
TEN PROJECTS OBSERVED
245
EX POST EVALUATION OF INVESTMENT PROJECTS CO‐FINANCED BY THE EUROPEAN REGIONAL DEVELOPMENT FUND (ERDF) OR COHESION FUND (CF) IN THE PERIOD 1994‐1999 FINAL REPORT TEN PROJECTS OBSERVED PREPARED BY: CSIL, CENTRE FOR INDUSTRIAL STUDIES, MILAN DKM, ECONOMIC CONSULTANTS, DUBLIN PREPARED FOR: European COMMISSION DIRECTORATE‐GENERAL REGIONAL POLICY POLICY DEVELOPMENT EVALUATION MILAN,NOVEMBER 9, 2012 ‐1,200,000 ‐1,000,000 ‐800,000 ‐600,000 ‐400,000 ‐200,000 0 200,000 400,000 600,000 800,000 1 3 5 7 9 11 13 15 17 19 21 23 25 27 29
Transcript of TEN PROJECTS OBSERVED
EX POST EVALUATION OF INVESTMENT PROJECTS CO‐FINANCED BY THE EUROPEAN REGIONAL DEVELOPMENT FUND (ERDF) OR COHESION FUND
(CF) IN THE PERIOD 1994‐1999
FINAL REPORT
TEN PROJECTS OBSERVED
PREPARED BY: CSIL, CENTRE FOR INDUSTRIAL STUDIES, MILAN
DKM, ECONOMIC CONSULTANTS, DUBLIN
PREPARED FOR: European COMMISSION DIRECTORATE‐GENERAL
REGIONAL POLICY POLICY DEVELOPMENT
EVALUATION
MILAN, NOVEMBER 9, 2012
‐1,200,000
‐1,000,000
‐800,000
‐600,000
‐400,000
‐200,000
0
200,000
400,000
600,000
800,000
1 3 5 7 9 11 13 15 17 19 21 23 25 27 29

This report is part of a study carried out by a Team selected by the Evaluation Unit, DG Regional Policy, European Commission, through a call for tenders by open procedure no 2010.CE.16.B.AT.036. The consortium selected comprises CSIL – Centre for Industrial Studies (lead partner – Milan) and DKM Economic Consultants (Dublin). The Core Team comprises: ‐ Scientific Director: Massimo Florio, CSIL and University of Milan; ‐ Project Coordinators: Silvia Vignetti and Julie Pellegrin, CSIL; ‐ External experts: Ginés de Rus (University of Las Palmas, Spain), Per‐Olov Johansson (Stockholm School of Economics, Sweden) and Eduardo Ley (World Bank, Washington, D.C.); ‐ Senior experts: Ugo Finzi, Mario Genco, Annette Hughes and Marcello Martinez; ‐ Task managers: John Lawlor, Julie Pellegrin and Davide Sartori; ‐ Project analysts: Emanuela Sirtori, Gelsomina Catalano and Rory Mc Monagle. A network of country experts provides the geographical coverage for the field analysis: Roland Blomeyer, Fernando Santos (Blomeyer and Sanz – Guadalajara), Andrea Moroni (CSIL – Milano), Antonis Moussios, Panos Liveris (Eurotec ‐ Thessaloniki), Marta Sánchez‐Borràs, Mateu Turró (CENIT – Barcelona), Ernestine Woelger (DKM – Dublin). The authors are grateful for the very helpful insights from the EC staff and particularly to Veronica Gaffey, Anna Burylo, José Luís Calvo de Celis and Kai Stryczynski. The authors are responsible for any remaining errors or omissions. Quotation is authorised as long as the source is acknowledged along with the fact that the results are provisional. Cover: 1) Map of the EU Member States involved in the evaluation study. Source: Authors. 2) The Port of Gioia Tauro. Source: MCT. 3) The M1 bridge over the River Boyne near Drogheda. Picture released into the public domain by its author Sarah777. 4) The Egnatia motorway. Source: Egnatis Odos S.A. 5) Waste piled up in the Sogama plant of Cerceda, picture by Gabriel Tizón (June, 2010). 6) Euromed in Sitges, picture by Javier López (April 2008) 7) Fontana Pretoria, picture by Bernhard J. Scheuvens (April, 2007) 8) Dublin Bay. Source: Dublin City. 9) Metro station ‘Aeropuerto T1 T2 T3’. Source: Urbanrail.net. 10) Ría de Vigo, picture by Enrique Dans (June, 2006). 11) Discounted Net Cash Flows in evaluated transport projects. Source: Authors. 12) Valorsul plant of urban solid waste treatment. Source: Valorsul.

TABLE OF CONTENTS
EXECUTIVE SUMMARY ........................................................................................................................ I
FOREWORD ........................................................................................................................................ 1
1 OVERVIEW OF THE SELECTED PROJECTS ..................................................................................... 3
2 EVALUATION QUESTIONS AND METHODOLOGY ........................................................................ 11
2.1 OVERALL APPROACH ....................................................................................................................... 11 2.2 SPECIFICITIES OF THE EVALUATION APPROACH ...................................................................................... 16 2.3 METHODOLOGICAL TOOLS ............................................................................................................... 18
3 DEVELOPMENT EFFECTS ............................................................................................................ 21
3.1 INTRODUCTION .............................................................................................................................. 21 3.2 ECONOMIC GROWTH ...................................................................................................................... 23 3.3 QUALITY OF LIFE ............................................................................................................................ 32 3.4 TEMPORAL DYNAMICS OF EFFECTS ..................................................................................................... 43 3.5 OVERALL ASSESSMENT .................................................................................................................... 49
4 PERFORMANCE DRIVERS ........................................................................................................... 51
4.1 INTRODUCTION .............................................................................................................................. 51 4.2 APPROPRIATENESS TO CONTEXT ........................................................................................................ 52 4.3 PROJECT DESIGN AND FINANCIAL SUSTAINABILITY ................................................................................. 56 4.4 FORECASTING CAPACITY .................................................................................................................. 63 4.5 PROJECT GOVERNANCE .................................................................................................................... 66 4.6 MANAGERIAL RESPONSE .................................................................................................................. 72 4.7 SOME REMARKS ON THE ROLE OF THE EUROPEAN COMMISSION .............................................................. 74 4.8 THE INTERPLAY BETWEEN FACTORS AND THEIR RELATIONS TO EFFECTS ...................................................... 78
5 LESSONS LEARNT ON EX‐POST CBA ............................................................................................ 83
5.1 INTRODUCTION .............................................................................................................................. 83 5.2 PROJECT IDENTIFICATION ................................................................................................................. 84 5.3 TIME HORIZON .............................................................................................................................. 86 5.4 COUNTERFACTUAL SCENARIO ........................................................................................................... 88 5.5 DEMAND ANALYSIS: FORECASTING THE FUTURE AND TESTING THE ASSUMPTIONS ........................................ 90 5.6 THE SOCIAL DISCOUNT RATES .......................................................................................................... 92 5.7 QUANTIFICATION OF COSTS AND BENEFITS .......................................................................................... 95 5.8 SHADOW PRICES .......................................................................................................................... 103
6 CONCLUDING REMARKS AND RECOMMENDATIONS ................................................................ 107
6.1 ANSWERING THE EVALUATION QUESTIONS ........................................................................................ 107 6.2 WHAT WE HAVE LEARNT ................................................................................................................ 110 6.3 RECOMMENDATIONS .................................................................................................................... 118
ANNEX I. THE TEN CASE STUDIES IN A NUTSHELL........................................................................ 126
THE PORT OF GIOIA TAURO ........................................................................................................................ 126 M1 MOTORWAY ...................................................................................................................................... 131 THE EGNATIA MOTORWAY ......................................................................................................................... 137 MADRID METRO LINE ‐ ACCESS TO BARAJAS AIRPORT ...................................................................................... 141 THE MEDITERRANEAN CORRIDOR ................................................................................................................. 145 WATER SUPPLY IN PALERMO ....................................................................................................................... 150 INTEGRATED SOLID WASTE MANAGEMENT IN NORTHERN LISBON ...................................................................... 157 URBAN SOLID WASTE MANAGEMENT IN GALICIA ............................................................................................ 163 INTEGRATED ENVIRONMENTAL REGENERATION OF RÍA DE VIGO ......................................................................... 168

DUBLIN WASTE WATER TREATMENT ............................................................................................................ 174
ANNEX II. CASE STUDIES SELECTION PROCESS ............................................................................. 180
PROJECT REVIEW ....................................................................................................................................... 180 SELECTION CRITERIA AND SCORING SYSTEM .................................................................................................... 180 RESULTS OF SELECTION PROCESS .................................................................................................................. 183
ANNEX III. CALCULATION OF CBA PARAMETERS ........................................................................... 186
SOCIAL DISCOUNT RATES ............................................................................................................................ 186 SHADOW WAGES ...................................................................................................................................... 193
ANNEX IV. REFERENCES ............................................................................................................... 200

LIST OF ABBREVIATIONS
AMAP Municipal Company of the Palermo Aqueduct
CBA Cost‐Benefit Analysis
CF Cohesion Fund
DBO Design‐Build‐Operate
DG Regio Directorate General for Regional Policies
EBIT Earnings Before Interest and Taxes
EC European Commission
ENPV Economic Net Present Value
EQ Evaluation Question
ERDF European Regional Development Fund
ERR Economic Rate of Return
ESF European Social Fund
EU European Union
EUR Euro
FNPV Financial Net Present Value
GDP Gross Domestic Product
HEATCO Developing Harmonised European Approaches for Transport Costing and Project Assessment
IMF International Monetary Fund
IRR Internal Rate of Return
MEDCORR Mediterranean Corridor
MCT Medcenter Container Terminal
MS Member State
MSW Municipal Solid Waste
n.a. Not Available
NGO Non‐Governmental Organisation
NPV Net Present Value

NRA National Roads Authority
OECD Organisation for Economic Co‐operation and Development
PPP Public‐Private Partnership
PT Port
RD Road
RL Railway
ROA Return On Assets
SDR Social Discount Rate
SWT Solid Waste Treatment
TEN‐T Trans‐European Transport Network
ToR Terms of Reference
UV Ultra Violet
VAT Value Added Tax
VVT Values of Travel Time
VTTS Values of Travel Time Savings
WS Water Supply
WtE Waste to Energy
WWT Waste Water Treatment

i
EXECUTIVE SUMMARY Background
Major projects, as defined by art. 16.2 of the ERDF Regulation 2082/1993, reiterated in art. 40 of Regulation 1083/2006 and in the new draft Regulations, are a critical ingredient of Cohesion Policy. Successful major projects positively contribute to economic growth, social welfare and quality of life. Their significance in terms of capital costs, absorption of EU Funds, their visibility with the wider public, and the level of expertise required for their implementation call for their specific scrutiny.
The objective of this study is to evaluate the type, magnitude and timeframe of long‐term effects of ten selected major projects implemented during the 1994‐1999 programming period, and the mechanisms explaining the project outcomes. By putting together the case studies’ evidence, the evaluator has extracted some key ideas for policy learning and has derived meaningful recommendations regarding the causality chain leading to certain long‐term effects of investments.
Evaluation questions
The conceptual framework underlying the study is organised along three dimensions of analysis addressing the following Evaluation Questions (synthesised under the “What”, “When” and “How” headings):
i. What long‐term effects do these projects bring about? A distinction between effects on ‘Economic development’ and ‘Quality of life’ has been made. The former includes direct effects on Gross Domestic Product (GDP) growth and endogenous dynamics of economic growth; the latter is used here as a synonym for social well‐being and includes effects that are not captured by the economic variables, but affect social and territorial cohesion, institutional learning, environment and social happiness.
ii. When do long‐term effects materialise and stabilise? Effects can stabilise a few years after the project’s completion, after a longer period, or may still need time to reach stabilisation.
iii. How do long‐term effects materialise? The following possible determinant factors, which may have an influence on the generation of the project’s short or long‐term effects, are identified: appropriateness to the context, project design, forecasting capacity, project governance and managerial response.
Finally, a fourth evaluation question asks which existing evaluation methods can capture a given long‐term contribution for different types of investment in the fields of environment and transport infrastructure. It refers to the identification of the most suitable methodology that enables one to address and disentangle the ‘What’, ‘When’ and ‘How’ dimensions.

ii
The Evaluation Questions are answered in this report by means of the large amount of evidence collected in the case studies1.
Overview of the selected projects
The investment projects analysed are in the transport (road, rail, seaports) and environment (water supply, waste water treatment, waste management) sectors, across five Member States: Greece, Ireland, Italy, Portugal and Spain:
i. Port of Gioia Tauro (Italy);
ii. M1 Motorway (Ireland);
iii. Egnatia Motorway (Greece);
iv. Madrid Metro Line giving access to the Barajas airport (Spain);
v. Mediterranean Corridor (Spain);
vi. Water supply in the city of Palermo (Italy);
vii. Urban solid waste treatment in Northern Lisbon (Portugal);
viii. Solis waste treatment in Galicia (Spain);
ix. Waste water treatment in Ría de Vigo (Spain);
x. Dublin waste water treatment (Ireland).
Overall, these cases represent more than EUR 10 billion of investment and slightly less than EUR 5 billion of co‐funding by the European Commission (EC). They were chosen on the basis of an objective selection procedure (taking into account geographical coverage, typology of infrastructure and size among other criteria) and because they were considered likely to provide interesting specific project narratives from which to draw effective policy lessons.
The EC co‐funding ranges from EUR 44 million for the Palermo water supply project, to more than EUR 3 billion for the Egnatia motorway. As presented in the map below, most of these projects received financial contributions through the Cohesion Fund or the European Regional Development Fund, but some of them received financing also from the European Social Fund, the Trans‐European Transport Network (TEN‐T) budget and the European Investment Bank.
1 All case studies are available on‐line on the Dg Regio website http://ec.europa.eu/regional_policy/information/evaluations/archives_1989_1999_en.cfm#1. Their Executive Summaries is also provided in Annex I of this Final Report.

iii
LOCATION, INVESTMENT COST AND SOURCES OF FINANCING OF THE SELECTED PROJECTS
Note: Total costs of the project are expressed in EUR millions at 2011 price. Source: Authors
Country/region: Greece/ East Macedonia & Trace, Central Macedonia, west Macedonia, Epirus, ThessalyProject title: The Egnatia MotorwaySector: Transport – MotorwayInvestment period: 1994‐2011Total cost: € 7,053EU co‐financing rate: 14.7% (CF) 28.7% (ERDF) 0.4% (TEN‐T Fund)EIB contribution: 41%
Country/region: Ireland / Border, Mid‐East, DublinProject title: M1 MotorwaySector: Transport – MotorwayInvestment period:1989‐2005Total cost: € 787EU co‐financing rate: 38% (CF)
Country/region: Italy/SicilyProject title: Water Supply System in PalermoSector: Environment ‐ Water SupplyInvestment period: 1997‐2004Total cost: € 120EU co‐financing rate: 37% (ERDF)EIB contribution: 18%
Country/region: Spain/MadridProject title: Madrid Metro Line – Access to Barajas AirportSector: Transport ‐ SubwayInvestment period: 1997‐2002; 2006‐2007Total cost: € 518EU co‐financing rate: 76% (CF)
Country/region: Spain/GaliciaProject title: Urban solid waste management in GaliciaSector: Environment ‐ Solid waste treatmentInvestment period: 1997 – 2010 (CF project 1997 – 2001)Total cost: € 275EU co‐financing rate: 36% (CF)
Country/region: Portugal/LisbonProject title: Integrated Solid Waste Management in Northern LisbonSector: Environment ‐ Solid waste treatmentInvestment period: 1996‐2002; 1999‐2008Total cost: € 366EU co‐financing rate: 37% (CF)EIB contribution: 34%
Country/Region: Ireland/DublinProject title: Dublin Waste Water TreatmentSector: Environment ‐Waste water treatmentInvestment period: 1995‐2003Total cost: € 296EU co‐financing rate: 53% (CF)
Country/Region: Italy/CalabriaProject title: Port of Gioia TauroSector: Transport ‐ PortInvestment period: 1994‐1998Total cost: € 418EU co‐financing rate: 13% (ERDF) 2% (ESF)
Country/region: Spain/Barcelona‐ValenciaProject title: The Mediterranean CorridorSector: Transport ‐ RailwayInvestment period: 1993‐2002Total cost: € 759EU co‐financing rate: 70% (CF)
Country/region: Spain/GaliciaProject title: Integrated environmental regeneration of Ría de VigoSector: Environment ‐Waste water treatmentInvestment period: 1995‐2000Total cost: € 172EU co‐financing rate: 69% (CF)

iv
Development effects (“What”)
On average, the cases under review produced positive overall effects along the different dimensions explored. They point at uncontroversial direct contributions to economic growth and quality of life, while the strength of each type of effect can differ by sector (transport or environment) or project.
• Direct welfare and economic growth. Infrastructural projects not only trigger economic growth effects, in terms of real growth in GDP, but they also generate broader effects in terms of user welfare, for example through the provision of improved public services. As the Egnatia and M1 motorway case studies indicate, transport projects can produce important effects in terms of direct economic growth, mainly through travel time savings, resulting in productivity gains and induced effects on regional development. User welfare is more central for environment projects, such as the waste water treatment projects in Dublin and Ría de Vigo, which provided their populations with improved public services and increased value of use of public goods (such as cleaner sea water and beaches), to the benefit of residents and tourists. The typology of infrastructure also matters: for the two incinerators reviewed (in Galicia and Northern Lisbon), for example, business opportunities arising from side activities (particularly the sale of electricity and contribution to the market for recycled materials) are an important driver of direct economic growth effects, which can take place beyond the local level.
• Endogenous dynamics. Channels of influence between infrastructure endowment and economic growth are also indirect, although to a lesser extent than the direct effects on welfare and economic growth. Economic growth was endogenously fostered by improving human capital (training courses were organised for workers at the Port of Gioia Tauro), increasing technological progress (through the installing of high‐performance railway technology for the Mediterranean Corridor project or waste water treatment systems in the Ría de Vigo municipalities) and promoting organisational change (such as the incorporation of an international engineering firm within the ‘Egnatia Odos’, the Greek agency in charge of the Egnatia motorway’s management). Environment projects record slightly lower levels of endogenous growth effects than transport projects.
• Social cohesion. Social cohesion effects are generally side effects, but they can reach significant magnitude if appropriately exploited. An exemplar illustration is given by the Madrid Metro Line: by offering quality and affordable public transport between Madrid centre and the Barajas district, the project provided better access for inhabitants (mostly immigrants or with limited resources) of the less developed neighbouring area.
• Environmental effects. Unsurprisingly, environmental projects bring about positive environmental effects, although their full achievement is hampered by various operational difficulties. One recurrent feature of environment projects, for example, is

v
the fact that they often depend on further investments (a new waste water treatment plant needs to be built in Vigo to address the capacity and treatment problems affecting the existing plant, and a new incinerator plant has been planned to solve the capacity problems of the waste incinerator in Galicia) or behavioural changes (such as improvement in waste sorting behaviour by householders in both Galicia and in Northern Lisbon), to have their effects reach their full potential. Transport projects also produce positive environmental side effects, particularly when traffic is shifted from car to rail (as in the Madrid Metro Line and Mediterranean Corridor projects).
• Territorial cohesion. Transport projects are more relevant as far as territorial cohesion is concerned. In particular, this is the case with the Egnatia motorway, which connects different regions of Greece to each other and to the Balkan countries. Other projects produced some positive effects on territorial cohesion, even if this objective was not a top priority: the new Madrid Metro Line, for instance, ensures cohesion between Madrid and a relatively peripheral area.
• Institutional quality. Institutional learning effects are overall low and they are even lower for environment projects. This is probably due to the fact that major infrastructural projects are big, but are location‐specific and not part of a network. They offer little opportunity to be compared with benchmarks, and as such to trigger learning mechanisms, unless institutionalised forms of learning accompany them. There is evidence that some learning effects at institutional level took place in the case of the Egnatia and M1 motorways (through the establishment of the ad hoc agency ‘Egnatia Odos’2 and the adoption of the innovative Design‐Build contracts3 respectively). The solid waste treatment project in Northern Lisbon is the environment project with the most favourable institutional development. As a pioneer project, it contributed to the development of regulatory capacity of institutions in the waste sector.
• Social happiness. Effects on social happiness effects can take place by reference to expectations or to subjective perceptions of wellbeing, which are not captured by other dimensions. These effects are relevant both in negative and positive terms, with no real difference between environment and transport projects. They are barely related to project performance along other dimensions (for example, there is little connection between the level of social happiness and environmental effects for environment projects, or effects in terms of territorial cohesion for transport projects), but they can be influenced by proactive measures (e.g. awareness‐raising campaigns, as with the Northern Lisbon solid waste treatment project). They can have important consequences for projects, especially when they give rise to organised forms of stakeholders’ “voice”: to mention one example, local stakeholders influenced the
2 In charge of the implementation and management of the Egnatia motorway project. 3 Design‐Build is a type of Public Private Partnership, whereby the public authority appoints a concessionaire to Design and Build a piece of infrastructure.

vi
Mediterranean Corridor design by requesting additional stops and changes to the rail route.
Stabilisation of the project effects (“When”)
Overall, the majority of effects detected appear to have already stabilised, either in the short‐medium (i.e. from 1 to 5 years after project completion) or in the long run (more than 6 years after project completion). However there are also significant factors which are not yet stabilised, mainly direct growth effects. For transport projects (e.g. Port of Gioia Tauro, Egnatia motorway and Mediterranean Corridor) more time is needed for these effects to stabilize. For environmental projects (e.g. solid waste treatment in Galicia and waste water treatment in Ría de Vigo) the stabilization of direct growth and environmental effects is linked to the consideration that future developments such as further investments or behavioural improvements are often expected to have an additional positive effect. As far as territorial cohesion effects are concerned, they have stabilised more homogenously in the long run. Effects on institutional quality, which are marginal for all the projects, tended to stabilise in the short run for environment projects (e.g. the development of new capacities for waste management among the Galician municipalities), and in the long run for transport projects (e.g. learning capacities within the Regional Consortium of Madrid Transport, the metropolitan transport agency). Finally, social happiness is an effect that has temporal horizon patterns that are essentially project‐specific. In any case, the evidence suggests that a five year lag from completion is the minimum required time to see significant stabilisation of effects.
Development drivers (“How”)
Determinant factors of project outcomes relate to the way the project interacts with the context, the technical features of the project, the capacity to predict future trends, the division of roles and responsibilities and the managerial capacity to react to unpredicted events. Some of these factors (appropriateness to the context and managerial response) generally positively contributed to the projects, regardless of the sector of intervention; another factor had an on‐average negative effect (project governance). The infrastructural sector matters in particular as far as project design is concerned, with positive scores recorded on average for transport projects and negative scores for environmental ones. More details on the development drivers are presented hereafter.
• Appropriateness to the context. Projects generally adapted to their context rather than influencing it. They provided appropriate solutions to population or users’ needs (e.g. the new incinerator plant in Lisbon to cope with the closure of the existing landfill) and reflected different socio‐economic and political factors (the expansion of the Madrid metro network resulted from higher mobility needs and growing air traffic at Barajas airport). In turn, context influenced project design by imposing constraints in terms of time (as with the implementation of the waste water treatment projects to

vii
comply with the Urban Waste Water Treatment Directive4 by the end of 2000), space (archaeological discoveries led to changes in the Egnatia motorway alignment) and budget (limited regional resources prevented implementation of the best project option in Ría de Vigo).
• Project design. Project design is a weak point of environment projects, which was adversely affected by time constraints (deadlines imposed by EC Regulations), forecasting mistakes (regarding the population trend in the case of Palermo) as well as social pressure (municipalities of the Northern Lisbon sub‐region pushed for spreading the solid waste treatment facilities around different areas, with negative economic and environmental consequences). On the face of it, transport projects (particularly the Port of Gioia Tauro and the Madrid Metro Line) are generally characterised by more efficient and flexible designs, reflecting the strategic vision underpinning them.
• Financial sustainability. Mechanisms to ensure financial sustainability are an integral part of project design. In general, the projects reviewed did not incur financial difficulties. During the investment phase, some projects incurred cost overruns which were covered through additional national public funding. During the operational phases, projects used different combinations of operating revenues (tariffs) and other sources of funding to cover operating and maintenance costs.
• Forecasting capacity. Good forecasting can be very important for deciding on an appropriate design or setting adequate tariffs. For environment projects, demand was the main source of unpredictability with resulting under‐capacity (as in the solid waste treatment project in Galicia). In one occasion (Madrid Metro Line), optimal forecasting capacity was achieved through a comprehensive system of controls implemented during construction and operation.
• Project governance. Governance had a decisive and on average a negative influence on project performance. The two main ingredients for an effective governance structure are: a clear distribution of responsibilities between stakeholders contributing to project development, and adequate mechanisms to integrate the views of a larger set of stakeholders. Environment projects appeared to be specifically vulnerable to social pressure: municipalities and Non‐Governmental Organisations in Northern Lisbon succeeded in influencing the project design and, indirectly, its performance. By contrast, transport projects showed a better capacity to either withstand pressure (e.g. managers of the Egnatia motorway gave little initial consideration to stakeholders’ opinions) or integrate it without disrupting the project’s constitutive features (as demonstrated by the inclusion of municipalities in the decision‐making process related to the Madrid Metro Line project). Some transport projects provided cases of good practice regarding effective distribution of responsibilities translating
4 Directive 91/271/EEC.

viii
into an appropriate legal form (e.g. the establishment of a dedicated commercial publicly owned company, like the ‘Egnatia Odos’).
• Managerial response. Appropriate managerial response can palliate deficiencies in terms of design, governance or forecasting, but it entails costs. While in the transport sector, managerial responses were less relevant, frequent or needed, environment projects offer different illustrations of effective managerial responses. Ría de Vigo provides a good example of an effective reaction adopted by Augas de Galicia, the regional body in charge of the project’s implementation: when some municipalities in Ría de Vigo proved to be inefficient in dealing with tender processes for assigning the management of the treatment plants, the regional body took responsibility for running the infrastructures, thus ensuring their immediate functioning.
• Role of the European Commission. Besides the already mentioned drivers, the role played by the European Commission on project development has been analysed. On different occasions, the Commission has intervened on either one or a number of drivers identified in the study. In some projects (generally environment projects, such as the solid waste treatment infrastructures in Northern Lisbon and Galicia), it was as a mere funding provider without going into the details of project design, management and implementation; in other cases (mostly transport projects, such as the Madrid Metro Line), it acted in a more proactive way, establishing closer relationships and undertaking discussions with the national authorities, and influencing the project’s features. Even when high levels of commitment were put in place, however, the Commission did not always manage to solve the pre‐existing limitations of the national / regional governance structures (as occurred in case of the Mediterranean Corridor and the Port of Gioia Tauro). The European Investment Bank was also involved in the co‐financing of three out of ten projects reviewed5 and in all cases it provided valuable support aimed at improving the project design.
These different drivers are deeply intertwined, i.e., before yielding development effects, they combine in different ways, generally through project‐specific patterns. For example, the impact of vested interests on design can be more or less important depending on whether an adequate governance structure is able to assuage or integrate these interests, whether forecasting capacity can lead to the adoption of appropriate awareness campaigns pre‐empting later disruptive effects, or whether managerial responses are able to minimise possible detrimental consequences.
One finding valid across all the cases reviewed is that design and governance are the two legs upon which a project stands. Appropriate forecasting capacity and managerial response are factors that can impinge on either one or the other, either positively by offsetting deficiencies, or negatively if they are wrong or insufficient, but usually they are less critical and have an indirect impact on project performance via design or governance. As to context, it is not only a 5 The Egnatia Motorway, the water supply project in Palermo and Integrated solid waste treatment in Northern Lisbon.

ix
set of constraints but also of opportunities giving rise to a vision underpinning a project’s adoption and development. A good vision proposing an appropriate articulation of constraints and opportunities and which is clear about what the project wants to achieve augurs well for future project developments.
Finally, a sector‐specific story emerges, as environment projects turn out to suffer from deficiencies on different fronts (design, forecasting, governance) which account for comparatively weaker performance (e.g. endogenous dynamics or institutional learning). Reasons have to do with weak administrative capacity of the local / regional authorities in charge, and with the relative ad hoc nature of the projects that are implemented without necessarily being part of a wider investment programme.
Lessons learnt on the methodology of ex‐post evaluation
This evaluation study developed and tested an innovative methodological approach for ex‐post evaluation of investment projects6, which proved to be very effective in answering the “What”, “When” and “How” Evaluation Questions. The following methodological innovations distinguish this study from other comparable exercises:
• Combination of perspectives. The evaluation has been carried out on the micro (project level) and macro (including external systems, areas and sectors) dimensions of analysis; the perspective of both economics and other social sciences has been adopted in order to disentangle all the different types of development effects triggered by investment; a mix of quantitative (ex‐post Cost‐Benefit Analysis) and qualitative (personal interviews, documentary analysis and searches of European Commission, government and newspaper archives) techniques. All these perspectives are integrated in a narrative way, so as to develop ten case studies that read as project ‘stories’.
• Focus of analysis. The focus is not only on the projects’ effects but also on the causality chain leading to the generation of certain effects at certain points in time.
• Timeframe of the evaluation. The time frame is exceptionally long since the projects under review were financed almost 15‐20 years ago: this allows us to disentangle the effects generated in the long‐term and to more easily identify the mechanisms which influenced such effects over the years.
The ex‐post Cost‐Benefit Analysis, in particular, provided a useful framework of analysis to disentangle the most crucial aspects of the projects’ ex‐post performances and final outcomes. The study gave rise to significant methodological lessons concerning the use of the ex‐post CBA and, more specifically, the following themes:
6 Presented and discussed in more detail in the First Intermediate Report of the evaluation study, available on the Dg Regio website http://ec.europa.eu/regional_policy/information/evaluations/archives_1989_1999_en.cfm#1.

x
• The identification of the unit of analysis, which may be wider than the project that is the object of the initial financing decision;
• The appropriate time horizon to encompass the project’s mid‐to long term impact;
• The selection of the most feasible and realistic counterfactual scenario against which to compare the project results;
• The estimation of project demand for the coming years;
• The adoption of ad‐hoc Social Discount Rates, which are both country‐ and time‐specific (different rates to capitalise the past cashflows and to discount the future ones);
• The identification and quantification of costs and benefits, with the objective of evaluating the long‐term impacts, as opposed to short‐term outputs generally quantified by ex‐ante CBAs;
• The application of the most appropriate Shadow Prices, which, if necessary, may also be region‐ or time‐specific.
The lessons derived from applying the CBA methodology to the ten projects are of general interest and may guide any future ex‐post CBA exercise at EU or wider level7.
Conclusions and recommendations
Overall, the evidence collected shows how the outcomes of development projects are the result of the frantic mishmash between incidental environmental, socio‐economic, institutional and cultural circumstances and the managerial responses produced by the project. A set of specific conjectures on what can be construed as a ‘list of ingredients’ of success for public investment projects has been identified. First of all, successful investments are more likely to lie in a context in which entrepreneurialism, professionalism, managerial discretion and accountability to government are in place to encourage project ideas, select the most promising ones, and prevent the project from being exposed to some disruption, either during construction or operation. Appropriate incentives and accurate forecasting and monitoring activities can be important to favour the achievement of the project goals. Finally, the establishment of formal mechanisms to ensure that all stakeholders’ voices are listened to by project designers and managers can help to generate a sense of social pride and identity which, in turn, increases the likelihood of project success.
This ‘list of ingredients’ suggests a set of operational recommendations along the main phases of the project management cycle.
7 For instance, a discussion is on‐going at the World Bank on how to revive CBA as a necessary, even if not exclusive, tool for project evaluation (World Bank, 2011).

xi
• Identification and formulation: a systematic and consistent planning function. At the initial phase of the project cycle there is a need to ensure that good ideas are generated while bad ones are discarded. Good project ideas are those underpinned by a clear and forward looking development vision and addressing a relevant social need. Innovation capacity within the public administration of the Member State, together with professionalism and high levels of technical competence should be ensured, in order to identify the most promising project ideas.
• Design and selection: an investment in technical expertise: The tools to be necessarily in place to develop high‐quality feasibility studies and ensure good project design are the following: a solid but flexible technical design, an accurate demand analysis with a sound forecasting exercise, risk management plan and ex‐ante Cost‐Benefit Analysis; a framework to systematically inform and involve stakeholders in the project development; a specific assessment of the governance arrangements in place and of the changes to be made8; mechanisms to ensure financial sustainability over the entire project life. Results of feasibility studies and cost‐benefit analysis, assessed by an independent reviewer checking its quality and reliability, should be used to select and prioritise projects.
• Project implementation: systematic monitoring and latitude. The project life should be tracked and monitored. Specific attention should be paid to projects considered particularly risky. In cases where the monitoring process highlights significant deviations from the expected performance, corrective action should be recommended by the Managing Authority and taken by the beneficiary.
• Closure: incentive schemes and learning. After the project closure, systematic ex‐post evaluation should be carried out by the European Commission, and the results made public. The ex‐post evaluation should aim not only to assess the project effects, but also to identify and reward well‐performing project teams.
The implementation of the recommendations put forward here would require joint action by the European Commission and Member States. In particular, the EC should carefully consider how to play an advisory role to the Member States in relation to the above challenges, particularly by contributing to adopt common approaches for project preparation and appraisal, promoting knowledge transfer and the sharing of good practices.
8 E.g. concerning the distribution of responsibilities between different institutional parties.

xii

xiii
RESUME Contexte
Les grands projets, définis par l’article 16.2 du Règlement (CEE) n° 2082/1993, réitéré dans l’art. 40 du Règlement (CEE) n° 1083/2006 et dans les nouveaux projets de Règlement, sont un ingrédient essentiel de la Politique de Cohésion. Les grands projets peuvent en effet contribuer d’une manière positive à la croissance économique, au bien‐être social et à la qualité de la vie. Leur importance en termes de coûts d'investissement, d’absorption des Fonds Européens, et de niveau d’expertise exigé pour leur exécution ainsi que leur visibilité en justifient l'examen approfondi.
L’objectif de cette étude est d’une part, d’évaluer le type, l'ampleur et le déroulement des effets de long terme de dix grands projets exécutés pendant la période de programmation 1994‐1999, et d’autre part, d’identifier les mécanismes qui expliquent les résultats de ces projets. Ces dix études des cas ont permis de tirer des enseignements utiles en matière de politique économique et de produire des recommandations concernant la chaîne de causalité reliant les investissements à leurs effets de long terme.
Questions d’Evaluation
Le cadre conceptuel qui sous‐tend cette étude est organisé autour de trois dimensions d'analyse, relatives aux questions d'évaluation suivantes (synthétisées par les titres ”Quoi”, “Quand” et “Comment”).
i. «Quoi»: Quels sont les effets de long terme de ces projets? Une distinction est opérée entre les effets sur le “Développement économique” et les effets sur la “Qualité de la vie”. Les premiers comprennent les effets directs sur la croissance du Produit Intérieur Brut (PIB) et les dynamiques endogènes de croissance économique. Les deuxièmes sont ici utilisés comme synonyme de bien‐être social et comprennent des effets non appréhendés par des variables économiques, qui concernent la cohésion sociale et territoriale, l’apprentissage institutionnel, l’environnement et le bien‐être social.
ii. «Quand»: Quand les effets de long terme se concrétisent‐ils et se stabilisent‐ils? Les effets peuvent se stabiliser quelques années après l'achèvement du projet; après une période plus longue; ou bien ils peuvent avoir encore besoin de temps pour se faire.
iii. «Comment»: Comment les effets de long terme se concrétisent‐ils? Des facteurs susceptibles d'influencer les effets de long terme et/ou de court terme ont été identifiés: adaptation au contexte, conception du projet, capacité de prévision, gouvernance du projet et réponse managériale.
Enfin, une quatrième question d'évaluation concerne les méthodes capables d’identifier les impacts de long terme de différentes typologies d'investissement, dans les secteurs de l'environnement et des transports. Cette question a trait à l'identification de la méthodologie la plus appropriée pour aborder et démêler les dimensions relatives aux questions “Quoi”,

xiv
“Quand” et “Comment”.
Ce rapport a abordé les questions d’évaluation ci‐dessus, à travers la grande quantité de matériel rassemblé lors des études de cas9.
Présentation des projets sélectionnés
Les projets d'investissement analysés se rapportent aux secteurs des transports (transport routier, ferroviaire et ports maritimes) et de l'environnement (approvisionnement en eau, traitement des eaux usées, gestion des déchets), dans 5 Etats Membres: Grèce, Irlande, Italie, Portugal et Espagne:
i. Port de Gioia Tauro (Italie);
ii. Autoroute M1 (Irlande);
iii. Autoroute d’Egnatia (Grèce);
iv. Ligne reliant le réseau de métro madrilène à l’aéroport de Barajas (Espagne);
v. Corridor Méditerranéen (Espagne);
vi. Approvisionnement en eau dans la ville de Palerme (Italie);
vii. Traitement des déchets solides urbains au nord de Lisbonne (Portugal);
viii. Traitement des déchets solides en Galice (Espagne);
ix. Traitement des eaux usées à Ría de Vigo (Espagne);
x. Traitement des eaux usées à Dublin (Irlande).
Dans leur ensemble, ces projets représentent plus de 10 milliard d'euros d'investissement et un peu moins de 5 milliard d'euros de cofinancement de la part de la Commission Européenne (CE). Ils ont été choisis sur la base d'une procédure de sélection prenant en considération des facteurs objectifs comme la couverture géographique, la typologie de l’infrastructure et l’importance du projet, entre autres critères, et parce que ils ont été considérés comme susceptibles de dévoiler des histoires intéressantes, d’où tirer des enseignements utiles.
Le cofinancement de la CE va de 44 million d'euros pour le projet d’approvisionnement en eau de Palerme, jusqu'à plus de 3 milliard d'euros pour l'autoroute d’Egnatia. La carte ci‐dessous montre que la plupart de ces projets reçoivent leur contribution financière du Fond de Cohésion ou le Fond Européen de Développement Régional, même si certains d'entre eux ont aussi été financés par le Fond Social Européen, le Réseau Transeuropéen de Transport (RTE‐T) et la Banque Européenne d'Investissement.
9Toutes les études de cas sont disponibles en ligne sur le site web de la DG‐REGIO http://ec.europa.eu/regional_policy/information/evaluations/archives_1989_1999_fr.cfm. Leurs résumés exécutifs sont aussi contenus dans l’Annexe I du Rapport Final.

xv
LIEU, COUT DE LʹINVESTISSEMENT ET SOURCE DE FINANCEMENT DES PROJETS SELECTIONNES
Note: Les coûts globaux de l’investissement sont exprimés en EUR millions, aux prix 2011. Source: Auteurs
Pays/région : Grèce/ Macédoine orientale et Trace, Macédoine Centrale, Macédoine occidentale, Epirus, ThessalieTitre du projet : L’autoroute d’EgnatiaSecteur: Transport – autoroutePériode d’investissement : 1994‐2011Coût total : 7,053 €Taux de cofinancement UE : 14.7% (FC) 28.7% (FEDR) 0.4% (Fond RTE‐T)Contribution BEI: : 41%
Pays/région: Irlande / Frontière, moyen Est, DublinTitre du projet: Autoroute M1Secteur: Transport – AutoroutePériode d’investissement:1989‐2005Coût total: 787 €Taux de cofinancement UE: 38% (FC)
Pays/région : Italie/SicileTitre du projet: Système d’approvisionnement en eau à PalermeSecteur: Environnement –approvisionnement en eauPériode d’investissement :1997‐2004Coût total: 120 €Taux de cofinancement UE : 37% (FEDR)Contribution BEI: 18%
Pays/région: Espagne/MadridTitre du projet: Ligne de métro de Madrid–Accès à l’aéroport de Barajas Secteur: Transport – métropolitainePériode d’investissement: 1997‐2002; 2006‐2007Coût total : 518 €Taux de cofinancement UE: 76% (FC)
Pays/région: Espagne/GaliceTitre du projet: Traitement des déchets solides en Galice Secteur: Environnement ‐ Traitement des déchets solides Période d’investissement: 1997 – 2010 (FC projet 1997 – 2001)Coût total : 275 €Taux de cofinancement UE: 36% (FC)
Pays/région: : Portugal/LisbonneTitre du projet:Gestion intégrée des déchets solides urbaines au nord de Lisbonne Secteur : Environnement –traitement des déchets solidesPériode d’investissement: 1996‐2002; 1999‐2008Coût total : 366 €Taux de cofinancement UE: : 37%(FC)Contribution BEI: 34%
Pays/région: Irlande/DublinTitre du projet :Traitement des eaux usées à DublinSecteur: Environnement –traitement des eaux uséesPériode d’investissement: 1995‐2003Coût total : 296 €Taux de cofinancement UE: 53% (FC)
Pays/région : Italie/CalabreTitre du projet: Port de Gioia TauroSecteur: Transport ‐PortPériode d’investissement : 1994‐1998Coût total : 418 €Taux de cofinancement UE : 13% (FEDR) 2% (FSE)
Pays/région: Espagne/Barcelone‐ValenciaTitre du projet: Le Corridor MéditerranéenSecteur: Transport – voie ferréePériode d’investissement: 1993‐2002Coût total : 759 €Taux de cofinancement UE : 70% (FC)
Pays/région: Espagne/GaliceTitre du projet : régénération environnementale intégrée de Ría de VigoSecteur: Environnement –traitement des eaux uséesPériode d’investissement: 1995‐2000Coût total : 172 €Taux de cofinancement UE: 69% (FC)

xvi
Effets de développement (“Quoi”)
En moyenne, les cas analysés ont produit des effets globaux positifs au regard des différentes dimensions explorées. Les projets ont contribué de façon incontestable à la croissance économique et à la qualité de la vie, même si l’importance de chaque type d'effet peut varier d'un secteur à l'autre (transports ou environnement) et d'un projet à l'autre.
• Bien‐être et croissance économique. Les projets d'infrastructure déclenchent des effets non seulement de croissance économique, en termes de croissance réelle du PIB, mais aussi ayant une portée plus large, du point de vue du bien‐être de l'utilisateur (par exemple à travers la mise à disposition de services publiques améliorés). Comme le démontrent les études de cas des autoroutes d’Egnatia et M1, les projets dans le secteur des transports peuvent produire des effets directs importants sur la croissance économique, principalement à travers la diminution du temps de voyage qui entraine des gains de productivité et des effets induits sur le développement régional. Le bien‐être de l'utilisateur est central pour les projets environnementaux, comme le montrent les projets de traitement des eaux usées à Dublin et à Ría de Vigo, qui ont fourni à leur populations des services publics améliorés et une valeur d'utilisation des biens publics accrue (par exemple l’eau de mer et des plages plus propres), au bénéfice des résidents et des touristes. La typologie d'infrastructure joue également un rôle important. Pour les deux incinérateurs considérés (en Galice et au nord de Lisbonne), par exemple, les opportunités résultant des activités secondaires (en particulier la vente d'électricité et la contribution au marché des matériaux recyclés) constituent un levier important déclenchant des effets directs sur la croissance économique, qui peuvent se vérifier au‐delà du niveau local.
• Dynamique endogène. La dotation infrastructurelle influence également la croissance économique de façon indirecte, quoique de façon moins importante que les effets directs sur le bien‐être et la croissance économique. La croissance économique a été encouragée de manière endogène grâce à l’amélioration du capital humain (par exemple, des formations professionnelles ont été organisée pour les travailleurs du Port de Gioia Tauro), en accroissant le progrès technologique (par exemple à travers l'installation de voies ferrées à haute performance technologique pour le projet du Corridor Méditerranéen ou de systèmes de traitement des eaux usées dans les municipalités de Ría de Vigo) et en promouvant un changement d’organisation (comme par exemple l'incorporation d'une société internationale d'ingénierie au sein de ‘Egnatia Odos’, l'agence grecque en charge de la gestion de l’ autoroute d’Egnatia). Les projets environnementaux sont associés à des niveaux de croissance endogène un peu plus bas, comparé aux projets dans le secteur des transports.
• Cohésion sociale. Les effets sur la cohésion sociale sont en général des effets secondaires, mais ils peuvent avoir une portée importante, s’ils sont exploités de manière appropriée. Un exemple est fourni par la ligne de métro madrilène. En offrant un transport public accessible et de qualité entre le centre de Madrid et le district de Barajas, le projet a fourni un meilleur accès pour les habitants (principalement immigrés ou avec ressources limitées) de la région voisine moins développée.
• Effets environnementaux. Sans surprise, les projets environnementaux entraînent des effets positifs sur l'environnement, même si leur plein achèvement est ralenti à cause de

xvii
différentes difficultés opérationnelles. Une caractéristique récurrente des projets environnementaux est qu’ils dépendent souvent d’un investissement ultérieur (par exemple, une nouvelle installation de traitement des eaux usées était nécessaire à Vigo, afin de pouvoir résoudre les problèmes de capacité et de traitement qui affectent l'installation existante; ou bien, un nouveau incinérateur a été planifié en Galice, pour résoudre les problèmes de capacité de l'incinérateur de déchets existant) ou d’un changement de comportement (comme par exemple un changement des habitudes de tri des déchets de la part des habitants en Galice et au nord de Lisbonne), afin de permettre aux effets du projet de réaliser complètement leur potentiel. Les projets dans le secteur des transports produisent, eux aussi, des effets secondaires positifs sur l'environnement, en particulier quand le trafic est déplacé de la route au rail (comme dans le cas des projets de la ligne métro de Madrid et du Corridor Méditerranéen).
• Cohésion territoriale. Au vu de la cohésion territoriale, les projets dans le secteur des transports sont les plus exemplaires. C'est en particulier le cas de l'autoroute d’Egnatia, qui connecte différentes régions de la Grèce l'une à l'autre et aux pays des Balkans. D’autres projets ont produit des effets positifs sur la cohésion territoriale, même si cet objectif n'était pas une priorité. La nouvelle ligne métropolitaine de Madrid, par exemple, assure une plus grande continuité entre Madrid et une région relativement périphérique.
• Qualité institutionnelle. Les effets d'apprentissage institutionnel sont, en général, assez faibles, surtout dans le cas des projets environnementaux. Cela est probablement dû au fait que les grands projets d'infrastructure, malgré leur taille, sont enracinés dans un endroit spécifique, sans nécessairement faire partie d'un réseau plus large de projets similaires. Ils offrent une très faible opportunité d'être comparés à d’autres projets de référence semblables et, par conséquent, de déclencher des mécanismes d'apprentissage, à moins que des formes institutionnalisées d'apprentissage ne soient mis en place. Il est clair que des effets d'apprentissage se sont développés au niveau institutionnel dans le cas des autoroutes d’Egnatia et M1 (à travers l'établissement de l'agence ad hoc ‘Egnatia Odos’ et l'adoption de contrats innovateurs ‘Design‐Build’10, respectivement). Le projet de traitement des déchets solides au nord de Lisbonne est le projet environnemental associé au développement institutionnel le plus favorable. En tant que projet pionnier, il a contribué à un développement de la capacité régulatrice des institutions dans le secteur des déchets.
• Bien‐être social. Les effets sur le bien‐être social peuvent se manifester en référence aux attentes ou à la perception subjective du bien‐être des parties intéressées, et ne sont pas appréhendés par les autres dimensions. Ces effets sont importants: ils sont soit fortement positifs ou fortement négatifs, sans que cela ne dépende du secteur d’appartenance. Ils sont également faiblement liés aux performances des projets dans les autres dimensions (par exemple, il y a très peu de lien entre le niveau de bien‐être social et les effets sur l’environnement des projets environnementaux, ou les effets de cohésion territoriale des projets dans le secteur des transports), mais ils peuvent être influencés par des mesures actives (par exemple des campagnes de sensibilisation, comme dans le cas du projet de 10Le Design‐Build est une typologie de partenariat public privé, dans lequel une autorité publique désigne un concessionnaire pour concevoir et construire une pièce de l’infrastructure.

xviii
traitement des déchets solides au nord de Lisbonne). Ils peuvent avoir des conséquences importantes pour les projets eux‐mêmes, en particulier quand ils donnent lieu à des formes organisées d’expression des parties prenantes. Par exemple, les parties prenantes locales ont influencé la conception du Corridor Méditerranéen, en requérant des étapes additionnelles et des changements de route.
Stabilisation des effets du projet (“Quand”)
Dans l’ensemble, la majorité des effets détectés se sont stabilisés, soit dans le court terme (de 1 à 5 ans après l'achèvement du projet) soit dans le long terme (plus de 6 ans après l'achèvement du projet). Cependant, il existe aussi des facteurs importants qui ne se sont toujours pas stabilisés, principalement en ce qui concerne les effets directs sur la croissance. Les projets dans le secteur des transports (par exemple le Port de Gioia Tauro, l'autoroute d’Egnatia et le Corridor Méditerranéen) nécessitent plus de temps pour obtenir une stabilisation de ces effets. Pour les projets environnementaux (par exemple le traitement des déchets solides en Galice et le traitement des eaux usées à Ría de Vigo), la stabilisation des effets sur l'environnement et la croissance est liée aux développements futurs, comme des investissements ultérieurs ou un changement du comportement des utilisateurs, qui ont souvent un effet positif additionnel. En ce qui concerne les effets sur la cohésion territoriale, ils se sont stabilisés d'une manière plus homogène sur le long terme. Les effets sur la qualité institutionnelle, qui sont marginaux pour tous les projets, ont une tendance à se stabiliser à court terme pour les projets environnementaux (par exemple le développement de nouvelles capacités pour la gestion des déchets dans les municipalités Galiciennes), et à long terme pour les projets dans le secteur des transports (par exemple les capacités d'apprentissage dans le Consortium Régional du Transport de Madrid, l'agence de transport métropolitain). Enfin, l’effet de bien‐être social est caractérisé par un horizon temporel essentiellement lié au projet spécifique. Au total, les cas suggèrent qu’un délai de 5 ans après l'achèvement du projet est le minimum nécessaire pour obtenir une stabilisation significative des effets.
Leviers de développement (“Comment”)
Les facteurs déterminant les résultats d'un projet sont liés à la manière par laquelle le projet interagit avec son contexte, aux caractéristiques techniques du projet, à la capacité de prévoir les tendances futures, à la division des rôles et des responsabilités et à la capacité managériale permettant de réagir à des événements imprévus. Certains de ces facteurs (adaptation au contexte et réponse managériale) ont généralement contribué aux projets d'une manière positive, indépendamment du secteur d'intervention; un autre facteur (la gouvernance du projet) a eu, en moyenne, un effet négatif. Le secteur d'activité compte en particulier quand il s'agit de concevoir le projet, avec des résultats qui sont, en moyenne, positifs pour les projets dans le secteur des transports et négatifs pour les projets environnementaux. Plus de détails sur les leviers de développement sont présentés ci‐dessous.
• Adaptation au contexte. Les projets se sont, en général, davantage adaptés à leur contexte qu’ils n’ont influencé ce dernier. Ils ont fourni des solutions adéquates aux besoins de la population ou des utilisateurs (par exemple le nouveau incinérateur de Lisbonne a permis de faire face à la fermeture de la décharge existante) et ils ont pris en compte différents facteurs socio‐économiques et politiques de façon satisfaisante

xix
(l'expansion du réseau métropolitain de Madrid a répondu à un besoin majeur de mobilité et à un trafic aérien accru à l'aéroport de Barajas). A son tour, le contexte a influencé la conception du projet en imposant des contraintes temporelles (comme pour la mise en place des projets de traitement des eaux usées destinés à se conformer à la Directive relative au traitement des eaux urbaines résiduaires11 avant la fin de l'année 2000), d’espace (des découvertes archéologiques ont mené à des changements de route de l'autoroute d’Egnatia) et de budget (les ressources régionales limitées ont empêché l’exécution de la meilleure option de projet à Ría de Vigo).
• Conception du projet. La conception du projet est un point faible des projets environnementaux. Celle‐ci a été affectée négativement par les contraintes temporelles (les délais imposés par les Directives européennes), les erreurs de prévision (concernant la tendance démographique dans le cas de Palerme) et la pression sociale (les municipalités de la sous‐région du nord de Lisbonne ont fait pression pour localiser les installations pour le traitement des déchets solides sur des emplacements différents, avec des conséquences économiques et environnementales négatives). A cet égard, les projets dans le secteur des transports (en particulier le Port de Gioia Tauro et la Ligne Métropolitaine de Madrid) sont caractérisés par des conceptions plus efficientes et flexibles, qui reflètent la vision stratégique en sous‐tendant l’adoption.
• Viabilité financière. Les mécanismes pour assurer la viabilité financière sont une partie intégrante de la conception du projet. En général, les projets analysés n'ont pas affronté de difficultés financières. Pendant la phase d'investissement, certains projets ont dû faire face à des surcoûts qui ont été couverts grâce à un financement public national additionnel. Pendant la phase opérationnelle, les projets ont utilisé des combinaisons différentes de revenus d'exploitation (tarifs) et d'autres sources de financement, pour couvrir les coûts d'exploitation et de manutention.
• Capacité de prévision. Une bonne capacité de prévision peut être très importante pour une conception appropriée ou pour établir des tarifs adéquats. Pour les projets environnementaux, la demande a été la principale source d'imprévu et a provoqué parfois une importante sous‐capacité (comme dans le cas du traitement des déchets solides en Galice). Dans l’un des projets analysés (la ligne métropolitaine de Madrid), une capacité de prévision optimale a été obtenue grâce à un système intégré de contrôles, exécutés pendant la construction et la mise en fonction.
• Gouvernance du projet. La gouvernance du projet a eu une influence décisive et, en moyenne, négative sur l'exécution des projets. Les deux ingrédients principaux pour une structure de gouvernance efficace sont: 1) une répartition claire des responsabilités entre les parties intéressées participant au développement du projet; 2) un mécanisme adéquat pour intégrer les points de vue d'un ensemble plus large d’intéressés. Les projets environnementaux ont été plus particulièrement vulnérables à la pression sociale. Les municipalités et les organisations non‐gouvernementales au nord de Lisbonne ont réussi à influencer la conception du projet et, indirectement, son résultat.
11Directive 91/271/EEC.

xx
Au contraire, les projets dans le secteur des transports ont montré une meilleure résistance à ce type de pression (par exemple les managers de l'autoroute d’Egnatia ont initialement pris très peu en considération les opinions des parties intéressées) ou bien ils ont été capables d’intégrer de telles pressions, sans bouleverser les caractéristiques constitutives du projet (comme le démontre l'inclusion des municipalités dans le processus de prise de décision relatif au projet de la ligne métropolitaine de Madrid). Certains projets dans le secteur des transports ont fourni des cas de bonne pratique en ce qui concerne la distribution des responsabilités, moyennant l’adoption de formes juridiques appropriées (par exemple, l'établissement d'une société commerciale publique, comme ‘Egnatia Odos’).
• Réponse managériale. Une réponse managériale appropriée peut atténuer les insuffisances de la conception, de la gouvernance ou de la prévision, mais elle entraîne aussi des coûts. Alors que dans le secteur des transports, les réponses managériales ont été moins importantes, moins fréquentes ou moins nécessaires, les projets environnementaux ont offert plus d’exemples de réponses managériales efficaces. Rìa de Vigo est un bon exemple de réaction efficace adoptée par Augas de Galicia, l'organisme régional en charge de la mise en place du projet: quand certaines municipalités à Ría de Vigo se sont montrées inefficaces dans la gestion des procédures d'appel d'offres pour désigner des prestataires en charge de la gestion des installations, l'organisme régional a pris en charge la gestion des infrastructures, en assurant leur mise en fonction immédiate.
• Rôle de la Commission Européenne. A part les leviers déjà mentionnés, l’étude a aussi analysé le rôle joué par la Commission Européenne dans le développement des projets. A plusieurs occasions, la Commission est intervenue en faveur de l’un ou plusieurs des leviers identifiés dans cette étude. Pour certains projets (généralement les projets environnementaux, comme par exemple les infrastructures de traitement des déchets solides au nord de Lisbonne et en Galice), la Commission était un simple fournisseur de fonds, et n’est pas entrée dans les détails de la conception du projet, de la gestion et de l'exécution. Dans d’autres cas (en particulier les projets dans le secteur des transports, comme la ligne métropolitaine de Madrid), elle a agit d'une manière plus active, en établissant une relation plus étroite et en s’engageant dans des discussions avec les autorités nationales avec pour résultat, une influence sur les caractéristiques du projet. Même quand elle s’est impliquée de façon significative, la Commission n'a pas toujours réussi à résoudre les difficultés liées aux systèmes de gouvernance nationale/régionale (comme dans le cas du Corridor Méditerranéen). La Banque Européenne d'Investissement a participé elle aussi au cofinancement de trois des dix projets analysés12 et, dans tous les cas, elle a fourni un support de bonne qualité, destiné à améliorer la conception du projet.
Ces différents leviers sont profondément interdépendants. Par exemple, avant de générer des effets de développement, ils se combinent entre eux de plusieurs façons, généralement à
12L’autoroute d’Egnatia, le projet d’approvisionnement en eau à Palerme et le traitement des déchets solides à Lisbonne Nord.

xxi
travers des modalités spécifiques pour chaque projet. Par exemple, l'impact sur la conception d’un projet de l’existence d’intérêts spécifiques et de leur expression, peur être plus ou moins important, selon qu’une structure de gouvernance adéquate est capable de dissiper ou d’intégrer ces intérêts, selon qu’une bonne capacité de prévision mène à l'adoption de campagnes de sensibilisation appropriées, ou selon qu’une réponse managériale est capable de minimiser d'éventuelles conséquences nuisibles.
Un résultat valide pour tous les cas analysés est que la conception et la gouvernance sont les deux éléments fondamentaux sur lesquels un projet s'appuie. Une capacité de prévision et une réponse managériale appropriées peuvent affecter l'un ou l'autre facteur, soit de manière positive en compensant les insuffisances, soit de manière négative si elles sont erronées ou insuffisantes .
En fin de compte, capacité de prévision et réponse managériale sont moins critiques et exercent un impact indirect sur la réussite d'un projet à travers la conception ou la gouvernance. En ce qui concerne le contexte, il ne s’agit pas seulement d’un ensemble de contraintes, mais aussi d’opportunités. Ensemble, contraintes et opportunités doivent contribuer à former la vision qui fonde l'adoption et le développement du projet. Une bonne vision proposant une articulation appropriée des contraintes et des opportunités, et qui est claire quant à ce que le projet veut réaliser, est une bonne base pour le développement futur du projet.
Enfin, les projets environnementaux sont caractérisés par une histoire spécifique, puisque ils s'avèrent souffrir d’insuffisances dans différents domaines (conception, prévision, gouvernance) qui expliquent des résultats comparativement plus faibles (par exemple dynamiques endogènes ou apprentissage institutionnel). Les raisons ont à voir avec la capacité administrative des autorités locales/régionales en charge et avec la nature relativement «ad hoc» de ces projets, qui sont mis en place sans nécessairement faire partie d'un programme d'investissement plus large.
Enseignements concernant la méthodologie d’évaluation ex post
Cette étude d'évaluation a développé et testé une approche méthodologique innovatrice pour l'évaluation ex‐post des projets d'investissement13, qui s’est révélée être très efficace pour répondre aux Questions d’Evaluation “Quoi”, “Quand” et “Comment”. Les innovations méthodologiques suivantes distinguent cette étude d’autres exercices comparables:
• Combinaison des perspectives. L'évaluation a été effectuée autour de dimensions d'analyse micro (au niveau de projet) et macro (incluant systèmes externes, régions et secteurs); la perspective propre à une approche économique a été complétée par les autres sciences sociales afin d’identifier les différents types d'effets de développement produits par
13 Cette approche est présentée et examinée plus en détail dans le Premier Rapport intermédiaire de l’étude d’évaluation, disponible sur le site web de la DG REGIO http://ec.europa.eu/regional_policy/information/evaluations/archives_1989_1999_fr.cfm

xxii
un projet; et enfin, une combinaison entre techniques quantitatives (Analyse Coûts‐Bénéfices ex post) et qualitatives (interviews personnelles, analyse documentaire et recherche dans les archives de la Commission Européenne, du gouvernement et des journaux) a été utilisée. Toutes ces perspectives sont intégrées, et un style narratif adopté, afin de développer dix études de cas qui sont autant d'”histoires” de projet.
• Centre d’intérêt de l'analyse. L’analyse se concentre non seulement sur l’ensemble des effets du projet, mais aussi sur la chaine de causalité qui produit certains effets à des moments précis.
• Calendrier de l’évaluation. Il est exceptionnellement long puisque les projets analysés ont été financés il y a 15‐20 ans environ. Cela a permis de distinguer les effets de long terme et d'identifier les mécanismes qui ont influencé de tels effets dans le temps.
L'Analyse Coûts‐Bénéfices ex‐post , en particulier, a fourni un cadre d'analyse utile pour dégage les effets plus importants et les résultats finaux des projets. L'étude a tiré des leçons méthodologiques importantes à propos de l'utilisation de l'ACB ex‐post et, plus précisément, les thématiques suivantes:
• L’identification de l'unité d'analyse, qui peut être plus large que le projet qui a été l’objet de la décision de financement initiale;
• L'horizon temporaire approprié qui rend compte des impacts à mi‐long terme;
• Le choix du scénario contrefactuel le plus faisable et réaliste, auquel comparer les résultats du projet;
• L'estimation de la demande du projet dans les années qui suivent son exécution;
• L’adoption de taux d’actualisation sociale spécifiques par pays et période (des taux différents pour capitaliser les flux passés et pour actualiser les flux futurs);
• L'identification et la quantification des coûts et des bénéfices, afin d'évaluer les impacts à long terme en opposition à ceux de court terme, généralement quantifiés à travers des Analyses Coût‐Bénéfice (ACB) ex‐ante;
• L'application des prix fictifs les plus appropriés qui, quand cela est nécessaire, sont spécifiques par période ou région.
Les leçons dérivées de l'application de la méthodologie de l’ACB aux dix projets analysés sont d'intérêt général et peuvent être utiles à n'importe quel exercice d’ACB ex‐post au niveau de l'UE ou même plus large14
Conclusions et recommandations
En général, les études de cas montrent que les résultats des projets de développement
14Par exemple, une discussion est en cours à la Banque Mondiale sur comment relancer l’ACB en tant qu’ instrument nécessaire (même si pas exclusif) d’évaluation des projets (Banque Mondiale, 2011).

xxiii
découlent d’un ensemble de circonstances sociales, environnementales, socio‐économiques, institutionnelles et culturelles, éventuellement accidentelles, et des réponses managériales produites par le projet. Des conjectures spécifiques ont été identifiées concernant ce qui peut être considéré comme une liste d'ingrédients pour la réussite d’un projet d’investissement public. En premier lieu, des investissements réussis prennent plus probablement place dans un contexte où l'esprit d'entreprise, le professionnalisme, l’indépendance de gestion et la responsabilité envers le gouvernement sont réunis pour encourager l’émergence des idées de projet, choisir les plus prometteuses et empêcher que le projet ne soit exposé à un bouleversement soit pendant sa construction, soit pendant la mise en œuvre. Des incitations appropriées, des prévisions précises et des activités de suivi sont importantes pour favoriser l'achèvement des objectifs du projet. Enfin, l'établissement par les concepteurs et les managers de mécanismes formalisés assurant que toutes les parties intéressées sont écoutées peuvent aider à produire un sentiment d'orgueil social et d’identité susceptibles d’augmenter la probabilité de réussite du projet.
Une telle liste d'ingrédients suggère un ensemble de recommandations opérationnelles tout au long des principales phases du cycle de gestion du projet.
• Identification et formulation: une fonction de planification systématique et cohérente. Pendant la première phase du cycle du projet, il faudrait s'assurer que les bonnes idées soient mises en pratique et que les mauvaises soient, au contraire, écartées. Les bonnes idées sont celles fondées sur une vision claire et innovatrice du développement et qui répondent à un besoin social important. Une capacité d'innovation de l'administration publique de l'Etat Membre, le professionnalisme et des compétences techniques de haut niveau permettent d'identifier les idées les plus prometteuses.
• Conception et sélection: un investissement dans l’expertise technique. Les instruments qui devraient être mis en place pour développer des études de faisabilité de haute qualité et assurer une bonne conception du projet sont les suivants: une conception technique solide, mais flexible; une analyse de la demande précise, accompagnée par un bon exercice de prévision; un plan de gestion des risques et une ACB ex‐ante; un cadre pour informer les parties intéressées d'une manière systématique et leur permettre de participer au développement du projet; une appréciation spécifique de l’organisation de la gouvernance et des changements à y apporter15; des mécanismes pour assurer la viabilité financière pendant toute la durée du projet. Les résultats des études de faisabilité et de l'Analyse Coûts‐Bénéfices, évalués par un réviseur indépendant en charge du contrôle de la qualité et du sérieux du projet, devraient être utilisés pour sélectionner et donner priorité aux meilleurs projets.
• Exécution du projet: suivi systématique et latitude. La vie du projet devrait être tracée et surveillée. Une attention spécifique devrait être prêtée aux projets particulièrement risqués. Au cas où le processus de suivi met en évidence des déviations importantes par rapport aux résultats attendus, une action corrective doit être recommandée par l'Autorité de Gestion et mise en œuvre par le bénéficiaire.
15Par ex. en ce qui concerne la distribution des responsabilités entre les différentes parties institutionnelles.

xxiv
• Clôture: schémas d’incitation et apprentissage. Après la clôture du projet, la Commission Européenne devrait effectuer une évaluation systématique ex‐post, dont les résultats devraient être publiés. L'évaluation ex‐post devrait être destinée non seulement à vérifier les effets du projet, mais aussi à identifier et récompenser les équipes des projets qui ont atteint une performance de haut niveau.
La mise en place des recommandations ici proposées demanderait une action conjointe de la part de la Commission Européenne et des États membres. En particulier, la CE devrait considérer attentivement son rôle de conseiller à l'égard des États membres à la lumière des défis décrits ci‐dessus, en contribuant par exemple à l'adoption d'approches communes pour la préparation et l’évaluation des projets et en promouvant le transfert de connaissance et le partage des bonnes pratiques.
xxv
ZUSAMMENFASSUNG Hintergrund
Großprojekte, definiert nach Art. 16,2 der EFRE‐Verordnung 2082/1993, bestätigt durch Art. 40 der Verordnung 1083/2006 und den neuen Verordnungsentwürfen, sind ein wesentlicher Bestandteil der Kohäsionspolitik. Erfolgreiche Großprojekte tragen positiv zum Wirtschaftswachstum, zum sozialen Gemeindewohl und zur Lebensqualität bei. Ihre Bedeutung im Hinblick auf die Investitionskosten, der Absorption von EU‐Fonds, deren Sichtbarkeit für eine breite Öffentlichkeit sowie das für die Umsetzung benötigte Expertenwissen machen eine spezifische Kontrolle erforderlich.
Ziel dieser Studie ist es, Art, Umfang und Zeitrahmen der langfristigen Auswirkungen von zehn ausgewählten Großprojekten zu evaluieren, die im Zeitraum von 1994 bis 1999 umgesetzt wurden, und die Mechanismen, die die Ergebnisse solcher Projekte erklären. Durch die Sammlung der Ergebnisse der Fallstudien konnte der Gutachter einige wichtige Ideen für politische Lernprozesse herausarbeiten und daraus sinnvolle Empfehlungen bezüglich der Kausalitätsketten ableiten, die zu einigen langfristigen Auswirkungen von Investitionen führten.
Bewertungsfragen Der konzeptionelle Rahmen, welcher der Studie zugrunde liegt, ist in drei Analysedimensionen organisiert, die folgende Bewertungsfragen beinhalten (zusammengefasst unter den Überschriften "Was", "Wann" und "Wie"):
i. Was sind die langfristigen Auswirkungen dieser Projekte? Unterschieden wurde zwischen den Auswirkungen „wirtschaftliche Entwicklung" und "Lebensqualität“. Zu den ersteren gehören die direkten Auswirkungen auf das Bruttoinlandsprodukt (BIP) und die endogene Dynamik des Wirtschaftswachstums, wobei letztere als Synonym für soziales Wohlergehen verwendet werden. Sie beinhalten Effekte, die nicht durch ökonomische Variablen erfasst werden, die aber den sozialen und territorialen Zusammenhalt, institutionelles Lernen, Umwelt und die soziale Zufriedenheit beeinflussen.
ii. Wann materialisieren und stabilisieren sich langfristige Auswirkungen? Effekte können sich nach wenigen Jahren nach Projektabschluss oder nach einem längeren Zeitraum stabilisieren, oder sie benötigen dafür noch Zeit.
iii. Wie stellen sich langfristige Effekte ein? Die folgenden möglichen bestimmenden Faktoren, welche einen Einfluss auf die Schaffung kurz‐ oder langfristiger Projektauswirkungen haben können, werden identifiziert: Angemessenheit des Kontextes, Projektdesign, Vorhersagefähigkeit, Projekt‐Governance und Führungsantworten.
Eine vierte Frage der Evaluierung ist schließlich, welche vorhandenen Auswertungsverfahren können eine bestimmte langfristige Wirkung von verschiedenen Investitionsarten in den Bereichen Umwelt und Verkehrsinfrastruktur erfassen. Sie bezieht sich auf die Identifizierung

xxvi
der am besten geeigneten Methode, die es einen ermöglicht, die „Was“, „Wenn“ und „Wie“ Dimensionen zu umfassen und zu entwirren.
Die Evaluationsfragen werden in diesem Bericht durch die große Anzahl der in den Fallstudien gesammelten Beispiele beantwortet16.
Übersicht der ausgewählten Projekte
Die analysierten Investitionsprojekte umfassen die Bereiche Verkehr (Straße, Schiene, Seehäfen) und Umwelt (Wasserversorgung, Abwasserbehandlung, Abfallwirtschaft) in fünf Mitgliedstaaten: Griechenland, Irland, Italien, Portugal und Spanien:
i. Hafen von Gioia Tauro (Italien);
ii. M1 Autobahn (Irland);
iii. Egnatia Autobahn (Griechenland);
iv. Metro‐Linie Madrid als Zubringer zum Flughafen Barajas (Spanien);
v. Mittelmeerkorridor (Spanien);
vi. Wasserversorgung in der Stadt Palermo (Italien);
vii. Behandlung fester Siedlungsabfälle in Nord Lissabon (Portugal);
viii. Abfallwirtschaft in Galicien (Spanien);
ix. Abwasserbehandlung in Ría de Vigo (Spanien);
x. Abwasserbehandlung in Dublin (Irland).
Zusammengenommen umfassen diese Projekte mehr als 10 Milliarden Euro an Investitionen und knapp 5 Milliarden Euro Ko‐finanzierung durch die Europäische Kommission (EK). Sie wurden auf Grundlage objektiver Auswahlverfahren (unter Berücksichtigung der geografischen Reichweite, Art der Infrastruktur, Größe und anderen Kriterien) ausgewählt und auch, weil sie wahrscheinlich interessante spezifische Projektgeschichten liefern, aus denen effektive politische Lehren gezogen werden können.
Die EU‐Kofinanzierung reicht von 44 Mio. EUR für das Wasserversorgungsprojekt in Palermo bis hin zu mehr als 3 Milliarden Euro für die Egnatia Autobahn. Wie in der unteren Karte gezeigt, erhielten die meisten dieser Projekte finanzielle Beiträge aus dem Kohäsionsfonds oder dem Europäischen Fond für Regionale Entwicklung, wohingegen einige von ihnen auch Finanzierung aus dem Europäischen Sozialfond, dem Etat des Trans‐Europäischen Verkehrsnetzes (TEN‐T) und der Europäischen Investitionsbank erhielten.
16 Alle Fallstudien sind auf der Internetseite der Dg Regio erhältlich http://ec.europa.eu/regional_policy/information/evaluations/archives_1989_1999_en.cfm#1. Eine Zusammenfassung ist auch im Anhang 1 dieses Schlussberichtes zur Verfügung gestellt.

xxvii
STANDORT, INVESTITIONSKOSTEN UND FINANZIERUNGSQUELLEN DER AUSGEWÄHLTEN PROJEKTE
Hinweis: Die Gesamtkosten des Projekts sind in Mio. EUR zum Preis von 2011 angegeben. Quelle: Autoren
Land / Region: Griechenland/Ost Mazedonien& Trace, Zentral Mazedonien, West Mazedonien, Epirus, ThessalierProjektname: Die Egnatia AutobahnSektor: Transport – AutobahnInvestitionsperiode: 1994‐2011Gesamtkosten: € 7,053EU Co‐Finanzierungsrate: 14.7% (KF) 28.7% (EFRE) 0.4% (TEN‐T Fund)EIB Beitrag: 41%
Land / Region : Irland / Grenze, Mittel‐Ost, DublinProjekttitel: M1 AutobahnSektor: Transport – AutobahnInvestitionsperiode: 1989‐2005Gesamtkosten: € 787EU Co‐Finanzierungsrate: 38% (KF)
Land / Region : Italien/SizilienProjektname: Wasserversorgung in der Stadt PalermoSektor: Umwelt‐WasserversorgungInvestitionsperiode: 1997‐2004Gesamtkosten: € 120EU Co‐Finanzierungsrate: 37% (EFRE)EIB Beitrag: 18%
Land / Region : Spanien/MadridProjektname: Madrid Metro Line – ZubringerzumBarajas FlughafenSektor: Transport ‐MetrolinieInvestitionsperiode: 1997‐2002; 2006‐2007Gesamtkosten: € 518EU Co‐Finanzierungsrate: 76% (KF)
Land / Region : Spanien/GalizienProjektname: StädtischeAbfallwirtschaft in GalizienSektor: Umwelt‐ AbfallwirtschaftInvestitionsperiode: 1997 – 2010 (KF Projekt 1997 – 2001)Gesamtkosten: € 275EU Co‐Finanzierungsrate: 36% (KF)
EU Co‐Finanzierungsrate: 69% (KF)Land / Region : Portugal/LissabonProjektname: Integriertes Abwassermanagement in Nord LissabonSektor: Umwelt‐AbwasserbehandlungInvestitionsperiode: 1996‐2002; 1999‐2008Gesamtkosten: € 366EU Co‐Finanzierungsrate: 37% (KF)EIB Beitrag: 34%
Land / Region: Irland/DublinProjektname: Abwasserbehandlung in Dublin Sektor: Umwelt‐AbwasserbehandlungInvestitionsperiode: 1995‐2003Gesamtkosten: € 296EU Co‐Finanzierungsrate: 53% (KF)
Land / Region: Italien/CalabrienProjektname: Hafen von Gioia TauroSektor: Transport ‐HafenInvestitionsperiode: 1994‐1998Gesamtkosten: € 418EU Co‐Finanzierungsrate: 13% (EFRE) 2% (ESF)
Land / Region : Spanien/Barcelona‐ValenciaProjektname: Der MittelmeerkorridorSektor: Transport ‐ SchienenverkehrInvestitionsperiode: 1993‐2002Gesamtkosten: € 759EU Co‐Finanzierungsrate: 70% (KF)
Land / Region : Spanien/GalizienProjektname: Integrierte Umweltregenerierung von Ría de VigoSektor: Umwelt‐AbwasserbehandlungInvestitionsperiode: 1995‐2000Gesamtkosten: € 172EU Co‐Finanzierungsrate: 69% (KF)

xxviii
Entwicklungseffekte (ʺWasʺ)
Die untersuchten Fallbeispiele haben insgesamt zu positiven Auswirkungen der unterschiedlichen Dimensionen geführt. Sie deuten unumstritten auf direkte Beiträge zum Wirtschaftswachstum und zur Verbesserung der Lebensqualität hin, während sich die Stärke der einzelnen Arten von Effekten nach Sektor (Verkehr oder Umwelt) oder Projekt unterscheiden können.
• Direktes Wohlstands‐ und Wirtschaftswachstum. Infrastrukturprojekte lösen nicht nur wirtschaftliche Wachstumseffekte in Hinblick auf ein reales BIP‐Wachstum aus sondern bringen auch weiterreichende Effekte für das Wohlergehen der Nutzer mit sich, zum Beispiel durch die Bereitstellung von verbesserten öffentlichen Dienstleistungen. Wie die Fallstudien der Autobahnen Egnatia und M1 zeigen, können Verkehrsprojekte wichtige Auswirkungen in Bezug auf das direkte wirtschaftliche Wachstum haben, vor allem durch Reisezeitersparnis, aus der sich Produktivitätssteigerungen und Mitnahmeeffekte für die regionale Entwicklung ergeben. Bei Umweltprojekten sind vor allem die Vorteile für die Nutzer von Bedeutung, wie bei den Projekten zur Abwasserbehandlung in Dublin und Ria de Vigo, die der Bevölkerung verbesserte öffentliche Dienstleistungen und einen verbesserten Nutzungswert der öffentlichen Güter gebracht haben (wie sauberes Meerwasser und Strände), zum Nutzen der Einwohner und Touristen. Die Typologie der Infrastruktur spielt ebenfalls eine Rolle: für die beiden betrachteten Abfallverbrennungsanlagen (in Galizien und Nord Lissabon) sind, zum Beispiel, die aus den Nebentätigkeiten entstehen Geschäftsmöglichkeiten (insbesondere der Verkauf von Strom und der Beitrag zum Markt von recycelten Materialien) ein wichtiger Faktor der direkten wirtschaftlichen Wachstumseffekte, die über die lokale Ebene hinausgehen können.
• Endogene Dynamik. Die Einflussnahme zwischen der Infrastrukturausstattung und dem Wirtschaftswachstum sind auch indirekt, wenn auch in einem geringeren Maße als die direkten Auswirkungen auf das Wohlergehen und das Wirtschaftswachstum. Das Wirtschaftswachstum wurde endogen gefördert durch die Verbesserung des Humankapitals (durch die Organisierung von Schulungen für die Hafenarbeiter von Gioia Tauro), durch zunehmenden technologischen Fortschritt (durch den Einsatz einer Hochleistungs‐Bahntechnologie für das Mittelmeerkorridor Projekt oder den Systemen zur Abwasserbehandlung in den Ría de Vigo Gemeinden) und durch die Förderung von organisatorischen Veränderungen (wie die Einbindung eines internationalen Ingenieur‐Unternehmens innerhalb des "Egnatia Odos", der für die Verwaltung der Egnatia Autobahn zuständigen griechischen Behörde). Umweltprojekte weisen einen etwas niedrigeren endogenen Wachstumseffekt aus als Verkehrsprojekte.
• Sozialer Zusammenhalt. Effekte auf den sozialen Zusammenhalt sind in der Regel Nebenwirkungen, aber sie können signifikante Größenordnung erreichen, wenn sie entsprechend genutzt werden. Eine beispielhafte Veranschaulichung stellt die Metro‐Linie Madrid dar: durch die Bereitstellung eines qualitativ hochwertigen und

xxix
erschwinglichen öffentlichen Verkehrsmittels zwischen dem Zentrum von Madrid und dem Bezirk Barajas hat das Projekt für einen besseren Zugang der Bewohner (meist Einwanderer oder Personen mit begrenzten Ressourcen) der weniger entwickelten angrenzenden Gebiete gesorgt.
• Auswirkungen auf die Umwelt. Es überrascht nicht, dass Umweltprojekte positive Auswirkungen auf die Umwelt haben, obwohl ihre vollständige Umsetzung von verschiedenen operationellen Schwierigkeiten erschwert wird. Ein wiederkehrendes Merkmal von Umweltprojekten ist zum Beispiel die Tatsache, dass sie häufig von weiteren Investitionen abhängen (in Vigo muss eine neue Kläranlage gebaut werden, um die Kapazität und die Aufbereitungsprobleme der bestehenden Anlage anzugehen, und es wurde eine neue Müllverbrennungsanlage geplant, um die Kapazitätsprobleme der Müllverbrennungsanlage in Galizien zu lösen) oder von Verhaltensänderungen (z. B. Verbesserung der Abfalltrennung in den Haushalten sowohl in Galizien als auch in Nord‐Lissabon), damit ihre Auswirkungen ihr volles Potenzial entfalten. Transportprojekte haben ebenfalls positive ökologische Nebenwirkungen, insbesondere wenn der Verkehr vom Auto auf die Schiene verlagert wird (wie bei der Metro‐Linie Madrid und dem Mittelmeerkorridor Projekt).
• Territoriale Kohäsion. Verkehrsprojekte sind, was den territorialen Zusammenhalt angeht, weit relevanter. Insbesondere ist dies bei der Egnatia Autobahn der Fall, welche verschiedene Regionen Griechenlands untereinander und mit den Balkanländern verbindet. Andere Projekte haben einige positive Auswirkungen auf den territorialen Zusammenhalt, auch wenn dieses Ziel nicht oberste Priorität war: zum Beispiel hat die neue Metro‐Linie Madrid den Zusammenhalt zwischen Madrid und einem relativ abgelegenen Gebiet sicherstellt.
• Institutionelle Qualität. Institutionelle Lerneffekte sind insgesamt gering und sogar noch geringer bei Umweltprojekten. Dies ist wahrscheinlich auf die Tatsache zurückzuführen, dass wichtige Infrastrukturprojekte zwar groß, aber standort‐gebunden und nicht Teil eines Netzwerks sind. Sie bieten wenig Gelegenheit, mit Zielvorgaben verglichen zu werden und als solche Lernmechanismen auslösen, es sei denn, sie werden von institutionalisierten Formen des Lernens begleitet. Es gibt Hinweise darauf, dass bei Autobahnen Egnatia und M1 einige Lerneffekte auf institutioneller Ebene stattfanden (durch die Einrichtung der ad‐hoc Agentur „Egnatia“17 beziehungsweise durch die Einführung innovativer Design‐Build Verträgen18). Das Projekt für die Abfallbehandlung in Nord Lissabon ist das Umwelt‐Projekt mit der günstigsten institutionellen Entwicklung. Als Pionierprojekt trug es zur Entwicklung der regulatorischen Kapazität von Institutionen in der Abfallwirtschaft bei.
17 Verantwortlich für die Durchführung und Verwaltung des Egnatia Autobahnprojektes. 18 Design‐Build (Generalunternehmer‐Verträge) sind eine Art von Öffentlich‐Privater‐Partnerschaft, bei der die öffentliche Behörde einen Konzessionär ernennt, der den Entwurf und den Bau der Infrastruktur durchführt.

xxx
• Soziale Zufriedenheit. Auswirkungen auf die soziale Zufriedenheit können durch den Verweis auf Vorstellungen oder subjektive Wahrnehmung des Wohlstandes stattfinden, die nicht durch andere Dimensionen erfasst werden. Diese Effekte sind sowohl im negativen als auch im positiven Sinne relevant und weisen keinen wirklichen Unterschied zwischen Umwelt‐ und Verkehrsprojekten auf. Sie stehen kaum in Bezug zur Projektleistung entlang anderer Dimensionen (zum Beispiel besteht kaum ein Zusammenhang zwischen der Höhe der gesellschaftlichen Zufriedenheit und den ökologischen Auswirkungen von Umweltprojekten oder den Auswirkungen im Hinblick auf den territorialen Zusammenhalt von Verkehrsprojekten), aber sie können durch pro‐aktive Maßnahmen beeinflusst werden (z. B. Sensibilisierungskampagnen, wie beim Abfallwirtschaftsprojekt in Nord Lissabon). Sie können wichtige Konsequenzen für Projekte haben, besonders wenn sie zum Entstehen einer organisierten "Stimme" der Interessengruppen führen: so beeinflussten lokale Akteure das Design des Mittelmeerkorridors durch die Forderung nach zusätzlichen Haltestellen und Änderungen der Bahnstrecke, um nur ein Beispiel zu nennen.
Stabilisierung der Projekt‐Effekte (ʺWannʺ)
Insgesamt scheint sich die Mehrheit der festgestellten Auswirkungen bereits stabilisiert zu haben, entweder in einem kurz‐mittelfristigen (d.h. von 1 bis 5 Jahren nach Projektabschluss) oder einem langfristigen (mehr als 6 Jahre nach Projektabschluss) Zeitraum. Allerdings gibt es auch wichtige Faktoren, die sich noch nicht stabilisiert haben, vor allem direkte Wachstumseffekte. Für Transportprojekte (z.B. Hafen von Gioia Tauro, Egnatia Autobahn und Mittelmeerkorridor) wird mehr Zeit benötigt, damit sich diese Wirkungen verfestigen. Bei Umweltprojekten (z.B. der Abfallbehandlung in Galizien und der Abwasserbehandlung in Ría de Vigo) ist die Stabilisierung von direktem Wachstum und ökologischen Auswirkungen verknüpft mit der Annahme, dass zukünftige Entwicklungen, wie weitere Investitionen oder Verhaltensänderungen, oftmals zusätzlich positive Auswirkungen bringen werden. Was die Effekte des territorialen Zusammenhalts betrifft, so haben sich diese auf lange Sicht gleichmäßiger stabilisiert. Auswirkungen auf die Qualität der Institutionen, die für alle Projekte gering sind, festigten sich kurzfristig eher bei Umweltprojekten (z.B. Entwicklung neuer Kapazitäten für die Abfallwirtschaft in den galizischen Gemeinden), und auf lange Sicht bei Verkehrsprojekten (z. B. Lernkapazitäten innerhalb des Regionalen Verkehrsverbundes Madrids, der städtischen Verkehrsagentur). Schließlich ist die soziale Zufriedenheit ein Effekt, der einen im Wesentlichen projektspezifischen zeitlichen Horizont hat. In jedem Fall deuten die Ergebnisse darauf hin, dass nach Fertigstellung ein Zeitraum von mindestens 5 Jahren notwendig ist, um eine deutliche Stabilisierung der Effekte festzustellen.
Entwicklungsfaktoren (ʺWieʺ)
Bestimmende Faktoren der Projektergebnisse beziehen sich auf die Art und Weise, wie das Projekt mit dem Kontext interagiert, den technischen Merkmalen des Projekts, der Fähigkeit, zukünftige Trends vorherzusagen, der Aufteilung der Rollen und Verantwortlichkeiten und der Fähigkeit des Managements, auf unvorhergesehene Ereignisse zu reagieren. Einige dieser

xxxi
Faktoren (Angemessenheit des Kontextes und der Führungskräfteverantwortung) trugen in der Regel positiv zu den Projekte bei, unabhängig vom Interventionssektor; ein weiterer Faktor hatte einen im Durchschnitt negativen Effekt (Projekt‐Governance). Der infrastrukturelle Sektor spielt, insbesondere was das Projektdesign betrifft, eine besondere Rolle, mit durchschnittlich positiven Noten bei Verkehrsprojekten und negativen Noten bei Umweltschutzprojekten. Weitere Details zur den Entwicklungsfaktoren werden im Folgenden vorgestellt.
• Angemessenheit gegenüber dem Kontext. Projekte passen sich generell ihrem Kontext an statt ihn zu beeinflussen. Sie lieferten geeignete Lösungen für die Bevölkerung oder für die Bedürfnisse der Nutzer (z.B. die neue Müllverbrennungsanlage in Lissabon zur Bewältigung der Schließung der bestehenden Deponie) und reflektierten unterschiedliche sozio‐ökonomische und politische Faktoren (die Erweiterung des Madrider Metro‐Liniennetzes resultierte aus einem höheren Mobilitätsbedarf und wachsendem Flugverkehr auf dem Flughafen Barajas). Im Gegenzug beeinflusste der Kontext den Projektentwurf durch die Auferlegung von zeitlichen (wie im Falle der Implementierung des Projektes zur Abwasserbehandlung zur Umsetzung der kommunalem Abwasserrichtlinie19 bis Ende 2000), räumlichen (archäologische Funde führten zur Änderungen der Führung der Egnatia Autobahn) und Etat‐Einschränkungen (begrenzte regionale Ressourcen verhindert Umsetzung der besten Projektmöglichkeit in Ría de Vigo).
• Projekt design. Ein Schwachpunkt bei Umweltprojekten ist der Projektentwurf, der negativ beeinflusst wird durch den Zeitdruck (durch von der EG‐Verordnungen auferlegten Fristen), Vorhersagefehlern (wie der Bevölkerungsentwicklung im Fall von Palermo) sowie sozialem Druck (Vorort‐Gemeinden Nord Lissabons erwirkten, dass die Abfallaufbereitungsanlagen auf verschiedene Regionen verteilt wurden, mit negativen wirtschaftlichen und ökologischen Folgen). Anscheinend sind Verkehrsprojekte (insbesondere der Hafen von Gioia Tauro und die Metro‐Linie Madrids) generell durch eine effizientere und flexiblere Planung gekennzeichnet, die ihre strategische Sichtweise untermauert. Finanzielle Nachhaltigkeit. Mechanismen zur Sicherung der finanziellen Nachhaltigkeit sind wesentlicher Bestandteil der Projektplanung. Im Allgemeinen hatten die betrachteten Projekte keine finanziellen Schwierigkeiten. Während der Investitionsphase entstanden bei einigen Projekten Kostenüberschreitungen, die durch zusätzliche nationale öffentliche Mittel gedeckt wurden. Während der Betriebsphase wurden in den Projekten verschiedene Kombinationen von Betriebseinnahmen (Tarife) und anderen Finanzierungsquellen genutzt, um Betriebs‐ und Wartungskosten zu decken.
• Vorhersagefähigkeit. Gute Vorhersagen können sehr wichtig sein für die Entscheidung über eine entsprechende Ausrichtung oder um angemessene Tarife festzulegen. Bei Umweltprojekten war die Nachfrage der größte unberechenbarste Faktor mit daraus
19 Direktive 91/271/EEC.

xxxii
resultierenden Unter‐Kapazität (wie im Abfallmanagement Projekt in Galizien). In einem Fall (Metro‐Linie Madrid), wurde eine optimale Kapazitätsprognose durch ein umfassendes Kontrollsystem während des Baus und Betriebes erreicht.
• Projektgovernance. Die Verwaltung hatte einen entscheidenden und im Durchschnitt negativen Einfluss auf die Projektumsetzung. Die beiden wichtigsten Komponenten für eine effektive Verwaltungsstruktur sind: eine klare Verteilung der Zuständigkeiten zwischen den an der Projektentwicklung beteiligten Akteuren und geeignete Mechanismen, um die Ansichten einer größeren Gruppe von Akteuren zu integrieren. Umweltprojekte scheinen besonders anfällig für sozialen Druck zu sein: Gemeinden und Nichtregierungsorganisationen in Nord Lissabon waren erfolgreich bei der Beeinflussung des Projektdesigns und damit indirekt auf die Umsetzung. Im Gegensatz dazu zeigten Verkehrsprojekte eine bessere Fähigkeit, dem Druck standzuhalten (z. B. nahmen die Führungskräfte der Egnatia‐Autobahn anfänglichen wenig Rücksicht auf die Meinungen der Akteure) oder integrieren sie, ohne die grundlegenden Merkmale des Projekts nachteilig zu beeinflussen (wie durch die Einbeziehung der Gemeinden in den Entscheidungsprozess bei der Metro‐Linie Madrid). Einige Verkehrsprojekte brachten Gute Praxis Beispiele in Bezug auf effektive Verteilung der Zuständigkeiten, die in eine entsprechende Rechtsform umgesetzt wurden (z.B. durch die Einrichtung eines geeigneten kommerziellen, öffentlichen Unternehmens, wie der "Egnatia Odos").
• Führungsantworten. Ein angemessenes Führungsverhalten kann Mängel in Bezug auf Design, Steuerung oder Vorausberechnungen mildern, aber es verursacht Kosten. Während im Verkehrssektor die Führungsantworten weniger relevant, häufig oder notwendig waren, zeigen Umweltprojekte verschiedene Möglichkeiten der effektiven Steuerung durch das Management. Ría de Vigo bietet ein gutes Beispiel für eine wirksame Reaktion durch die Augas de Galicia, der regionalen Durchführungsstelle des Projektes: als sich einige Gemeinden in Ría de Vigo im Umgang mit Ausschreibungen für die Übertragung der Verwaltung der Aufbereitungsanlagen als ineffizient erwiesen, übernahm die regionale Stelle die Verantwortung für den Betrieb der Anlagen und sorgte so für ihre sofortige Funktionsfähigkeit.
• Die Rolle der Europäischen Kommission. Neben den bereits erwähnten Faktoren, wurde die Rolle der Europäischen Kommission bei der Projektentwicklung analysiert. Bei verschiedenen Gelegenheiten hat die Kommission entweder auf einen oder auf mehrere, in der Studie identifizierten, Entwicklungsfaktor eingegriffen. Bei einigen Projekten (in der Regel Umweltprojekten, wie bei den Abfallaufbereitungsanlagen in Nord Lissabon und Galizien), war sie lediglich Finanzgeber ohne dabei in die Details der Projektausrichtung, des Managements und der Durchführung einzugreifen; in anderen Fällen (meist Verkehrsprojekte, wie der Madrider Metro‐Linie), wirkte sie in einer pro‐aktiven Weise, etablierte engere Beziehungen, führte Diskussionen mit den nationalen Behörden und beeinflusste die Projektmerkmale. Auch wenn ein hohes Maß an Engagement eingebracht wurde, ist es der Kommission jedoch nicht immer gelungen, die bereits bestehenden Einschränkungen der nationalen/regionalen Governance‐Strukturen (wie sie im Fall des Mittelmeerkorridors und dem Hafen von Gioia Tauro aufgetreten sind) zu überwinden. Die Europäische Investitionsbank war auch bei der

xxxiii
Ko‐Finanzierung von drei der zehn betrachteten Projekte beteiligt20 und in allen Fällen gab sie wertvolle Unterstützung für die Verbesserung der Projektausrichtung.
Diese unterschiedlichen Faktoren sind tief miteinander verflochten, d.h. bevor sie entwicklungspolitische Effekte bringen, greifen sie in unterschiedlicher Weise ineinander ein, in der Regel durch projektspezifische Muster. Zum Beispiel kann der Einfluss der Interessensgruppen auf die Gestaltung mehr oder weniger bedeutend sein, je nachdem ob eine entsprechende Verwaltungsstruktur in der Lage ist, diese Interessen zu besänftigen oder zu integrieren, eine Vorhersagefähigkeit zum Einsatz entsprechender Sensibilisierungskampagnen führt die späteren Störeffekten vorgreift, oder ob Führungsantworten in der Lage sind, mögliche nachteilige Folgen auf ein Minimum zu reduzieren.
Ein in allen betrachteten Fällen gültiges Ergebnis ist, dass Design und Governance die beiden Pfeiler sind, auf dem ein Projekt steht. Eine entsprechende Vorhersagefähigkeit und Führungsantwort sind Faktoren, die sich das eine oder andere beeinflussen, entweder positiv durch das Ausgleichen von Mängeln, oder negativ, wenn sie falsch oder unzureichend sind. Normalerweise sind sie aber weniger kritisch und haben einen indirekten Einfluss auf die Projektumsetzung durch das Design oder der Governance. Im Hinblick auf den Kontext bestehen nicht nur eine Reihe von Einschränkungen sondern auch Möglichkeiten, die eine Vision bilden hilft, die zur Anpassung und Entwicklung des Projekts führt. Eine klare Vorstellung, die eine entsprechende Artikulation von Zwängen und Möglichkeiten vorschlägt und die klar weiß, was das Projekt erreichen will, bringt viel für die zukünftige Entwicklung des Projektes.
Schließlich entsteht eine Sektor spezifische Geschichte, da Umweltprojekte unter verschiedenen Mängeln an unterschiedlichen Fronten leiden (Design, Vorhersehbarkeit, Governance), die zu einer vergleichsweise schwächeren Leistung (z.B. endogene Dynamik oder institutionelles Lernen) führen. Die Gründe hängen mit einer schwachen Verwaltungskapazität der lokalen/regionalen Behörden und mit dem relativen ad‐hoc‐Charakter der Projekte zusammen, die umgesetzt werden, ohne notwendigerweise Teil eines größeren Investitionsprogramms zu sein.
Gewonnene Erkenntnisse aus der Methodik der Ex‐post‐Evaluierung
Diese Evaluationsstudie entwickelte und testete einen innovativen methodischen Ansatz für die Ex‐post‐Bewertung von Investitionsprojekten21, die sich als sehr wirksam bei der Beantwortung der Evaluationsfragen "Was", "Wann" und "Wie" erwies. Die folgenden methodischen Neuerungen unterscheiden diese Studie von anderen vergleichbaren Untersuchungen:
20 Die Egnatia Autobahn, das Wasserversorgungsprojekt in Palermo und integrierte Feststoff‐Abfallbehandlung in Nord Lissabon. 21 Vorgestellt und erörtert im ersten Zwischenbericht der Evaluierungsstudie, erhältlich auf der Seite der DG Regio http://ec.europa.eu/regional_policy/information/evaluations/archives_1989_1999_de.cfm

xxxiv
• Kombination von Perspektiven. Die Evaluierung umfasste die Analysedimensionen der Mikro‐ (Projektebene) und Makroebene (einschließlich externer Systeme, Bereiche und Sektoren). Sowohl die Perspektive der Wirtschafts‐ als auch anderer Sozialwissenschaften wurde berücksichtigt, um die verschiedenen Arten der Entwicklungseffekte zu entwirren, die durch Investitionen ausgelöst wurden. Eine Mischung aus quantitativen (ex‐post Kosten‐Nutzen‐Analyse) und qualitativen Techniken (persönliche Interviews, Dokumentenanalyse und Recherche in Archiven der Europäischen Kommission, Regierungen und Zeitungen). Alle diese Perspektiven sind in einer erzählerischen Weise zusammengefasst, so dass zehn Fallstudien entstanden, die sich als Projekt "Geschichten" lesen.
• Fokus der Analyse. Der Fokus liegt nicht nur auf den Projekteeffekten, sondern auch auf der Kausalitätskette, die zur Erzeugung bestimmter Effekte zu bestimmten Zeitpunkten führte.
• Zeitraum der Auswertung. Der zeitliche Rahmen ist außergewöhnlich lang, da die betrachteten Projekte vor fast 15‐20 Jahren finanziert wurden: dies ermöglicht es, die langfristig generierten Auswirkungen zu entwirren und die Mechanismen leichter zu identifizieren, die solche Wirkungen über die Jahre beeinflusst haben.
Insbesondere die Ex‐post‐Kosten‐Nutzen‐Analyse erwies sich als ein nützlicher Analyserahmen, um die wichtigsten Aspekte der ex‐post Leistungen und die endgültigen Ergebnisse der Projekte auszumachen. Die Studie führte zu bedeutsamen methodischen Erkenntnissen bezüglich des Einsatzes der Ex‐post‐KNA und, genauer gesagt, den folgenden Themen:
• Die Identifizierung der Analyseeinheit, die weiter als das Projekt sein kann, die das Ziel der Entscheidung zur Anschubfinanzierung ist;
• Der angemessene Zeithorizont, um die mittel bis langfristigen Auswirkungen des Projektes zu erfassen;
• Die Auswahl der am besten durchführbaren und realistischen kontrafaktischen Szenarios, mit denen die Projektergebnisse vergleichen werden;
• Der Einschätzung der Projektnachfrage für die kommenden Jahre;
• Die Berücksichtigung von ad‐hoc sozialen Kosten, die sowohl landes‐ und zeitspezifisch sind (unterschiedliche Raten, die vergangenen Cashflows auszunutzen und die zukünftigen herabzusetzen);
• Die Identifizierung und Quantifizierung von Kosten und Nutzen, mit dem Ziel, die langfristigen Auswirkungen zu evaluieren, im Gegensatz zu kurzfristigen Ergebnissen, die in der Regel durch ex‐ante KNA quantifiziert werden;

xxxv
• Die Berücksichtigung der geeignetsten Schattenpreise, die, wenn nötig, auch regions‐ oder zeitspezifisch sein können.
Die gewonnenen Erkenntnisse, die sich durch die Anwendung der KNA‐Methode bei den zehn Projekten ergeben, sind von allgemeinem Interesse und können bei jeder zukünftigen Ex‐post KNA Studie auf EU oder breiter Ebene eingesetzt werden22.
Schlussfolgerungen und Empfehlungen
Insgesamt zeigen die gesammelten Beispiele, wie die Ergebnisse von Entwicklungsprojekten das Resultat einer Reihe von zufälligen ökologischen, sozio‐ökonomischen, institutionellen und kulturellen Gegebenheiten ist und den Führungsreaktionen, die durch das Projekt erzeugt werden. Es wurde eine Reihe von spezifischen Vermutungen darüber, was als "Liste der Komponenten" für den Erfolg öffentlicher Investitionsprojekte ausgelegt werden kann, identifiziert. Zunächst einmal sind erfolgreiche Investitionen eher in einem Kontext angesiedelt, in dem Unternehmertum, Professionalität, Führungsdiskretion und eine Rechenschaftspflicht gegenüber der Regierung vorhanden sind, um Projektideen zu fördern, die vielversprechendsten auszuwählen und verhindern wird, dass das Projekt irgendwelchen Störungen ausgesetzt ist, weder während des Aufbaus noch der Umsetzung. Angemessene Anreize und genaue Vorhersagen und Monitoring können wichtig sein, das Erreichen der Projektziele zu gewährleisten. Schließlich kann die Einrichtung formeller Mechanismen, die zur Anhörung aller Beteiligten durch Projekt‐Designer und Manager helfen, ein Gefühl des sozialen Stolzes und der Identität herzustellen, die wiederum die Wahrscheinlichkeit eines Projekterfolges erhöht.
Diese "Komponenten‐Liste " enthält eine Reihe von praktischen Empfehlungen für die wichtigsten Phasen des Projektmanagementzyklus.
• Identifizierung und Formulierung: eine systematische und konsequente Planungsfunktion. In der ersten Phase des Projektzyklus ist es notwendig sicherzustellen, dass gute Ideen entwickelt und schlechte verworfen werden. Gute Projektideen sind diejenigen, die eine klare und zukunftsorientierte Vision der Entwicklung haben und relevante gesellschaftliche Notwendigkeit berücksichtigen. So sollten Innovationsfähigkeit innerhalb der öffentlichen Verwaltung des Mitgliedstaats, Professionalität und ein hohes Maß an technischer Kompetenz sichergestellt werden, um die vielversprechendsten Projektideen zu identifizieren.
• Design und Auswahl: eine Investition in technisches Know‐how: Die Werkzeuge, die notwendigerweise eingesetzt werden müssen, um hochwertige Machbarkeitsstudien zu entwickeln und für eine gute Projektplanung zu sorgen sind die Folgenden: ein solides, aber flexibles technisches Design, eine genaue Bedarfsanalyse mit einer soliden Vorausberechnung, ein Risiko‐Management‐Plan und eine ex‐ante Kosten‐
22 Zum Beispiel ist bei der Weltbank eine Diskussion im Gange, wie KNA als ein notwendiges, aber nicht auschließliches Instrument für Projektevaluierung belebt warden kann (World Bank, 2011).

xxxvi
Nutzen‐Analyse, ein Rahmen, um systematisch Akteure zu informieren und in die Projektentwicklung einzubinden, eine spezifische Bewertung der vorhandenen Governance‐Strukturen und der Änderungen, die vorgenommen werden sollen23; Mechanismen zur Sicherstellung der finanziellen Nachhaltigkeit der gesamten Projektlaufzeit. Die Ergebnisse der Machbarkeitsstudien und der Kosten‐Nutzen‐Analyse, die von einem unabhängigen Gutachter auf Qualität und Zuverlässigkeit hin überprüft werden, sollten für die Auswahl und Priorisierung von Projekten herangezogen werden.
• Projektdurchführung: die systematische Überwachung und Breite. Der Projektzyklus sollte verfolgt und überwacht werden. Besondere Aufmerksamkeit sollte besonders riskanten Projekten gewidmet werden. In Fällen, in denen der Monitoring‐Prozess signifikante Abweichungen von der erwarteten Leistung zeigt, sollten Korrekturmaßnahmen durch die Verwaltungsbehörde vorgeschlagen und durch den Begünstigten übernommen werden.
• Abschluss: Anreizsysteme und Lernen. Nach Abschluss des Projekts sollte die Europäische Kommission eine systematische Ex‐post‐Evaluierung durchführen und die Ergebnisse öffentlich macht en. Die Ex‐post‐Evaluierung sollte nicht nur darauf abzielen, die Auswirkungen eines Projekts zu überprüfen, sondern auch leistungsstarke Projektteams zu identifizieren und zu belohnen.
Die Umsetzung der hier vorgestellten Empfehlungen verlangt ein gemeinsames Vorgehen der Europäischen Kommission und der Mitgliedstaaten. Insbesondere sollte die EG sorgfältig prüfen, wie sie eine beratende Rolle bei den Mitgliedstaaten in Bezug auf die oben genannten Herausforderungen spielen kann, insbesondere durch ihren Beitrag, gemeinsame Ansätze zur Projektplanung und ‐prüfung zu erlassen, der Förderung von Wissenstransfer und dem Austausch guter Praktiken.
23 Z.B. über die Verteilung der Zuständigkeiten zwischen den verschiedenen institutionellen Parteien.

1
FOREWORD Background and objective
In December 2010, DG Regio commissioned a Team led by CSIL Milano in partnership with DKM Dublin to undertake the ex‐post evaluation of investment projects co‐financed by the European Regional Development Fund (ERDF) or Cohesion Fund (CF) in the period 1994‐1999 (Contract n° 2010.CE.16.B.AT. 036). The objective of this study is to evaluate the long‐term effects of ten major projects implemented during the 1994‐1999 programming period in five Member States and selected from a list of 35 projects, proposed by DG Regio in the Terms of Reference (ToR), and slightly revised in the Inception phase.
The investment projects to be analysed are in the Transport (road, rail, seaports) and Environment (water supply, waste water treatment, waste management) sectors, across five Member States: Greece, Ireland, Italy, Portugal and Spain. Most of the projects were funded by the Cohesion Fund, while a minority were funded by the European Regional Development Fund.
Tasks and structure of the report
The study incorporates four main tasks:
• Task 1: Development of a conceptual basis for assessing the long‐term contribution of environment and transport infrastructure investments to economic development, quality of life and the wellbeing of society.
• Task 2: Preliminary review of 35 ERDF or CF projects and selection of ten projects for evaluation.
• Task 3: In‐depth evaluation of ten ERDF or CF projects.
• Task 4: Generalise findings from the case studies.
The present Final Report has been submitted by the Team as part of Task 4 and it is designed as a self‐contained report, easily understood without the need to read all the ten case studies and methodological documents24.
It is organised as follows: the First Section provides a brief overview of the ten projects analysed, with indications of the infrastructure nature, the geographical location, the volume of financing involved and the main stakeholders in place. The reader can find more details on each project in Annex I, where the executive summaries of the case studies are presented.
24 Available on‐line on the Dg Regio website: http://ec.europa.eu/regional_policy/information/evaluations/archives_1989_1999_en.cfm#1.

2
Section 2 presents the overall methodological approach followed throughout the evaluation study, with reference to the Evaluation Questions set out in the Terms of Reference and with a focus on the main peculiarities of the approach.
Sections 3 and 4 contain the main lessons drawn from the case studies’ evidence regarding the type, magnitude and timeframe of long‐term effects generated (Section 3) and the mechanisms explaining the project outcomes (Section 4). The role played by the European Commission is also specifically addressed in Section 4.
In Section 5 lessons are drawn regarding the methodological approach and its suitability for capturing the long‐term contribution from different investments in the fields of transport and environmental infrastructure: particular emphasis is put on limitations and strengths of the ex‐post CBA exercise.
Finally, in Section 6 the ten project histories analysed are put together to answer the Evaluation Questions, extract some key ideas for policy learning and derive meaningful recommendations.

3
1 OVERVIEW OF THE SELECTED PROJECTS
The Terms of Reference indicate a list of 35 major infrastructure projects co‐financed in the period 1994‐1999 by the Cohesion Fund (CF) or the European Regional Development Fund (ERDF) in Greece, Ireland, Italy, Spain and Portugal from which ten had to be chosen for in‐depth analysis with case studies.
The selection of the ten case studies is the first milestone of the evaluation. The full description of the selection process is presented in Annex II. Here, for ease of reading, the methodological steps the process has relied on are briefly reviewed:
• Projects review. A preliminary screening of project documents has been carried out to determine whether a project was in a condition to be evaluated or not, i.e. whether its evaluation was justifiable, feasible and likely to provide useful information within the timeframe, resource constraints and operational objectives of the present study.
• Evaluability scoring. A summary sheet has been produced for each of the 35 projects with a brief description of the key features of the projects. The exercise was complemented with an evaluability scoring system which aimed at guiding in an objective and consistent way the selection of case studies.
• Projects ranking and selection. The evaluability assessment allowed for ranking the projects and identified the most promising ones, out of which the ten most suitable projects have been identified by adopting further selection criteria, including coverage of Member States, balance between sectors and coverage of Funds.
The results of the selection are a list of projects which constitute a purposeful set that assures maximum credibility and utility, which are the main concerns given the small initial sample size (See Table 1.1).

4
Table 1.1 TEN PROJECTS OBSERVED PROJECT COUNTRY EC Fund EIB loan SECTOR SUB‐SECTOR
Port of Gioia Tauro Italy ERDF/ESF Transport PT
M1 Motorway Ireland CF Transport RD
Egnatia Motorway Greece CF/ERDF/TEN‐T
√ Transport RD
Madrid Metro Line 8 Spain CF Transport RL
Mediterranean Corridor
Spain CF Transport RL
Water supply in Palermo
Italy ERDF √ Environment WS
Urban solid waste treatment in Lisbon
Portugal CF Environment SWT
Solid waste treatment in Galicia
Spain CF Environment SWT
Waste water treatment in Ría de Vigo
Spain CF Environment WWT
Dublin Waste Water Treatment
Ireland CF √ Environment WWT
Legend: T: Transport – RD: Road; RL: Railway; PT: Port. E: Environment – WS: Water supply; WWT: Waste water treatment; SWT: Solid waste treatment.
This list is balanced across sectors and countries. In particular, it includes:
• Five transport projects: two motorways, two railways (of which one is urban transport) and one port;
• Five environment projects: one water supply, two waste water and two solid waste treatments.
• As for geographical coverage: four Spanish projects (two transport and two environment), two Italian (one transport and one environment), one Greek (transport), two Irish (one transport and one environment), and one Portuguese (environment).
• With respect to investment costs and funds coverage, there is a wide range of project sizes (see Table 1.2). There are seven CF project, two ERDF projects and one with joint financing. Some resources from the European Social Fund (ESF) were allocated for the Port of Gioia Tauro project and from the Trans‐European Transport Network (TEN‐T) budget for the Egnatia Motorway.

5
Table 1.2 INVESTMENT COSTS AND EC CO‐FUNDING PROJECT Total investment costs (EUR
million) EC co‐funding (EUR million)
EC co‐funding rate (%)
Port of Gioia Tauro 418 61.9 15%
M1 Motorway 787 301 38%
Egnatia Motorway 7053 3091 44%
Madrid Metro Line 518 393 76%
Mediterranean Corridor 759 531 70%
Water supply in Palermo 120 44 37%
Urban solid waste treatment in Lisbon
366 137 37%
Solid waste treatment in Galicia 275 100 36%
Waste water treatment in Ría de Vigo
172 118 69%
Dublin Waste Water Treatment 296 157 53%
TOTAL 10,764 4,934 46%
Note: prices are expressed in constant terms (Euro 2011). Source: Authors
Overall, this sample is not exhaustive or representative of the universe of projects co‐financed in the period 1994‐1999, but it covers overall more than EUR 10 billion of investment costs (and slightly less than EUR 5 billion of EC co‐funding), and provides a panorama of experiences suitable for developing interesting project narratives and drawing potentially powerful lessons. As such, the analysis of these cases, acting as a magnifying lens over some specific determinants, allowed us to raise some key ideas for policy learning that are presented in Sections 3 and 4.
In the following, the key features and aspects of investigation of the ten projects observed are briefly presented.
1.1.2 Projects in the environmental sector Dublin Waste Water Treatment (Ireland). The project, completed in 2003, consists of a comprehensive expansion and up‐grading of the Ringsend treatment plant which accommodates most of the waste water arising in the Dublin region, as well as the construction of a pumping station and underwater pipeline to carry wastewater from the north of the city to the Ringsend. The project was designed to

6
meet the standards of the European Urban Waste Water Directive25, but the plant also tackled a genuine water quality problem in Dublin Bay and surrounding waters, areas with high amenity value for the city of Dublin. The project was completed in stages over a number of years, during which the economy and population grew strongly. Thus, the key aspect of investigation is whether further future investment is required to meet ongoing demand and environmental requirements. Water supply in Palermo (Italy). The project consists of eight sub‐interventions concerning the water distribution network of the municipality of Palermo. They include the completion of the external bypass, the replacement of six sub‐networks, and the provision of a supervision and monitoring system. The project is an example of a rather stable project over time in terms of objectives pursued, type of service provided and demand served. Given its stability and the long time span of operation (since 1999), the project offers interesting hints to see whether it actually contributed to alleviate the strong deficiencies in the quality of the drinking water provision service in Palermo. This project enables investigation of the contribution to improving the quality of life and standard of living of the population. Waste Water Treatment Ría de Vigo (Spain). The project includes the installation of nine waste water treatment plants in eight municipalities of Galicia (Vigo, Redondela, Cangas, Moaña, Nigrán, Gondomar, Soutomaior and Vilaboa), about 260 km of waste water conveyor pipes and 59 pumps. This project, implemented by the regional public body Augas de Galicia, offers an example of facilities that are used by very large segments of the population living in an industrial, economically developed, area. The waste water treatment plants serve about one million inhabitants (a third of the 25 Directive 91/271/EEC.

7
whole Galician population), who exert significant environmental pressure on this fragile ecosystem, and in particular on the shorelines. Long‐term environmental effects are the key challenge for this project. Urban solid waste management in Galicia (Spain). The project consists of the construction of a set of facilities (operated by the public‐private company Sogama) in the municipality of Cerceda, Galicia, for the separation of recyclable materials and the incineration of mixed waste with energy recovery. In addition, a number of transfer stations for receiving the waste collected at local level by municipalities and transporting it to Cerceda, by truck or rail, were spread all over the region. This project is a regional‐scale intervention that involves facilities placed throughout the whole regional territory and its main cities, absorbing the demand of about two million users. At the moment of the project construction phase, a large number of municipalities were unsure about whether or not adopting the Sogama incineration technology. They decided to join the Sogama waste management system only later on, when the infrastructures had been already built. Because of the impossibility to exactly determine ex‐ante the service demand, today the incinerator plant’s capacity does not allow to valorise the total volume of waste collected. The project offers interesting insights for the investigation of what has been its impact as compared to a counterfactual scenario. Integrated Solid Waste Management in Lisbon (Portugal). The project aims at the development of the Integrated Waste Management System in the metropolitan area of Northern Lisbon, implemented by the public company Valorsul. The initial design covered the construction of a Waste‐to‐Energy Plant, a sanitary landfill, a material sorting facility, a drop‐off centre and a bottom ash processing and recovery installation, together with the sealing of uncontrolled open dumps and the implementation of separate collection of specific waste. Implemented between 1996 and 2005, other initiatives, co‐financed by additional EU funds, for the construction of an Anaerobic Digestion Plant producing compost from organic waste, were added to the original intervention. This project is of particular interest considering that, prior to its implementation, landfills had been running
Waste‐to‐Energy plant (WtE)
Materials Recovery Facility (MRF) and Drop‐off Centre
Bottom ash processing and recovery installation
Anaerobic Digestion Plant (Station for Organic Valorisation and Treatment)
Landfill in Mato da Cruz

8
out of capacity. A key feature of analysis is therefore the context situation, with low environmental awareness and the need to cope with EU environmental directives.
1.1.3 Projects in the transport sector Port of Gioia Tauro (Italy). The project includes the construction of a transhipment port in Gioia Tauro, Calabria, and the provision of additional port services necessary for the transhipment. The port is an interesting story which was initiated from a successful business intuition of a port terminal operator who agreed with the Italian Government about the destination of the already existing but unused port infrastructure. In fact, the port was originally designed to realise a cold rolling mill (steelworks), which was abandoned, the only facility actually constructed being the port (basin and quays). The vision of the private entrepreneurs in 1994 was to reconvert the already existing basin into a container terminal, primarily for transhipment purposes, becoming the premier transhipment port of the Mediterranean Sea for volumes of freight moved. The interesting aspect of investigation is to what extent the success of this container terminal (the only productive investment among those analysed26) brought about socio‐economic development in the region. The governance aspects and the political and institutional local influences are the main interesting features depicting the project context.
26 Productive investments are defined as those investments producing or able to produce revenues from the production of goods or provision of services.
Harbourmaster and Port Authority
Railway Terminal
MCT container terminal
ICO‐BLG car terminal
West quay
Duty free zone
Area for logistic activities
1st ASI‐REG industrial area
2nd ASI‐REG industrial area

9
M1 motorway (Ireland). The project includes the construction of seven sections of road to deliver a continuous motorway stretching from Dublin airport in the south to just north of Dundalk at the northern end. This motorway offers the opportunity to analyse a range of indirect and wider effects, spilling over to third parties and involving other economic activities. In fact, the motorway’s key feature is the potential for encouragement of industrial growth in its catchment area, which could have not occurred otherwise. The challenge of the analysis is to see whether industries previously located closer to Belfast or Dublin have relocated outside these major hubs because of the reduced transport costs now associated with these areas. Egnatia motorway (Greece). The project concerns the construction of the Egnatia motorway, 670 km long, running from Igoumenitsa to Kipoi and crossing five regions in Northern Greece. The project also includes one service station and five toll stations. The project is of particular interest because it represents a “mega project”, the most important modern infrastructure project for the development and connection of Greece with Europe, the Balkans and the Middle East. The motorway, part of the TEN‐T Network, is connected with five ports, six airports and nine vertical axes creating access to the Balkans and other Eastern European countries, and responds to well‐documented needs to improve accessibility of isolated and remote areas. The wider economic effects produced on growth and people’s quality of life, and the way these materialised, are the key aspects of this project.
Dundalk Western Bypass (2005)
Dunleer – Dundalk Road (2001)
Dunleer Bypass (1993)
Drogheda Bypass (2003)
Balbriggan Bypass (1998)
Lissenhall – Balbriggan (2003)
Cloghran – Lissenhall (2003)

10
The Mediterranean Corridor (Spain). The project includes the upgrading of the pre‐existing rail line between Valencia and Sant Vicenç de Calders, close to Barcelona, for speeds of up to 200‐220 km/h, with new layouts where radii were too small, some new stations and the doubling of some single track sections and new superstructure (catenaries27, signalling). The project was structured in three stages, in order to limit the impacts on the track, between 1993 and 2002. The Mediterranean Corridor (MEDCORR) is a line used by both long, medium and short‐distance passengers, but also with high potential demand for freight traffic. Given the strong political influence from the central and regional governments to which the MEDCORR was subject and the divergent interests around the project, it is interesting to analyse if and how the project managed to effectively satisfy both passenger and freight transport demand. Madrid Metro Line 8 (Spain). The project concerns the construction of the Madrid Metro Line 8, which connects the centre of Madrid with Barajas airport. The project was implemented in different stages between 1998 and 2007, when the Airport‐Terminal 4 station was opened to public. This project gives an example of an intervention with the potential to radically change the behaviour of citizens by diverting traffic from road to rail, with further beneficial effects on the environment. It is therefore interesting to investigate the typologies of long‐term effects, in terms of changes in private behaviours (citizens and firms), facilitating economic development on one side and improving quality of life on the other.
27 Contact system of trains to the overhead electrified line.
LEGENDHigh Speed LineDouble track
Conventional gaungenetworkDouble trackSingle track

11
2 EVALUATION QUESTIONS AND METHODOLOGY
2.1 OVERALL APPROACH The main objective of this ex‐post evaluation is to analyse the long‐term contribution of selected projects in transport and environment infrastructures, implemented during the 1994‐1999 programming period and co‐financed by the ERDF and/or CF, to economic development as well as wellbeing28 of society. The ten project histories are then put together to extract some key ideas for policy learning and to derive meaningful recommendations (included in Section 6). A similar ex‐post evaluation, based on a very limited number of infrastructural projects co‐financed the World Bank, was carried out several years ago by A.O. Hirschman, in his book “Development Projects Observed” (1967). His inspiring work underpins our methodological design.
The overall methodological approach has been developed by starting from the evaluation questions specified in the ToR. More specifically, the four Evaluation Questions (EQs) that the ToR ask to be addressed are the following:
i. What kind of long‐term contributions can be identified for different types of investment in the field of environment and transport infrastructure?
ii. What is the minimum and average time needed for a given long‐term contribution to materialise and stabilise? What are these time spans for different types of investment in the field of environment and transport infrastructure?
iii. How are these long‐term contributions generated for different types of investment in the field of environment and transport infrastructure, i.e., what is the causal chain between certain short‐term socio‐economic returns and long‐term returns from investment?
iv. What are the existing evaluation methods to capture a given long‐term contribution for different types of investment in the field of environment and transport infrastructure?
The Evaluation Questions i, ii and iii encompass three distinct dimensions of analysis, which represent the foundations of the evaluation exercise undertaken in each of the ten case studies: the ‘What’, ‘When’ and ‘How’. The ‘What’ dimension (EQ i) relates to the object of the evaluation, i.e. the different typologies of long‐term contributions which can be observed in each project. The ‘When’ dimension (EQ ii) has to do with the timing of the long‐term effect, more precisely to the point in the project’s lifetime in which the effects materialised for the first time and stabilised. Within the ‘How’ dimension (EQ iii), the key determinants of the
28 Used as synonymous with ‘quality of life’.

12
project outcomes are analysed, in order to explain which factors influence the generation and timing of effects.
The fourth evaluation question is not related to another dimension of analysis, but it refers to the identification of the most suitable methodology that enables one to address and disentangle the ‘What’, ‘When’ and ‘How’ dimensions. In a sense, this evaluation question provides the basis to answer all the other evaluation questions.
The three dimensions of analysis have been further explored and defined by the Team (as synthetically illustrated in Figure 2.1), in order to develop a comprehensive and detailed conceptual framework for the evaluation study. Each of them is discussed hereafter29.
Figure 2.1 STRUCTURE OF THE CONCEPTUAL FRAMEWORK
Source: Authors
2.1.2 The ‘What’ dimension The Team elaborated a classification of long‐term effects, with the aim of identifying all the possible impacts of public investments on economic and social welfare. A broad distinction in project effects is between effects on ‘Economic development’ and ‘Quality of life’. Investment projects can foster economic development, which is generally quantifiable by aggregate
29 The answers to the Evaluation Questions can be found in the concluding section (Section 6).
WHAT:“What kind of long term contributions can be
identified for different types of investment in the field of environment and transport infrastructure? “
WHEN: “What is the minimum and average time needed for a
given long term contribution to materialise and stabilise? What are these time spans for different types of investment in the field of environment and transport
infrastructure? “
HOW:“How are these long term contributions generated for different types of investment in the field of environment and transport infrastructure, i.e., what is the causal chain between certain short term socio‐economic returns and long term returns from investment?”
• Appropriateness to the context
• Project design
• Forecasting capacity
• Project governance
• Behavioural response
Economic development
• Economic growth
• Endogenous dynamics
Quality of life
• Social cohesion
• Environmental sustainability
• Territorial cohesion
• Institutional quality
• Social happiness
Effects stabilised
• In the short run
• In the long run
Effects not yet stabilised

13
indicators, such as Gross Domestic Product and broader definitions of measurable economic welfare, as reflected in the Cost‐Benefit Analysis; although economic development is not disconnected from the wellbeing of society, it is acknowledged that there are a number of other factors that may affect public welfare, that are not captured by the traditional economic indicators30.
Table 2.1 TAXONOMY OF LONG‐TERM DEVELOPMENT EFFECTS Definition Checklist
Economic development
Direct economic growth
Following the traditional growth theory31, both public and private investment contribute to increasing the stock of capital and thus economic growth. The direct contribution of a project to economic growth, in terms not only of real GDP growth, but also, more generally, to economic welfare, is discussed within this category of effect.
Did the project have effects on the endowment of labour or capital production factors? Did it contribute to employment creation? Did it attract new investments? Did it create new business opportunities? Did it produce decreases in travel costs? Did it created measureable economic welfare effects for users (e.g. savings of transport time)?
Endogenous dynamics
Endogenous dynamics comprise all the factors that have an indirect effect on economic growth, by improving the productivity of inputs: the increase in the stock of competences and knowledge of human capital, the introduction of a more advanced technology and changes in the organisational model of economic actors, making them more efficient, are analysed insofar they contribute to increasing the production function32.
Did the project contribute to the improvement of the total factor productivity of the economic system? Have social behaviours changed as a result of the project? Did the project provide new/improved skills, R&D investment, or organisational changes that translated into an increase in labour productivity and development of human capital?
Quality of life
Social cohesion Public investment can affect social cohesion, by minimising disparities, avoiding social marginalisation and reducing income inequalities across different socio‐economic, gender or ethnic groups.
Did the project promote social inclusion? Did it improve the conditions of specific segments of the population (e.g. elderly, migrants)? Did it improve the affordability of services?
Environmental effects
Polluting emissions, biodiversity loss and depletion of natural resources caused by large infrastructural projects can affect social wellbeing of both the present and future generations. These are additional effects, not already taken into account in the Cost‐Benefit Analysis as a direct economic welfare effect.
Did the project improve the quality of the natural environment? Did it alter wildlife habitats? Did it affect the ecosystem? Were there any environmental issues related to project implementation?
Territorial cohesion
The project can contribute to reducing welfare disparities caused by unequal distribution of resources and opportunities among regions and their population. The focus, in particular, is on core‐periphery and urban/rural differences.
Did the project improve the territorial cohesion of the region/country? Did it play any role in urban‐rural or core/periphery or cross‐border dynamics? Did it expand the territorial coverage of the delivery of a basic service?
Institutional learning
Investment projects can bring wide spill‐over effects to the quality of Public Administration and other institutions at national, regional or local level. Institutional quality is strongly related to economic growth33, but it can also affect the quality of life of people, because of the intrinsic value that individuals can attribute to a well‐ordered society34.
Did the project induce any institutional learning at regional administrative level? Did it raise political awareness regarding a specific theme? Did it have effects on the level of corruption?
Social happiness
This category encompasses all those variables which may affect the subjective perception of people’s wellbeing, and have to do with their psychology, family context, religion and cultural traits.
Are the project beneficiaries overall satisfied with the project’s implementation and outcomes? Did the project have any effect on the perception of quality of life? Did it affect the sense of security of the target population?
30 Dasgupta, 2011 and Stiglitz et al., 2009. 31 Solow, 1956. 32 Becker, 1962; Griliches, 1992 and Griffith, 2000; Tomer, 1982 and Martinez, 2009. 33 See, for instance, Easterly et al., 2006. 34 Sen, 1987.

14
For the purpose of this study, the notion of quality of life35 refers to the factors that affect social development, the level of social satisfaction, the perception of social reality and other dimensions which are outside the conventional economic dimension. Under these two broad categories, a taxonomy of more specific long‐term development effects of investment projects has been developed. The definition of each type of effect is provided in Table 2.1 (see above).
In researching all the possible long‐term effects of project investments, it is acknowledged that there is a risk of double‐counting: for example, a project for water treatment has clear environmental effects which may contribute to the development of new economic activities that foster economic growth. The evaluation paid special attention to overcoming this risk and to detecting all the kinds of contributions brought by the projects, but explicating which of them prevail.
2.1.3 The ‘When’ dimension The temporal dimension of analysis relates to the point in the project’s lifetime at which the effects materialise for the first time, how they develop over time and whether they have already stabilised or are still evolving. A clear distinction emerges between short‐term and long‐term effects, with the former being the first contributions made by the project and enjoyed by society after a relatively short time following project completion (about 1‐5 years); the latter, on the other hand, become visible after a longer period of time and tend to stabilise over many years. It is acknowledged that, given the varying timeframe for different effects to appear and stabilise, the choice of the time horizon and the timeframe at which the ex‐post evaluation is carried out can significantly affect the results of the evaluation.
2.1.4 The ‘How’ dimension Project outcomes, i.e. the way projects affect the generation of certain effects and the varying timeframe for effects to appear and stabilise, are not certain, but result from a non‐deterministic combination of different and interrelated factors. Five stylised determinants of project outcomes have been identified: appropriateness to the context, project design, forecasting capacity, project governance and managerial response. Five Working Hypotheses are related to these dimensions and explain how each of them can influence the generation of the project’s short or long‐term effects (see Table 2.2).
The three dimensions of analysis are logically interconnected and by combining the ‘What’, ‘When’ and ‘How’ dimensions the evaluator can disentangle the causal chain between the project’s inputs and the outputs. The assessment of the nature and strength of project’s impact (‘What’) and of the temporal dynamics of effects materialisation (‘When’) is included in Section 3 of this report, while Section 4 provides the discussion about the key determinants (‘How’).
35 Used also as synonymous with wellbeing, as mentioned in the ToR.

15
Table 2.2 KEY DETERMINANTS OF PROJECT OUTCOMES Determinant Definition Working Hypothesis Questions to be answered
Appropriateness to the context
Includes the consideration of institutional, cultural, social and economic environment into which the project is inserted.
Context traits can be more or less favourable for project performance and deserve early and careful consideration regarding which to take or to make.
The terminology of context traits that can be either ‘taken’ (that is, accepted, as they are considered unchangeable) or ‘made’ (by changing existing or creating new traits) is drawn from Hirschman (1967).
Has the (political, cultural, socio‐economic, institutional, regulatory) context played a role in influencing the attainment of long‐term effects?
Were there any political, social, cultural, economic, regulatory, or institutional constraints to project implementation and performance?
Was the project ‘trait taking’ or ‘trait making’ in its nature? If it was intended to be trait making, did it succeed?
Project design Refers to the technical capacity to design the infrastructure project and to select the best project option.
The technical and engineering capacity to design an infrastructure and to provide the appropriate mechanism for its financial sustainability should be sufficiently disciplined to reduce future risks; at the same time it should leave some degrees of ‘latitude’ to enable adjustments for unforeseen circumstances.
Following Hirschman, latitude is the characteristic of a project that permits the project planner and operator to mould it, or to let it ‘slip’, in one direction or another. Some projects are so structured that latitude is severely restricted or completely absent: in these cases, the project is considered highly ‘disciplined’.
To what extent and in what way did the technical, structural and financial features of the project influence its performance?
Did the option selection process lead to the implementation of the most promising project idea?
Was project design capacity a relevant factor in determining the observed ex‐post performance of the project?
Was the project design flexible enough to be adjusted, if needed, to external and unexpected constraints?
Forecasting capacity
Relates to the feasibility and capacity to predict future variables, such as the demand level.
A good initial investment in building the forecasting capacity does not eliminate risks, but it increases the knowledge of the context, improves the project design and optimises the distribution of responsibilities without lowering the commitment to performance.
Were the ex‐ante forecasts based on a sound methodology and a comprehensive set of information?
Were some important factors not sufficiently considered ex‐ante?
Was the forecasting capacity a relevant factor in determining the observed ex‐post performance of the project?
Project governance
Concerns the number and type of stakeholders involved throughout the project cycle and how responsibilities are attributed and shared.
High stakeholder involvement, well‐defined roles and responsibilities and incentive mechanisms require commitment of resources and increase the complexity of the decision‐making process, which may be subject to particular pressures, but they can favour the project performance and its sustainability over time.
What are the interests and motives of different actors and incentives for decision‐making? How did they change over the time‐span considered?
Was the ownership of the project clearly identified?
Did contractual arrangements improve the co‐ordination of different stakeholders towards achievement‐oriented results?
Was project visibility a relevant political incentive to foster proper project implementation? Was the project subject to political or other forms of pressure?
Managerial response
Defined as the managerial and professional ability to react to unforeseen events.
Unpredicted events that occur and undermine the sustainability of the project and its capacity to lead to expected benefits can be overcome by prompt and adequate response from the decision‐makers and project managers, driven either by professionalism and experience or by creativity and imagination.
How did the project’s management react to exogenous, unpredictable, events?
What remedial actions were put in place? What mechanisms were used to incentivise proactive responses?
Why were these events unexpected? Was it due to their purely exogenous and ex‐ante unpredictable nature? Or, was it due to poor planning capacity?

16
2.2 SPECIFICITIES OF THE EVALUATION APPROACH This evaluation study is characterised by three main methodological innovations which make this study different from other ex‐post evaluation studies usually performed by the European Commission or other institutions36. These peculiarities refer to:
i. The combination of different perspectives of analysis;
ii. The level of analysis;
iii. The timeframe of the evaluation.
2.2.1 Perspectives of analysis A combination of different perspectives has been adopted throughout the study:
• Micro and macro level perspectives. The units of analysis are individual projects, however their geographical scope can range from the local to the national and even supra‐national level37. A suitable mix of micro and macro analyses allows one to capture most of the direct, indirect and wider effects of the project and its interaction with other sectors and geographical areas. On the micro‐level of analysis, the focus is on the long‐term contributions to welfare brought by the infrastructural project itself. On the macro‐level, following general equilibrium perspective, the wider effects generated by the project on external systems, areas and sectors should be also considered: in order to ascertain the entire picture in terms of welfare generated, most relevant effects in other secondary markets should be included, taking into account complementarities and substitution effects.
• Economics and other social‐sciences perspectives. The distinction between economic and wellbeing or quality of life effects requires one to combine the perspectives of economics with the broader frame of social sciences, in order to build a comprehensive picture of the project’s long‐term impact. There are various strands of the literature analysing to what extent and under which conditions infrastructural projects can trigger economic development. It is however acknowledged that major infrastructures may affect quality of life by means of other factors, which do not have a purely economic nature: people’s level of satisfaction and subjective perceptions about social reality are elements which can explain the different dimensions of project outcomes, but which are generally better explored by the social sciences and cannot be easily captured by economic models.
• Quantitative and qualitative perspectives. The impacts that a major infrastructural project can have on the socio‐economic welfare of the target area and on other
36 Some of the most recent ex‐post evaluations include the following: EVA‐TREN, 2007; European Commission 2011a and 2011b; European Parliament, 2006; the Post‐Opening Project Evaluation (POPE) process in the UK and several World Bank studies (see, for instance, Jenkins, 1997 and World Bank, 2005). 37 In case, for example of Trans‐European Network (TEN) transport projects with cross‐border aspects.

17
“external” systems are multi‐faceted: they may entail direct, indirect effects and externalities, generated on different geographical levels and at different times. While some of the project’s effects can be quantified and measured, it is acknowledged that other types of contributions (especially those of a social nature) cannot be easily captured by quantitative indicators. In these cases, qualitative techniques can be used to integrate the evaluation’s findings. Qualitative analysis is also needed to identify the causality chains leading to the generation of certain effects at certain points in time.
These perspectives are not mutually‐exclusive, but complementary, in the sense that they all coexist and are integrated simultaneously in the methodological approach adopted. The hybrid nature of the methodology, which combines micro and macro levels of analysis, economic and social science perspectives and quantitative and qualitative techniques, represents one of the main innovation of the present evaluation.
2.2.2 Focus of analysis This feature differs from the level of analysis, as it is not related to the geographic and sectoral scope of analysis. Here the emphasis is on the focus of the evaluation, which is not only the identification of the project’s effects, but also of the mechanisms behind such effects.
While most recent ex‐post evaluation exercises have been primarily focused on projects38, with the object of identifying their benefits and costs with regard to a number of distinct objectives (e.g. environment, economy, accessibility, integration and so on) and, possibly, giving a measure of their utility, the focus of the present study is broader, as it encompasses also other external processes and variables that could affect the project itself. The objective of disentangling the causality chain leading to the project impact, besides the identification of the long‐term effects actually produced, is the main feature that distinguishes this approach from others39.
2.2.3 Timeframe of the evaluation The specific timing of the evaluation is another unique aspect of the present evaluation study. Ex‐post evaluations, that are promoted and carried out by most of the international institutions, including the European Commission, usually consist of an analysis undertaken immediately or shortly after (3‐5 years) the construction phase: their objective is generally to shed some light on the appropriateness of the selection process and the ex‐ante estimation (e.g. project costs, timeframe for construction, demand analysis) and to identify the project’s results and its immediate effects.
Carrying out an evaluation on projects financed almost 15‐20 years ago, as in the present study, gives instead the scope to observe the mechanisms that influenced the projects over
38 E.g. European Commission 2011a and 2011b. 39 As a matter of fact, the importance of broadening the scope of the evaluation, so as to include the implementation process as well as outcomes and to study the social and political context within which the programme operates, has been recommended by a World Bank study (2005).

18
their past histories and, in this way, to analyse the key determinants of project outcomes. Actually, the evaluator has a favoured position which allows him/her to look back in the past, dig in the project’s history and highlight whether any diversion from ex‐ante plans occurred and why. Moreover, it allows one to put the emphasis not merely on the initial investment that was part of the financing decision, but on the whole functional unit delivering long‐term effects, including different, subsequent but relevant financing decisions (modifications or new components introduced).
2.3 METHODOLOGICAL TOOLS
2.3.1 Evaluation techniques The different perspectives of analysis inspired the selection of the specific methods involved in the evaluation, which are ex‐post Cost‐Benefit Analysis (CBA) and a set of qualitative techniques, including personal interviews, documentary analysis and searches of EC, government and newspaper archives. The ex‐post CBA incorporates the micro level of analysis, the quantitative approach and, typically, the economic perspective of investigation. On the other hand, the macro level of analysis, the qualitative approach and the social science perspective are better reflected in the use of qualitative techniques.
For all the ten case studies undertaken, ex‐post CBA provided quantification or indications about some of the long‐term effects produced by the project and an important support to test and validate certain findings derived from interviews. In addition, a risk analysis has been carried out for each project, in order to calculate their expected performance and the possible range of variations of CBA results, subject to different assumptions on the most critical variables. However, the most important contribution of the CBA exercise has been to provide a framework of analysis to disentangle the most crucial aspects of the projects’ ex‐post performances and final outcomes. The identification of objectives, the alternative options analysis, the demand analysis, the forecasting and measuring of financial outflows and inflows and of costs and benefits to social welfare stimulate the evaluator to reflect on the rationale and foundations behind the investment decision, as well as the implementation problems that may be embedded therein. Furthermore, any deviation from expected values stimulated research into the reasons for this.
CBA results have been complemented by qualitative techniques, which helped to expand the scope of the CBA and to detect the wider effects on other sectors, markets and areas not directly captured by the CBA. Interviews with EC, national or regional authorities, the infrastructure operators, key experts, Non‐Governmental Organisations or associations of users allowed the team to determine why certain effects were generated and to identify the various “shades of grey” between the two extremes of a project’s success or failure. The media (including websites or blogs), in particular, have proved to be an excellent source of evidence revealing both evidence and perceptions about the project.

19
2.3.2 Tools for the horizontal analysis Qualitative and quantitative findings are integrated in a narrative way, in order to develop ten project ‘histories’ and to isolate and depict the main aspects behind their long‐term performance40. In order to keep the structure of all the case study reports as similar as possible, and facilitate the cross‐project comparisons of findings, all case study reports share the same outline41 and a set of standard tables are used to summarise the main evaluation results related to three dimensions of analysis (‘What’, ‘When’ and ‘How’). In the standardised tables, scores are assigned to each type of long‐term effect and each determinant. Scores ranging from ‐5 to +5 are given in order to intuitively highlight which are the most important effects generated for each case study and which are the most relevant determinants explaining the project outcomes. In other words, scores are used to rank the effects and determinants, showing which ones are the most relevant. Moreover, the plus or minus signs indicate the nature of the effects produced by the project (was the impact positive or negative?) and of the determinant of project performance (did the determinant positively or negatively contribute to the project outcome?)42.
Table 2.3 EVALUATION SCORES ON PROJECT’S IMPACT AND DETERMINANTS OF PROJECT OUTCOMES
Score Meaning
+5 Given the existing constraints, the highest positive effects have been generated.
+4 Given the existing constraints, high positive effects have been generated, but more could have been achieved under certain conditions.
+3 Moderate positive effects have been generated, with large scope for further improvement.
+2 Some positive effects have been produced.
+1 Very little, almost negligible, positive effects have been generated.
0 No effects have been generated.
‐1 Very little, almost negligible, negative effects have been generated.
‐2 Minor negative effects have been produced.
‐3 Moderate negative effects have been generated, but they could have been worse.
‐4 Highly negative effects have been generated.
‐5 The highest negative effects have been generated.
Note: The same scores have been used for assessing both the project’s impacts and determinants. In the first case, they have to be interpreted as the nature and strength of effect generated by the project; in the latter, they indicate the strength of each determinant factor in influencing the project outcomes.
The ‘When’ dimensions results are synthetically presented by means of another table: for each kind of effect, a score is given to explain how the nature and strength of the impact evolved over the years, by focusing in particular, on the short‐run (approximately 1‐5 years after the
40 All case studies are available on‐line on the Dg Regio website http://ec.europa.eu/regional_policy/information/evaluations/archives_1989_1999_en.cfm#1; their executive summaries are included in Annex I of the present report. 41 Including: Section 1: Project description; Section 2: Origin and history; Section 3: Long‐term development effects; Section 4: Determinants of project outcomes; Section 5: Conclusions; Annexes: Ex‐post CBA, map of stakeholders and others. 42 The same scores are used to disentangle the project’s impacts on different stakeholders. This table allows one to better interpret the aggregated score given to each effect, by understanding on which actor the project impacted the most

20
project’s completion), the long‐run (6‐10 years after the project’s completion) and the future period. The Table contains information that allows the reader to immediately understand whether the project impacts have already stabilised or not. The meaning of the symbols used and an example of their application is presented in the following two tables.
Table 2.4 SYMBOLS USED TO DESCRIBE THE TEMPORAL DYNAMICS OF THE EFFECTS Symbol Meaning
+ or ‐ Positive or negative effect.
++ or ‐‐ Positive or negative effects reinforced (in positive or negative direction) with respect to the previous stage.
+++ or ‐‐‐ Positive or negative effects further reinforced (in positive or negative direction) with respect to the previous stage.
+/‐ Mixed effect, it is not possible to assess whether the impact was positive or negative.
Table 2.5 EXAMPLES OF TEMPORAL DYNAMICS OF THE EFFECTS Short run (years 1‐5)
Long run (years 6‐ 10)
Future years
Comments
+ + + The positive effect stabilised in the short‐run.
+ ++ ++ The positive effect stabilised in the long‐run.
+ ++ +++ The effect has grown over the years and is expected to increase also in the future (not stabilised yet).
‐ + ++ The effect was at first negative; after some years it turned positive and it is still not stabilised yet.
+/‐ + ++ Effects have been mixed in the initial stage, became positive in the long‐run and are expected to further increase in the future (not stabilised yet).

21
3 DEVELOPMENT EFFECTS 3.1 INTRODUCTION The scope of this Section is to explore the main long‐term socio‐economic effects generated by the ten infrastructural projects analysed and detect the timeframe over which such effects were produced and stabilised, if they have stabilised. In other words, a horizontal analysis is undertaken on the evidence gathered from the sample projects, in order to answer the Evaluation Questions related to the ‘What’ and ‘When’ dimensions:
“What kind of long‐term contributions can be identified for different types of investment in the field of environment and transport infrastructure?”
“What is the minimum and average time needed for a given long‐term contribution to materialise and stabilise? What are these time spans for different types of investment in the field of environment and transport infrastructure?”
As explained in the previous Section, comparable scores have been assigned in each case study to “quantify”, on an ordinal scale, the different types of contributions to economic growth and quality of life. On average, both the transport and environment projects produced positive effects (recording scores generally higher than 0). Figures 3.1 and 3.2 show the median score by sector – transport and environment – and the minimum and maximum score recorded in individual projects. A number of remarks can be derived from these Figures:
• Larger deviations from the average value can be observed for certain impacts (for example on social happiness) than for others (such as on endogenous dynamics);
• When comparing the kinds of effects with each other, it is possible to highlight that some impacts (e.g. on direct economic growth) have generally been stronger than others (e.g. on institutional quality);
• If a sectoral perspective is taken, it can be pointed out that certain effects had different strengths depending on whether the transport or environment projects are considered: for example, territorial cohesion has been promoted more by transport infrastructures.

22
Figure 3.1 THE EFFECTS AT A GLANCE ‐ TRANSPORT PROJECTS
Note: The graph shows the median scores and their degree of variability (from the minimum to the maximum score recorded) for the projects by each type of effect. The meaning of each score (±5) is presented in Table 2.3 of this report. Source: Authors
Figure 3.2 THE EFFECTS AT A GLANCE ‐ ENVIRONMENT PROJECTS
Note: The graph shows the median scores and their degree of variability (from the minimum to the maximum score recorded) for the projects by each type of effect. The meaning of each score (±5) is presented in Table 2.3 of this report. Source: Authors
These are only intuitive findings drawn from a high level review of all case studies. It is acknowledged that behind these synthetic findings there are complex project histories, which differ significantly from one case to another one, even in the same sector. Hence, while these figures give a preliminary overview of the kind of development effects observed, a deeper discussion is presented in the following Sections (3.2 and 3.3) to better disentangle the project specificities and the general findings arising.
‐5‐4‐3‐2‐1012345
Median score
Min
Max
‐5
‐4
‐3
‐2
‐1
0
1
2
3
4
5
Median score
Min
Max

23
As far as the timeframe for effects to materialise and stabilise is concerned, the cross‐project review suggests that the majority of effects have reached a stable situation and no changes are expected regarding the kind and intensity of such effects. More specific patterns could be highlighted when each type of effect is analysed: for instance, more time is generally needed for the direct economic growth effects to stabilise, while endogenous dynamics tend to stabilise in the short (i.e. from 1 to 5 years after the project completion) or in the long run (more than 6 years after project completion). Sectoral patterns are also present: the impact of transport projects generally stabilises over a longer timeframe than does that of environmental projects. More details on the temporal dynamics of project effects are presented in Section 3.4.
3.2 ECONOMIC GROWTH The cases under review point to large uncontroversial and steady direct effects on economic growth. Effects better captured by an endogenous growth approach (triggered by factors such as human capital, endogenous technological progress and organisational change) are also consistently positive although at a slightly lower level than direct growth effects.
3.2.1 Direct welfare and economic growth This category of effects encompasses all the direct contributions of the project to economic growth, in terms not only of real growth in Gross Domestic Product, but also, more generally, of economic welfare. To be consistent, the label “Direct economic growth” identified in the study’s conceptual framework, could be more conveniently modified to “Direct welfare and economic growth”.
Figure 3.3 DIRECT WELFARE AND ECONOMIC GROWTH EFFECTS AT A GLANCE
Note: The graph shows the score recorded by each project in relation to the direct economic growth effects. The meaning of each score (±5) is presented in Table 2.3 of this report. Source: Authors
0
+5+4+3+2+1
‐5‐4‐3‐2‐1
M1 Motorway
Portof Gioia TauroVigo wastewater treatment
Dublinwastewater treatment
EgnatiaMotorwayMadrid Metro LinePalermo Water Supply System Sogamasolidwaste treatment
Valorsulsolidwaste treatment
MediterraneanCorridor

24
In line with the findings of the traditional theory, the cases confirm that the investment in infrastructures triggers economic growth effects, thanks to the accumulation of capital43. Most are captured through the ex‐post CBA.
Various channels of influence link infrastructure endowment to economic growth. The cases under review allow us to identify the following (non‐exhaustive) series:
• Efficiency of the system: investment, operating and maintenance costs savings and energy savings;
• Users’ productivity: travel time saving and improved safety;
• New business opportunities, directly or indirectly provided by the project;
• Change in land use and value;
• Direct users’ welfare, affected, for example, by the provision of improved public services and increased value of use of public goods;
The case studies shed light on the level at which these factors apply (local, regional, national, and international) and which actors benefit most from them.
With the single exception of the Mediterranean Corridor project, transport projects record satisfactory performance in terms of direct economic growth – i.e. over the seven categories of effects reviewed, direct economic growth is in general one of the main effects produced by the projects considered.
This is confirmed by the results of the CBAs (see Table 3.2). The average Economic Net Present Value (ENPV) of a transport project is high and stands at EUR 1,981 million (including the negative performance of the Mediterranean Corridor). The range, however, is very wide: from EUR ‐6.87 million for the Mediterranean Corridor to EUR 6,150 million for the M1. This testifies to the large variability in the economic growth changes produced by these projects, compared to the costs borne. In general, a project in transport has a significant impact on the direct economic growth of a region or a country, but the investment cost is high (the average in the sample is EUR 1,907 million, 2011 prices44). Thus, to be effective these projects have to be supported by efficient implementation (no cost overruns and delays during implementation) and adequate volumes of traffic during operation (no demand underestimation). Otherwise, the risk of failure or limited impact is high. This is what happened for example with the Mediterranean Corridor, where inefficiencies during implementation (one section is not yet completed) and a fall in demand back to 2000 values determined a negative ENPV. On the other hand, control of construction costs of the Madrid Metro Line, accompanied by a systematic increase in the passengers at Barajas airport, generated very high economic results
43 For a reference in the economic literature, see Aschauer (1989), Barro (1990), Gramlich (1994) and Straub (2008). 44 This is including the cost for the Egnatia Motorway which alone accounts for EUR 7,052.6 million (2011 prices); excluding Egnatia, the average is EUR 620.5 million.

25
(ENPV equal to EUR 2,636 million). In what follows the specific factors underlying the direct economic growth dynamics generated by transport projects are discussed.
The main factors accounting for the direct growth effects of the two motorways reviewed (the Egnatia motorway in Greece and the M1 in Ireland) are travel time savings and improved safety with overall positive impact on users’ productivity. While the Egnatia motorway also contributed to the reduction of vehicle operating cost, these rose in the M1 case, due to slight longer distance and higher speeds.
In the case of the Egnatia motorway, improved users’ productivity had important induced consequences in terms of increased business opportunities (in sectors like trade and tourism), increased accessibility and mobility, improved performance of ports and airports, and more attractive locations. These effects at regional and national level are not tangible and difficult to quantify45. However, together with the very size of the infrastructure (670 km), the fact that Egnatia offers many interconnections to other different important transport modes (ports, airports), and vertical axes towards neighbouring countries, is suggestive of the magnitude of the effects produced. The fact that the motorway is relevant for both passenger and freight transport also multiplies spillovers46. Most likely, these effects more than outweighed the decrease in activity in places from where road traffic was diverted (at local level). On the face of it, in the case of the M1 (“only” 83 km), some investments and business opportunities were observed but they were difficult to solely impute to the motorway and part of them could in fact result from spreading of economic activity and/or urban sprawl.
The Egnatia motorway, which was implemented in the most rural regions of Greece, increased accessibility which in turn favoured also important changes in land use and value. The transformation of a significant amount of rural land into urban land or new areas occupied by industrial and commercial activities represents a driver of economic growth. Economic impact of the Egnatia motorway has also been reflected in the increase in the market value of land47. By contrast, effects on land use and value are of secondary importance in the M1 case.
The same main factors are at work in the case of the Madrid Metro Line: time savings and reduced trip costs made possible by the shift to a cheaper, more reliable and faster transport mode ensured a more effective connection between Barajas Airport, its neighbourhoods and Madrid. Travel time and cost savings for users alone accounted for about 78% of the total quantified benefits. This, together with increased traffic (related to the Airport and the Madrid International Fair, located in the same district) contributed to improving the attractiveness of the entire metropolitan area. This is reflected in increased land values and in the development of new business opportunities.
45 It has to be pointed out that these are often pecuniary externalities (i.e. externalities which operate through price rather than through real resource changes) or wider economic effects (as a reference, see Yew‐Kwang, 1983 and Greenwald and Stiglitz, 1986). 46 Again, the results from the CBA analysis confirm the evidence by showing that EUR 292.6 million/year and EUR 133.6 million/year are the average annual benefit generated, respectively, to passengers and freight traffic. 47 It has been estimated that buildings located close to the interchanges facing the motorway have increased their value by up to approximately 600%.

26
Reduction in travel times has been achieved by another Spanish project, the Mediterranean Corridor: long‐distance passengers travelling along the upgraded Valencia‐Barcelona railway benefitted from reduced travel time and vehicle operating cost savings, because of the shift of transport mode from road to railway. That said, the recent contraction of passenger demand, due to the economic crisis, and the lack of any increase in freight demand, due to the saturation of the line and some infrastructural constraints48, are factors which led to a lower than expected economic impact.
As to the Gioia Tauro project, its main economic benefit consists of the development of an entirely new business in the Southern Italian region of Calabria, i.e. transhipment, which translated into the generation of direct employment related to the operation of the infrastructure. The creation of additional business opportunities in the area close to the port (e.g. industries, logistic services and others) were, however, well below the expectations of public authorities. It has to be pointed out that these wider effects, in fact, were outside the scope of the project evaluated: actually, because of its specific characteristics, pure transhipment tends to generate very little or no value added and development in the area where the port is located.
It is worth noting that the Gioia Tauro project shares little characteristics with the other transport projects analysed. As already mentioned in Section 1, this is the only case of a productive investment. As a consequence, while the main beneficiaries of other projects have been the infrastructure users, Gioia Tauro mostly benefitted the operator itself which enjoyed significant profits, especially at the beginning of the project life cycle.
The mentioned effects were generated at different geographical levels (local, regional, national or even international), depending on the size and location of the transport infrastructure itself. Clearly a project like the Egnatia motorway had effects of a cross‐border nature, while a transport project like the MEDCORR produced effects on a regional scale.
With regard to environment projects, direct growth effects triggered by the projects reviewed are slightly less important compared to other effects produced than is the case for transport projects – suggesting a contrario that effects in terms of quality of life are more important (as discussed in the next Sections).
All these projects contributed to economic growth and welfare through the provision of basic public services which did not exist before (as for the waste water treatment Ría de Vigo or solid waste treatment in Galicia and Northern Lisbon) or highly underdeveloped (as for the Palermo water supply case and waste water treatment in Dublin) and through the increased value of use of public goods, such as cleaner sea water and beaches (to the benefit of residents and tourists). Public service provision directly affects the user’s utility function: consumer surplus is mainly measured by the amount of money people would be willing to give up to ensure the provision of a service (i.e. their willingness‐to‐pay).
48 Such as too short sidings which prevent faster trains from passing slower freight trains.

27
The average ENPV of an environmental project is EUR 209 million, significantly below the average recorded in transport. Also the investment costs are generally lower than for transport projects (on average EUR 245.8 million). All these projects, however, show a positive economic performance (i.e. ENPV greater than zero) within a relatively narrow range: from EUR 46.8 million for the Integrated Environmental Regeneration of Ría de Vigo to EUR 335 million for Dublin Waste Water Treatment. The risk analyses also show that results are more robust against uncertainties (see Table 3.2). This is an indication of the relative “stability” of these projects, which generate lower direct economic growth dynamics, but are less sensitive to market and macro‐economic conditions and therefore less risky.
The willingness‐to‐pay of users represents the main benefit quantified in the CBAs of the two waste water treatment cases. In both cases, the project also had effects in terms of business opportunities in the tourism sector. In Ría de Vigo, expectations as far as another sector, aquaculture, is concerned were not realised. In Dublin, the plant also impacted on the house building sector and house owners because of increased property values, thanks to the cleaner water and the opening of new bathing beaches.
For the solid waste management projects in Galicia and Northern Lisbon, the importance of business opportunities takes on a wider significance. The two projects had a positive impact on direct economic growth, not only by effectively implementing a waste management and treatment service, but also through increased business opportunities arising from side activities, particularly the sale of electricity and the contribution to the market for recycled materials. While the Portuguese infrastructures, operated by the company Valorsul, obtained very large benefits from energy production49, much more could have been achieved in terms of sale of recyclable waste and compost. As far as the facilities operated by Sogama in Galicia are concerned, besides the economic benefit from energy generation and sale, the project was more successful in contributing to the recycling of packaging waste. Moreover, the project also had the unintended effect of attracting other companies operating in the waste management sector into the same area. For these reasons, the effects on direct economic growth of the two infrastructures have slightly different magnitudes: in Galicia, effects are stronger and in Portugal lower.
Finally, in the case of the Palermo project, aimed at renovating the municipal water supply network and improving service delivery, direct economic welfare and growth effects identified are mostly due to users’ time savings for avoided self‐provision of water (no longer needed in order to operate individual pumps), and cost savings realised by domestic and industrial users who do not need to purchase, operate and maintain pumps and tanks any longer50. In addition, increased operator efficiency in the provision of the service through avoided maintenance and operating costs and higher productivity of commercial and industrial users were generated,
49 Valorsul recovers energy from the composting plant, the incinerator plant and, lately, also from burning landfill biogas. The high national subsidies on energy generation from these sources secure Valorsul’s financial returns. 50 The total discounted value of the time savings is EUR 335.6 million, representing 82.3% of the total benefits, while the cost savings account for EUR 66.9 million (16.4% of the benefits).

28
thanks to increased water supply reliability. Overall, these effects have a local relevance without spillover effects on third parties.
Figure 3.4 DRIVING THE ECONOMIC GROWTH
Note: a) Shortening distance and increasing business opportunities in Greece thanks to the Egnatia motorway51 b) Sogama and Valorsul’ contribution to the market of recycled materials52
Linked to the fact that the catchment area of all the analysed environment projects is local or regional (in the case of the Galicia solid waste management project only), these effects are predominantly of a local/regional nature, with the exception of the benefit deriving from the sale of energy into the national network, which is on a national basis.
Table 3.1 SYNTHESIS OF FACTORS POSITIVELY INFLUENCING DIRECT WELFARE AND ECONOMIC GROWTH
Gioia Tau
ro
M1
Egna
tia
Mad
rid
MED
CORR
Palerm
o
Valorsul
Soga
ma
Ría de
Vigo
Dub
lin
Efficiency of the system √ √ √ √ √ √ √ √
Users’ productivity √ √ √ √
New business opportunities √ √ √ √ √
Change in land use and value √ √ √ √ Direct users’ welfare √ √ √ √ √ √
Source: Authors
To summarise, Table 3.1 shows the drivers of economic welfare and growth highlighted in the ten case studies. It can be pointed out that there are sector‐specific factors at work: for
51 http://www.egnatia.eu/page/default.asp?id=5&la=2 52 http://www.sogama.es/gl/info/xestion‐de‐residuos‐urbanos

29
instance, while transport projects generally influence growth via increased users’ productivity, environment projects have mainly a direct users’ welfare impact, via the provision of new public services. More detailed results emerging from the CBA exercise are shown in Table 3.2: the Economic Net Present Value (ENPV) and Economic Rate of Return (ERR) estimated for each project is presented, with indications of the forecasted variability of results as derived from the risk analysis.
Table 3.2 COMPARATIVE CBA RESULTS Base case Risk analysis
Project ENPV
(EUR million)
ERR
(%)
ENPV
(EUR million)
ERR
(%)
Port of Gioia Tauro 604.5 10.44% Min. 269.1
Max. 1,090.6
Mean 635.6
Min. 7.64%
Max. 13%
Mean 10.59%
M1 motorway 6,150 23.8% Min. 5,687
Max. 6,863
Mean 6,226
Min. 23.6%
Max. 24.16%
Mean 23.86%
Egnatia Motorway 523.1 5.2% Min. ‐561.4
Max. 1,964.7
Mean 520.4
Min. 4.37%
Max. 6.24%
Mean 5.2%
Madrid Metro Line – Access to Barajas Airport
2,636 16.87% Min. 2,380.2
Max. 2,908.8
Mean 2,648.9
Min. 16.13%
Max. 17.53%
Mean 16.87%
Mediterranean Corridor ‐6.9 4.9% Min. ‐82.8
Max. 72.9
Mean ‐5.9
Min. 4.47%
Max. 5.43%
Mean 4.95%
Water Supply System in
Palermo
315 14.68% Min. 276.6
Max. 339.1
Mean 312.6
Min. 14.04
Max. 15.04
Mean 14.63
Integrated Solid Waste Management in northern Lisbon
135 5.9% Min. 115.4
Max. 178.1
Mean 140.9
Min. 5.7%
Max. 6.3%
Mean 6%
Urban solid waste management in Galicia
193 7.19% Min. 119.7
Max. 358.5
Mean 235.1
Min. 6.27%
Max. 8.63%
Mean 7.49%
Integrated environmental regeneration of Ría de Vigo
46.81 5.86% Min. ‐19,996.9
Max. 102,831.8
Mean 46,641.8
Min. 4.31%
Max. 7.09%
Mean 5.85%
Dublin Waste Water Treatment
335 11.7% Min. 97
Max. 400
Mean 236
Min. n.a.
Max. n.a.
Mean 10.1%
Source: Authors

30
Findings The direct contribution of the projects reviewed to economic growth, in terms not only of real growth in GDP but also more generally of economic welfare, is significantly positive for almost all the projects. Transport projects, and in particular roads / urban transport projects, can produce important effects in terms of direct economic growth, mainly through travel time savings, resulting in productivity gains and induced effects on regional development. Effects on economic welfare are a priori more central for environment projects – but this, in fact, depends on the typology of infrastructure. For the two incinerators reviewed, business opportunities are an important driver of direct economic growth effects, which can take place beyond the local level. The average ENPV of transport projects is higher than that of environment projects but the range is also wider. In the face of high investment costs, efficient implementation and adequate demand forecasts are necessary in the former case in order to avoid failure (e.g. Mediterranean Corridor). Environment projects are less risky but also generate lower direct economic growth dynamics.
3.2.2 Endogenous dynamics Indirect growth effects triggered by endogenous factors are generally lower than direct growth effects but they are positive for all projects. In fact, they tend to represent a generally positive “surprise” compared to expectations. Environment projects record slightly lower levels of endogenous growth than transport projects.
Figure 3.5 ENDOGENOUS DYNAMICS EFFECTS AT A GLANCE
Note: The graph shows the score recorded by each project in relation to the endogenous dynamics effects. The meaning of each score (±5) is presented in Table 2.3 of this report. Source: Authors
In general, the three main factors of endogenous dynamics, i.e., human capital, technological progress and organisational change were activated in the projects reviewed. Technological progress was almost always promoted, along with human capital development. This is clearly the case with projects mobilising innovative technological solutions (either in absolute terms or with respect to local conditions) and spreading know‐how, like the M1 motorway, Madrid Metro Line, Dublin waste water treatment, the port of Gioia Tauro, the Mediterranean Corridor, Sogama and Valorsul solid waste treatment projects. On other occasions, technological transfer took place with international experts hired in the design / construction phases (M1, Valorsul and Egnatia where an international engineering firm was incorporated
0
+5+4+3+2+1
‐5‐4‐3‐2‐1
EgnatiaMotorway
Portof Gioia Tauro MediterraneanCorridorVigo wastewater treatment Dublinwastewater treatment Sogamasolidwaste treatment
Madrid Metro LinePalermo Water Supply System Valorsulsolidwaste treatment
M1 Motorway
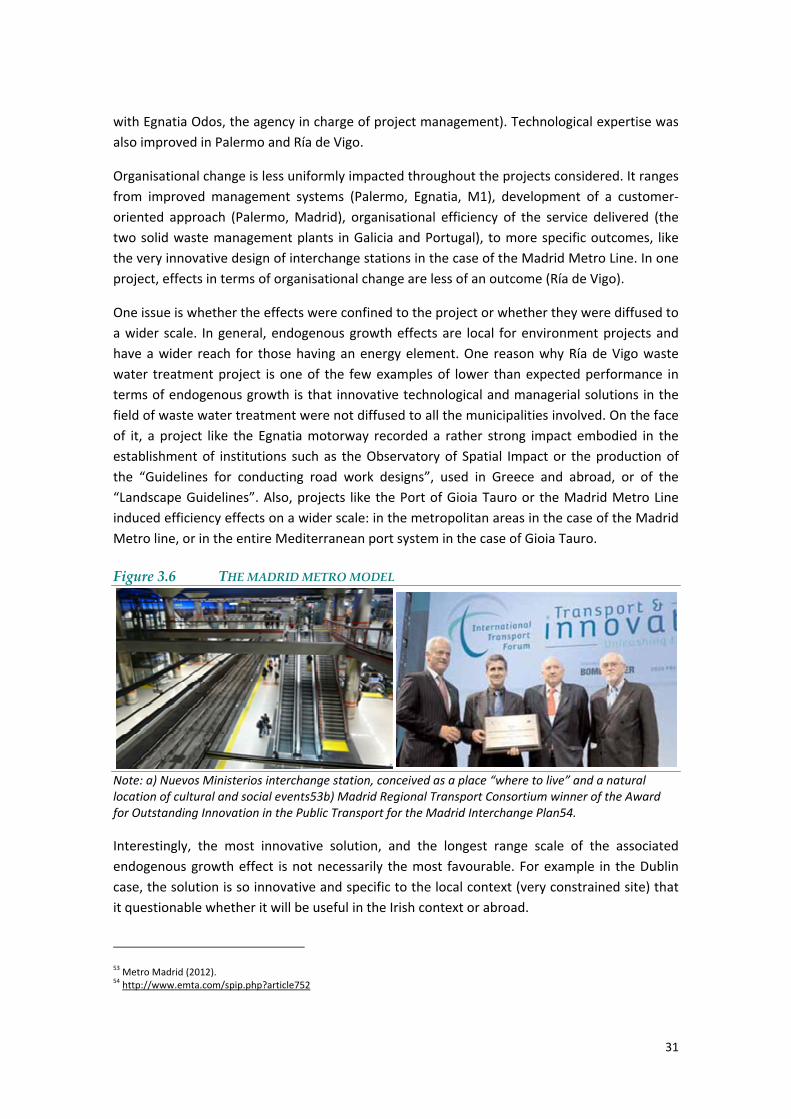
31
with Egnatia Odos, the agency in charge of project management). Technological expertise was also improved in Palermo and Ría de Vigo.
Organisational change is less uniformly impacted throughout the projects considered. It ranges from improved management systems (Palermo, Egnatia, M1), development of a customer‐oriented approach (Palermo, Madrid), organisational efficiency of the service delivered (the two solid waste management plants in Galicia and Portugal), to more specific outcomes, like the very innovative design of interchange stations in the case of the Madrid Metro Line. In one project, effects in terms of organisational change are less of an outcome (Ría de Vigo).
One issue is whether the effects were confined to the project or whether they were diffused to a wider scale. In general, endogenous growth effects are local for environment projects and have a wider reach for those having an energy element. One reason why Ría de Vigo waste water treatment project is one of the few examples of lower than expected performance in terms of endogenous growth is that innovative technological and managerial solutions in the field of waste water treatment were not diffused to all the municipalities involved. On the face of it, a project like the Egnatia motorway recorded a rather strong impact embodied in the establishment of institutions such as the Observatory of Spatial Impact or the production of the “Guidelines for conducting road work designs”, used in Greece and abroad, or of the “Landscape Guidelines”. Also, projects like the Port of Gioia Tauro or the Madrid Metro Line induced efficiency effects on a wider scale: in the metropolitan areas in the case of the Madrid Metro line, or in the entire Mediterranean port system in the case of Gioia Tauro.
Figure 3.6 THE MADRID METRO MODEL
Note: a) Nuevos Ministerios interchange station, conceived as a place “where to live” and a natural location of cultural and social events53b) Madrid Regional Transport Consortium winner of the Award for Outstanding Innovation in the Public Transport for the Madrid Interchange Plan54.
Interestingly, the most innovative solution, and the longest range scale of the associated endogenous growth effect is not necessarily the most favourable. For example in the Dublin case, the solution is so innovative and specific to the local context (very constrained site) that it questionable whether it will be useful in the Irish context or abroad.
53 Metro Madrid (2012). 54 http://www.emta.com/spip.php?article752

32
Findings Endogenous dynamics effects (i.e. indirect growth effects) are generally less important than direct growth effects but they are positive, and often higher than expected. They are more likely to be secured by transport projects. The projects reviewed take advantage of all the three main factors of endogenous growth i.e., human capital, technological progress and organisational change, but the last of these is the least uniformly impacted. Endogenous growth effects are generally local for environment projects and have a wider reach for road transport projects.
3.3 QUALITY OF LIFE In contrast to impacts in terms of direct and indirect economic growth, effects on quality of life vary from project to project to a higher extent. This is in particular the case for transport projects and it reflects the fact that there are two outliers with respect to quality of life: Gioia Tauro (low performance on all five criteria) and Metro Madrid (the opposite).
3.3.1 Social cohesion The projects reviewed bring about little effects in terms of social cohesion. This is not surprising as social cohesion is not a main objective of major projects, at least of those included in the sample assessed. Thus, for a series of projects (Gioia Tauro, Egnatia, Palermo, Ría de Vigo, Sogama) no such effects are detected. However, in a few cases, some effects do materialise beside the main objectives. An exemplar illustration is given by the Madrid Metro Line case. Besides providing access to the airport (and International Fair), the metro line actually also benefits the inhabitants (often immigrants) of the less developed neighbourhood of the Barajas area. It offers quality and affordable public transport for travellers with limited resources. Another transport project, the Mediterranean Corridor, also favoured social cohesion, by providing better rail services for people who do not own a car or have disabilities.
Figure 3.7 SOCIAL COHESION EFFECTS AT A GLANCE
Note: The graph shows the score recorded by each project in relation to the social cohesion effects. The meaning of each score (±5) is presented in Table 2.3 of this report. Source: Authors
0
+5+4+3+2+1
‐5‐4‐3‐2‐1
Madrid Metro LineMediterraneanCorridor
Portof Gioia TauroEgnatiaMotorwayPalermo Water Supply System Vigo wastewater treatment Sogamasolidwaste treatmentValorsulsolidwaste treatment
Dublinwastewater treatment
M1 Motorway
33
Other projects may have contributed to social cohesion through more circumscribed or indirect means. Actually, any project sponsored by the EU can indirectly and in principle contribute to social cohesion if the national government decides to dedicate to social spending (e.g. health expenditure) the resources freed up thanks to EC co‐funding.
Besides the mentioned evident effects on social cohesion, the analysis carried out on the case studies did not allow us to go further into the measurement of the welfare distribution effects of projects. It is recognised that relatively large projects may exacerbate or ease social unbalances characterising the target population. In order to consider explicitly the distribution impact, the evaluator would need to analyse data on income, expenditure, price elasticity and other variables at the microeconomic level and to identify changes for each population group involved in the project (e.g. shareholders, taxpayers, skilled and unskilled workers, different types of users or consumers). Specific welfare weights would have to be computed and plugged into the Social Welfare Function55, so as to capture welfare changes for each group. A different approach to including distribution considerations in project evaluation is to focus on social affordability. Social affordability analysis can be defined as checking the project impact only on the most disadvantaged groups: this would allow the evaluator to focus on a smaller set of welfare proxies and social targets.
Even though these types of analysis were not carried out on the reviewed projects, there is no evidence suggesting that projects had relevant regressive effects on welfare distribution. In one case only, slightly negative effects were obtained as a result of an unexpected event: bad odours emitted from the Dublin waste water treatment plant with negative consequences for the surrounding areas which were perceived to be less well‐off compared to other districts of the city.
Findings Social cohesion effects are generally side effects; this reflects the fact that social cohesion is not a high priority for the projects reviewed. These effects are generally positive except in one case (Dublin waste water treatment). In a few instances (e.g., Madrid Metro Line), they reach significant magnitudes.
3.3.2 Environmental effects As expected, environment projects record positive environmental effects. Frequently, however, environmental effects did not reach their full magnitude while in one occasion (Palermo) the objective has been overall missed.
In fact, operational difficulties of different sorts (and different importance) hampered the full attainment of the expected effects. For example, the two waste water treatment plants in Dublin and Galicia produced significant environmental effects by improving water quality, but to slightly different extents. While in Ría de Vigo, the under capacity of the principal plant (the Lagares plant) and late (or missed56) installation of Ultra‐Violet (UV) treatment, together with
55 In Economics, a Social Welfare Function is a function that allows one to aggregate the social welfare states of individuals (Sen, 1970). 56 In the case of the Lagares plant.

34
other marginal difficulties57 reduced environmental effects, in Dublin, operational and structural difficulties (mainly in terms of under capacity) did not imperil overall positive environmental effects. One serious odour problem was solved albeit at substantial cost (see Section 4.3).
Figure 3.8 ENVIRONMENTAL EFFECTS AT A GLANCE
Note: The graph shows the score recorded by each project in relation to the environmental effects. The meaning of each score (±5) is presented in Table 2.3 of this report. Source: Authors
In fact, operational difficulties of different sorts (and different importance) hampered the full attainment of the expected effects. For example, the two waste water treatment plants in Dublin and Galicia produced significant environmental effects by improving water quality, but to slightly different extents. While in Ría de Vigo, the under capacity of the principal plant (the Lagares plant) and late (or missed58) installation of Ultra‐Violet (UV) treatment, together with other marginal difficulties59 reduced environmental effects, in Dublin, operational and structural difficulties (mainly in terms of under capacity) did not imperil overall positive environmental effects. One serious odour problem was solved albeit at substantial cost (see Section 4.3).
The solid waste treatment projects in Lisbon and Galicia achieved important environmental benefits. In both cases, the projects secured more efficient waste management systems and led to the closure of illegal landfills. Sogama and Valorsul are at the origin of air emissions resulting from incineration, landfill and from waste transport, but this effect is more than counterbalanced by the sale of energy, which allows energy production savings from other non‐renewable sources. Both projects are affected by the low quality of household waste separation, reducing potentials from recycling and, in the Valorsul case, production and sale of
57 Industrial illegal discharges. 58 In the case of the Lagares plant. 59 Industrial illegal discharges.
0
+5+4+3+2+1
‐5‐4‐3‐2‐1
Madrid Metro Line
Portof Gioia TauroEgnatiaMotorwayPalermo Water Supply System
Dublinwaste water treatmentSogamasolidwaste treatmentValorsulsolidwaste treatment
M1 Motorway
MediterraneanCorridorVigo wastewater treatment

35
compost. Additionally, in the case of the Galician plant, the under capacity of the incinerator led to the dumping of a large volume of waste at the Areosa landfill, thus reducing the possibility of waste valorisation through energy recovery. Also, a missed opportunity in this case was the failure to campaign in favour of the plant and convince the population of its environmental advantages as happened with Valorsul. In both cases, further additional positive effects are expected in the future if the recycling rate increases.
Figure 3.9 FACING UP TO WASTE
Note: a) Unloading waste at the Sogama Environmental Complex in Cerceda (Spain)60; b) A train carrying waste arriving at the Cerceda waste treatment complex61.
In Palermo, while water supply improved, water losses were not overall reduced. This is because water saved in the new sub networks was used to maintain pressure in the overall network, provoking leakages in the old sub networks, which have not been affected by the intervention. Dealing with supply disruptions (quality of service provided) was prioritised rather than improving overall environmental effects.
In the transport projects, achieving environmental effects is not a primary objective, but some side effects are obtained. Examples are the reduction of fuel cost made possible by economies of scale related to the use of huge ships as in Gioia Tauro, or the positive effects resulting from the shift to a cleaner mode of transport (rail replacing car traffic, as in the Madrid Metro Line and Mediterranean Corridor cases).
Environmental effects can act in opposite directions and offset one another, as illustrated by the two motorway projects. Effects can typically be positive (diversion of traffic from roads going through small towns resulting in less congestion, less air pollution and less noise) and negative (air pollutant emissions due to the generation of new traffic as well as negative externalities resulting from construction62). While in the Egnatia case negatives were offset by positives, the opposite is true as far as the M1 is concerned. In both cases mitigation measures were mobilised to reduce the negative effects (e.g. bridge and crossings or even re‐alignment as for Egnatia), which in general raised costs and efforts.
60http://www.acciona‐infraestructuras.com/activities/civil_works/spain/galicia/la‐coruña/sogama‐complex/photos.aspx?page=&desde=1625&pais=&localidad=&ccaa=&provincia=&actividad=1808§or=&segmento=1815&tipomapa=. 61 European Union, 2004, “The Cohesion Fund: a boost for European solidarity”; Inforegio Panorama n. 14. 62 Particularly in the case of the large Egnatia Motorway.

36
Findings As expected, environment projects produce positive environmental effects, although their full achievement is hampered by various operational or structural difficulties (e.g. under capacity or the readiness of the population to separate waste). In one environment project (Palermo water supply), there was a trade‐off between the reliability of service provision and environmental objectives, which was decided in favour of the former. Transport projects also produce environmental side effects which are in general positive. In some cases, they can have an important impact (e.g., shifting transport mode from car to rail in the Madrid Metro Line and Mediterranean Corridor projects).
3.3.3 Territorial cohesion The objective of territorial cohesion records contrasting performances across transport projects. This probably reflects the fact that territorial cohesion in its usual sense (reduction of gaps between more and less favoured geographical regions63) is important but perhaps not as central to all projects as is the case of environmental effects for environment projects.
Figure 3.10 TERRITORIAL COHESION EFFECTS AT A GLANCE
Note: The graph shows the score recorded by each project in relation to the territorial cohesion effects. The meaning of each score (±5) is presented in Table 2.3 of this report. Source: Authors
The objective of territorial cohesion is explicit in the two motorway cases, but effects recorded are of a much wider magnitude as far as Egnatia is concerned, obviously due to the much wider reach of the latter infrastructure. Thus, Egnatia motorway improved cross‐border exchanges, reduced the isolation of borderland areas but also improved accessibility between urban centres (“functional policentricity”). M1 reduced the peripherality of border areas and improved the linkages between Dublin and Belfast.
63 The concept of European territorial cohesion can be traced back to the Treaty of Rome (1957), which states that among the objectives of the European integration is “To strengthen the unity of their economies and to ensure their harmonious development by reducing the differences existing between the various regions and backwardness of the less favoured regions”. In the more recent Green Paper on Territorial Cohesion (European Commission, 2008b), territorial cohesion is about ensuring the harmonious development of all EU places and transforming territorial diversity into an asset that contributes to sustainable development of the entire EU.
0
+5+4+3+2+1
‐5‐4‐3‐2‐1
Vigo wastewater treatment
Portof Gioia TauroPalermo Water Supply System
Dublinwastewater treatmentValorsulsolidwaste treatment
M1 MotorwayMadrid Metro LineSogamasolidwaste treatment
EgnatiaMotorway
MediterraneanCorridor

37
Figure 3.11 REGIONS OPEN THEIR BORDERS
Note: a) Egnatia Motorway and its vertical axes64b) Rail Mediterranean Corridor65.
In the case of the Metro Madrid project too, positive effects are recorded in terms of territorial cohesion since the line connects Madrid with not only the airport but also a relatively peripheral area (the Barajas village). But as with the social cohesion effects, this result is more a side effect than a priority. The upgrade of the Mediterranean Corridor railway also fostered territorial cohesion, by strengthening of linkages among the regions involved and contributing to a more polycentric development for the country. Finally, Gioia Tauro is embedded in a North / South divide (more relevant in terms of economic and social cohesion) which was not eased by the project, with overall little or no impact on territorial cohesion66.
Environment projects have only negligible effects on territorial cohesion. They show that circumscribed arrangements (e.g., unique tariff imposed benefitting the most distant towns in the Sogama case) or the very existence of the infrastructure itself making available a service of general interest and ensuring its full coverage (e.g., the extension of the sewerage network in Ría de Vigo) can have some positive effects in this respect.
Findings Most of the transport projects have positive effects in terms of territorial cohesion even if territorial cohesion is not always a top priority. In one case (Madrid Metro Line), significant effects in terms of territorial cohesion are recorded which nevertheless appear to be side effects when they are compared to the main objectives of the project. Environment projects record marginal side effects as far as territorial cohesion is concerned (e.g. the provision of a service of general interest to a whole segment of population).
64 http://observatory.egnatia.gr/map_gallery_en_temp.htm
65 Ministerio de Fomento (2011). 66 Actually, the port had the potential to reduce the North‐South divide and enhance territorial cohesion, by moving the Southern region of Calabria from the periphery of Europe to the centre of the Mediterranean transport routes. Yet, the competition pressures from other Italian ports, especially Northern ones, and the lack of a national coordinated strategy prevented the Port of Gioia Tauro from having any significant effect on territorial cohesion.

38
3.3.4 Institutional quality This category refers to effects that investment projects have on the quality of life thanks to the improvement in the quality of institutions, independently of its direct relationship with economic growth67.
In general, performance of the projects in terms of institutional learning ranks low. This is especially the case for environment projects which are characterised by very little spill over: if learning effects took place they mostly remained confined within project.
Figure 3.12 INSTITUTIONAL QUALITY EFFECTS AT A GLANCE
Note: The graph shows the score recorded by each project in relation to the institutional quality effects. The meaning of each score (±5) is presented in Table 2.3 of this report. Source: Authors
Concerning the specific case of projects in the environment sector, one hypothesis is that the involved actors are often municipalities or regional authorities not always adequately prepared to take advantage of the investment projects. For example in the case of Ría de Vigo, municipalities were in charge of organising bidding procedures to select private operators to run infrastructural parts of the project. However, some of them proved incapable of going through this process and Augas de Galicia, the governmental body in charge of the project implementation, had to take over the task, with no resulting learning effects taking place.
Sogama illustrates a missed opportunity for even wider impact since most local municipalities decided not to join together in consortia, thus missing the chance to achieve economies of scale in waste management. At the regional level, the government of Galicia was also unsuccessful in dealing with the municipalities’ uncertainty about whether or not to join the Sogama waste treatment model. Greater involvement and discussion with municipalities from the early stage of project conception, in particular, could have helped to give Sogama more definite indications of the project’s demand. Instead, given the difficulty of correctly
67 These effects differ from organisational changes addressed in the Endogenous growth section which are related to economic growth by improving the productivity of inputs.
0
+5+4+3+2+1
‐5‐4‐3‐2‐1
Vigo wastewater treatmentDublinwastewater treatmentSogamasolidwaste treatment Portof Gioia Tauro
Palermo Water Supply System
M1 MotorwayMadrid Metro Line
EgnatiaMotorwayValorsulsolidwaste treatment
MediterraneanCorridor

39
forecasting demand, the incinerator plant’s capacity is today insufficient to treat the total volume of waste collected. Another example of disappointment is given by the Palermo project which raised expectations in terms of diffusion of respect for the law but which produced little effects apart from the establishment of a task force to deal with unpaid bills.
Valorsul is possibly the environment project with the most favourable institutional developments. It enabled the implementation and testing of the “multi‐municipal” management model proposed in the National Strategic Plan for Municipal Solid Waste. As a pioneer project, it strengthened the capacity to deliver large and complex projects and in particular it contributed to the development of regulatory capacity and knowledge of public procurement, benefiting institutions in the waste sector. The learning capacity process is still ongoing and even if, in fact, no other incinerators were set up in Portugal after the construction of the Valorsul facilities in Northern Lisbon, the governmental Financial Institute of Regional Development started to export the new expertise acquired, by assisting EU candidate countries through the EC’s Twinning Instrument.
In the transport sector, there is evidence that some learning effects took place. For example, the M1 which was the second motorway to be built in Ireland led the way to a series of positive developments like the establishment of the National Roads Agency NRA as a “conduit” through which learning took place. The M1 was thus a testing bed for contractual models which led to the progressive adoption of Design and Build contracts. It is also under the project influence that the Planning Appeals Board acquired a greater role in planning at the expense of local authorities (and the government ministry), bringing about the de‐politicisation of the planning process. Learning was also significant for the other motorway under review. Egnatia paved the way for the improvement of the management of large infrastructures. The establishment of Egnatia Odos was a considerable institutional innovation which was decisive in the case of Egnatia. Unfortunately, the model was not consistently replicated (e.g. in the case of other motorways like PATHE) which suggests limitations in the learning process. In Madrid too, the role of the Regional Consortium of Madrid Transport (CTRM), a metropolitan transport agency with strong participation by local authorities was important, but contrary to the Greek case, this consortium model was replicated.
Figure 3.13 BEYOND A PROJECT: NEW MANAGEMENT MODELS
Note: a) NRA takes the responsibility for managing and funding the procurement and maintenance of new national roads in Ireland; b) The public company Valorsul introduces a modern and functioning waste management system in the metropolitan area of Northern Lisbon c) Egnatia Odos – the first state owned company governed by private rules – takes the responsibility for the design, construction and management of the Egnatia motorway in Greece.
In the case of Gioia Tauro, no such effects materialised, because little or no linkages took place with the socio‐economic / institutional context which prevented spill over. The Mediterranean Corridor is the only example of a project which recorded negative effects on institutional

40
quality. By feeding hostility and friction among different stakeholders, the project contributed to making investment planning in the rail infrastructure sector particularly unstable. In turn, this prevented identification of the best project option to implement to maximise the demand for rail transport.
The contrast between learning effects obtained in the two Irish projects tends to confirm the hypothesis according to which authorities at national level are more receptive and better positioned to take advantage of the learning opportunities offered by large investment projects. While environment in general and waste water treatment in particular are in the hands of local or regional authorities, in the field of road transport, operational and management authorities are at national level (e.g. Planning Appeals Board as far as planning is concerned). In the latter case, learning effects are more likely to take place; they were limited in the former case. Moreover, the fact that environmental projects are more location‐specific and generally not part of wider networks and investment plans (unlike transport projects) offers limited opportunity for comparisons with benchmarks, and as such for triggering institutionalised learning mechanisms.
Findings Institutional learning effects triggered by investment projects are low compared to other effects. They are even lower for environment projects where they generally do not generate spillover. A possible explanation concerning the specific case of projects in the environment sector compared to counterparts in the transport sector is that the former primarily involve local or regional actors insufficiently prepared to take advantage of the learning opportunities offered by these projects. By contrast, transport projects are generally managed at national level where institutional capabilities are stronger, and they are more likely to be included in wider investment programmes where they can take advantage of some forms of institutionalised learning mechanisms
3.3.5 Social happiness In the case studies, social happiness effects are described as a residual category which addresses all remaining effects on quality of life not covered in the previous dimensions. These effects appear to be very variable with no real difference between environment and transport projects. In a large majority of cases, they are positive.
Social satisfaction or dissatisfaction can take place in reference to expectations68. When this is the case, as in Palermo and Gioia Tauro, effects are of a large magnitude. In Palermo, thanks to the choice of prioritising the quality (continuity) of service delivery, even if at the expense of positive environmental effects, there was very high public satisfaction among users, certainly also due to the unexpected success of a public endeavour. Conversely, in Gioia Tauro, expectations in terms of local development were so high and results so disappointing that this created deep resentment among local stakeholders.
68 Kahneman and Tversky (1979) developed a model describing how individual choices are affected by expectations, and, in particular, how choices between alternatives that involve risk are taken. According to this theory, called “Prospect theory”, people make decisions based on the potential value of losses and gains rather than the final outcome.

41
Figure 3.14 SOCIAL HAPPINESS EFFECTS AT A GLANCE
Note: The graph shows the score recorded by each project in relation to the social happiness effects. The meaning of each score (±5) is presented in Table 2.3 of this report. Source: Authors
In other cases, social (dis)satisfaction is related to “objective” factors, and the intensity of the effects lower. For example, the introduction of tolls for the two motorways reviewed had negative impacts on social happiness, partially counterbalancing general satisfaction arising from factors such as increased leisure opportunities, civic pride, etc. In the M1 case, it is not clear how decisive this dissatisfaction was, while in the Egnatia case it had important consequences since it resulted in the delayed introduction of tolls and consequent financial losses. The long delays in the MEDCORR’s implementation generated widespread feelings of frustration among the public, thus limiting the satisfaction regarding the new infrastructure. In the case of the two waste water treatment plants, satisfaction was rather limited by shortcomings intrinsic to the projects’ operations (odour problems in the Dublin case, under‐capacity of the Lagarès plant in the Ría de Vigo case).
When measures are taken to purposely alter the perception of projects by the population, effects are magnified. In this respect, the two solid waste treatment projects in Galicia and Portugal are interesting to contrast the role played by awareness‐raising activities and campaigns. Both projects “objectively” contributed to citizen’s quality of life through the elimination of landfills and their replacement with green areas, but they both also had to deal with the necessity of “selling” the choice of the incinerator technology. While awareness‐raising activities positively contributed to the satisfaction associated with the latter project, they were (at least initially) a negative factor in the former case. For Egnatia too, pressure from environmental organisations played a role in limiting the positive perception of the project.
It is worth stressing that the level of satisfaction (in fact, especially of dissatisfaction) is important not only because it contributes to determining overall project performance in static terms, but also because it can have an influence on project functioning and achievements in dynamic terms. For example, in the Sogama / Valorsul cases, social acceptance is an important issue since it may have an influence on the very functioning of the projects by making possible
0
+5+4+3+2+1
‐5‐4‐3‐2‐1 Dublin waste water treatment
Port of Gioia Tauro
Madrid Metro LineValorsul solid waste treatment
Egnatia MotorwaySogama solid waste treatment
Palermo Water Supply System
M1 motorwayMediterranean CorridorVigo waste water treatment

42
better waste separation with regard to recycling and composting, or influencing the construction of other plants (e.g. a new incinerator plant in the Sogama case). Also, the perception of Gioia Tauro is an important factor likely to influence future directions taken by the project at the difficult junction in which the project is69.
Figure 3.15 SOCIAL ACCEPTANCE
Note: a) Egnatia Road Users refusing to pay toll70; b) Population of Palermo municipality demanding continuity in the water service supply71 c) Boyne Bridge as an iconic image for Drogheda and Co. Louth in Ireland72.
When social dissatisfaction is not expressed by citizens or users but is “captured” by organised vested / localised interests, the effects on the project can be even greater and immediate. Local stakeholders can indeed become organised to demand specific benefits from the project (e.g. to obtain the construction of facilities all across the territory so as to share the burden of having a solid waste treatment plant in their territory, as in Valorsul, or to obtain one or several additional stop(s) in the path of a train or metro in Madrid or MEDCORR). In these cases, there is a trade‐off between social satisfaction and profitability, efficiency or positive environmental effects.
Overall, social happiness seems somewhat disconnected from other areas of performance. It is sometimes the subject of a trade‐off in the sense that positive effects are obtained at the expense of performance in other dimensions (such as for the Valorsul and Madrid projects).
Findings Social happiness effects vary widely from project to project. They can depend on more or less objective factors. When they take place in reference to expectations, they are of larger magnitude than when they result from tangible factors (e.g., delays, the introduction of tolls, etc.). Social happiness is barely related to project performance along other dimensions but it can be influenced by proactive measures (e.g., awareness campaigns). It can also be influenced by organised forms of expression (vested interest) and has, in this case, far‐reaching consequences for project constituent features (e.g., design). Overall, social happiness is an important category of effects which have an important influence on features and further developments of the projects.
69 At present the port is going through a period of economic difficulties, due to the world economic crisis and competitiveness problems, which have led a number of clients to choose other ports. 70 Source: To Vima, Dec. 31, 2010. 71 Source: La Repubblica.it 72 Source: http://en.wikipedia.org/wiki/File:Boyne_Bridge,Belfast,Ireland.jpg.

43
3.4 TEMPORAL DYNAMICS OF EFFECTS A cross‐project review allows us also to gain an idea of the degree of stabilisation of the effects, a snapshot of which is provided in Figure 3.16 below. Overall, the majority of effects appears to have already stabilised, either in the short (i.e. from 1 to 5 years after project completion) or in the long run (more than 6 years after project completion). A sectorally disaggregated analysis allows one, more specifically, to highlight that for transport projects more time is generally needed for the effects to stabilise.
Figure 3.16 TEMPORAL DYNAMICS OF EFFECTS BY SECTOR
Source: Authors
A further analysis disaggregated by type of effects (Figures 3.17 and 3.18) shows that direct economic growth is in general the category for which a majority of effects have not yet stabilised. On the face of it, endogenous dynamics effects have generally stabilised in the long run, across projects in both sectors. The Egnatia project is one exception which recorded strong endogenous growth effects that stabilised in the short run (related to the establishment of Egnatia Odos).
21%
40%
39%
Transport
Stabilised in the short term
Stabilised in the long term
Not stabilised yet
40%
27%
33%
Environment
Stabilised in the short term
Stabilised in the long term
Not stabilised yet

44
Figure 3.17 TEMPORAL DYNAMICS OF EFFECTS ‐ TRANSPORT PROJECTS
Source: Authors
Figure 3.18 TEMPORAL DYNAMICS OF EFFECTS – ENVIRONMENT PROJECTS
Source: Authors
Environment projects in particular are characterised by effects in terms of direct growth that are yet to stabilise. Interestingly, the same goes as far as environmental effects are concerned.73 In fact, future developments such as further investments or behavioural improvements are often expected to have an additional positive effect (e.g., when adequate capacity is achieved and a long sea outfall to remove effluent from sensitive waters is installed in the Dublin case, when the under capacity of the Lagares plant is resolved in the Ría de Vigo case, or when / if better waste sorting improving recycling rates take place in both the Sogama and Valorsul cases– see Box 3.1 at the end of the Section).
73 The only exception is Palermo.
0
1
2
3
4
5
Num
ber o
f projects
Not stabilisedyet
Stabilised in thelong term
Stabilised in theshort term
0
1
2
3
4
5
Num
ber o
f projects
Not stabilisedyet
Stabilised in thelong term
Stabilised in theshort term

45
For transport projects too, direct growth effects have not always stabilised. But unlike environment projects, in just one case (Egnatia motorway), this is due to expected future positive developments (links with North‐South routes). In two other cases, the reason has rather to do with uncertainties about the projects (the Port of Gioia Tauro at a difficult juncture and the Mediterranean Corridor which is expected to be included in the TEN‐T priority list for the 2014‐2020 period). Finally, for the M1 and Madrid Metro Line, effects stabilised in the long run, after having recorded immediate strong positive effects (ramp up effects). As far as territorial cohesion effects are concerned, they stabilised more homogenously in the long run. The exception is the Egnatia motorway, where such effects could still grow.
Effects on institutional quality, which are marginal for all the projects, tended to stabilise in the short run for environment projects, and in the long run for transport projects.
Finally, social happiness is an effect that has temporal horizons patterns that are essentially project‐specific:
• In Gioia Tauro, effects have not stabilised. People in Calabria moved from initial enthusiasm to frustration over the lack of effects on local development. Much will depend on the future of the port. For the Mediterranean Corridor project too, satisfaction with the new infrastructures and high quality trains gave way to frustration and lack of confidence regarding the future.
• In the cases of M1 and Madrid Metro Line, positive effects on social happiness materialised and stabilised in the short run. The same goes for the Palermo project with even higher level of satisfaction.
• In the cases of Egnatia and Sogama, impacts have been mixed and may not have stabilised yet. In the former case, much will depend on the future level of toll while in the latter case, it depends on whether current deficiencies (under capacity) will be resolved.
• By contrast, in the case of Valorsul, initial opposition to the project was effectively counterbalanced by awareness campaigns which achieved public consensus.
• In the case of Ría de Vigo, the perception of benefits of the project can potentially increase if the problems of the Lagares plant are solved. In Dublin too, the odour problem created a negative short‐term localised impact which faded as the problem was resolved; further positive impacts may be experienced thanks to future investments.
In general, the fact that some effects are considered not to be stabilised because planned investments are expected to improve performance represents a challenge as far as the definition of the project boundaries is concerned, and beyond, for the assessment of the project.

46
This is apparent, for example, by looking at the trend over time in the discounted net cashflows accounted for the calculation of the ENPV in the Cost‐Benefit Analysis of the projects (shown below). These show, as expected, non‐linearity during the early years, due to construction and project commissioning and start‐up. The situation does not start to normalize on average before the tenth year, when more stable cashflows appear. However, high levels of variation exist between projects. In addition, as explained above, planned future investments have the effect of keeping the project impacts in flux.
Figure 3.19 DISCOUNTED NET CASH FLOWS IN TRANSPORT PROJECTS (EUR THOUSAND)
Source: Authors
Figure 3.20 DISCOUNTED NET CASH FLOWS IN ENVIRONMENT PROJECTS (EUR THOUSAND)
Source: Authors
With respect to the transport sector (see Figure 3.19), the Egnatia motorway is characterized by huge costs throughout the first 15‐years period, as compared to the other projects.
‐1,200,000
‐1,000,000
‐800,000
‐600,000
‐400,000
‐200,000
0
200,000
400,000
600,000
800,000
1 2 3 4 5 6 7 8 9 10 11 12 13 14 15 16 17 18 19 20 21 22 23 24 25 26 27 28 29 30
Egnatia Motorway Metro Madrid Mediterranean Corridor M1 Gioia Tauro
‐250,000
‐200,000
‐150,000
‐100,000
‐50,000
0
50,000
100,000
1 2 3 4 5 6 7 8 9 10 11 12 13 14 15 16 17 18 19 20 21 22 23 24 25 26 27 28 29 30
Dublin Waste Water Treatment Lisbon SWM Ria de Vigo Sogama Palermo Water Supply

47
However, its forecast subsequent flows tend to stabilize at higher values with a radical jump in year 16 (i.e. when construction is completed), so that the ENVP in the end is positive. By contrast, in the Mediterranean Corridor, the first years’ outflows are not out‐weighed by the subsequent stable but low inflows, so that its final ENVP is negative.
With respect to the environment sector (see Figure 3.20 the projects presenting the largest outflows are Dublin waste water treatment74 and Sogama solid waste treatment, for which economic cashflows jump rapidly from highly negative to positive values. In general, however, the discounted cashflow trends of these projects are both less extreme in magnitude (i.e. they are less expensive) and less variable over the time horizon than the transport projects. The forecasted flows, in particular, tend to stabilize at positive values that are similar for all the environmental sector’s projects, with the ones related to Dublin slightly higher than the others. In the end, none of this sector’s ENVPs turns out to be negative.
An additional remark is worth making concerning the temporal dynamics of project effects, which could also affect the ENPVs. The materialisation and subsequent stabilisation of effects may depend on whether the project was implemented at the most suitable time or not. When investments are carried out at the most appropriate moment, the generated benefits are more likely to be maximised. This is the case, for example, of the Port of Gioia Tauro, which took advantage of the structural change occurring in maritime freight traffic at the beginning of the Nineties, i.e. increasing containerisation and demand for transhipment. The Port of Gioia Tauro at that time was the first transhipment port in the Mediterranean75 and this allowed it to immediately attract substantial demand, with positive economic effects.
This study can also suggest whether some projects were implemented too late, i.e. when the project demand was already in place but remained unsatisfied for a certain period, or too early, i.e. when demand was still insufficient. While there are no cases, among the reviewed ones, of projects which turned out to be financed and implemented too early, some considerations can be made regarding relatively late project implementation.
Although the need for the Egnatia and M1 motorway and the Palermo water supply improvement were well‐established, the projects were started only when the optimal conditions emerged, in terms of adequate financing (particularly for the motorway projects) and political and administrative renewal (in Palermo). By contrast, the need for solid waste and waste water treatment, although already existing, was probably not completely perceived by the population and/or public administration. Hence, the projects were started only when a Directive pushed for their implementation (in the case of waste water treatment projects) or when social and political awareness of the necessity to find a more sustainable solution to the waste management issue became strong enough.
74 The net cash flow compared to the counterfactual was considered. 75 Malta’s port was opened soon after it.

48
Box 3.1 EVIDENCE OF ADDITIONAL INVESTMENTS PLANNED AFTER PROJECT COMPLETION
• Port of Gioia Tauro. A Framework Programme Agreement signed in September 2010 by the main public parties under the auspices of the European Commission will provide EUR 450 million for additional investments in the next three years, with the aim of improving the efficiency and overall performance of the port, in particular by strengthening the railway connections, building a rail gateway within the port area and supporting logistics activities. The creation of an intermodal platform and the provision of new services linked to the port activities may increase the competitiveness of Gioia Tauro and stimulate demand.
• Mediterranean Corridor. Even when the initial project is completed (the doubling of the Vandellós‐Tarragona section is expected by 2013), additional investments are envisaged on the Valencia‐Barcelona railway line. The installation of dual gauge (polyvalent) sleepers and third rail along the entire Mediterranean Corridor has already started: the intervention’s goal is to make the line fully interoperable with the rest of the trans‐European network, by allowing both Iberian and international gauge rolling stock to use it. Additionally, a new High‐Speed Line has been planned between Castellón and Valencia, connected to the already existing Valencia‐Madrid High‐Speed Line. For these works, the Ministry of Public Works will invest about EUR 1 billion: works have not started yet, but they are expected to be completed by 2014. These investments aim to create capacity for freight traffic to grow, due to the shift of long‐distance passenger trains onto the new High‐Speed Line. Finally, in October 2011 the Mediterranean Corridor was included in the provisional list of TEN‐T Priority Projects to be financed in the 2014‐2020 programming period. If the MEDCORR is confirmed as a priority project, additional financial resources will be available to transform the Corridor into a gateway for both passengers and freight to central Europe by 2030.
• Dublin Waste Water Treatment. A further EUR 147.3 million76 is to be spent between now and 2015 to increase capacity and make the Ringsend plant fully compliant with the revision of the Directive 91/271/EEC, reflecting the designation of the Liffey estuary as a sensitive water body requiring full tertiary treatment: in order to comply with the Directive, a 9 km underwater tunnel from the Ringsend plant will be built to discharge the treated wastewater beyond the sensitive waters area.
• Integrated environmental regeneration of Ría de Vigo. In order to meet the shellfish water Directive, a new plant in Vigo has been designing in 2009 by AcuaNorte77. The project involves an investment of about EUR 170 million, which may be co‐financed by Structural Funds. The new Lagares plant is expected to release water that complies with all the current limits of contamination and, in particular, it should solve the existing contamination problems of the Ría related to the higher volume of water arriving at the plant during rainy periods.
• Urban solid waste management in Galicia. The Galician Government, in the plan for Municipal Solid Waste management 2010‐2020, has developed a differentiated strategy to address the weaknesses affecting the current waste management system: 1) Some of the Sogama facilities will be modified in order to allow the separation of light packaging improperly included in non‐recyclable waste, thus increasing the amount of recyclable materials recovered (costing EUR 8 million); 2) construction of new composting plants throughout the region; 3) construction of a new incinerator plant in the South of Galicia (costing approximately EUR 240‐260 million), to allow for the treatment and valorisation of the entire amount of mixed and non‐recyclable waste generated; 4) implementation of a communication programme involving the launch of a set of awareness campaigns to improve waste sorting by households.
Source: Authors
76 2011 prices, VAT exclusive. 77 The National Company of the Spanish North Basin Waters.

49
Findings The majority of effects generated by the projects reviewed have already stabilised, mostly in the short‐term for environmental projects and in the long‐term for transport projects. Some effects are not yet stabilised and they are particularly related to transport projects and, more generally, to projects for which additional future investments or behavioural changes (e.g. in citizens’ solid waste sorting) are expected to influence current project performance. From the perspective of the different categories of effects, impacts on direct economic growth require more time to reach a stable situation; the same applies to environmental effects generated by environment projects.
3.5 OVERALL ASSESSMENT The overall assessment of a single project is complex and the issue is best tackled in the individual case study reports78. Here, it is possible to add a few remarks on common developments and unexpected features that a horizontal reading highlights.
First, there are trends such as the predominance of direct welfare and economic growth, the positive yet reduced endogenous dynamics effects and the relatively limited effects in terms of institutional learning that are common to practically all projects. The argument put forward to account for the relatively disappointing effects as far as institutional learning is concerned has to do with the fact that major infrastructural projects, particularly in the environment sector, are big but not always embedded in wider plans. As such, they offer little opportunity to trigger learning mechanisms within institutions.
There also appear to be sectoral variations. As expected, environment projects record positive environmental effects – with the exception of Palermo. The corresponding link between transport projects and effects in terms of territorial cohesion is also verified ‐ with the exception of Gioia Tauro.79 Also, one recurrent feature of environment projects, for example, is the fact that they often depend on further investments or behavioural changes to have their effects reach their full potential, in terms of both direct welfare and economic growth and environmental effects. In general, if environment projects tend to record lower levels of performance across the dimensions reviewed, it is argued that this is perhaps because they are generally managed by local or regional authorities not necessarily sufficiently equipped to fully take advantage of them. This compares to transport projects which are more likely to be included in larger investment programmes and to be managed by national authorities with higher capabilities.
Within sectors, there are specific stories related to the typology of investment considered. Clearly, each “twinset” of projects is characterised by common features. For example, the two solid waste treatment plants produced relevant direct growth effects in terms of business opportunities whereas the effects of the two waste water treatment plants were
78 Available on the website http://ec.europa.eu/regional_policy/information/evaluations/archives_1989_1999_en.cfm#1. 79 The two exceptions, Palermo water supply and the Port of Gioia Tauro, are ascribable to different explanatory interpretations: while in the case of Palermo the low score as far as environmental effects are concerned is due to a failure, in the case of Gioia Tauro, the low score for territorial cohesion is because the latter was not a core priority.

50
comparatively more important in terms of the population’s direct welfare. This is also confirmed by the specific stories of the Palermo and Gioia Tauro projects.
Of particular relevance, are the apparently very project‐specific dynamics of social happiness. This category of effects was initially defined to be residual, but it turned out to have quite an important role in the overall assessment of single projects. In differing instances, it appears to be an intervening variable affecting not only the current level of performance, but also future developments of the projects. What is more, the level of social happiness seems to be somewhat disconnected from performance along other dimensions. In particular, it is as if there were no direct connections between the level of social happiness and environmental effects recorded by environment projects, or effects in terms of territorial cohesion for transport projects. On the contrary, in differing cases, there is a disconnection, and even a trade‐off between social happiness and other dimensions of project performance. This can happen because social happiness is in part “captured” by vested interests (e.g. Valorsul80), because an apparently circumscribed event durably biases the population’s perception of the project (e.g. odour problem in the Dublin case) or simply because expectations are not congruent with the main dimensions of the effects analysed (Gioia Tauro).
80 Responding to the needs of stakeholders brought about detrimental effects in terms of efficiency of the overall plant, and reduced positive environmental impacts.

51
4 PERFORMANCE DRIVERS 4.1 INTRODUCTION Having analysed the development effects generated by the ten projects assessed, this Section deals with the mechanisms that can explain why and how certain effects were generated and others were not, and why some of them have already stabilised and others have not. The causal chain leading to certain more or less successful project outcomes will be identified, so as to answer the ToR Evaluation Question:
“How are these long‐term contributions generated for different types of investment in the field of environment and transport infrastructure, i.e., what is the causal chain between certain short‐term socio‐economic returns and long‐term returns from investment?”
Figures 4.1 and 4.2 provide a synthetic overview of the median contribution given by key determinant factors identified in the Conceptual Framework (see Section 2.1): positive and negative scores indicate respectively that the given factor positively or negatively affected project performance.
Figure 4.1 THE DEVELOPMENT DRIVERS AT A GLANCE ‐ TRANSPORT PROJECTS
Note: The graph shows the median scores recorded and their degree of variability (from the minimum to the maximum score recorded) for the projects by each key determinant factor. The meaning of each score (±5) is presented in Table 2.3 of this report. Source: Authors
‐5.0‐4.0‐3.0‐2.0‐1.00.01.02.03.04.05.0
Median value
Min
Max

52
Figure 4.2 THE DEVELOPMENT DRIVERS AT A GLANCE ‐ ENVIRONMENT PROJECTS
Note: The graph shows the median scores recorded and their degree of variability (from the minimum to the maximum score recorded) for the projects by each key determinant factor. The meaning of each score (±5) is presented in Table 2.3 of this report. Source: Authors
While more details on the main drivers are included in the following Section, some general remarks can be gathered from these graphs:
• some determinant factors (project design and managerial response) generally contribute positively to the projects, regardless of the sector of intervention; another had mostly negative effects on project outcomes (project governance);
• the infrastructural sector matters in particular as far as appropriateness to the context is concerned, with positive median scores recorded for both environment and transport projects, but with some very negative scores in the latter sector: as a result of this wider variability, the average score for transport projects is lower than for environment ones81;
• the extent of score variability is generally very wide with one exception: appropriateness to the context records very positive results for all the environment projects.
4.2 APPROPRIATENESS TO CONTEXT The relationship between a project and its “context” is multifaceted and multidirectional. Different factors affect the projects reviewed to different extents and in different ways. In turn, some projects influenced their environment in some way.
81 1.8 in the transport sector against 4.2 in the environment sector.
‐5.0‐4.0‐3.0‐2.0‐1.00.01.02.03.04.05.0
Median value
Min
Max
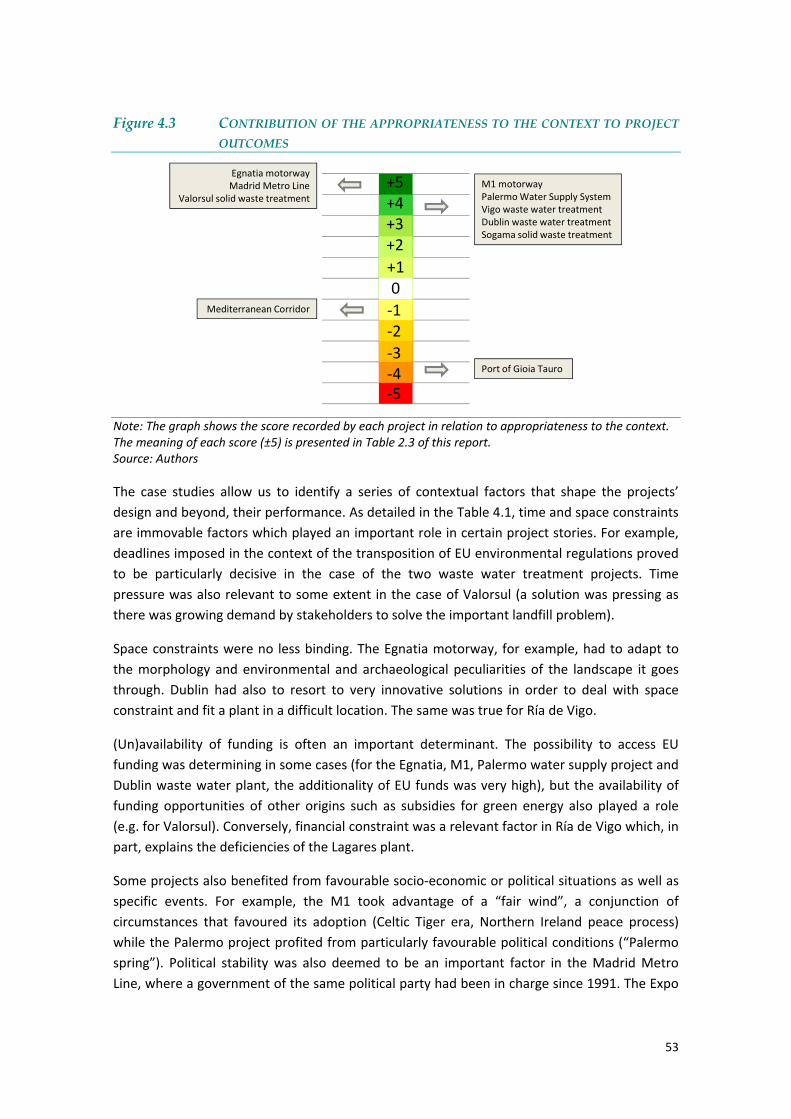
53
Figure 4.3 CONTRIBUTION OF THE APPROPRIATENESS TO THE CONTEXT TO PROJECT OUTCOMES
Note: The graph shows the score recorded by each project in relation to appropriateness to the context. The meaning of each score (±5) is presented in Table 2.3 of this report. Source: Authors
The case studies allow us to identify a series of contextual factors that shape the projects’ design and beyond, their performance. As detailed in the Table 4.1, time and space constraints are immovable factors which played an important role in certain project stories. For example, deadlines imposed in the context of the transposition of EU environmental regulations proved to be particularly decisive in the case of the two waste water treatment projects. Time pressure was also relevant to some extent in the case of Valorsul (a solution was pressing as there was growing demand by stakeholders to solve the important landfill problem).
Space constraints were no less binding. The Egnatia motorway, for example, had to adapt to the morphology and environmental and archaeological peculiarities of the landscape it goes through. Dublin had also to resort to very innovative solutions in order to deal with space constraint and fit a plant in a difficult location. The same was true for Ría de Vigo.
(Un)availability of funding is often an important determinant. The possibility to access EU funding was determining in some cases (for the Egnatia, M1, Palermo water supply project and Dublin waste water plant, the additionality of EU funds was very high), but the availability of funding opportunities of other origins such as subsidies for green energy also played a role (e.g. for Valorsul). Conversely, financial constraint was a relevant factor in Ría de Vigo which, in part, explains the deficiencies of the Lagares plant.
Some projects also benefited from favourable socio‐economic or political situations as well as specific events. For example, the M1 took advantage of a “fair wind”, a conjunction of circumstances that favoured its adoption (Celtic Tiger era, Northern Ireland peace process) while the Palermo project profited from particularly favourable political conditions (“Palermo spring”). Political stability was also deemed to be an important factor in the Madrid Metro Line, where a government of the same political party had been in charge since 1991. The Expo
0
+5+4+3+2+1
‐5‐4‐3‐2‐1
Port of Gioia Tauro
M1 motorwayPalermo Water Supply System Vigo waste water treatmentDublin waste water treatmentSogama solid waste treatment
Egnatia motorwayMadrid Metro Line
Valorsul solid waste treatment
Mediterranean Corridor

54
exhibition was one factor favouring the implementation of the Valorsul plant in Northern Lisbon.
The projects often provided sophisticated responses adapted to specific socio‐economic developments or institutional structures. The Madrid Metro Line presented a highly appropriate response to the expanding Madrid area and resulting mobility needs, as well as to growing air traffic at Barajas airport and to the needs of the Fair’s visitors. The integrated solution involving eight municipalities adopted in the Ría de Vigo case was also the best option given the institutional context of the project (with different municipalities discharging waste water into the same Ría). The solid waste treatment plant in Galicia was adapted to low population density thanks to the establishment of intermediate transfer stations.
Finally, almost all the projects were adapted to their context in the sense that they provided appropriate solutions to population needs and demand. The two motorways reviewed both responded to needs in terms of increased capacity and safety for the M1 and faster connection for Egnatia. The Madrid Metro Line solved mobility issues in the Madrid area and the Palermo and the two waste water treatment plants were adequate solutions to problems in water distribution and treatment. The two solid waste treatment plants in Galicia and Portugal facilitated dealing with severe waste management problems (the presence of illegal landfills).
The Mediterranean Corridor also appears well adapted to its context, considering the needs of long‐distance passengers who benefited from more reliable and faster services between Valencia and Barcelona. However, by focusing only on this demand segment, the project brought no advantages for freight demand, which is potentially very high. Since freight traffic was left out the scope of the initial investment, the project cannot be considered fully appropriate to its context.
On some occasions, needs and demand were not those of the general population or of users, but of specific interest groups. As a result, some of the constituting features characterising the projects were determined by particular or local interests with varying implications for performance and effects produced. Thus, plants were dispersed in the Valorsul case with resulting negative environmental effects and project efficiency, one stop was added in the Madrid Metro Line somewhat increasing travel times, the route of the Mediterranean Corridor was changed in different sections, etc. It is worth noting that apparently “objective” geological / archaeological / environmental features can in fact be mediated or revealed by lobbying groups or NGOs who give them their relevance (e.g. in the case of Egnatia).

55
Table 4.1 SPACE AND TIME CONSTRAINTS Projects Space Constraint Time Constraint
The Egnatia Motorway
Problems of a geological and wildlife nature as well as archaeological discoveries have been faced during the implementation of the project. These required specific studies and the use of sophisticated design methods and, in many cases, they justified a change in the motorway alignment.
Dublin Waste Water Treatment
The project used a number of innovative technologies to cater for the large pollution load on a constrained site (15 hectares). Indeed, it was decided to direct all of Dublin’s wastewater for treatment to a single constrained site, at the centre of Dublin Bay and the Liffey Estuary.
In 1990 the Irish government published the Environmental Action Programme, a comprehensive programme to deal with management of the environment, which contains the provision to ban the dumping of raw sewage in Irish coastal waters in major urban areas by the end of 2000, in line with Directive 91/271/EEC.
Integrated environmental regeneration of Ría de Vigo
The high population density of Vigo imposed space limitations on the location of the infrastructures. The solutions adopted to cope with this problem were: building chemical plants that take up less space than biological ones; adapting the infrastructure to small sections of land (e.g. Lagares plant); building the plants on artificial platforms over the sea (e.g. Teis and Moaña plants). Also for the building of the new Lagares plant, the space constraint has been taken into account and to cope with this some of the new facilities will be built underground.
Directive 91/271/EEC on urban waste water treatment required the municipalities of Ría de Vigo to install secondary‐type treatment facilities for urban waste waters by 31st December 2000. Moreover, the Directive 79/923/EEC required the fulfilment of obligations on shellfish waters by 30 October 1987.
Integrated Solid Waste Management in northern Lisbon
The National Strategic Plan for Municipal Solid Waste 1997‐2006 required the closure of all illegal dumps in Portugal by 2000 and two reduction targets for MSW generation, namely by 2.5% for the period 1995‐2000 and 5% for 2000‐2005. Additionally, Directive 94/62/EEC on packaging and packaging waste, transposed by Member States by 30 June 1996, set specific targets on the recycling share of certain materials.
Urban solid waste management in Galicia
Directive 94/62/EEC on packaging and packaging waste, transposed by Member States by 30 June 1996, set specific targets on the recycling share of certain materials.
Source: Authors

56
Overall, to refer to Hirschman’s terminology, the investment projects reviewed are more “trait takers” than “trait makers”. To some extent, the M1 was a trait maker inasmuch as it was one of the first motorways in Ireland and it contributed to the introduction of new institutional structures. The Mediterranean Corridor managed to change the behaviour of long‐distance travellers by diverting most of them from air and road transport to railway. Egnatia too was at the origin of changes in the regulatory framework for public management of large infrastructure. But the other projects had little or no effects on their environment. Even the successful Madrid Metro Line was more the consequences of social, strategic and economic circumstances bringing about a modal shift rather than creating new demand.
A contrario, this is exemplified by the case of projects which took place in not so favourable an environment and which did not manage to turn the latter to their advantage. The Region of Galicia for example was not able to mitigate the uncertainty deriving from the autonomy of municipalities which hampered the Sogama project’s forecasting capacity. It also proved to be difficult for both the Sogama and Valorsul projects to trigger learning on how to carry out better waste separation, despite awareness campaigns. Perhaps the greatest example is the port of Gioia Tauro. There was a strong disconnect between the project, its socio‐economic context and the EU and national authorities’ objective of fostering broader local development. The point is that the project was not able to transcend these objective difficulties through a comprehensive integrated approach including, for example, the development of activities in the logistics sector. This would have required the mobilisation of different stakeholders, something the governance structure failed to do.
Findings Context influenced in many different ways the projects reviewed. In general the latter are “trait‐takers” rather than “trait‐makers”. In just a few cases, projects marginally influenced their environment. The projects were determined to varying extents by time, space and budgetary constraints. In particular, deadlines imposed by Regulations applying in the cases of environment projects (waste water treatment) were especially binding. The projects also took advantage of different favourable socio‐economic and political factors and were generally adapted to local institutional features. They generally provided adapted solutions to population or users' needs. On various occasions, they also had to bend to specific or local vested interests.
4.3 PROJECT DESIGN AND FINANCIAL SUSTAINABILITY
4.3.1 Project Design Project design appears to be a weak point of environment projects. Different factors affected the adoption of optimal designs.
Budget and time constraints played a significant role in the definition of the design of a number of environment projects. In Ría de Vigo, both time and budget constraints were an issue influencing design. The little time available to respect the deadline of 31 December 2000 (imposed by EU Directive 91/271/EEC) together with budget constraints induced local managers to overlook a potential source of risk (additional load due to rain), and to neglect

57
other important EU Directives (which would have required tertiary treatment). As a result, there was a deficiency in the design of a couple of minor plants (lack of tertiary treatment during the initial years of operation) and especially of the main Lagares plant (lack of tertiary treatment and under‐capacity). The Dublin waste water treatment plant’s design was mostly affected by time constraint. The decision to locate the plant on a very constrained site was more due to time pressure deriving from the necessity to respect the deadline imposed by the EU Directive82 than social pressure (see below). As a result a very innovative technology was chosen which caused teething problems such as bad odour (compromising the public perception of the project) and which, most importantly, contributed to the under capacity of the plant.
The case of Valorsul illustrates the influence of specific interests over the design. Agreement about the technology chosen (incineration) was reached, but the dispersion of facilities to satisfy municipalities’ interest reduced the overall benefits of the project in economic and environmental terms. The construction of an Anaerobic Digestion Plant was also directed at responding to NGOs concerns.
In four cases, design difficulties were due to forecasting mistakes. The design of the Palermo and of the Mediterranean Corridor projects suffered from an overestimation of water demand due to a major forecasting error in the former, and inaccurate analysis of all the demand segments (short, medium and long distance passengers and freight traffic) in the latter. The Dublin case also suffered from mistaken anticipations of the actual demand. With more damaging effects, Sogama’s design was characterised by under‐capacity deriving from the difficulty of forecasting municipalities’ demand (see Section 4.4).
Figure 4.4 CONTRIBUTION OF PROJECT DESIGN TO PROJECT OUTCOMES
Note: The graph shows the score recorded by each project in relation to project design. The meaning of each score (±5) is presented in Table 2.3 of this report. Source: Authors
82 Directive 91/271/EEC on Urban Waste Water Treatment.
0
+5+4+3+2+1
‐5‐4‐3‐2‐1
Dublin waste water treatmentMediterranean Corridor
Port of Gioia Tauro
Madrid Metro Line
Vigo waste water treatment
M1 motorwayEgnatia MotorwayPalermo Water Supply System Sogama solid waste treatment
Valorsul solid waste treatment

58
In general, designs failed to include a degree of flexibility enabling them to adapt to unforeseen events or to palliate design deficiency. For example, although the best technology was chosen for Sogama (Circulating Fluidised Bed combustion through public tender), the design was made inflexible by the strong opposition from municipalities regarding the infrastructure’s location and their uncertainty ‐ not minimised by any actions on the part of the regional government ‐ regarding whether or not to join the Sogama waste management system: these factors made it impossible to set ex‐ante the exact required capacity of the incinerator plant. Valorsul integrated some element of flexibility (with a fourth line to increase incineration capacity) but it was one of the few plants reviewed to be characterised by overcapacity, therefore not needing it. The design of the Palermo project was also insufficiently flexible. Overall, the environment projects reviewed were, in Hirschman’s words, characterised more by “discipline” than “latitude”83.
On the face of it, design of transport projects tends to show more positive features. Two projects stand out in this respect: the port of Gioia Tauro and the Madrid Metro Line. First, the two project designs well reflected the grander vision underpinning them. The design of Gioia Tauro was determined by the visionary intuition of a private entrepreneur with a deep understanding of the terms of competitiveness at work in the transhipment sector. As to the design of the Madrid Metro Line, it owes much to a combined vision of local and long distance needs. Additionally, while Gioia Tauro took advantage of an existing infrastructure complemented by all the necessary modern equipment, the design of the Madrid Metro Line was able to deal with many challenges of a geotechnical nature. The latter was also characterised by innovations such as a new approach to interchange. The design of the Madrid Metro Line suffered from some limitations which however did not alter the overall positive features: overcapacity of the interchange (governed more by aesthetic than functional criteria) and the introduction of an additional stop at Pinar del Rey which somewhat increased travel time.
Contrary to the cases of Gioia Tauro and Madrid Metro Line, the effectiveness of the MEDCORR design was limited by the absence of a coherent strategic vision.
The design of the two motorways reviewed faced some challenges in terms of flexibility that were successfully dealt with. The main difficulty with the design of the M1 motorway was related to the nature of the form of contract governing it (traditional civil contract tightly defining design) and its related inflexibility. This was a problem, for example, in implementing innovative solutions to deal with environmental or historic issues (more recently, the Design and Build model has been used, which offered more flexibility and succeeded in controlling costs). Also, the introduction of tolls implied some re‐design. As to Egnatia, it required specific engineering capacities and advanced technologies (accessible via the international engineering company incorporated within Egnatia Odos). Some forecasting mistakes were offset by the
83The project is considered ‘disciplined’ if particularly rigid and structured in such a way that any change to its design is particularly complex. By contrast, latitude is the characteristic of a project that permits the project planner and operator to mould it, or to let it ‘slip’, in one direction or another where necessary.

59
flexibility of the project design, which could also accommodate demands from environmental NGOs and archaeologists.
Overall, compared to the environment projects, in transport, the technical solutions were more straightforward and designs included a generally higher degree of flexibility.
Findings Project design is often a weak point of environment projects. These were adversely affected by budget and time constraints, forecasting mistakes (and resulting under capacity) as well as social pressures. Environment project design lacked the flexibility necessary to adjust to these deficiencies. On the face of it, transport projects (with the exception of the Mediterranean Corridor) are generally characterised by more efficient and flexible designs, reflecting the strategic vision underpinning them.
4.3.2 Financial sustainability In a CBA framework of analysis, the financial sustainability of a project is considered to be ensured if the net flow of cumulative generated cashflow is positive for all the years considered84. In other words, financial sustainability occurs when investment and operational cash outflow planned, including taxes, interests and loans reimbursement, are covered ex‐ante with adequate incoming cashflow over a given period of time. Incoming cashflow comprises any possible revenues from the sale of goods and services (they are “operating revenues” obtained for example from tariffs or tolls) and sources of financing (EC co‐funding and national / regional public contributions or private resources).
By this definition, financial sustainability is ensured for all the ten projects reviewed. Although it was not possible to systematically collect data for the net cashflow for each year and each project, no evidence was found that the projects had cashflow difficulties with consequences for their development: actually, there are no cases of projects whose construction had to be interrupted or delayed because they ran out of cash.
In addition, in relation to the specific question raised by the Terms of Reference as to whether the various sources of financing were able to cover the investment costs during the investment phase, Table 4.2 shows that in six cases, cost overruns occurred (see also Table 4.3) which were adequately covered by national public funds (except in the case of Gioia Tauro where the private operator increased its debt). In the remaining four projects, the envisaged sources of financing were adequate to cover investment costs over the time set. The contribution of EC co‐funding proved to be decisive in one case (Egnatia) where the investment would have not been possible without it. In the other cases, the contribution of EU co‐funding was critical in the sense that it generally enabled promoters to undertake more ambitious investments and earlier than otherwise planned.
84 European Commission, 2008a, p. 43.

60
Table 4.2 FINANCIAL SUSTAINABILITY Project Investment phase Operational phase Future
Port of Gioia Tauro
The sources of financing were appropriate to cover all the investment costs. However, because of administrative and political inefficiencies, in the first phase of the project start‐up considerable additional investments were undertaken by MCT, which became highly indebted. The increase in the financial exposure of the company was so significant that concerns were raised among shareholders.
The initial profitability of the transhipment project for MTC is now in question by the crisis of competitiveness at the port.
A Framework Programme Agreement signed by the main public parties under the auspices of the European Commission, is going to provide EUR 450 million for additional investments in the next three years, with the aim of improving the efficiency and overall performance of the port. This further investment could provide a fresh impetus to the competitiveness of the port.
M1 Motorway The sources of financing initially mobilised were not able to cover the investment costs since cost overruns occurred during the construction phase. They were due to increased inflation in the construction sector, the generous compensation for land acquisition and the discovery of a number of archaeological sites. The Irish public sector covered all the additional costs.
To ensure financial sustainability during the operational phase, a toll concession for part of the route was designed. Falling traffic volumes (from 2008) have meant reduced toll income; however, income should still be sufficient going forward.
No major future developments are envisaged, although some uncertainties about the future do exist, mainly around the impact of on‐going economic weakness on traffic volumes. However the possibility that the nearby M2 will be tolled at some point in the future might see some traffic diverted back to the M1.
Egnatia Motorway
The original alignment of the motorway was subjected to continuous revisions in the course of implementation; thus, cost overruns occurred. They were covered by additional financing provided by the Greek Government.
Although toll stations were included in the project design and were ready to implement in 2004, the introduction of tolls was delayed until 2010 because of political motives. This represented a missed profit for the operator, while operations and maintenance have been ensured through government funds.
The Egnatia motorway is expected to be operated and managed by the private sector. This will most likely result into an increase of the toll. However, there is still uncertainty about the concrete specification and the timing of the concession.
Madrid Metro Line – Access to Barajas Airport
The sources of financing were able to cover all the investment costs.
The revenues generated by the tariff are not enough per se to cover the project’s operating and maintenance costs. The financial sustainability of the project is assured by the degree of public subsidisation of the urban transport sector.
No significant changes to the current tariff setting are expected in the coming years.
Mediterranean Corridor
Due to continuous changes in the project design (particularly to the rail route), additional resources had to be mobilised in order to cover investment costs. These were covered through national public resources.
The operational revenues cover the operational and maintenance costs incurred by the railway operator (Renfe). Tariffs are considered adequate and their increase is not under discussion.
No significant changes to the current tariff settings are expected in the next years. Even in the future, tariffs are likely to allow the full recovery of operating costs.
Water Supply System in
Palermo
The sources of financing were able to cover all the investment costs. In fact, cost savings occurred, thanks to further adjustments during the design phase and cost reductions at the tendering stage.
The financial sustainability is ensured by tariffs on consumers. No significant changes to the current tariff settings are expected in the coming years.

61
Integrated Solid Waste Management in Northern Lisbon
The sources of financing were able to cover all the investment costs related to the construction of a sanitary landfill, the Waste‐to‐Energy plant, the material sorting facility and the bottom ash processing and recovery installation. Some cost overruns, covered by Valorsul, were recorded for the Anaerobic Digestion plant construction, due to technical problems encountered during testing.
Overall financial sustainability is assured through cross‐subsidisation: high electricity sales tariffs are granted by means of governmental subsidisation, while low gate fees are paid by municipalities.
No tariff increase is currently under discussion.
Urban solid waste management in Galicia
The sources of financing were able to cover the investment costs.
The financial sustainability of Sogama was assured by tariffs collected from municipalities and by the sale of energy. However, the increase in personnel costs recorded in the years after operations started, the fall in revenues from the sale of electricity produced, because of a decrease in energy prices, and the arrears that some municipalities are accumulating in paying treatment tariffs, are causing Sogama financial difficulties.
No tariff increase is currently under discussion, so financial sustainability of Sogama in the future is uncertain.
Integrated environmental regeneration of Ría de Vigo
The various sources of financing were able to cover the estimated investment costs and no cost overruns occurred.
The project’s financial sustainability has been secured during the operational phase, by means of municipal tariffs, which entirely cover the operating cost of treatment plants, and of a regional tax which provides for further resources to meet the future investments needs in the waste water treatment sector of Galicia.
Even in the future, operational revenues are expected to cover the operational cost of the project.
Dublin Waste Water Treatment
The sources of financing initially mobilised were not sufficient to cover all the investment costs since a cost overrun of approximately EUR 23 million occurred in the realisation of the underwater pipeline from Sutton in north Dublin to the Ringsend treatment plant. This additional funding was provided by the Irish public sector.
Because the capacity of the plant was wrongly designed, significant operational and odour problems occurred during the early years of the plant’s operations, which have imposed significant additional costs on Dublin City Council. Moreover, the total absence of water charges on households has made financial sustainability difficult to ensure.
A further EUR 147.3 million (2011 prices, VAT exclusive) is to be spent between now and 2015 to increase capacity and make the plant fully compliant with the Directive, reflecting the designation of the Liffey estuary as a sensitive water body requiring full tertiary treatment. Moreover, in the coming years it is planned to introduce metered household water charges. Therefore, financial sustainability is likely to be assured in the future.
Source: Authors

62
Finally, in the operational phase, Table 4.2 shows that the projects reviewed use different combinations of sources of financing and operating revenues to cover operating and maintenance costs. Three projects record an unmitigated success in imposing tariff as the main means to secure financial sustainability. They are: the Palermo project which relies on tariffs imposed on consumers85, Ría de Vigo where a tariff related to volumes consumed imposed by municipalities and a regional tax imposed by the Government of Galicia on final users cover both investments and operating / maintenance costs, and MEDCORR where operational revenues cover operational and maintenance costs.
In two other cases, operating revenues are obtained on the basis of tariffs or fees that are substantially subsidised. In the case of the Madrid Metro Line, the operator CRTM, is able to charge very low fees86 and ensure financial sustainability thanks to the fact that CRTM (and in fact the whole sector) is highly subsidised. Also the Valorsul project relies on cross‐subsidisation and the distorted (high) prices of energy sold and gate fees paid by municipalities (set very low so as to generate a modest surplus).
In the other cases, mechanisms to obtain operating revenues are in place, but problems arise that are external to the functioning of these mechanisms (related to political or economic difficulties, or a legacy from the past). For example, the M1 motorway partly ensures its financial sustainability thanks to a toll concession applying to part of the road, but the impact of the current economic crisis on traffic, and thus on operating revenues, is unknown. Similarly, prospects are indeterminate in the case of Egnatia, where the introduction of tolls was delayed until 2010 for political reasons and where the forthcoming privatisation of Egnatia Odos is expected to be accompanied by an increase in tolls.
Prospects are negative in the case of Sogama, which adopted a mechanism based on tariffs levied on municipalities (established so as to cover Sogama’s operating costs) and the sale of energy. However, the affordability problems faced by the municipalities (which have accumulated financial arrears with Sogama due to low taxes imposed on citizens) as well as the adverse evolution of the price of energy threatens this model. Evolution in related markets and demand are a source of concern for the Gioia Tauro project. Its future depends on important further public investments that will determine the ability of the project to withstand competition in the transhipment sector.
Finally, in the Dublin case, the operation of the waste water treatment plant was a burden for local authorities inasmuch as there was a total absence of water charges for private consumers (abolished in 1997 in contravention with the polluter pays principle87), while commercial and
85 Tariffs were introduced independently from the project. 86 Because of the participation of the private sector in the second phase of the construction of the Line, an additional charge on the usual Metro fare is applied to passengers heading to (or departing from) the airport. Yet the overall fare remains very low by international standards. 87According to the ”polluter pays” principle, stated in Directive 2004/35/EC, the operator whose activity has caused the environmental damage or the imminent threat of such damage is to be held financially liable. The objective of this principle is to induce operators to adopt measures and develop practices to minimise the risks of environmental damage so that their exposure to financial liabilities is reduced.

63
industrial customers were charged on a marginal cost basis. However, prospects are rather positive since the reintroduction of household water charges is planned in the near future.
Overall, there appear to be different possible combinations of operating revenues and sources of financing and different extents of recourse to public funding (either directly or through subsidisation of tariffs) during the operational phase. When operating revenues are the main source of financial sustainability, this augurs well for the long‐term financial self‐sufficiency of a project. However, the desirability or feasibility of this option is not automatic and additional considerations in terms for example of affordability and social cohesion must also be taken into account88. What is important is that an adequate and acceptable combination of operating revenues and sources of financing is decided sufficiently in advance (e.g., at design stage) to minimise the costs of later adjustments.
Findings The projects reviewed are financially sustainable in the sense that they were able to ensure positive net cashflow. During the investment phase, some projects incurred cost overruns which were covered through additional national public funding. In general EC co‐funding was decisive in allowing more ambitious investment to be implemented earlier than would otherwise be the case. During the operational phase, various combinations of operating revenues and sources of financing are mobilised. Operating and maintenance costs are covered through tariffs without the support of public funding for three projects (Palermo, Ría de Vigo and MEDCORR). In two other cases, financial sustainability is possible thanks to subsidised tariffs (Madrid Metro Line and Valorsul) while in the remaining cases, external adverse factors (recession, social acceptance, etc.) may affect the possibility of generating adequate levels of operating revenues.
4.4 FORECASTING CAPACITY Forecasting is a major sensitive area for all projects, possibly to a higher extent for environment projects. There are different items that the projects reviewed had difficulties in forecasting.
For a series of projects, forecasting demand for the projects’ services proved to be challenging (see Table 4.3). Depending on the cases, this has had more or less important implications for project performance. In Palermo, demand (per capita water consumption) was overestimated due to a major forecasting error as far as demographic trends are concerned. This was exacerbated by the fact that forecasts were prepared in accordance with the mandatory indication included in the Master Plan and were therefore rigid from a planning point of view. In Dublin too, forecasting was clearly problematic as the plant was characterised by undercapacity from the very beginning of operations, partly as a result of a miscalculation of the commercial load. Sogama also encountered a major difficulty in anticipating demand due to uncertainty on the part of municipalities, which postponed deciding whether or not to join the Sogama scheme until the very last moment. Forecasting was also a major deficiency of the MEDCORR project, which overvalued expected passenger traffic, while potential effects 88 For example an ex‐post evaluation on “Cost benefit analysis of selected environment projects” finds that affordability is an issue for some of the projects reviewed (European Commission, 2011b).

64
provided by freight demand were not explored. In the case of Valorsul, the limited capacity to precisely forecast demand led to a slight overcapacity, which however was not decisive in determining overall project performance. Finally, in the case of the M1, some forecasting issues created difficulties in particular in order to be able to set the appropriate tariff.
Figure 4.5 CONTRIBUTION OF FORECASTING CAPACITY TO PROJECT OUTCOMES
Note: The graph shows the score recorded by each project in relation to forecasting capacity. The meaning of each score (±5) is presented in Table 2.3 of this report. Source: Authors
It is worth noting that under / over capacity does not automatically result from forecasting deficiencies. Ría de Vigo is also characterised by undercapacity, but it seems not to be imputable to a forecasting error. As a matter of fact, it was known from the beginning that the Lagares plant would not be able to deal with additional sludge resulting from rainwater; it was rather a choice to proceed with the design because of time and budgetary constraints (see above). In the same vein, traffic was not underestimated in the Egnatia case. If there were risks arising from lower than anticipated revenues, it was therefore not due to forecasting mistakes but to political motives (resisting the imposition of tolls).
There is a series of more qualitative issues (or risks) that were unevenly forecasted – these are on the supply side to follow Hirschman’s categories. For example, apart from demand, forecasting deficiencies in the Dublin plant led to the failure to anticipate the designation of the Liffey Estuary as a sensitive water body. Consequences were significant for the operation of the plant with resulting additional remedial costs, as well as for future developments (if full tertiary treatment is required, this would further reduce capacity). Also the sophisticated and innovative technology caused teething problems which were difficult to anticipate. In Sogama, improper waste separation by citizens was also insufficiently anticipated. By contrast, in the case of Valorsul, public opposition was correctly anticipated and dealt with through communication efforts (public discussions, forums) and the setting up of a committee in charge of monitoring studies conducted in the context of the Environmental Impact Assessment process.
0
+5+4+3+2+1
‐5‐4‐3‐2‐1
Dublinwastewater treatment
Portof Gioia Tauro
Madrid Metro Line
Vigo wastewater treatment
M1 motorwayMediterraneanCorridorSogamasolidwaste treatment
Valorsulsolidwaste treatment
Palermo Water Supply System
EgnatiaMotorway

65
Table 4.3 COST AND TIME OVERRUNS AND OVER/UNDER CAPACITY Project Cost overruns Time overruns Overcapacity Undercapacity
Port of Gioia Tauro √ √
M1 motorway √ √
Egnatia Motorway √ √
Madrid Metro Line – Access to Barajas Airport
Mediterranean Corridor √ √ √
Water Supply System in
Palermo
√
Integrated Solid Waste Management in northern Lisbon
√
Urban solid waste management in Galicia
√
Integrated environmental regeneration of Ría de Vigo
√
Dublin Waste Water Treatment
√ √
Source: Authors
For the M1, geological and archaeological features were not sufficiently anticipated, with relevant consequences because of the traditional contract forms placing an onus on designer to accurately predict conditions on the ground. In the Egnatia case too some forecasting difficulties occurred with consequences in terms of cost (some environmental features were not accurately anticipated and required the taking of measures to minimise environmental impact, landslides, fencing, etc.).
Very favourable results were obtained in the case of the Madrid Metro Line. The project was characterised by optimal forecasting capacities with many control systems implemented during construction and operations, and the establishment of a “Security and Control Unit” (see Table 4.4 below). As a result the project achieved cost efficiency with unprecedented low costs per km (the only minor unexpected technical event was filtrations). The main unexpected qualitative event was the request to add one additional station at Pinar del Rey. Forecasting was also a strong asset of Gioia Tauro in the initial phase of the project.

66
Table 4.4 DECISIONS REGARDING THE WORKS PLANNED IN THE EXTENSION PLAN FOR METRO DE MADRID NETWORK (1995‐1999)
ITEM DESCRIPTION
Construction techniques
In order to ensure the safety of workers, urban structures and buildings, excavation methods with an open front (namely, the New Austrian Method and Mechanical Pre‐cut) were rejected.
Contract conditions
As the main aim was guaranteeing the quality and the safety of the project, none of the agreements could be under a fixed‐price contract. However, to foster timely development of the project, it was decided to deal with all the modifications that the project required as a priority.
Control systems A control system for the underground works was developed to measure precisely how the tunnel excavation was affecting nearby buildings and structures on the surface.
Designers and building contractors
The selection of designers and the building contractors was done carefully, taking into account the experience of the engineers each company put forward with regard to underground works in urban areas. The criteria for evaluation of tenders were based on 30% for the economic bid, 20% for the terms proposed and 50% for the technical conditions, team personnel and auxiliary means.
Project Managers A national or global company would not have been contracted as project manager. The project was managed by three civil engineers from the Community of Madrid whose expertise in similar works was a valuable asset.
Expert advice The best Spanish experts in tunnels, who had long experience of working with soft soils, were the Project Managers’ advisers as their experience in similar works was a guarantee for the project’s success. The tunnel boring machine manufacturer’s personnel also worked side‐by‐side with the Public Works technicians.
Source: Melis‐Maynar (2001)
Findings Forecasting is a sensitive area for all the projects. Some environment projects faced specific difficulties in anticipating demand, with repercussions for design (under capacity). Forecasting qualitative issues on the supply side was in general better ensured by both environment and transport projects. Forecasting deficiencies were mitigated through different remedial measures which sometimes entailed substantial additional costs. In one occasion (Madrid Metro Line), optimal forecasting capacity was obtained through a comprehensive system of controls implemented during construction and operation.
4.5 PROJECT GOVERNANCE As illustrated in Figure 4.6, governance of the projects reviewed had on average a negative effect on overall project performance. The cases reviewed show that there are in fact two essential ingredients of a governance structure and that it is not straightforward to have both of them right. These are: a clear distribution of responsibility between stakeholders in charge of project development, and effective modalities to integrate the views of other stakeholders (including users, beneficiaries, etc.). In both respects, some transport projects tended to perform better than environment projects.

67
Figure 4.6 CONTRIBUTION OF PROJECT GOVERNANCE TO PROJECT OUTCOMES
Note: The graph shows the score recorded by each project in relation to project governance. The meaning of each score (±5) is presented in Table 2.3 of this report. Source: Authors
Table 4.5 identifies the different patterns of distribution of responsibilities adopted in the projects reviewed, and the legal form they take (e.g. public private partnership, entrustment to a State‐owned company, joint venture, etc.). In this respect, the legal form chosen (which can vary depending on the phase of the project management cycle: design, construction, operation, maintenance) does not appear to be sufficient to guarantee a division of responsibilities in which the latter are clearly and effectively assigned. However, as illustrated below, some specific configurations may facilitate the establishment of good project governance.
Some transport projects offer examples of good practice in terms of effective distribution of responsibility. For example, the M1 and Egnatia motorways illustrate clear and efficient patterns which resulted from institutional innovations. As pointed out earlier, the M1 project was part of the context for setting up new governance structures around the establishment of the National Road Authority in 1993, the evolving role of the Planning Appeals Board, and the progressive adoption of Design and Build contracts. In the case of Egnatia, the establishment of Egnatia Odos as an independent ad hoc agency in charge of design, construction, maintenance, and operation of the motorway played an important role in the success of the project. This latter project shows how establishing a commercial (though publicly owned) company helped deliver and operate the infrastructure on an efficient basis.
0
+5+4+3+2+1
‐5‐4‐3‐2‐1
Port of Gioia Tauro
Madrid Metro Line
Vigo waste water treatmentDublin waste water treatment
Sogama solid waste treatmentMediterranean Corridor
Palermo Water Supply System (±5) Egnatia Motorway (±3)Valorsul solid waste treatment (±3)
M1 motorway

68
Table 4.5 DISTRIBUTION OF RESPONSIBILITIES BETWEEN PROJECTS’ STAKEHOLDERS PROJECT DISTRIBUTION OF RESPONSIBILITIES
Port of Gioia Tauro
The project proposal was put forward by Contship Italia S.p.A, a Swiss private company operating as a global container carrier on the trade routes mainly to and from Europe. Contship Italia was responsible for project implementation under the supervision of the Port Authority of Gioia Tauro, a public body with legal status. The latter was established in 1998 and took over the ASI‐REG consortium, the Association for Industrial Development in the Province of Reggio Calabria, established in 1963 and controlled by the Region of Calabria. After the creation of the Port Authority, the ASI‐REG consortium’s field of responsibility was limited to industrial development in the area at the rear of the Port. The Port Authority is in charge of the planning, coordination, surveillance, promotion and monitoring of the port operations and of all the other commercial and industrial activities implemented within the port areas. Today there are two terminal operators in the Port of Gioia Tauro: Medcenter Container Terminal (MCT) and BLG Automobile Logistics Italia. Medcenter Container Terminal (MCT) is part of the Contship Italia Group. BLG is a joint‐venture between a German logistics company in the automotive sector and a Japanese company specialising in cargo handling (ICO shipping company, a subsidiary of Nippon Yusen Kaisha).
M1 Motorway The overall responsibility for the designing and supervision of the works for the construction and maintenance of the road is entrusted to the National Roads Authority (NRA), formally established as an independent statutory body under the Roads Act 1993. The NRA was effectively formed out of the Roads Unit of the national Department of the Environment & Local Government. Until 2002, it remained under the control of this Department, at which point it was transferred to the Department of Transport. Although under the direction of the NRA, the Local Administrations‐ Dublin (since 1994 Fingal), Meath and Louth county councils – are responsible for the actual planning, building and maintenance of the road. The only exception is in the case of Public Private Partnerships (PPP), where the NRA is the road authority. The NRA has also responsibility for overseeing the implementation of tolling on the M1, the concession for which has been awarded to Celtic Roads Group, an international consortium of private companies89.
Egnatia Motorway
Egnatia Odos S.A., an ad hoc State‐owned public limited company was created in 1995 to design, implement and manage the Egnatia Motorway. It had been under the superintendence of the Ministry for the Environment, Physical Planning and Public Works within the Greek government until 2009. Then, it came under the supervision of the Ministry of Infrastructure, Transport and Networks. Until 2002, a private company, namely Brown & Root company (today KBR ), was included in its Corporate Organisation Chart, with the role of Project Manager and with the main task to provide the necessary managerial and technical expertise to run the project. Construction works were entrusted to private companies selected through competitive tenders by Egnatia Odos. The collection of tolls is carried out by the Operational and Maintenance Division of the Egnatia Odos on behalf of the Ministry of Finance. By the end of 2012, Egnatia Odos is expected to be privatised. In particular, the Greek State will give over the functioning of the highway, its maintenance and toll stations to private companies through concession contracts, while the construction department will remain under the supervision of the State.
Madrid Metro Line
National and regional authorities were involved in project design, namely the Ministry of Transport, the Community of Madrid and the planning and studies department of the Regional Consortium of Madrid Transport (Consorcio Regional de Transportes de Madrid – CRTM). MINTRA, a specialised public company owned by the Community of Madrid was the stakeholder involved in the financing and construction of the infrastructure during the first phase. Then, a new concessional model was applied to the construction of the last section (between Barajas village and T4), allowing the participation of the private sector. The work was awarded to Metro Barajas Sociedad Concesionaria (MBSC). The ownership of the line lies with CRTM while the public company Metro de Madrid S.A. (owned by the municipality and the Autonomous Community of Madrid) is responsible for the provision of the service. The management of the section from Barajas‐Pueblo to the new T4 terminal is the responsibility of MBSC, which recovers the cost through the additional fare paid by metro users entering or exiting the airport stations
Mediterranean Corridor
The project was designed in the framework of a national railways plan drafted by the Spanish government. Regional and local governments (especially Autonomous Community of Cataluña and Communidad Valenciana) actively participated in the project design, by drawing up specific proposals for the layout of the line passing through their territory. Different lobbying associations in the transport sector, interested in making the MEDCORR a high‐speed rail gateway to central Europe for both passengers and freight, tried to influence the national investment strategy at different stages. The operation of the railway was entrusted to the National Network of Spanish railways – Renfe. Until 2005, prior to the EU legislation requiring rail infrastructure and operations to be split, Renfe was also responsible for the construction and maintenance of rail infrastructure. Then, it was divided into Renfe Operadora, a
89 Dragados Concessions de Infraestructuras (a major Spanish firm), Edmund Nuttall Ltd (United Kingdom), HBG Ascon Ltd (Ireland), and NTR plc (Ireland).

69
state‐owned company in charge of operating passenger and freight transport in competition with other companies, and the Administrator of Railway Infrastructures – Adif, a public enterprise in charge of managing the rail infrastructures and rail traffic and assigning the use of the infrastructures to operating companies against the payment of a fee. Moreover, Adif is responsible of financing investment in the rail lines, under the control of the Ministry of Public Works.
Water supply in Palermo
The project was designed by a staff of engineers on behalf of the Local Administration, that is the Municipality of Palermo. This latter supervised the implementation of the project through the management board of AMAP, the public company fully owned by the Municipality of Palermo in charge of providing the water service in Palermo. AMAP was originally entrusted only with the provision of drinking water service but in 1994 it became responsible for the management of the entire water cycle (Integrated Water Service) in the Optimal Territorial Ambit n. 1 (which includes the Palermo area), as a result of the reforms introduced by the National Law 36/1994. The management of funds and the whole construction works were supervised by the National Authority concerned, namely the Ministry of Public Works.
Urban solid waste treatment in Lisbon
Valorsul was the public company responsible for the design, construction and management of the project. In 1995, it signed a concession contract for 25 years with the Ministry for Environment, Spatial Planning and Regional Development. It was established in 1994 as the multi‐municipal company responsible for waste treatment in the Northern Lisbon metropolitan area, including the municipalities of Amadora, Lisbon, Loures and Vila Franca de Xira. The company is fully owned by national public companies and municipalities, with shares proportional to the volume of Municipal Solid Waste treated by Valorsul90. Valorsul’s strategic decisions, such as the enlargement of the integrated waste management system through the Anaerobic Digestion plant and the inclusion of former Resioeste municipalities within its catchment area, have been promoted by the public national authorities. Nevertheless, municipalities participated to the decision‐making process and they are able to significantly influence the company’s activities.
Solid waste treatment in Galicia
Project design, implementation and management were the responsibility of Sogama, a public‐private company established in 1992. It is owned by the Government of Galicia, which is the majority stakeholders (51%), and by the Spanish‐based energy company, Socio Tecnolóxico, (49%). Regional law 10/1997 of 22 August represents the main legislative basis of Sogama’s activities. Accordingly, Sogama is responsible for the management of urban solid waste from the transfer stations to the final treatment plant in Cerceda. Other actors affect project performance, by intervening at different stages of the life‐cycle of solid waste and with different roles: citizens are responsible for sorting the waste at home, municipalities for collecting and taking it to the transfer stations and other non‐profit making companies (e.g. ECOEMBES) are involved in the recovery of the recyclable materials. The Government of Galicia is in charge of preparing the regional plans for waste management, in consultation with local authorities. Municipalities, however, can also establish their own waste management plans, in compliance with the national and regional ones.
Waste water treatment in Ría de Vigo
Both private and public stakeholders were involved in the project design. Initial projects to improve waste water treatment were elaborated by different Local Administrations (such as the municipalities of Vigo and Redondela ), in collaboration with the private companies which were in charge of operating the sewage network (e.g. Seragua). In 1994, Augas de Galicia ‐ an independent agency of the Water Administration of Galicia within the Department of Environment, Land and Infrastructures of the Board of Galicia – took over and centralised the responsibility for planning, financing and implementing the interventions in all the municipalities of the target area. Once the investments were completed, Augas de Galicia assigned to local administrations the use, operation and ownership of the infrastructures. The management was then entrusted to private companies, selected through competitive tenders by the municipalities. The only exception is the private company Adantia S.L., operating the waste water treatment plants of Soutomaior and Vilaboa, which was selected directly by Augas de Galicia.
Dublin Waste Water Treatment
The project was delivered using a Public Private Partnership (Design‐Build‐Operate – DBO) procurement process. Accordingly, a public local authority appointed a concessionaire to Design, Build and Operate the infrastructure. The public authority was the local authority Dublin City Council (DCC) while the concessionaire awarded the DBO contract was the ABA consortium, comprising international private companies including Ascon (construction firm), Black & Veatch (plant designers and suppliers) and Anglian Water International (operator). Anglian is actually in charge of the plant’s operation for a concession period of 25 years, at the end of which the plant will be returned to the local public authority. Ownership remains with the local authority throughout. Anglian operates the plan through the company Celtic Anglian Water (CAW), a 50:50 joint venture with National Toll Roads.
Source: Authors
90 Until 2010 (before the merger with Resioeste), shares were distributed as follows: Society Expo '98 Park (26%), EGF – Empresa General de Fomento S.A.90 (25%), City Hall Lisbon (20%), EDP ‐ Energias de Portugal S.A. (11%), Loures City Council (10%), City of Amadora (4%) and the Municipality of Vila Franca de Xira (4%).

70
A governance structure with well‐defined roles for stakeholders party to the project design, construction and implementation was also a strong feature of the Madrid Metro Line. The Regional Consortium of Madrid Transport is an established consortium including local authorities which played a key coordinating role with respect to all stakeholders (Madrid Transport Infrastructures, i.e. the regional authority responsible for construction; Metro de Madrid, responsible for the metro services, etc.). There was however some evidence of conflicting interests between different levels of government (central government / City Council and central and local governments), even if they did not significantly affect project performance.
On the face of it, Gioia Tauro and the Mediterranean Corridor are illustrations of fragmented governance structure with a large number of uncoordinated institutions and stakeholders that hampered the adoption of a unitary vision and integrated approach to a common strategic development plan.
In the waste water treatment plant of Dublin, the governance structure failed to deliver adequate solutions to more technical problems related to design and other initial difficulties (forecasting). In fact, the Design‐Build‐Operate approach that enabled the fitting of the plant on such a constrained site entailed a fairly complex governance structure, with difficulties in defining clear responsibilities when specific operational problems had to be dealt with. As a result, time consuming and costly mitigation measures were necessary which largely fell on Dublin City Council (notwithstanding that one of the purposes of Design‐Build‐Operate contracts is precisely to transfer risk to the concessionaire).
One challenge in the Palermo project was the articulation of the project governance with the evolution of the wider institutional context. Indeed, the governance of the project played a determining role at the beginning of the project, and a less positive role in the subsequent phases because the institutional context became less favourable. The Municipal Company of the Palermo Aqueduct (AMAP) benefited from the conjunction of political will, technical and managerial competence, financial resources and a favourable institutional framework, which eroded as time passed until the project came up against an institutional impasse (new management Board, shifting responsibilities to the Optimal Territorial Ambit authority with resulting conflict with AMAP).
Likewise, in the Sogama case, one of the decisive issues determining project performance was the hesitation of municipalities in deciding whether or not to join the Sogama system. This was a problem in the institutional framework which the regional government could have more effectively coped with, for example by encouraging discussions between Sogama and municipalities during the project design phase. This case also illustrates the missed opportunities for the municipalities to join a consortium in order to better coordinate waste management and facilitate increased efficiency and lower costs.
How to include the views of stakeholders is the second sensitive issue characterising the governance of the projects reviewed (which is actually linked to the first one). As a matter of fact, a balance should be struck between not taking them into account at all (the risk being

71
that specific interests are voiced at a later stage with potentially disruptive effects), and being too amenable to their consideration (the risk being that this is at the expense of the project’s constituent features, of some of its objectives or of its timely implementation).
Figure 4.7 THE LACK OF A COORDINATION ROLE INFLUENCING PROJECT’S PERFORMANCE
Note: a) “The arm wrestling in the shade of the port”, Gazzetta del Sud, 15 January 2011. The article is one of the many showing the conflicting interests on the development of the Gioia Tauro port. b) “The Government is searching for a place where to locate the Sogama of the South”, EL PAIS Galicia, 1 March 201291. The article refers to the plan of building new infrastructures in the South of Galicia needed to solve Sogama’s capacity limits. The latter is a result of a wrongly forecast demand mainly due to the autonomy recognised to Galicia municipalities to decide if and when to subscribe to Sogama’s service contract.
In the solid waste treatment plant of Valorsul, the fact that municipalities were both users and shareholders gave the latter a voice in decision‐making with the resulting dispersion of plants. This influenced somewhat negatively the performance of the project from an economic and environmental point of view (higher transport costs and negative impact on environment) but improved its effects on territorial cohesion and social happiness. One of the ingredients of the success of the Madrid Metro Line governance was precisely that municipalities were included in the decision‐making structure – admittedly an important feature for a suburban transport infrastructure crossing different urban sections. The Mediterranean Corridor project was revised to accommodate some, although not all, local requests (mainly regarding the railway route), with positive effects on social happiness, but causing some delays and additional costs to project implementation.
By contrast, Egnatia adopted a technical‐engineering approach (with the inclusion of an international consulting firm in Egnatia Odos’ corporate organisation chart) giving little initial consideration to stakeholders opinions. In fact, a more participatory approach could have enabled better anticipation of the opposition of environmentalist NGOs, for example through consultation. In the end, good cooperation developed and the design flexibility enabled changes to be made albeit the cost was high.
The M1 is also an example of how the role of local authorities was mitigated through progressive and partial transfer of competence at the national level. One of the positive features of the M1 governance structure was also its depoliticisation, protecting it from the
91 http://ccaa.elpais.com/ccaa/2012/03/01/galicia/1330639104_672280.html

72
expression of vested interests. However, the project was not entirely successful in this respect since one major shortcoming was the exceedingly favourable terms under which landowners were compensated.
Findings The governance of the projects reviewed tends to have a decisive, and on average, negative influence over project performance. The two main ingredients are: a clear and effective distribution of responsibilities between stakeholders contributing to project development, and adequate mechanisms to integrate the views of a large set of stakeholders. The governance arrangements of the projects reviewed have different legal expressions, but none is intrinsically better suited to guarantee an appropriate distribution of responsibilities. Some transport projects represent cases of good practice in this respect (e.g., the establishment of an ad hoc commercial publicly‐owned company in the Egnatia case). Specific features of (or changes in) the wider institutional setting caused difficulties in the case of some projects (particularly in the environment sector) which governance systems did not adapt to. Environment projects appeared to be specifically vulnerable to social pressure while transport projects showed a better capacity to either withstand pressure or integrate it without disrupting the project’s constituent features.
4.6 MANAGERIAL RESPONSE In the case of environment projects, managerial response was often a way to palliate deficiencies in terms of design, governance or forecasting. In the case of transport projects, it was perhaps less needed. In general, the capacity to remedy shortcomings and deficiencies depends on context, governance and flexibility of design. Importantly, it entails costs.
Figure 4.8 CONTRIBUTION OF MANAGERIAL RESPONSE TO PROJECT OUTCOMES
Note: The graph shows the score recorded by each project in relation to managerial response. The meaning of each score (±5) is presented in Table 2.3 of this report. Source: Authors
In the Dublin wastewater treatment project, evidence is mixed on the capacity to react to unforeseen events. The undercapacity characterising the plant was dealt with since it was still possible to satisfactorily operate the plant. On the face of it, the odour problem was resolved less successfully. These ad hoc responses entailed significant costs (especially for Dublin City Council).
0
+5+4+3+2+1
‐5‐4‐3‐2‐1
Madrid Metro LineDublin waste water treatment
Vigo waste water treatmentValorsul solid waste treatment
Sogama solid waste treatment
Palermo Water Supply System (±5)Port of Gioia Tauro (±4)
M1 motorwayMediterranean Corridor
Egnatia Motorway

73
Ría de Vigo offers a good example of an effective reaction adopted by Augas de Galicia, the regional body in charge of the project’s implementation, when some municipalities proved to be inefficient in dealing with tender processes to select private operators to take over the task of operating the concerned plants. This was made possible by the governance structure which endowed Augas de Galicia with sufficient competence to do so.
Valorsul exhibited managerial response by taking into account municipalities and NGOs demands (via dispersion of plants and establishment of an Anaerobic Digestion plant respectively) with, as a result, high social consensus and positive perceptions of the project. This was at the expense of efficiency criteria as these measures entailed higher costs. The merger with Resioeste, the association of municipalities responsible for waste management in another area close to Lisbon, to deal with overcapacity and ensure full capacity utilisation is also an example of effective managerial response.
In response to undercapacity problems, Sogama promptly increased its landfill capacity (Areosa) so as to receive increased volumes of waste. It also launched various campaigns to try improving waste separation to increase recycling (for which municipalities and the Region are in principle responsible). Other examples are the awareness campaigns launched to promote incineration (admittedly not very successful to date), or the drying of organic waste when the idea of establishing a composting plant was dropped92.
By contrast, managerial responses in transport projects are less relevant or effective. Gioia Tauro owes much of its initial effective strategic management to private initiatives (e.g., MCT, in charge of the transhipment activity, directly financed some necessary investments which were disputed by public authorities with its own funds). Over the years, such room for manoeuvre progressively decreased as Gioia Tauro declined in importance for its owners (Contship Italia group). As far as Egnatia is concerned, deficiencies related to forecasting capacity were outweighed by prompt and adequate responses by Egnatia Odos. The body learnt to revise the design of the motorway and cooperated with “sources of uncertainty” (environmental and archaeological organisations). This was made possible by expertise within Egnatia Odos, and the governance structure of the project (Egnatia Odos’ existence itself). Similar capacities have not been detected in the M1 project, whose managers showed limited adaptation to unforeseen events (such as unexpected on‐site conditions). In the Madrid Metro Line, managerial responses were made less necessary because of good project design and ex‐ante forecasting capacity which succeeded in minimising risks. Finally, in the case of the Mediterranean Corridor, managerial response proved to be adequate to cope with changes in regulation, planning and project design, but the lengthy procedures and budgetary constraints represented in some cases an insurmountable obstacle which limited management’s room for manoeuvre and their effective contribution to project outcomes.
92 Given the decision not to build a composting plant to complement the Sogama environmental complex in Cerceda, organic waste is not separated from the rest of non‐recyclable waste by Sogama clients. Therefore, collected waste has a very high level of humidity and needs to be dried before being incinerated.

74
Findings Appropriate managerial responses palliated deficiencies in terms of design, governance or forecasting but they entailed costs. Environment projects offer different illustrations of effective managerial responses while in the transport sector, managerial responses were less relevant and frequent.
4.7 SOME REMARKS ON THE ROLE OF THE EUROPEAN COMMISSION As highlighted in the previous Section, the role played by different stakeholders has to be taken into account in the assessment of project performance determinants: public authorities, private companies, organisations, direct users at local, regional, national or wider level may affect the project history and outcomes in many ways, either in positive or negative terms. Among these actors, the contribution made by the European Commission (EC) should not be neglected, as this is the only player which was involved in all the evaluated projects (Box 4.1 provides a brief overview of the EU legal requirements in place in the 1994‐1999 programming period).
An analysis, however, of the different internal procedures put in place by the Commission’s General Directorates participating in the approval, financing and implementation of major projects during the Nineties and how these procedures developed and changed over the following years is outside the scope of this study. Moreover, for the sake of clarity, it has to be pointed out that the findings highlighted in this Section solely refer to the ten projects evaluated.
Besides its role of funding provider, the Commission’s involvement in project planning has been highly variable across countries and type of project: in some projects the EC services intervened mostly as a provider of capital grants, without making specific recommendations about the project design, management and implementation. In other cases the EC was more proactive. This involved undertaking closer relationships and discussions with the national authorities and, in some cases, influencing the project features. A broader distinction can be made between the five environmental and five transport projects, with the first group generally involving lesser inputs from the Commission than the second one93.
The two solid waste treatment projects evaluated94 are examples of minimal involvement on the Commission’s side in the decision‐making process and in influencing the project features. The same behaviour can be highlighted with reference to the water supply project of Palermo. The planning process remained in the hands of the national (in the case of Valorsul integrated waste management system) regional (Sogama waste treatment) or local (Palermo water supply) authorities, with a very limited contribution by the Commission.
93 With the exception of the Mediterranean Corridor project, as explained below. 94 The Structural Funds resources allocated to these two projects covered approximately the same share of total investment costs (around 35‐40%).

75
Box 4.1 THE LEGAL BASIS FOR MAJOR PROJECTS IN THE 1994‐1999 EU REGULATION
In 1994‐1999 programming period, different approval and financing procedures were in force for major projects co‐financed by the ERDF and projects assisted by the Cohesion Fund.
• Art. 16.2 of the ERDF Regulation95 defined major projects as “those the total costs of which taken into account determining the amount of Community assistance” was “greater than ECU 25 million for infrastructure investments or greater than ECU 15 million for productive investments”.
• With regard to the approval framework, Art. 5 of Council Regulation 2083/9396 established that applications for ERDF assistance, both submitted individually or within the framework of an operational programme, had to provide the following information: a) for investment in infrastructures: analysis of the costs and socio‐economic benefits of the project, including an indication of the expected rate of use; the expected impact on the development or conversion of the region concerned; an indication of the consequences that Community participation will have for the completion of the project; b) for productive investment: an indication of the market outlook for the sector concerned; the effects on employment; an analysis of the expected profitability of the project.
• The Cohesion Fund Regulation97 did not provide a definition of major projects. Art. 10.3 stated that projects to be supported through the CF resources, including groups of related projects, had to be of a “significant impact in the field of environmental protection or in the improvement of trans‐European transport infrastructure networks. In any event, the total cost of projects or groups of projects may be in principle not less than 10 million ECU/EUR”.
• The European Commission’s appraisal of the applications was based on a set of specific criteria listed respectively in Art. 14 (3) and Art. 10 (5) of the EC ERDF and Cohesion Fund Regulations. They include, for example, the assessment of conformity of the interventions with relevant Community legislation and the adequateness of administrative and financial mechanisms in ensuring an effective project implementation. In addition, the preamble of the Cohesion Fund Regulation made clear that assistance was provided to projects which did not represent a prejudice to the “polluter pays” principle98.
From 2000 onwards, several changes have been introduced to the legal basis of EU assistance to major projects. Most importantly, subsequent Regulations envisage the possibility to finance the major projects only as part of a large intervention (an operational programme in the period 2007‐2013)99, and state that the total eligible cost has to be higher than EUR 25 million in the case of environment projects and EUR 50 million in other fields, as for the current period 2007‐2013. Moreover, Member States are asked to provide more detailed information on the project features. As for the next programming period (2014‐2020), a new Regulation for EU assistance is currently under preparation100.
Source: Authors
95 Council Regulation (EEC) No 2082/1993 of 20 July 1993 amending Regulation (EEC) No 4253/88 laying down provisions for implementing Regulation (EEC) No 2052/88 as regards coordination of the activities of the different Structural. Funds between themselves and with the operations of the European Investment Bank and the other existing financial instruments. 96 Council Regulation (EEC) No 2083/93 of 20 July 1993 amending Regulation (EEC) No 4254/88 laying down provisions for implementing Regulation (EEC) No 2052/898 as regards the European Regional Development Fund. 97 Council Regulation (EC) no. 1164/94 of 16 May 1994, establishing a Cohesion Fund. 98 Council Regulation (EC) no. 1164/94 of 16 May 1994, establishing a Cohesion Fund: “(…) Whereas, in accordance with Article 130s (5) of the Treaty and without prejudice to the principle that the polluter should pay, the Council may decide on financial assistance from the Cohesion Fund where a measure based on paragraph 1 of that Article involves costs deemed disproportionate for the public authorities of a Member States”. 99 Art 39 of the Council Regulation (EC) No 1083/2006 of 11 July 2006 laying down general provisions on the European Regional Development Fund, the European Social Fund and the Cohesion Fund and repealing Regulation (EC) No 1260/1999 100 The role of the Commission is expected to be strengthened. For instance, there is the proposal to make the approval decision conditional on the first works contract being concluded within two years of the date of the decision (Art. 92 of the Proposal for a regulation of the European Parliament and of the Council, COM(2011), 615 final/2, 14.03.2012, Brussels).

76
A more prominent part, also in financial terms101, has been played by the EC as far as the two waste water treatment projects are concerned. This is perhaps motivated by the fact that the infrastructural projects in Dublin and Ría de Vigo were specifically meant to comply with a European Directive imposing secondary‐type treatment to urban waste water (the Urban Waste Water Directive 91/271/EEC). For example, additional information was requested by DG Environment to make sure that the disinfection technology had been installed to all the treatment plants of Ría de Vigo, so as to comply with other relevant Directives on bathing and shellfish waters102. As confirmed by the interviewees and the documents consulted, however, the Commission did not question the undercapacity of the Vigo plant, which was stated in the application form itself.
The EC was more involved in the design of the transport projects and also influenced the management structures in place for project governance. As far as the Irish M1 motorway is concerned, the EC indirectly, but effectively, contributed to the development of the institutional structures to manage and deliver the National Development Plans and specifically the M1. In Greece, following the express request of the EC, the then existing regulatory framework for the management of public infrastructure was revised and an ad‐hoc public entity governed by private law was set up for the construction, supervision and management of the Egnatia motorway (Egnatia Odos). As the case study has shown, the existence of a unique company in charge of the infrastructure is one of the success factors for the project.
Additionally, the significance that EU funds had in triggering the implementation of both the motorway projects has to be emphasised. The high level of European financial support103 pushed for the realisation of the projects, and without such financing, project implementation would probably have been delayed.
In two cases the Commission played a crucial role in ensuring the maximisation of the project’s impact, by encouraging the local authorities to undertake a broader view in the project design. Driving the Greek Government to conceive the Egnatia motorway as a Trans‐European Network infrastructure, to be connected to Eastern Europe and to the Balkan countries by means of vertical axes, ensured greater effects in terms of economic growth and territorial cohesion. Similarly, asking the Madrid transport authorities to ensure more interchange possibilities of the new Metro Line with other public transport system lines, as a condition of co‐financing through the Cohesion Fund104, helped to design a better solution and to attract more demand. In both cases, this positive influence of the EC services has been positively acknowledged by the interviewees.
101 The Cohesion Fund contribution allocated to the Dublin and Ría de Vigo projects was relatively higher than for other environment projects (80% of the initial financial decision, and 53‐68% of the total expenditures incurred to date). 102 Directives 76/460/EEC and 79/923/EEC respectively: these Directives impose more severe requirements on water, to be complied with through the installation of ultraviolet disinfection technologies. 103 38% for the M1 and approximately 43% for the Egnatia motorway. 104 In order to be co‐financed through the CF as a major project, the Madrid Metro Line had to be conceived of as an access to a Trans‐European Network (Barajas airport). Alternatively, the project would have been considered as an urban transport project, to be co‐financed through other EU instruments.

77
The Mediterranean Corridor, by contrast, despite its relevance for increasing territorial cohesion and its potential for being part of the railway Trans‐European Transport Network, did not seem to have been paid much attention by the Commission in the past. Throughout all the phases of project history, from its planning to its implementation, there is very limited evidence of an active contribution by the Commission to assessment of the planning strategy. The EC could probably play a more active role in future years. If the Mediterranean Corridor is confirmed as a TEN‐T priority project in the 2014‐2020 programming period, the Commission will be in the position to promote an integrated vision for the rail system at Spanish and European level, by favouring the coordination of interests and strategies of regional and national authorities.
In the case of the Port of Gioia Tauro, concerns were raised by DG Transport105 about the potential implications that the financial support would have had on the EU maritime transport policy objectives and on possible competition distortion effects of public support for a private productive operation. An independent appraisal was commissioned, which highlighted that the EU financial assistance involved (covering a small part of total investment costs) did not represent unfair competition. Following that, DG Regio agreed to co‐finance the project.
Recognising the potentiality of the port to trigger socio‐economic development in one of the poorest regions of Europe106 and the well‐known regional governance constraints, the Commission took an active role also in the subsequent phases. It promoted and steered the implementation of accompanying actions addressed at supporting broader socio‐economic development107. Notwithstanding this commitment, the EC services could not change the key limitations of the governance structures, which paralysed the implementation process of any further local development initiative beyond the completion of the infrastructure.
The Port of Gioia Tauro, the Egnatia motorway and the Madrid Metro Line projects are examples of active involvement of the EC in the development strategy in which the project is embedded. Yet, this has not always been the case for other projects. In fact, the range of roles played by the Commission throughout these ten projects spans from the provision of recommendations and exercise of pressure to stimulate some of the measures deemed necessary to improve the project’s effectiveness on the one hand, to a position of mostly co‐financing body on the other hand (as for the Sogama and Valorsul waste treatment projects and the Mediterranean Corridor). At an intermediate degree of involvement, there are also cases in which some interest has been shown by the EC services on project design features, particularly aimed at ensuring compliance with EU Directives (as for the Vigo and Dublin waste water treatment projects).
105 DG VII at that time. 106 I.e. Calabria. 107 For example it was at the request of the Commission that a Master Plan was prepared in 1997 and again it is thanks to the Commission that the latest Framework Programme Agreement foreseeing further investments to re‐launch the port’s competitiveness and fostering regional development.

78
Finally, it should be mentioned that in some cases the ERDF or CF grants were combined with EIB loans. The EIB was involved in co‐financing three out of the ten projects reviewed (urban waste treatment in Northern Lisbon, water supply in Palermo and Egnatia Motorway), for a total allocation of more than EUR 3 billion108. In these cases, before project implementation, the EIB provided valuable assistance to enhancing the quality of the project. The Bank’s advice proved to be effective particularly when associated with a condition on the loan provision. Thanks to this mechanism, it ensured that an improved water metering system was installed in Palermo, with the side‐effect of allowing the identification of illegal connections to the old network. By contrast, when the Bank did not have a direct influence on project financing, its advice did not necessarily lead to project improvements. This is shown by the Mediterranean Corridor case study. The Bank collaborated on the appraisal of the MEDCORR, at the specific request of the European Commission. Despite having indicated several weaknesses in the project dossier, particularly related to the demand analysis, no revisions to the project design were either requested by the Commission or implemented by the national authorities.
Findings When analysing the role played by the European Commission in the projects reviewed, various degrees of involvement can be highlighted, which appear to be related to the infrastructural sector. Transport projects generally spurred higher involvement by the Commission in both the planning and design stages. As to environment projects, the Commission’s attention was mostly focused on ensuring compliance with EU Directives. In some cases, more proactive behaviour ensured the maximisation of projects’ effects (e.g. Madrid Metro Line or, to some extent, Ría de Vigo) or implied the establishment of effective governance mechanisms (e.g. the two motorway projects). In other cases, in spite of the high level of commitment put in place, the EC did not manage to solve the already existing limitations of the national / regional governance structures (e.g. Mediterranean Corridor and Gioia Tauro).
4.8 THE INTERPLAY BETWEEN FACTORS AND THEIR RELATIONS TO EFFECTS
One immediate finding emerging from the preceding Sections concerns what seems to be a sector‐specific story. Indeed, environment projects share common features and follow comparable trends that differ in degree rather than in nature. Echoing the comparatively weaker performance of environment projects identified in Section 3, the examination of drivers in the present Section reveals that environment projects also suffer from deficiencies on different fronts (design, forecasting, governance). Besides the explanation put forward earlier in terms of the weaker administrative capacity of the (local / regional) authorities in charge, together with the relative ad hoc nature of the projects (i.e., that they are implemented without necessarily being part of a wider investment programme), an additional consideration arises. The review of drivers shows that mere compliance with EC regulations109 is hardly a valid objective for an investment project. First, there are generally different ways in
108 Different loans were approved for the Egnatia motorway, amounting to EUR 2,885 million; EUR 126 million and EUR 22 million were allocated for the Valorsul and Palermo projects respectively (2011 prices). 109 The link between the projects’ raison d’être and the compliance requirement is particularly strong for the two waste water treatment plants.

79
which compliance requirements can be fulfilled, and this is not through one single project. Second, and more fundamentally, pursuing an objective in terms of compliance instead of aiming at development or social welfare objectives seems to take place at the expense of good planning110. Overall, compliance should be better viewed as one constraint in the maximisation of social welfare pursued by a project rather than as a fully‐fledged objective. Even if it has to be acknowledged that EU Directives may have the beneficial effect of accelerating an investment, which would otherwise be delayed or not implemented, environmental projects should not owe their existence purely to the compelling necessity of complying with regulations. Instead, they should be conceived within a wider strategic development plan.
Another striking result, besides or beyond the sectoral pattern above, is that the different drivers identified are deeply intertwined. In other words, before yielding development effects, drivers are combined in different ways, through project‐specific patterns. There is therefore no simple causal link between one driver and one or more effects.
Elements of the context generally impact on design. For example, deadlines imposed by the EU regulations on waste water treatment were particularly binding in the cases of Ría de Vigo and Dublin. However, this is not sufficient to account for or predict the final performance of the projects. As a matter of fact, in one case (Dublin), the result was not decisive in terms of environmental effects (even if it could become so in the future) but it had some negative consequences on social cohesion and social happiness (because of the bad odour and perception of political bias), as well as on costs. In Ría de Vigo, on the other hand, it clearly reduced the expected environmental benefits of the project.
Similarly, the impact of vested interests on design can be more or less important depending on whether an adequate governance structure is able to smoothen or integrate these interests, whether forecasting capacity can lead to the adoption of appropriate awareness campaigns pre‐empting later disruptive effects, or whether managerial responses are able to minimise possible detrimental consequences. While in the M1 project, a depoliticised governance structure preserved the integrity of the project from particulars interests, in the MEDCORR case lack of coordination among different interests prevented the planning of the best project option. In the Egnatia case, the requests of environmentalists and archaeologists were integrated not so much through the governance structure, but thanks to adequate managerial response (and relative associated costs). On the face of it, in the case of Valorsul, design, influenced as it was by specific interests (dispersion of plants and addition of an Anaerobic Digestion Plant) was perhaps not optimal from an efficiency / environmental point of view but it yielded positive results as far as social happiness was concerned.
The same goes for example for forecasting mistakes which can have an influence on project design (leading to over or under capacity) but the eventual impact on project performance is decided through the intervention of yet another variable. For example, in the case of Sogama,
110 Similar findings are reached in the ex‐post evaluation on “Cost benefit analysis of environment projects” (European Commission, 2011b).

80
whose design was characterised by under‐capacity due to the difficulty of forecasting municipalities’ demand, an appropriate reaction in terms of managerial response, the opening / enlargement of the Areosa landfill, mitigated the potentially negative impact and preserved positive environmental effects . In principle, the flexibility of design itself could also represent an appropriate mitigation measure (of a more “endogenous” sort).
Forecasting capacity is also important as far as financial sustainability is concerned, since the correct estimation of demand can be decisive in setting adequate tariffs and generating operating revenues. However, it is interesting to see how financial sustainability also depends to a large extent on governance, as well as social acceptance issues. For example, the introduction of tolls can meet the resistance of users or an unclear distribution of responsibilities can imperil the possibility of levying tariffs, and furthermore put at risk overall financial sustainability (e.g., by failing to provide adequate incentives to contribute to a project’s objectives).
Perhaps the only relatively direct link between a “driver” and an “effect” takes place between what was categorised as “appropriateness to context” and institutional learning. Indeed, the finding that projects are more “trait taker” than “trait maker” is quite disappointing given the sheer size of the projects reviewed. However, this fits well with the fact that institutional learning is not a major effect produced by these projects. In this respect, the proposed explanation put forward earlier has to do with the fact that more relevant learning effects are more likely to take place when projects are planned and managed at national level and included in wider investment programmes.
Also of interest are the relationships that did not take place in accordance with expectations or common wisdom. For example, given the generally high level of adaptation of the projects to the needs of the population or of users pinpointed in practically all the case studies, it is somewhat surprising that social happiness is not aligned and accordingly positively affected. In fact, social happiness appears to follow rather independent patterns suggesting that additional factors have an influence on it. This invites us to consider social happiness as an independent variable which does not automatically adjust if the other project variables are positive. Given the importance of it in the overall assessment of projects, it therefore deserves special and dedicated attention, for example through the adoption of consultation measures or other participatory approaches.
As to the temporal effects, they appear more determined by structural features of the projects than by the specific drivers and their combinations identified in this section.
At this point, one could feel discouraged in the face of what appears to be so many project‐specific features. In fact, despite of or apart from the high variability of patterns at work, and beyond the sectoral difference concerning environment projects highlighted above, a broader framework of relationships also emerges within which these patterns seem to take place.
As a matter of fact, an important finding valid across the cases reviewed is that design and governance are the two legs upon which a project stands. Forecasting capacity and managerial

81
response are factors that can impinge on either one or the other, either positively by offsetting deficiencies, or negatively if they are wrong or insufficient. In other words, they have an indirect impact on project performance that passes through design or governance. As to context, there is maybe more to it than what appears at first sight. Surely, contextual elements influence both design and governance, more or less directly and strictly (and maybe the former to a higher extent than the latter). But this is not only a passive relationship. It also props up an interaction whereby context is not only a set of constraints but also of opportunities giving rise to a vision underpinning a project’s adoption and development. A good example of a vision is given by the Madrid Metro Line where the joint analysis of local and long distance mobility needs provided a sound basis for project development. The vision can also be simple (e.g. the provision of a public service) or ambitious (the modifications of the terms of competition in global transhipment).
In turn, for a project to be successful, both design and governance should be in accordance with and adhere to a precise and specific vision of what the project wants to achieve (this also includes provisions to ensure financial sustainability during the operational phase). If the vision is right, if it proposes an appropriate articulation of constraints and opportunities, this augurs well for further developments.
Further, while there seems to be different mechanisms safeguarding or compensating for the effects of design (forecasting, managerial response, design itself through flexibility..), in cases of deficiencies in the governance structure, the only possible palliative is managerial response, which likely does not offer an adequate durable remedy. In other words, an unsuitable governance structure seems to be to a large extent irredeemable. It therefore deserves all the attention of policymakers at the early stage of the project conception.
Overall, at some risk of oversimplification, it is possible to say that a good vision adapted to its context is often correlated to a relevant governance structure and an appropriate design. Forecasting and managerial response are there to prevent or palliate deficiencies.
The lesson is that it is not sufficient to individually look at one factor or set of factors to ensure a project performance. No set should be neglected and all are potentially important. However, there are some prerequisites for a project to be successful and these principally revolve around the workings of governance mechanisms.

82

83
5 LESSONS LEARNT ON EX‐POST CBA 5.1 INTRODUCTION The fourth Evaluation Question stated in the ToR relates to the possible qualitative and quantitative methods that can be adopted to capture the impact of investment projects:
“What are the existing evaluation methods to capture a given long‐term contribution for different types of investment in the field of environment and transport infrastructure?”
This issue has been widely addressed in the First Intermediate Report of this evaluation study, where an overview of the existing methodologies for ex‐post evaluation was provided. This Section deals, more specifically, with one of these methods, i.e. the ex‐post CBA111: the methodological issues raised and the lessons learned by the ex‐post application of the Cost‐Benefit Analysis methodology to the sample of major projects evaluated in the previous Sections are discussed.
The methodological learning is of particular relevance in light of the specificity of this evaluation, which is one of the first examples worldwide of usage of CBA backwards and forwards with a long time horizon (30 years), in a standardised form for projects in different countries and sectors. This specificity raises issues which are new if compared to what happens in the ex‐ante appraisal.
We believe that the methodological lessons learned are of general interest, given the current debate at EU level, at the World Bank, and elsewhere, on reviving CBA as necessary, even if not exclusive, tool for project evaluation112. The discussion presented below offers an interpretation key about the specificities that are drawn from the ex‐post application of the CBA methodology.
The Section is organised around the topics that are key in the development of the ex‐post CBA. They can be considered as a categorization of the main themes guiding the development of the analyses. For each of them, examples from the ten projects are provided to illustrate how the methodology was applied in the practice, and a relative lesson is drawn. They are:
• Project Identification;
• Time Horizon;
• Counterfactual Scenario;
111 The CBA methodology is particularly used within the EU as a tool to shape the allocation of funds (as discussed in Florio, 2007). The basic principles of the EU approach to Cost‐Benefit Analysis of infrastructure projects is presented in Florio and Vignetti (2011). A discussion about the need of ex‐post CBA in the framework of Cohesion Policy major projects is provided by Florio and Sartori (2010). 112 World Bank, 2011.

84
• Demand Analysis;
• Social Discount Rate;
• Quantification of Costs and Benefits;
• Shadow Prices.
5.2 PROJECT IDENTIFICATION
The first critical aspect deserving attention concerns the definition of the scope of the CBA in order to identify which investments should be considered as the subject of the ex‐post evaluation. Given the specific context of this evaluation, some adaptations to the definition of project presented in the EC Guide to Cost‐Benefit Analysis of Investment Projects (hereafter “the Guide”) have to be introduced113.
The general criterion to be used for project identification is that a full project should have been realised and have been mature enough to enable the assessment of the effects produced in the long run. The question of defining the project “borders” (i.e. which infrastructures and operations are included in the project), as well as the minimum time for long‐term impacts to materialise and stabilise, therefore becomes relevant.
On the basis of the analyses performed, the main criteria to identifying the projects are the self‐sufficiency of the investments and their pertinence and timing.
5.2.1 Self‐sufficiency of the investments The first criterion to comply with is the application of the “self‐sufficient unit of analysis” concept. This requires not focusing on too narrow an object, i.e. the assistance for a specific phase or component of a project, or on a too broad one, i.e. the assistance for a strategy or a programme of interventions. The lessons learnt from the study are:
• In cases where the ERDF/CF finances just a specific phase, or a sub‐portion, of a given broader self‐standing intervention, the latter should be considered as the subject of the CBA114.
• In cases where the ERDF/CF finances a project which was part of a larger set of interventions (a programme) all aimed at achieving the same priority (but representing different units of analysis), the former should be considered as the subject of the evaluation. This example is provided by the upgrade of the Mediterranean Corridor, in Spain. The specific project or, better, the rail section financed by the Cohesion Fund,
113A project is defined as a “self‐sufficient unit of analysis comprising a series of works, activities or services intended to accomplish an indivisible task of a precise economic or technical nature” (source: European Commission, 2008a). 114 This should have been, in principle, the case of the Italian project “Water Supply in Palermo”, where the ERDF assistance was designed to co‐finance the reorganization of six water subnets and other works part of a broader intervention concerning the whole water supply network of Palermo. However, the non‐realisation of the interventions not financed with the ERDF obliged to focus only on ERDF assistance.

85
was part of a broader strategy aimed at upgrading the entire line included in the currently labelled Mediterranean Corridor, which spans from the South of Spain (Algeciras/Seville) to the Eastern French border. This strategy was implemented through a wide number of interventions carried out in different times, locations and stages, and under different political mandates. Given this fragmentation, which pre‐empted identification of a single investment phase, the evaluation study focussed on the effects generated by the works on the section Valencia – San Vicenç de Calders (about 70 km from Barcelona), which was the one which received co‐financing from the Cohesion Fund.
5.2.2 Pertinence and timing of the investments The second criterion concerns the pertinence and timing of the investments, which require to decide whether modifications, new components, technologies, etc. introduced later on have to be considered as part of the investment or not. The objective of the CBA is to assess the long‐term performance of the project so that an initial investment always has to be singled out as the subject of the ex‐post evaluation. The question is how far one should go in limiting the scope of this initial investment. The lessons learnt from the study are:
• Investments incurred in the years subsequent to the project’s completion, but not pertinent to it ‐ i.e. not occurring on the original infrastructure – should be excluded from the CBA, even if they affect its performance. For example, in the project Egnatia motorway (Greece), traffic flows are expected to increase substantially after the opening of nine vertical axes connecting Greece with the Balkan and European countries. These axes, currently under design/construction, consist of a set of new infrastructures (national motorway roads) which will be connected to the Egnatia motorway at nine strategic points. Despite their influence on the project performance, they do not pertain to the original investment and thus their construction cost was excluded from the CBA115.
• Investments in the project incurred in the years subsequent to its completion should be included in the analysis if pertaining to it and consistent with the original logic of intervention. In the cases of waste water treatment Ría de Vigo and solid waste treatment in Galicia and Lisbon, new technologies not envisaged in the original design were introduced as additional components to improve the performance of the project and deliver a better service. The modifications, considered to be complementary and consistent to the original investment, were considered part of the subject of the Cost‐Benefit Analysis.
115 Another example is provided by the project Port of Gioia Tauro, whose objective was the creation of a transhipment port by the private company Medcenter Container Terminal (MCT) to regenerate the existing and abandoned dock basin at Gioia Tauro, Calabria. In the analysis, some activities not pertinent to the transhipment operations were not considered as part of the analysed project. These consisted of investments, operating costs and revenues deriving, for example, from the car carrier activities, incurred by the other terminal operator and other bodies operating in the industrial area outside the terminal.

86
• Investments in the project incurred in the years subsequent to its completion should not be included in the analysis if, although pertinent, they pursue objectives disconnected to the original project’s rationale. This is the case with the water supply of Palermo project, where additional interventions not included in the original plan have later been realised with regard to the distribution network and the adduction system. They were aimed at coping with periods of drought and improved the available quantity of water from natural sources to be pumped in the system, and contributed to mitigating the water loss problem. However, since not directly related to the project’s aim of improving the water distribution service in Palermo, they have been excluded.
• Investments incurred in the years subsequent to project completion and pertinent to the project, but undertaken by an institution other than the initial investor (usually the ERDF/CF beneficiary) should be included in the analysis. This is the case with the Madrid Metro Line 8 project, where the extension of the line to the Airport T4 station (inaugurated in 2007) was financed by the national agency AENA, the operator of Barajas airport, through a concession to a private company. It is because of this concession that, currently, it is necessary to pay a supplement when using Line 8 to access either of the two airport stations. Due to its pertinence, this additional investment was included in the analysis regardless of the source of financing.
Lesson learnt The identification of a proper object of the ex‐post CBA, in terms of a “self‐sufficient unit of analysis to which long‐term effects can be attributed”, is complex. The complexity comes from the fact that investment decisions and implementation are not isolated, but are part of a wider system of public interventions, which may determine modifications to the original design, as well as the need to be physically integrated with other complementary infrastructures. What to include and what to exclude from the ex‐post CBA should be assessed by the analyst on a case by case basis, by applying the following criteria:
• the project should be already realised and mature enough in order to assess the effects produced in the long run;
• an initial investment should always be identified as the main object of investigation, while subsequent investments (already carried out or planned) should be included only if pertinent to the original infrastructure and consistent to the achievement of the project objectives;
• a specific phase, or a sub‐portion, of a given broader self‐standing intervention, should not be considered as the subject of the CBA on its own, although the EDRF/CF assistance financed that specific phase only.
5.3 TIME HORIZON
Ex‐post CBAs needs to be undertaken from “today’s viewpoint”116. This is a peculiarity of the evaluation, which assesses the performance of projects that are in the middle of their life cycles. This implies the adoption of an appropriate time horizon of analysis.
116 This was 2011 for our study.

87
In the context of this study, a reference value of 30 years117 has been applied to all projects. In particular, year “zero” is the first year where capital expenditure for investment occurred.
This implies that the timeframe for evaluation varies across projects, depending on the date of works commencement, and that all analyses extend beyond the current year. For instance, the M1 motorway was delivered in a number of sections over a period of 16 years (1989‐2005). The earliest completed section, the Dunleer Bypass, opened in 1993 while the most recently completed section, the Dundalk Western Bypass, opened in 2005, and thus has been operational for six years. To cater for this, the project stretched from 1989 (Year 0) to 2019 (Year 30).
In line with this approach, the analysis comprises a set of historical data (from year zero until today), on the one hand, and a set of forecasts of future demand, costs and revenues/benefits (from “today” until the end of the time horizon), on the other. This twofold nature of the analysis implies to adopt two sets of parameters (i.e. discount rates – see below) and to deal with a mix of current and constant prices (see Box 5.1) .
Box 5.1 ADJUSTING HISTORICAL PRICES FOR INFLATION The mix of historical and forecast data affects the choice of the prices to be used, i.e. whether to use nominal (current) or real (constant) prices. A standard approach to be adopted is to use constant prices. This requires the following adjustments:
• Data from 2011 onwards should be estimated in real terms (2011 prices, no inflation).
• Data up to and including 2010 are historical and therefore expressed in nominal terms. In order to align the two levels of analysis, and to have only one price basis, the historical prices should be reflated so as to turn them into prices at 2011 Euros.
Source: Authors
This approach proved to be appropriate for all projects except one, namely the Egnatia Motorway, where the adopted time horizon is too short in light of the type and magnitude of the investment. As a matter of fact, the Egnatia Motorway is an exceptional case that can be encompassed within the concept of “mega” (rather than “major”) project, given the amount of money involved, the time elapsed and the geographical scope covered. To give a rough idea, Egnatia is like a sum of several major projects in a row. The investment, amounting to EUR 5.5 billion, was delivered between 1994 and 2011, a total construction phase lasting 18 years118. In such a situation, the adoption of a time horizon of 30 years is not sufficient to encompass the long‐term effects of the project. For this reason, beyond the standard CBA stretching over a period of 30 years (which shows in any case a positive ENPV), a simulation of a CBA over a period of 50 years was carried out to better express the value of the project today and to calculate its economic viability.
117 This is line with the indications of the EC Guide 2008. 118 It is worth mentioning that although the M1 in Dublin took 16 years to deliver, nevertheless, it cost a lot less and therefore cannot be considered a ‘mega’ project.

88
Lesson learnt The timeframe of a project analysis should be formulated for a period appropriate to its economically useful life and long enough to encompass its mid‐to‐long term impact. The adoption of 30 years as default rule is generally appropriate for “standard” projects, whose construction phase lasts for a relatively limited number of years (e.g. 3 to 7) and so there remains enough scope for mid‐to‐long term impacts to unfold and stabilise. For mega projects, whose investment phase may stretch for as much as two decades, a longer timeframe should be adopted to better calculate the project economic viability.
5.4 COUNTERFACTUAL SCENARIO
Once the project is identified and the time horizon set, an appropriate counterfactual against which to compare the performance of the projects should be identified. The counterfactual defines – in principle ‐ what would have happened in the absence of the project, usually a “do nothing” or “do minimum” option. The “do nothing” consists of a continuation of the position prior to the project. In the case of an upgrade of an already existing infrastructure, this means keeping in operation the system as it was before the project’s realisation, including incurring appropriate operations and maintenance costs. For this reason, it is also called “business as usual”. The “do minimum” consists of the least cost solution involving a minimum capital expenditure to address ‐ at least partially – the stated objectives.
What option to choose as the most appropriate counterfactual is not always straightforward. In general, the “business as usual” should be taken as counterfactual by default, whenever it proves to be feasible and realistic. In some cases, if the “business as usual” is not feasible, a “do minimum” scenario shall be adopted.
The adoption of the “business as usual” as an appropriate counterfactual was unproblematic for all transport projects and for the water supply project in Palermo, in other words, for all projects not aimed at complying with new regulations. In these cases, the continuation of the position prior to the project was always assessed as plausible. For example, in the Metro Madrid Line project, the counterfactual scenario consisted of continuing to serve Barajas airport with other transport modes, such as taxis, bus, etc. In the Mediterranean Corridor, it consisted of maintaining the operations of the conventional service on the Barcelona‐Valencia route. Similarly, in Palermo, it consisted of keeping in operation the water distribution network as it was before, with a minimum level of the water service.
By contrast, for the environment projects that are motivated by the need to comply with EU Directives119, the identification of an appropriate counterfactual is more complex and lends itself to a complex debate.
In these projects “business as usual” would correspond to perpetuating a situation of infringement of EU and national legislations and environmental risk. Thus, the evaluator could decide to dismiss this scenario and adopt the “do minimum” as the counterfactual. However, the identification of a realistic ‐ and economically viable ‐ “do minimum” solution, as the 119 They are: Waste water treatment Ría de Vigo, Solid waste treatment in Galicia, Urban solid waste treatment in Lisbon and Waste water treatment in Dublin.

89
technically minimum capital expenditure to ensure compliance, is complex and, in some cases, not possible. Let’s discuss the issue with examples from the case studies.
To identify counterfactuals in the solid waste projects is relatively easier because this sector offers various technological options that range from a minimum to maximum, in a scale of possible alternatives that can be adopted to reach the stated objective120. Thus, a minimum capital expenditure to be used as basis for comparison of costs and benefits is generally identifiable121.
For example, in the solid waste treatment in Galicia project, cost and benefits were calculated net of what would have happened in a counterfactual consisting of a decentralised management of municipal solid waste, based on the use of fully legal municipal landfills, without waste separation and without electric energy production. This scenario corresponded to a do‐minimum compared with the situation before the project, particularly regarding the retrofitting of landfills. Similarly, in urban solid waste treatment in Lisbon, the continuation of the position pre‐Valorsul was not considered tenable, as it would have involved a continuation of uncontrolled and illegal dumping of waste and unacceptably poor environmental standards. Therefore, a “do minimum” option, whereby all waste is disposed of in a single large new landfill, was selected as the counterfactual. It should be mentioned, however, that both counterfactuals would comply only partially with all the requirements of the regulations122. Nevertheless, they could be plausible solutions and realistic bases for comparison.
In the two waste water projects, by contrast, the identification of a realistic “do minimum” solution, to be adopted as a counterfactual, was not possible. This is because the projects under assessment were the minimum technically possible solution to address the stated objective.
For example, under the current EU regulations, primary and secondary treatment with an advanced disinfection system are all mandatory for the treatment of waste water in large urban agglomerations123 and this is exactly what was introduced in the project waste water treatment Ría de Vigo. A similar situation applied with the project waste water treatment in Dublin. In these contexts, there was no scope to identify a possible minimum intervention capable of introducing the necessary improvements in order to comply with legislation.
Accordingly, the counterfactual adopted for these projects was that of keeping the “business as usual”, i.e. waste water continues to be directly discharged into the sea either without any
120 For example, Directive 2008/98/EC (known as the Waste Framework Directive) introduces a five‐step waste management hierarchy, where prevention, i.e. reduction of waste generation, is to be considered as the favoured option, followed by re‐use, recycling and other forms of recovery, including energy recovery through incineration and composting, with disposal to landfill as the last resort management system. The EU objective is to promote a waste management system across European regions that moves up the waste management hierarchy. 121 Also, in these contexts, other “do‐something” alternative technologies can be considered in order to verify that the chosen option is the optimal one. 122 In particular, they do not comply with the Landfill Directive 1999/31/EC, which requires progressive diversion of biodegradable waste from landfill, with targets for given years after the Directive in enacted (art. 5 (2)). 123 I.e. in agglomerations with more than 15,000 population equivalent.

90
treatment or with only primary treatment. Although this scenario would violate EU legislation, it should be considered as the only possible, realistic and technically feasible basis for comparison of costs and benefits of the option adopted.
Lesson learnt Cost and benefits need to be compared against a counterfactual scenario, consisting of what would have happened in the absence of the project. Usually the “business as usual” option, consisting of continuing with the business prior to the project, should be adopted as the counterfactual. However, in the case of projects that are motivated by the need to comply with new regulations, the “business as usual” would mean maintaining an illegal situation and so a “do‐minimum” option (i.e. the least cost project that ensures compliance) could be adopted. In these cases, the “do‐minimum” should be carefully defined, so that the counterfactual scenario is both feasible and realistic and do not cause undue and no real additional benefits or costs. In practice, however, this approach is not always feasible. In fact, owing to technological constraints, in some cases it can be impossible to identify a technically viable minimum solution capable reaching the stated objective, other than the project itself. In such cases, the “business as usual” option should be considered an acceptable counterfactual, as the only technically feasible basis for comparison of costs and benefits of the project.
5.5 DEMAND ANALYSIS: FORECASTING THE FUTURE AND TESTING THE ASSUMPTIONS
In the next stage, the analysis deals with forecasting the expected demand of users, costs and revenues from today until the end of the time horizon. Future demand of passengers, freights, volumes of water supplied, volumes and composition of wastewater discharged, tons and composition of the waste treated, etc. – on which outflows and inflows depend – should be primarily determined on the basis of the indications provided by the service operators and other stakeholders in order to derive the most likely scenario (“base case”). Care should also be taken to set the forecasts in the context of consistent international, national and regional macroeconomic conditions.
Given the specificity of this evaluation, however, this forecasting exercise turns out to be relatively less complex than in the ex‐ante appraisal. The reason lies in the fact that the projects have been already operational for a number of years so that the historical trend of their performance is available.
If there are no reasons to believe differently, forecasts shall just concern an inertial continuation of the previous trend.
To cite an example, in the Palermo water supply project, it was assumed that per capita water consumption will remain stable in the coming years, under the assumption that citizens will not change their behaviour in the use of water resources. In general, all environment projects which demand is relatively stable (e.g. just depending on population growth dynamics) should adopt this approach.
In the transport projects, the elasticity of demand to price and income (and so to macro‐economic conditions) is higher than in the environment projects. As a consequence, these projects experienced a non‐linear trend, overall consisting of a substantial decrease in traffic

91
after a systematic increase up to 2009, as a consequence of the international economic crisis. The logical approach to adopt in these case is that of maintaining the negative trend in the coming years and then forecasting a turnaround, following a progressive recovery from the crisis. Even here, the historical data available facilitates the exercise since assumptions for the forecasts can rely on previously identified trends.
For example, in Madrid Metro Line, the assumption adopted was that from 2011 to 2014 the number of users accessing the airport will decrease by 1.2% per year, which is equal to the average annual growth rate of airport passengers recorded between 2009 and 2011, as a reflection of market contraction due to the economic crisis. From 2015 onwards, a turnaround was expected and moderate growth of 1.6% per year was assumed.
In other cases, when indications exist that a substantial deviation from previous performance is expected in the coming years, forecasts should be based on new assumptions and models.
This was the case for example with the Egnatia Motorway, for which experts from the Traffic Department of the operator confirmed that traffic flows should increase substantially, with an expected positive “shock” caused by the opening of the nine vertical axes, as well as other national motorways (the PATHE and Ionian motorways).
Another example is provided by the Port of Gioia Tauro. Before the crisis, the port experienced great success, e.g. tripling its business volumes in a few years. Owing to 2009 crisis, however, many cargo operators opted to revise to revise their transport strategy and to change the route and destination port, affecting the traffic levels in Gioia Tauro. Also, traffic demand in the Port of Gioia Tauro was negatively affected by the current growth in some North African markets, which justify direct calls and decrease the relative importance of transhipment. Actually, the crisis and other factors combined to cause a 17.6% decrease in container traffic in Gioia Tauro, which substantially reduced in 2010 and 2011. In light of this scenario, a full recovery to pre‐crisis performance was not expected and thus more prudent forecasts were elaborated.
5.5.1 Sensitivity and risk analyses To mitigate the risk error when forecasting the future and to provide “margins of manoeuvre”, an analysis of scenarios should always be carried out so as to give a range of options. The scenario analysis is a specific form of sensitivity analysis124 which studies the combined impact of determined sets of values assumed by the variables that are critical for the project performance. A set of “optimistic“ and “pessimistic” values of a group of variables should be used to build different realistic scenarios, under certain hypotheses.
124 According to the EC Guide 2008 (European Commission, 2008a), the “sensitivity analysis allows the determination of the ‘critical’ variables or parameters of the model. Such variables are those whose variations, positive or negative, have the greatest impact on a project’s financial and/or economic performance. The analysis is carried out by varying one element at a time and determining the effect of that change on IRR or NPV.”
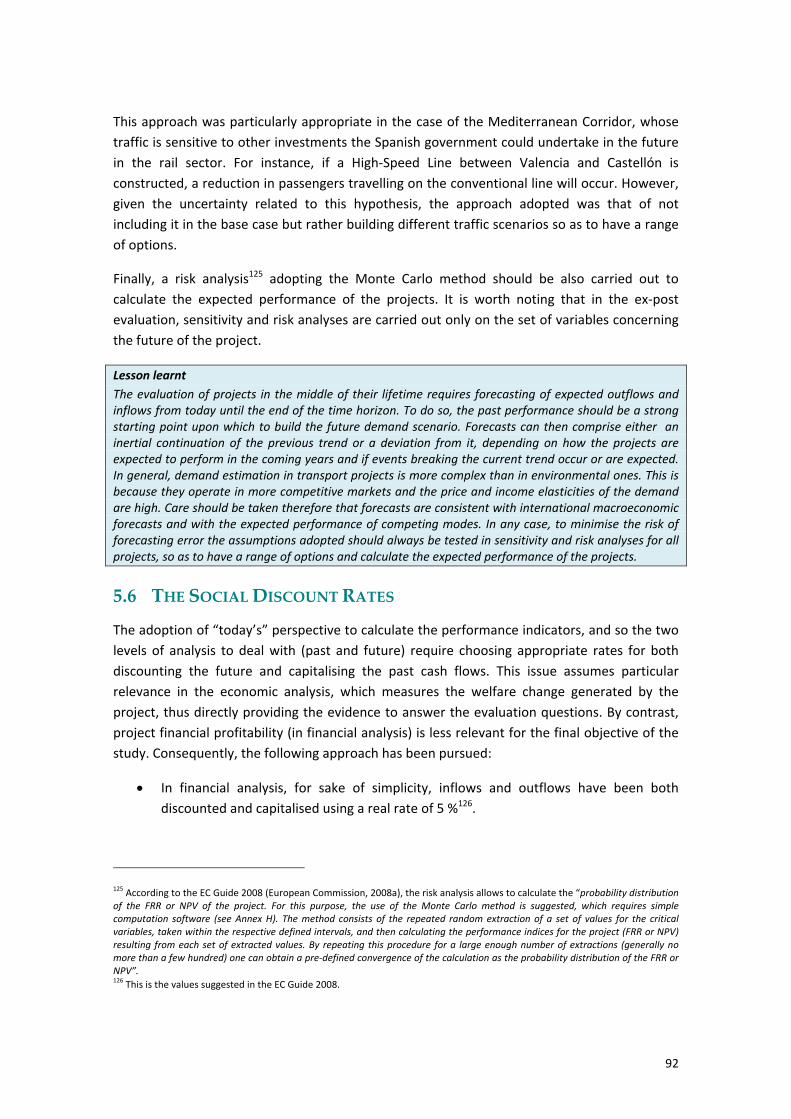
92
This approach was particularly appropriate in the case of the Mediterranean Corridor, whose traffic is sensitive to other investments the Spanish government could undertake in the future in the rail sector. For instance, if a High‐Speed Line between Valencia and Castellón is constructed, a reduction in passengers travelling on the conventional line will occur. However, given the uncertainty related to this hypothesis, the approach adopted was that of not including it in the base case but rather building different traffic scenarios so as to have a range of options.
Finally, a risk analysis125 adopting the Monte Carlo method should be also carried out to calculate the expected performance of the projects. It is worth noting that in the ex‐post evaluation, sensitivity and risk analyses are carried out only on the set of variables concerning the future of the project.
Lesson learnt The evaluation of projects in the middle of their lifetime requires forecasting of expected outflows and inflows from today until the end of the time horizon. To do so, the past performance should be a strong starting point upon which to build the future demand scenario. Forecasts can then comprise either an inertial continuation of the previous trend or a deviation from it, depending on how the projects are expected to perform in the coming years and if events breaking the current trend occur or are expected. In general, demand estimation in transport projects is more complex than in environmental ones. This is because they operate in more competitive markets and the price and income elasticities of the demand are high. Care should be taken therefore that forecasts are consistent with international macroeconomic forecasts and with the expected performance of competing modes. In any case, to minimise the risk of forecasting error the assumptions adopted should always be tested in sensitivity and risk analyses for all projects, so as to have a range of options and calculate the expected performance of the projects.
5.6 THE SOCIAL DISCOUNT RATES
The adoption of “today’s” perspective to calculate the performance indicators, and so the two levels of analysis to deal with (past and future) require choosing appropriate rates for both discounting the future and capitalising the past cash flows. This issue assumes particular relevance in the economic analysis, which measures the welfare change generated by the project, thus directly providing the evidence to answer the evaluation questions. By contrast, project financial profitability (in financial analysis) is less relevant for the final objective of the study. Consequently, the following approach has been pursued:
• In financial analysis, for sake of simplicity, inflows and outflows have been both discounted and capitalised using a real rate of 5 %126.
125 According to the EC Guide 2008 (European Commission, 2008a), the risk analysis allows to calculate the “probability distribution of the FRR or NPV of the project. For this purpose, the use of the Monte Carlo method is suggested, which requires simple computation software (see Annex H). The method consists of the repeated random extraction of a set of values for the critical variables, taken within the respective defined intervals, and then calculating the performance indices for the project (FRR or NPV) resulting from each set of extracted values. By repeating this procedure for a large enough number of extractions (generally no more than a few hundred) one can obtain a pre‐defined convergence of the calculation as the probability distribution of the FRR or NPV”. 126 This is the values suggested in the EC Guide 2008.

93
• In economic analysis, different Social Discount Rates (SDRs) have been applied, since, according to the definition provided in the Guide, “the social discount rate reflects the social view on how future benefits and costs should be valued against present ones and [...] is based on estimates of long‐term growth potentials” of a given country.
Recognizing that economic growth is not uniform between countries, different rates for different countries should be used and, within each country, two rates adopted. The following backward‐ and forward‐discounting rates have been calculated and used in this ex‐post evaluation on the basis of data collected from Eurostat, the IMF and OECD (see Table 5.1). For a detailed discussion of the methodology used for rates calculation please see Annex III.
Table 5.1 ADOPTED VALUES OF SOCIAL DISCOUNT RATE COUNTRY ADOPTED VALUE FOR THE
BACKWARD SDR (up to 2011) ADOPTED VALUE FOR THE FORWARD SDR (from 2012)
Ireland 9.1 4.0
Italy 2.9 2.4
Spain 5.4 3.3
Greece 6.1 3.2
Portugal 4.2 2.9
Source: Authors’ elaborations on IMF, Eurostat and OECD data
To verify the robustness of these values, for each project, an uncertainty analysis should test different assumptions for the SDR and explicitly consider the social opportunity cost of capital approach to verify the robustness of the model adopted (see Box 5.2).
Box 5.2 ANALYSIS OF PARAMETRICAL UNCERTAINTY The uncertainty analysis aims at testing the elasticity of the project economic performance to some methodological assumptions. In contrast to the sensitivity analysis, it does not relate to the hypotheses made on the future trend of certain variables but it is aimed at testing the robustness of some assumptions and parameters used in the economic analysis, including the Social Discount Rates. It is therefore a sort of test of the methodology used, where variations in the parameters are not the result of the uncertainty about the future but relates to methodological choices made.
Source: Authors
The application of this methodology put some hints for reflection, especially when there is a large difference between the backward and the forward SDRs.
As the SDR is a summary statistics for the social opportunity cost of capital, in principle, it is a variable depending upon the growth opportunities of the country. This is also true for several other shadow prices, which are instead usually treated as parameters, i.e. constants, in CBA. While treating shadow prices as parameters at any given point in the timeline is generally the most sensible approach, the SDR is too intimately related to growth prospects to ignore structural breaks in the country growth prospects. As it happens, this evaluation deals exactly with such a structural break in almost all the countries considered.
The pragmatic baseline approach that seems advisable is to acknowledge this fact by using a backward and forward SDR, with in fact the latter being considerably lower than the former.

94
Two subtle, and interesting, issues arise in so doing.
First, it may be the case that the forward SDR is a more realistic estimate of the social opportunity cost of the capital for an economy, as the previous growth rate was unsustainable, for example because inflated by an asset bubble or excessive debt. Hence, one should use a unique rate, the backward one being estimated by the forward one. This, however, may underestimate the potential of the economy, as the current growth prospects are hampered by structural unbalances, which manifest themselves in high unemployment rate and low utilised capacity. Using the two rates seems a realistic compromise between two possible errors in opposite directions. An alternative would be to use a midway SDR, and the impact of the different assumptions can be tested by an uncertainty analysis.
A second issue that arises when the SDR forward is lower than backward is the following one. The capitalised backward flows include most of the investment costs, and in initial years will typically be negative. The discounted future flows are made up of mostly operation flows, and are typically positive. A lower discount rate would necessarily increase the Net Present Value of the project. This may seem a paradox, as the crisis has a positive impact on the project performance. This counter‐intuitive result is, however, consistent with the fact that the low utilisation of real capital in the economy makes it less valuable, hence future flows need to be discounted less.
The Egnatia motorway offers a good example of what illustrated above. The SDRs adopted for Greece were 6.1% and 3.2%, in real terms, for respectively the backward (1994‐2011) and the forward (2012‐2024) periods. The fall of approximately 3 percentage points for the forward SDR is due to the current Greek crisis, as a result of which long‐term growth potential has been dramatically lowered. By comparing the two SDRs we can infer that, as a paradox, the project is economically viable “thanks” to the current poor economic situation in Greece, which is reflected into a low forward SDR having the effect of making the ENPV increase. If another rate, closer to the 6% used for the backward discounting, was used for forward discounting, the project would not be viable127.
However, this consideration can be misleading if one does not adopt a critical perspective on the suitability of the past data as a reliable indicator of the economic growth of the country. In fact, the value used for the backward discounting, calculated upon the average GDP growth rate reported for Greece between 2003 and 2007 (equal to 4.01%, according to the IMF), has been revealed to be unrealistic in real economic terms. It was in reality an unsustainable trajectory ending up in depression.
To a smaller extent, this situation is present also in the Irish projects, for which a decrease of the SDR from 9.1% to 4.0% has been adopted. Fluctuations of these assumptions, as tested in the uncertainty analysis, did not generate a negative ENPV, but the overall effect of a decreased forward SDR was that of boosting the economic performance of the projects. Again,
127For instance, by using the 6% for the two SDRs, the ENPV would be approximately Euro ‐1.09 Billion.

95
the question is to see whether the available data about pre‐crisis growth should be considered as a good indicator of the real economic growth of the country or not, and then choose the rates considered most appropriate.
Nevertheless, it is not the intention of this Section to enter into a complex debate about to what extent the economic growths reported in the past years for some EU countries are based on a solid economic trajectory rather than asset bubbles. What is highlighted here is just that:
• the choice of the two SDRs affects the results of the CBA analysis;
• the adoption of country‐specific reference values guarantees consistency across projects implemented in the same Member State;
• given the possible unrealism of the statistical indicators upon which SDRs are calculated, the latter should always be tested in an uncertainty analysis to verify the robustness of the model and, in case results show high sensitivity to the choice made, additional analysis should be carried out to identify the most appropriate values.
Lesson learnt In order to calculate the economic performance indicators from today’s point of view, two Social Discount Rates (SDRs) should be adopted in the analysis so as to capitalise the cash flows of the past and discount those of the future. Since the SDR depends on economic growth potentials, this generates a kind of “perverse” effect, according to which the recent worsening of the economic situation in the EU countries has the effect of increasing the economic viability of the projects. If this can be accepted overall, however, consideration should be given to the realism of SDRs adopted, which values should be always tested in an uncertainty analysis to verify that assumptions based on country macro‐economic conditions are not distorting the results of the analysis.
5.7 QUANTIFICATION OF COSTS AND BENEFITS
Given the timeframe of the ex‐post analysis, which implies going back many years, some detailed data on the past performance of the project cannot be available anymore.
This implies structuring the analysis upon categories and sub‐categories of costs and benefits in a rather aggregate way. While, on the one hand, aggregate categories of costs and benefits reduce the accuracy of the analysis, on the other, they simplify the methodology for data collection and of presentation of results.
In the following discussion, the main categories of costs, revenues and benefits considered in the ten CBAs are illustrated, together with the underlying methodological learning drawn from their practical quantification in the context of this study.
5.7.1 Costs and Revenues As for the ex‐ante appraisals, all project inputs should be divided into investment and operating costs.
Regarding investment, infrastructure construction costs should be accounted for. When available, the data to be used are the incremental cash disbursements encountered in

96
different accounting periods, disaggregated by the various types of assets necessary to build the infrastructure: land, buildings, machinery, equipment, etc. Consistently with the Guide, past investments should be treated as written‐off (sunk costs) and not included in the cash flows of the CBA. Finally, a residual value of the fixed investment should also be included within the investment costs at the end‐year128.
In the context of this evaluation, the quantification of the total cost to build the infrastructures was straightforward, although in some cases disaggregated data by cost‐item or by year of expenditure was not always available. The Port of Gioia Tauro by contrast offers an interesting example of sunk costs. The port infrastructure was built by the Italian Government between the 1970s and then it remained abandoned until the 1990s. The value of this infrastructure has been considered a “legacy from the past” and therefore excluded from the analysis.
Concerning operating costs, cash flows should comprise the disbursements, past, on‐going and foreseen, for the purchase of goods and services, which are not of an investment nature since they are consumed within each accounting period. As for revenues, they should include the past, on‐going and foreseen inflows generated by charging the users of the infrastructure.
The ex‐post quantification of the operating costs and revenues is relatively less simple than for the investment cost. The main problem consists of how to single out costs (and revenues) specific to the project only. More specifically, this problem arises when the project is part of a wider system of functionally integrated services so that it becomes difficult to hive off inflows and outflows from the totals. To isolate costs and revenues related only to the specific service provided by the project, some assumptions should be made, for example by applying a standard ratio to the totals.
This is what happened in the project for the integrated environmental regeneration of Ría de Vigo. Information about revenues and costs concerned the entire system, consisting of the water distribution service, plus the sewage service, plus the waste water treatment service, all provided by a unique operator. To quantify the operational costs of the waste water treatment service only a standard ratio of 0.7 was applied to the total costs. This ratio was obtained as an average of standard values available in the literature129 of costs related to the sewerage network and the treatment service.
Similarly, in Madrid Metro Line, operating and maintenance costs of this line only have derived by the operator on the basis of the amount of service provided by Line 8 (in terms of “trains per km”) with respect to that of the total network. In 2009, for instance, Metro Line 8 accounted for about 5% of the total service provided.
128 The discounted value of the net future revenue the project will generate after the 30th year should be included in the residual value. This should be included at end year with a positive sign within investment costs, because it is an inflow, although a virtual one. In line with the indication of the EC Guide 2008, the proposed ways to calculate it also in the context of the present study are to use the average annual net social benefits over the period 2011 to year 30 or, alternatively, on the basis of the standard accounting economic depreciation formula for assets and liabilities. 129 “Comitato di sorveglianza sull’uso delle risorse idriche (2001) and Osservatorio prezzi Emilia Romagna (2010).”

97
5.7.2 Financial analysis In the context of the Structural Funds financing mechanism, a financial analysis carried out ex‐ante has the following two main objectives:
• to assess that the project is in need of EU funding, which is proved by a negative financial profitability (i.e. FNPV(C)130 lower than zero);
• to asses that the business will be sustainable in the long run, which is proved by a positive financial sustainability (i.e. the cumulated net cash flow is never negative along the entire timeframe of analysis).
Let’s see how the relevance of these two objective changes in the ex‐post evaluation.
The first objective becomes irrelevant because financing has been already provided and the project implemented. At the ex‐post level, it can be only verified that such financing was actually needed, by recalculating the profitability of the projects. In all the ten projects observed in this evaluation, this has always been proved (i.e. all projects presents a negative FNPV(C)).
The second objective keeps its relevance, but changes its connotation. This is because the simple comparison between revenues and costs generated by a stand‐alone project (as happens ex‐ante) is not a sufficient indicator of the likelihood sustainability of the service under evaluation. In principle, a project can show positive cash flows, but with the operator not in the overall financial position to ensure its operation and maintenance.
Vice‐versa, a project can show negative cash flows, but the operator can be in a position to cover the shortages. This is what happened for example in the case of the Egnatia motorway, where the late introduction of the toll made the project not self‐sustaining. However, the operator, a fully state‐owned company, has been able to run the service thanks to the current funding from the Ministry of Public Works.
Thus, instead of focusing on the project itself, one should rather assess the overall financial “solidity” of the operator. In other words, an assessment of the long‐term financial position of the municipality, the railway operator, the port authority, etc. should be carried out by calculating the standard accounting indicators such as EBIT (Earnings before Interest and Taxes), ROA (Return on Asset), etc. Also, it should be noted that, when the operator is a state‐owned company, its solidity also depends on the financial and institutional agreements in place with the government.
In light of the above considerations, the results of the financial analysis, as intended and used in the standard CBA model used ex‐ante, are less relevant for the final objective of this ex‐post study and should be considered as a pure methodological base for the economic analysis.
130 I.e. the financial return on investment.

98
5.7.3 Benefits Different approaches developed within different CBA traditions may be applied to benefit evaluation, the approaches being the general equilibrium, on the one hand, and the partial equilibrium, on the other (see Box 5.3). In the choice between a partial versus general equilibrium approach an important consideration is that ex‐post CBA encounters data limitations. Accordingly, a mixed approach can be the most appropriate solution. This means that in economic analysis shadow prices should be adopted to correct cost factors to reflect their opportunity cost. By contrast, for each of the benefits identified, two alternative approaches can be used. One consists of applying conversion factors to the financial values of the operating revenues to capture with shadow prices the welfare change produced. The other consists of evaluating the benefit by means of willingness‐to‐pay. The two approaches being mutually exclusive to avoid any double counting.
The use of conversion factors for the inputs is discussed in the next section, while the methodological learning about benefit quantification in the context of this evaluation is discussed below.
Box 5.3 GENERAL VERSUS PARTIAL EQUILIBRIUM The General equilibrium approach of CBA maintains that, where market prices are distorted, a set of shadow prices must be computed. Shadow prices are in principle the solution of a social planning problem and should be used systematically in the calculation of the net social profit of a project. Shadow profits, or economic profits, are general equilibrium measures that are defined in such a way as to include all the direct and indirect, market and non‐market effects, so that one does not need to sum welfare effects in each market and for each agent. Thus, whenever the project shows a positive net present value at shadow prices, it means it increases social welfare. If it has not, it decreases it. The Partial equilibrium approach stresses the concepts of consumer and producer surplus131. Summing these two welfare measures, one obtains a first component of the social welfare associated with the availability of one good. To obtains the entire picture, welfare effects in secondary markets (as well as externalities), must be added, because of complementarities and substitution effects. In other words, CBA in partial equilibrium basically implies measuring effects on all the different agents affected by a project and then summing them. The addition of single welfare changes for each agent involved in the production of the service plus the welfare change of the users is a proxy of the net social surplus generated by the project132.
Source: European Commission, 2008a
The main cross‐cutting lesson is that different typologies of effect are accounted for in each sector, reflecting the different methodological approaches that have been developed within the general CBA framework. In principle, these methodologies do not differ from those which are used in the ex‐ante evaluation. Technically speaking, the only difference can be that the
131 Given a Marshallian demand curve, with quasi‐linear preferences, and a supply curve in one market, the consumer surplus is the excess of the willingness‐to‐pay over the price paid and the producer surplus is the excess of revenues from tariffs over costs. 132 In this regard, in practice, it is important to avoid double counting the benefits. For example, the inclusion of financial inflows accrued by the project producer(s) together with the consumer surplus does not constitute a double‐counting of benefits, as long as the willingness‐to‐pay (in which the consumer surplus is included) is considered net of the tariff paid. On the other hand, if the price the consumers would be willing to pay is simply multiplied by the volumes supplied, financial revenues must be excluded, so as not to be counted twice.

99
ex‐post evaluation offers the opportunity to observe already materialised impacts and so a wider range of techniques for benefit monetisation.
The ex‐ante appraisal usually focuses on the output of a project (be it drinking water provision, purified waste water, passengers carried, etc.) and makes an effort to assign a unit money value to the volumes produced or carried. By contrast, the ex‐post evaluation, occurring later in time, can also focus on the impacts that have been generated by the provision of this output. To give an example, in a project aimed at drinking water treatment, instead of valuing the purified water because it will be beneficial to health, ex ‐post one could directly evaluate what has been the benefit to health generated by the systematic provision of purified water, e.g. saved costs for hospitalization. A similar approach could be adopted, by looking at the increased business volumes induced thanks to reduced travel times for freight. Two considerations should be done in this regard.
First, this distinction is merely technical, as, from a conceptual point of view, the two approaches have the same underlying logic. In fact, ex‐ante, a money value is given to the output exactly because it should produce an expected impact in the long run.
Second, the approach focussing on outputs is more prudent because it avoids the risk of assigning to the project a set of long‐term impacts that are reported in a given sector, and which can in fact be the consequence of a mix of factors, not attributable to the project only. Again, in the example of the drinking water treatment, if one imputes to the project benefits all the costs for hospitalization saved thanks to reduced morbidity of a water quality‐related disease, it is likely to overestimate the benefits of the project. More likely, this reduced morbidity will be the consequence of a mix of factors, including –but not exclusively – the project. Thus, one should make an additional effort to single out the share of benefit attributable to the project only. Similarly, in the other example, a new road is likely to contribute to the creation of new businesses in its area of influence but other factors may be important too. Thus, again, a complex exercise of “isolation” of effects should be carried out.
In light of these considerations, a more prudent approach focussing on the evaluation of project outputs appears preferable in the context of the ex‐post evaluation too.
In the following, the methodologies adopted in the study and the lessons learned in the quantification of different typologies of benefits are discussed.
5.7.4 Direct effects Direct effects – defined as impacts on the users of the infrastructure – should be always included in the analysis, as they are relatively easy to measure. However, the methodology for the quantification of the direct effects differs between two sectors and subsectors.
In transport, users’ willingness‐to‐pay for direct effects can be proxied by applying the concept of consumer surplus, defined as the welfare change of the users of the service thanks to the new investment, net of the tariff/tool paid for travelling, which accounts for the producer

100
surplus. The consumer surplus should be evaluated as the sum of single beneficial effects accruing to users.
In the five transport projects analysed, the key direct effects that was possible to measure have been: travel time savings, reduction of vehicle operating costs133 and reduction of accidents134. In particular, travel time saving was the leading effect that accounted for most of the consumer surplus. This has been evaluated in four out of five projects, given that for the Port of Gioia Tauro its application was not feasible (see Box 5.4 for a discussion about the evaluation of time).
Box 5.4 EVALUATION OF TIME SAVINGS The time saved by the users of the infrastructure is the most common benefit accruing to transport projects. Its evaluation consists of quantifying the minutes saved by travelling from one to another point thanks to the new or improved infrastructure and then applying a unit money value to the saving. For benefit monetisation, unit VTTS (Values of Travel Time Savings) can be extracted from HEATCO135 and applied. These values are country specific and depend on macroeconomic conditions of a country. Accordingly, it is usually suggested that the values should be allowed to grow over time, following real income trends, with an elasticity that has been evidenced to be between 0.7 and 1. Thus, since benefits are estimated on the basis of a mix of macro and micro‐economic variables (GDP, public expenditure, population preferences, etc.) it makes sense to use VTTSs that change over time. However, one should not confuse the technicality of valuing and monetizing a benefit with the meaning of the benefit itself. In any CBA it is ‐ in fact ‐ important to limit the influence of external effects (such as GDP trend) and focus on the variables that are under the control of the project. For example, a project whose economic performance is positive only because estimates grow together with GDP is too sensitive to external impacts. Inconsideration of this, for sake of caution, the methodology adopted assumed a value of time constant over time to avoid project benefits being affected by external variables.
Source: Authors
In environmental, willingness‐to‐pay can be determined in different ways. One method is to estimate it as the avoided cost for the alternative purchase or self‐production of a good/service of the same quality at the same quantity. Another is the so‐called “Benefit Transfer”, which is the practice of adapting economic values estimating the benefit for the use of an environmental asset, which are available in the literature, to evaluate other similar services or infrastructures for which an economic value is not available. The results obtained in one context are then transferred to another where the value of the same benefits has to be estimated. Other methods are the contingent evaluation, i.e. to ask directly to users how much they would be willing to pay for the environmental improvement, or the “revealed method”,
133 Please note that these effects can occur either to users, and are thus considered direct impacts, or to other parties not using the infrastructure, and are thus considered indirect. For example, a new rail investment may have the effect of making travel journeys safer (direct) but also of reducing the congestion on a road network which now benefits from fewer car accidents (indirect). 134 Ibidem. 135 HEATCO, 2005, Developing Harmonised European Approaches for Transport Costing and Project Assessment ‐ Deliverable 5 Proposal for Harmonised Guidelines.

101
i.e. to derive it by observing consumers’ behaviour and the purchases made in a similar market136.
In our study, the quantification of the willingness‐to‐pay proved to be feasible in three out of five environmental cases. The methods adopted have been the avoided alternative cost for self‐production and the Benefit Transfer. The former was adopted in Water supply of Palermo, where willingness‐to‐pay was valued on the basis of the avoided cost to purchase, operate and maintain pumping stations and tanks that would have assured the same quantity of water for households and industries137. The latter was used in the cases the integrated environmental regeneration of Ría de Vigo and Dublin waste water treatment.
On the contrary, in the solid waste field, the willingness‐to‐pay approach was not followed. In accordance with the general equilibrium approach, the alternative method of applying a conversion factor to the tariff(s) paid by users (i.e. the municipalities served in these cases) has been therefore applied to reflect the benefits deriving from the activation of a solid waste collection, selection and treatment system.
5.7.5 Externalities and indirect impacts Externalities138 and/or indirect impacts139 (e.g. changes in the markets for substitute goods) should be quantified on a case by case basis and valued only if the data allows for it. Since the these effects are extremely project‐specific, and the range of possibilities is wide, they should be valued, wherever possible, with the technique most appropriate for each specific case, as suggested in the Guide (e.g. benefit transfer, hedonic prices, willingness‐to‐accept, etc.). In the following a brief description of the most important indirect and external effects identified in the two sectors is provided.
In transport, the quantification of indirect impacts resulted feasible for effects including the reduction of vehicle operating costs and accidents due to less congestion in the network from which traffic has been diverted. For example, the project Mediterranean Corridor has contributed to shift to rail passengers from the road and air networks, which resulted to be (relatively) less congested. Benefit quantification consisted of applying unit values available in the literature140 to the estimated number of vehicles (or passengers for air) remained on the road (air) network.
As far as environmental externalities are concerned, the two main effects that were accounted for in the transport CBAs have been the increase/decrease of CO2 and noise emissions due to
136 See EC Guide (2008). Annex F. Evaluation of health & environmental impacts. 137 Another alternative method, tested in the project, is the reduction in the number of complaints regarding water service
provision. In the water services field, in fact, the number of complaints is recognised to be a reliable indicator of the level of service quality, and is used worldwide both by academics and by suppliers as proxy of the willingness‐to‐pay.
138 An externality is defined as any cost or benefit that spills over from the project towards other parties without monetary compensation. 139 Indirect effects are defined as quantity or price changes occurring in secondary markets thanks to the project. 140 Estudio de Optimización Funcional del Ferrocarril en el Corredor Mediterráneo”. November 2000.

102
the increase/decrease of traffic on road. It is straightforward that the two motorways (M1 and Egnatia motorway) generated a negative effect on CO2 and noise emissions, having increased the number of vehicles on the road. By contrast, the two rail projects (Mediterranean Corridor and Madrid Metro Line) generated the opposite effect. Similarly to indirect effects, the quantification of these effects consisted of applying unit values derived the literature141 to the number of vehicles added or avoided to the road thanks to the project.
In environmental, a key indirect effect of the two solid waste projects is, amongst other, the energy recovered by the facility, which avoids electricity generation somewhere else relying on fossil fuels. Its quantification has been carried out by calculating the shadow price of the electricity produced. For example, in the urban solid waste management in Galicia, in order to estimate the shadow price of the operator’s energy sales, the 2011 price of electricity in Spain and Portugal was considered, assuming that the energy sale price is equal to the production cost142. A weighted average of the energy prices has been computed, by considering the different shares of energy production of each country in the Iberian market143.
Benefits from energy production are also associated to saving of emissions produced in the process of energy generation. In particular, by producing energy the projects enable the saving of emissions that would have been produced by an alternative mix of energy sources. To quantify this benefit, the energy production mix of the Iberian market (considering Portugal and Spain) has been calculated and the corresponding emissions for the amount of energy produced by the operator quantified144, while different sources were used to estimate the damage cost per kg of emission into the air.
In the water and waste water projects, no indirect or external effects have been accounted for, also in consideration that the environmental improvement developed within these projects should have been already captured by the willingness‐to‐pay.
5.7.6 Avoided costs The capital expenditure that would be borne in the counterfactual scenario, and which is avoided thanks to the project, should be accounted for within the benefits. This avoided or hypothetical expenditure should be valued as the opportunity cost (and thus the shadow price) of the pre‐existing infrastructure which gets used in the project.
This benefit arises when the counterfactual scenario envisages other alternative uses or other technologies that would have generated a social cost.
141 In the specific, the DG TREN 2008 Handbook on estimation of external costs in the transport sector. 142 The latest data are available for the period January‐September 2011 (source: Quarterly Reports on European Electricity Markets of the European Commission http://ec.europa.eu/energy/observatory/electricity/electricity_en.htm). 143 Approximately 85% for Spain and 15% for Portugal. 144 The Spanish and Portuguese production mix has been estimated on the basis of Rede Eléctrica de España (2010) and Rede Eléctrica Nacional (2010). The source for the emissions for each power plant is the Database on life cycle emissions for electricity and heat generation technologies (updated to 2008) CASES, 2008.

103
This type of benefit has been valued in two out of ten projects, namely the port of Gioia Tauro and the integrated solid waste management in Northern Lisbon. In the former, it was considered that the (abandoned) port area could have been used for purposes other than the construction of a transhipment port, e.g. agriculture, fishing, shipbuilding, tourism, etc. Accordingly, the concession fee that would have been paid by other companies or individuals to carry out commercial activities was used as a proxy of the opportunity cost of the port infrastructure. In the latter case, the saving in social and environmental costs associated to landfills, which would have occurred in the counterfactual scenario, has been accounted for and valued with shadow prices.
5.7.7 Non quantifiable effects Impacts that cannot be quantified and valued should be considered as part of a qualitative analysis, together with other purely qualitative effects, such as institutional learning or political awareness. The ten project analyses offer a wide range of these effects that have been duly discussed in the previous sections of the report.
Lesson learnt Ex‐post evaluation implies going back many years. This affects data availability and makes it necessary to introduce simplifications to the standard, fully‐fledged, CBA model, which is used in the ex‐ante evaluation. To deal with data limitations, costs and benefits have to be treated in a rather aggregate way. However, if on the one hand standard aggregate categories limit the accuracy of the analysis, on the other, they ensure a smooth methodology for data collection and for presentation of results. Cash flows to be used in the financial analysis are the same of the ex‐ante evaluation. However, in the ex‐post evaluation, the calculation of the project’s financial profitability is less relevant than in the ex‐ante because the financing decision has been already taken. In economic analysis, the methodologies adopted in the ex‐post evaluation to identify, quantify and value social costs and benefits do not differ, in principle, from the ex‐ante evaluation, although the ex‐post evaluation offers the possibility to evaluate long‐term “impacts”, in alternative to short‐term “outputs”. However, the approach of evaluating long‐term impacts is more risky since in this way one can impute effects that are not attributable to the project only but rather caused by a mix of factors.
5.8 SHADOW PRICES
To reflect the opportunity cost of inputs, also in the ex‐post evaluation, the cost items of financial analysis should be converted into shadow prices145, by means of appropriate conversion factors. In the application of this methodology, the following methods should be adopted:
• whenever possible, specific conversions factors for each category of cost should be derived from national guidance documents. In the absence thereof, conversions factors should be estimated on the basis of expert opinion.
145 It is worth mentioning that, as illustrated above with the use of the shadow prices for benefits, conversion factors have not been applied only to the cost items of the financial analysis but also to revenues.

104
• When the above approach is not possible, country‐specific Standard Conversion Factors shall be used.
• For labour146, regional‐specific shadow wages available in the literature should be adopted (see Annex III). However, where considered more appropriate, country‐specific shadow wages, calculated on the basis of a formula for which the conversion factor is inversely correlated to the level of unemployment147, could be used.
Table 5.2 provides the set of conversion factors that have been used for the main cost items in the context of this evaluation. For the Italian and Spanish projects, some conversion factors could have derived from national guidance notes148, while country specific Standard Conversion Factors have been calculated see box below.
Table 5.2 ADOPTED CONVERSION FACTORS IRELAND ITALY SPAIN GREECE PORTUGAL
Project design 0.989 0.997 0.997 0.997 0.994
Expropriations 0.989 0.648 (*) 1.3 (**) 0.997 0.994
Labour (***) 0.98 0.77 0.85 0.72 0.93
Civil works 0.989 0.8840 (*) 0.9 (*) 0.997 0.994
Equipment 0.989 0.8850 (*) 0.997 0.997 0.994
Maintenance 0.989 1.0182 (*) 0.82 (*) 0.997 0.994
Extraordinary maintenance
0.989 1.0182 (*) 0.997 0.997 0.994
Other 0.989 0.997 0.997 0.997 0.994
Note: (*) national guidance documents; (**) Expert opinion; (***) The conversion factors for the shadow wages are drawn from Del Bo et al. (2011), see Annex III. When not specified, the standard conversion factors have been used.
One of the main issues concerning shadow prices and specific to the ex‐post evaluation is that two sets of conversion factors can be developed for the two levels of analysis (past and future), following the same logic adopted for the Social Discount Rate. This is because the social opportunity cost of a good or service can change over time, as a reflection of changes in fiscal requirements, levels of administered tariffs, composition of non‐efficient markets, and so on. However, the markets where these analyses have been performed (i.e. the EU‐15) can be considered relatively stable, and definitely less dynamic than for instance in developing countries, where distortions of the market prices can be more significant. Accordingly, in light
146 For wages, it is common to use a conversion factor less than one. The shadow wage is region‐specific, because labour is less mobile than capital. Empirical studies applied to different developing countries, provide estimations for conversion factors for labour, ranging 0.36 for working children in farm households in Nepal to 1.29 for self‐employed rice‐producing households in Côte d’Ivoire (see Del Bo, Fiorio and Florio, 2009). 147 The formula is: SWR = W(1‐u)(1‐t)where W is the market wage, u is the regional unemployment rate, t is the rate of social security payments and relevant taxes. The conversion factor is (1‐u)(1‐t). See the EC Guide 2008, Annex D.
148 For Italy: Guida NUVV. Rete dei Nuclei di Valutazione e Verifica degli Investimenti pubblici (2003), Studi di fattibilità delle opera pubbliche. For Spain: Spanish Ministry for Transport (1996), Manual para la Evaluación de Inversiones en Ferrocarriles del Ministerio de Fomento.

105
of the negligible effect the development of two sets of conversion factors would have had on the results of the analyses, the evaluators decided not to undertake this approach.
Another issue is that, given the use of aggregated cost‐items, many conversion factors also have to be aggregated. In these cases, when the accounted item is a combination of other primary items, the conversion factor is calculated as a weighted average of the factors included in the table above149.
Box 5.5 STANDARD CONVERSION FACTOR (SCF) METHODOLOGY AND CALCULATION
The standard conversion factor is an approximation that is used to convert the prices of minor non‐tradable goods into border prices. As defined in the Guide, this value is estimated on the basis of national imports and exports, as well as on the taxes paid on them, as showed by the formula below:
SCF= (M + X) / [(M + Tm) + (X + Tx)] where M is total imports (C.I.F.), X is total exports (F.O.B.), Tm is taxes on imports and Tx is taxes on exports. The SCF has been calculated on the basis of Eurostat data, considering an average of 15 years (1994‐2008). The results of this exercise are presented below:
Note: Data are in Millions of Euros. Indicators used for the calculation are the following: Export duties and monetary compensatory amounts on exports (TX); Taxes and duties on imports excluding VAT (Tm); Exports of goods and services (X); Imports of goods and services (M).
Source: Authors
Lesson learnt As with the ex‐ante evaluation, the key concept regarding the use of accounting or shadow prices in economic analysis, based on social opportunity cost, instead of prices observed in the market, remains valid. Given the twofold nature of the analysis adopted, as for the Social Discount Rate and other parameters, developing two different sets of conversion factors (one backward and one forward) would be appropriate. However, such an approach in the context of the EU‐15 would produce negligible effects on the final results of the evaluation. Thus, the application of one set of conversion factors throughout the whole time horizon is justifiable.
149 For example, in the Port of Gioia Tauro, the port services’ other costs are assumed to be composed of a small share of
equipment costs (30%) and by a larger one (70%) of other costs, including, as instance, energy. The conversion factor for this item is calculated as a sum of the base conversion factors, properly weighted, of ‘equipment’ and ‘other costs’.
IRELAND ITALY SPAIN GREECE PORTUGAL
Imports 88,453 307,08 210,479 63,662 50,262
Export 103,662 322,71 186,856 41,845 38,505
Taxes on imports 2,13 1,71 1,20 296. 526.
Taxes on exports 0.0 0.0 0.0 3.5 0.0
STANDARCONVERSION FACTOR 0.98 0.99 0.99 0.99 0.99

106

107
6 CONCLUDING REMARKS AND RECOMMENDATIONS
6.1 ANSWERING THE EVALUATION QUESTIONS The ToR for this study asked four evaluation questions. Here we summarise our answers, further elaborate on them drawing more general conclusions, and offer some specific recommendations for the future.
What kind of long‐term contributions can be identified for different types of investment in the field of environment and transport infrastructure?
The cases under review indicate large uncontroversial and steady contributions to economic growth and social welfare. Not only, in line with the findings of the traditional growth theory, does investment in infrastructures trigger economic growth (in terms of real growth in GDP), but it also provides broader effects in terms of user welfare (for example through the provision of improved public services). Channels of influence between infrastructure endowment and economic growth are mostly direct (enhanced efficiency in the system, better user productivity, new business opportunities) but also, to a lesser extent, indirect (improvement in human capital, endogenous technological progress and organisational change). Transport projects can produce important effects in terms of direct economic growth, mainly through travel time savings, resulting in productivity gains and induced effects on regional development, while economic welfare is more central for environment projects. However, the typology of infrastructure also matters; for the two incinerators reviewed, for example, business opportunities are an important driver of direct economic growth effects, which can take place beyond the local level. Environment projects record slightly lower levels of endogenous growth effects than transport projects, given the less complex technology.
Positive contributions are also recorded on quality of life (effects on social and territorial cohesion, environment, institutional quality and social happiness), however with a larger variability between projects. In particular, territorial cohesion has been promoted more by transport infrastructures, while for environment is more of a side effect. Social cohesion effects are generally side effects, but they can reach significant magnitude if appropriately exploited. Environment projects produce, as expected, positive environmental effects, although their full achievement is hampered by various operational difficulties, while transport projects produce environmental effects, albeit positive, usually only as a side effect. Institutional learning effects are overall low (due to lack of critical mass) and even lower for environment projects, mainly because they are managed at a regional or local level. Finally, social happiness effects are relevant both in negative and positive terms and can be influenced by proactive measures. They can have important consequences for projects, especially when they give rise to organised forms of expression (vested interest).

108
What is the minimum and average time needed for a given long‐term contribution to materialise and stabilise? What are these time spans for different types of investment in the field of environment and transport
infrastructure?
Overall, the majority of effects detected appears to have already stabilised, either in the short (i.e. from 1 to 5 years after project completion) or in the long run (more than 6 years after project completion). However there are also significant factors which are not yet stabilised, mainly direct growth effects. For transport projects (e.g. Port of Gioia Tauro, Egnatia motorway and Mediterranean Corridor) more time is needed for these effects to stabilize. For environmental projects (e.g. solid waste treatment in Galicia and waste water treatment in Ría de Vigo) the stabilization of direct growth and environmental effects is linked to the consideration that future developments such as further investments or behavioural improvements are often expected to have an additional positive effect. As far as territorial cohesion effects are concerned, they have stabilised more homogenously in the long run. Effects on institutional quality, which are marginal for all the projects, tended to stabilise in the short run for environment projects, and in the long run for transport projects. Finally, social happiness is an effect that has temporal horizon patterns that are essentially project‐specific. In any case, the evidence suggests that a five year lag from completion is the minimum required time to see significant stabilisation of effects.
How are these long‐term contributions generated for different types of investment in the field of environment and transport infrastructure, i.e., what is the causal chain between certain short‐term socio‐economic returns and long‐
term returns from investment?
Determinant factors of project outcomes relate to the way the project interacts with the context (appropriateness), the technical features of the project (design), the capacity to predict future trends (forecasting capacity), the division of roles and responsibilities (governance) and the managerial capacity to react to unpredicted events (managerial response). Some of those factors (appropriateness to the context and managerial response) generally positively contributed to the projects, regardless of the sector of intervention; another factor had an average negative effect (project governance). The infrastructural sector matters in particular as far as project design is concerned, with positive scores recorded on average for transport projects and negative scores for environmental ones. In this case, it seems that the compelling necessity of complying with EC regulations that characterise some environment projects takes place at the expense of good quality planning.
The causal chains linking those factors to project performance are diverse and not straightforward. Context influenced in many different ways project design: this was determined to varying extents by time, space and budgetary constraint and reflected different socio‐economic and political factors. In general, projects adapt to the context rather than influence it. Project design is a weak point of environment projects. They were adversely affected by budget and time constraints, forecasting mistakes and social pressure, and they

109
lacked the necessary flexibility. On the face of it, transport projects are generally characterised by very efficient and effective designs. Good forecasting of demand can be very important to decide on an appropriate design or to set adequate tariffs. Projects rely to different extent on tariffs to ensure financial sustainability but in general they do not incur financial difficulties. Governance is one fundamental factor accounting for project performance. While environment projects appeared to be vulnerable to social pressure, transport ones sometimes provided cases of good practices (e.g. the establishment of a dedicated commercial publicly owned company). Finally, appropriate managerial response can palliate deficiencies in terms of design, governance or forecasting but it entails costs.
Different identified drivers are strongly interlinked: they combine in different ways following project‐specific and difficult‐to‐predict patterns. However some rules emerge as well. Specifically, design and governance are the two legs upon which a project stands. Appropriate responses to weaknesses in those two dimensions materialise in the long‐term. Forecasting capacity and managerial response are factors that can impinge on either one or the other, either positively by offsetting deficiencies, or negatively if they are wrong or insufficient, but usually they are less critical. They have an indirect impact on project performance via design or governance.
To sum up, for a project to be successful, both design and governance should be well‐tuned with a precise and specific vision of what the project wants to achieve. This variable is only partially in the hands of project promoters. In some cases the national or regional governance should facilitate the necessary adaptation. So if the vision is right, if it proposes an appropriate articulation of constraints and opportunities, this augurs well for further developments. Overall, at some risk of oversimplification, it is possible to say that a good vision adapted to its context determines a relevant governance structure and an appropriate design. Forecasting and managerial response are there to prevent or palliate deficiencies.
What are the existing evaluation methods to capture a given long‐term contribution for different types of investment in the field of environment and
transport infrastructure?
Aware of the challenges the evaluation remit posed, the present study followed an innovative methodological approach i) combining micro and macro dimensions of analysis, ii) relying on economics and other social‐sciences perspectives and iii) combining quantitative and qualitative techniques. The scale of the project under assessment, the timeframe of analysis and the nature of observed effects called for hybrid methods of assessment in order to combine different sources and typologies of evidence. This approach proved to be effective. More generally, a suggested sound methodological approach for ex‐post evaluation relies on the following three elements: a mix of qualitative and quantitative methods, extensive use of fieldwork and the comparison of a wide‐ranging sample of data sources (including press articles, minutes of parliamentary hearings, judicial records and so on) to ensure that all the relevant voices are taken into consideration.

110
In addition, the present exercise tested and developed a comprehensive approach to ex‐post Cost‐Benefit Analysis which is a recommended tool for the quantitative ex‐post assessment. The advantage of undertaking a Cost‐Benefit Analysis is, among others, the ability to compare against the ex‐ante forecasts on the basis of a consistent methodology. Moreover, the existence of a methodologically sound forecasting model produced in the ex‐ante stage and the use of actual and structured data from the monitoring system, can minimise the data requirement to undertake such an exercise.
6.2 WHAT WE HAVE LEARNT What can we learn from a small number of in‐depth project histories? The question is similar to what can we learn in general from past history. No country is identical to another: geography, culture, political and social institutions vary across space and time. Although economic circumstances may superficially look similar in two countries or towns in a given period of time, any economic process of production and consumption is embedded in a complex idiosyncratic pattern of social relations.
The experience gained from many days spent travelling in the field at the project sites and evidence collected from almost one hundred interviews with stakeholders, citizens and journalists taught us that a clear idea of ‘what is’ a project needs interactions and primary information. The evidence collected shows how the outcomes of development projects are the result of the frantic mishmash between incidental environmental, socio‐economic, institutional and cultural circumstances and the managerial responses produced by the project. The chains of causality appear rather loose, especially when comparing apparently similar projects which however generated radically different outcomes, so that identifying some key rules that can be valid in a broader context seems too ambitious. The sense of wonder and mystery recalled by Hirschman at times prevails over scientific wisdom.
“[...] my hidden agenda: to endow and surround the development story with a sense of wonder and mystery that would reveal it to have much in common with the highest quests undertaken by human kind”. (A.O. Hirschman, 1967)
Disentangling the impact of economic change from a number of concurring forces is intellectually challenging. A combination of qualitative and quantitative analysis is necessary but usually not sufficient, and in most cases we need to conjecture on the drivers of history and of counterfactual histories. The evaluation work carried out in this context was similar to digging different layers of ground to discover buried structures. We learned that with such a long‐term perspective, ex‐post evaluation is far from being based on hard facts alone. It needs a dose of intuition, if not creativity, in trying to distil lessons learned.
"The outstanding fact is the extreme precariousness of the basis of knowledge on which our estimates of prospective yield have to be made. Our knowledge of the factors which will govern the yield of an investment some years hence is usually very slight and often negligible. If we speak frankly, we have to admit that our basis of knowledge for estimating the yield ten years hence of a railway, a copper

111
mine, a textile factory, the goodwill of a patent medicine, an Atlantic liner, a building in the City of London amounts to little and sometimes to nothing; or even five years hence. In fact, those who seriously attempt to make any such estimate are often so much in the minority that their behaviour does not govern the market." (J.M. Keynes, 1936)
After a full immersion in project histories, i.e. “ after a serious attempt to make any such estimate”, the evaluator has possibly achieved a certain degree of confidence in the learning process involved in studying investment trajectories, from early conception to operation to the materialisation and, to some extent, stabilisation of long‐term effects. This confidence can be translated into a set of conjectures, supported by the findings of the ten case histories and further understanding of the evaluators of what can be construed as a list of ingredients of success for public investment projects.
6.2.1 The origin of project ideas: entrepreneurialism within government There is a fundamental difference between a project promoted by government and an investment by private firms, even when the objects are apparently similar. In a market economy, private entrepreneurs or the management of a large company, identify an opportunity for profit from a wide array of opportunities, and submit their ideas to shareholders, collaborators, financiers and licensing authorities, struggling to get their project idea approved and implemented. The risk is distributed in various ways, but in quite a precise sense decisions can usually be traced back to a very small number of project promoters.
In government, there is formally no entrepreneur or individual policy‐maker, who takes the responsibility for decision‐making. Project ideas, however, are not fortuitous events. Even in the public sector, in any place and time, there are opportunities for investment. These usually compete for scarce funds, either provided by taxpayers, or savers through public debt, or project‐finance players, and eventually transfers from other public bodies. The grants provided by the European Union to finance specific projects are part and parcel of this competition of ideas for funding of public investment. While in the private sector, good ideas possibly translate into profitable businesses, in the public sector good ideas are those that enhance social welfare, a more subtle and less well‐measured concept. What we want to stress here is the linkage between good ideas and good projects.
In line with the institutional literature150 and further investigations about the role of public entrepreneurship in state‐owned enterprises151, there is evidence that although hierarchical structures and compliance with rules may leave limited room for innovation, a pivotal role in project development is played by teams and managers in the public sector adopting risk‐taking and innovative behaviour (“intrapreneurship152”).
150See in particular Suddaby et al., 2009. 151 See for example Bernier and Hafsi, 2007. 152 "Intrapreneurship refers to employee initiatives in organizations to undertake something new, without being asked to do so." (Source: EIM, 2008). Intrapreneurship is also a practice of corporate management aimed at enhancing entrepreneurship. The term

112
Trivial as it may seem, the first step for a successful public investment project lies in an environment within government that first, encourages new ideas, and second, selects the good ones through a fair competition process. In most cases the project “entrepreneurs” within government will not be clearly identified and remembered, but they have lived and struggled through long meetings and procedures to have their ideas translated into a viable project, against inertia or conflicting ideas and interests.
We have found evidence that the precipitation of successful project decisions is critically linked to a governmental environment that is open to fresh ideas (in some cases born of specific entrepreneurial actors), motivated only by a long‐term vision of social welfare. A clear example is the Palermo water project, where its success, in an extremely difficult social context, can be traced back to the empowerment of professionals on the board of directors of the municipal water company, breaking old habits of appointments to these managerial positions. There are other good examples in our small sample where the injection of high professionalism and creativity in the public administration was a key success factor.
In some cases the entrepreneurial role can be played by a private actor, with a pivotal role in identifying a good opportunity with potential spillovers in terms of territorial development. This is the story of the Gioia Tauro port, whose origin was the visionary intuition of a private entrepreneur who succeeded in convincing the national government of the strong potential for territorial development in his project idea. In the start‐up phase of the transhipment hub construction the private operator responded promptly to the impasse among the public actors by taking actions and implementing on its own (including investing extra money up‐front in anticipation of funding) some of the investments expected to be carried out by the public sector.
We insist that this is needed at the early conception stage, as no good project is likely to derive from bad ideas, and good ideas need a certain type of creative people. The first building block of an investment strategy for the public good is providing room for such teams within government, or in alliance with government.
6.2.2 Professionalism as a built‐in insurance mechanism A closely related, but distinct, success ingredient is the attraction around the project design and implementation of good professionals. While successful project ideas do not necessarily require high skills on the part of their promoters, as vision is more important, their technical design, the implementation strategy and supervision, need adequate human capital. Usually, the entrepreneurial spirit promoting good project ideas includes awareness of the importance of professionalism for project implementation.
The public sector in all the Member States, but particularly in lagging‐behind regions, competes with the private sector in recruiting skills. In the private perspective, acquiring the
was first used in a paper written in 1978 by Gifford and Elizabeth Pinchot. Later the term was credited to Gifford Pinchot by Norman Macrae in the April 17, 1982 issue of The Economist.

113
services of high quality human capital is closely linked to project profitability. In the public perspective, ensuring a high‐profile team of professionals enhances project resilience and is a risk mitigation measure.
The case histories in our sample provide instructive examples of significant injections of professionalism into public agencies implementing major infrastructure projects. The Egnatia project was implemented by a dedicated independent agency staffed with high level professionals, trained in technical as well as managerial skills by a private firm providing technical assistance and advisory services in the start‐up phase. This proved to be a key success factor: proper adjustments to the original design reduced the risks of delays and cost escalation in the construction phase after the discovery of archaeological sites.
A different choice was made for the Madrid Metro Line construction, whose responsibility lay with the Community of Madrid rather than a private company. Here, the project benefitted from the longstanding experience in similar projects of the three Project Managers, advised by the best Spanish experts in tunnel excavation in soft soils.
All investment projects need careful design and proactive management for the simple reason that usually no project is identical to another. Hence, the project design needs adaptation and quick response from management to unforeseen circumstances. In our sample we have three pairs of projects: two waste management plants, two waste water treatment plants and two highways. While some similarities are apparent, even basic technological choices differ widely because of variations in local circumstances.
The variability of construction and operation conditions, across space and time, and the way they interact with the evolving circumstances of the context in which they are implemented are so wide that any major project, whatever its detailed engineering, is surrounded both ex‐ante and on‐going in a cloud of uncertainty. Uncertainty about the actual construction costs because of the discovery of archaeological sites during excavation153, about the behaviour of users and of competing transport modes154, about legal procedures in an unstable institutional environment, about the global competitive scenario for freight transportation155 and so forth. Indeed, every deviation from the ex‐ante forecast due to unexpected events needs a prompt and appropriate reaction to keep project implementation on track and ensure a smooth attainment of the expected results.
In this context, the only viable way to partly ensure against such uncertainty is to have project designers and managers who are trained to deal with a variety of circumstances. This is something that is achieved only by experienced and knowledgeable professionals who have seen in practice many similar projects in different conditions and are not surprised or embarrassed to see that the world around the project is in a state of flux and needs continuous adaptation. Ensuring that such teams are in charge of the project design, construction, and
153 As happened during the construction of the Egnatia motorway. 154 As for the Mediterranean Corridor case. 155 As for the Port of Gioia Tauro.

114
later on its operation, is the best insurance mechanism against uncertainty, and a critical success ingredient.
6.2.3 Social ownership to cope with civil claims In contrast to most private sector projects, public infrastructures are a notable example of the need to establish social norms that go beyond property rights in their strict legal meaning. Establishing a new plant for the production of cars, or a new commercial venture in the suburbs, may raise some concerns among local residents, but these concerns are constrained by the rule of law. If building permissions, emissions standards and so on are respected, any residual objection by residents usually is contained. Thus, while social acceptance may be an issue occasionally for private projects, it is usually not such a central concern as for public infrastructure.
The core issue is that citizens feel that they have ownership rights over their territory more intensively when they are affected by infrastructure financed by taxpayers’ money. The issue of social acceptance then poses itself possibly as an issue of violation of fundamental rights by government bodies, who in turn are more influenced by such claims. The waste water treatment project in Dublin shows how disruptive the effect of citizens' claims can be if not appropriately and timely dealt with. The Valorsul case also shows the influence of specific interests over the design and the resulting negative effects on project performance.
Hence, another ingredient of success for a major public project is to establish as early as possible a mechanism that gives a specific context to social ownership claims. This can be done through environmental education, as the Valorsul project shows, or in other ways, such as public consultation and hearings for residents and for all concerned parties, or even by an effective communication campaign. Social acceptance is part of the development process and can play a decisive role in the success or failure of a project. Raising the appropriate level of expectations in the population is also an important ingredient. In the Gioia Tauro project the unrealistically high expectations of the population, due to past failures of a number of public initiatives promoted in the same area, is the cause of the negative effect in terms of social happiness recorded ex‐post. The same holds true for the Mediterranean Corridor, where failure to meet all the expected objectives is at the root of widespread feelings of frustration and lack of confidence about the future of the Corridor.
By contrast, a positive sense of social ownership is part of the success of a project and it translates into a sense of pride and identity on the part of the beneficiary population. An example of a positive civic pride impact is provided by the M1 motorway in Ireland, where the Boyne Bridge constructed along the motorway has become something of an iconic image for the population and even appeared on sports logos.
The promoter of a public infrastructure should be aware that it is better to hear claims (for instance by environmental associations in Galicia) earlier than later, and in a structured and formal way, with shared and clear rules rather than in a chaotic and unpredictable way over the long years of construction and initial operation. Designing such mechanisms is another

115
form of insurance against uncertainty, but it goes beyond that, as it is intrinsic to the public mission of a government‐sponsored project to achieve a feeling of ownership on the part of the citizens. The media are full of histories of project failures determined by a perhaps technically well‐designed project, but entirely lacking in social communication and empowerment of local communities.
6.2.4 Forecasting and monitoring as learning devices Under close scrutiny, the ability to forecast into the distant future, as required for public infrastructure such as a major motorway (Egnatia) or a solid waste plant (Valorsul) is necessarily very limited. This point was acknowledged by Hirschman decades ago (and even earlier by Keynes in his analysis of macro‐economic instability156). We have collected wide evidence of deviations between initial forecasts and observed project performance, and we are not surprised to find this. It would be a misunderstanding of the rules of the investment game to conclude that because forecasts are so difficult, they are not worthwhile. The opposite is true. We submit the view that struggling to squeeze out the available information at the early stages of project conception, and guessing its future, is another ingredient of success for two reasons. First, because such initial effort amounts to a way of testing the project design along a number of unknown dimensions of the future. In so doing, the project promoter and designer acquire precious knowledge of what can go wrong, and can think in terms of cost and benefits of risk mitigation. Second, because having a forecast at time T0 offers the important opportunity to monitor project performance at time T1, against the previous expectations. Even the extreme case of the Palermo water supply system, where the forecasts of water demand pointed to an increase in the resident population while the opposite actually occurred, illustrates that the simple existence of a number of explicit assumptions on future demand made it possible to quickly adapt the project design according to the most up‐to‐date information on population trend.
Again, the forecasting effort should not be spent only in the initial phase of the project, it is needed during the whole project time horizon. In the Gioia Tauro case history, for example, the forecasts provided by the private operator proved to be realistic and underpinned by a thorough understanding of the shipping market context and development scenarios. However, the current global shipping market scenario is evolving in such a dramatic way that the key assumptions of the forecasting model are now severely challenged.
The learning process in fact can be described as the constant comparison of what we expect with what we observe, and the divergence is in a deep sense our way of questioning our mental models, and improving on them. In this perspective, a major project, with a time horizon of several decades, is potentially a powerful learning device. You start with the initial model of project performance and then over time you learn and change or adjust your model. But to do this, you had to invest in forecasting in the first place, and you have to establish a monitoring system which is an intellectual exercise, much beyond auditing expenditures or
156 Keynes, 1936.

116
physical indicators. The two things, forecasting and monitoring, should possibly be planned from the beginning and delegated to professionals with sufficient continuity over the years: learning, after all, should be accumulated by somebody, or it will be lost.
6.2.5 Governments and projects We have found relatively limited evidence in our evaluation that major projects are able to change government, while we have abundant evidence that governments influence projects, not always for the better.
Starting with the first issue, while some evolution in public sector arrangements is correlated with major projects (examples are the experience of new bodies established for motorway planning in Ireland and Greece in response to pressure from the EC), the causality is uncertain. This is however not surprising. The public administration involved is often much bigger in terms of number of employees, capital owned, legal power, than most project organisations. The time horizon of the project is long, but the public administration time horizon is even longer, and in a sense is endless, as government may conceive of itself as the custodian of the interest of the current and future generations combined. All this creates an inertia, which is not easily shaken by the force of the project as a driver of change. It might be the case that the project has created the need for new technologies, administrative arrangements and social responses, but for the existing government machinery this is only one among many facts of life, and it will tend to be digested and diluted by traditional ways of doing things. In this perspective, it is overstating the case to suggest that a major project can change the public administration and policy‐making for the better.
It is more likely that the opposite would happen. Local interests may alter the constituent features of project design (such as the metro stop added in the Madrid line, or the route of the Mediterranean Corridor revised several times, or plant location for the Valorsul project) and weaken its unitary conception to allow for distributing rents (or just political support), changes of local government can interrupt the development of a plan (Palermo and Gioia Tauro), lack of coordination by public authorities can create gaps in implementation and so on (Ría de Vigo).
Another aspect of the governance issue which should be carefully considered is related to the institutional relationship between the project’s stakeholders, especially public ones, which pre‐exist and cannot be changed by the project itself. This is the case with the large degree of autonomy of Galician municipalities hampering the demand forecasting exercise in the Sogama project, or the substituting power of the region which enabled the Augas de Galicia to take over responsibilities when municipalities were unable to manage their water treatment facilities, in the Ría de Vigo project. However, some mechanisms could have been put in place by the Region to more precisely quantify the potential beneficiaries of the Sogama project, without limiting the autonomy of local authorities: higher involvement and discussion with municipalities since the early stage of project conception, in particular, could have helped to give Sogama more definite indications of the project’s demand

117
Clearly, high standards of government quality will do much to improve the project’s chances. Democratic accountability of the administration, its transparency and integrity, professionalism of civil servants, and the best possible selection of policymakers can do a lot to contribute to project success, and the reverse to diminish it. Having said this, from the perspective of individual project planning and funding, one needs perhaps to be less ambitious. If the project cannot change the government for the better, at least one should design an appropriate relationship between the project team and public officials. An arms’ length relationship is often described as a key success factor. Full independence of the project manager would amount to privatisation de facto or de jure, and privatisation without competitive markets or appropriate regulation is a highly questionable arrangement. Full subordination of management to government would confuse roles and in some case pave the way for corruption and rent extraction from the project. The middle course is however only a generic prescription, and needs to be tailored case by case. The important point is that the design of such a project governance system, i.e. a careful balance between managerial discretion and accountability to government, if absent, would unavoidably expose the project to some disruption, either during construction, or operation, or both. Hence, having a governance idea in the first place is another ingredient for success in our short list.
6.2.6 Incentives for success and identity While the internal project incentive structure was not at the core of our evaluation, we conclude that no public investment project can perform well without the right incentive mechanism in place. Again, it may be helpful to think of differences compared to the private sector. Here the incentives are clear, and directly or indirectly boil down to monetary rewards for shareholders, managers and employees (in varying proportions). Moreover, these monetary incentives are also in place with public sector projects, when – as is usual ‐ governmental bodies require public procurement and turn to private companies for construction and in some cases for operations. Therefore, there are powerful external forces around the public infrastructure project that pull it in certain directions. To resist, the management (and government at large) should have their own countervailing mechanisms.
One such mechanism, explored by recent literature in economics and social sciences, is the specific identity of public sector managers and employees. We have found some evidence of this in the projects we have analysed, with interviewees who were proud of their achievements. Even without money attached, a reward in terms of reputation and a feeling of ‘mission accomplished’ for project managers is important, for example as we have observed in the managing body of Egnatia (in a difficult general situation for the country) or in the water company of Palermo. It is not by chance however that such behaviour was observed for these two projects, since this aspect is strongly connected to professionalism.
We are not aware of monetary rewards linked to project performance in the ten case‐studies we have analysed, but we would suggest that this issue should be further studied. The employment and wage impact of the projects was never a crucial aspect, but good management was, and the public sector competes with the private sector to attract skills. It is likely that the combination of monetary and identity incentives is different across types of

118
individuals, and that public sector projects attract people who care more about identity than about income. But this should not be taken for granted, and in the long‐term the design of incentives related to the success of the projects in terms of their own social objectives should be in place.
6.3 RECOMMENDATIONS Major projects, as defined by art. 16.2 of the ERDF Regulation 2082/1993, reiterated with art. 40 of Regulation 1083/2006, are a critical ingredient of Cohesion Policy. Successful major projects positively contribute to economic growth, social welfare and quality of life. Their significance in terms of capital costs, absorption of EU Funds, their visibility with the wider public, and the level of expertise required for their implementation call for well‐tailored arrangements and approaches.
Since the initial design of 1993, the institutional context in which the decision‐making process on major projects takes place has radically changed. After the enlargement process in 2004 the infrastructural investment needs are now more focused in the EU 12, where technical and institutional capacity in project preparation and appraisal had to be significantly improved. In order to support this process the EC and Member States supported several capacity building initiatives. Among others, JASPERS157, was launched in 2005 helping to improve the quantity and quality of project coming forward for approval.
The legislative proposals for Cohesion Policy during the period 2014‐2020 currently under discussion move towards further decentralization to Member States of major projects selection. Thus, the EC is called to play a more strategic role in the upstream phase of OP negotiation and prioritisation.
Although the present context is different from the one in which the project under assessment were initiated (i.e. in the 1990s), and is still evolving, there are a number of relevant recommendations emerging from the evidence collected with the present study. It is not within the remit of this ex‐post‐ evaluation to assess the current approach to major project financing, or to propose a new frame. What we do here is just to distill some lessons learned from the evaluation. Recognising that these lessons are drawn from 10 projects in 5 Member States of EU15 the suggestions provided here, although taking into consideration the current debate on the post‐2013 cohesion policy, are necessarily exploratory and broad in scope and would need to be developed in the specific context of each Member State. Their implementation would require joint action by the different players, especially the European Commission and Member States, within the scope and limits of their responsibilities.
157 Joint Assistance to Support Projects in European Regions, a dedicated initiative managed by the EIB and co‐sponsored by the European Commission, the European Bank for Reconstruction and Development (EBRD) and KfW Bankengruppe

119
6.3.1 Project identification and formulation: a systematic and consistent planning function
At the very initial phase of the project cycle there is the need to ensure that good ideas are generated while “white elephants”158 are killed off. An innovation capacity within the public administration of the Member States is a key‐ingredient that should be ensured from an early stage. More specifically recommendations on the identification phase are to:
• Develop “intrapreneurial” teams in public administration. Managing Authorities should promote innovative capacity inside public administration in relation to major infrastructure projects. Task forces within the planning units of Managing Authorities should systematically carry out preliminary studies aimed at identifying a relevant social need to be addressed and deciding whether the project concept is valid. They should be carried out in different sectors or fields of interventions in order to explore promising project ideas159. Within such sectoral or territorial task forces we suggest the promotion of managerial schemes that stimulate public administrators or development agencies to identify and select competing project ideas160: competition for good project ideas should be encouraged as a permanent feature of the appropriate governmental levels. The EC should encourage the Member States to put in place such teams at national and regional level.
• Establish a close relationship between project identification and planning. The Managing Authorities should also ensure that project identification and prioritisation is underpinned by a robust and forward‐looking development strategy. Planning units within the Managing Authorities should be able to stop or restructure those project ideas developed in isolation and motivated by too specific, local or myopic visions. By contrast, priority should be given to projects which are part of a wider regional or sectoral development plan. The inclusion of a project idea into the pipeline must be justified at a very early stage, on the basis of considerations related to the effectiveness in the contribution to the strategic development objectives, the expected socio‐economic benefits, the readiness in project preparation and conditions that may influence its preparation. If the justification is not convincing, the planning units should assist the project beneficiary in reconsidering the project design or the decision to undertake it. For environment projects compliance with EU Directives is a necessary but should not be considered a sufficient justification. When different options are available, compliance should be achieved through project solutions maximizing social welfare. Improvement of the linkages between planning and
158 The term is used for initiatives whose costs (especially operation and maintenance costs) are disproportionate compared to their usefulness. 159 Potential areas for public investments must be explored within the scope of national/regional infrastructural priorities, and may be for example the provision or the amelioration of services of general interest, the removal of bottlenecks in transport networks, the pursuing of environmental protection. 160 Within large corporations "intrapreneurship” schemes are where managers are incentivised to propose innovations. These schemes are aimed at developing a dynamic management by encouraging managers within large organisations to behave like entrepreneurs, by providing resources to be spent on projects of their choice.

120
major project identification is a second area of potential collaboration between and the MS and the EC.
• Endorse a role of policy advisor for the EC. The EC should carefully consider how to play an advisory role to the Member States in relation to the above challenges, particularly by contributing to the design of a reliable mechanism to ensure that the selection of projects is consistent with the overall development planning framework. For example, the Operational Programme should include a description of the planning process leading to the identification of the list of major projects and the contribution they provide to strategic objectives. In addition, the EC should consider providing support to the Member States in developing guidance notes and methodological tools on project preparation and appraisal (this is further discussed below).
6.3.2 Project design and selection: an investment in technical expertise Once the project identification has been completed, the Member States should select the most promising project option and develop a feasibility study. Major projects need major technical skills: the Member States should guarantee high quality standards for ex‐ante feasibility studies. Technical assistance activities during project preparation should be strengthened and the appropriate technical expertise, including that provided by the EIB and JASPERS, should be more systematically mobilised. Recommendations on project design deal more specifically with the following:
• Provide solid technical design and forecasting. Project design should be aimed at selecting the technical option which best adapts to the context, ensuring a significant degree of flexibility for later adjustments. Demand analysis is often the most critical aspect. A serious and technically sound forecasting effort should be promoted as the basis for later monitoring processes. In fact, even when based on weak assumptions, the existence of a forecasting model is a powerful tool in the hands of skilled managers, enabling them to adapt to new conditions during project implementation.
• Develop sound and reliable cost‐benefit analyses. The development of national manuals, training and technical assistance enhancing CBA expertise and practice should be encouraged by the EC. The Member States should be urged by the EC to develop key parameters, methodologies and reference values for benefits calculation tailored to the national and regional context in order to support project preparation and ensure methodological consistency and reliability. This includes for example consistently valuing CO2 emissions, travel times, shadow wages, etc. for each country or group of regions. Project analysts should be aware that the value of a sound CBA does not stem from a single number, but from the existence of a development concept underpinning the key analytical assumptions, whose ownership and responsibility shall remain within the project beneficiary.
• Cost benefit analysis as key input of the selection process. Good ex‐ante Cost‐Benefit Analysis (including a comprehensive set of analyses, based on the six steps –from objectives

121
to risk assessment‐ illustrated in the DG Regio CBA Guide 2008)161 is the proper tool to guide the understanding of the project’s key potential and challenges in the light of social welfare objectives. Managing Authorities should promote and prioritise projects with a higher positive expected ENPV, resulting from a convincing CBA. In cases where an environmental project is mainly driven by compliance, the CBA is still useful to highlight to what extent the directive is welfare‐enhancing. Cost‐Benefit Analysis reports could be make available to the public in order to facilitate public debate.
• Promote an independent quality review. Project selection should be made based on the most accurate and comprehensive set of information, also for accountability purposes. The quality of feasibility studies and related ex‐ante analyses should be assessed by independent experts in a consistent way throughout the EU27. The EC should consider developing a comprehensive methodological guideline to support a consistent approach to project appraisal. For example, a project scorecard system or other forms of project rating systems could be an appropriate tool to appraise the quality of major project feasibility studies entering the pipeline. In other words, it is not enough that a quality check just states that the feasibility study is acceptable. The assessment of the evaluators should be based on the quality and comprehensiveness of the project dossier as well as on the level of risks entailed by the operations, possibly with a consistent format across the EU.
• Make social acceptance part of the process. Social acceptance by the affected population is an essential ingredient of project success. For this reason steps should be taken to design a framework to systematically inform, involve and share responsibilities for decisions about project design at the formulation stage of major projects. Different mechanisms could be suggested. One of the most structured and effective is to organise public hearings (along the lines of what is done in some member countries for Environmental Impact Assessments162) both before approval and during implementation of the project. However, such mechanisms are time‐consuming, therefore care should be taken in fixing and agreeing the timeline of the process from the beginning. The capacity to design and endorse clear ‘rules of the game’ minimises the risks of late and usually much more costly adjustments to social claims. The EC can disseminate across the MS the best international experience in this area.
• Design responsive governance arrangements. The feasibility study should pay attention to the governance arrangements, including necessary changes to be carried out at the Member State level. The relationship between the beneficiary and the Managing Authority responsible for project implementation should be designed in order to ensure that the essential autonomy is in place in the operational implementation while enforcing the
161According to the CBA Guide (2008), the six steps along which a project appraisal report should be structured are the following: Socio‐economic context and objectives; project identification; feasibility and options analysis; financial analysis; economic analysis; risk assessment. 162 Environmental assessment can be undertaken for individual projects on the basis of Directive 85/337/EEC (known as ‘Environmental Impact Assessment’ – EIA Directive) or for public plans or programmes on the basis of Directive 2001/42/EC (known as ‘Strategic Environmental Assessment’ – SEA Directive).

122
pursuit of a social welfare objective. It should also include a comprehensive stakeholders mapping and an analysis of the institutional relationships between the public actors involved in the project, highlighting the specific conditions and potential constraints which may hamper future effective sharing of responsibilities. The selection of public managers or private partners involved in the project implementation should be made through open and transparent competitions rewarding professional merit and technical competence in order to ensure a prompt and suitable managerial response to shocks during project implementation.
• Ensure financial sustainability. Mechanisms to ensure financial sustainability should be part of the project design. The issue is already dealt with in the CBA Guide as far as the construction and operational phases are considered, but the ex‐post evaluation reveals that this is in area that needs greater scrutiny. A vague statement that the Member State will cover in some way any cash needs of the project over its life is not a promising approach to planning the financial sustainability of the project. In cases where project revenues need to be complemented by public funds during project operations to ensure long‐term financial sustainability, these appropriations should be established by specific laws or other budgetary provisions. The project dossier should clearly state when such conditions occur. In some cases this could imply engaging in a discussion between the EC and the Member States about tariffs on the service implemented. In line with the EU legislation and directives in this area, the Member States have a primary responsibility in establishing the desired mix of tariff revenues, debt (e.g. project bond finance) and budgetary transfers (in compliance with State aid rules) to sustain their infrastructure investment. However, the project analyst should be aware that if Member States shifts such decisions to the future it is de facto circumventing the requirement for financial sustainability in the first place.
• Design solid risk management schemes. Proper risk analysis should be carried out, highlighting the potential sources of future uncertainty and the probability of their occurrence. A detailed risk management plan should be designed including the highlighting of the risk sources, identifying possible mitigating measures and the share of responsibilities among the project stakeholders in implementing them, according to the proposed project governance structure. As part of the technical assistance facilities for project preparation we suggest that Risk Management Guidelines for major projects are prepared by drawing from the evidence on ex‐post deviations collected.
6.3.3 Project implementation: systematic monitoring and latitude Project selection should be seen as the start rather than the end of the process. Systematic follow‐up measures and restructuring activities should be allowed. Recommendations on project implementation are the following:
• Undertake systematic monitoring. Project implementation should be monitored and be made public across several socio‐economic and financial dimensions in order to identify deviations and review project development effectiveness. Records for the duration of project implementation should be kept in order that the learning process is not lost.

123
Specific attention should also be paid to i) projects approved but indicated as particularly risky (i.e. those inherently more uncertain or those submitted with a less convincing set of ex‐ante analyses); ii) risks threatening the achievement of the development objectives of the project; iii) the evolution of the project's financial conditions and iv) the evolution and performance of the governance structure.
• Allow restructuring and redesign. During project implementation, in cases of severe deviations from the ex‐ante forecasts or modified contextual conditions, projects should be restructured to improve effectiveness and address risks of underperformance. In case of a lack of a proper managerial response, the Managing Authority should put pressure on the beneficiary to take corrective actions. Within the limit of its responsibilities, such pressure can take the form of required restructuring, suspension of payment or cancellation of further funding.
6.3.4 Project closure: incentive schemes and learning The systematic and critical observation of a project’s performance brings relevant lessons for the future and is an essential requirement for accountability. The project life should be tracked and, as far as possible, the evidence made public. Moreover, based on the evidence collected a system of rewards should be allowed. More specifically:
• Carry out ex‐post evaluation. The EC should systematically implement ex‐post evaluation, since the informative and heuristic potential of such an exercise is valuable. It should be carried out as far as possible on a balanced sample of major projects at least five years after the project commencement of operations, although it is likely that long‐term effects are not yet stabilised. The Managing Authority should cooperate by disclosing data and information, especially as far as the financial performance of the project is regarded. The focus of the analysis should be the degree of effectiveness in achieving the development objectives and the reasons explaining the observed performance. A guiding tool could be the ex‐ante project appraisal: the ex‐post assessment should focus on checking to what extent the weakest aspects identified ex‐ante actually affected project performance. A recommended methodology for evaluation is a mix of quantitative and qualitative approaches, in the line with what has been developed and tested with the present exercise. Ex‐post CBA is a recommended tool of analysis, on the quantitative economic dimensions, to be integrated with the other important social dimensions.
• Reward good projects and teams. The Member States and the EC should be aware that good project ideas and successful projects originate within good governments and administrations. Well‐performing project teams are to be encouraged. After tracking the project performance, and having clearly identified the management in charge of the project, success should be rewarded though appropriately designed incentive mechanisms, including for example a highly visible special mention by the EC of good practice (this is occasionally, but not systematically done already) possibly based on assessment by a high‐profile international jury of experts.

124
• Promote knowledge transfer and sharing of best practice. The EC is in the best position to play a pivotal role in enhancing the professional and managerial capacities at the Member State level through knowledge transfer. The EC should encourage the sharing of experiences among Member States, for example by ensuring specific sectoral guidelines are developed (e.g. on water treatment, solid waste management, metro lines, optical fibres, etc.) taking stock of the know‐how developed at national and regional level, preparing handbooks of best practice, and organising workshops developing practical experiences, possibly involving project managers as both lecturers and recipients of training.
• Track project life: a project data warehouse. The EC should promote the setting up of a data warehouse collecting in a systematic and organised way the full set of documents and information on the projects through their entire life cycle. Project files should include application forms, cost‐benefit analyses, notes of inter‐service consultations, results of the project appraisal, completion report, monitoring reports, ex‐post evaluation reports, restructuring arrangements and audit reports. Public access to the data warehouse (or some sections of it) should be decided, according to the EC Access to Information Policy. In addition, a database collecting and comparing ex‐ante estimates and ex‐post results of key financial and economic data (by sectors and typology of projects) could provide a good basis for ex‐ante forecasting and risk assessment. For example, the distribution of the variations between ex‐ante and ex‐post cost and benefit values can support specific risk tests.
Figure 6.1 SYNTHESIS OF RECOMMENDATIONS ON PROJECT LIFE CYCLE
Source: Authors
Provide solid technical design and forecastingDevelop sound and reliable cost‐benefit analysesCost‐benefit analysis as key input of the selection
Promote an independent quality reviewMake social acceptance part of the process
Design responsive governance arrangements
Ensure financial sustainabilityDesign solid risk management
schemes
Develop ‘intrapreneurial’ teams in public administrationEstablish a close relationship between project identification and planningEndorse a role of policy advisor for the EC
Carry out ex‐post evaluationReward good projects and teamsPromote knowledge transfer and sharing of best practiceTrack project life: a project data warehouse
Undertake systematic monitoringAllow restructuring and redesign
Identification and
formulation
Design and selection
ImplementationClosure

125

126
ANNEX I. THE TEN CASE STUDIES IN A NUTSHELL
THE PORT OF GIOIA TAURO This case study illustrates the story of the Port of Gioia Tauro, a major infrastructure investment co‐financed by the European Regional Development Fund (ERDF) in the period 1994‐1998. More specifically, this is an ex‐post evaluation assessing the long‐term effects produced by the project and interpreting the key determinants of the observed performance. It is an innovative evaluation exercise given the long‐run perspective (30 years), which extends into both the past and the future, and requires a mix of retrospective and prospective analysis.
The analysis draws from an ex‐post Cost‐Benefit Analysis ‐ CBA and from an extensive set of qualitative evidence, both secondary (technical reports, official reports, press articles, books and research papers) and primary (17 interviews with key stakeholders and experts have been carried out in the period May‐July 2011).
Defined as ‘the metaphor of a modernisation process without development’ or the ‘largest industrial development project ever promoted in the Mezzogiorno’163, the Port of Gioia Tauro is an emblematic story of great business success and unexploited potential for local development: the project has generated very different long‐term effects with regard to the various stakeholders. It was initiated in 1994 thanks to the visionary intuition of a private entrepreneur, who asked the Italian Government for a concession to use the existing, unused, port infrastructure in Gioia Tauro as a transhipment terminal hub (a container terminal dedicated to transloading containers from mother vessels to small feeder vessels directed to regional ports).
The existing port had been built twenty years earlier to serve a major steelworks project which never came to fruition. The equivalent of more than EUR two billion164 was spent by the Italian government to build this infrastructure, which remained unused for two decades while many different (sometimes bizarre) potential uses were the subject of seemingly never‐ending discussions. When a private entrepreneur came with a very promising business plan and the commitment to invest some EUR 150 million in the operation, the Italian government saw a unique opportunity to finally provide a use for the port with a high developmental potential. In addition to national public funds for infrastructure works (some adaptations were needed to the existing port), and private funds for equipment and machinery, the European Commission co‐funded the private operation (which was considered a productive investment) through an ERDF grant of EUR 40 million in current terms.
163 Italian Parliament, 2008. 164 In real terms at 2011 prices.

127
The construction of the port was concluded in 1994, while the operational phase started the following year. The total past investment amounted to EUR 418 million, 85% of which was privately sustained by MCT and 13% was co‐financed through the ERDF. Some resources from the European Social Fund and national public authorities (about EUR 8.4 million) were allocated to provide MCT employees with training courses. The following Table summarizes the total investments costs occurred since the initial financing year until today.
OVERVIEW OF INVESTMENT COSTS AND SOURCES OF FINANCING Financing period 1994‐2009
First year of operation 1995
Total investment costs (2011 prices) EUR 418 million 100%
Sources of financing and co‐funding rates over the total investment costs
Cohesion Fund EUR 0 0%
European Regional Development Fund EUR 55.6 million 13%
European Social Fund EUR 6.3 million 2%
European Investment Bank EUR 0 0%
National‐regional‐local public contribution EUR 2.1 million 1%
Private capital (MCT) EUR 345 million 85%
After fifteen years the assessment of the economic impact of the project is mixed, and stresses the multi‐faceted dimensions of development plans. On one hand the transhipment hub proved to be quite a successful business operation, especially in the short and medium run. Thanks to the effects of globalisation which shrank commercial transport costs, a boom in freight transportation in the Mediterranean Sea from the Far East, and the strong location of the port, Gioia Tauro became in a few years the premier transhipment hub in the Mediterranean, handling one‐and‐a‐half million containers annually and with the four largest shipping lines calling to the port. It was (and remains), however, a risky business operation because of the socio‐economic context and dependency on highly volatile global demand.
On the other hand, although the terminal operator provided one thousand two hundred direct jobs and a further eight hundred jobs were generated in related activities, the expected long‐term development effects, in particular in terms of industrial development in the surrounding area, did not materialise despite much effort (and money) being spent to that end. Wider effects of efficiency on the Italian and Mediterranean port system are additional benefits of the project, but they did not materialise at the local level and did not affect the living conditions of the local population.
The current situation at the port is a vast and well‐equipped port terminal with a huge but practically empty industrial zone behind it. The port business is currently carried out by two port operators, one being by far the most relevant, but which is currently strongly challenged by market fluctuations and the global economic crisis. According to the EU Commission criterion, up to now the project has proven to be not financially sustainable, as its cumulated net cash flows have not been positive each year since the start of the operational phase.
In terms of long‐term development effects the current analysis shows that:

128
• In the early 1990s, the beginning of transhipment activities brought significant efficiency improvements (cost reductions) to the global logistic supply chain, benefitting transport operators and internationalised business. The Gioia Tauro transhipment hub came at the right moment to participate in this reorganisation of the global logistics systems.
• In terms of socio‐economic development the port produced fairly positive results, as confirmed also by the results of the cost‐benefit analysis. The main driver of the net benefit is the employment created165, with likely effects on local unemployment. Additional positive impacts flow from the efficiency gains the entire Italian and Mediterranean port system achieved, thanks to the expansion of transhipment activity in Gioia Tauro.
• Further positive impacts flow from the learning effects, for both private and public actors, in terms of how to deal with transhipment activity. It has been reported that employees, trade unions, and business associations benefitted from being involved in such high‐tech activities.
• Negative impacts are recorded in terms of a sense of frustration the local people experienced, due to the lost promise of widespread development that the port operation was expected to bring to the entire area. Social distrust and disillusionment are tangible effects and are likely to influence future actions regarding the port.
It should be borne in mind that these considerations strongly rely on the assumptions made regarding the future of the port in the prospective analysis, which, according to the evaluators, in the most probable scenario is going to experience slightly increased traffic over time166. Scenario analysis shows that the above results are subject to a high degree of uncertainty, the possible scenarios ranging from a catastrophic situation with the discontinuation of the port activities, to the recommencement of significant traffic growth in the near future with the implementation of new investment plans.
The current situation in fact is one of deep crisis for competitiveness reasons, and the port is at a turning point. Since 2007 the container terminal has suffered from increased competition from North African ports (Port Said and Tangier in particular), which have heavily invested in transhipment activities. The 2008 financial crisis made competition even fiercer and the lack of a prompt response led to the loss of the port’s main clients, Maersk (the largest shipping line, providing 40% of the total traffic) being the most recent departure in June 2011167. At the same time, a Framework Programme Agreement (FPA) signed in September 2010 by the main public parties under the auspices of the European Commission, which supported it and provided indications and suggestions as to how to strengthen some of its key aspects (governance and strategic vision), is going to provide EUR 450 million for additional 165 Which has been captured in the Cost‐Benefit Analysis by a low shadow wage. 166 A 2% annual rate of growth is assumed from 2012 onwards. 167 The transhipment hub has currently only one major client, Mediterranean Shipping Company‐MSC.

129
investments in the next three years, with the aim of improving the efficiency and overall performance of the port, in particular by strengthening the railway connections, building a rail gateway within the port area and supporting logistics activities. However, the implementation of the plan has been severely delayed.
The results of the current analysis of the project’s long‐term development effects are based on the expectation that the port will slowly regain its past traffic flow and market share, although it will not return to the strong growth rates experience previously, as the strategic objectives of the FPA would claim. This is based on the lessons learned regarding the key determinants of the performance of the project.
The analysis in fact shows that a key determinant of the past, present and even future performance of the port is the governance structure of the port and the broader area of Gioia Tauro (including in particular two industrial zones located close to the port area), which has been always characterised by fragmented actions and lack of coordination and clear political will. The number of actors, poor strategic direction, perhaps some vested interests at national, regional and local level and, finally, conflicts between local authorities are responsible for the current state of play and are the main difficulty to be resolved going forward. In addition, the weakness of the overall transport (and more specifically port) strategy at national level has exacerbated the existing governance problems. On top of that, the strong presence of organised crime in the territory, favoured by the weakness of the governance structure, has certainly played a negative role by discouraging business creation and imposing extra security costs.
In this picture, the European Commission has played a relevant role over the course of the years. On one hand it provided financial support through the Structural Funds in different phases168, enabling the implementation of accompanying actions addressed at supporting broader socio‐economic development and, on the other, it supported and steered the planning efforts aiming specifically at overcoming the well‐known governance constraints (for example it was on request of the Commission that a Master Plan was prepared in 1997 and again it is thanks to the Commission that the latest FPA has developed using an integrated approach). Notwithstanding this commitment, it could not influence in a determinative way the key limitations of the governance structures, which do not impact the programming phase but paralyse the implementation process, during which the Commission has little or no role. The only instrument the Commission had to hand were conditionalities on the timing and destination of funds. This was however not enough to make the difference.
At a broader level, from a purely developmental perspective, the limited appropriateness to the context (in terms of institutional, cultural and socio‐economic characteristics) of the key rationale of the initial financing decision should be acknowledged: triggering a growth enhancing path through the support of a container terminal hub was too ambitious and highly 168 in addition to the initial ERDF grant the Structural Funds co‐financed staff training on transhipment activities – European Social Fund ‐, the construction of the platform for modal shift – ERDF ‐ and a global grant for new business to locate in the industrial zones – ERDF ‐ and, finally, the latest FPA.

130
risky in the socio‐economic context of the Calabria region. In fact, transhipment by design does not lead to immediate territorial development and, on the contrary, is subject to inherent demand volatility resulting from global competition between a few multi‐national companies.
Therefore, broader development effects could be achieved only by an integrated and coordinated plan fostering business creation, transport connections and high level services for port‐related activities, combined with the long‐term commitment of highly experienced and dedicated professional resources. In a context characterised by weak entrepreneurial capacity, especially regarding maritime‐related activities, structural poverty in transport infrastructural endowment, societal security instability and scarce administrative capacity, the lack of strong, skilled and coordinated action pursuant to the port interests prevented a brilliant private operation from being turned into a unique development initiative.

131
M1 MOTORWAY This case study illustrates the story of the development of the M1 motorway in Ireland. The route forms part of the TEN‐T United Kingdom‐Ireland‐Benelux Road Axis (Priority Axis No.13), which links the three main cities on the island of Ireland with Great Britain and Continental Europe. The purpose of the evaluation is to assess the socio‐economic long‐term effects generated by the project and to disentangle the possible determinant factors that may have contributed to producing these effects.
The context and objective of the project can be considered as:
• A well‐established need (since the 1960s) to improve the old N1 route, in terms of improving capacity, speed and safety.
• Increasing economic activity and prosperity, and the resultant increase in demand for travel.
• The availability of high levels of funding under the CF.
• The Northern Ireland peace process, which reconnected Ireland with Northern Ireland socio‐economically.
The M1 was only the second motorway to be commenced in Ireland, but there was subsequently a large programme of providing motorways on all the major inter‐urban routes (N2 through to N9), which was mostly delivered in the 2000s and the current decade.
In more detail, the project consisted of seven sections of road, to deliver a continuous motorway stretching from Dublin airport in the south to just north of Dundalk at the northern end. Further improvements of the road extending to the border with Northern Ireland and beyond to Belfast have subsequently been put in place, but do not form part of the project being analysed.
Construction commenced in 1989 with the Dunleer Bypass, which opened for traffic in 1994. The final section (Dundalk Western Bypass) commenced construction in 1998 and was completed in 2005. The project involved a total investment of EUR 787 million (2011 prices, VAT exclusive), 38% of which co‐financed through the Cohesion Fund. The remaining investment cost was covered through national public contribution (47%) and contributions by private capital (13%). The European Commission’s contribution was primarily justified by the fact that the route was part of the TEN‐T priority Axis No.13, its importance for the Irish transport sector and the high cost of delivering the infrastructure.

132
OVERVIEW OF INVESTMENT COSTS AND SOURCES OF FINANCING Financing period 1989‐2005
First year of operation 2005 (full motorway)
Total investment costs (2011 prices) EUR 786.6 million 100%
Sources of financing and co‐funding rates over the total investment costs
Cohesion Fund EUR 300.6 million 38.2%
European Regional Development Fund EUR 0 0.0%
European Investment Bank EUR 0 0.0%
National‐regional‐local public contribution EUR 382.4 million 48.6%
Private capital EUR 103.6 million 13.2%
The cost of building motorways increased significantly in Ireland over the period of construction, reflecting increased inflation in the construction sector as the economy entered the “Celtic Tiger” era. Generous compensation for land acquisition also added to costs. Cost overruns were a particular issue on the Dundalk Western Bypass because of these reasons, as well as the discovery of a number of archaeological sites on the route.
Institutional and management structures evolved over the timeframe of the project. Perhaps the most significant institutional change was the establishment of the National Roads Authority (NRA) in 1993. The NRA has “overall responsibility for the planning and supervision of works for the construction and maintenance of national roads”, as well as powers to enter into tolling arrangements with private operators. Previously these functions were in the hands of Local Authorities.
Other important developments related to the decision to offer a toll concession on the road, which was awarded to Celtic Roads Group (CRG). The toll agreement included the construction of the Dundalk Western Bypass and maintenance of the entire road from the Balbriggan Bypass northwards. Tolls are collected on the Drogheda Bypass section.
More recently there has been a change in the planning process with respect to major infrastructure such as motorways. Firstly, the law was changed in 2001, so that the Planning Appeals Board replaced the Minister of the Environment as the body which provides final approval for a motorway scheme to commence. This as a positive development which depoliticised the planning process. Secondly, under the Planning and Development (Strategic Infrastructure) Act 2006, planning applications for “strategic infrastructure” are made directly to the Planning Appeals Board instead of to a Local Authority, which is designed to speed up approvals.
The new road has performed satisfactorily since opening. Over the years the various sections of the motorway have seen strong traffic growth, albeit volumes have fallen somewhat since the peak year of 2008. Volumes are heaviest at the southern end of the motorway, closest to Dublin, and tend to decrease the further north one goes.
In terms of financial sustainability, the toll concession is designed to ensure that all but the southern sections of the road will be properly maintained for the concession period. Falling traffic volumes have meant reduced toll income, but as one of the busiest roads in the country

133
income should still be sufficient going forward. Recent regional traffic forecasts generated by the NRA point to modestly growing traffic volumes over the coming decades.
The M1 has contributed to direct economic growth, most directly through cutting journey times. The sum of time savings on the sections of the motorway on opening is estimated at 37 minutes, with a large concomitant reduction in journey time variability. Other direct impacts include reduced accident costs. The CBA undertaken on the M1 indicates that the financial NPV of the project is minus EUR 0.65 billion, while the economic NPV amounts to positive EUR 6.15 billion (2011 prices). These results are highly robust: the project has already generated (as of end 2011) sufficient benefits to justify itself.
We estimate that 6,300 work years of employment were generated over the 16 years of construction of the M1 (albeit some would have been displaced). Residents along the route of the motorway experienced increased employment over the period 1996‐2006 (higher than the national average), but also increased the distance they travelled to work, pointing to a combination of increased local economic activity and urban sprawl.
There would have been an increase of knowledge and expertise in the institutions and firms involved in the management and delivery of the new road, thus improving Irish human capital and driving organisational development. This could be expected to have overflowed into the building of subsequent motorways, and possibly into other areas of civil engineering.
It is less clear the degree to which the M1 motorway contributed to social cohesion. Prima facie it would have opened up more employment opportunities, which the travel to work data indicate the workforce of Co. Louth succeeded in accessing. On the other hand, it may be that those who were already better off were in a stronger position to avail of these opportunities.
The M1 motorway has had positive and negative environmental impacts. On the positive side, the environment for humans in the by‐passed towns improved. However, there are a number of environmental negatives, including an increase in fuel usage and consequently in Greenhouse gas (GHG) emissions and other pollutants, increased noise and severance in rural areas, and possibly undermining the attractiveness of the parallel rail route.
Territorial cohesion would have benefited from the new road. The cost of transport in the north east of the country was reduced and connectivity between the region and Dublin, the main economic centre in Ireland, was increased.
Institutional structures and capacity changed significantly over the course of the building of the M1 motorway. Much of this was driven by the requirements of the large and unprecedented investment in Ireland’s infrastructure, rather than by individual projects. However, as the M1 was one for the first motorways to be built in Ireland, it was so to speak something of a “pioneer”, and it is reasonable to conclude that the lessons and experiences of delivering the M1 were influential in the institutional developments that occurred.
In terms of social happiness, in general the motorway network is a source of public pride and satisfaction. On the negative side, there was considerable resistance to the decision to toll the motorway at Drogheda, and this has persisted to a degree.

134
This project was highly appropriate to the context. It had been well‐established (as far back as the 1960s) that there was a requirement for increased capacity and safety on the route. The first section of the road to be upgraded opened in 1994, as both the “Celtic Tiger” era and the Northern Ireland peace process were beginning, so the road received a very “fair wind” in terms of external circumstances.
It was clear at the time that Ireland’s infrastructure was inadequate, particularly in terms of roads. EU co‐funding was seen as kick‐starting a programme of investments, which in the pre‐Celtic Tiger era might have appeared too daunting for the Government. As a result, the public mood was overwhelmingly in favour of the investment programme. It is arguable whether, pre‐Celtic Tiger, the Irish Government would have been in a position to fund a motorway along the entirety of the route.
Design of the road proved robust, for instance proving capable of coping with the decision to accommodate tolling on the Drogheda Bypass.
Forecasting capacity with regard to the demand side (traffic volumes) was somewhat redundant, as it had been decided in the 1989‐1993 and 1994‐1999 Operational Programmes to build the road to motorway standard throughout. Forecasting capacity as a mechanism to reduce risk did come into sharp focus with the decision to offer a toll concession for part of the route. Traffic forecasts would have been key to negotiations and bidding for the toll concession, although we are not privy to these forecasts and how accurate they proved to be.
Governance structures were novel in an Irish context, and evolved over time. The overall Community Support Framework (CSF) 1989‐1993 and 1994‐1999 had a Monitoring Committee, as did the Operational Programmes for Peripherality and Transport, and there were extensive reporting and monitoring requirements. The discipline of complying with these added to the quality of the governance and decision‐making process in the course of the delivery of the programme.
The establishment of the NRA and its expanding role, the adoption of “design & build” contracts and the encouragement of international competition for contracts, as well as the changing role for the Planning Appeals Board over time are all positive examples of the strength of governance and its ability to cope with changes.
There are some signs of a return to the politicised approach to infrastructure development subsequent to 1999 when there was a significant reduction in EU funding as well as a strengthening of the Exchequer position. Possible examples include the decision to build all the major inter‐urban routes to motorway standard, well in excess of the standard recommended in the national Road Needs Study, and the system for compensating landowners for land acquisition, agreed with the Irish Farmers’ Association in 2001. Fiscal difficulties have returned in recent years, and have re‐established their traditional constraining role on public infrastructure budgets.
In terms of managerial response, at the wider level of public policy (e.g. evolution of the role of the NRA, the planning system, of contract design and the compensation agreement with

135
farmers) there was a significant degree of evolution and adaptation to circumstances. However, at the project management level for the M1 itself, there is limited evidence of adaptation to unforeseen events. The main category of such events would be unexpected on‐site conditions in the building of the road, and the contract structures prescribed in large degree how these would be dealt with.
The role of the EC was in general positive, providing a large proportion of the total cost of the investment, as well as requiring the establishment of strong governance and oversight structures.
By and large it can be said that the project has stabilised. No major future developments are envisaged, although some uncertainties about the future do exist, mainly around the impact of ongoing economic weakness on traffic volumes. The possibility that the nearby M2 will be tolled at some point in the future might see some traffic diverted back to the M1.
The key lesson to be gleaned from the experience of the M1 ‐ and it applies to the wider body of road infrastructure investment in Ireland over the last two decades ‐ is: “context is king”.
It was well‐established that Ireland’s road infrastructure and institutional structures were inadequate, and the solutions had been identified. Little action had followed, mainly for fiscal reasons (public capital was invariably the first victim of economic downturns in Ireland), but also possibly because of lack of political and social consensus on where and how to invest the State’s scarce resources.
Also, by the late 1980s, Ireland was slowly emerging from a major fiscal crisis and the return of largescale emigration which had not been seen since the 1950s. The crisis had only been halted by painful fiscal retrenchment, introduced by a minority Government but made possible by broad political and social consensus on the remedies required. This consensus included a process that became known as “social partnership”, involving the State, trade unions and employers’ representatives, which traded tax reductions for pay restraint. It was a watershed moment in the history of the Irish State, triggered a significant turnaround in the fortunes of the economy, and is generally seen as a key element in the emergence of the Celtic Tiger.
Thus, as the 1980s were coming to an end, two out of three key requirements were in place: (1) knowledge of what needed to be done, and (2) socio‐political consensus to facilitate a focussed programme of investment. The missing factor was money, and borrowing was problematic because of the overhang of public debt.
At this point the expanded ERDF and Cohesion Funds came on the scene. Ireland drew up National Development Plans and succeeded in gaining a disproportionately large share of these funds in the 1989‐1993 and 1994‐1999 rounds. This became a virtuous circle. The EU funds made the National Development Plans feasible and thus created a strong incentive to “do it right” (put together a good plan and implement it properly and on time), in order to make sure that no funding was lost.
As the 1990s progressed, the Celtic Tiger began to emerge, and the process of ending decades of civil strife in Northern Ireland (particularly relevant for the M1) began to bear fruit.

136
Infrastructure investment was one of the catalysts for economic growth and in turn was justified by it.
As Ireland entered the 2000s, EU funding reduced, but the economy continued to grow and the Exchequer was in a sufficiently strong position to take over the funding of even more ambitious investment programmes, including the completion of the M1 and the M50 (and its subsequent expansion) as well as the Northern Post Access Tunnel which linked the M1 and M50 to Dublin port. In a period of little more than two decades, Ireland went from having no motorways at all to a network of over 700 km, with all the major urban centres linked by motorways. While arguments can be made that the level of investment was excessive, it is likely that important network benefits were generated.
Thus the M1 caught a fair wind from many directions, which helped its delivery and provided the subsequent growing demand for its services.
The EU Commission’s role was notably positive in the Irish experience, particularly in the 1990s, and points to the scope the Commission has to leverage positive change through infrastructure funding.
The degree to which the lessons learnt are transferable to other countries and circumstances will vary from case to case. It may prove difficult to reproduce a similar combination of positive circumstances. On the other hand the positive leverage the Commission can apply institutionally and in terms of management is likely to be stronger in most other countries than it was in Ireland during the 2000s.

137
THE EGNATIA MOTORWAY This case study analyses the implementation of the Egnatia motorway, a road crossing horizontally Northern Greece with a length of 670 km and a width of 24.5 m (or 22 m along mountainous adverse sections). The motorway runs from Igoumenitsa to Kipoi and crosses five regions: East Macedonia & Thrace, Central Macedonia, West Macedonia, Epirus and Thessaly. The purpose of the evaluation is to assess the socio‐economic long‐term effects generated by the project and to disentangle the possible determinant factors that may have contributed to producing these effects.
The project responded to the need of providing faster and safer connections between the Western and Eastern borders of Greece. The overall condition of the existing roads was poor. They followed the conventional routes through the mountains and lacked access control, allowing animals and people to cross. As a result, travel time from East to West was very long (about 12 hours) and driving conditions were very dangerous. In light of this need, the idea of building a motorway axis dates back to the 1970s. However, the lack of financial resources and of expertise to overcome the technical difficulties posed by the Greek mountainous territory prevented construction until 1997. In the meantime, the Greek State financed the realisation of some dispersed sections, which remained unconnected for years. The push for the realisation of the project came with the launch of the first European Community Support Framework (CSF, 1989‐1993), which triggered a positive response of the Greek government, by allowing it to plan the construction of necessary infrastructures thanks to the funds made available from the European Union.
In order to understand the features of project, two historical facts should be taken into account. First, originally Egnatia was conceived as a road running only from Igoumenitsa to Thessaloniki, thus leaving out the remotest areas of East Macedonia & Thrace, and it was designed as a motorway only in some sections. The project eventually implemented is different from this original design and it is the result of stringent negotiations between the various stakeholders, among which the European Commission played a key role. In fact, on the request of the European Commission, the Egnatia motorway was re‐designed as a Trans‐European Road Network running from Igoumenitsa to Kipoi with the aim to make it a collector road for the Pan European Corridors and Trans‐European Networks converging in the Balkans area.
Second, following again a request of the Commission, the regulatory framework for the management of public infrastructure in Greece was substantially revised. Breaking with the traditional management system, an ad‐hoc executing agency was established for the construction, supervision and management of the motorway. The Egnatia Odos was set up in 1995 and, although fully owned by the Greek State, it operates according to the rules of the private sector. An international consulting company (Brown & Root) was appointed and merged into the organisational chart of Egnatia Odos with the role of Project manager. The aim was to provide the emerging company with the managerial and technical expertise needed to implement and run the project.

138
Once set the institutional conditions to operate, construction works started, taking place between 1997 and 2011169, with the first section opened to traffic in 2000. The total investment costs amounted to EUR 7,052.6 million (2011 prices), of which 44% was financed by the European Union (ERDF, CF, TEN‐budget) and the remaining 56% by the Greek State, of which 41% provided by loans from the European Investment Bank.
OVERVIEW OF INVESTMENT COSTS AND SOURCES OF FINANCING Financing period 1994‐2011
First year of operation 2000
Total investment costs (2011 prices) EUR 7,052.6 million 100%
Sources of financing and co‐funding rates over the total investment costs
Cohesion Fund EUR 1,033.5 million 14.7%
European Regional Development Fund EUR 2,025.9 million 28.7%
TEN‐T Budget EUR 31.2 million 0.4%
European Investment Bank EUR 2,885.4 million 40.9%
National contribution EUR 1,076.5 million 15.3%
To date, driving is allowed along the entire length of the motorway, with the exception of a 1 km section in the Region of Epirus, which is closed because of landslides occurring in that area. As a consequence, traffic is diverted to the old road network, which is just beside the Egnatia motorway. Since 2004, the performance of the motorway in terms of traffic volume, environmental and spatial impacts has been monitored and supervised by the Egnatia Observatory. Although designed as a tolled motorway, users have been asked to pay tolls only since 2010. The delayed introduction of the tolls was not related to technical issues but to the purpose of achieving political consensus. This has hampered the financial sustainability of the project, which is currently not self‐sustaining so that operation and maintenance have been ensured through external financing from the central government. The introduction of the Gantry system for toll collection and the privatisation of operations are expected to make the project financially sustainable.
The project succeeded in achieving the expected objectives and contributed to the economic development of the context in which it took place. Journey time from West to East Greece was significantly cut (by 5 hours and 10 minutes) and the number of accidents was reduced (e.g. 97 fatalities in 1998 against 48 in 2010). These effects materialised in the short run, according to the progressive opening of the motorway’s sections. Relevant wider economic effects have been triggered by the project in the long run. In particular, the project has succeeded in improving the performance of ports and airports physically and functionally connected to the motorway and providing the conditions for the development of new business activities, as well as boosting the tourism industry.
A strong impact has been generated in terms of territorial cohesion. As a consequence of the reduction in travel time and costs, relationships between the remotest urban centres and the
169 Investment concerning some sections were undertaken by the Greek State since 1994.

139
most dynamic and developed ones have been increased. A number of socio‐economic indicators show that this has led to an increase in cohesion among the five regions crossed by the motorway. However, effects on territorial cohesion are expected to be wider in the future. Being a Trans‐European Network connected through vertical axes to the neighbouring countries to the North, the Egnatia motorway creates the conditions for improving territorial cohesion at European level. From the national point of view, territorial cohesion is expected to be reinforced once other investments on the connected axes roads (PATHE and Ionian motorway) are completed.
From the endogenous dynamic perspective, the project was innovative. With the creation of the Egnatia Odos and its Observatory, it brought about a new organisational scheme for the management of public infrastructure projects in Greece and, moreover, developed new knowledge and expertise for the construction of road infrastructures, while minimising their impacts on the landscape. The impacts on institutional quality could have been much higher if the innovations introduced by the project had been applied in a consistent manner. In particular, an ad hoc private law company, such as the Egnatia Odos, could have been established also for the upgrading of PATHE motorway, which was started in the same period and is still underway.
Finally, the Egnatia motorway turned out to be an environmental friendly infrastructure. Although negative externalities were generated, in terms of increases in noise and emissions related to the generated traffic, its negative impacts on the landscape were minimised by implementing appropriate mitigation measures.
The analysis of the determinants of such performance shows that the relevance of the project to the context was very high and that the project was able to influence the context in which it took place, by changing the surrounding socio‐economic and legislative environment (it was a “trait making” project in Hirschman’ s words). The project, however, had limited forecasting capacity on some environmental issues. Although these issues could have been foreseen upfront, nevertheless they were not properly taken into account during the project design. As a result, the original alignment of the motorway was subjected to continuous revisions in the course of implementation. The construction of additional structures was therefore needed, leading to additional construction costs and delays during implementation. Fortunately, the project’s design was flexible enough to allow it to “slip” in one direction or another according to the needs of the context. In the face of the design weaknesses, the project manager (demonstrated good managerial response to unforeseen events, by revising promptly the project, adopting collaborative cooperation with the stakeholders concerned (environmental and archaeological organisations).
Overall, the project’s governance was the dimension which most affected the performance of the project, providing a mixed contribution. On the one hand, it made possible to overcome the weaknesses in project design and forecasting capacity. In this regard, a key role was played by the European Commission which improved the project design by bringing it into line with EU priorities for Trans‐European Networks. A significant contribution was also made by the environmental and archaeological organisations, which contributed to improving the

140
alignment of the motorway in order to minimise its impact on the landscape. On the other hand, the governance was less effective in implementing all the measures needed to ensure the project’s sustainability. The main responsibility in this regard lies with the Greek State, which delayed the introduction of tolls, despite the (soft) pressure carried out by the European Commission.
As for future developments, operation and management of Egnatia is expected to be given in concession to a private operator. However, there is still uncertainty about the concrete specifications and the timing of the concession. The impacts of a private management (likely to increase the toll prices) and the introduction of an electronic toll collection system should improve the revenues and the sustainability of the project and, in turn, help the Greek Government in repaying the loans contracted with the banks and the EIB.
Four interesting lessons can be learnt from the analysis of the project performance.
First, the Egnatia motorway is an example of a mega‐project involving a large number of stakeholders. The common tendency in these projects is to avoid negative reactions from them so that the final decision is taken only after the completion of long consultation. This tendency can, however, lengthen the process, producing delays in the implementation with negative effects on investment costs. In general, the shorter the decision‐making process is, the easier it is to avoid cost overruns, although the interests of some concerned stakeholders might not be protected adequately.
Second, the establishment of an independent agency for the purposes of project construction, operation and maintenance and monitoring is an efficient solution for the realisation of the project and the management of national and European funds.
Third, the political dimension is never aside when dealing with large infrastructure projects, which depend upon strong political commitment. However, projects should not become a means for political visibility and consensus building. As demonstrated by the Egnatia motorway, the policy to delay the introduction of the toll system so as to protect the consensus jeopardised the financial sustainability of the project.
Fourth, the European Commission can play a strategic role in the project it co‐finances. Far from being a mere funding provider, it can attach to the provision of funds conditionalities which will improve the quality of the project design and preparation, especially by putting the project into a wider European perspective.

141
MADRID METRO LINE ‐ ACCESS TO BARAJAS AIRPORT This case study illustrates the story of the Madrid Metro Line 8, a major infrastructure investment co‐financed by the EU over the period 1997‐2002. More specifically, this is an ex‐post evaluation assessing the long‐term effects produced by the project and interpreting the key determinants of the observed performance. The analysis draws from an ex‐post Cost‐Benefit Analysis (CBA) and from an extensive set of qualitative evidence, both secondary (technical reports, official reports, press articles, books and research papers) and primary (interviews with key stakeholders and experts have been carried out in the period March to November 2011).
Line 8 of the Madrid Metro is an external radial line of the network, which runs between the centre and the northeast of the city linking the core business centre of Madrid and Barajas International Airport. Line 8 offers a quick and reliable public transport connection to residents and employees of businesses located near its stations in central Madrid and in Barajas village. Located 12 km to the East of the Madrid municipal area, Madrid‐Barajas airport is a major national and European airport handling close to 50 million passengers and over 685,000 tonnes of freight per year. Barajas has always had very good access by road ‐ indeed it was the European airport with the highest share of people accessing by car (86.7%170) ‐ but, until 1999, it was not efficiently connected to the city via reliable public transport. There was, thus, a well‐established need to improve public transport connections to Madrid‐Barajas airport.
Since the late Sixties, the idea of connecting Madrid’s city centre with the airport by rail had been under study; however, it was not until the approval of the metropolitan rail network Extension Plan (1995‐1999) that the idea was seriously considered. During the Nineties, Madrid’s and its peripheral districts’ population experienced a significant process of urban expansion as well as a relocation of economic activities, mostly to the outskirts of the metropolitan area. This led to a substantial growth in mobility between the city of Madrid and its surroundings, which provoked heavy congestion on Madrid’s access routes. In this context, the creation of a Metro Line was considered the best option to link Madrid‐Barajas airport, Madrid’s Fair, located nearby the airport, and the surrounding residential areas.
The development of Line 8 was carried out in three stages, in response to the evolution of the needs and objectives of the city. Firstly, the 1995‐1999 Extension Plan envisaged the construction of a metro section between Barajas village and the station of Mar de Cristal, so as to connect Madrid to the airport. The European Commission – Directorate‐General Regional Policy (DG Regio), however, highlighted that this initial project idea would have allowed limited access to the city and few interchange possibilities with other public transport system lines. The Commission considered that, in order to be eligible for Cohesion Funds, the line had to provide very good access to a significant share of Madrid’s population and airport users; more specifically, the Airport connection to a main interchange in the city centre was required. Consequently, the metro section between Mar de Cristal and Nuevos Ministerios, in
170 Referred to 1999.

142
downtown Madrid, was included in the subsequent Metro Extension Plan (1999‐2003). In a third phase, finished in 2007, as a result of an important expansion plan at Madrid Airport, the line was extended to the new T‐4 terminal building and a new intermediate station was built at Pinar del Rey.
The project under assessment involved an investment cost of EUR 462 million between 1997 and 2002, 85% of which co‐financed through the Cohesion Fund. A further investment of EUR 55.9 million was financed between 2006 and 2007 to extend the line, thus making EUR 518 million the total investment cost considered in the analysis. The Cohesion Fund contributed to cover about 76% of the total investment cost, while the remainder was covered by regional public funds. From a financial sustainability perspective, it can be stated that the revenues generated by the project from tariffs are not enough to cover its operating and maintenance costs. Instead, the coverage of costs is ensured by the large degree of public subsidisation of the sector.
OVERVIEW OF INVESTMENT COSTS AND SOURCES OF FINANCING Financing period 1997‐2002; 2006‐2007
First year of operation 1998
Total investment costs (2011 prices) EUR 518.32 million 100%
Sources of financing and co‐funding rates over the total investment costs
Cohesion Fund EUR 393 million 76%
European Regional Development Fund EUR 0 0%
European Investment Bank EUR 0 0%
National‐regional‐local public contribution EUR 125 million 24%
Private capital EUR 0 0%
The number of passengers accessing the Metro Line 8 at the airport stations has increased over the period 1998‐2004, and then stabilised at some 35 million users per year. In total, the number of passengers joining the metro network at the Barajas terminal stations or leaving the system through the same stations represents about one third of the total number of Line 8 passengers. However, the demand is probably not yet completely stabilised: in November 2010, new bus lines connecting the city to the airport have been provided by the service operators: the improvement in the bus network system, which constitutes a direct public transport competitor for Metro Line 8, to some extent may affect the future Line’s 8 demand.
Madrid’s Metro network has been extended by many kilometres of new lines over the last two decades, but the Extension Plan 1995‐1999, in which the creation of Line 8 was included, was unprecedented, as it extended the subway network by 56 new kilometres of new lines and 38 new stations. As a consequence of this, Madrid has become one of the best cities in Europe in terms of external and internal transport links, which are amongst the most important factors when deciding where to locate a business. Line 8 has facilitated the location of new businesses in Madrid, with direct impacts on economic growth and, thanks to its high connectivity with the public transport system, it has prevented the concentration of commercial activity in the areas closest to the airport, and helped to disperse economic dynamics and social welfare over the entire area between the Barajas village and the city. Significant efficiency benefits also

143
come from time savings and reliability gains for public transport users and from reductions both in operating costs and accidents for former private car users.
The line generated a positive economic return also due to cost savings for diverted traffic and to the reduction in externalities due to the change to a cleaner mode of transport. Indeed, the modal shift of motorised transport users to an environmentally friendly alternative has been highly positive for environmental quality in a polluted city such as Madrid. Reducing traffic on congested major roads has had particularly high impacts on greenhouse gas emissions. These benefits have been quantified in the ex‐post CBA. The analysis indicates the economic Net Present Value of the project amounts to EUR 2,636 million, with an internal rate of return of 16.87%: such results confirm that, from an economic perspective, the project was justified.
With regard to economic endogenous dynamics, the line has enhanced the integration into the city of two important and peripheral infrastructures for Madrid: its international hub airport and IFEMA (Institute of Madrid Fair), the 4th largest trade fair in Europe in number of attendees. By providing them with a direct and reliable connection to the city centre, the project contributed to their development. On one hand, the fair has favoured the exchange of know‐how and the establishment of commercial agreements with international firms, which in turn have widened the competences of local companies; on the other hand, the good transport connection has increased the productivity of companies, as it has facilitated access to their suppliers and customers. Moreover, the construction of Nuevos Ministerios station was complex, requiring a high level of technical skills, and marked a change in the way of conceiving the design of interchange nodes: actually, the station was articulated as a large, functional and user‐oriented space. This knowledge has overflowed into the construction of subway stations in many other cities around the world.
The expansion of the network towards the periphery represented a considerable improvement in connectivity and territorial cohesion as it reduced welfare disparities caused by unequal distribution of resources and opportunities among the region’s inhabitants. Bringing a quality and affordable public transport service closer to some residents of surrounding municipalities has also had a positive impact on social cohesion by enabling vulnerable social groups, particularly immigrants with lower incomes, living in the suburbs, to more easily access the city centre, and by lowering their generalised transport costs, even in terms of time spent commuting.
Finally, as for the institutions involved in the project, the existence of a metropolitan transport agency, CRTM (Regional Consortium of Madrid Transport), with strong participation by the local authorities greatly facilitated the execution of Line 8. Since then, the management system of transport projects through consortia has spread throughout Spain, which has now more than 20 similar authorities. The European Commission also definitely contributed to a better design of the line, as it required the rapid extension of the airport connection to the core business centre of Madrid, thus maximising the demand and the level of modal transfer.
The institutional, economic, social and cultural context played a non‐minor role in the project’s success. As mentioned before, the metropolitan outskirts of Madrid were experiencing

144
significant residential growth, leading to an increase in centre‐periphery transport flows. The context was highly positive for the project also considering the steady growth of visitors and exhibitors at Madrid’s Fair since 1990, together with the planned expansion of Barajas airport and its positioning as Spain’s international hub. In addition, the project benefited from the fact that, since 1991, the city of Madrid has been under the government of the same political party. This has facilitated good decision‐making capacity, with long‐term vision, and enabled the completion of projects such as the metro network expansion, which are planned in different stages.
The success of the project was also largely due to its accurate project design and good forecasting capacity. Being in a densely populated city with a multitude of services buried under the pavement, which give rise to many potential restrictions and risks for the construction, the project called for meticulous control and special construction techniques. With the aim of anticipating possible accidents during the operational phase, advanced security and control systems were installed. Furthermore, the collaboration of skilled professionals allowed the project to promptly react and overcome unpredicted events that arose during the works, such as the discovery of polluting filtrations in the ground. Thanks to the good planning capacity and project design, the project’s construction was completed without any delays and cost overruns.
The well‐defined roles and responsibilities of the different transport and government institutions and their experience in the transport sector within the Madrid Community positively influenced the project’s outcome. With regard to the extension of Metro Line 8 to the subsequently commissioned T4 airport terminal, the Public‐Private Partnership contract established was probably essential for the early completion of the whole line as it facilitated financing and construction bidding procedures. An absence of coordination between two governmental levels (central and local) and the defence of their own and conflicting interests (a rail service versus a metro line) were revealed during the project planning and execution, but it did not significantly affected the project performance.
In spite of some uncertainty concerning the future demand of Line 8, which depends on the offer of alternative transport modes (such as bus lines) and on the future development of the Barajas airport, the project’s effects are considered mostly stabilised.
In conclusion, the Madrid Metro Line represents a successful example of infrastructural project which managed to deliver all the expected benefits at the expected time and costs. This was achieved mainly thanks to the adoption of a wide and long‐term plan, ensuring a joint analysis of local and long distance transport needs and good inter‐modality, which in turn led to a globally efficient solution. The European Commission played a crucial role in this respect, by pushing the local authorities to undertake a broader view in the project design, thus ensuring the maximisation of the project’s impact.

145
THE MEDITERRANEAN CORRIDOR This case study illustrates the story of a set of rail investments in the Mediterranean Corridor, a major infrastructure investment co‐financed by the European Union (EU) over the period 1993‐2002. More specifically, this is an ex‐post evaluation assessing the long‐term effects produced by the project and interpreting the key determinants of the observed performance. It is an innovative evaluation exercise given the long‐run perspective (30 years), which extends into both the past and the future, and requires a mix of retrospective and prospective analysis.
The analysis draws from an ex‐post Cost‐Benefit Analysis (CBA) and from an extensive set of qualitative evidence, both secondary (technical reports, official reports, press articles, books and research papers) and primary (interviews with key stakeholders and experts have been carried out).
The Mediterranean Corridor (MEDCORR) is a railway line from Algeciras/Sevilla to the Eastern French border. It runs across four densely populated regions of Spain: Andalusía, Región de Murcia, Comunidad Valenciana and Cataluña. In 1995, at the time of the project, the regions included in the MEDCORR area accounted for 44% of Spanish GDP and 37% of the country’s population. The scope of this case study is not the whole MEDCORR, but only the works carried out in the section from Valencia to Sant Vicenç de Calders, closed to Barcelona171. The project envisaged the provision of double‐track, the electrification of the line, the installation of new signalling and civil works to replace a number of level crossing by over or underpasses.
The Railway Transport Plan of 1987 was the first Spanish plan to highlight the necessity to improve the rail infrastructure between Valencia and Barcelona. The main arguments in the Plan were capacity problems and the poor quality of the rail services offered, which were responsible for the low transport market share for rail for both long‐distance passengers and freight. This intervention was embedded in a broader‐level vision promoted since the 1980s by different organisations, both at local and international level (e.g. CITRAME ‐ the Interregional Committee for transport in the Mediterranean), with the purpose of enhancing European competitiveness through the development of a rail line linking the North of Africa with Northern Europe along the Mediterranean coast.
In spite of some stakeholders’ pressures, requesting a qualitative step‐up of the Valencia‐Barcelona railway, through the creation of an additional high‐speed line network (above 250 km/h), which would have left the existing conventional line open to regional and metropolitan passengers traffic and freight traffic, in the 1987 Plan the Spanish Ministry of Public Works opted for the improvement of the existing line to high performance service (speeds up to 200‐220 km/h).
In 1993 financial assistance was requested from the Cohesion Fund (CF) and in 1994 the grant was approved without major modifications to the initial requests. During the appraisal phase, the Commission asked the opinion of the European Investment Bank, which was involved in 171 Respectively located in the two regions of Comunidad Valenciana and Cataluña.

146
co‐financing other investment projects included in the Railway Transport Plan. The Bank indicated that the study undertaken by the Spanish institutions on the Valencia‐Barcelona upgrading was insufficient as a basis for determining whether actions proposed were appropriate, and warned that the global perspective of the line should be analysed, in order to assess the justification of the proposed intervention172.
The project was structured in three stages in order to limit the impact on the existing track, which had to remain operational, as well as to spread the high investment costs over several years. Project implementation, which started in 1993 and was expected to be completed by 2000, in fact has not yet been completed173. Delays and cost overruns occurred in the delivery process, as changes to the route were decided during the implementation phase. Moreover, the planning uncertainties concerning the connection design of the Corridor to the Madrid‐Barcelona high speed railway line severely delayed the completion of works at the Tarragona – Vandellós section (45 km), where a single‐track still exists. This has become a bottleneck for the entire line. The original project, as subsequently modified, is expected to be completed by 2013, 20 years after its start.
The total investment costs considered in the analysis amount to EUR 759 million (2011 prices), undertaken between 1993 and 2002 and co‐financed through the Cohesion Fund and national public resources.
OVERVIEW OF INVESTMENT COSTS AND SOURCES OF FINANCING Financing period 1993‐2002
First year of operation 1997
Total investment costs (2011 prices) EUR 759 million 100%
Sources of financing and co‐funding rates over the total investment costs
Cohesion Fund EUR 531 million 70%
European Regional Development Fund EUR 0 0%
European Investment Bank EUR 0 0%
National‐regional‐local public contribution EUR 228 million 30%
Private capital EUR 0 0%
Note: according to the EC financing decisions, the Cohesion Fund was supposed to co‐finance 85% of programmed investment cost. However, due to cost overruns covered by national resources, the share of CF resources allocated over the total investment cost reduced to approximately 70%.
In 1997, new high‐performance services between Barcelona and Valencia (called ‘Euromed’) were inaugurated. Whilst the improved interregional traffic attracted new long‐distance passengers to rail, neither regional nor suburban rail services were significantly affected by the investment: actually, no travel time savings were recorded for short‐distance and most of medium‐distance passengers. The project did not increase freight transport either: actually, 172 “The schemes [for which co‐financing was asked] are part of the works necessary to complete the upgrading of the Barcelona‐Valencia line. Although some of the projects taken in isolation can be justified, their global interest can only be assessed in the context of the possible alternatives for the improvement of rail services in the Corridor. This global study has not been provided and therefore the correctness of the adopted solution cannot be established” (EIB, 1994) 173 This report has been written in June 2012.

147
freight trains are constrained by lack of proper connections with the ports, by the priority assigned to passenger trains along the line, and by the infrastructure restrictions on the trains’ length, which is limited by the 450‐500 metre sidings on the network174.
Despite these problems, the project brought some socio‐economic benefits. The improvement in travel time for rail passengers between Tarragona and Valencia, which reduced from three hours and 38 minutes (in 1992) to the current two hours and 55 minutes, has facilitated to some extent business and leisure trips. Both road and rail users have benefitted from the improvements in the rail line. Besides the reduction in journey times, rail passengers have benefitted from greater reliability and also safety, as a consequence of the removal of several level crossings on the line. The producer surplus, i.e. the benefit resulting from increased revenues thanks to higher demand and unit tariffs net of operating costs, is particularly significant, accounting for about 47% of the value of total benefits. These revenues entirely cover the operating costs of the line, thus guaranteeing the financial sustainability of the project in the operational phase.
The direct effects on economic growth through increased efficiency have been, however, minor since they have not led to lower logistics costs supported by improved rail freight transport along the Corridor. Indeed, although freight transport potential demand along the line is high, it has not been captured by the project. Additionally, as far as passenger demand is concerned, it has to be stressed that after an initial increase in demand between 1993 and 2001, demand growth remained stagnant until 2008 and since 2009 has slowed down, returning to 2000 levels. The reason for the recent demand contraction is the economic crisis. However, in more general terms, demand increase was constrained by the saturation of the line, which does not have enough capacity to also stimulate an increase in short/medium‐distance passengers and freight traffic.
The Cost‐Benefit Analysis indicates that the economic profitability of the project is negative (with an Economic Net Present Value of ‐6.87 EUR million and an Internal Rate of Return of 4.9%) and the probability for the project to generate a positive return to society is limited (41%)175. Measurable social benefits achieved in terms of travel time savings or reduced vehicle operating costs are outweighed by the high investment costs of the project, confirming that the benefits of the works carried out are modest. If a wider perspective is adopted and the overall traffic demand of the MEDCORR line is considered, it is plausible that benefits for long‐distance passengers, going beyond the Barcelona and Valencia stations to other rail sections which are outside the scope of this analysis, are higher: in particular, travel time savings in this case may be higher compared to road transport as may be the induced demand. In addition, as shown by the sensitivity analysis, CBA results are strongly dependent upon traffic volume: if demand returns to the pre‐crisis level, the Economic Net Present value would turn positive.
174 Rail sidings are sections of track which run parallel to a line and connected to it at both ends by switches. Sidings allow fast or high priority trains to pass slower or lower priority trains going the same direction. 175 As estimated in the risk analysis.

148
Although it is evident that the project co‐financed by the Cohesion Fund was risky and not profitable from an economic view point, nevertheless, some other non‐quantifiable effects should be considered. In particular, improved infrastructure and modern traffic control systems brought new know‐how on rail technology which favoured endogenous dynamics of growth. The contribution of this major investment in the MEDCORR Valencia‐Barcelona section to territorial cohesion is high, thanks to the improvement of transport connection along the Mediterranean coastline, which in turn supported the development and strengthening of new linkages within the Spanish territory and a more polycentric pattern of development for the entire country. The project also generated some side effects in terms of social cohesion, thanks to the user‐friendly design of the new rail stations and rolling stock, addressing the needs of people with disabilities, and the provision of a mode of transport for people who do not own a car.
Positive effects that stemmed from the project were the modal shift from road and air transport to a cleaner and more energy‐efficient means of transport, which strengthens synergies between environmental protection and growth. Moreover, some of the works, in particular the underground by‐pass of Castellón, have reduced the barrier effect and the noise pollution of trains crossing the city.
While the overall public perception of the project impact on their quality of life has been positive, social happiness has been constrained by delays and deadlocks in the line, which have generated widespread feelings of frustration and loss of confidence about the future of the Corridor among local people. Inhabitants’ dissatisfaction was also perceived in some minor towns where, as a result of a new layout, their rail stations were left out of the Corridor: this decision was felt to having caused negative impacts on the economic development of the towns.
The project’s influence on national, regional and local institutional quality is negligible. On the contrary, it contributed to generate and feed hostility and friction among different stakeholders, including: municipalities, asking for changes in the rail route and additional stops by the new rail services at their stations; local and international lobbies promoting the port system’s competitiveness and interested in making the MEDCORR the main high‐speed rail gateway to central Europe, demanding more interventions to address freight transport demand; and the national authorities, which are instead in favour of implementing high‐speed connections within Spain mainly in a radial direction from Madrid to the provincial capitals.
The analysis of the determinant mechanisms of project performance highlights that project governance and inadequate forecasting capacity were the critical factors. Lack of coordination of all stakeholders’ particular interests and the inaccurate ex‐ante demand analysis (also recognised by the European Investment Bank176) prevented from developing a comprehensive long‐term strategy for the rail line.
176 EIB, 1994.

149
From the appropriateness to the context perspective, while it is true that upgrading the Valencia‐Barcelona line ensured territorial and social cohesion, improved the quality of services and produced some travel time savings for long‐distance passengers, higher impacts could have been achieved if a wider perspective view had been taken from the initial stage of project design and, particularly, if the potentiality of freight demand had been also take into account. Similarly, the project’s performance was hindered by poor design: links with the high speed lines could have been envisaged from the origin, as well as proper infrastructure and connections with the ports, so as to produce cost and time saving for freight transport also. Moreover, some inaccuracies and mistakes made in the design phase, admitted by the Spanish government177, caused delays to the completion of works and additional costs.
Finally, managerial response had an overall not particularly significant effect on project outcomes. In order to accommodate local pressures, the rail route was changed at different points, for example in order to preserve the landscape in a place of historical relevance in one case and not to divide an industrial area in another one. Other requests (such as those from a municipality asking for more trains to stop) were not met: this resulted in negative effects on social happiness, but was justified in view of the objective of maintaining higher speed along the entire line.
The completion of the Vandellós‐Tarragona section and its connection to the Madrid‐Barcelona‐French border High‐Speed Line (HSL) on the one hand (expected by 2013), and the construction of the High‐Speed Line between Castellón and Valencia, to be linked to the already operational Valencia‐Madrid HSL, on the other hand (expected by the end of 2014) may affect future demand along the Corridor’s section under assessment. Long‐distance passengers will benefit from additional travel time savings and the new HSL will generate spare capacity along the existing line which could be exploited by freight traffic. The actual increase in freight rail transport, however, will depend on the implementation of additional interventions aimed at adapting the existing lines (such as the extension of rail sidings). These may be financed by the Spanish government and the European Commission during the 2014‐2020 period, as a consequence of the recent inclusion of the whole Mediterranean Corridor in the list of TEN‐T priority projects for the next European programming period.
As far as the European Commission is concerned, in past years its role in the project has been significant in that it co‐financed a very high share of the investment cost (70%). On the other hand, the Commission’s contribution to project design was limited. Its degree of involvement may increase in the future if the Mediterranean Corridor is confirmed as a EU priority project.
177 “In the following [paragraphs] the reasons why this request of modification was submitted are presented, by distinguishing among: omissions, errors and deficiencies of the proposed project, requests from the body involved in the project’s implementation [i.e. Renfe] and [other] adaptations of the project made necessary by the modifications resulting from the previous reasons” (Ministry of Economy and Finance, 1998).

150
WATER SUPPLY IN PALERMO The present case study appraises an infrastructure project aimed at renovating the water distribution network in the city of Palermo, in the Italian region of Sicily. After almost ten years of project implementation the aim of the present ex‐post evaluation is to establish the extent to which this infrastructure project has affected the lives of the inhabitants of Palermo and what long‐term effects it has produced. The analysis draws from an ex‐post Cost‐Benefit Analysis ‐ CBA and from a set of qualitative evidence, both secondary (technical reports, official reports, press articles, books and research papers) and primary evidence (15 interviews with key stakeholders and experts were carried out in the period September‐October 2011).
The aqueduct of the Municipality of Palermo is a striking piece of infrastructure built at the end of the XIX century to serve the historical central districts of the city178. During the urban expansion experienced by the city in the 1950s and 1960s additional sections of the water distribution network were built, in response to the needs of a booming population, in the absence of a systematic and strategic plan.
At the beginning of the 1980s the entire water system infrastructure was in a state of obsolescence. Moreover, the public company in charge of the service delivery had poor internal technical capacity and lacked a strong strategic vision, due also to a political context influenced by corruption and organised crime. As a consequence, the citizens of Palermo suffered from severe water shortages, and the water was rationed during the day and the week in order both to more effectively use the limited available water and to reduce water losses, by shortening the periods of time during which the networks were kept under pressure (even though this parameter was set at a very low level). Citizens coped with this shortage by collecting water in domestic tanks operated with electric pumps in order to compensate for the low service pressure.
After serious episodes of drought at the end of the 1970s, the municipal company (AMAP ‐ Azienda Municipalizzata Acquedotto di Palermo) engaged a group of experts to draft a study to identify a long‐term solution to the problem. In contrast to the common perception that water shortages were due to the scarcity of water sources and dry weather, the study correctly identified heavy losses in the obsolete distribution network as the main source of inefficiency in the system. It was however only at the beginning of the 1990s that a Master Plan was prepared based on the findings in that study. The result was an ambitious and highly demanding (in terms of financial resources as well as time and technical capacity) plan for the complete restructuring of the entire system. However, some of the technical details and solutions identified were controversial. In particular, water demand was overestimated
178 The whole system ‐ originally consisting of a canal, over 67 km long (the old Scillato aqueduct, still in operation), two masonry tanks on the San Ciro site, and the water system of the town centre at that time (length ≈ 80 Km’s) ‐ was built in only three years through project financing, one of the oldest examples of this kind of PPP in Italy. The concession for the operation of the aqueduct and of the water service in Palermo for sixty years was signed on February 12th, 1898 between the Municipality, which co‐financed the investment with 30% of the capital cost, and the company which won the tender, namely the Scillato Water Company (Società Acqua di Scillato) of the Biglia brothers and Vanni.

151
(assuming population increase while it was actually decreasing at the time), leading to overcapacity in the pipes and supply system design.
It was thanks to the funds available through the EU 1994‐1999 programming period that project implementation gained momentum. Due to funds availability and administrative reasons related to the readiness of the projects, only some components of the Master Plan were selected for implementation, namely the renovation of the oldest three sub‐networks of the distribution network, located in the historical centre. Soon after, thanks to additional funds availability, three additional sub‐networks plus the completion of the city bypass to facilitate water distribution in the north‐west district, plus a system of automatic supervision and remote control of the water, were also financed.
The construction phase started in 1997 and the initially planned works were completed by 2004. The first section that was completed started to operate in 2002. In order to cover the investment of EUR 110 million179, the Municipality of Palermo benefitted from co‐financing of the European Regional Development Fund (ERDF) for a total of EUR 44 million (40% of the total investment). In addition, other EUR 44 million were provided from the Italian State. Since the EU required the municipal company (AMAP) to co‐finance at least 20% of the total cost of the projects in accordance with a project financing scheme, an EIB loan was applied for by AMAP. After the project’s independent appraisal, the EIB approved the loan conditional on the addition of a metering system to the planned investment.
The works were implemented practically on time and with cost savings, thanks to further adjustments during the design phase and cost reductions at the tendering stage. Part of the additional resources made available by the EIB and saved on the investment costs were used by AMAP for additional investments undertaken by the municipal company to provide new connections for users180, which improved the metering system and had the side‐effect of identifying illegal connections to the old network.
In total, the past investment costs considered in the analysis amount to EUR 120 million and the co‐financing share of each source of financing is recorded in the following Table. The project has proven to be financially sustainable, as revenues have been able to cover costs for each year since 1997,181 and a similar sustainability pattern is expected in the future.
179 Unless otherwise specified, this and all the following cash quantities are expressed in constant 2011 prices. 180 Originally not planned in the projects on the sub‐networks. 181 The cumulated net cash flows criterion in the EC Guide defines a project as financially sustainable if there is no year in which cumulated costs outweighs revenues.

152
OVERVIEW OF INVESTMENT COSTS AND SOURCES OF FINANCING Financing period 1997‐2011
First year of operation 2002
Total investment costs (2011 prices) EUR 120 million 100%
Sources of financing and co‐funding rates over the total investment costs
Cohesion Fund EUR 0 0%
European Regional Development Fund EUR 44 million 37%
European Investment Bank EUR 22 million 18%
National‐regional‐local public contribution EUR 54 million 45%
Private capital EUR 0 0%
Evidence available from the interviews and documents collected supports the assessment of a strong improvement in the quality of life of citizens brought about by the implementation of the project. In particular, 450 km of new pipes, made of High Density Polyethylene (with an innovative technology implemented for the first time in Italy for a water distribution system) completely eliminated the problem of physical losses in the six sub‐networks, serving about 60% of the total municipal population. Although water losses were still severe in the old part of the network, it was decided to use the water savings in the restored section of the network to allow for a continuous water supply, thus eliminating water supply disruptions in almost all the network (in about 25% of the network water is still rationed because the pipes are so obsolete that they could not cope with a continuous supply without a serious increase in pipe bursts and other associated problems). The more efficient distribution was actually used to provide a more reliable water service to the population rather than reducing water losses, making it possible for the already available water supply to cope with existing demand. It is worth noting in fact that neither the total water volume available nor the per capita water consumption changed as a result of the project. As a result of the more reliable service the number of complaints by citizens dramatically dropped after the project’s implementation.
The more reliable and effective water supply in the entire city has direct welfare and economic growth effects in terms of avoided costs for the large share of the population benefitting from the continuous water supply, as compared to the situation before the project. This effect has been estimated in the CBA via the avoided costs of maintaining and operating the electric pumps to obtain water during the rationing, avoided time invested by private and commercial users in managing water storage and operating the pumps as well as in avoided maintenance costs for domestic appliances or electrical devices making use of water (e.g. washing machines). The discounted value of these social benefits amounts to about EUR 407 million (2011 prices). Another direct growth effect for commercial and industrial users is improved productivity due to a more reliable water supply. This is however not quantified but only described in qualitative terms.
Additional effects are recorded. First, the municipal company achieved more efficient management of the distribution system, in terms of operational and maintenance costs, with effects in terms of efficiency and growth. It was no longer necessary to invest resources in complex daily manoeuvres to operate the water network by shifts (i.e. supply‐side operated

153
network) and in repairing frequent breaks or disruptions in the pipes and other faults. This amounted to a saving of EUR 1.5 million on average per year, included in the CBA calculations.
The saved resources were partially invested in other management activities, in particular in additional research related to the problem of water metering. A side effect of the project’s implementation is in fact an improvement in the knowledge base and quality of the management of the municipal company (endogenous dynamics) following a shift from a supply‐driven to a demand‐driven delivery service, focused on providing the water actually demanded according to the users’ preferences, rather than pumping water into the system according to technical feasibility. This shift, together with the adoption of the new metering system, independent for each single sub‐network, fostered the need to develop a more reliable and accurate account of water metering. This was achieved also via a number of innovative research studies in the field of water metering and investments in new user connections. Results in this respect relate to a better understanding of the causes and the amount of water losses, a decrease in the so‐called administrative losses (due to metering weaknesses rather than physical losses in the pipes) and a decrease in unpaid bills. This effect was not quantified but only qualitatively described.
A minor long‐term effect produced by the project implementation was a slight improvement in water quality, again a side effect of the improvement in distribution efficiency. The improvement in water quality is the result of a decrease in the risk of contamination events rather than improvement in the physical‐chemical profile of the water. As a matter of fact, water quality was good even before the project and the project’s implementation did not affect this aspect (natural sources and water purification treatments have not been modified by the project).
Additional interventions realised later and independently from the initial project, addressing the adduction system and mainly aimed at coping with periods of drought, improved the available quantity of water from natural sources to be pumped in the system and contributed to mitigating the water loss problem.
The project’s long‐term effects were felt at the local level only and the main beneficiaries were the citizens and the municipal company. The most relevant effects (more reliable water supply and operational cost savings) materialised soon after the project’s implementation (four years after the project’s start), while side effects (knowledge improvement) only arose later on.
Although the overall final assessment of the project’s performance is positive, and the CBA provides a positive economic net present value supporting this finding (EUR 315 million at 2011 prices)182, it should be also noted that, not only were a number of potential benefits not achieved, but additional investments foreseen and not implemented are at the origin of pending problems in the delivery and management of the water service. For a complete restructuring of the water system some additional interventions would have been necessary,
182 The Economic rate of return of the project is equal to 14.68%.

154
such as a new water tank and the renovation of the rest of the sub‐networks via the complete replacement of the old sub‐networks which are obsolete and in particularly poor condition, a careful maintenance system, a shift to an asset management approach to service delivery (i.e. long‐term planning of the best mix of capital and operating expenses according to principles of optimal resource allocation) and the revision and rationalization of the internal mains supplying the new sub‐networks.
The most striking effect of the failure to complete the plan is that water losses in the network still amount to 47% of the total supplied water, since the water savings in the restored sections are counterbalanced by an increase in water losses in the obsolete sections which are now continuously supplied (therefore water can now leak from the network 24 hours per day every day, rather than only during the times when water was being supplied). Moreover, the supply system of the new sub‐networks remains the old, sub‐optimal, one: for example a forecasted new water tank was not realised and this leaves one of the main sub‐networks with unsuitable values in the technical parameters for water pressures which cause underperformance of the entire sub‐network. Pressures problems are recorded in some of the new sub‐networks and tanks and electric pumps are still in use in some of the highest buildings to raise water to the top floors.
Some of the current water pressure and low speed problems are also related to a forecasting error in the design phase. The entire system suffers from overcapacity since the demand forecast was significantly overestimated. A long‐term strategy of interventions prepared in the same years of the project implementation was actually addressing these problems with the revisions of the planned interventions, and design of new, more suitable, ones, according to more realistic demand forecasts.
The best solution to the remaining problems related to water losses and pressure can be addressed by restructuring the remaining sections of the urban network. To this end, a new design needs to be developed with updated demand forecasts, since the original Master Plan suffers from the above‐mentioned forecasting errors and its implementation today would lead to overcapacity in the system. Moreover, it would be advisable for the new plan to address technical specificities with up‐to‐date and innovative solutions, tailored to the current situation of the water network. The scientific discipline of water losses control is in fact fast developing and requires high profile and up‐to‐date technical expertise.
The key determinant of project performance is project governance, which positively affected the project in the start‐up phase but subsequently proved to be the impeding factor in the continuation of the entire renovation strategy. It was a positive combination of political will and technical and managerial capacity that facilitated in the initial phase, in such a short period of time and with such an advanced and efficient implementing capacity, project approval, and implementation. After many years during which the water supply in Palermo was affected by the influence of organised crime and a policy of clientelism in the selection of public managers, leading to a management approach far from the pursuit of the public interest, a cultural and political renovation, the so‐called Spring of Palermo, saw a top level management board of the municipal company being selected and empowered to deal with the

155
deeply rooted problem of water shortages. The water supply project was only the first step in a more far‐reaching long‐term strategy of innovation and capacity improvement in the public company, pursuing managerial and technical advancement underpinned by a new company vision, implemented by the new management board.
With a pragmatic strategic view and the technical strength of a highly qualified team of experts, the project provided the correct and prompt solution to an urgent and relevant need of the population, overcoming some weaknesses in the project design and forecasts (such as for example the planned overcapacity stemming from demand overestimation). The taskforce in charge of project implementation not only provided a high standard of technical input, but was also able to establish fruitful professional relationships with the national authorities in charge of funds management and with the financing institutions (EU and EIB). In particular, the Italian desk of the EIB provided not only the funding but also technical support at the design phase, by requiring an additional component (i.e. the water metering system) for which additional funds were also provided. As regards the European Commission, it played the role of funds provider with no additional input either in the planning or during the implementation phase.
However, after the first interventions were successfully implemented, this ambitious innovative strategy was discontinued. The reasons for this stem from a number of events, including institutional conflicts and impasses in the implementation at regional level of national reform of the water supply system. Change in the management board of the municipal company definitively brought a halt to the ‘magic moment’ of this restructuring process. Political impasse and managerial limitations were the cause of the failure to continue proper and comprehensive implementation of the remaining components of the original design.
The adoption of a more strategic and comprehensive approach by the Commission would have been beneficial to the completion of the water network development plan, including the components already planned and never implemented. In this light the Commission could have urged the municipality and AMAP to complete the modernization of the water network within the framework of the following programming periods by removing all the obstacles that prevented the already planned interventions from being realized. Such pressure from an external player could have been critical in overcoming impasses in the governance structure. According to some interviewees, the EC, during the years of project’s implementation, was actually in the position, by a modest amount of moral suasion, to push the consistency of the strategic planning and the allocation of the Structural Funds. For example, within the first three years Operational Plan approved by the Authority of the pertinent Optimal Territorial Ambit183 an allocation of EUR 13 million184 (funded with a mix of sources, including the EU
183 The service provided by AMAP S.p.A. is part of the Integrated Water Service organization of the Optimal Territorial Ambit 1 of Palermo. 184 2011 prices.

156
funds185) was foreseen with the aim to undertake some remaining necessary investments in the Palermo network. Such investments were actually never implemented.
The overall project implementation suggests two relevant lessons that are worth to be underlined. First, technical competence and managerial capacity have proven to be crucial in order to implement the project both on time and without cost overruns. Indeed, the governance aspect – deeply related to political issues – can be rightfully considered a key necessary condition for the Palermo water supply system’s success.
A further lesson that can be drawn from this case‐study concerns the importance that the institutional context and legislative framework have in creating a favourable context, by clearly setting out responsibilities and providing incentives for committing to long‐term investment plans. The EC could play a role in this respect. Even if so far most of the Commission’s efforts have been put during the initial phase of the project’s financial assessment, giving little relevance to the subsequent design and operational phases, systematic follow‐up activities, the provision of financial funds conditional on a longer‐term planning and a stronger supply of technical expertise would be highly advisable in the future years for facilitating the overall reconstruction process.
185 Since the 2000‐2006 programming period, financing of investments in the water sector in Sicily has been ruled by Framework Programme Agreements, using in an integrated way both the ERDF and the various national funds.

157
INTEGRATED SOLID WASTE MANAGEMENT IN NORTHERN LISBON This case study analyses the development of the Integrated Waste Management System in the metropolitan area of Northern Lisbon, implemented by the public company Valorsul (Valorização e Tratamento de Resíduos Sólidos da Área Metropolitana de Lisboa Norte S.A.).
Portugal’s economy was undergoing significant growth in the early 1990s, following structural changes in various sectors, namely industry, agriculture, coastal urbanisation and tourism. At the same time, the country had difficulties in balancing this progress with social and environmental developments. The waste sector, in particular, was managed in an unsustainable way, and Portugal struggled with the new challenges arising from EU membership (specifically compliance with policies and legislation). MSW treatment still relied upon landfill disposal and, to a minor extent, compost production. Recycling was largely underdeveloped and no incinerator plants were in operation.
In response to this, starting from 1993 the Government reorganised the waste sector by means of new laws, policies, plans and institutions. Two Decree‐Laws186 allowed municipalities to undertake waste management activities through third‐party concessions and they set the conditions for shared management systems between municipalities. Furthermore, the Strategic Plan for Municipal Solid Waste (PERSU) was launched in 1996, which set the ground for the construction of new infrastructures for waste treatment.
Within this context, Valorsul was established in 1994 as the public company responsible for municipal waste treatment of the metropolitan area of North Lisbon, including the municipalities of Amadora, Lisbon, Loures, Odivelas and Vila Franca de Xira187. Its shareholders include the Councils of these municipalities as well as other public bodies at national level. In 1995 the company was granted a twenty‐five year concession for the construction and management of the necessary facilities for the recovery or disposal of municipal solid waste (MSW) produced by some 1.3 million people. The overall project size can be appreciated if one considers that in 2009 the MSW produced by the municipalities in the catchment area accounted for 16% of total MSW generated in Portugal.
The initial project, financially supported by the CF and the European Investment Bank, covered the construction of a Waste to Energy Plant (WtE), a modern sanitary landfill, a material sorting facility, drop‐off centre and a bottom ash processing and recovery installation. The project also envisaged the sealing of uncontrolled open dumps and the implementation of separate collection of specific MSW (albeit collection remained the responsibility of the municipalities and not of Valorsul). This project was implemented between 1995 and 2002 and involved a capital expenditure of EUR 331.4 million in current terms (at 2011 prices). The evaluation takes into account also a subsequent Cohesion Fund project, approved in 1999, involving the construction of an Anaerobic Digestion Plant producing compost from organic
186 Decree‐Law 372/93 October 29th and 379/93 November 5th. 187 Note that, at the time of the establishment of Valorsul, Odivelas belonged to the municipality of Loures, from which it became independent in 1998.

158
waste (for an investment cost of EUR 34.6 million). This plant, which started operations in 2008, complemented the Valorsul waste management aimed at providing the population of the metropolitan area of Northern Lisbon with modern and effective facilities for waste treatment and recycling.
The total investment cost for implementation of the Integrated Waste Management System considered in the analysis is EUR 366 million in constant 2011 prices. Besides the Cohesion Fund and European Investment Bank’s contribution, the remaining cost were covered by Valorsul own resources, as shown in the following Table.
OVERVIEW OF INVESTMENT COSTS AND SOURCES OF FINANCING Financing period 1995‐2002; 1999‐2008
First year of operation 1996‐2008
Total investment costs (2011 prices) EUR 366 million 100%
Sources of financing and co‐funding rates over the total investment costs
Cohesion Fund EUR 136.8 million 37.38%
European Regional Development Fund EUR 0 0
European Investment Bank EUR 125.8 million 34.36%
National‐regional‐local public contribution EUR 0 0
Public equity/commercial debt/internal cash flow EUR 103.4 million 28.26%
Environmental quality is the aspect on which the project has had the most positive impact. The project contributed, in particular, to the closure of all uncontrolled landfills in the catchment, which were generating significant air and soil pollution; to proper processing of municipal waste (e.g. it reduced the amount of untreated waste sent to landfills from 100% in 1998 to 17% in 2009); to the generation of partially renewable electricity (Valorsul produces 0.7% of the national electricity of Portugal), thus reducing greenhouse gas emissions, and to increasing the recycling rates of organics and other materials.
It is worth highlighting, however, that the current recycling rates in the catchment area (which varies between 6% and 14% of total recyclable materials) are still below the national and EU targets, in contravention of EU Directive 2004/12/EC on packaging and packaging waste. Organic waste sorting is very poor, and the high improper fraction prevents from producing good quality compost. Despite the numerous education campaigns implemented by Valorsul, more time and efforts are probably needed in order to change the waste sorting behaviour of citizens.
From an economic viewpoint the project has contributed to direct economic growth in a number of areas, such as energy production, sale of recyclable products and delivery of effective waste treatment services. Notwithstanding this, the benefits to economic growth could have been greater, subject to the following conditions:
• a higher recycling rate, enabling an increase in the sale of recyclable materials;

159
• a better quality of compost produced, which would have generated higher revenues from the Anaerobic Digestion Plant: Valorsul is experiencing difficulties in marketing the compost due to its poor quality;
• and, if the facilities had been built in a single complex. The plants that are part of the Valorsul Integrated Waste Management System have been spread over the different municipalities involved. Their centralisation in a single location would have allowed a saving in waste transportation costs between facilities and in overhead costs, while generating relevant synergies.
Additionally, Valorsul’s financial return on investment would have been higher if the tariffs paid by municipalities for the waste treatment services reflected their cost. Instead, thanks to the governmental subsidisation of the price of energy produced by ‘green’ sources, Valorsul generates high income from the production of energy from waste, and as a result can charge the municipalities very low gate fees, sufficient to make a modest financial surplus188, but not covering the operation cost of waste treatment. This is in contravention of the European “polluter pays” principle189.
These issues are reflected in the CBA exercise. On a socio‐economic basis, the project has a negative return (ENPV EUR ‐44 million) over a 30 year timeframe. However, if compared to the counterfactual of a landfill, which generates an ENPV of EUR ‐179 million, the project generates a net positive return for society of approximately EUR 135 million, with an internal rate of return of 5.9%.
Overall, the project’s economic benefits, that have been quantified in the CBA, are not particularly high and they are positive only when compared to the counterfactual scenario. This is partly due to the aforementioned reasons (lost revenue opportunities from the sale of compost, the limited revenues from the sale of recyclable materials and the relative more costly decentralised system). However, in assessing the project’s impact it has to be considered that the CBA does not incorporate a large number of other effects which in fact have been produced by the project.
The large scale of the project (one of the largest at that time), the new technology (incineration) and the multi‐municipal management structure used, had a positive impact on capacity building, from a technical as well as a managerial perspective. Much of the expertise was acquired from international experts brought in to establish the project, with a potential positive effect on the endogenous dynamics of economic growth. With regard to institutional quality, the project helped to create in a relatively short period of time a level of expertise and capacity to deliver large and complex projects that did not exist before in Portugal. The project
188 It is not uncommon for the gate fees at municipal WtE plants to be set as a residual after energy sales revenues are taken into account. It is worth noting also that final users contribute as tax payers to the subsidisation of the energy sector. 189 According to this principle, stated in Directive 2004/35/CE, the operator whose activity has caused the environmental damage or the imminent threat of such damage is to be held financially liable. The objective of this principle is to induce operators to adopt measures and develop practices to minimise the risks of environmental damage so that their exposure to financial liabilities is reduced.

160
was ‘pioneering’ at the time, and it can be said that in the medium to long run, it also influenced some institutional structures in a sort of learning‐by‐doing process. In fact, the lessons learnt have been used to assist EU Candidate Countries involved in similar projects in subsequent years, through the EC Twinning Instrument.
Regarding territorial cohesion, the project has had an influence on reducing welfare disparities between the relatively large and rich municipality of Lisbon and the other smaller and less economically developed municipalities in the metropolitan area: if the decentralised strategy followed in the construction of the waste treatment facilities increased the transport cost of waste and the transport emissions, it also helped to distribute the employment and development opportunities generated by the new infrastructures across all the municipalities involved and, most of all, to minimize the “Not in my backyard” syndrome: since no municipality was in favour of the construction of a waste treatment complex in its area, in order not to dissatisfy any municipality, Valorsul accepted to distribute the different plants over the entire catchment area. Instead, the project did not contribute to social cohesion, since it ensured the provision of a public service to all citizens, without focusing on particular social groups.
The main non‐quantified benefit is on social happiness. Local residents not only enjoy a better quality of waste services, but also have been the target of many initiatives in the area of environmental education, which increases public perception of the improvement in quality of life attained thanks to the new Integrated Waste Management System. While in its initial stages the project faced opposition from local communities and environmental organisations, Valorsul’s efforts to increase the transparency of its operations, raise awareness and involve civil society organisations and other stakeholders, helped to change perceptions. The closure and rehabilitation of old dumps provided valuable public amenities while generating significant environmental improvements. Moreover, Valorsul has supported additional initiatives to increase people’s quality of life, such as the construction of an indoor swimming pool and the planting of trees in public parks. As a result of this, opposition is now considered negligible and the project’s impact on social happiness has been very high.
The project was highly appropriate to its context and this played a positive role in the generation of long‐term effects: the large problem of waste management and the need to comply with EU policies and legislation was highly relevant in the justification of the project, which was also necessary for the success of national plans and strategies such as PERSU. The celebration of Expo ’98 in Lisbon was also an important driver, since the selected location was occupied by an old dump site and a poorly functioning composting plant, for which an alternative solution had to be found. Very important too was the availability of EU funds for large infrastructures that would help Portugal to meet EU environmental standards.
Another key factor in the project’s success was the limited on‐going opposition to the project, which has been minimised through an adequate forecasting capacity and managerial response. On the one hand, Valorsul anticipated that the public would oppose the new technology, but it managed to change perceptions, as said, by organising communication campaigns and building strategic partnerships with companies, authorities and local associations, with particular

161
attention to those groups who had more reservations regarding the project. On the other hand, Valorsul secured the consensus of the municipalities involved, which are both its shareholders and users of the Integrated Waste Management System, by adapting to their demands: more specifically, municipalities asked for and obtained the construction of waste facilities in each of the target territories and a of ring‐road serving the WtE plant so as to reduce traffic congestion. Demands of environmental organisations have also been addressed through the decision to build the composting plant.
Forecasting capacity however was limited as far as the waste volume and composition in the target area were concerned. The WtE plant’s capacity turned out to be slightly higher than actual demand: it is capable of treating 662,000 tonnes of MSW per year, but in fact over recent years has received on average 560,000 tonnes; the current economic crisis, which has constrained private consumption and thus waste generation, is further reducing the volume of waste to be treated. Nevertheless, Valorsul has demonstrated good capacity to adapt to this. With the goal of maximising utilisation of the WtE capacity and reaching economies of scale, in 2010 the company decided to merge with Resioeste, the association of municipalities responsible for waste management in the West region of Lisbon, having a population of about 400,000 inhabitants.
Regarding project design, it proved to be effective in generating the expected effects. The project was planned in a comprehensive and incremental way. At first, the most urgent issues were tackled, i.e. sealing of open dumps and construction of a modern landfill. Then the WtE plant was commissioned, and initiatives for complementary waste treatment followed.
Finally, it is worth noting the role of the EC and the European Investment Bank (EIB). The EC not only co‐financed Valorsul’s first project, but also gave continuous support to Valorsul’s activities through the co‐financing of further projects, namely: the refurbishment of municipal landfills (European Regional Development Fund); the Anaerobic Digestion Plant (Cohesion Fund); the Ecovia project (LIFE Programme), etc. The role of the EIB was also of great value. In addition to a financial contribution close to that of the CF (32% against 36% of total investment cost), the EIB also provided technical and economic assistance for the design of the project.
The main lesson that can be drawn from this project concerns the way how Valorsul involved and collaborated with local authorities, Non‐Governmental Organisations and other parties in order to secure consensus among stakeholders. Projects envisaging the construction of incinerator plants are usually subject to very strong public opposition, but Valorsul successfully managed to cope with that by organising numerous awareness campaigns and ensuring high transparency towards the public since the early stage of project design. On the other hand, the project also allows to perceive the importance that good waste sorting among households has in ensuring the effectiveness of the entire waste management system: the recovery of recyclable materials in the Northern Lisbon area currently is not enough to comply with the EU targets on recycling190 and bad separation of organic waste prevents from producing compost
190 Set in Directive 94/62/EC on packaging and packaging waste, amended by Directive 2004/12/EC.

162
to be sold to the agriculture sector. New awareness campaigns and the improvement of waste collection, which have been foreseen in the new Strategic Plan for Municipal Solid Waste, covering the period 2007‐2016, are expected to improve the recycling rates in the future years.

163
URBAN SOLID WASTE MANAGEMENT IN GALICIA This case study analyses the implementation of a new urban solid waste management system in the Spanish Autonomous Community of Galicia. The purpose of the evaluation is to assess the socio‐economic long‐term effects generated by the project and to disentangle the possible determinant factors that may have contributed to producing these effects.
The project consisted of the construction of a set of facilities in the municipality of Cerceda for the separation of recyclable materials (plastic, tetra pak and metal) and the incineration of mixed waste with energy recovery; in addition, a number of transfer stations for receiving the waste collected at local level by municipalities and transporting it to Cerceda, by truck or rail, were spread all over the region. The infrastructures were designed and are operated by the regional public‐private company Sogama, of which the Autonomous Community is the major shareholder (51%).
The construction phase took place between 1997 and 2001 and involved an initial investment of EUR 206 million191, 47% of which co‐financed through the Cohesion Fund and the remaining through Sogama’s shareholders contributions. No cost overruns and delays occurred in the construction phase. Sogama undertook additional investments in the following years, including the construction of additional transfer stations and the upgrading of plants and machineries. The total investment costs considered in the project under assessment amount to EUR 274.6 million (2011 prices), the majority of which financed by Sogama, while the European Commission (Cohesion Fund) contributed for about 36% of the total investment costs. A residual contribution, particularly for the construction of one transfer station, has been provided by the Municipality of Vigo (see the following Table).
OVERVIEW OF INVESTMENT COSTS AND SOURCES OF FINANCING Financing period 1997‐2010 (CF project 1997‐2001)
First year of operation 2001
Total investment costs (2011 prices) EUR 274.6 million 100%
Sources of financing and co‐funding rates over the total investment costs
Cohesion Fund EUR 99.6 million 36.3%
European Regional Development Fund EUR 0 0%
European Investment Bank EUR 0 0%
National‐regional‐local public contribution EUR 1.5 million 0.5%
Private capital (Sogama)* EUR 173 million 63.2%
* Sogama’s financing is provided by its shareholders, including the Government of Galicia, and by private loans.
Sogama collects a tariff from municipalities to cover the waste transport and treatment costs, which in 2012 amounts to EUR 54.33 per tonne (VAT excluded). This tariff was set in 2004 so as to ensure the company’s financial sustainability, without pursuing profit maximisation. However, the increase of personnel costs recorded in the following years, the fall of revenues 191 In constant 2011 prices, corresponding to EUR 147 million in current terms.

164
from the sale of electric energy produced, because of a decrease of energy prices, and the arrears that some municipalities are accumulating in paying the treatment tariff is putting Sogama in financial difficulties. In 2010 its commercial debt amounted to EUR 30.5 million. It is uncertain how long this situation will continue, since no tariff increase is currently under discussion.
A crucial feature of the project’s history and its performance regards the fact that in Spain municipalities have a very high degree of autonomy in the management of public services, including in the solid waste sector. In accordance with this autonomy, Galician municipalities were free to decide whether to entrust waste treatment to Sogama or to set up their own facilities for waste treatment and disposal. In 1997, when Sogama’s plants were designed and the Region applied for EU financial support, the demand for the Sogama’s facilities was still unclear. While 18 municipalities out of a total of 315 in the region had already decided not to be served by Sogama and to build two composting plants (the Nostián and Barbanza plants), another 150 municipalities chose Sogama’s incineration technology, while the remainder (representing almost half of the total Galician population) were still unsure about which technology to adopt.
Since the first years of operation, the number of municipalities served by Sogama has significantly increased, from 150 (with a total population of 1,100,000) to the current 296 (with around 2,300,000 inhabitants), representing 82% of the total Galician population. As a consequence, the volume of waste treated by Sogama has also risen, from less than 500,000 tonnes in 2000 to almost 900,000 tonnes in 2006‐2011192. In order to cope with this increase, Sogama’s landfill, built in 1996 as a depository of non‐hazardous waste, was enlarged so as to receive the volume of mixed waste collected by the municipalities of the catchment area in excess of the capacity of the Cerceda facilities, which is 500,000 tonnes per year. As far as the recyclable waste is concerned, this is collected in different types of rubbish bags which all go to Cerceda where the recyclable materials are sorted, compressed and delivered to the companies charged with their recycling.
This study finds that the project achieved its main objective: the closure of the numerous illegal landfills operating in the region in the Nineties and the provision of a more environmentally sustainable waste management system, in compliance with EU Directives and national legislation. Also because of the poor ex‐ante situation, involving high contamination and no valorisation of waste through recycling or energy generation, the project’s impact on the environment was immediately positive. Yet, it has to be pointed out that the recovery of recyclable waste is still far from meeting the recycling targets set by the European Commission (Directive 94/62/EC) and national legislation (Regulation 252/2006)193.
Relevant effects have been detected also in terms of direct economic growth, through the generation of direct and indirect employment, the production and sale of electricity, and the
192 These volumes refer to mixed waste (excluding recyclable materials). 193 Ranging between 55% and 80% of total packaging produced.

165
waste separation and treatment activities carried out by Sogama. These effects are quantified via the ex‐post CBA methodology at an economic net present value of EUR 193.07 million and an economic internal rate of return of 7.19% (at 2011 prices).
In terms of endogenous dynamics of economic growth, the project contributed to the development of human capital within the region, thanks to the new expertise and capacities in delivering a range of modern waste management technologies and in regulating them. This favoured the establishment in Cerceda of other facilities for the solid waste treatment, beside the Sogama complex: a plant for bulky and electronic waste treatment and a plant for recovering and disposing of the pharmaceutical waste collected all over Spain. All these activities paved the way to good economic perspective for the municipality: today Cerceda has the lowest unemployment rate in Galicia (7%) and it is among the towns with the highest per capita income in the region.
The Sogama project ensured territorial cohesion within the regional territory. No municipalities have been excluded in principle from the waste management service offered by Sogama and a unique tariff to all the subscriber municipalities was applied starting from 2004. The solidarity purpose of the tariff, which is proportional to the volume of non‐recyclable waste produced but it is not related to the actual distance of each transfer station from Cerceda and hence to Sogama’s transport costs, particularly benefitted the most distant towns, which are also the most rural. In this way, the project contributed to reduce the core‐periphery gaps and in preventing any welfare territorial disparities. However, such a tariff setting is only partially in line with the European “polluter pays” principle applying to the waste management sector and stated in Directive 2004/35/EC: according to this principle, the more distant the Sogama client the higher the tariff should be, because of higher environmental transport costs.
There have been more limited effects on institutional quality. Even if new competencies concerning the delivery of waste management services were developed both within the regional and municipal administrations, much more could have been expected. In particular, municipalities could have made a greater use of different forms of associations (such as consortia) in order to more efficiently manage transport and collection activities, via economies of scale and reducing costs. They also could have made much more efforts to promote waste separation among citizens, so as to maximise the recovery of recyclable materials.
On the other side, the Government of Galicia did not minimise the main risk affecting the new regional waste management plan: uncertainty about the number of municipalities deciding to subscribe to a service contract with Sogama. The size of the Cerceda facilities for treating and incinerating mixed waste was set according to the number of municipalities that had already agreed to join the Sogama’s waste treatment model, and it turned to be inadequate when demand increased. Hence, a much larger amount of waste than was expected has to be dumped every year in the landfill, losing the opportunity to valorise it. However, some mechanisms could have been put in place by the Region to more precisely quantify the potential beneficiaries of the Sogama project, without limiting the autonomy of local

166
authorities: higher involvement and discussion with municipalities since the early stage of project conception, in particular, could have helped to give Sogama more definite indications of the project’s demand.
Although the long‐term contributions on economic development, environment and, in general, quality of life, are significant, people perceptions of the project effectiveness are not particularly high. On one side, people express satisfaction over the closure of all illegal landfills and the adoption of a more sustainable waste management solution; on the other side, their perception of wellbeing has been significantly influenced by the environmentalist associations and, partly, by the press, both of which strongly contrast the incineration technology against other forms of waste treatment (for instance, compost production). Such opposition and the lack of an adequate communication strategy by the project sponsors did not allow the public to perceive in a balance way the benefits brought by the project.
The analysis of the determinant factors of the long‐term effects generated by the project shows that:
• The project was highly appropriate to the regional context, as it was the right initiative to implement in order to achieve a more sustainable waste management model: in particular, the construction of a number of transfer stations operating in specific areas of the region as intermediate points along the waste collection process adapts well to the peculiarities of Galician economic geography, characterised by high population dispersion.
• Sogama’s forecasting capacity was highly constrained by the specific legislative context and the Government of Galicia’s strategy, that prevented anticipation of actual project demand.
• As a consequence of the limited forecasting possibility, the project design was particularly rigid and Sogama’s room for manoeuvre was constrained. The incinerator size was set according to the actual number of subscriber municipalities at the time of the financing application; when demand increased, Sogama preferred to enlarge the landfill’s size, while the incinerator’s capacity was not modified: in fact, nothing would have guaranteed that demand would not have changed again. In any case, the project design was good, thanks to the adoption of the best incineration technology available (the Circulating Fluidised bed Combustion), considered more efficient and environmental friendly, and it positively contributed at the project’s performance.
• Sogama did its best to react to the unexpected events, demonstrating good managerial response, for example when its landfill was enlarged, in order to cope with the increase volume of waste collected, or when awareness campaigns had to be organised to reduce the fraction of improper waste among the recyclable materials. By carrying out these activities, Sogama managed to improve the quality of waste sorting by households.

167
• The regional project’s governance is the dimension which mostly affected the project’s performance: in particular, the very high degree of autonomy granted by national law to municipalities and the Region’s weak role during the planning phase in better defining ex‐ante the service’s demand are the main causes of the under‐capacity of Sogama’s facilities. By not putting in place any mechanism to cope with the municipalities’ hesitation about which treatment plant to join, the Region did not contributed to limit the uncertainty regarding the demand for the waste management service delivered by Sogama.
• The European Commission’s degree of involvement in the Sogama project was very limited. Besides covering a share of the investment cost, the Commission did not have any active role in the project design and, particularly, in supporting the Government of Galicia in the development of the regional waste management plan and in pointing out its weaknesses. As a matter of fact, this was outside the Commission’s sphere of intervention.
Two lessons can be learnt from this project. First, the Sogama project allows to understand to what extent the institutional context’s characteristics, in this case at regional level, may negatively influence the design and development of a project. The legislative and institutional framework should ensure the identification and removal of all constraints that may hamper the project effectiveness, but this was not the case of the Sogama project. Second, the impact of an environmental project in the field of solid waste management can be maximised only if a set of awareness campaigns to the public are organised, in order to promote source separation practices (thus increasing the recycling rates) and ensure social acceptance of the new waste management system put in place.
The current waste management plan of the Government of Galicia, covering the period 2010‐2020, is expected to intervene to address the problems that limit the Sogama project’s effectiveness: awareness campaigns are planned to be organised to further improve citizens’ waste sorting and a new Waste to Energy plant is going be built in Galicia and to enter into operation in 2018, to ensure the valorisation of all non‐recyclable waste collected, which exceed the capacity of the Sogama incinerator plant. As a consequence of the new regional strategy and of the investments already programmed for the coming years, the overall performance of the Sogama project might increase specifically in terms of the economic and environmental impacts.
Yet, it has to be considered that valorisation of all non‐recyclable waste produced in the region will be achieved only if an appropriate number of municipalities will actually decide to drop off the Sogama waste management system and start to be served by the new incineration plant, in compliance with the EU proximity principle. Coordination by the regional administration may be helpful to guarantee enough demand to both the treatment plants, but the Government of Galicia still does not have any power in this respect.

168
INTEGRATED ENVIRONMENTAL REGENERATION OF RÍA DE VIGO This case study analyses the group of projects “Integrated environmental regeneration of Ría de Vigo”, which envisages the construction of nine waste water treatment plants and the installation of sewage pipelines and pumping stations in eight municipalities of Ría de Vigo, in the Spanish Autonomous Community of Galicia. The timeframe of this evaluation study, which occurs more than ten years after the project’s completion, allows one to analyse the socio‐economic‐environmental effects generated by the project in the long‐term, and to identify the factors that may have contributed to producing or limiting these effects. The evaluation methodology adopted comprises both qualitative and quantitative techniques, relying on documentary evidence, press and literature review, interviews and the Cost‐Benefit Analysis methodology.
Since the beginning of the Nineties, the Spanish Autonomous Community of Galicia has financed a number of interventions to improve waste water management within the regional territory. Among these investments is the major project “Integrated environmental regeneration of Ría de Vigo”. Ría de Vigo is a 35 km long sea inlet on the West coast of Galicia, facing onto the Atlantic Ocean. It is one of the most densely populated and industrialised areas of the region and the lack of any treatment plant to purify urban sewage before being discharged into the Ría’s water was negatively affecting the environment and the quality of life of inhabitants. Before the project implementation, the Ría was suffering severe contamination, with floating solid debris, bad odours and accumulation of pollutants.
In order to provide an appropriate and integrated solution to this situation, the Region took charge of the construction of nine treatment plants along the Ría’s coast, in eight different municipalities: Vigo, Redondela, Cangas, Moaña, Nigrán, Gondomar, Soutomaior and Vilaboa. The interventions included also the replacement and extension of the sewage pipelines in parts of the municipalities, in order to convey all waste water produced by the population to the treatment facilities. Project design and implementation were undertaken by Augas de Galicia, an independent body of the Government of Galicia, while the operation of the infrastructures, once completed, was generally assigned to the municipalities194.
The works were implemented between 1995 and 2000 and the infrastructures started to be operated over a number of years, from 1998 to the end of 2000. The project cost EUR 159.5 million in real terms (2011 money)195. The Cohesion Fund ensured adequate financing for the project, by covering almost 80% of the investment expenditure, while the remainder was financed by the Region and, to a lesser extent, by the municipality of Vigo. Between 2005 and 2010 additional investment costs were undertaken by the Region to upgrade some of these treatment plants, involving a cost of EUR 9.4 million. They have been included in the analysis, thus making the total investment cost of the project under assessment EUR 171.52 million.
194 Only in few cases, Augas de Galicia took responsibility for the operation of some treatment plants, as explained below. 195 All figures are expressed in real terms at 2011 prices, unless otherwise specified.

169
OVERVIEW OF INVESTMENT COSTS AND SOURCES OF FINANCING Financing period 1995‐2000
First year of operation 1998‐2000
Total investment costs (2011 prices) EUR 171.52 million 100%
Sources of financing and co‐funding rates over the total investment costs
Cohesion Fund EUR 117.62 million 68.6%
European Regional Development Fund EUR 0 0
European Investment Bank EUR 0 0
National‐regional‐local public contribution EUR 53.91 million 31.4%
Private capital EUR 0 0
Thanks to the project, today all the municipalities of Ría de Vigo are provided with a system to collect and treat all urban waste water produced by inhabitants, tourists and some commercial and industrial activities, corresponding to a total number of 620,000 population equivalent. By the end of 2000, without any unexpected delay, all the treatment plants were in operation and direct discharge of urban waste waters in the Ría ceased. The various sources of financing were able to cover the estimated investment costs, so that no cost overruns occurred. The project’s financial sustainability has been secured also during the operational phase, by means of municipal tariffs, which entirely cover the operating cost of treatment plants, and of a regional tax which provides for further resources to meet the future investments needs in the waste water treatment sector of Galicia. Both the municipal tariff and the regional tax for waste water management and treatment are in line with the European “polluter pays” principle, stated in Directive 2004/35/CE and requiring the costs of pollution be borne by those who cause it: actually, higher volumes of waste water produced are related to higher tariffs.
The new infrastructures had an immediately positive effect on environment and direct economic growth. More specifically, the reduction in the contamination load of the Ría, which was putting at risk the entire ecosystem, enabled an increase in environmental quality. These interventions effectively improved water quality, in compliance with Directive 91/271/EC on urban waste water treatment, which required the municipalities of Ría de Vigo to install secondary‐type treatment facilities for urban waste waters by 31st December 2000. Most of the treatment plants have also been provided with a disinfection system, to further reduce the concentration of bacteria in the water, in compliance with the Directives for shellfish and bathing waters (respectively, Directives 79/923/ EC and 76/460/ EC).
In terms of economic growth, the improvement in the Ría’s water led to an increase in the number of bathing beaches, which in turn benefited tourism development: more tourists have been attracted by the beautiful landscape and clean sea, thus stimulating the development of the accommodation sector and a number of economic activities related to the use of beaches (beach umbrella and sun bed rental, sale of food and beverage, and so on). A clear indication

170
of the enhancement of water and beach quality is given by the number of beaches along the bay achieving Blue Flag196 status: they have steadily increased, from 2 in 1999 to 17 in 2007.
As far as another important and well‐developed economic sector of Ría de Vigo is concerned, i.e. shellfish extraction and aquaculture, the evidence collected shows that the project’s effect has not been significant. Even if Augas de Galicia expected the project to have some positive impact on this sector, the improvement of water quality appears not to be directly related either to any increase in shellfish production or to any reduction in time and cost needed for their purification. Actually, before being consumed, mussels need to spend some time in open waters (usually in the Atlantic Ocean) in order to reduce their microbial load. The purification process, however, has not been influenced by the project: its duration, and hence cost, did not undergo any significant variation as a result of the improvement of water quality.
Thanks to the enhancement of the Ría’s water quality, today inhabitants benefit from a general improvement of wellbeing. More specifically, the reduction of non‐bathing beaches and the possibility to enjoy new recreational activities linked to the use of water and beaches are the main factors which positively affect the beneficiaries’ quality of life. This effect has been valued via the willingness‐to‐pay of inhabitants for the waste water treatment service and included in the ex‐post Cost Benefit Analysis. The results are positive: a net present value of EUR 46.81 million and an economic internal rate of return of 5.86% (at 2011 prices).
The project also contributed to fostering territorial cohesion in the target area. By extending the sewerage to the most rural and less densely populated areas of the cities and by providing all inhabitants with the same waste water management and treatment service, the infrastructure enabled the reduction of territorial gaps between the peripheral and central districts of the cities.
Greater effects could have been produced on institutional quality, in particular where the institutions at the regional level are concerned. The project represented the opportunity for Augas de Galicia to provide a sustainable solution to the waste water management problem in Ría de Vigo. Yet, in designing the project, only the requirements of the urban waste Water Directive were originally considered by Augas de Galicia, while the specific targets on water quality set by the bathing waters Directive and the shellfish waters Directive were not fully complied with. After the European Commission demanded that these relevant Directives were also taken into account, Augas de Galicia revised the project design and provided some of the treatment plants with Ultraviolet (UV) disinfection technology. However, this technology, which would have enabled the achievement of the more stringent water quality standards for bathing and shellfish waters, was not installed at the plants at Redondela, Soutomaior, Cangas and at the river Lagares plant at Vigo.
Furthermore, no adequate measures to guarantee the water quality needed for shellfish waters were included in the Galician plan of water purification, published in 2000 and covering
196 http://www.blueflag.org/

171
the period 2000‐2015. The lack of proper interventions specifically aimed at implementing EU legalisation in this field in Ría de Vigo led to an infringement procedure and to an economic sanction by the European Court of Justice in 2005. After the sanction, in order to ensure full compliance with the requirements of the shellfish water Directive, the treatment plants at Redondela, Soutomaior and Cangas were upgraded with the UV disinfection system.
Today, the main problems that still limit the project’s effectiveness are related to the Lagares plant. This facility, which is the largest among those built, receiving 65% of the urban waste waters produced in all of the Ría, still lacks disinfection technology and, most importantly, is affected by structural problems that prevent its proper functioning. Because almost all the sewerage network of Vigo is mixed, conveying both waste water from households and rain waters, during the rainy periods a larger volume of water arrives at the plant, whose capacity allows it to treat only a part of it. Waste water exceeding the capacity of the Lagares plant has to be discharged into the Ría after undergoing only the primary‐type treatment. These problems prevent the maximisation of the whole project’s benefits on the environment and economic growth; moreover, the disappointment among the public at not yet having solved the malfunctioning of this plant, which is limiting the overall quality of the Ría’s waters, but also preventing full compliance with the European relevant Directives, is reducing the perception of wellbeing and of the project’s effectiveness.
The mechanisms behind the project’s performance have been identified and evaluated. Among the factors which positively contributed to the generation of long‐term development effects are the good appropriateness of the project to the context and the adequate managerial response of Augas de Galicia in response to unexpected events. On one hand, providing an integrated intervention to improve waste water collection and treatment throughout all the municipalities of the Ría was the most appropriate solution to improve the water quality of the whole water basin. In addition, Augas de Galicia appropriately took into account the high population density characterising the municipalities and the resulting space constraints on the treatment plants: where space was limited and municipalities did not succeed in expropriating the required land, because of the reluctance of residents to move, Augas de Galicia built the treatment plants on artificial platforms extending out onto the sea, specifically created for this purpose. On the other hand, Augas de Galicia promptly and effectively intervened when some municipalities197 were shown to be unable to set up the tendering process to assign the management of the treatment plant: in these cases, the regional body took responsibility for running the infrastructures, thus ensuring their immediate functioning.
By contrast, the main determinant factor responsible for the weakness of the infrastructure is poor project conceptual design. In planning the intervention in Ría de Vigo and designing each infrastructure, Augas de Galicia placed particular emphasis on the objective of fulfilling the urban waste water treatment Directive by the established deadline, but the other relevant Directives, particularly the one concerning shellfish waters, were probably pushed into the background. In parallel, the problems related to the limited capacity of the Lagares plant were 197 These were Soutomaior and Vilaboa.

172
not adequately taken into account by the regional authorities. Actually, the inadequate treatment capacity of the Lagares plant with respect to the volume of water to be treated during the rainy periods was apparent and well acknowledged by Augas de Galicia: these problems have been expressly admitted since 1995, in the application for EU co‐financing. Hence, as a matter of fact forecasting capacity cannot be considered inadequate per se, while poor project design is considered as the key determinant of the limited project performance.
Besides an over‐emphasis on compliance with the urban waste water treatment Directive to the detriment of the requirements of the other Directives and the overall functioning of the largest treatment plant in the Ría, a shortage of regional financial resources contributed to determine a poor project design. Augas de Galicia, which in the same period was implementing a large number of investment projects throughout the regional territory, made great efforts during the design and construction phase to optimise the available resources and control costs. Despite the fact that Cohesion Fund support was very high for the major project in Ría de Vigo, the regional funds that had been allocated for investments in the waste water treatment sector were limited and insufficient to fully address the investment needs of the area, as also admitted by an interviewee.
The European Commission at first greatly contributed to the improvement of the project design, by highlighting the need to ensure compliance with the shellfish and bathing water Directives, thus indirectly requiring the installation of the UV treatment systems. Against Augas de Galicia’s declaration that all the relevant Directives had been taken into consideration, the Commission agreed to co‐finance the major project, even if, in fact, the design of most of the infrastructures still had to be finalised. This prevented the Commission from knowing that UV disinfection technology had not been immediately envisaged for all the treatment plants, in spite of its recommendations.
As far as the project governance dimension is concerned, the distribution of responsibilities between Augas de Galicia and the municipalities did not affect the positive long‐term effects produced by the project. Nevertheless, more could have been achieved if more effective control over illegal industrial discharges and the functioning of industrial waste water treatment plants had been put in place by the regional authorities. Although the industrial waste water purification systems are outside the scope of this evaluation, since the most polluted industrial waste waters are not treated at the municipal plants, ineffective control over them necessarily influences the overall impact of the other facilities and limits the attainment of greater benefits with respect to the Ría’s water quality.
The project impacts on economic growth and environment are not completely stabilised, but are expected to further increase in the future years, when the structural problems of the Lagares plants are solved. A long time was taken by the Region to identify a proper solution to these problems. A new treatment plant was finally designed in 2009 by the national public company AcuaNorte, costing EUR 170 million, but it will probably only start operations at the end of 2015.

173
In conclusion, even if an overall positive impact on economic growth, welfare and environment was generated by the project, in part because the ex‐ante situation was particularly negative and in part because of the project’s good appropriateness to the context and needs, these effects could have been maximised via more accurate planning of the interventions and project design on the part of Augas de Galicia. A higher allocation of regional funds in addressing the waste water management issues throughout the region would have also contributed at implementing the best project option, which would have generated higher effects since the initial stage of the infrastructure operation.

174
DUBLIN WASTE WATER TREATMENT This case study analyses the construction and operation of the Dublin Waste Water Treatment plant (DWWT). The purpose of the evaluation is to assess the socio‐economic long‐term effects generated by the project and to disentangle the possible determinant factors that may have contributed to producing these effects.
The context and objective of the project can be considered as:
• The requirement to comply with the Urban Waste Water Directive 91/271/EEC, along with other Directives such as the Bathing Water Directive;
• The availability of very high funding rates from the EU Cohesion Fund for investments to address the requirements of the Directive; and
• The increasingly well‐established need to improve water quality in Dublin Bay, independent of the requirements of the Directive, driven by increased population and prosperity.
In more detail, the project, completed in 2003, consisted primarily of a comprehensive expansion and up‐grading of the Ringsend treatment plant, as well as a pumping station and underwater pipeline to carry wastewater from the north of the city to the Ringsend plant. The objective was to accommodate most of the waste water arising in the Dublin region (a human population of approximately 1.1 million) and comply with the Urban Waste Water Directive. There is also planned substantial future investment to increase capacity and cater for the sensitive status of the Liffey estuary, to be completed by 2015.
This was an exceptionally large and complex project, and at the time was the largest wastewater project grant‐aided by the Cohesion Fund. The project was delivered using a Public Private Partnership (Design‐Build‐Operate ‐ DBO198) procurement process, and used a number of innovative technologies to cater for the large pollution load on a constrained site (15 hectares). The public authority in charge of the project was Dublin City Council (DCC), and the concessionaire awarded the DBO contract was the ABA consortium, which included Celtic Anglian Water (CAW) as the plant operator.
The construction phase took place between 1995 and 2003. Elements of the upgraded plant commenced operations in 1999 but the plant became fully operational in 2003.
The project involved a total initial investment of EUR 297 million (2011 prices, VAT exclusive), 53% of which co‐financed through the Cohesion Fund. The remaining investment cost was
198 Design‐Build‐Operate or DBO is a type of Public Private Partnership (PPP), whereby the public authority appoints a concessionaire to Design, Build and Operate a piece of infrastructure. The concessionaire is free to design the plant as they see fit, to deliver an agreed outcome. The concessionaire then builds the plant according to this design and operates the plant for a set period of time (typically 20‐25 years), at the end of which the plant is transferred back to the public authority. Ownership remains with the local authority throughout. Under traditional procurement the public authority (the “employer”) designs the plant and employs a contractor to build it according to the employer’s specification. Upon completion the public authority takes over the operation of the plant.

175
covered through national public contribution (37%) and contributions by large industrial users (10%). The EC contribution was primarily justified by reference to the requirement to meet the standards of the already mentioned Urban Waste Water Directive.
After the project was finalised, the designation of the Liffey estuary as a sensitive water body requiring full tertiary treatment forced to implement additional investments. A further EUR 147.3 million (2011 prices, VAT exclusive) is to be spent between now and 2015 to increase capacity and make the plant fully compliant with the Urban Waste Water Directive. Thus the total cost of the project will be EUR 443.3 million.
OVERVIEW OF INVESTMENT COSTS AND SOURCES OF FINANCING Financing period 1995‐2003
First year of operation 2003
Total investment costs (2011 prices) EUR 296 million 100%
Sources of financing and co‐funding rates over the total investment costs
Cohesion Fund EUR 157 million 53.1%
European Regional Development Fund EUR 0 0%
European Investment Bank EUR 0 0%
National‐regional‐local public contribution EUR 109 million 36.8%
Private capital EUR 29.9 million 10.1%
There were no major time overruns on delivery of the project, but the whole project was subject to a cost overrun of approximately EUR 23 million, as a result of the overrun on one aspect of the project – the underwater pipeline from Sutton in north Dublin to the treatment plant.
Design capacity of the plant (originally not expected to be reached until 2020) was 1.64 million population equivalent, split roughly 70:30 between domestic and non‐domestic customers. However, the plant was operating at above design capacity ‐ 1.8 to 1.9 million population equivalent ‐ from the day it opened. This created significant operational problems, and contributed to serious odour problems during the early years of the plant’s operations. The latter were eventually resolved, albeit at significant additional cost to Dublin City Council, which has also had to compensate the concessionaire for the above design capacity pollution load.
Current performance is satisfactory, indeed the plant is seen as a flagship for the technology used. Operation of the plant represents a significant financial burden on Dublin City Council. In particular, there are no water charges on households, although it is planned to introduce metered household water charges in the coming years. This will contribute significantly to financial sustainability of the overall public water services, as well as potentially having a moderating impact on demand. Commercial customers, whose discharges are similar in nature to domestic wastewater, currently pay a combined water/wastewater charge (EUR 1.90/m3 in 2012). Industrial customers pay based on a formula in accordance with the constituents of

176
their wastewater discharges and their licences. The formula is designed to capture the marginal cost of treating their waste water. As such, the European “polluter pays” principle199 is only partly implemented at the moment, although it is expected to be fully implemented in the coming years with the introduction of metered household charges.
Project impacts are analysed using two broad methodological approaches – quantitative (i.e. Cost Benefit Analysis) and qualitative. From an economic viewpoint (taking into account household willingness‐to pay‐for improved water quality in Dublin Bay and conversion from market to shadow prices), the project generates highly positive returns: an economic net present value of EUR 355 million and an internal rate of return of 11.7%.
There were some positive endogenous dynamics effects, particularly in terms of technological progress: many of these benefits may be mainly felt outside Ireland. The project may also have uncovered technological inadequacies, which had negative impacts on the subsequent operations of the plant, initially at least.
Social cohesion may have on balance been somewhat negatively impacted, through the impacts of the odour problems on the Ringsend district of the city, which is less well‐off than the average, and sees itself as being poorly treated by Dublin City Council (a municipal incinerator is also proposed for the area, which has exacerbated this perception). On the other hand, the extension of waste water capacity facilitated increased housing and commercial development, particularly in the north of the city where development had been constrained due to lack of water services.
It can be argued that the absence of domestic water supply and wastewater treatment charges contributes to social cohesion, by avoiding financial burdens on less‐well‐off households, but of course this has negative consequences for both financial and environmental sustainability. Avoidance of undue burdens on households can be more efficiently achieved through general social welfare transfers.
Environmental quality was strongly enhanced by the project, with a significant improvement in water quality in the bay, and further improvement possible with the installation of increased capacity and a long sea outfall in the coming years. This has resulted in a number of beaches along the bay achieving Blue Flag status in the years since the new treatment plant opened. The absence of metered domestic water supply and wastewater treatment charges has negative consequences for environment, as economic theory indicates that this contributes to the excessive load on the plant.
The plant as designed (and as operated) is in compliance with the basic requirements of the Urban Waste Water Directive, but on designation of the Liffey Estuary as a sensitive water body in 2001, further investment (to be completed by 2015) is required to deliver full compliance.
199 Stated in Directive 2004/35/EEC.

177
There is limited impact on territorial cohesion, except in so far as development in Fingal County in the north of the city has been facilitated.
It is open to question whether the project had an impact on institutional quality. The project does appear to have uncovered a lack of institutional quality at local authority level, in terms of capacity to plan and design the physical plant and the Design‐Build‐Operate (DBO) contract.
Social happiness impacts, in terms of perception of the project, are mixed. Those using the amenity of Dublin Bay have largely positive perceptions, while the residents immediately neighbouring the plant have a negative perception due to the serious odour problems in the early years of the plant’s operations, reinforced by the current plans for a municipal waste incinerator on an adjacent site.
The assessment of the key determinants of project outcomes highlights that the context for the project was in large part highly positive, specifically inadequate or no treatment of wastewater discharges from the largest city in Ireland into an enclosed bay with a high amenity value; growing population, housing and prosperity; the Urban Waste Water Directive, which brought the requirement for improved treatment into sharp legal focus; and finally the availability of very high levels of EU grant aid for projects aimed at meeting the requirements of the Directive.
Some weaknesses were highlighted under the heading of project design, under which we would include contract design. Although the DBO procurement approach apparently enabled the accommodation of the plant on a constrained site, shortfalls in the contract design made it difficult and time‐consuming to resolve operational problems and allocate responsibility.
Forecasting capacity likewise was a significant source of weakness in the project, most notably in terms of projecting the design load, which was exceeded from day one of operations. That said, the acceleration of growth during the “Celtic Tiger” period exceeded all expectations. Failure to anticipate important environmental constraints was also an issue. Between them, these have had significant consequences for the technical solution, the cost and the operations of the plant.
In general, governance for EU co‐funded projects is stronger than for unfunded projects, because of the discipline imposed by EU procedures. However, it can be said that governance of this project exhibited weaknesses in many respects, most notably in respect of the forecasting issues discussed above, but also in terms of contract design.
Managerial response exhibited positive and negatives. The project had to adapt to a number of unforeseen events, albeit that many of these should have been foreseen. It appears to have been able to cater for the above design capacity demand quite well, but took a number of years – and high cost ‐ to deal with the odour problem. A number of environmental designations that constrained the project also had to be dealt with. Positive managerial response can be seen in the construction of the Sutton to Ringsend pipeline, and in the decision by DCC to change its consulting engineers.

178
Looking forward, the project will involve significant further investment to increase capacity and deliver full compliance with the Urban Waste Water Directive (to be completed in 2015). The planned introduction of metered domestic water service charges in the coming years will enhance financial sustainability and should moderate demand.
A lesson from the project is to be aware of vulnerabilities with complex and innovative infrastructure projects, subject to significant constraints, in a dynamic environment. This may be particularly problematic in contexts where technical expertise is weak, and demand data or forecasting capacity is limited.

179

180
ANNEX II. CASE STUDIES SELECTION PROCESS
PROJECT REVIEW The ToR indicates a list of 35 major infrastructure projects co‐financed in the period 1994‐1999 by the Cohesion Fund (CF) and the European Regional Development Fund (ERDF) in Greece, Ireland, Italy, Spain and Portugal among which ten are to be chosen for in‐depth analysis with case studies. Case studies are the core of the entire evaluation exercise (Task 3), therefore the activity of project review and selection is crucial for the next steps of the study.
The project review was aimed at performing a pre‐assessment analysis to determine whether a project was in a condition to be evaluated, i.e. whether its evaluation was justifiable, feasible and likely to provide useful information within the timeframe, resource constraints and operational objectives of the present study. This review was based on a thorough analysis of project documents collected at the DG Regio premises (geographical units) as well as at the national and local authorities in charge of the projects. Documents collected included, among others, application forms, monitoring and final reports, ex‐post evaluations, technical analyses (demand analysis, Cost‐benefit analysis, Environmental Impact Assessment, EIB opinions). Additional information were collected via the Internet (press releases, books and scientific publications, parliamentary relations and so on). Site visits and telephone/email contacts were needed in order to collect all the information. A preliminary identification of key stakeholders for interviews was also carried out.
The quality and availability of data is highly varied among countries and projects. In some cases the dossiers collected were quite comprehensive, while in others basic information was missing. The quality and availability of data was a key aspect for the selection of the candidate projects.
Project review was based on desk analysis of the documents collected. A summary sheet was produced for each of the 35 projects (see Annex I) with a brief description of the key features of the project. The exercise was complemented with an evaluability scoring system which aimed at guiding in an objective and consistent way the selection of case studies. These are described in the following Sections.
SELECTION CRITERIA AND SCORING SYSTEM The evaluability assessment allowed for the ranking the projects and identified the most promising ones, out of which the ten most suitable projects have been identified by adopting further selection criteria. This method constituted a purposeful sampling that assured maximum credibility and utility, which are the main concerns given the small initial sample size.

181
More specifically, a project’s evaluability was assessed along three criteria, each one with a different weight to express its relative importance in the project selection (see box).
Box II.1CRITERIA FOR THE ASSESSMENT OF PROJECT EVALUABILITY i) Relevance for the evaluation (40%). This criterion measures the extent to which the project can
contribute to answering the Evaluation Questions identified in the ToR and the conceptual model. In this sense, a fundamental condition relates to the time elapsed since its completion: the project is in the basic condition for being appraised if it has been operational for a sufficient time span.
ii) Availability and quality of data from existing sources (40%). This criterion captures the extent to which the information (both ex‐ante and ex‐post) needed for the evaluation is already available, as well as being relevant and appropriate to the scope and purpose of the evaluation and is of good quality (no incomplete files, etc.). Considerations about the willingness of people contacted to provide support to the evaluation are also part of the judgment.
iii) Amount of new ex‐post quantitative data required to support evaluation (20%). This criterion measures the extent to which new ex‐post data is needed to be generated in order to have a sufficient set of material to carry out the ex‐post evaluation. For example, new users satisfaction surveys.
The evaluability assessment of the 35 ERDF/CF projects was based on their rated performance in meeting the above criteria. The evaluability grid (Table II.1) indicates what conditions should be indicatively met for an effective ex‐post evaluation of projects. The grid complemented and is actually part of the project summary sheets.
To arrive at a total score for a given project, country experts assigned a score to each of the questions suggested under each criterion. These questions were intended as a further specification of the criterion and guided the country experts in formulating their assessment.
By summing up the scores and weighting for their relative importance via the criterion, total scores per criterion were calculated. These scores were accompanied by a qualitative explanation of the reasons underlying the judgments made.
Finally, as an outcome of the project evaluability assessment exercise, each project received a total sum P rating (the sum of the single macro‐scores per criterion) that allowed the orderly ranking of projects. A review of the scores obtained by each project, presenting the results in aggregate form, is presented in Table II.2.
In order to pick the ten candidate projects from the ranking, additional qualitative criteria have been considered. They are:
• Coverage of all Member States: at least one project per country (if more than one project, balance between sectors and subsectors must be respected);
• Balance between sectors and subsectors;
• Coverage of all Funds;
• Representativeness in terms of CF and ERDF funds received (for example Spain received 53% of total CF funding for major projects in the period 1993‐1994, while Ireland, only 10%).

182
The level of representativeness of the projects over the total number of projects financed by the European Commission in the programming period 1994‐1999 is not taken as criterion for selection. Actually, the scope of this study is not to pick‐up the most statistically representative projects, but to consider ten illustrative examples of infrastructure projects, than can deliver interesting insights on the possible long‐term effects of infrastructures and on the causal chain leading to those effects. Although the ten case studies are neither statistical representative nor randomly selected, this methodology does not prevent the possibility to derive findings that could be generalised to most of the financed projects.
Table II.1 PROJECTS EVALUABILITY GRID AND SCORING FORMULA EVALUABILITY CRITERIA
QUALITATIVE ASSESSMENT
QUANTITATIVE ASSESSMENT
KEY QUESTIONS P RATING200
(1 to 5)
TOTAL
A) Relevance for the evaluation
To what extent is the project suitable for ex‐post evaluation in light of the methodology proposed in the Inception Report (cost‐benefit analysis complemented by qualitative discussion)?
score * 0.15
To what extent is the project likely to have generated observable long‐term changes in the service provided (or improved) through its implementation?
score * 0.05
To what extent is the project likely to have generated additional effects on its socio‐economic context or on citizens’ quality of life that are suitable for a more qualitative description?
score * 0.05
To what extent is the ex‐post evaluation of the project likely to produce relevant policy lessons?
score * 0.15
B) Availability and quality of data from existing sources
To what extent are data available reliable, of good quality and appropriate to the scope of the evaluation?
score * 0.2
Did the project have SMART indicators, documenting its impact on key target‐areas of intervention?
score * 0.05
Does regional or sector‐specific baseline (prior to the project’s implementation) quantitative and qualitative information exist?
score * 0.05
Did the project foresee a systematic capacity to generate data for its evaluation via a regular and accessible monitoring process?
score * 0.05
To what extent have contacted people been cooperative and helpful to facilitate data collection?
score * 0.05
C) Amount of new primary data required to support evaluation
To what extent is it necessary to generate new ex‐post data, such as customer surveys, to support the evaluation?°
score * 0.2
Total project evaluability Sum
A + B + C
Legend: 1 = Very low or nil, 2 = Low, 3 = Medium, 4 = High, 5= Very high. ° For this question a negative response is equal to high scores, such as 4 or 5. On the other hand, the necessity to resort to extra data gathering is rated with low scores (1 or 2).
200 Performance Rating.

183
RESULTS OF SELECTION PROCESS The result of the evaluability review is presented in table below.
Table II.2 PROJECTS RANKING ACCORDING TO EVALUABILITY CRITERIA N. COUNTRY SECTOR SUB‐
SECTOR PROJECT SCORE
1 Grece T RD Egnatia Motorway 4.85
2 Spain E WWT Waste water treatment in Ría de Vigo 4.45
3 Italy T PT Port of Gioia Tauro 4.45
4 Grece T RD Athens Ring Road 4.35
5 Spain T RW Madrid metro line – Access to Barajas airport 4.35
6 Spain T RW Mediterranean Corridor 200/220 km/h 4.15
7 Italy E WS Water supply in Palermo 4.15
8 Ireland T RD N1 Motorway 4.15
9 Ireland E WWT Dublin Region Waste Water Treatment 4.10
10 Portugal E SWT Urban solid waste treatment in Lisbon 4.00
11 Ireland E WWT Dundalk Sewerage Scheme 4.00
12 Spain E SWT Solid waste treatment in Galicia 3.95
13 Grece E WS Works to supply Athens with water 3.90
14 Ireland E WS Dublin Region Water Supply 3.85
15 Spain T RW High speed railway Madrid‐Barcelona‐French border 3.80
16 Spain E WWT Waste water treatment in Galicia 3.50
17 Spain T RW Extension of the Valencia underground railway 3.25
18 Spain E WWT Waste water treatment of the Coast of Catalunya 3.20
19 Spain T RD Motorway Rias Bajas 3.05
20 Spain T RD Motorway Madrid Valencia 2.95
21 Spain T RD Motorway Bailen Grenada 2.90
22 Ireland T RW Rail network improvement 2.80
23 Ireland T RD N7‐N8 Motorway 2.80
24 Portugal E WWT Water purification of the Estoril Coast 2.60
25 Ireland T RW Rail Network Trackwork and Signalling (originally described as Mallow‐Tralee Track Upgrade)
2.60
26 Grece T RW Double track railway Evangelismos Leptokarya 2.45
27 Portugal T RW Light surface metro of Porto 2.20
28 Portugal T RD A9 Ring Road of Lisbon 2,20
29 Portugal E SWT Incinerator plant for solid waste ‐ LIPOR II 2.20
30 Portugal E WS Water supply in Porto North Region 2.20
31 Spain E WS Water supply of Madrid 2.15
32 Portugal T RD A3 Motorway sections 1.80
33 Portugal T RW Modernisation of the line Beira Alta 1.80
34 Italy T RD A3 Naples‐Salerno motorway 1.70
35 Spain T RW Modernisation of the conventional railway network 1.45
Legend: T: Transport – RD: Road; RL: Railway; PT: Port. E: Environment – WS: Water supply; WWT: Waste water treatment; SWT: Solid waste treatment.

184
By applying the additional qualitative criteria, ten out of those first fourteen are selected for case studies. As a matter of simplification, for example, the project N.4 “Athens Ring Road” was dropped since one Greek transport project is already included in those with a higher ranking and was therefore the transport project selected for Greece.
Table II.3 PROJECTS FOR CASE STUDIES N. COUNTRY FUND SECTOR SUB‐SECTOR PROJECT
1 Ireland CF E WWT Dublin Waste Water Treatment
2 Italy ERDF E WS Water supply in Palermo
3 Spain CF E WWT Waste water treatment in Ría de Vigo
4 Spain CF E SWT Solid waste treatment in Galicia
5 Portugal CF E SWT Urban solid waste treatment in Lisbon
1 Greece CF/ERDF T RD Egnatia Motorway
6 Ireland CF T RD M1 Motorway
2 Italy ERDF T PT Port of Gioia Tauro
7 Spain CF T RL Mediterranean Corridor
4 Spain CF T RL Madrid metro line 8

185

186
ANNEX III. CALCULATION OF CBA PARAMETERS
SOCIAL DISCOUNT RATES The social discount rate should reflect the social view on how future benefits and costs are to be valued against the present ones (EC guide 2008). In practical terms, it is the rate that in ex‐ante Cost‐Benefit Analysis is used to discount the economic flows; for this evaluation study, where projects to be analysed started in the period 1994‐99 and the CBA is undertaken from today’s point of view, a rate is needed to capitalise the past flows (in this case it is a backward social discount rate), and a proper discount rate is needed to discount the future (forward social discount rate).
The most used formula201 to compute the discount rate is the following one:
r = eg+p
where the real social discount rate of public funds (r) is defined as the product of the growth rate of public expenditure (g) and the elasticity of marginal social welfare with respect to public expenditure (e), added to the rate of time preference (p). The formula can be expressed also in terms of consumption, where g is the growth rate of consumption, e is the elasticity of marginal utility with respect to consumption and, and p reflects the consumer’s impatience, i.e. the present value attributed to a future marginal utility. While e measures the percentage rate at which the marginal utility falls for every percentage increase in consumption, p measures the pure time preference, which is independent from the level of consumption.
Hence, the choice of the rate strictly derives from the economic trend and the consumption growth path, but also by individual and social preferences about how consumption should be transferred across people in different times. In fact, the social discount rate can be also defined as the opportunity cost of differing consumption for the whole society. As Pearce and Ulph (1999) state, using a high rate today is implicitly to take the view that people do not want to invest a lot of capital which may improve the conditions of future generations: so what particular inter temporal efficiency path is chosen to pursue depends fundamentally on the value judgment about inter‐temporal equity.
Since the rate depends upon variables which change to a certain extent over time, the rate will also change over time. This consideration is important especially for projects of long duration, while for short‐term projects the rate can be assumed constant (Pearce and Ulph, 1999).
201 This is the general accepted formula used for applied CBA in the European Union (Spackman, 2004), but not the only one that can be possibly used. In the USA the social discount rate is more commonly interpreted as the social opportunity cost of capital. The rationale behind this approach is that public investments crowd out private investments, so that the social discount rate is defined as the real rate of return earned on a marginal project in the private sector.

187
Despite the neoclassical theory of project evaluation (Arrow and Kurz, 1970) considering agents’ preferences to be time invariant and claims for a constant exponential rate for future discounting, there is strong evidence (Ainslie, 1992; Cropper et al. 1994; Dybvig et al. 1996; Weitzman 1998) that individual preferences are time inconsistent and the social discount rate is a hyperbolic function: people are sensitive to a time delay if it occurs in the near rather than in the distant future. Today an agent would use a low discount rate between two distant periods, d and d+1, but for a more immediate period t he would apply a higher rate to discount economic flows of period t+1 (Cropper and Laibson, 1998). The Green Book for Appraisal and Evaluation in Central Government of the Treasury of the United Kingdom expressly suggests considering a declining, rather than constant, schedule of discount rates for projects with very long‐term impacts. While for projects with a life cycle below 30 years the social discount rate to be used is 3,5%, the Treasury recommends reducing the rate by 0,5% for a period of years between 31 and 75 and to further reduce it for very long‐term projects.
Decreasing marginal utility of consumption is related to a wealth effect, and uncertainty about income growth drives present investments, while external shocks affect GDP growth. Uncertainty increases as the time horizon under scrutiny widens: hence, under the assumption of risk aversion, the social discount rate should be a decreasing function of the project duration. Gollier (2000) proves that the effect of uncertainty in the discount rate may vary from 2% to 8% and he suggests using a discount rate not larger than 5% for projects lasting between 50 and 100 years.
The main approaches used to calculate the social discount rate, summarised, for example, by Pearce and Ulph (1999), are given below. For each term of the social discount rate formula, estimates are produced for the five countries under analysis and for the two sub‐periods: the years, before 2010, and the future.
Time preference rate
The rate of time preferences (p) can be decomposed into two terms: the rate at which discounting the welfare arising to people in future purely by virtue of this utility arising later, which is related to individual’s impatience and myopia, and the rate of growth of life chances, or, conversely, of death. It has also been suggested, particularly by many environmental scientists, to also include a factor accounting for catastrophic risk that may affect the returns on public expenditure, linked for example to the effects of climate change.
Some authors regard zero as the only ethically defensible value for the rate of pure time preference. Good at one time cannot be different from good at another (Broome, 1991), from a utilitarian and impartial point view. However, most welfare economics literature agrees that a modest rate of time preference is justified, because most individuals prefer consumption today to consumption tomorrow.
The literature generally estimates pure time preferences between 0.1%, if the annual probability of human race extinction is considered (Stern, 2007), to 3% per year, when utility discount rate is reflected by pure social time preference (Nordhaus, 1993). On average, an

188
approximate 1% rate of time preferences is generally accepted for European countries (Evans and Sezer, 2005), which also reflects the catastrophe risk. An easy way to proxy this factor could be to consider the crude death rate of the population (number of death over population).
Figure III.1 TREND OF THE MORTALITY RATE
Source: Eurostat
Table III.1 MORTALITY RATE COUNTRY AVERAGE
1994‐1998 AVERAGE 1999‐2003
AVERAGE 2004‐09
CHANGE 1994‐2009
Suggested value of p for the backward SDR
Suggested value of p for the forward SDR
Ireland 0.87% 0.79% 0.66% ‐0.21% 0.77% 0.66%
Italy 0.98% 0.99% 0.96% ‐0.01% 0.98% 0.96%
Spain 0.89% 0.91% 0.86% ‐0.02% 0.89% 0.86%
Greece 0.94% 0.95% 0.96% 0.02% 0.95% 0.96%
Portugal 1.04% 1.04% 0.98% ‐0.05% 1.02% 0.98%
Source: Eurostat
For the period of analysis of the present study, the mortality rate in the five countries considered is approximately constant over time and amounts to about 1%. The only exception is Ireland, where this rate is generally lower and has had a stronger decreasing trend over the past decade202 (Figure AIII.1). In the formula for the specific social discount rates for
202 Whelan (2008) shows that the long‐term trends in Irish population mortality are not in general dissimilar to trends observed in developed economies. Walsh (2008) explains the recent stronger declining trend by pointing attention to the increased spending on health care and the increased efficiency of this expenditure, which led to the fall of “winter” mortality caused by respiratory
0.50%
0.60%
0.70%
0.80%
0.90%
1.00%
1.10%
1994
1995
1996
1997
1998
1999
2000
2001
2002
2003
2004
2005
2006
2007
2008
2009
Ireland
Italy
Spain
Greece
Portugal

189
this evaluation study, the time preference rates shown in Table AIII.1 have been suggested. In the backward social discount rate formula, the average mortality rate of the whole period 1994‐2009 is considered; for the forward rate, constant mortality rate is adopted and the average value of the period 2004‐09 is selected.
Growth rate of consumption
To calculate the rate of growth of per capita consumption (g), past data are usually used. Pearce and Ulph (1999), in calculating the social discount rate for the United Kingdom, decided to take very long‐run rates of growth in real per capita consumption for two reasons: a value of g based on real per capita consumption would understate the relevant magnitude of g, given that the population may choose to substitute leisure for consumption; secondly, real consumption may fail to reflect rising social costs of consumption, thus the risk is to overestimate g. Long‐run rates of growth allow us to smooth out these effects. Also Evans and Sezer (2005) used the average annual growth of per capita real consumption over the three past decades (1970‐2001) to estimate the actual rate, which amounts approximately at 2.3% for Spain, 2.5% for Italy and Greece, 2.7% for Portugal and 3% for Ireland.
A different method to estimate g is to consider real per capita GDP growth as a proxy for consumption growth. For long periods, above 20 years, there is no reliable way of assessing the average annual economic growth for any country. As stressed by Evans, “all that can be reasonably done is to base the assessment on actual growth performance in the recent past using a sufficient amount of annual data to cover several business cycles”203. However, the economic crisis of 2008‐2009 and the acute debt problems of Greece, Ireland and Portugal have strongly increased the uncertainty of any estimate of growth for all of Europe.
For the CBA exercise of this study, and in particular for the calculation of the discount rate, the Team estimated a different g for each country and for the two periods, whose values are presented in Table III.2. For the past period, the 1994‐2007 average of real per capita GDP are considered. For Ireland, the years 2008‐2010 are also included in the average: this could help to offset some of the excessive growth caused by the “bubble economy” from 2000, thus leading to a more realistic rate for the country. For the future period, official forecasts to 2016 provided by the International Monetary Fund could guide the identification of the term g, but these forecasts have a high degree of uncertainty, given the still unstable macroeconomic situation.
For the forward social discount rate formula, it is suggested to consider the 2011‐2016 average predicted growth rates. The Team believes however that the IMF predictions for Portugal are too pessimistic, especially considering that the European Union has recently intervened to help
and cerebrovascular illnesses. Another possible reason behind the decreasing mortality rate lies in the very high population growth, due to immigration. In fact, in 2008, Ireland had the highest birth rate (18.1 per 1,000), the lowest death rate (6.5 per 1,000) and highest net‐migration rate (14.1 per 1,000) in the entire European Union (source http://www.independent.ie/national‐news/baby‐boom‐puts‐us‐on‐top‐of‐birth‐rate‐league‐1595151.html). 203 Evans’ paper is included in Florio, 2007.

190
with the rescue of its economy. Thus, instead of a predicted growth of 0.26% for the following years, it is proposed to use a real growth rate of 1%, which is still below the average growth of the other countries for the period 2011‐2016 (1.17%). In addition, given the very high inflow of foreign capital starting from 2003 (Honohan, 2009), it is recognised that the GDP is not the best indicator for the Irish economic growth and that the Gross National Income would probably give a more realistic measure of the national economic wealth. When considering the level of GNI for Ireland (data are provided by the World Development Indicators of the World Bank), it is the case that it is much lower than GDP. However, when the per capita growth rate is considered, no major differences emerge between the GNI and GDP trends. For this reason the Team decided to use the IMF GDP figures also for Ireland.
Figure III.2 REAL GROWTH RATE OF PER CAPITAL GDP
Source: IMF World Economic Outlook data
As part of the anticipated austerity measures to address the current debt crisis, Ireland will be facing a burden of higher taxes, reduced public expenditure and minimal increases in wages for the coming years, thus reducing income and consumption growth. At the same time, the focus for recovery is on exports, which is a sector largely dominated by multi‐national firms. This will tend to increase GDP, while having a much smaller effect on the national income. For these reasons, the IMF estimates of a 2.05% per capita GDP growth are perceived as too optimistic and an average rate of 1.5 is probably a more realistic value of national economic development.
‐9.00
‐7.00
‐5.00
‐3.00
‐1.00
1.00
3.00
5.00
7.00
9.00
11.00
1994
1995
1996
1997
1998
1999
2000
2001
2002
2003
2004
2005
2006
2007
2008
2009
2010
2011
2012
2013
2014
2015
2016
Ireland
Italy
Spain
Greece
Portugal

191
Table III.2 REAL GROWTH OF PER CAPITA GDP COUNTRY AVERAGE
1994‐2001 AVERAGE 2003‐2007
AVERAGE 2008‐10
AVERAGE 2011‐2016
Suggested value of g for the backward SDR
Suggested value of g for the forward SDR
Ireland 7.99 3.44 ‐5.00 2.05 3.83 1.50
Greece 2.40 4.01 ‐2.07 1.25 3.21 1.25
Spain 3.46 1.96 ‐2.12 1.38 2.71 1.38
Italy 2.05 0.59 ‐2.41 0.93 1.32 0.93
Portugal 3.23 0.57 ‐0.47 0.26 1.90 1.00
Source: IMF
Elasticity of marginal social utility of consumption
The elasticity of marginal social utility of consumption measures the percentage rate at which the marginal utility of consumption falls for every percentage increase in consumption. For estimation purposes, the elasticity term is the most troublesome component of the social discount rate formula. A number of economists regard the marginal utility of income as not measurable, but others claim that elasticity can be estimated with surveys or it can be inferred from observation on indirect individual behaviours. People’s savings, for example, can reflect their views about how much consumption they wish to transfer over time.
Another approach is to consider society's judgement about how consumption should be transferred across people at different times. In this case, the elasticity tells us how much more worthwhile it is to carry out transfer of income from a rich person to a poor one, or, in other words, it tells us the social planner’s aversion to income inequality. This value can be revealed by using two methods. The first one consists in considering national contribution of aid allocated to the developing countries. This approach leads to an elasticity value of around 1% for developed countries204. The second method, which is the most widely used, is based on the progressivity of national income tax rates. The formula for country‐specific elasticity, proposed by Stern (1977), is very simple: e=ln(1‐t’)/ln(1‐t), where t’ and t are respectively the marginal and average tax rates for an average taxpayer.
The results obtained for e are sensitive to tax coverage and to the adopted definition for the average tax rate (for example whether employees’ social contribution are included or not in the tax rates), but in general its value is above 1%. Table AIII.3 shows the mean elasticity calculated by Evans and Sezer (2005) for the five countries of our study. The elasticity to be entered in the backward and forward formulas for SDR is taken from the OECD Tax Database (Taxation of Wage Income, 2004) and refers to personal income taxation. Tax rates include central and sub‐central government taxation, plus employees’ social security contribution for a single person without dependents. Elasticity has been calculated as the average of the elasticities at different income levels. Figure AIII.3 shows how elasticity values stabilised
204 Source: OECD/DAC website

192
between 1.6% and 1.9% for all the countries, apart from Ireland, where elasticity is higher: it rises significantly between 2005 and 2007 and later stabilised at 2.2%.
Figure III.3 ELASTICITY TREND
Source: Elaboration based on OECD Tax Database
Table III.3 VALUES OF AVERAGE ELASTICITY COUNTRY Evans and Sezer,
2005 AVERAGE 2000‐09 Suggested value of
e for the backward SDR
Suggested value of e for the forward SDR
Ireland 2.3 2.29 2.19 2.25
Italy 1.7 1.56 1.43 1.58
Spain 1.9 1.68 1.68 1.79
Greece 1.8 1.77 1.62 1.76
Portugal 1.7 1.77 1.68 1.95
Note: OECD provides marginal and average tax rates only for the period 2000‐2009. Source: Evans and Sezer (2005) and elaboration based on OECD Tax Database.
Since no data are available to calculate the elasticity in the period 1994‐1999 and there are no forecasts for future tax rates, quite strong hypotheses have to be made in choosing the values of e for the social discount rate. For the backward SDR, the Core Team decided to use the average elasticity for the years 2000‐2001 and for the forward rate the average elasticity available for the latest years (2008‐2009).
Calculation of the Social Discount Rate
In the EU, The European Commission sets benchmark discount rate for Cost‐Benefit Analysis in the Member States, in order to make the national figures more uniform. To have an idea of the
1.00
1.20
1.40
1.60
1.80
2.00
2.20
2.40
2.60
2.80
2000
2001
2002
2003
2004
2005
2006
2007
2008
2009
Ireland
Italy
Spain
Greece
Portugal

193
extent of divergence across different social discount rates used in Europe, in 2002 the French rate, based on the marginal product of capital was 8%, the UK rate was 6%, based on both cost of capital and time preferences considerations, while the German one was just 3%, as it was based on value of the real long‐term government bond rate (Evans, 2006).
The European CBA Guide for the period 1994‐1999 suggested a social discount rate of 5%; this rate was later modified and it now corresponds to 5.5% for Cohesion countries and for Convergence regions with high growth, and 3.5% for the Competitiveness regions.
After having identified the values of each term of the social discount rate function, the discounting rates proposed for the five countries to be analysed and for the past and future periods are presented in Table AIII.4. The very high GDP which characterised Ireland before the economic crisis and its higher values of elasticity leads to a very high backward social discount rate. This is however in line with the 1997 CBA guidelines of the European Commission, which referred to variation of the European regional social discount rates ranging from a minimum of 3% to a maximum of 10%.
As for Greece and Spain the proposed social discount rate is higher than the value recommended by the EC Guide for the past programming periods, which was 5%, while it is lower for Italy and Portugal. For the coming years, the social discount rate is lower for all the countries, but it has not changed significantly for Italy.
Table III.4 SUGGESTED SOCIAL DISCOUNT RATES TO BE USED IN THE CBA EXERCISE COUNTRY p g e Backward
SDR p g e Forward
SDR
Ireland 0.77 3.83 2.19 9.1 0.66 1.50 2.25 4.0
Italy 0.98 1.32 1.43 2.9 0.96 0.93 1.58 2.4
Spain 0.89 2.71 1.68 5.4 0.86 1.38 1.79 3.3
Greece 0.95 3.21 1.62 6.1 0.96 1.25 1.76 3.2
Portugal 1.02 1.90 1.68 4.2 0.98 1.00 1.95 2.9
SHADOW WAGES In a perfect world the individual value of work time, as measured by monetary wage, would be equal to the social value of work. However, in reality the social value of a marginal product of labour does not correspond to the individual value of labour, because of imperfections of the capital and labour markets, including asymmetric information, regulation of minimum wages and lack of competition (such as monopsony). The shadow wage measures the social value of time spent working and it is defined as the social opportunity cost of labour for renouncing leisure time. Different shadow wage rate formulae can be considered, depending on the specific hypotheses on labour market conditions. For an overview of the theories and techniques to estimate the shadow wage we draw from Del Bo et al. (2011).
When the existence of a competitive labour market can be assumed, in which the labour is paid its marginal value and there is only frictional unemployment, the shadow wage can be

194
estimated by simply using the prevailing manufacturing average wage, divided by a nominal protection factor to account for countrywide price distortions. If unemployment is around 2‐3%, the observed wage is frequently used as a proxy for the shadow wage, under the condition that observed prices are also good proxies of their shadow counterparts.
In case of involuntary unemployment and wage rigidity in the labour market, the shadow wage is a function of the reservation wage that individuals are willing to accept to sacrifice their leisure time, and of the marginal social value of the income increase for the newly hired people (a distributive term). If the actual wage is higher than the reservation wage it means that people are willing to accept employment below the official wage rate, for example in the black labour market. In practical terms, the reservation wage can be estimated by using minimum wages, surveys or average observed net‐of‐tax wages; the distributive term can be estimated from welfare weights and labour responses.
Regions/countries can also be characterised by a dualistic labour market, with a formal labour market, where there is an excess of labour supply, which is absorbed in the informal labour market. The shadow wage is defined as the value of the marginal social product in the informal sector (i.e. labour productivity at shadow prices), minus the social value of the increase of income to the household in the informal sector. The latter term is expressed in terms of the difference between the wage rate and the marginal product of labour at market prices. A common proxy for the wage of workers in the informal market is the net‐of‐tax wage rate.
Del Bo et al. (2011) carried out a cluster analysis to classify European regions according to their labour market. Five dimensions have been considered: the average income levels, the regional unemployment rate, the share of workers employed in the rural sector and the migration flows. The data used was for the years from 2001 to 2007. Cluster 1 includes regions characterised by relatively high income level, a low indicator for rurality, positive migration inflows and relatively low unemployment. These characteristics indicate the existence of a fairly efficient labour market and they are common in many EU‐15 regions including capital cities (Paris, London, Amsterdam, Stockholm, South of Germany, North of Italy, Austria, south‐east England, etc.). Regions in cluster 2 have high levels of income, low long‐term unemployment but high short‐term unemployment, few workers in agriculture and very high immigration, probably entering an informal urban sector. Many regions in Spain, Portugal, France, central Italy and Ireland, to mention a few, are included in this cluster. Southern Spain and southern Italy, northern Greece and other regions also in the new Member States are characterised by high unemployment, low per capita GDP, quite a high agricultural employment share and a certain degree of emigration (cluster 3). Finally, regions in cluster 4 are very poor and rural, with high unemployment and large outflows migration rates: this cluster includes regions mostly in Eastern Europe and Greece.

195
Figure III.4 FOUR LABOUR MARKETS CLUSTERS IN THE EU NUTS2 REGIONS
Source: Del Bo et al., 2011
The best way to estimate the shadow wages, to be used in the CBA exercise of the present evaluation study, would be to consider the specific characteristics of the regional labour market and to apply the most correct formula, as shown in the Table III.5.
Table III.5 REGION‐SPECIFIC SHADOW WAGE FORMULAE COUNTRY LABOUR MARKET SHADOW WAGE FORMULA DEFINITIONS
Ireland (south)
Fairly social efficient market
SWR = wM/NPC wM = market wage rate in the manufacturing sector
NPC = nominal protection factor to account for country‐wide price distortions
Italy (south), Spain (south), Greece (north)
Quasi Keynesian unemployment
SWR = βrw+[(1‐β) wM /NPC] β = regional welfare weights
wM = market wage rates in the manufacturing sector
rw =reservation wage
NPC = nominal protection factor to account for country‐wide price distortions
Ireland (north)
Portugal,
Greece (south),
Spain (north‐east)
Markets with informal activities
SWR = β [wA(1‐t) / NPCA ] +[(1‐β) *wM /NPC]
β = regional welfare weights
wA and wM = market wage rates in the agricultural sector and manufacturing sector
(1‐t) = benefit/tax wedge on wages
NPC = nominal protection factor to account for country‐wide price distortions (NPCA in the agricultural sector)
Source: Del Bo et al., 2011

196
Del Bo and colleagues calculated the regional shadow wage and the respective conversion factors for all the European NUTS 2 regions, using mainly Eurostat data referring to year 2007. These figures, reported in the following table, illustrate well the differences existing both within and across countries.
Country experts, in charge of implementing the Cost‐Benefit Analysis of the projects, have decided on a case‐by‐case basis:
• whether to use them or to refer to other sources that are considered more appropriate;
• whether to refer to the regional or national conversion factor; this decision has to be taken and justified mainly on the basis of the specificities of the projects.
• whether to calculate and apply different shadow wages and conversion factors for the backward period and for the forward one. Only if no changes in the labour market occurred in the past (between 1994 and 2006) and if it is reasonable to assume than no changes are expected in the future (after 2007), the same conversion factors can be used for the two periods.
Table III.6 REGION‐SPECIFIC ANNUAL SHADOW WAGES AND CONVERSION FACTORS (2007) COUNTRY NUTS 2 REGION SHADOW
WAGE (EUR) CONVERSION FACTOS
Spain ES11 Galicia 21,277.14 0.85
ES12 Principado de Asturias 27,621.01 0.87
ES13 Cantabria 25,694.77 0.88
ES21 Pais Vasco 32,591.78 1
ES22 Comunidad Foral de Navarra 30,974.69 1
ES23 La Rioja 24,307.10 0.89
ES24 Aragsn 25,642.16 0.89
ES30 Comunidad de Madrid 30,001.80 0.92
ES41 Castilla y Lesn 24,764.43 0.87
ES42 Castilla‐la Mancha 19,647.43 0.82
ES43 Extremadura 13,371.87 0.64
ES51 Cataluqa 27,433.86 0.91
ES52 Comunidad Valenciana 22,829.64 0.87
ES53 Illes Balears 20,935.21 0.9
ES61 Andalucia 16,926.11 0.67
ES62 Regisn de Murcia 20,205.47 0.84
ES63 Ceuta 22,903.13 0.73
ES64 Melilla 17,865.70 0.74
ES70 Canarias (ES) 20,651.70 0.86
Spain ES NATIONAL AVERAGE 23,455.00 0.85
Greece GR11 Anatoliki Makedonia, Thraki 10,901.25 0.53

197
GR12 Kentriki Makedonia 12,212.45 0.69
GR13 Dytiki Makedonia 21,250.21 0.68
GR14 Thessalia 11,406.11 0.6
GR21 Ipeiros 11,945.89 0.65
GR22 Ionia Nisia 20,349.91 0.86
GR23 Dytiki Ellada 9,601.57 0.51
GR24 Sterea Ellada 14,846.92 0.75
GR25 Peloponnisos 13,928.63 0.67
GR30 Attiki 18,331.43 0.95
GR41 Voreio Aigaio 13,301.86 0.62
GR42 Notio Aigaio 23,683.57 0.91
GR43 Kriti 16,073.61 0.88
Greece GR NATIONAL AVERAGE 15,217.95 0.72
Ireland IE01 Border, Midlands and Western 29,068.82 0.95
IE02 Southern and Eastern 40,637.93 1
Ireland IE NATIONAL AVERAGE 34,853.37 0.98
Italy ITC1 Piemonte 27,240.70 0.88
ITC2 Valle d'Aosta/Vallie d'Aoste 30,114.08 1
ITC3 Liguria 25,378.67 0.86
ITC4 Lombardia 33,054.99 1
ITD1 Provincia Autonoma Bolzano‐Bozen 30,204.70 0.99
ITD2 Provincia Autonoma Trento 29,970.91 1
ITD3 Veneto 28,858.99 1
ITD4 Friuli‐Venezia Giulia 29,952.12 1
ITD5 Emilia‐Romagna 30,327.86 1
ITE1 Toscana 22,586.65 0.87
ITE2 Umbria 22,574.98 0.84
ITE3 Marche 20,807.46 0.86
ITE4 Lazio 27,591.13 0.89
ITF1 Abruzzo 21,497.02 0.8
ITF2 Molise 18,612.81 0.77
ITF3 Campania 7,572.28 0.34
ITF4 Puglia 8,013.40 0.35
ITF5 Basilicata 10,700.68 0.46
ITF6 Calabria 6,604.17 0.34
ITG1 Sicilia 7,055.07 0.34
ITG2 Sardegna 12,460.43 0.5
Italy IT NATIONAL AVERAGE 21,484.72 0.77
Portugal PT11 Norte 10,696.76 0.9
PT15 Algarve 14,010.63 0.93
PT16 Centro (PT) 13,342.46 0.91
PT17 Lisboa 21,373.73 0.97
PT18 Alentejo 15,534.05 0.91
PT20 Regico Autsnoma dos Agores (PT) 13,253.89 0.92

198
PT30 Regico Autsnoma da Madeira (PT) 13,781.78 0.96
Portugal PT NATIONAL AVERAGE 14,570.47 0.93
Source: Del Bo et al., 2011

199

200
ANNEX IV. REFERENCES Ainslie G.W., 1992, Picoeconomics, Cambridge: Cambridge University Press.
Arrow K.J. and Kurz M., 1970, Public Investment, The Rate of Return and Optimal Fiscal Policy, Baltimore: John Hopkins University Press.
Aschauer D.A., 1989, Does public capital crowd out private capital?, Journal of Monetary Economics, Vol. 24(2), pp. 171‐188.
Barro R., 1990, Government Spending in a Sample Model of Endogenous Growth, Journal of Political Economy, Vol. 98 (5), pp. S103‐26.
Bernier L. and Hafsi T., 2007 "The Changing Nature of Public Entrepreneurship", Public Administration Review, 67, p. 488‐503.
Broome J., 1991, Weighing goods: Equality, uncertainty, and time, Basil Blackwell (eds.), Cambridge.
Cropper M. and Laibson D., 1998, The Implications of Hyperbolic Discounting for Project Evaluation, The World Bank Development Research Group ‐ Environment and Infrastructure, Policy Research Working Paper No. 1943, The World Bank: Washington D.C.
Cropper M.L., Aydede S.K. and Portney P.R., 1994, Preferences for Life Savings Programs: How the Public Discounts Time and Age, Journal of Risk and Uncertainty, No. 8, pp. 243‐265.
Del Bo C., Fiorio C. and Florio M., 2011, Shadow Wages for the EU Regions, Fiscal Studies, Vol. 32, No 1, pp. 109‐143.
Dybvig P. H., Jr. I. Jonathan E. and Ross S. A., 1996, Long Forward and Zero‐Coupon Rates Can Never Fall, The Journal of Business, January 1996, 69 (1), pp. 1–25.
EIB, 1994, First Reaction. Corridor Méditerranéen (200/220 km/h Tr. Valence‐ Sant Vicenç de Calders Phase 1), Cohesion Fund Project No. 94.11.65.007, Turró, M. and Senior, J., Luxembourg, 13th October 1994.
EIM, 2008, Conceptualizing entrepreneurial employee behavior, available at: http://www.entrepreneurship‐sme.eu/pdf‐ez/H200802.pdf.
European Commission, 2008a, Guide to Cost Benefit Analysis of Investment Projects, prepared by the consortium including TRT Trasporti e Territorio and CSIL Centre for Industrial Studies. http://ec.europa.eu/regional_policy/sources/docgener/guides/cost/guide2008_en.pdf.
European Commission, 2008b, Green Paper on Territorial Cohesion – Turning territorial diversity into strength, Communication from the Commission to the Council, the European parliament, the Committee of the Regions and the European Economic and Social Committee, COM(2008) 616, Brussels 6/10/2008.

201
European Commission, 2011a, Ex‐post evaluation of cohesion policy interventions 2000‐2006 financed by the Cohesion Fund (including former ISPA) – Work Package B – Cost benefit analysis of selected transport projects, DG Regional Policy.
European Commission, 2011b, Ex‐post evaluation of cohesion policy interventions 2000‐2006 financed by the Cohesion Fund (including former ISPA) – Work Package C – Cost benefit analysis of environmental projects, DG Regional Policy.
Evans D.J. and Sezer H., 2005, Social Discount rates for Member Countries of the European Union, Journal of Economic Studies, vol. 32 (1).
EVA‐TREN, 2007, Improved Decision‐Aid Methods and Tools to Support Evaluation of Investment for Transport and Energy networks in Europe. Deliverable 1: Evaluating the State‐of‐the‐Art in Investment for Transport and Energy Networks, Policy‐oriented research in the framework of the Sixth Framework Programme 2002‐06. Project duration May 2006‐October 2008. www.eva‐tren.eu.
Florio M. and Sartori V., 2010, Getting Incentives Right: do we need ex post CBA?, Working Papers 201001, Centre for Industrial Studies (CSIL).
Florio M. and Vignetti S., 2011, Intellectual bridges across project evaluation traditions: the contribution of EU Regional Policy, Cuadernos Economicos de ICE, forthcoming.
Florio, 2007, Cost‐Benefit Analysis and Incentives in Evaluation. The Structural Funds of the European Union, Edward Elgar (Ed.).
Gollier C., 2000, Discounting an uncertain future, Journal of Public Economics 85 (2002), pp. 149‐166.
Gramlich E., 1994, Infrastructure Investment: a Review Essay, Journal of Economic Literature, Vol. 32 (3), pp. 1176‐96.
Greenwald B. and Stiglitz J.E., 1986, Externalities in economies with imperfect information and incomplete markets, Quarterly Journal of Economics, 101(2), pp. 229‐264.
Hirschman A.O., 1967, Development Projects Observed, The Brookings Institution, Washington, D.C.
Honohan P., 2009, What went wrong in Ireland?, Trinity College Dublin, paper prepared for the World Bank. http://www.tcd.ie/Economics/staff/phonohan/What%20went%20wrong.pdf.
Jenkins G.P., 1997, Project Analysis and the World Bank, The American Economic Review, Vol. 87, issue 2, Paper and Proceedings of the Hundred and Fourth Annual Meeting of the American Economic Association (May, 1997), pp. 38‐42.
Kahneman D. and Tversky A., 1979, Prospect Theory: An Analysis of Decision Under Risk, Econometrica, Vol. 47 (2), pp. 263‐292.

202
Keynes J.M., 1936, The General Theory of Employment, Interest and Money, “Chapter 12. The State of Long‐Term Expectations”.
Melis Maynar, M.J., 2001, Ampliación de la red de metro de Madrid, Revista de Obras Públicas, N.3410, pp.19‐49, May 2001No 95‐01, University of East Anglia, School of environmental studies, CSERGE.
Metro de Madrid, 2012, Las tienes que conocer: Nuevos Ministerios. Galería de imágenes, available at: www.metromadrid.es/es/viaja_en_metro/Las_tienes_que_conocer/Nuevos MinisteriosEmblematica.
Ministerio de Fomento, 2011, Corredor Ferroviario Mediterráneo. Mapas Redes Transeuropeas de Transporte, Valencia.
Ministry of Economy and Finance, 1998, Requests of modification of the financial decision about the Cohesion Fund project 95/11/65/005: Mediterranean Corridor. Upgrading to 200/220 km/h in Spain.
Nordhaus W.D., 1993, Rolling the 'DICE': an optimal transition path for controlling greenhouse gases, Resource and Energy Economics, Elsevier, vol. 15(1), pp. 27‐50.
Pearce D. and Ulph D., 1999, A social discount rate for the UK, in Pearce, D.W. (Ed), Economics and the Environment: Essays on Ecological Economics and Sustainable Development, 268‐285, Edward Elgar, Cheltenham.
Sen A., 1970, Collective Choice and Social Welfare, Holden‐Day publishing.
Spackman M., 2004, Time discounting and of the cost of capital in government, Fiscal Studies, 25, pp. 467‐518.
Stern N., 1977, “Welfare weights and the elasticity of marginal utility of income”, in Proceedings of the Annual Conference of the Association of University Teachers of Economics, Artis M. and Nobay R. eds., Oxford: Blackwell.
Stern N., 2007, The economics of climate change: Stern review on the economics of climate change, Cambridge: Cambridge University Press.
Straub S., 2008, Infrastructure and growth in developing countries: recent advances and research challenges, The World Bank Policy Research Working paper 4460, Washington, DC.
Suddaby R., Lawrence T.B. and Leca B., 2009, Institutional work: actors and agency in institutional studies of organization New York: Cambridge University Press.
Walsh B.M., 2008, Wealthier and healthier: Ireland’s demographic catch‐up, Journal of the Statistical and Social Inquiry Society of Ireland, Vol. 37, pp. 95‐112.
Weitzman M.L., 1998, Why the Far‐Distant Future Should be Discounted at its Lowest Possible Rate, Journal of Environmental Economics and Management, 36 (3), pp. 201–208.

203
Whelan S., 2008, Projecting Population Mortality for Ireland, Journal of the Statistical and Social Inquiry Society of Ireland, Vol. 37, pp. 135‐163.
World Bank, 2005, Influential Evaluations: Detailed Case Studies, The World Bank Operations Evaluation Department, Washington, D.C.
World Bank, 2011, Economic Analysis for World Banks Supported Investment Operations – Input for the Revised Operational Policy, December 6, 2011.
Yew‐Kwang Ng, 1983, Rents and Pecuniary Externalities in Cost‐Benefit Analysis: Comment, The American Economic Review, Vol. 73, No. 5, pp. 1163‐1170.


