Tempur Sealy International, Inc. (TPX)
42
© 2021 Tempur Sealy International, Inc. “Our growth reflects strong industry demand, our worldwide leadership position, and the success of our omni- channel distribution strategy” Tempur Sealy International, Inc. (TPX) 1 Pictured above: Tempur-Pedic flagship store in Manhattan
Transcript of Tempur Sealy International, Inc. (TPX)
© 2021 Tempur Sealy International, Inc.
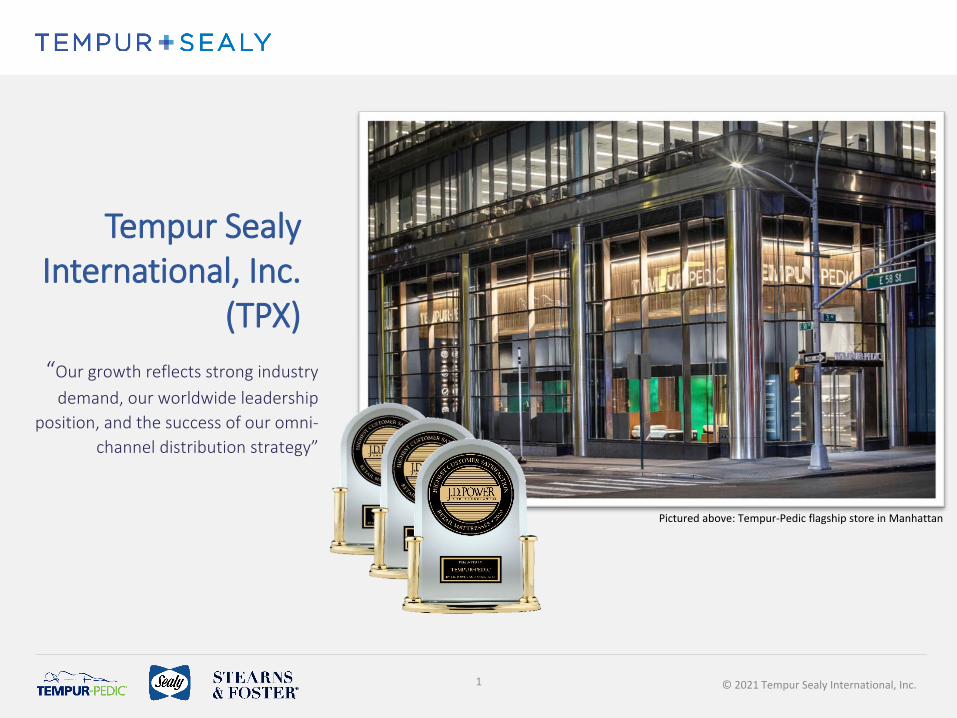
“Our growth reflects strong industry demand, our worldwide leadership
position, and the success of our omni-channel distribution strategy”
Tempur Sealy International, Inc.
(TPX)
1
Pictured above: Tempur-Pedic flagship store in Manhattan
© 2021 Tempur Sealy International, Inc.2
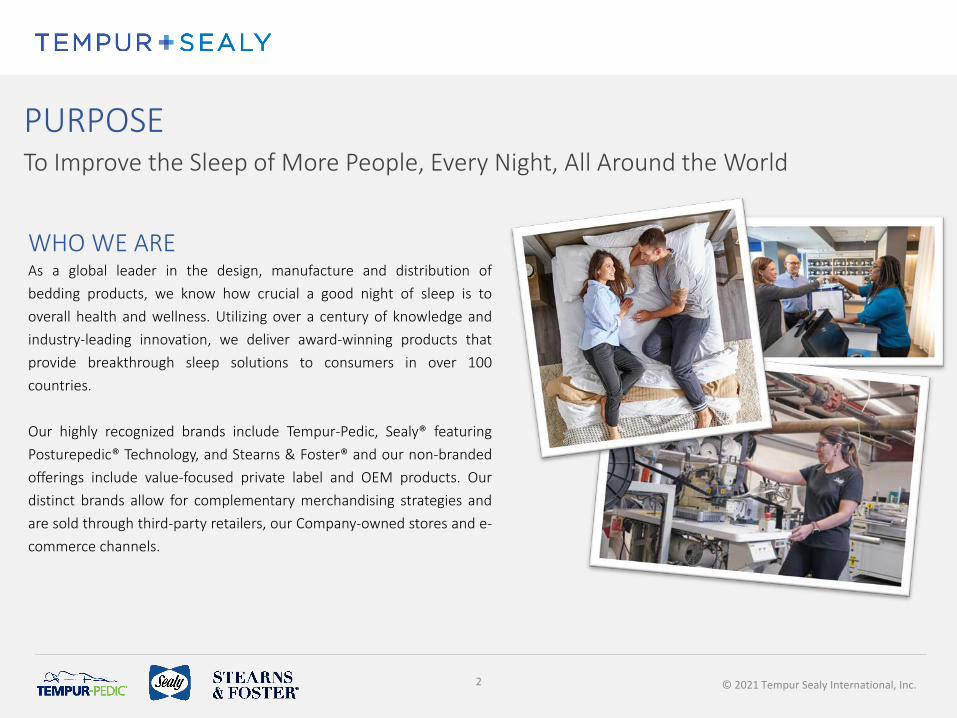
PURPOSETo Improve the Sleep of More People, Every Night, All Around the World
WHO WE AREAs a global leader in the design, manufacture and distribution ofbedding products, we know how crucial a good night of sleep is tooverall health and wellness. Utilizing over a century of knowledge andindustry-leading innovation, we deliver award-winning products thatprovide breakthrough sleep solutions to consumers in over 100countries.
Our highly recognized brands include Tempur-Pedic, Sealy® featuringPosturepedic® Technology, and Stearns & Foster® and our non-brandedofferings include value-focused private label and OEM products. Ourdistinct brands allow for complementary merchandising strategies andare sold through third-party retailers, our Company-owned stores and e-commerce channels.
© 2021 Tempur Sealy International, Inc.3
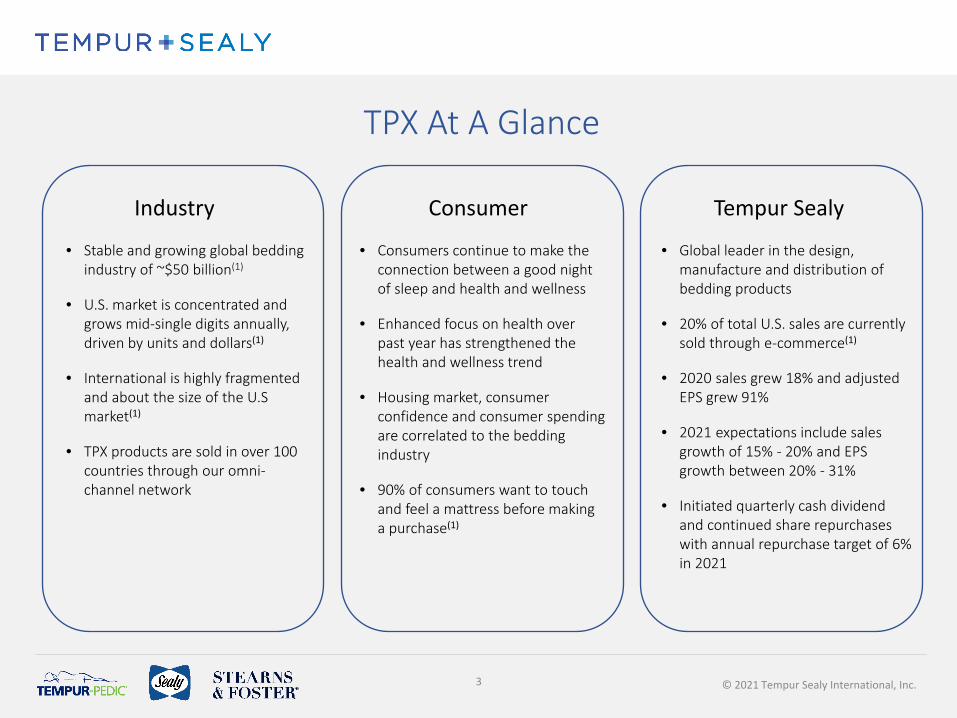
Industry
• Stable and growing global bedding industry of ~$50 billion(1)
• U.S. market is concentrated and grows mid-single digits annually, driven by units and dollars(1)
• International is highly fragmented and about the size of the U.S market(1)
• TPX products are sold in over 100 countries through our omni-channel network
Consumer Tempur Sealy
• Consumers continue to make the connection between a good night of sleep and health and wellness
• Enhanced focus on health over past year has strengthened the health and wellness trend
• Housing market, consumer confidence and consumer spending are correlated to the bedding industry
• 90% of consumers want to touch and feel a mattress before making a purchase(1)
• Global leader in the design, manufacture and distribution of bedding products
• 20% of total U.S. sales are currently sold through e-commerce(1)
• 2020 sales grew 18% and adjusted EPS grew 91%
• 2021 expectations include sales growth of 15% - 20% and EPS growth between 20% - 31%
• Initiated quarterly cash dividend and continued share repurchases with annual repurchase target of 6% in 2021
TPX At A Glance
© 2021 Tempur Sealy International, Inc.
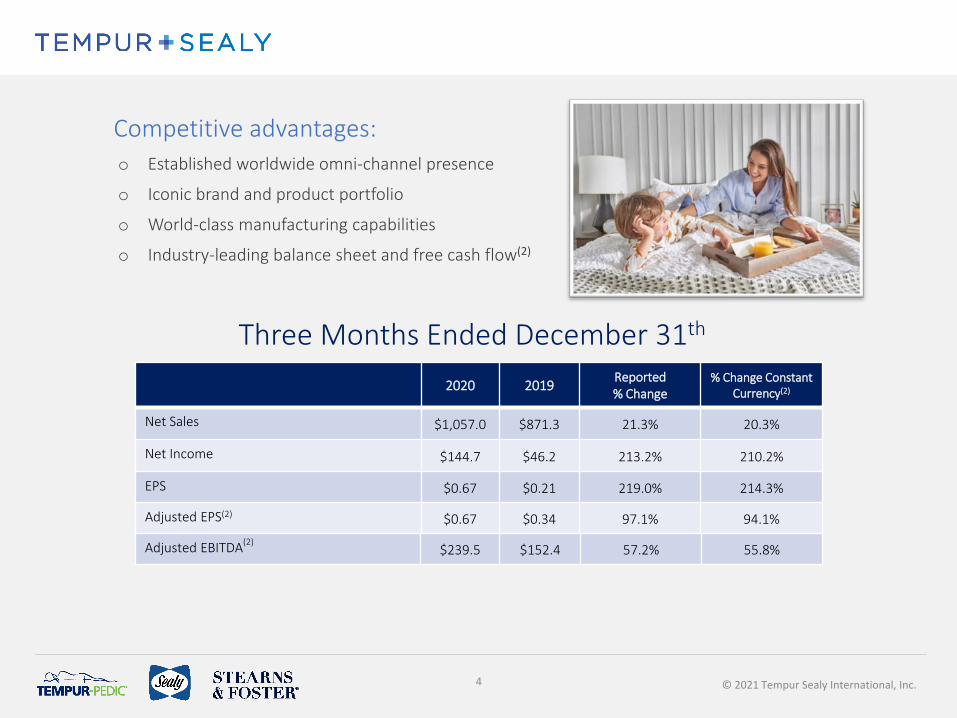
o Established worldwide omni-channel presence
o Iconic brand and product portfolio
o World-class manufacturing capabilities
o Industry-leading balance sheet and free cash flow(2)
Competitive advantages:
4
Three Months Ended December 31th
2020 2019 Reported% Change
% Change Constant Currency(2)
Net Sales $1,057.0 $871.3 21.3% 20.3%
Net Income $144.7 $46.2 213.2% 210.2%
EPS $0.67 $0.21 219.0% 214.3%
Adjusted EPS(2) $0.67 $0.34 97.1% 94.1%
Adjusted EBITDA(2)$239.5 $152.4 57.2% 55.8%
© 2021 Tempur Sealy International, Inc.
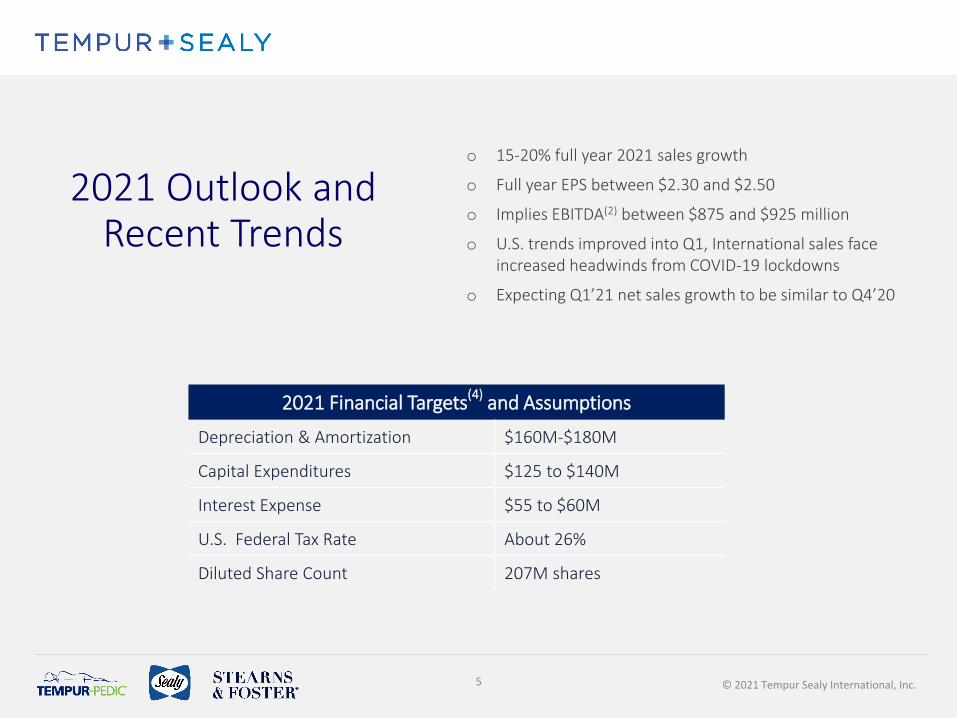
2021 Financial Targets(4) and Assumptions
Depreciation & Amortization $160M-$180M
Capital Expenditures $125 to $140M
Interest Expense $55 to $60M
U.S. Federal Tax Rate About 26%
Diluted Share Count 207M shares
o 15-20% full year 2021 sales growth
o Full year EPS between $2.30 and $2.50
o Implies EBITDA(2) between $875 and $925 million
o U.S. trends improved into Q1, International sales face increased headwinds from COVID-19 lockdowns
o Expecting Q1’21 net sales growth to be similar to Q4’20
2021 Outlook and Recent Trends
5
© 2021 Tempur Sealy International, Inc.© 2021 Tempur Sealy International, Inc.
6
WORLDWIDE OMNI-CHANNEL
© 2021 Tempur Sealy International, Inc.
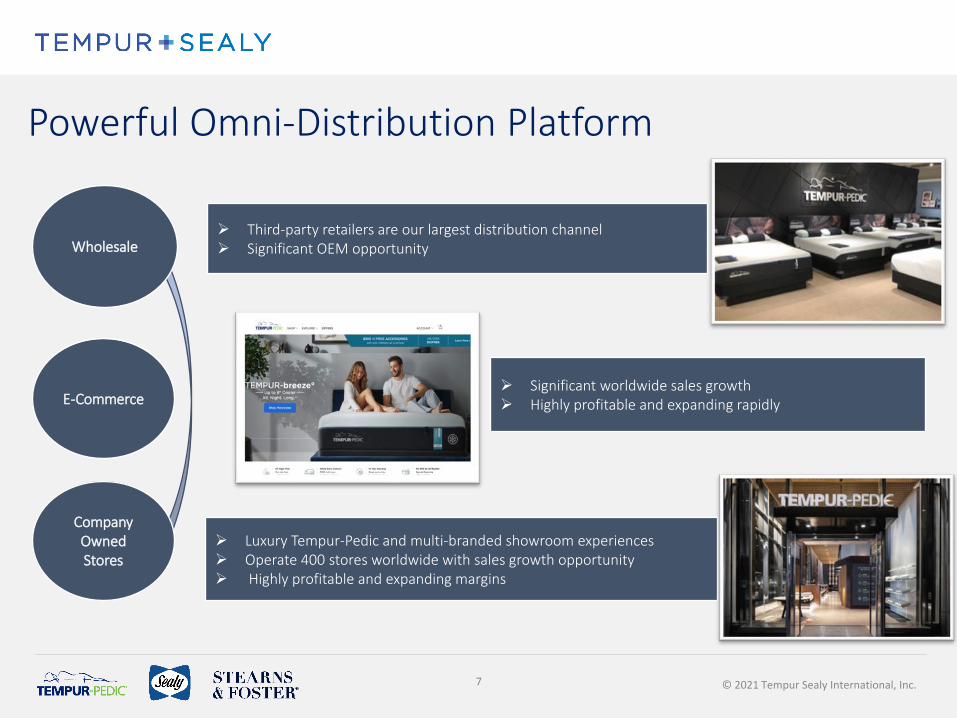
Powerful Omni-Distribution Platform
Company Owned Stores
Wholesale
E-Commerce
Third-party retailers are our largest distribution channel Significant OEM opportunity
Significant worldwide sales growth Highly profitable and expanding rapidly
Luxury Tempur-Pedic and multi-branded showroom experiences Operate 400 stores worldwide with sales growth opportunity Highly profitable and expanding margins
7
© 2021 Tempur Sealy International, Inc.8
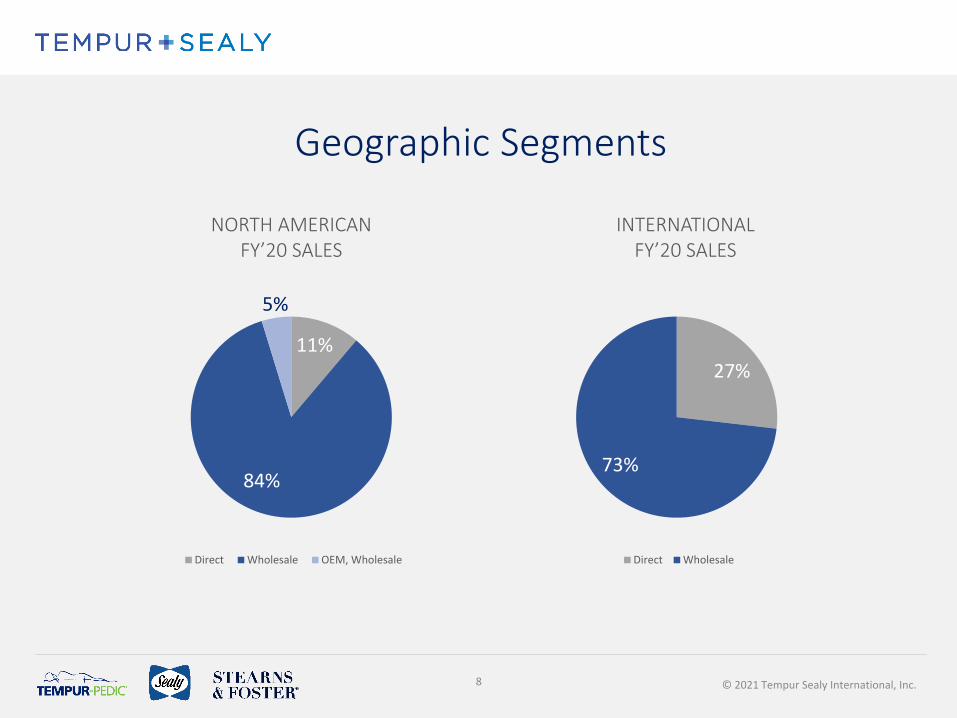
NORTH AMERICAN FY’20 SALES
INTERNATIONAL FY’20 SALES
Geographic Segments
27%
73%
Direct Wholesale
11%
84%
5%
Direct Wholesale OEM, Wholesale
© 2021 Tempur Sealy International, Inc.9
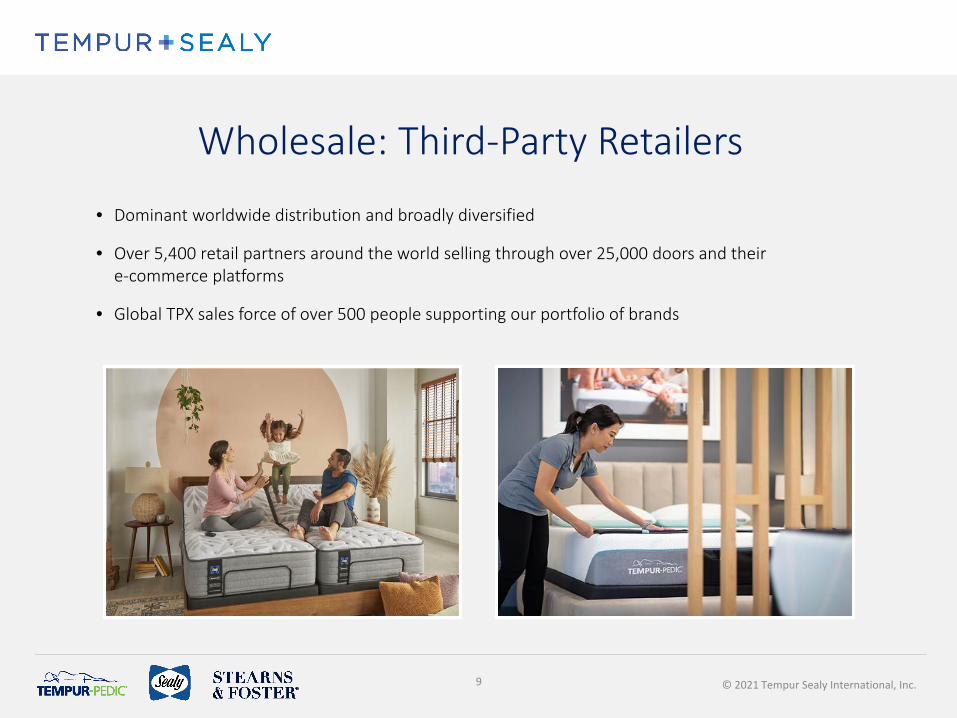
Wholesale: Third-Party Retailers
• Dominant worldwide distribution and broadly diversified
• Over 5,400 retail partners around the world selling through over 25,000 doors and their e-commerce platforms
• Global TPX sales force of over 500 people supporting our portfolio of brands
© 2021 Tempur Sealy International, Inc.10
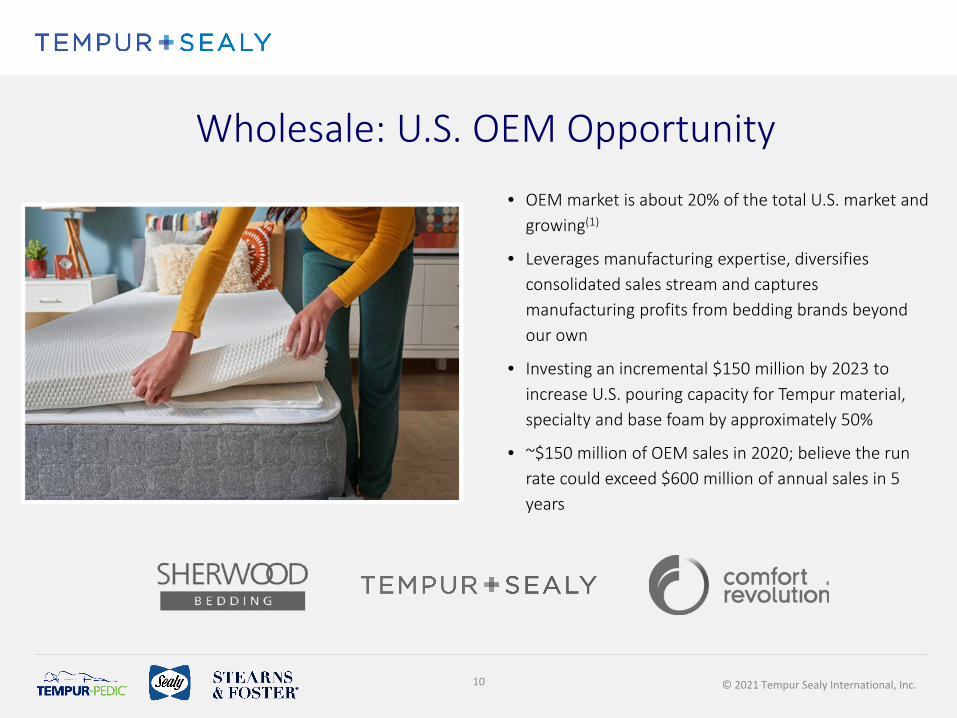
Wholesale: U.S. OEM Opportunity• OEM market is about 20% of the total U.S. market and
growing(1)
• Leverages manufacturing expertise, diversifies consolidated sales stream and captures manufacturing profits from bedding brands beyond our own
• Investing an incremental $150 million by 2023 to increase U.S. pouring capacity for Tempur material, specialty and base foam by approximately 50%
• ~$150 million of OEM sales in 2020; believe the run rate could exceed $600 million of annual sales in 5 years
© 2021 Tempur Sealy International, Inc.
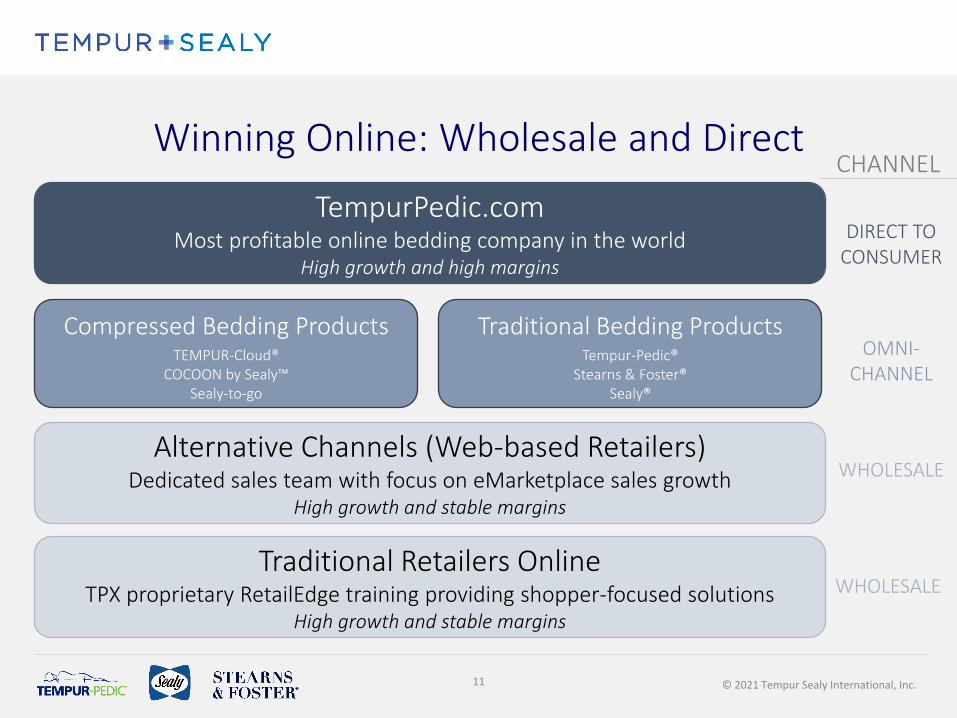
TempurPedic.comMost profitable online bedding company in the world
High growth and high margins
Alternative Channels (Web-based Retailers)Dedicated sales team with focus on eMarketplace sales growth
High growth and stable margins
Traditional Retailers OnlineTPX proprietary RetailEdge training providing shopper-focused solutions
High growth and stable margins
Compressed Bedding ProductsTEMPUR-Cloud®
COCOON by Sealy™ Sealy-to-go
DIRECT TO CONSUMER
WHOLESALE
OMNI-CHANNEL
CHANNEL
WHOLESALE
11
Traditional Bedding ProductsTempur-Pedic®
Stearns & Foster®Sealy®
Winning Online: Wholesale and Direct
© 2021 Tempur Sealy International, Inc.
$-
$20
$40
$60
$80
$100
$120
$140
$160
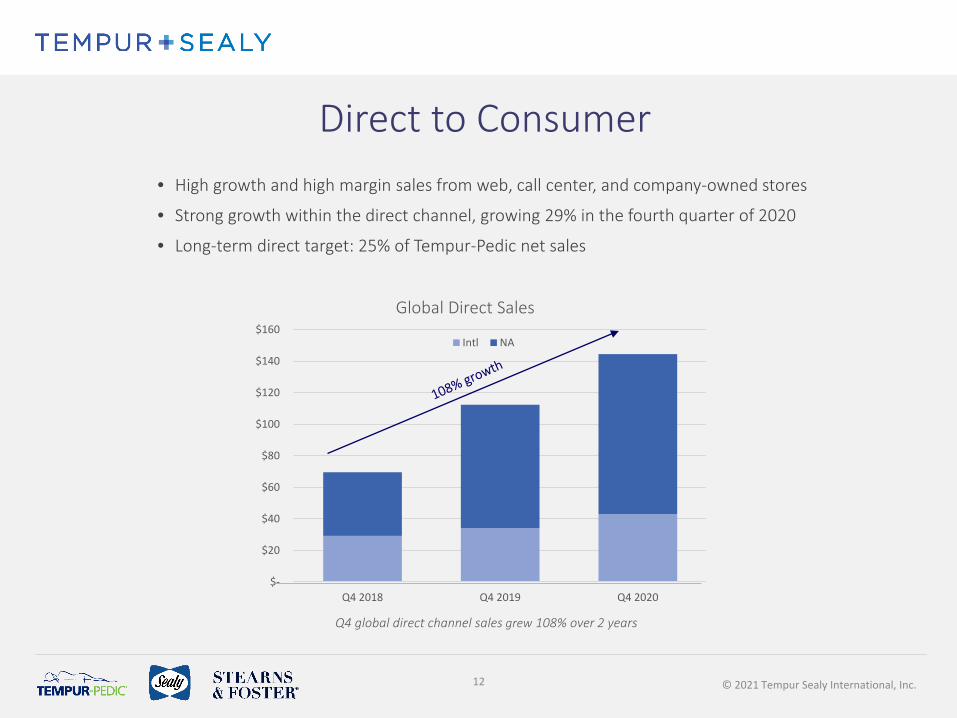
Q4 2018 Q4 2019 Q4 2020
Global Direct Sales
Intl NA
Direct to Consumer• High growth and high margin sales from web, call center, and company-owned stores
• Strong growth within the direct channel, growing 29% in the fourth quarter of 2020
• Long-term direct target: 25% of Tempur-Pedic net sales
Q4 global direct channel sales grew 108% over 2 years
12
© 2021 Tempur Sealy International, Inc.
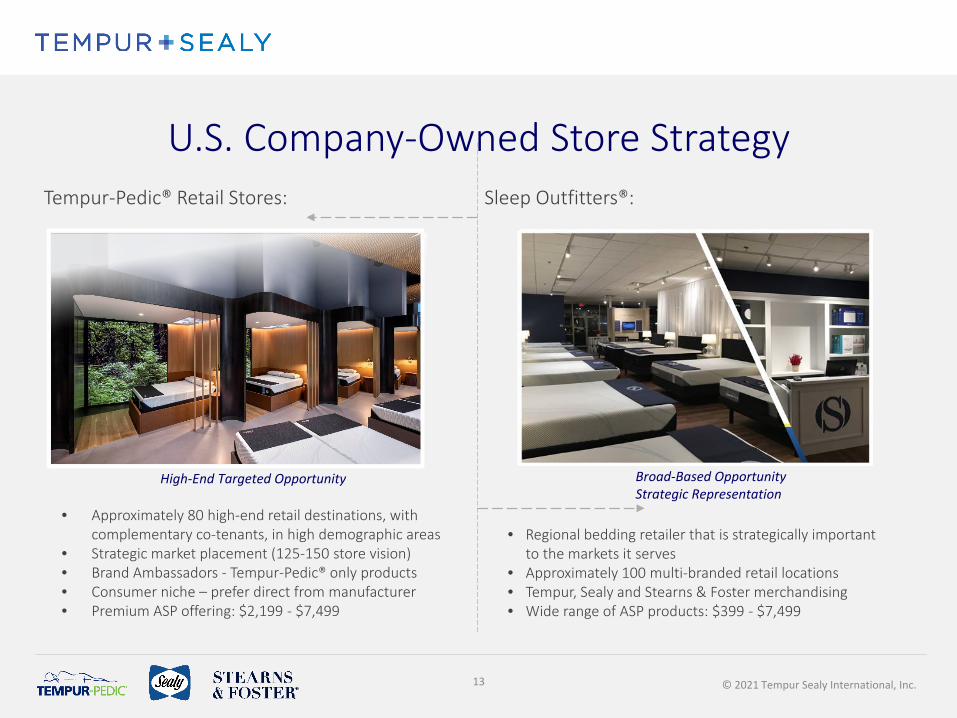
Sleep Outfitters®:Tempur-Pedic® Retail Stores:
Broad-Based Opportunity Strategic Representation
High-End Targeted Opportunity
• Approximately 80 high-end retail destinations, with complementary co-tenants, in high demographic areas
• Strategic market placement (125-150 store vision)• Brand Ambassadors - Tempur-Pedic® only products• Consumer niche – prefer direct from manufacturer• Premium ASP offering: $2,199 - $7,499
• Regional bedding retailer that is strategically important to the markets it serves
• Approximately 100 multi-branded retail locations• Tempur, Sealy and Stearns & Foster merchandising• Wide range of ASP products: $399 - $7,499
13
U.S. Company-Owned Store Strategy
© 2021 Tempur Sealy International, Inc.
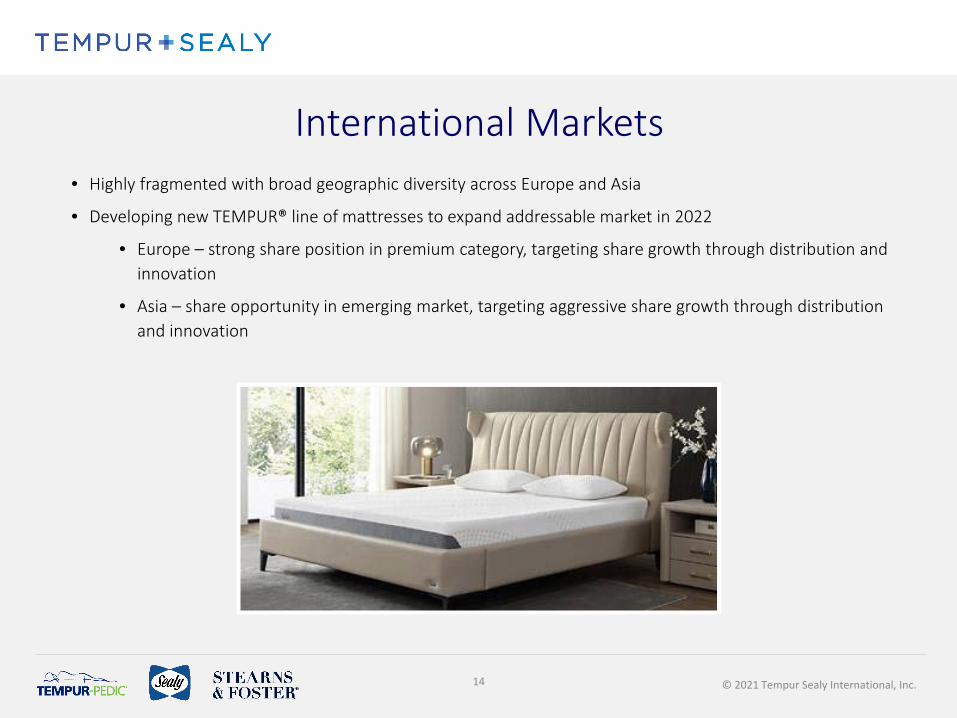
International Markets
14
• Highly fragmented with broad geographic diversity across Europe and Asia
• Developing new TEMPUR® line of mattresses to expand addressable market in 2022
• Europe – strong share position in premium category, targeting share growth through distribution andinnovation
• Asia – share opportunity in emerging market, targeting aggressive share growth through distribution and innovation
© 2021 Tempur Sealy International, Inc.15
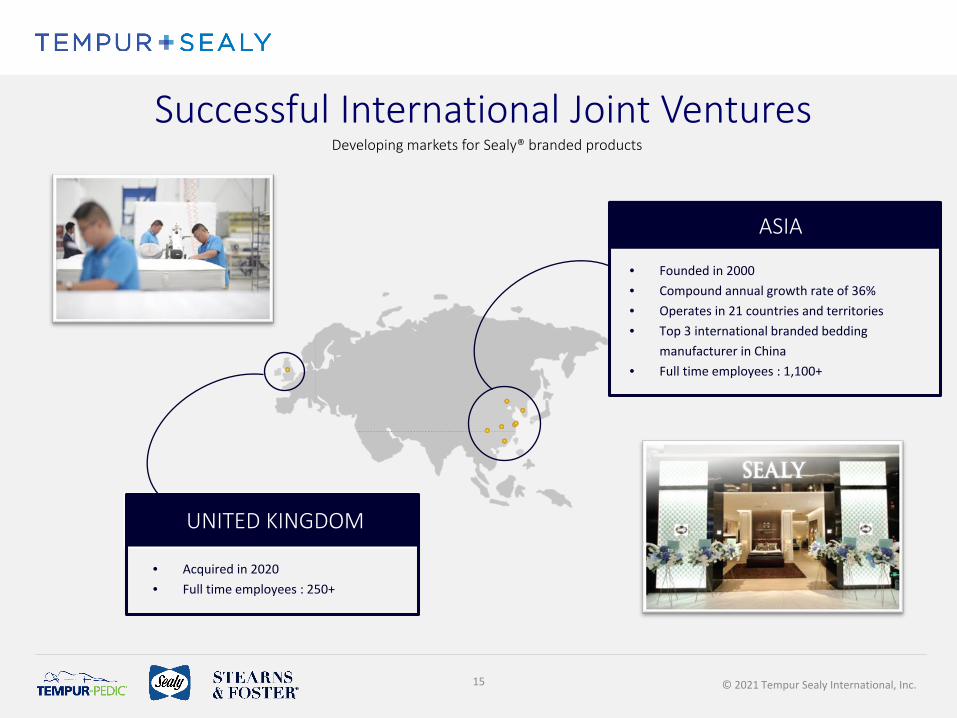
Successful International Joint Ventures
UNITED KINGDOM
• Acquired in 2020• Full time employees : 250+
Developing markets for Sealy® branded products
ASIA
• Founded in 2000• Compound annual growth rate of 36%• Operates in 21 countries and territories• Top 3 international branded bedding
manufacturer in China• Full time employees : 1,100+
© 2021 Tempur Sealy International, Inc.
BRANDS & PRODUCTS
16© 2021 Tempur Sealy International, Inc.
© 2021 Tempur Sealy International, Inc.
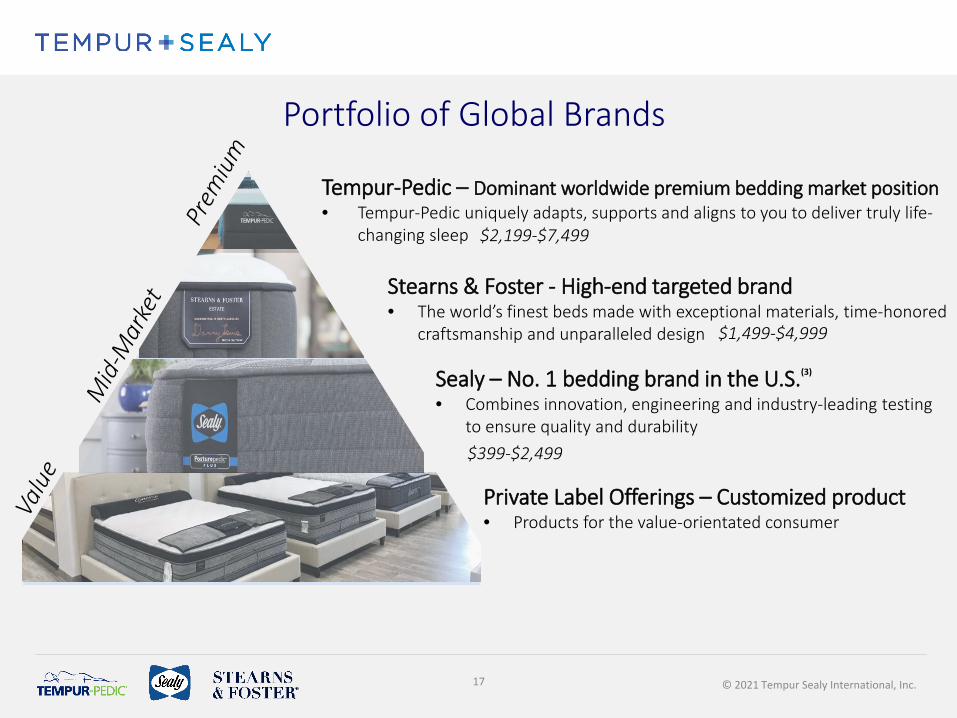
Portfolio of Global Brands
Stearns & Foster - High-end targeted brand• The world’s finest beds made with exceptional materials, time-honored
craftsmanship and unparalleled design
Sealy – No. 1 bedding brand in the U.S.(3)
• Combines innovation, engineering and industry-leading testing to ensure quality and durability
Private Label Offerings – Customized product• Products for the value-orientated consumer
$1,499-$4,999
$2,199-$7,499
$399-$2,499
17
Tempur-Pedic – Dominant worldwide premium bedding market position• Tempur-Pedic uniquely adapts, supports and aligns to you to deliver truly life-
changing sleep
© 2021 Tempur Sealy International, Inc.18
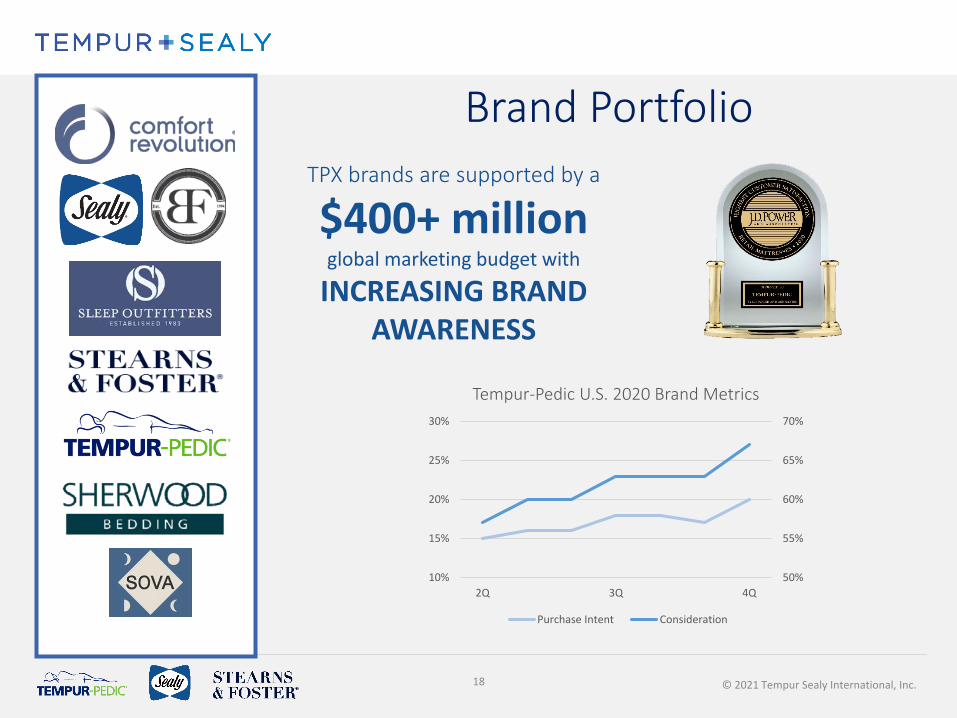
TPX brands are supported by a
$400+ million global marketing budget with
INCREASING BRAND AWARENESS
Brand Portfolio
50%
55%
60%
65%
70%
10%
15%
20%
25%
30%
2Q 3Q 4Q
Tempur-Pedic U.S. 2020 Brand Metrics
Purchase Intent Consideration
© 2021 Tempur Sealy International, Inc.
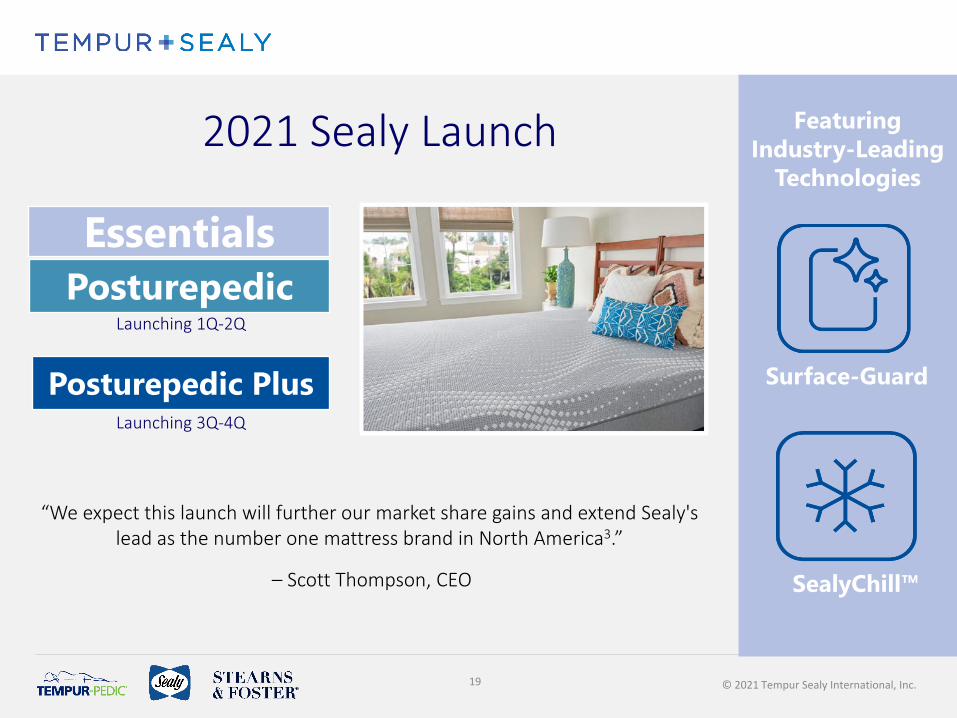
Posturepedic Plus
PosturepedicEssentials
Surface-Guard
SealyChill™
2021 Sealy Launch
“We expect this launch will further our market share gains and extend Sealy's lead as the number one mattress brand in North America3.”
– Scott Thompson, CEO
Featuring Industry-Leading
Technologies
Launching 1Q-2Q
Launching 3Q-4Q
19
© 2021 Tempur Sealy International, Inc.
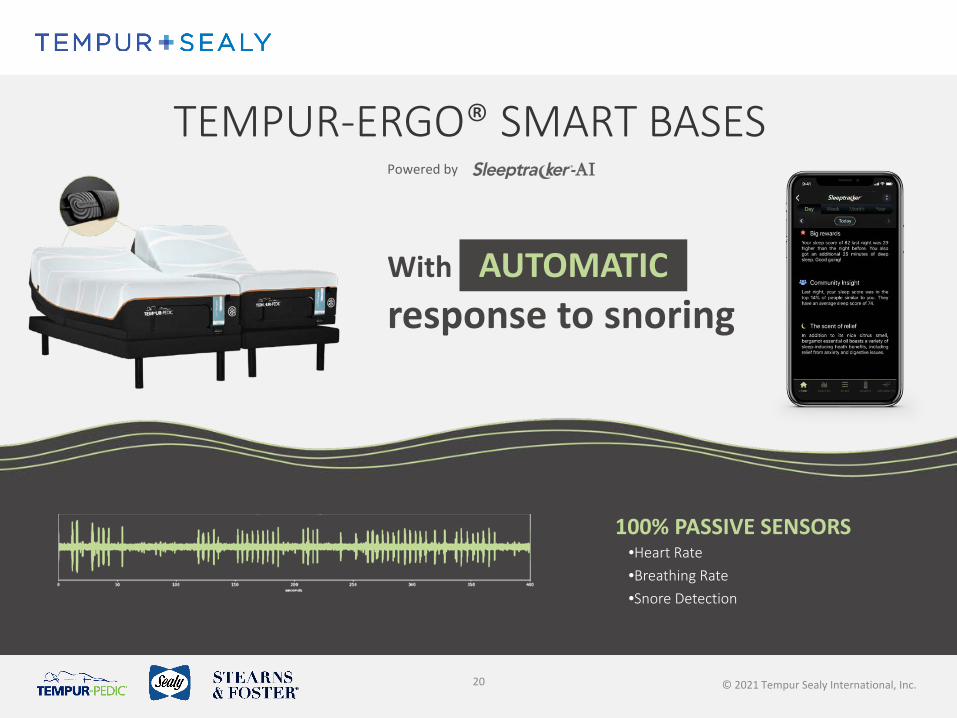
With AUTOMATICresponse to snoring
20
•Heart Rate•Breathing Rate•Snore Detection
TEMPUR-ERGO® SMART BASES
100% PASSIVE SENSORS
Powered by
© 2021 Tempur Sealy International, Inc.
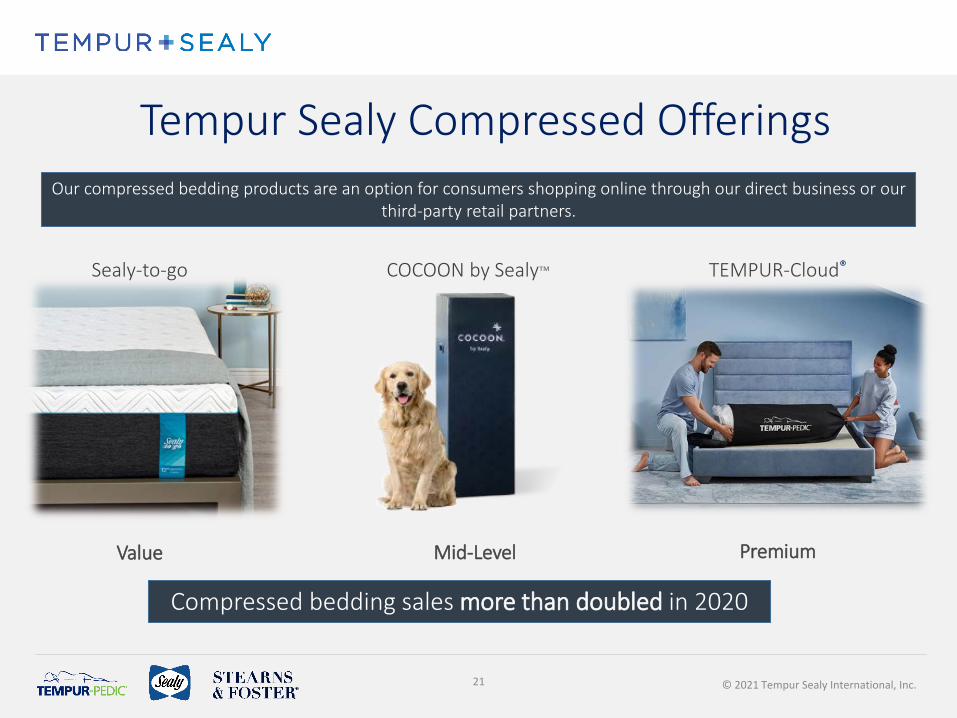
Tempur Sealy Compressed Offerings
Compressed bedding sales more than doubled in 2020
21
TEMPUR-Cloud®COCOON by Sealy™Sealy-to-go
Value Mid-Level Premium
Our compressed bedding products are an option for consumers shopping online through our direct business or our third-party retail partners.
© 2021 Tempur Sealy International, Inc.
WORLD-CLASS MANUFACTURING CAPABILITIES
22 © 2021 Tempur Sealy International, Inc.
© 2021 Tempur Sealy International, Inc.
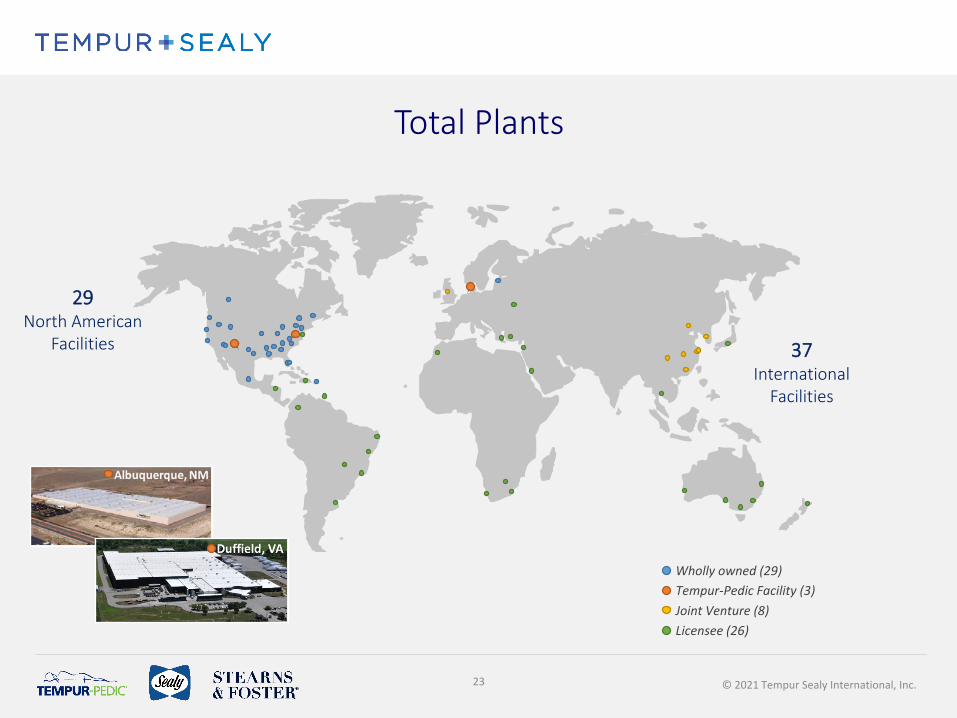
29North American
Facilities 37International
Facilities
Wholly owned (29)
Joint Venture (8)Licensee (26)
Total Plants
Tempur-Pedic Facility (3)
23
© 2021 Tempur Sealy International, Inc.24
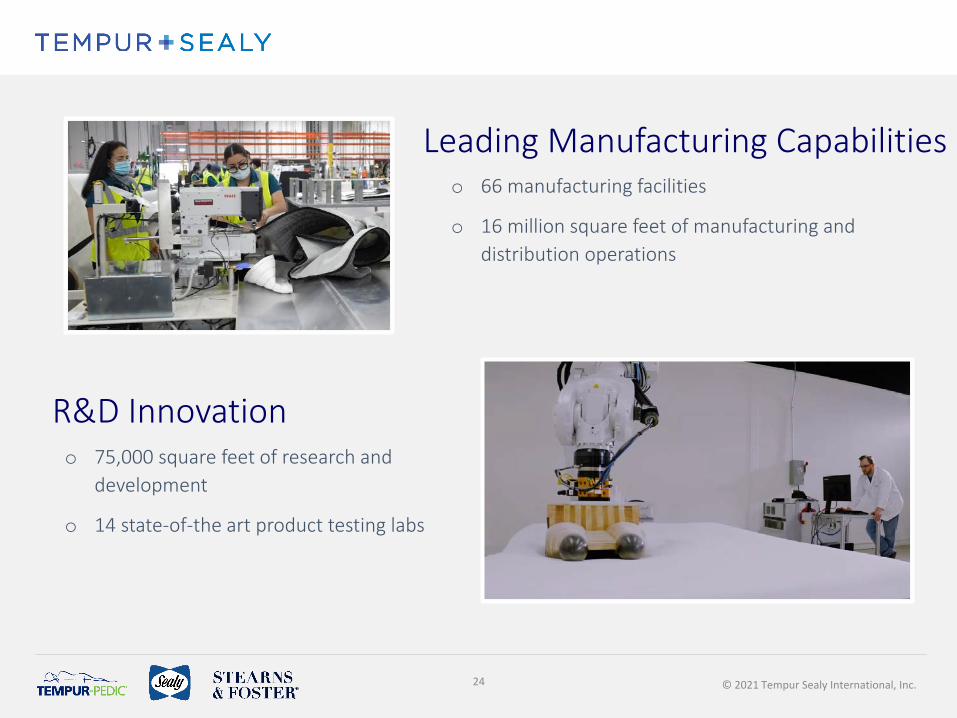
o 66 manufacturing facilities
o 16 million square feet of manufacturing and distribution operations
Leading Manufacturing Capabilities
R&D Innovationo 75,000 square feet of research and
development
o 14 state-of-the art product testing labs
© 2021 Tempur Sealy International, Inc.25
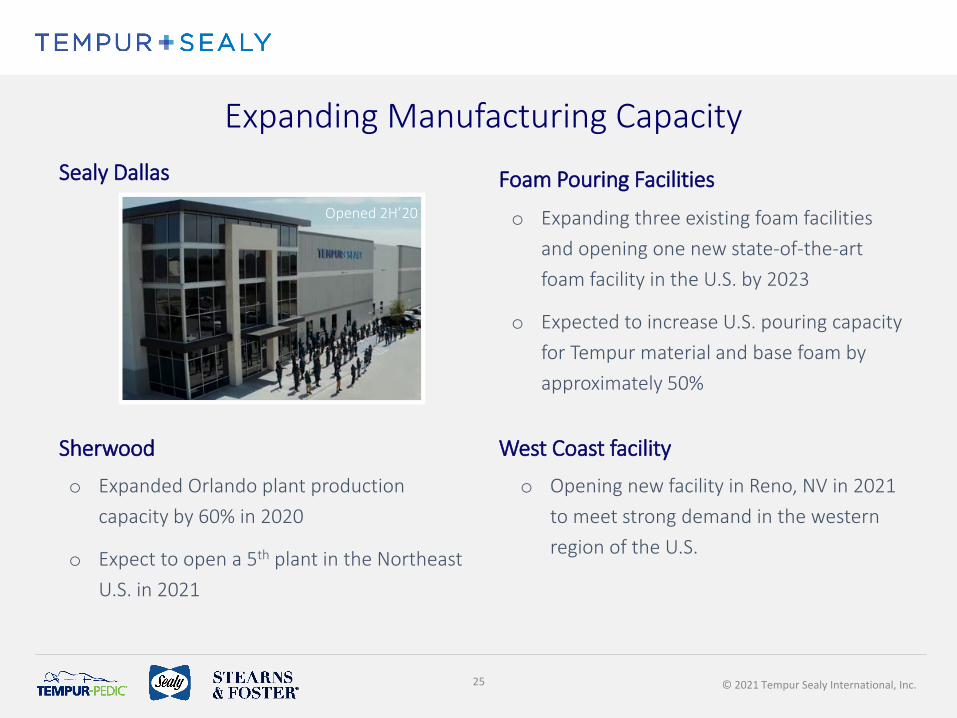
Expanding Manufacturing CapacitySealy Dallas
Sherwood West Coast facility
Foam Pouring Facilities
o Expanded Orlando plant production capacity by 60% in 2020
o Expect to open a 5th plant in the Northeast U.S. in 2021
o Expanding three existing foam facilities and opening one new state-of-the-art foam facility in the U.S. by 2023
o Expected to increase U.S. pouring capacity for Tempur material and base foam by approximately 50%
o Opening new facility in Reno, NV in 2021 to meet strong demand in the western region of the U.S.
Opened 2H’20

© 2021 Tempur Sealy International, Inc.
INDUSTRY-LEADING BALANCE SHEET & CASH FLOW
26 © 2021 Tempur Sealy International, Inc.
© 2021 Tempur Sealy International, Inc.27
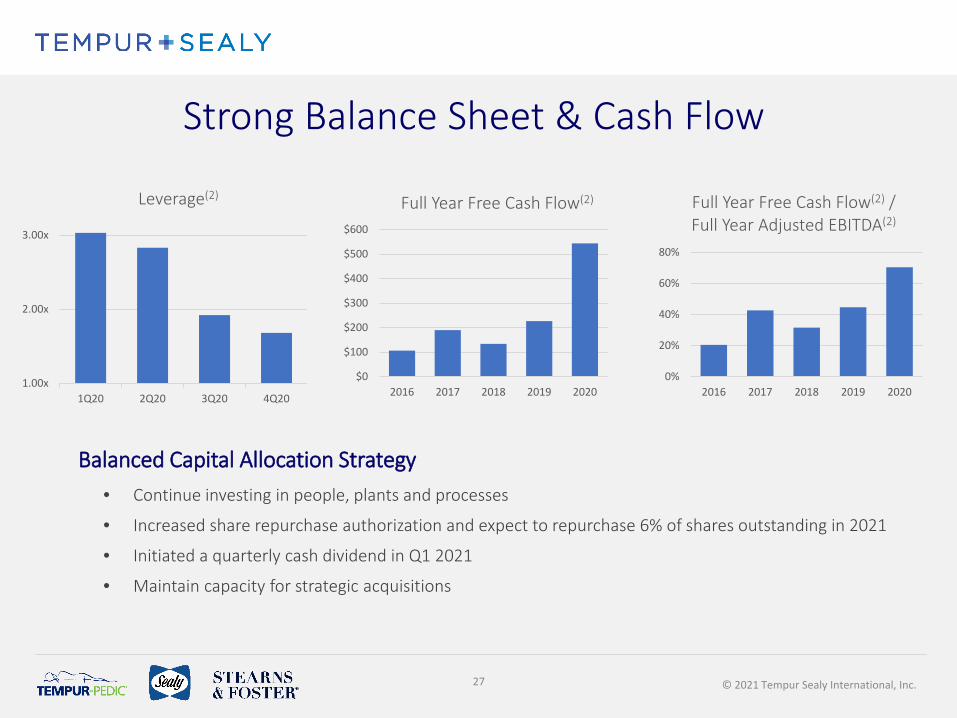
Strong Balance Sheet & Cash Flow
1.00x
2.00x
3.00x
1Q20 2Q20 3Q20 4Q20
Leverage(2)
$0
$100
$200
$300
$400
$500
$600
2016 2017 2018 2019 2020
Full Year Free Cash Flow(2)
0%
20%
40%
60%
80%
2016 2017 2018 2019 2020
Full Year Free Cash Flow(2) / Full Year Adjusted EBITDA(2)
• Continue investing in people, plants and processes
• Increased share repurchase authorization and expect to repurchase 6% of shares outstanding in 2021
• Initiated a quarterly cash dividend in Q1 2021
• Maintain capacity for strategic acquisitions
Balanced Capital Allocation Strategy

© 2021 Tempur Sealy International, Inc.28
ENVIRONMENTAL, SOCIAL AND CORPORATE GOVERNANCE
© 2020 Tempur Sealy International, Inc.
© 2021 Tempur Sealy International, Inc.
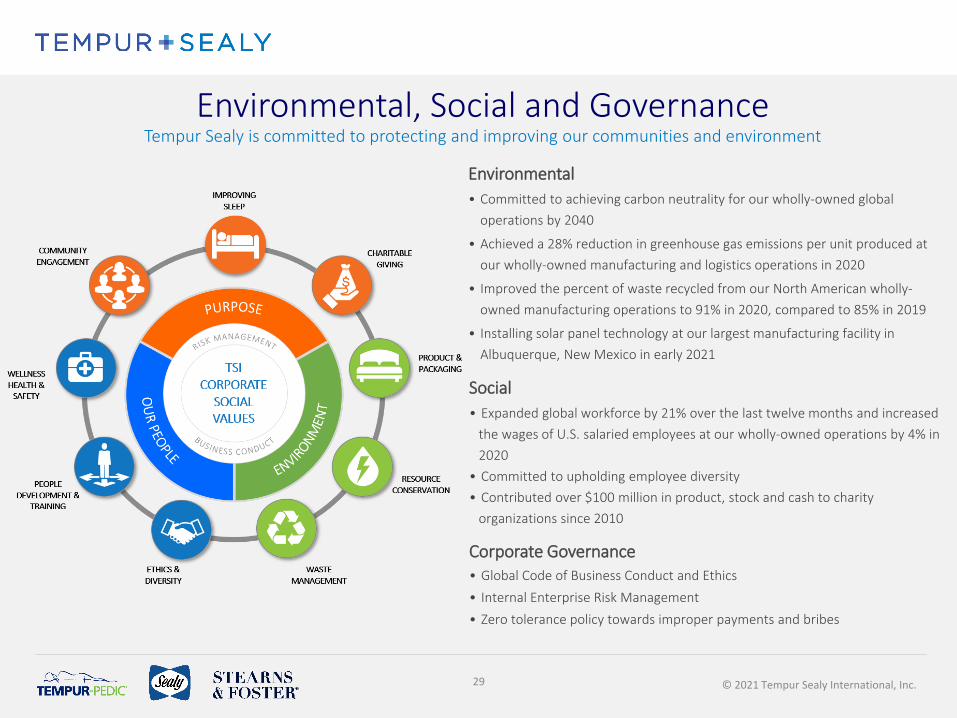
Environmental, Social and GovernanceTempur Sealy is committed to protecting and improving our communities and environment
Environmental• Committed to achieving carbon neutrality for our wholly-owned global
operations by 2040
• Achieved a 28% reduction in greenhouse gas emissions per unit produced at our wholly-owned manufacturing and logistics operations in 2020
• Improved the percent of waste recycled from our North American wholly-owned manufacturing operations to 91% in 2020, compared to 85% in 2019
• Installing solar panel technology at our largest manufacturing facility in Albuquerque, New Mexico in early 2021
Social• Expanded global workforce by 21% over the last twelve months and increased
the wages of U.S. salaried employees at our wholly-owned operations by 4% in 2020
• Committed to upholding employee diversity • Contributed over $100 million in product, stock and cash to charity
organizations since 2010
Corporate Governance• Global Code of Business Conduct and Ethics• Internal Enterprise Risk Management • Zero tolerance policy towards improper payments and bribes
29
© 2021 Tempur Sealy International, Inc.
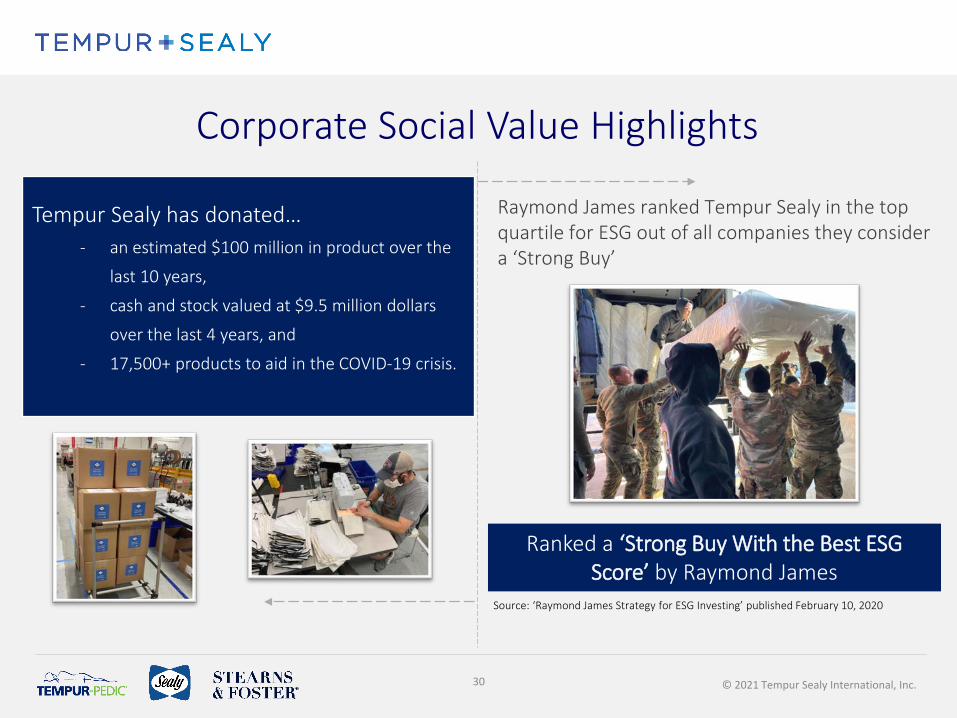
Corporate Social Value Highlights
Tempur Sealy has donated…- an estimated $100 million in product over the
last 10 years,
- cash and stock valued at $9.5 million dollars
over the last 4 years, and
- 17,500+ products to aid in the COVID-19 crisis.
Ranked a ‘Strong Buy With the Best ESG Score’ by Raymond James
Raymond James ranked Tempur Sealy in the top quartile for ESG out of all companies they consider a ‘Strong Buy’
Source: ‘Raymond James Strategy for ESG Investing’ published February 10, 2020
30
© 2021 Tempur Sealy International, Inc.31
Value Creation Drivers• Bedding market is a stable and growing industry with strong returns
• Importance of bedding will continue as consumers connect health and wellness with a good night of sleep
• Track record of developing and marketing differentiated products through consumer-centric innovation for the total global bedding market
• Omni-channel distribution strategy to be where the consumer wants to shop
• Robust free cash flow(2) and fortified balance sheet that provide flexibility to take advantage of industry and market opportunities
© 2021 Tempur Sealy International, Inc.
Thank you for your interest in Tempur Sealy International
For more information please email: [email protected]
32

© 2021 Tempur Sealy International, Inc.
Appendix
© 2020 Tempur Sealy International, Inc.33
© 2021 Tempur Sealy International, Inc.
This investor presentation contains statements relating to the Company's quarterly cash dividend, the Company's share repurchase targets, the Company's expectations regarding net sales for 2021, EBITDA for 2021,and EPS for 2021 and subsequent periods and the Company's expectations for increasing sales growth, product launches, channel growth, acquisitions and commodities outlook. Any forward-looking statementscontained herein are based upon current expectations and beliefs and various assumptions. There can be no assurance that the Company will realize these expectations, meet its guidance, or that these beliefs willprove correct.
Numerous factors, many of which are beyond the Company's control, could cause actual results to differ materially from any that may be expressed herein as forward-looking statements. These potential risk factorsinclude the risk factors discussed under the heading "Risk Factors" under ITEM 1A of Part 1 of the Company's Annual Report on Form 10-K for the year ended December 31, 2020. There may be other factors that maycause the Company's actual results to differ materially from the forward-looking statements. The Company undertakes no obligation to update any forward-looking statement to reflect events or circumstances afterthe date on which such statement is made.
Other potential risk factors include the risk factors discussed under the heading "Risk Factors" under Part I, ITEM 1A of the Company’s Annual Report on Form 10-K for the year ended December 31, 2020. There maybe other factors that cause the Company’s actual results to differ materially from any of those expressed as forward-looking statements herein.
Note Regarding Historical Financial Information:In this investor presentation we provide or refer to certain historical information for the Company. For a more detailed discussion of the Company’s financial performance, please refer to the Company’s SEC filings.
Note Regarding Trademarks, Trade Names and Service Marks:TEMPUR®, Tempur-Pedic®, the TEMPUR-PEDIC & Reclining Figure Design®, TEMPUR-Adapt®, TEMPUR-ProAdapt®, TEMPUR-LuxeAdapt®, TEMPUR-PRObreeze™, TEMPUR-LUXEbreeze™, TEMPUR-Cloud®, TEMPUR-Contour™, TEMPUR-Rhapsody™, TEMPUR-Flex®, THE GRANDBED BY TEMPUR-PEDIC®, TEMPUR-Ergo®, TEMPUR-UP™, TEMPUR-Neck™, TEMPUR-Symphony™, TEMPUR-Comfort™, TEMPUR-Traditional™, TEMPUR-Home™, SEALY®, SEALY POSTUREPEDIC®, STEARNS & FOSTER®, COCOON by Sealy™, SealyChill™ and Clean Shop Promise™ are trademarks, trade names or service marks of Tempur Sealy International, Inc. and/or itssubsidiaries. All other trademarks, trade names and service marks in this presentation are the property of the respective owners.
Limitations on Guidance: The guidance included herein is from the Company’s press release and related earnings call on February 11, 2021. The Company is neither reconfirming this guidance as of the date of thisinvestor presentation nor assuming any obligation to update or revise such guidance. See above.
Forward-Looking Statements
34
© 2021 Tempur Sealy International, Inc.
Use of Non-GAAP Financial Measures and Constant Currency Information
In this investor presentation and certain of its press releases and SEC filings, the Company provides information regarding adjusted net income, EBITDA, adjusted EBITDA per credit facility,free cash flow, consolidated indebtedness less netted cash, and leverage which are not recognized terms under U.S. Generally Accepted Accounting Principles (“GAAP”) and do not purport tobe alternatives to net income and earnings per share as a measure of operating performance, an alternative to cash provided by operating activities as a measure of liquidity, or analternative to total debt. The Company believes these non-GAAP measures provide investors with performance measures that better reflect the Company's underlying operations and trends,including trends in changes in margin and operating expenses, providing a perspective not immediately apparent from net income and operating income. The adjustments managementmakes to derive the non-GAAP measures include adjustments to exclude items that may cause short-term fluctuations in the nearest GAAP measure, but which management does notconsider to be the fundamental attributes or primary drivers of the Company's business.
The Company believes that exclusion of these items assists in providing a more complete understanding of the Company's underlying results from continuing operations and trends, andmanagement uses these measures along with the corresponding GAAP financial measures to manage the Company's business, to evaluate its consolidated and business segmentperformance compared to prior periods and the marketplace, to establish operational goals and management incentive goals, and to provide continuity to investors for comparabilitypurposes. Limitations associated with the use of these non-GAAP measures include that these measures do not present all of the amounts associated with the Company’s results asdetermined in accordance with GAAP. These non-GAAP measures should be considered supplemental in nature and should not be construed as more significant than comparable measuresdefined by GAAP. Because not all companies use identical calculations, these presentations may not be comparable to other similarly titled measures of other companies. For moreinformation regarding the use of these non-GAAP financial measures, please refer to the reconciliations on the following pages and the Company’s SEC filings.
Constant Currency InformationIn this presentation the Company refers to, and in other communications with investors the Company may refer to, net sales or earnings or other historical financial information on a"constant currency basis," which is a non-GAAP financial measure. These references to constant currency basis do not include operational impacts that could result from fluctuations inforeign currency rates. To provide information on a constant currency basis, the applicable financial results are adjusted based on a simple mathematical model that translates current periodresults in local currency using the comparable prior corresponding period's currency conversion rate. This approach is used for countries where the functional currency is the local countrycurrency. This information is provided so that certain financial results can be viewed without the impact of fluctuations in foreign currency rates, thereby facilitating period-to-periodcomparisons of business performance.
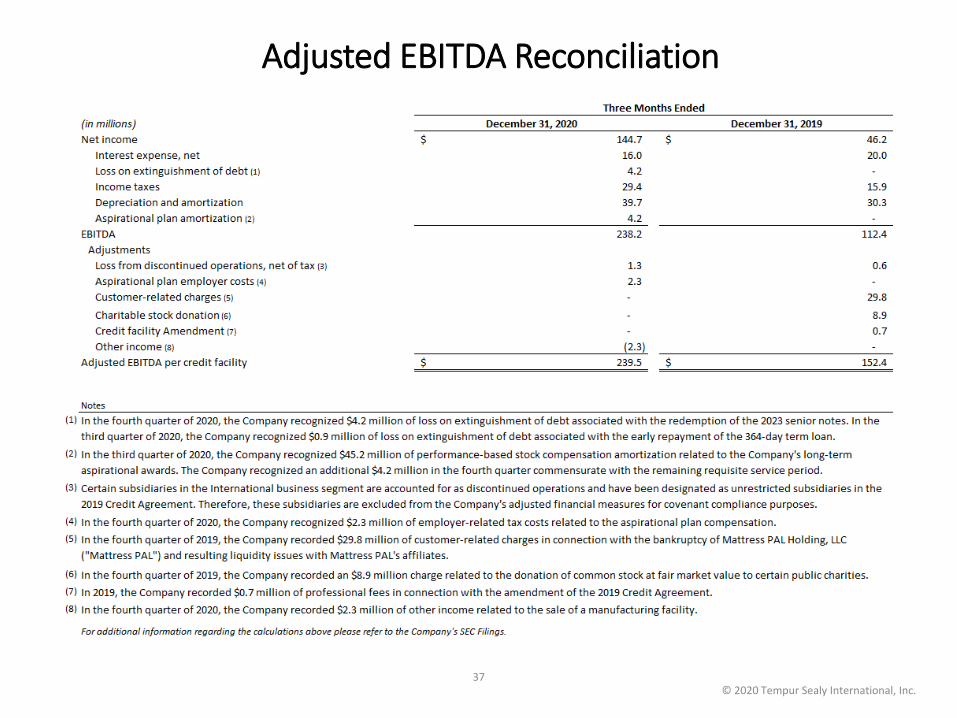
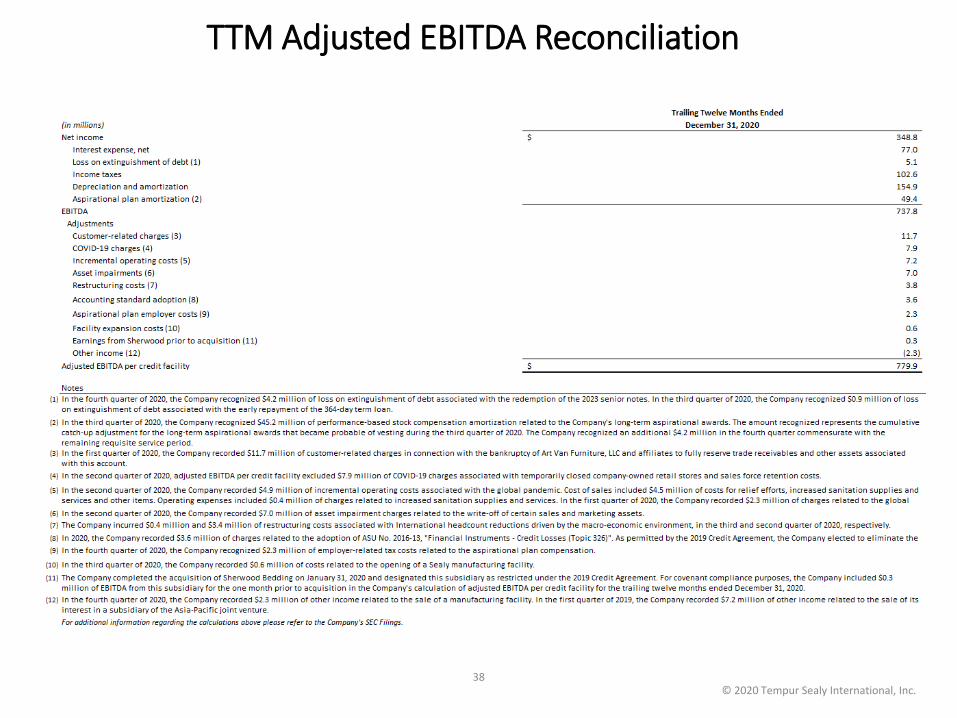
EBITDA and Adjusted EBITDA per Credit FacilityA reconciliation of the Company's GAAP net income to EBITDA and adjusted EBITDA per credit facility (which we refer to in this investor presentation as adjusted EBITDA) is provided on thesubsequent slides. Management believes that the use of EBITDA and adjusted EBITDA per credit facility provides investors with useful information with respect to the Company’s operatingperformance and comparisons from period to period as well as the Company’s compliance with requirements under its credit agreement.
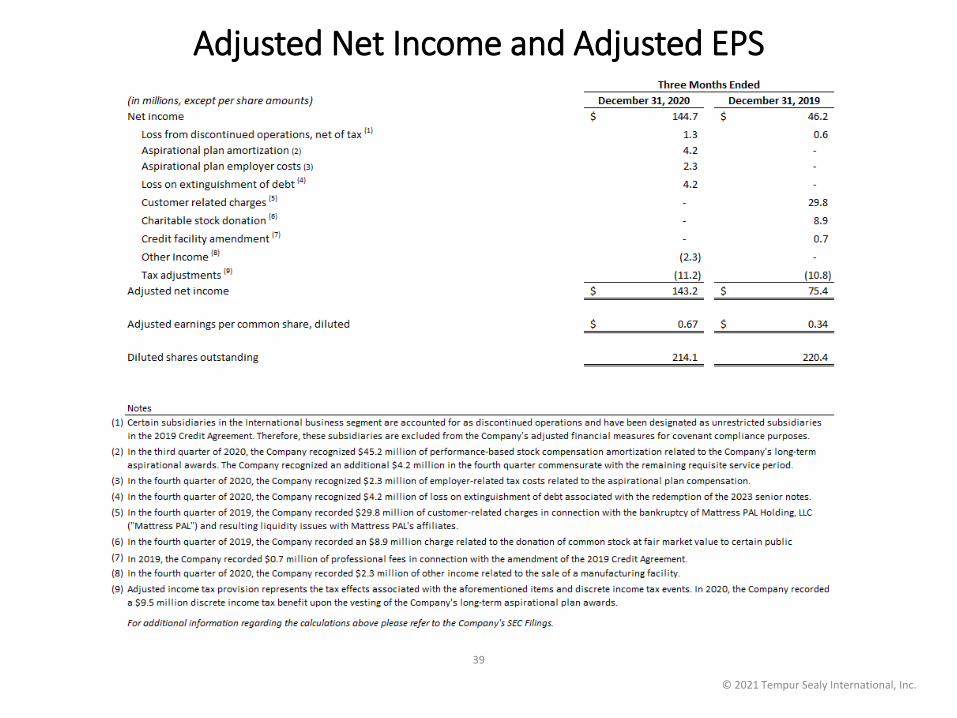
Adjusted Net IncomeA reconciliation of the Company's GAAP net income to adjusted net income and a calculation of adjusted EPS are provided on subsequent slides. Management believes that the use ofadjusted net income and adjusted EPS also provides investors with useful information with respect to the Company’s operating performance and comparisons from period to period.
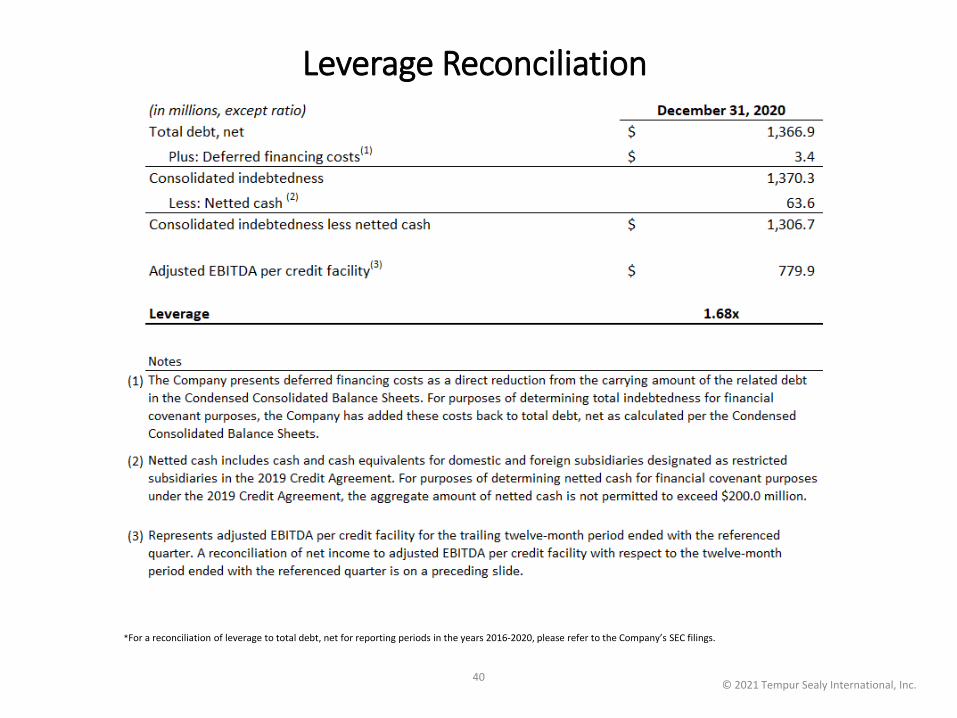
LeverageConsolidated indebtedness less netted cash to adjusted EBITDA per credit facility, which the Company may refer to as leverage, is provided on a subsequent slide and is calculated by dividingconsolidated indebtedness less netted cash, as defined by the Company’s senior secured credit facility, by adjusted EBITDA per credit facility. The Company provides this as supplementalinformation to investors regarding the Company’s operating performance and comparisons from period to period, as well as general information about the Company's progress in reducingits leverage.
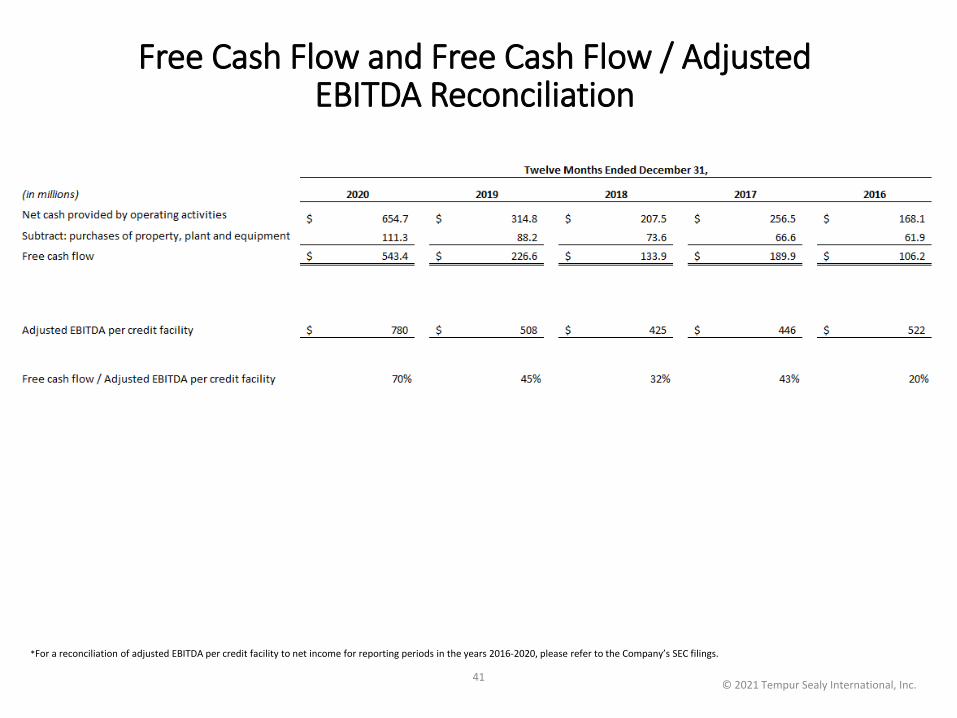
Free Cash FlowThe Company defines free cash flow as net cash provided by operating activities less purchases of property, plant and equipment. Management believes that free cash flow may be useful forinvestors in assessing the Company’s operating performance, ability to generate cash and ability to fund the Company’s capital expenditures and meet the Company’s debt servicerequirements. 35
© 2021 Tempur Sealy International, Inc.
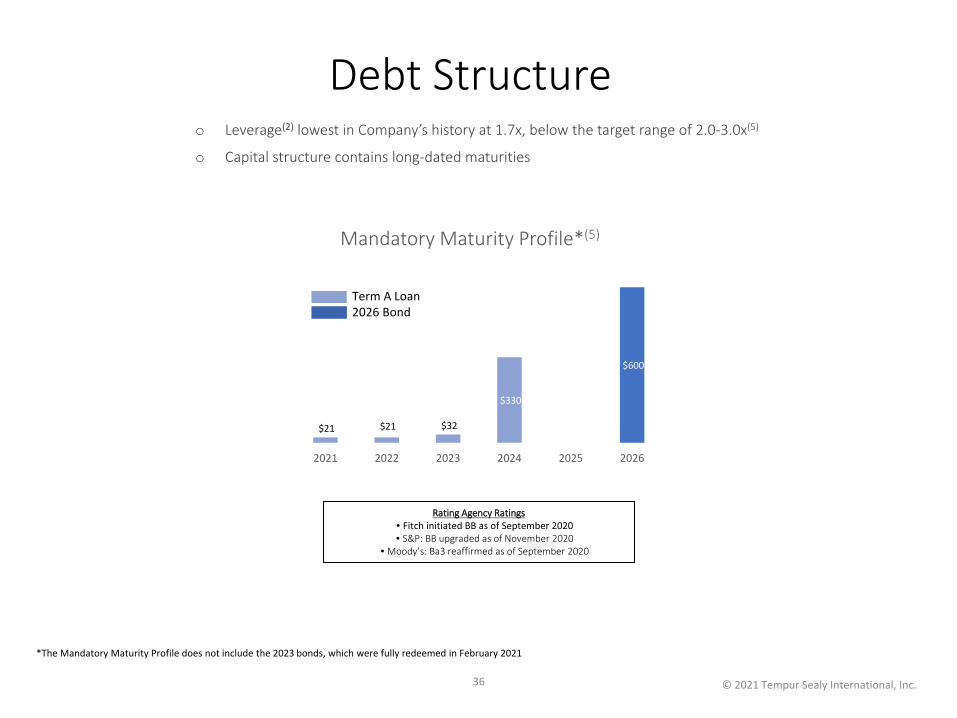
$21 $21 $32
$330
$600
2021 2022 2023 2024 2025 2026
Mandatory Maturity Profile*(5)
Debt Structureo Leverage(2) lowest in Company’s history at 1.7x, below the target range of 2.0-3.0x(5)
o Capital structure contains long-dated maturities
Rating Agency Ratings• Fitch initiated BB as of September 2020• S&P: BB upgraded as of November 2020
• Moody’s: Ba3 reaffirmed as of September 2020
Term A Loan2026 Bond
36
*The Mandatory Maturity Profile does not include the 2023 bonds, which were fully redeemed in February 2021
© 2021 Tempur Sealy International, Inc.
Adjusted EBITDA Reconciliation
© 2020 Tempur Sealy International, Inc.37
© 2021 Tempur Sealy International, Inc.
TTM Adjusted EBITDA Reconciliation
© 2020 Tempur Sealy International, Inc.38
© 2021 Tempur Sealy International, Inc.
Adjusted Net Income and Adjusted EPS
39
© 2021 Tempur Sealy International, Inc.
Leverage Reconciliation
40
*For a reconciliation of leverage to total debt, net for reporting periods in the years 2016-2020, please refer to the Company’s SEC filings.
© 2021 Tempur Sealy International, Inc.
Free Cash Flow and Free Cash Flow / Adjusted EBITDA Reconciliation
41
*For a reconciliation of adjusted EBITDA per credit facility to net income for reporting periods in the years 2016-2020, please refer to the Company’s SEC filings.
© 2021 Tempur Sealy International, Inc.
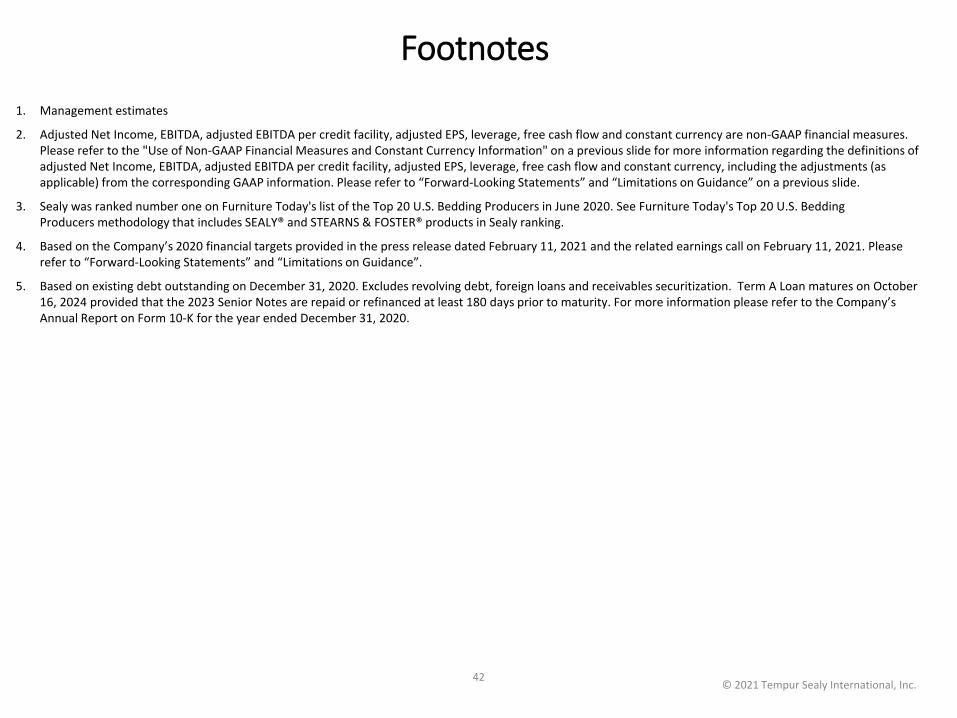
Footnotes1. Management estimates
2. Adjusted Net Income, EBITDA, adjusted EBITDA per credit facility, adjusted EPS, leverage, free cash flow and constant currency are non-GAAP financial measures. Please refer to the "Use of Non-GAAP Financial Measures and Constant Currency Information" on a previous slide for more information regarding the definitions of adjusted Net Income, EBITDA, adjusted EBITDA per credit facility, adjusted EPS, leverage, free cash flow and constant currency, including the adjustments (as applicable) from the corresponding GAAP information. Please refer to “Forward-Looking Statements” and “Limitations on Guidance” on a previous slide.
3. Sealy was ranked number one on Furniture Today's list of the Top 20 U.S. Bedding Producers in June 2020. See Furniture Today's Top 20 U.S. Bedding Producers methodology that includes SEALY® and STEARNS & FOSTER® products in Sealy ranking.
4. Based on the Company’s 2020 financial targets provided in the press release dated February 11, 2021 and the related earnings call on February 11, 2021. Please refer to “Forward-Looking Statements” and “Limitations on Guidance”.
5. Based on existing debt outstanding on December 31, 2020. Excludes revolving debt, foreign loans and receivables securitization. Term A Loan matures on October 16, 2024 provided that the 2023 Senior Notes are repaid or refinanced at least 180 days prior to maturity. For more information please refer to the Company’s Annual Report on Form 10-K for the year ended December 31, 2020.
42