Temporary Protection and Technology Adoption: Evidence … · Temporary Protection and Technology...
58
Temporary Protection and Technology Adoption: Evidence from the Napoleonic Blockade Réka Juhász * Columbia University October 24, 2017 Abstract This paper uses a natural experiment to estimate the causal effect of temporary trade protection on long-term economic development. I find that regions in the French Empire which became better protected from trade with the British for exogenous rea- sons during the Napoleonic Wars (1803-15) increased capacity in mechanized cotton spinning to a larger extent than regions which remained more exposed to trade. In the long-run, regions with exogenously higher spinning capacity had higher activity in mechanized cotton spinning and higher value-added per capita in industry. JEL code: F13, F63, O14 Keywords: Infant industry, Industrialization, Technology Adoption * I thank my advisors Silvana Tenreyro and Steve Pischke for their continued guidance and support. My thesis examiners, Thierry Mayer and John Van Reenen, provided extensive feedback that has improved the paper significantly. I am grateful to Andy Bernard, Tim Besley, Esther Bøler, Francesco Caselli, Alex Clymo, Nick Crafts, Jeremiah Dittmar, Swati Dhingra, Dave Donaldson, Knick Harley, Ethan Ilzetzki, Balázs Muraközy, Gianmarco Ottaviano, Joel Mokyr, Michael Peters, Steve Redding, Esteban Rossi-Hansberg, Daniel Sturm, David Weinstein and seminar participants for helpful comments and suggestions. Financial support from STICERD and CEP is gratefully acknowledged. I thank Pierre-Philippe Combes, Guillaume Daudin, Alan Fernihough, Ömer Özak, Peter Solar, Anna Valero, Gilles Postel-Vinay, and EURO-FRIEND for kindly sharing data. I am grateful to Lili Szabó, Jérémy Hervelin, Gábor Szakács and Yue Yu for excellent research assistance. Contact: [email protected]. 1
Transcript of Temporary Protection and Technology Adoption: Evidence … · Temporary Protection and Technology...

Temporary Protection and Technology Adoption:Evidence from the Napoleonic Blockade
Réka Juhász∗
Columbia University
October 24, 2017
Abstract
This paper uses a natural experiment to estimate the causal effect of temporarytrade protection on long-term economic development. I find that regions in the FrenchEmpire which became better protected from trade with the British for exogenous rea-sons during the Napoleonic Wars (1803-15) increased capacity in mechanized cottonspinning to a larger extent than regions which remained more exposed to trade. Inthe long-run, regions with exogenously higher spinning capacity had higher activity inmechanized cotton spinning and higher value-added per capita in industry.
JEL code: F13, F63, O14Keywords: Infant industry, Industrialization, Technology Adoption
∗I thank my advisors Silvana Tenreyro and Steve Pischke for their continued guidance and support. Mythesis examiners, Thierry Mayer and John Van Reenen, provided extensive feedback that has improvedthe paper significantly. I am grateful to Andy Bernard, Tim Besley, Esther Bøler, Francesco Caselli, AlexClymo, Nick Crafts, Jeremiah Dittmar, Swati Dhingra, Dave Donaldson, Knick Harley, Ethan Ilzetzki, BalázsMuraközy, Gianmarco Ottaviano, Joel Mokyr, Michael Peters, Steve Redding, Esteban Rossi-Hansberg,Daniel Sturm, David Weinstein and seminar participants for helpful comments and suggestions. Financialsupport from STICERD and CEP is gratefully acknowledged. I thank Pierre-Philippe Combes, GuillaumeDaudin, Alan Fernihough, Ömer Özak, Peter Solar, Anna Valero, Gilles Postel-Vinay, and EURO-FRIENDfor kindly sharing data. I am grateful to Lili Szabó, Jérémy Hervelin, Gábor Szakács and Yue Yu for excellentresearch assistance. Contact: [email protected].
1

“The principal advantage of the English cotton trade arises from our machinesboth for spinning and printing (...). It is impossible to say how soon foreigncountries may obtain these machines, but even then, the experience we have inthe use of them would give us such an advantage that I should not fear thecompetition.” – Joseph Smith and Robert Peel (1786)1
A long-standing debate in economics is centered on the question of whether certain indus-
tries can become competitive in the long-run if they are given temporary trade protection.
The idea, widely known as the infant industry argument, has a long tradition in the history
of economic thought, dating back to at least Alexander Hamilton and Friedrich List.2 As-
sessing the empirical relevance of these predictions has proven difficult for two reasons. First,
infant industry protection is generally granted by the policy-maker at the country-wide level.
This implies that even if the industry becomes competitive in the long-run, it is difficult to
answer the counterfactual question of whether the industry would have become competitive
anyway. Second, in the case of a specific policy intervention, it is not possible to disentangle
the effect of the economic mechanism at work from the efficacy of implementation and the
inherent endogeneity of which industry the policy maker chooses to protect.
The principal contribution of this paper is to estimate the causal effect of temporary
trade protection on the development of an infant industry and the economy more generally.
I present a natural experiment which replicates infant industry protection without the direct
involvement of the policy maker, making it possible to address both identification challenges.
I study the effect of temporary trade protection on the mechanized cotton-spinning industry
across regions of the French Empire during and after the Napoleonic Wars (1803-15).
Throughout these wars, the French Empire was exposed to a regionally differential, and
arguably exogenous, shock to the cost of trading with Britain. In particular, the wars led to
a unique historical episode whereby a blockade of Britain was implemented by attempting
to stop British goods from entering Continental Europe. Ports were closed to ships carrying1 Quoted in Edwards (1967, p.51).2Hamilton (1791) and List (1856).
2
British goods, and the military was active in enforcing the blockade along the coastline. In
practice however, holes in the system opened up almost immediately. Instead of achieving
the original goal of stopping trade flows between Britain and the Continent, the blockade
displaced trade to more circuitous, and hence more expensive routes. In the north of France,
effective distance between a given region and London increased markedly, as trade was
diverted either to unreliable indirect routes through German regions, or through Southern
Europe. In the southern regions of France, effective distance to London changed to a far
smaller extent, as trade routes stayed more or less the same. By comparing regions which
received a smaller or larger shock, it is possible to empirically evaluate the predictions of the
infant industry argument.
The industry examined is mechanized cotton spinning. This was one of the fastest grow-
ing and most innovative sectors in the 19th century, playing a key role in the first Industrial
Revolution and contributing 25 percent to overall TFP growth in British industry between
1780 and 1860 (Crafts, 1985). Both Hamilton and List advocated for infant industry protec-
tion for the nascent cotton industries in the US and Germany respectively (Hamilton, 1791;
List, 1856).
A number of features of the industry in early nineteenth century France make it particu-
larly well-suited to examining the effects of infant industry protection. First, the technology,
invented and developed in Britain in the late 18th century, was initially not adopted on a
wide scale in France, a country with an initially similar cotton industry. By the beginning
of the Napoleonic Wars, the French were not competitive in mechanized cotton spinning.
Second, the machines were cheap and depreciated fast meaning that the long-term results
cannot be driven by the gradual depletion of a one-time investment. Finally, this was the first
industry to mechanize and adopt modern, factory-based production methods. Differently to
traditional cottage industry, modern production methods are generally thought to exhibit
the types of increasing returns to scale inherent to infant industry mechanisms. This aspect
3

of the setting is helpful, as infant industry mechanisms may be present in mechanized cotton
spinning, but not in most other sectors in early 19th century France, as these only switched
to factory-based production methods later.
I estimate the causal effect of temporary protection in two steps. First, I ask whether
trade protection was an important driver of the adoption of mechanized cotton-spinning tech-
nology in the short-run, during the disruption to trade. This would be the case if protection
rendered profitable previously unprofitable locations by increasing the price of competing
imported British yarn. Second, I examine effects in the long-run, after the disruption to
trade ended. If temporary protection was successful in changing the long-term profitabil-
ity of production in a given location through agglomeration economies, we would expect to
find persistence in the location of mechanized cotton-spinning activity. In addition, I exam-
ine whether adoption of frontier technology in mechanized cotton spinning led to aggregate
effects on the regional economy.
To conduct the empirical analysis, a large amount of data was compiled from primary
sources. The main outcome variable of interest is capacity in mechanized cotton spinning. I
collected data on the number of mechanized cotton spindles (the relevant measure of phys-
ical capital) for French departments throughout the nineteenth century from handwritten
industrial surveys. For some years, these are available at the firm level. To reconstruct
trade routes in use before and during the blockade, data on ships arriving and sailing from
Britain to Continental European ports were extracted from a bi-weekly shipping newspaper,
the Lloyd’s List, over a 20 year period.
To identify the causal effect of trade protection on mechanized spinning capacity in the
short-run, I use a difference in difference (DD) estimator with continuous treatment intensity.
This compares the size of mechanized cotton spinning capacity across regions which were
exposed to smaller or larger increases in the cost of trading with Britain (trade cost shock
for short), before and after the Napoleonic Wars. My empirical strategy is based on the well-
4

documented fact that trade diminishes dramatically with distance, implying that geographic
distance plays a role similar to that of artificial barriers to trade such as tariffs. Identification
relies on there being no other shock contemporaneous to, and correlated with the trade cost
shock. I show evidence in support of this assumption using a number of placebo tests and
other robustness checks.
Trade protection had a large and statistically significant effect on the adoption of mech-
anized cotton-spinning technology. I find that areas which received a larger trade cost shock
during the Napoleonic Wars increased production capacity in mechanized cotton spinning to
a larger extent than areas which received a smaller shock. The estimated effect is large and
statistically significant. Moving from the 25th to the 75th percentile of the shock leads to a
predicted increase in spinning capacity which is similar in size to mean spinning capacity at
the end of the blockade.
The second part of the empirical strategy examines the extent to which temporary trade
protection rendered locations profitable for production in the long-term. I estimate the long-
run, local average treatment effect of having a larger regional mechanized cotton spinning
industry as a result of temporary trade protection on our outcome variables of interest. For
the trade cost shock to be a valid instrument for the post-blockade location of the cotton
industry, the shock must be uncorrelated with other determinants of the outcome variables. I
build evidence in support of this assumption using placebo tests and other robustness checks.
However, as these effects are estimated for a relatively long time horizon, it is not possible
to rule out that other mechanisms may (partly) be driving the long-run results. For this
reason, I view these results as more suggestive than the short-run ones.
I find evidence of persistence in the location of mechanized cotton spinning throughout
the 19th century. Having one more mechanized spindle in 1812 as a result of higher pro-
tection during the blockade increased mechanized spinning capacity by about 2-3 spindles
in 1840, and 5-6 spindles in 1887. As the industry expanded in France throughout the
5

19th century, the results show that regions which had a first-mover advantage as a result
of temporary protection were the ones disproportionately increasing their spinning capacity
throughout the 19th century. Moreover, the pattern of persistence is inconsistent with the
alternative mechanism of slow technology diffusion from Britain, as more southern regions
of France decreased in absolute magnitude in the long-run. I also examine the extent to
which temporary protection affected long-run development more generally through its effect
on mechanized cotton spinning. I find that increased protection from British competition
increased value added per capita in industry in 1860, through its effect on mechanized cotton
spinning, but not later.
Since tariffs or prohibitions were imposed on cotton manufactures between Britain and
France following the end of the Napoleonic Wars, the long-term within-country results are
consistent with an infant industry mechanism at work within France. It does not necessarily
show however, that (a subset of) firms had become competitive at free trade prices. For this
reason, I also examine exports of cotton manufactures from France. Consistent with evolving
comparative advantage in cotton manufactures, I find that exports increased substantially
after the end of the Napoleonic Wars, in levels and relative to British exports of the same.
As late as 1850, other countries in Continental Europe typically had much smaller cotton
spinning industries, suggesting that adoption of the technology was far from inevitable.
The results of the paper contribute to several strands of the literature. To the best of
my knowledge, this paper is the first to provide well-identified, reduced-form evidence of an
infant industry mechanism. To date, the literature has partially addressed the challenges to
estimating the effects of temporary trade protection by using calibrated or estimated model
parameters to simulate the counterfactual of no-protection in partial equilibrium models
(Baldwin and Krugman, 1986, 1988; Head, 1994; Irwin, 2000; Hansen et al., 2003). Without
exception, papers in this literature study cases in which the policy-maker implemented tariff
protection and as such, cannot address the inherent endogeneity of industry choice.
6

More generally, the economic theory underlying the infant industry mechanism can be
seen in the context of a large class of models which predict that initial conditions are im-
portant for determining the long-run location of industries as a result of agglomeration
economies. In particular, the paper is related to a growing empirical literature which ex-
amines whether temporary shocks can permanently shift the location of economic activity
(Davis and Weinstein, 2002; Redding and Sturm, 2008; Kline and Moretti, 2014). In con-
trast to other mechanisms which the literature has explored, this paper estimates the effect
of trade protection on determining industry location and as such, informs the debate on
whether infant industry mechanisms are empirically relevant.
The results of this paper raise the question of whether policy intervention may be welfare-
maximizing in similar settings. Even setting aside the issue of how policymakers identify
such industries, theoretically, this depends crucially on the source and size of agglomeration
economies. These are difficult to distinguish and quantify. Krugman (1987), Lucas (1988),
Matsuyama (1992) and Young (1991) model external-to-the-firm learning-by-doing, while
Krugman and Elizondo (1996) and Puga and Venables (1999) model pecuniary externalities
which arise from the interaction of internal to the firm increasing returns to scale, input-
output linkages and transport costs. Both strands predict that trade policy may affect
the long-term location of industries, though the effect on welfare is generally different. In
particular, it is generally not the case that policy intervention is optimal in the latter type
of models as Puga and Venables (1999) show. In contrast, intervention can be optimal if the
region has a latent comparative advantage in the industry, and the size of the externalities
is large in models which feature external economies of scale as discussed by Harrison and
Rodríguez-Clare (2010).3
Data availability limits the extent to which I am able to differentiate between the two3As is well known, tariff protection is generally not the most efficient form of intervention, as a production
subsidy would not distort consumption choices. See Melitz (2005) for a discussion.
7

types of agglomeration economies in the empirical analysis. However, I present historical
evidence consistent with learning-by-doing externalities. This suggestive evidence on external
economies of scale does not imply a case for infant industry protection in similar settings.
Instead, it serves to highlight the important challenges economies face to the extent that
similar mechanisms are present in developing countries today.4
Finally, the paper contributes to the debate on why France was slow to adopt mech-
anized cotton-spinning technology (Allen, 2009; Crafts, 1995; Landes, 2003). Most closely
related to this paper’s mechanism is Crafts (1995), who argued that the historical accident of
mechanized spinning technology being invented in Britain, and not France, gave that coun-
try a significant first-mover advantage which made emulation for follower countries difficult.
Moreover, Crouzet (1964) has claimed that countries which received more protection from
British competition during the Continental Blockade, such as France, adopted mechanized
cotton spinning technology early in the nineteenth century. On the other hand, Heckscher
(1922) argued that these events were nothing more than the short-run “hothouse” develop-
ment of an industry subject to artificial protection. Using the data assembled for this paper,
it has been possible to test this question for the case of France by exploiting within-country
variation in trade protection.
The paper is organized as follows. The next section discusses mechanization of cotton
spinning and its effects on France. Section 2 describes the way in which the Napoleonic
Wars drove exogenous changes in trade protection from Britain. Section 3 describes the
main sources of data, while Sections 4-5 contain the short and long-term empirical analysis,
respectively. The final section concludes.4It should also be noted that even if the effect driving the results are external economies of scale, the
welfare implications are ambiguous because of the static negative welfare losses stemming from the higherprice paid by consumers of cotton yarn. This discussion also abstracts from the myriad other (arguablyoverwhelmingly negative) effects of the blockade. The goal of this paper however is not to offer a welfareevaluation of the blockade but rather to use the setting to study the question of whether theoretical infantindustry mecahnisms are empirically relevant.
8
1 The cotton industry in Britain and France
Britain’s dominance of the 19th century cotton textile industry is a widely known fact. It
may thus be somewhat surprising that as late as the mid-18th century, the cotton textile
industry in Britain and France were actually remarkably similar (Riello, 2013). In both
countries, cotton textile manufacturing was a new and small industry relative to traditional
European textiles such as wool, linen and silk.5 Moreover, the cotton industry was marginal
not only in relation to other domestic textiles, but also relative to world output, which was
dominated by Indian cotton cloth.6
1.1 Mechanization in Britain and diffusion of technology to France
A series of inventions mechanized the spinning of cotton yarn in Britain in the second half
of the 18th century. Traditionally, spinners had spun one thread at a time using a simple
wheel. Mechanization increased output per worker as machines were able to spin multiple
rovings simultaneously. The new machines diffused rapidly across the British countryside
(Allen, 2009). Importantly, they were fairly cheap, and they depreciated fast.7 This rules
out a slow to depreciate, large, one-time investment driving the long-term results.
Mechanization had large effects on the cotton textile industry for a number of reasons.
First, the machines disrupted the domestic structure of the industry. The size of machines,
their complexity and reliance on inanimate power rendered production in the workers’ homes
obsolete and manufacturing activity moved into large factories. For the first time, produc-
tion was organized in large structures that required careful organization of work-flow and5For example, Chabert (1945) estimates the size of the industries for France in 1788, before the French
Revolution, and in 1812, towards the end of the Napoleonic Wars, as follows (in millions of francs); 1788:Linen and hemp: 235, Wool: 225, Silk: 130.8, Cotton: no number given. 1812: Linen and hemp: 242.8,Wool: 315.1, Silk: 107.5, Cotton: 191.6.
6It has been estimated that about 3 million pounds of cotton yarn a year were spun in both Britain andFrance, which compares modestly to Bengal’s 85 million pounds of yearly output (Allen, 2009).
7Allen (2009) has estimated that the original spinning jenny was priced at about seven times a spinner’sweekly wage and it depreciated in about 10 years.
9

management of workers (Allen, 2009) . This change was one of the most significant conse-
quences of the First Industrial Revolution, as it radically changed the method of production
from rurally organized, cottage industry characterized by small fixed capital investments,
to modern, factory based production subject to (external or internal to the firm) increasing
returns to scale (Mokyr, 2009).
Historical evidence points to at least one source of external increasing returns to scale in
the form of learning-by-doing. Experimentation via trial and error, small improvements made
by anonymous workers and entrepreneurs, and experience acquired on the job were important
sources of productivity improvements (Mokyr, 2009). For example, Chapman (1970) finds
that most cotton mills in England had a remarkably similar structure. Chapman quotes a
contemporary, Sir William Fairbairn, on the reason for this; “The machinery of the mills was
driven by four water-wheels erected by Mr Lowe of Nottingham. His work, heavy and clumsy
as it was, had in a certain way answered the purpose, and as cotton mills were then in their
infancy, he was the only person, qualified from experience, to undertake the construction of
the gearing.” (Chapman, 1970, pp. 239-240, my emphasis). Edwards notes that when the
mule-jenny, a third generation spinning machine, “left Crompton’s [the inventor’s] hands it
was a crude device, it had to be improved, and the spinners and weavers of muslins had to
acquire their skills.” (Edwards, 1967, p.4).8
Consistent with large improvements in productivity, the price of yarns declined signif-
icantly throughout the period as is shown in Figure A.1. The trend is most dramatic for
finer yarns, the real price of which dropped tenfold in as many years, but there was also a
decline in lower count (less fine) yarns. The large decrease in price is significant, as it helps
to explain why hand-spinners were outcompeted so quickly.
An imbalance in spinning output and downstream weaving capacity soon made British8Additional quantitative evidence on external learning effects is provided by David (1970), who estimates
strong learning effects for six firms in the 19th century US cotton textile industry.
10

cotton yarn uniquely reliant on exports markets, of which Europe was by far the most impor-
tant. Crouzet (1987) estimates that around 56-76 percent of Britain’s cotton manufactures
were exported either in the form of cloth or yarn. 44 percent of cotton cloth and a full 86
percent of cotton yarn exports were destined for the European market, and in particular,
France, Germany and Russia. This reliance on the Northern European market for cotton
yarn explains why maintaining trade with Europe in cottons was so crucially important dur-
ing the blockade, despite the risks and large increase in transport costs that were involved.
1.2 Slow adoption of mechanized spinning technlogy in France
Mechanization of cotton spinning in France proceeded very slowly relative to events across
the Channel. In 1790, the number of spinning jennies was estimated to be 900 in France,
while the number in Britain has been put at 18,000 (Aspin, 1964). Consistent with the lag in
technology, French machine spun yarn sold in France was at least double the price of British
machine spun yarn in Britain at the beginning of the blockade.9
Why was adoption so slow? It is important to note that the British prohibited both the
export of spinning machinery and the emigration of engineers and skilled workers until 1843
(Saxonhouse and Wright, 2004). This put an artificial barrier on the diffusion of technology
across the Channel. It meant that while the French were able to acquire blueprints of the
machines, and with the help of some English and Irish engineers, British best practice, they
did not have wide scale access to the tacit type of knowledge that is acquired via learning-
by-doing and that would be embedded in the export of machines or workers.
According to the historical evidence, both the state and private entrepreneurs were well
aware of the momentous changes taking place across the Channel and both made attempts to
foster technology transfer. Horn (2006) writes that “the effort pivoted on acquiring English
machines and spreading access to them as widely as possible. As is well known, the French9Figure A.2 compares prices for the full range of counts at the beginning of the blockade.
11
state concentrated on acquiring Arkwright’s water frame and the mule-jenny, both of which
were crucial to England’s competitive edge. Industrial spies (...) were commissioned to
acquire these technologies. (...) British machine builders were rewarded for coming to
France and given subsidies for each set of machine they sold. The Bourbon government paid
the wages of at least 100 foreign workers in machine building and provided large subsidies to
innovative French entrepreneurs who financed the construction of advanced textile machinery.
Before the adjudication of Arkwright’s second patent in 1785, no less than three mechanics
were building roller-spinning machines in France. Doggedly, if haphazardly, government
action enabled hundreds of English style (if not always functionally equivalent) carding and
spinning machines to be put into operation in nearly every major industrial district in France
between 1786-1789.” (p. 78).
However, it was not just the state which fostered technology diffusion. Chassagne (1991)
and Horn (2006) both emphasize that French cotton spinners played an even more important
role in the transfer of technology. In Toulouse, Francois Bernard Boyer-Fonfrede recruited
12 engineers from Britain to build a six storey, water powered spinning mill which employed
over five-hundred workers. After construction of the mill was complete, three were hired by
a firm in Aix, and another by a firm in Gironde (Chassagne, 1991, p. 244). In Amiens,
another entrepreneur, Jean-Baptiste Morgan, was similarly active in fostering technology
transfer. According to Horn, Morgan sent agents to recruit English workers; “Arriving
in yearly batches from 1788 to 1790, they provided Morgan with a detailed and precise
knowledge of English techniques, and with the mechanical expertise to construct the needed
machines and instruct workers in their use.” (Horn, 2006, p.83).
What is striking about these accounts is the extent to which technology transfer seems
to have been reliant on British know-how. Furthermore, it also seems to be the case that
above and beyond the technological expertise required to build the mills and machinery,
French workers were also reliant on British training in acquiring best-practice techniques in
12

mechanized spinning and in training weavers to adapt to using the new type of yarn. Con-
sistent with British competition inhibiting French entrepreneurs from entering the industry,
mechanized spinners active in France at the time unambiguously laid the finger of blame on
British competition.10
While technology diffusion was reliant on British know-how, according to the available
evidence, both prior to and during the blockade, machines were predominantly produced
domestically in France. Chassagne (1991) notes that three different mechanics were already
producing roller-spinning machines before 1785, one of whom produced 84 machines for a
number of different spinners. During the Napoleonic period, it seems most large firms had
their own machine builders for building and repairing the machines (Chassagne, 1991). The
emergence of specialized machinery producers was a feature that differentiated the US and
Great-Britain from other 19th century cotton textile producing regions (Saxonhouse and
Wright, 2004), though even in Britain, this subsidiary industry featuring large firms instead
of miscellaneous tradesman and small workshops did not emerge until the 1830s (Cookson,
1994).
Three features of the historical context discussed above are important to keep in mind
when interpreting the empirical results as evidence of an infant industry mechanism. First,
the similarity of the cotton textile industry in Britain and France prior to mechanization in
Britain is significant, as it suggests that economic fundamentals in Britain and France were
sufficiently close such that once French spinners were protected from British competition,
mechanization was rapidly adopted and became competitive in the longer-term. Put differ-
ently, it gives support to the claim that British competition was the key barrier inhibiting
French entrepreneurs from adopting the technology, as opposed to differences in economic10AN/AFIV/1318 contains a petition from large spinners across the Empire requesting a complete ban on
English cloth, while AN/F12/533 contains a petition from the Chamber of Commerce in Rhone (prefectureLyon) requesting the same. Appendix A.6 contains a description of each of the primary archival sourcesreferenced in the paper.
13

fundamentals. Second, the fact that French entrepreneurs were highly reliant on British
know-how for both domestic machine building and mechanized spinning points to the fact
that at pre-blockade protection levels, French spinners were unable to use the new technol-
ogy in an efficient way. Third, rapid productivity improvements and external to the firm
learning effects characterized mechanized cotton spinning. In light of the historical evidence,
it seems plausible that learning-by-doing externalities are the mechanism which gave rise to
the infant industry effect found in the empirical results, though data limitations do not allow
me to test this econometrically.
2 Variation from the Napoleonic Wars
The Continental Blockade prohibiting the entry of British goods onto the European Conti-
nent was declared in Berlin in late 1806, following the defeat of the Fourth Coalition against
France in Jena - Auerstadt. These events took place within the context of the Napoleonic
Wars (1803-1815). During this period, France fought Britain and its allies in a series of
campaigns. It is within this historical setting that the motivations and military constraints
for both Britain and France can be understood.11
The primary aim of the blockade was to weaken Britain economically by denying her ac-
cess to important Continental European markets. As the last section has shown, Northern-
European markets were particularly important for cotton cloth and yarn. However, the stark
asymmetry of naval power between Britain and France meant that traditional blockade of
British ports by the French navy was militarily infeasible.12 In contrast however, Napoleon
was increasingly successful in exerting his direct or indirect influence over most of the Con-11More generally, the Napoloenic blockade took place within the context of the French Revolutionary and
Napoleonic Wars (1792-1815). However, the disruption to trade that took place during the period studiedhere was fundamentaly different to the French Revolutionary Wars that came before (Davis and Engerman,2006). Appendix A.1.1 contains a detailed discussion of why this was the case.
12By 1800, the British had twice the number of warships as the French did (Davis and Engerman, 2006).
14

tinent.13 In this way, though Napoleon could not blockade British ports, he could use his
land-based power to do the next best thing, which was to attempt to stop British goods from
entering the Continent. Ports were closed to ships carrying British goods, and the military
was active in patrolling the coastline.
To understand the disruption to trade, it is worth examining two periods separately;
the three years leading up the imposition of the Continental Blockade (1803-06), and the
the blockade (1806-13) itself. Disruption to trade along the North-Sea ports began in 1803
with the onset of the Napoleonic Wars. Neutral ports along the North-Sea (Hamburg in
particular), together with Dutch ports had been traditionally used to continue trading with
the British in times of war (Edwards, 1967). However, in a highly symbolic event, Hanover
(home to the royal dynasty to which monarchs of Great Britain belonged to) was occupied
by the French army. Britain retaliated by imposing a tight blockade of the entire North Sea
coast between the Weser and the Elbe, which was then expanded to include ports along the
French Channel and the North Sea in 1804 (Davis and Engerman, 2006). Crouzet (1987)
considers this period a prequel to the blockade in the sense that trade to Northern Europe
was forced onto land routes for the first time significantly driving up the price at which goods
entered the Continent. Discussing the effects of the North-Sea blockade on cotton textile
exporters, Edwards writes; “During 1804 and 1805, when the Elbe was blockaded, Germany’s
share of the total cotton exports to Europe dwindled to a mere three percent, while there
was a sharp jump in the trade to Denmark and Prussia.” (1967, p. 55). Merchants’ letters to
Britain were positive about the sales being made from Denmark until as late as August 1807,
noting that large quantities of cotton yarn were being smuggled successfully into France.13By 1806, the French Empire had expanded in size to include all regions of present-day Belgium, parts of
Holland, the entire left bank of the Rhine, regions of present-day Switzerland up to and including Geneva,and regions in the North-West of the Italian peninsula, up to Genoa. In addition, Napoleon’s relatives wereon the thrones of the Kingdom of Holland, the Kingdom of Italy, the Kingdom of Naples and the Kingdomof Spain. The Portuguese royal family had fled to Brazil and Napoleon’s relatives were also in power in keyGerman states (Connelly, 1969).
15

Disruption to trading routes became even more severe with the onset of the Continental
Blockade. The historical events that followed the introduction of the Berlin Decree in 1806
are fairly complex and they involve much back and forth retaliation between Britain and
France, the details of which are not relevant for my purposes.14 The following points are
worth noting regarding the implementation of the blockade. First, the series of laws passed
by Britain and France had the effect of completely wiping out neutral shipping on top of
the evident damage they did to domestic shipping interests (Irwin, 2005; O’Rourke, 2006).
Second, the extent to which Napoleon could ensure successful implementation of the blockade
depended on his ability to keep areas outside of France under his control.
To succeed, Napoleon thus relied on all Continental ports to simultaneously enforce the
blockade. This turned out to be an insurmountable challenge. Two features of the blockade
are key to my empirical strategy: (i) the blockade was, for the most part, well-enforced
along the coast of the French Empire implying that goods intended for French markets had
to enter the country via third-country ports, and; (ii) the blockade was unevenly successful
across Northern and Southern Europe meaning that the traditional north-south direction
of British trading routes were reversed, significantly driving up the costs of accessing some
areas of France. As a result, while Napoleon was able to successfully implement the blockade
along the coastline directly under his control, he could not plug in the gaps in the system
which opened up in regions not directly under his control, and he was unable to stop the
inflow of goods at the French Empire’s overland borders.
2.1 Geographic asymmetry in the success of the blockade
Trade statistics for British exports of manufactured goods and other British produce show
the stark divergence in the success of the blockade across Northern and Southern Europe
as Figure A.3 makes clear. Traditionally, Northern Europe had been the more important14The interested reader can consult Davis and Engerman (2006).
16
market for British exports relative to the Mediterranean, with exports to the former being
about twice as high as exports to the latter. This pattern was completely reversed during the
blockade. While exports to Northern-Europe declined three-fold from peak to trough, trade
to the Mediterranean quadrupled. By 1812, exports to the Mediterranean outnumbered
exports to Northern-Europe five-to-one.
There was a significant amount of time variation in the effectiveness of the blockade in
Northern-Europe. The British were able to smuggle into Northern Europe using two difficult
routes (via Helgoland, a tiny island off the North-Sea coast, and Gothenburg). However, this
was possible only in years where Napoleon was unable to commit sufficient troops to imple-
menting the blockade along the North-Sea coast because of fighting elsewhere. Consistent
with the British using southern trading routes in years when northern smuggling became
particularly difficult, exports to the Mediterranean dropped in 1810, when the northern
smuggling routes were open. Kirkman Finlay, a Glaswegian exporter of cottons noted that
in 1810 “(...) the trade from Helgoland was also destroyed, since the French emperor when-
ever peace was made with Austria again closed up entirely every means of introduction from
that island” (quoted in Edwards (1967, p. 58)).
The reasons for asymmetry in the success of the blockade outside of the French Empire
were two-fold. First, Napoleon was inherently stronger militarily in the north, while the
British had the upper-hand in the Mediterranean. From 1803 onwards, Napoleon had made
significant territorial gains along the coast of the North-Sea, which meant that French troops
were able to directly implement the blockade almost up to the Baltic-Sea in years where
sufficient troops could be committed to stopping smuggling.
In the Mediterranean on the other hand, the French navy was in a desperate state as
early as 1793 a result of an indiosyncratic political event which took place during the French
Revolution. As part of the internal turmoil during the French Revolution, a significant
part of the French Mediterranean fleet was destroyed (Rodger, 2005). Furthermore, as a
17

result a Napoleon’s misadventure in Egypt (interpreted in Britain as an attempt to reach
India), the British made control of the Mediterranean a policy of strategic importance. They
controlled a number of points of primary importance in Southern Europe, such as Gibraltar
and Malta, both of which became important smuggling centers. Furthermore, they exerted
significant influence on Portugal, a historically important ally, and also Sardinia and Sicily.
Crouzet (1987) describes how throughout the Napoleonic Wars, the British were able to
single-handedly control shipping in the Mediterranean, which he called a “British sea”.
Second, and perhaps most catastrophically, the Spanish insurgency against French rule
which started in 1808 meant that the entire Iberian peninsula became open to trade with the
British. This gave the British a direct, overland link to the French Empire. Together with
their control of Gibraltar and shipping on the Mediterranean sea, Southern Europe became
the main outlet for British goods.
2.2 Smuggling routes
While the trade statistics are informative about regional variation, the high level of aggre-
gation does not make it possible to use them as a way to understand how trading routes
between Britain and Continental Europe changed throughout the blockade. To identify these,
I collected data from the Lloyd’s List on ship movements between Britain and Continental
Europe for the period 1787-1814.15 Using these data, I am able to measure the number of
ships sailing between Britain and each Continental European port in any given year. Figure
A.5 shows time series evidence about the uneven effects of the blockade for different parts of
the European coastline. These data confirm regional variation in the blockade found using
British export data. They also show that direct shipping to the French Empire during the
blockade was virtually non-existent. Finally, they make clear that Baltic ports were used
from 1803-1806 when the initial blockade of the Channel and the North-Sea coast was first15The data will be described in more detail in Section 3.
18

imposed.
To smuggle successfully, the British needed access to stable ports directly under their
control in order to set up their merchant infrastructure. Figure 1 contains data from the
Lloyd’s List, disaggregated to the level of European ports, for a year before the disruption to
trade began (1802), and a blockade year (1809). This figure visualizes the dramatic change
in trading routes. Each circle is proportionate to the number of ships sailing between Britain
and a given port for a given year. There were four ports from where the British conducted
a large part of their smuggling during the blockade years; Helgoland and Gothenburg in
Northern-Europe, and Gibraltar and Malta in the Mediterranean. With the exception of
Gothenburg, each of these belonged to the British. They were thus stable ports where
merchants were able to stock inventory.
In the north, both Gothenburg and Helgoland were far from ideal as smuggling centers,
as neither had direct overland access to Northern Europe. As such, they were reliant either
on decreased vigilance along the North-Sea coast (Helgoland), or on Russia and Prussia’s
shifting allegiances which determined whether ships would be allowed entry (Gothenburg).
Marzagalli (1999) describes how merchants from Britain, Holland and Hamburg relocated
their business to Gothenburg in order to organize smuggling routes. However during a
number of months in 1808, when the blockade was fully effective both along the North-
Sea and the Baltic, stocks piled up in Gothenburg as ships arriving from Sweden were
continuously denied entry (Crouzet, 1987).
Once goods were smuggled onto the mainland from Helgoland or Gothenburg, they made
their way into the French Empire along its eastern border. Ellis writes “(...) smuggling was
more active along the inland than the maritime frontiers of the Empire. One reason for
this was the nature of the terrain (...). Another was the proximity of foreign entrepots like
Frankfrurt, Darmstadt, Mannheim, Heidelberg, Rastatt, Kehl and above all Basel. Within
the Empire itself there were many smuggling bases up along the Swiss frontier and down the
19

left-bank of the Rhine.” (Ellis, 1981, p. 203)
Southern Europe proved far more permeable to the entry of British goods. Even prior
to the Spanish insurgency, with Gibraltar firmly in their possession, and significant sway
over much of Portugal, the British had access to a direct, overland connection to France.
Edwards (1967) notes that between 1805 and 1807 (prior to the Spanish insurgency) cotton
textile goods were exported in increasing quantities to Portugal, the Straits of Gibraltar,
Malta and Sicily. The increase in shipping on the West-Mediterranean was driven almost
single-handedly by Malta. Crouzet (1987) describes in detail the key importance played by
Malta, especially for the smuggling of cotton textiles. At one point, 8.8 percent of exports
from Britain were taken into Europe via Malta. French consular reports described markets
for British yarn in Malta and Bosnia.16 With respect to the latter, the consul noted that
there was no domestic demand for yarn in Bosnia, instead it was purchased exclusively by
Viennese merchants for export. Regarding southern smuggling, there is widespread consensus
that a favored route for reaching Continental European markets was that taken via Trieste,
consistent with the existence of markets for cotton yarn in this region (Marzagalli, 1999;
Crouzet, 1987). Heckscher (1922) gives details of a smuggling route that began from Trieste
and brought goods up along the Danube into Germany and finally into France.
Goods were smuggled into France from Spain via the Pyrenees. Archival sources in the
form of hundreds of letters between prefects in south-western departments and the gov-
ernment in Paris provide evidence on the scale of smuggling through the Southern border.
Similarly to the inland border in the east, the mountainous terrain provided smugglers with
a multitude of potential routes which made detection difficult. All border departments
reported a multitude of routes with destinations ranging from Bordeaux and Toulouse to
Paris.17
16Archives Nationales, F12/1859.17Archives Nationales, F7/8777 and F12/8778.
20

One final piece of quantitative evidence from internal trade routes within the French
Empire confirms that with the onset of the Napoleonic Wars, the direction of trade with
Britain was reversed. Figure A.6 shows the time series for trade from Strasbourg up and
down-river along the Rhine. Coinciding with the onset of the blockade, down-river trade (in
the south-north direction) increased dramatically, while up-river trade (in the north-south
direction) remained stable.
3 Data
In this section, I give a brief overview of the most important datasets which I constructed,
and the main variables of interest. A more detailed description of all data, including sources
and potential limitations, can be found in Appendix A.3. Summary statistics are reported
in Table A.2.
3.1 Quantifying the trade cost shock
I use the Lloyd’s List to reconstruct trade routes between Britain and the Continent before
and during the Napoleonic Wars. Using this information, supplemented with historical
evidence presented in Section 2, I calculate the shortest effective distance to London for each
department in the French Empire for both the pre-blockade and blockade period. I account
for one of the most important drivers of increasing trade costs; the difference between water-
and land-borne routes, by calibrating the ratio of the two to match the fact that, during this
period, sailing from Rouen to Marseille was two-thirds of the cost of going overland (Daudin,
2010). Based on these numbers, 1 sea kilometer is equivalent to 0.15 kilometers on land.
To quantify the shortest route prior to the onset of the Napoleonic Wars, I allow trade to
pass through any port that was in use between 1787-1814. To calculate the shortest route
between London and each department during the Napoleonic Wars, I restrict possible routes
21

to the ones that were in operation during the Napoleonic Wars; Helgoland, Gothenburg,
Gibraltar and Malta.18 For any department i, the algorithm then picks the least cost path.
The trade cost shock, defined as the log-change in the shortest route to London for each
department, can be seen in Figure 2, where darker shading shows a larger shock. Effective
distance to London increased from a mean of 380 land kilometers in pre-blockade years to
1,055 land kilometers in blockade years. Consistent with the geographic asymmetry in the
success of the blockade, the trade cost shock decreased in intensity as we move from the
north to the south of the French Empire.
For departments along the English Channel, the trade cost shock is high for two reasons.
First, as they are located geographically close to Britain, their effective distance to London
prior to the blockade was small. Second, as trade routes in northern Europe were disrupted
to a larger extent than those in the south, these departments became furthest away from
London in terms of their effective distance. For example, the department Seine-Maritime
(prefecture Rouen) was situated 86 land-based kilometers from London prior to the blockade,
and became 1,282 land-based kilometers away during the blockade. This is because the
nearest smuggling port was Helgoland. From there, goods needed to make the long journey
overland from the German coastline down to Strasbourg and up north again to reach the
department.19
In contrast, the trade cost shock is relatively small for departments in the south. These
departments were located further from Britain prior to the blockade, meaning that their
effective distance to London was initially high. Moreover, given that trade routes in the
south were disrupted to a smaller extent during the blockade, the general direction of trade
for these regions did not change. While there was an increase in effective distance as a result18Appendix A.3 contains further details on the precise trading routes.19For departments closer to the east such as Seine-Maritime, the shortest route passed through Helgoland
during the blockade, while for more western departments such as Finistere, the shortest routes passed throughGibraltar, in the south.
22
of trade being diverted to land routes, this was much smaller than in the north. For example,
for Pyrenees-Orientales (prefecture Perpignan), the pre-blockade distance was 548 land-based
kilometers, while during the blockade it increased to only 689 land-based kilometers. During
the blockade, the algorithm predicts that goods destined for this department were smuggled
through Gibraltar and only made an overland journey from Barcelona.
To what extent does this measure accurately capture the increase in trading costs between
Britain and a given department in France? One worry is that by excluding any form of
direct smuggling between Britain and France, we are introducing systematic measurement
error. While it is certainly true that some direct smuggling between Britain and France
took place during the Napoleonic Wars, historians seem to agree that this was far riskier
than indirect smuggling routes and this is also confirmed by British export data.20 The fact
that third-country ports were used is indicative of the fact that either direct smuggling was
quantitatively unimportant, or that the risks associated with it were sufficiently high that
taking more circuitous routes was at least as profitable. In either case, this implies that this
measure should do a relatively good job of capturing the change in trade costs.
3.2 Short-run outcome variables
I measure production capacity in mechanized cotton spinning both before (1803) and to-
wards the end of the blockade (1812) using prefectural reports on mechanized cotton spin-
ners. These data are available at the level of the firm for the pre-treatment period, and at
the level of the department across both periods. In 1803, many firms only reported number
of machines and not number of spindles. For these firms, I have imputed the missing ob-
servations using a predictive mean matching model.21 In addition, I observe labor employed
and the vintage of machine used. For the pre-treatment year, I also observe a rich set of20Appendix A.3.2.4 contains a more detailed discussion of this point.21More details on the imputation model and robustness to imputation can be found in Appendix A.3.2.1.
23
covariates for firms, which I exploit in the empirical analysis.
3.3 Long-run outcome variables
I measure outcomes in the long-run along a number of dimensions. I examine persistence
in mechanized spinning capacity using data on spindles for 1840 and 1887 compiled from
industrial firm surveys and annual statistical reports. I impute spindle data for firms with
missing spindles in 1840 using an identical predictive mean matching model to the one used
in the short-run analysis. I observe value-added in agriculture, manufacturing and services
at four points in time across the 19th and 20th century from Combes et al. (2011). Finally, to
examine exporting outcomes, I digitized product level export data for the period 1787-1828
from primary sources.
4 Short-term Empirical Strategy and Results
In this section, I first describe the evolution of mechanized cotton spinning during the
Napoleonic Wars and then turn to estimating the short-run effect of trade protection.
4.1 Mechanized spinning during the Napoleonic Wars
Figure 3 shows the variation in spinning capacity which will be used to estimate the effect of
trade protection on domestic production capacity. The figure shows the spatial distribution
of spinning capacity across the French Empire in 1803, prior to the onset of the Napoleonic
Wars, and in 1812, towards the end of the blockade.
In 1803, a number of departments across the French Empire reported some mechanized
spinning activity. Notably, the department with the largest spinning capacity was located
in the south of the empire around Lyon (Rhone). Between 1803 and 1812, spinning capacity
in the French Empire increased by about 370 percent, from 380,000 to around 1.4 million
24
spindles. A look at Figure 3 reveals the extent to which growth in spinning capacity was
distributed unevenly. Particularly striking is the increase in spinning capacity along the
English Channel, where the increase in the costs of trading with Britain was the largest. By
1812, the largest spinning department in the French Empire was located along the English
Channel (Seine-Maritime). In general, more southern regions of the Empire stagnated. In
particular, south-eastern regions along the border with Spain saw outright decline in all
departments. According to reports from the prefects, many modern firms in these areas
went bankrupt.22
Reports from various departments paint a picture consistent with the numbers. Southern
departments unanimously complained about a collapse in demand, with some blaming com-
petition from foreign yarn.23 The situation in the northern departments could not have been
more different. A report from the Nord stated that there was not much change in activity
in linens, woolens and hemp. In contrast, they stated, trends in mechanized cotton spinning
were completely different. In this branch of the textile sector, despite the high price of raw
cotton, activity had picked up considerably, particularly during 1809 and 1810.24
It is worth bearing in mind, that the large increase in spinning came at a time when
the economic environment was highly uncertain and a number of factors specific to the
cotton industry made any form of development surprising. Importantly, cotton did not enjoy
particularly favorable government support. This point should be taken into consideration
when thinking both about the importance of state support for the cotton industry. The
army used woolen textiles (Heckscher, 1922) and Napoleon remained highly ambivalent of
developments in the cotton industry because of its reliance on imported inputs. In fact,
cotton was the only textile to flourish in the French Empire during the Napoleonic Wars,22Archives Nationales, F12/1570-89. For example, the report from the prefect in Gers states all modern
firms picked up in the 1806 survey had gone bankrupt, while that from the prefect of Haute-Garonne alsostates that many entrepreneurs have shut down.
23Archives Nationales, F12/1570-1590. Foreign yarn is blamed by the Rhone department.24Archives Nationales, F12/1581
25

despite it being the only textile singularly reliant on an imported input traded via sea-routes.
Napoleon was constantly trying to find substitutes for raw cotton. He declared, “it would be
better to use only wool, flax and silk, the products of our own soil, and to proscribe cotton
forever on the Continent” (Heckscher, 1922, p. 277). In 1810, he offered a prize of one million
francs for the invention of a flax-spinning machine and placed high tariffs on imports of raw
cotton, despite the fact that prices had increased significantly during the blockade because
of the disruption to trade.
4.2 Short-run empirical strategy
I now turn to estimating the extent to which trade protection was an important driver of
the adoption of mechanized spinning technology. This would be the case if trade protection
rendered profitable previously unprofitable locations. If entrepreneurs were not competitive
at pre-blockade import prices for British yarn, and they became competitive once disruption
to trade drove up the price of British yarn sufficiently to make entry profitable, we would
expect to find a large effect of trade protection on adoption of mechanized cotton spinning
capacity.
My empirical strategy is based on the well-documented fact that trade diminishes dra-
matically with distance, implying that geographic distance plays a role similar to that of
artificial barriers to trade such as tariffs.25 Geographic distance however is constant over
time, making it generally difficult to disentangle the effect of distance from other regional
characteristics fixed over time. I exploit the fact that while geographic distance between
Britain and French regions did not change during the blockade, the set of possible trading
routes did, leading to changes in effective distance between Britain and a given French re-
gion.26 I use variation in the extent to which effective distance to London changed for a25See Head and Mayer (2014) for a recent discussion on the gravity literature.26In its identification strategy, the paper builds on Frankel and Romer (1999); Feyrer (2009a,b); Pascali
(2015).
26

given department to estimate the short-run effect of trade protection on mechanized cotton
spinning capacity. This leads to the following specification, similar in spirit to a standard
difference-in-difference (DD) estimator;
Sit = αi + δt + γlnDit + εit (1)
Sit is a measure of mechanized spinning capacity in region i at time t, lnDit is the
natural logarithm of effective distance to Britain in department i at time t, αi controls for
time-invariant fixed effects at the regional level, and δt controls for the effect of aggregate
shocks over time. γ is the parameter of interest, which we expect to be positive if trade
protection from the industrial leader, Britain, is an important driver of mechanization.
The unit of observation is the department, which I observe in 1803, prior to the Napoleonic
Wars, and in 1812, towards the end of the blockade. I observe 88 of the 109 departments
which made up the French Empire in both periods. Spinning capacity is measured as the
number of spindles per thousand inhabitants. Spindles are normalized by departmental
population to account for the fact that larger departments may increase spinning capacity
more in response to the same shock simply because of their size. In calculating per capita
variables, I use population measured in 1811 across all short-run and long-run specifications,
to avoid confounding endogenous population responses with the effects on spinning capacity.
Spindles is the standard measure of physical capital in mechanized cotton spinning.27 The
relationship is estimated in levels because of the large number of zeros in the data, however I
show robustness to other types of specifications.28 Effective distance to London in 1803 and
1812 is quantified using the measure described in Section 3. I report standardized coefficients27Importantly, this is not a measure of the number of machines, the productivity of which may change
over time, but rather it is the piece of equipment onto which the thread is twisted. As there is a one to onecorrespondence between spindles and thread spun on a single machine, improvements in technology whichmade it possible for a machine to be equipped with more spindles will be picked up by this measure.
28In particular, 39 and 36 departments reported no mechanized spindles in 1803 and 1812, respectively.28 departments had no mechanized spinning capacity in both 1803 and 1812.
27

in italics and I calculate two types of standard errors; standard errors clustered at the level
of the department to account for serial correlation are reported in parentheses. I also report
standard errors clustered at a slightly higher level of aggregation, to account for spatial
correlation. To do this, I use the administrative system in place before the formation of
departments during the Revolution, the généralités.29
The estimation strategy compares outcomes in regions of the French Empire which re-
ceived a large trade cost shock to regions which received a smaller shock before and after
the disruption to trade. Differently to a standard DD strategy, treatment intensity is con-
tinuous. Furthermore, the nature of the trade cost shock is such that all units are affected
to some extent by the disruption to trade. The latter is not problematic for identification to
the extent that the effect of interest is trade protection, and not the effect of the blockade
itself. Identification relies on there being no shocks contemporaneous to and correlated with
the trade cost shock. There are two main concerns for identification. First, some areas of
the French Empire may simply have been more conducive to the new technology. If these
variables were correlated with the trade cost shock, and they exerted a time-varying effect on
spinning capacity, my identification strategy would be undermined. Second, the differential
trade cost shock took place in the context of the Napoleonic Wars, a highly turbulent period,
raising the concern that forces besides the trade cost shock are driving the effects that I find.
In the following, I address both concerns.29The appealing aspect of clustering at this level is that it is reasonable to expect that economic ties within
these historical regions may be stronger than across them, providing a natural way of clustering at a higherlevel of aggregation. However, it should be noted that for a few robustness checks, the number of clusters atthe level of généralités falls below 30. Given that clustering with too few groups underestimates the standarderror (Bertrand et al., 2004), standard errors clustered at the level of généralités are not reported where thenumber of clusters falls below 30. To keep the two types of standard errors comparable, I have not used thewild-bootstrap method as suggested by Cameron et al. (2008). Appendix A.3.1.17 contains a more detaileddescription of how departments were assigned to généralités.
28

4.3 Baseline results
Table 1 contains the results from estimating equation 1. The scatterplot and the baseline
linear fit is plotted on Figure A.7. The estimated effect of protection from British competition
is large and statistically significant. The point estimate of 33.47 in column (1) implies that
moving from the 25th to the 75th percentile of the trade cost shock leads to a predicted
increase in spinning capacity per capita that is about the same size as mean spinning capacity
in 1812 across departments. To assess the relative size of the shock, moving from the 25th and
75th percentile (roughly 400 land based kilometers) is equivalent to moving a department
along the English Channel to the Spanish border. That would imply moving Bruges, in
present-day Belgium, to Toulouse, in present-day France .
Results are robust to alternative measures of the trade cost shock and different assump-
tions about the functional form of the specification.30 In order to understand the extent
to which treatment intensity is continuous, I include a time-varying intercept for depart-
ments above median latitude, which will soak up much of the binary, north-south variation.
Consistent with continuous treatment intensity, results remain similar in magnitude and
statistically significant (Table A.3, Column (5)).31
As the scatterplot in Figure A.7 makes clear, there is large variation in the extent to
which spinning capacity increased during this time period, raising the concern that the
effect may be driven by a small number of outliers. This is not the case. Results are robust
to winsorizing the top 10% of the observations (Table A.3, Column (8)). Identification
comes not only from regions which were large to begin with, or regions which saw the largest
increases in spinning capacity. This is also apparent from the scatterplot, which shows the
remarkable extent to which all departments that received a high trade cost shock increased
their spinning capacity.30Tables A.3 - A.8 contain the results. These are discussed in detail in Appendix A.2.131For comparison, Tables A.4 presents the results from estimating a standard, binary DD model.
29

How did departments go about scaling up their spinning capacity? Table A.5 exam-
ines the extent to which increases in spinning capacity were driven by firm entry (extensive
margin) relative to pre-existing firms investing in more capacity (intensive margin). Exploit-
ing the fact that firm level data is available for the initial period of the Napoleonic Wars,
in particular during the North Sea blockade (1803-1806), I find that the extensive margin
accounted for the vast majority of the effect, at least during this time period. This is im-
portant, as learning-by-doing models of infant-industry implicitly assume that a financial
constraint inhibits any one entrepreneur from being able to grow sufficiently large in order
to internalize externalities. The fact that most of the increase in capacity was driven by new
firms entering the market is consistent with a mechanism where firms do not internalize the
force which will render production profitable in the long-term.
4.4 Robustness
To address the concern that the trade cost shock may be correlated with factors that render
particular locations more favorable for mechanized cotton spinning, I explore robustness of
the results to the addition of variables measuring natural or acquired locational advantage
(Columns (2) - (7) in Table 1). While fixed effects soak up any time-invariant confounder
correlated with effective distance to London, there is a concern that the time-varying effect of
fundamentals may be driving the results. I include variables one-by-one (Columns (2)-(6)),
and simultaneously (Column (7)). Each variable is interacted with a binary variable that
takes the value of one in the treatment period, and zero otherwise. Across all columns, the
coefficient remains similar in magnitude and statistically significant. Cheap access to power
sources such as fast-flowing streams (measured as mean streamflow in the department) and
distance to the nearest coalfield do not exert a statistically significant time-varying effect.
For the case of France this makes sense; as late as the 1840s, the median cotton spinning firm
used no steam-power and one water-powered engine according to data from Chanut et al.
30
(2000).32
To control for the time-varying effect of access to large centers of urban population, I
construct the reduced form measure of market potential (Harris, 1954) widely used in the
literature. This is defined as ∑j
P opc
distcj, where Popc is the population of city c in 1800 and
distcj is the distance between department j and city c. Data on city populations across the
territory of the French Empire is from Nunn and Qian (2011).
I also control for the time-varying effect of human capital in a flexible way by differ-
entiating between upper-tail knowledge and average human capital following the work of
Squicciarini and Voigtländer (2015). Access to upper-tail knowledge is defined similarly to
market potential, but I replace urban population in 1800 by the number of universities in
existence in 1802 within the territory of the French Empire using data from Valero and
Van Reenen (2015). Average human capital is measured as the proportion of men able to
sign their wedding certificates in 1786 as reported in Furet and Ozouf (1982). While the
coefficient of interest remains positive and significant, it is interesting to note that these
three “acquired” fundamentals enter with a positive sign and are statistically significant.
A different identification concern is that other shocks, contemporaneous to and correlated
with the trade cost shock, may be (at least partly) driving the results. This is of particular
concern given the highly turbulent time period under investigation. I address these concerns
in two ways. First, I consider two other specific shocks contemporaneous to the trade cost
shock which could potentially account for part of the estimated effect. I consider whether a
differential shock to the imported input, raw cotton, or increased market access through the
expansion of the French Empire’s influence across Europe can account for the results. Both
of these effects may give rise to the estimated baseline effect, though through a mechanism32Crafts and Wolf (2014) study of the locational determinants of British cotton mills in the 1840s. The
authors find that water power had a strong positive effect on the number of cotton mill employees in a givenregion, while coal had a negative albeit less robust effect. They found no or only weak evidence for othernatural locational fundamentals such as ruggedness, humidity or hardness of the water.
31

different to that of infant industry. I take a more general approach in the next section
by conducting placebo tests for two other textile industries (woollen spinning and leather
tanning).
An asymmetric shock to the price of imported raw cotton is particularly problematic, as
this would arguably have a disproportionate effect on mechanized cotton spinning, meaning
that the placebo industries I examine in the next section may well be unaffected. To under-
stand the extent to which changes in the price of imported raw cotton may be driving the
results, Figure A.8 shows price data in the north and the south of the French Empire for
different varieties of raw cotton in use at the time; Levantine, Brazilian, US and from French
colonies.33
As the figure makes clear, prices increased markedly during the Napoleonic Wars, but
the shock was fairly symmetric in the north and the south. For the case of Brazilian cotton,
where one specific variety (Pernambuco) can consistently be matched to London prices, it is
also clear that French prices increased to a greater extent than those in Britain. Given that
both British yarn and raw cotton were imported, why would shocks to these products have
a seemingly different spatial pattern?
First, it is important to note that only part of the increase in raw cotton prices can be
attributed to the disruption to trade caused by the blockade. Part of the increase was driven
by a substantial increase in the tariffs on raw cotton, which affected all regions equally.34
Heckscher (1922, pp. 274-276) shows some evidence that prices in the empire were generally
substantially higher than in other Continental European cities, consistent with the fact that
tariffs accounted for part of the increase in French prices.
Second, while the disruption to trade did cause trading routes to shift from sea- to land-33I have not been able to find a data source for raw cotton prices at a regionally more disaggreagted level.
It should be noted that Napoleon experimented with growing cotton around Naples to substitute for othersources. Heckscher (1922, p. 277) cites estimates that put this additional source at not more than 12% ofthe total raw cotton in use in 1812.
34Table A.21 reports tariffs for different varities of raw cotton throughout the period of interest.
32

based ones driving up the price of raw cotton, differently to British yarn, the fundamental
direction of trade did not change. The reason for this is that the source country for raw
cotton was not Britain. Importantly, much of the raw cotton imported to France was coming
from a southerly direction even prior to the blockade. France sourced raw cotton from the
Levant, Brazil (by way of Portugal), its colonies and the US. Given their geographic positions,
Portuguese and Levantine cotton were imported into France from a southerly direction.
Moreover, Bordeaux, located in the south of the Atlantic seaboard was far and above the
most important French port prior to the French Revolution, and as such was the main
distribution center for colonial and US raw cotton (Marzagalli, 1999).35 When the blockade
disrupted trade in raw cotton, it did so to a large extent not by changing the direction of trade
(as was the case for British yarn), but rather by forcing it from predominantly southern sea-
routes to southern land-routes which entered the French Empire from the south or through
the eastern terrestrial border.
Figure A.9 reports quantitative evidence to support the claim that raw cotton entered
France predominantly from a southerly direction. In particular, the share of French imports
by the source region from which they are imported is shown. As can be seen, over 50% of the
imported raw cotton entered France from Southern Europe in all but one year throughout
the blockade. The Atlantic and Eastern border were also relatively important at different
points. Imports from Northern-Europe were below 20% for all years. If anything, it seems
that more southern regions had better access to raw cotton supplies both before, and in
particular, during the blockade consistent with the price evidence. Appendix A.1.3 contains
additional historical evidence that describes the particular trade routes used to import raw
cotton during the blockade.
All else equal, the large increase in raw cotton prices negatively affected French competi-35With the onset of the French Revolutionary Wars, trade was diverted to neutral ports such as Hamburg
in the north and Livorno in the south (Marzagalli, 1999).
33
tiveness. This may explain why some parts of the empire seemed to face tougher competition
from the British during the blockade, despite the fact that all departments were positively
affected by the trade cost shock on the import-competing side.36
The second contemporaneous shock which could explain the results is that of France’s
increased market access throughout this period. This could happen both through the annex-
ation of territories, and through France’s ever increasing indirect influence over large parts
of continental Europe. For example, Ellis (1981, p. 20) describes the aims of the blockade
as follows; “It is suggested here that the loss of French transmarine markets and sources
of supply had some influence on Napoleon’s Blockade. If the vacuum left in the French
economy was to be filled, the key recovery seemed to lie in the resources of the Continental
mainland. New, and it appeared inevitable non-oceanic, supply lines and outlets had to be
found to give the imperial economy the stimulus for expansion, especially from 1807 onwards
when neutral trade lay in the stranglehold of belligerent Powers.”
Table 2 explores robustness of the results to the inclusion of variables that capture chang-
ing market potential throughout the blockade. Column (1) restates the baseline effect for
comparison, while Column (2) adds the baseline measure of market potential defined in the
previous section. Column (3) explores robustness of the results to accounting for the ex-
panding French Empire, which can be thought of as increased internal market access. The
(time-varying) control for market potential is constructed to include any city that formed
part of the Empire in 1803 and 1812, respectively, thereby capturing the effect that annex-
ation had on market access. Figure A.10 shows the spatial distribution of regions annexed
between 1803-1812 and the cities they contain. Relative to Column (1), the coefficient of in-
terest is virtually unchanged, while the time varying measure of market potential is negative36There is a remaining concern that the quality of raw cotton which was in relatively high supply may
have affected incentives to specialize in a particular quality of spun yarn. This may have affected machinechoice as in Hanlon (2015). In the following section, I show that the trade cost shock did not lead to achange in the type of machine used.
34

and insignificant. This is unsurprising. As can be seen from Figure A.10, territories were
annexed to the French Empire in fairly equal amounts both along the northern seaboard and
in the south.
To capture increased access to continental European markets outside of France’s expand-
ing internal market, I calculated the same measure of market potential for regions outside of
the French Empire. In particular, any city belonging to a region classified by Grab (2003, p.
17) to be a French satellite as of 1812 was included.37 I also construct a more conservative
measure that drops all of Spain. As a result of the insurgency against French rule and British
military presence, it is unlikely that French firms enjoyed easy access to Spanish markets.
Columns (4)-(5) show the estimation results when including these controls interacted with
a time dummy (one-by-one). In both cases, the coefficient of interest increases somewhat in
size and remains highly significant. The controls enter with a positive coefficient, but only
the measure excluding Spain is significantly different from zero. While there is some evidence
for increased access to third markets having a positive effect on spinning capacity, given the
distribution of French satellites, the market potential measure is largest for areas along the
eastern border. As such, it is not highly correlated with the trade cost shock and does not
affect the coefficient of interest in a quantitatively important way. Finally, Columns (6)-(7)
show that the results are robust to including both internal and external measures of market
potential simultaneously.
4.5 Placebo tests
The disruption to trade took place during a turbulent period of French history. The second
main concern in terms of identification is the extent to which the estimated effect is indeed37This included most of Germany and Italy, all of Spain, the Illryian provinces and the Grand Duchy
of Warsaw as shown in Figure A.11. Note that the Illryian provinces were in fact annexed to the FrenchEmpire, however as they were geographically separate from the rest of France, it seemed more reasonable toinclude them in the external measure of market potential.
35

driven by differential trade protection as opposed to unobservables correlated with the trade
cost shock. The previous section considered a number of specific shocks that could have
confounded the effect of interest. To gain a better understanding of the forces driving my
results, I conducted a number of placebo tests. Furthermore, in the following section, I
will use the trade cost shock as an instrument for the post-blockade location of mechanized
cotton-spinning capacity. The results presented here also build evidence for the exclusion
restriction, which requires that the shock affects the long-term outcome variables of interest
only through its effect on spinning capacity.
Table 3 presents these results. Columns (1) - (3) estimates the effect of the trade cost
shock on spinning capacity in the pre-treatment period between 1794-1803. In the absence
of similar data for this period, I have constructed an approximation to spindles in 1794. By
exploiting the fact that the firm level data observed in 1803 and 1806 contain the date the
firm was founded, we know which firms were already active in 1794. Using this information,
I approximate spinning capacity at the departmental level in 1794 by using spinning capacity
in 1803 for firms already active in 1794. This assumes that all growth in spinning capacity
took place on the extensive margin of firm entry and that firms did not go bankrupt, neither
of which are likely to hold. However, to the extent that results from Table A.5 for the
period 1803-06 are representative more generally, we should expect the extensive margin to
be the quantitatively more important way in which departments increased spinning capacity.
Column (1) estimates the baseline regression for the pre-treatment period. The estimated
coefficient is small and statistically significant at 5 percent. As Column (2) and (3) show,
the effect is spurious, and seems to be driven by omitting the time-varying effect of market
potential. Inclusion of this variable decreases the point estimate on the trade cost shock
which is no longer differentiable statistically from zero.
Columns (4) and (5) investigate the extent to which other variables of interest in mech-
anized cotton spinning were affected by the trade cost shock. This is important as it helps
36

understand the type of mechanism that may be driving our results. Column (4) finds that
capital-labor ratios (at the level of the department) within mechanized cotton spinning did
not change systematically with the trade cost shock. This is an important finding, as an
alternative mechanism to differential trade protection from the British could be that factor
prices changed differentially across the French Empire rendering the adoption of capital-
biased mechanized spinning technology more attractive in some places. More sophisticated
machines with a larger number of spindles substituted for relatively more labor, and thus
an uneven factor price shock across the French Empire should have altered the capital-labor
ratio at the departmental level, even within mechanized cotton spinning.
Column (5) shows that the trade cost shock was not associated with differential quality
upgrading at the level of the department. I use information on the type of machines in
use in each department to estimate whether the trade cost shock differentially affected the
type of machines firms used. The data allow me to differentiate between two types of
machines “filatures continus” and “mull-jennys”. The former were less modern machines, with
significantly fewer spindles on average per machine, and they were mainly used for spinning
less fine yarn. To the extent that larger investments in the north during the Napoleonic Wars
also entailed upgrading into more modern and capital-intensive machinery, the long term
results which I find in the following section could be driven by a a head-start in upgrading to
higher quality machines. To the contrary, I find that the trade cost shock had no differential
effect on the proportion of newer type machines in a given department.
I subject the results to further scrutiny by asking whether the trade cost shock had a
differential effect on industries which were less intensively traded with Britain and in which
there was no similar change in technology. These placebo tests are informative about the
extent to which the results for mechanized cotton may be driven by mechanisms other than
decreased import competition from the technological leader.
In an influential paper, Crouzet (1964) argued that the period of the French Revolutionary
37

and Napoleonic Wars had a long lasting negative effect on the Atlantic and Mediterranean
seaboard as a result of France being shut out of the Atlantic trade during this period.
Another concern is whether the war effort may have had a spatially differential effect. If the
war effort had a larger effect on those areas of France closer to Britain, this may confound
the coefficient of interest. For both of these identification concerns, the placebo tests are
useful, as these types of confounders should also affect other industries.
Columns (6) and (7) show that the effect which I find for cotton spinning is not present for
two other industries, wool yarn (a direct substitute) and leather.38 Both products were less
intensively traded with Britain, and there was no technological change in either industry.39
For these reasons, the trade shock should not have had a significant effect on the spatial
distribution of activity, which is precisely what I find. This provides further evidence that
the mechanism driving the results is decreased import competition from the technological
leader, France.40
5 Long-term Empirical Strategy and Results
The previous section established that trade protection from Britain had a positive effect
on mechanized cotton spinning capacity in the short-run, while protection lasted. In this
section, I turn to examining the long-run effects of temporary trade protection. First, I
examine outcomes within France by exploiting exogenous variation in post-blockade spinning
capacity. While trading routes with Britain were restored to their post-blockade level after38It should be noted that pre-treatment data for these industries is observed in 1792, rather than in 1803
as is the case for cotton.39Appendix A.1.2 provides additional details on these industries in support of these statements.40Appendix A.4 contains further robustness checks. In Table A.9, I show that the results are robust to
the inclusion of time-varying controls for the historical location of cotton manufacturing, the location ofdownstream weaving, year of incorporation into the French Empire (proxying for both institutional changeand access to a large, internal market), conscription rates (exploring whether results are driven by a spatiallyuneven negative labor supply shock unevenly pushing firms into mechanization through factor price effects)and distance to the nearest Atlantic trading port.
38

the Napoleonic Wars drew to a close, tariff and non-tariff trade barriers were put in place
between the two countries (O’Rourke and Williamson, 2001). For this reason, I also examine
exporting outcomes for France as a whole to establish the extent to which a subset of firms
had become sufficiently productive to export.
5.1 Within country outcomes
An infant industry mechanism would predict that temporary trade protection renders a
location profitable for production not only in the short-term, while protection lasts, but
also in the long-term, once protection is removed.41 To test these predictions, I compare
outcomes in the 19th and 20th century in regions which had higher or lower post-blockade
spinning capacity as a consequence of differing levels of protection.
First, I ask whether the location of mechanized cotton spinning showed persistence over
time. Higher protection from British competition during the blockade increased mechanized
spinning capacity while differential protection lasted. To the extent that temporary protec-
tion rendered locations profitable in the long-run, we would expect to find persistence in
the location of cotton spinning. Second, I examine whether trade protection had aggregate
effects on the regional economy through its effect on mechanized cotton spinning.
I estimate IV specifications of the following form
Yit = α0 + β0tSi(1812) + ηit (2)
Si(1812) = α1 + β1∆ln(Dij) + ωi (3)41Whether the industry becomes competitive in the long-run is partly a question of whether protection
lasts for a sufficiently long time. For example, in the case of a learning-by-doing externality, the size ofthe initial productivity gap and the speed of learning would determine how long protection needs to last.Whether this holds true in this setting is an empirical question.
39

where Yit is the departmental (i) outcome at time t (spinning capacity or industrial
value-added), Si(1812) measures the size of mechanized cotton spinning in department i in
1812 using the same measure of spindles per thousand inhabitants that was used in the
previous section. ∆ln(Dij) is the trade cost shock defined in Section 3.
For the case of long-term outcomes, the main challenge for identification of β0t is omitted
variable bias. In particular, we expect Si(1812) to be correlated with unobservable locational
fundamentals in the error term, ηit, which also affect the outcome variables of interest. To
overcome this challenge, I propose using the trade-cost shock as an instrument for post-
blockade spinning capacity. The identifying assumption for the 2SLS estimation strategy to
render consistent estimates for β0t is that the trade cost shock is uncorrelated with the error
term ηit. To build evidence in support of the validity of the instrument, I show both robust-
ness of the results to the inclusion of measures of natural or acquired locational fundamentals
and to the inclusion of lagged spinning capacity as a control. This latter is important, as it
controls for geographic persistence in the location of mechanized spinning. A placebo test
builds additional support for the validity of the instrument. However, it should be noted
that given the long time horizon over which these effects are estimated, it is not possible
to fully rule out that the estimated effects are (partly) driven by other forces. Any shock
that affects the French economy over the long time horizon that is examined and that is
correlated with the trade cost shock would confound the effect of interest. For this reason, I
view the long term results presented in this section more as suggestive rather than conclusive
evidence on the long-run effects of temporary protection.
The previous analysis has also shown substantial evidence supporting the exclusion re-
striction. This requires trade protection to affect the outcome variables of interest only
through its effect on the size of post-blockade mechanized cotton spinning. Particularly im-
portant in building evidence for this, are the placebo tests showing no similar effect of the
trade cost shock on other industries, and the placebos which find no effect within mecha-
40
nized cotton spinning on capital-labor ratios (no evidence on aggregate factor price shocks)
and the quality of machines (no evidence on differential quality upgrading). According to
these results, the trade cost shock indeed seemed to work only through increasing the size
of mechanized cotton spinning sector.
Nevertheless, as it is not possible to rule out every channel via which the trade cost
shock may effect outcomes Yit, I present both the 2SLS and the reduced form estimates
across all specifications. Even if the exclusion restriction did not hold, the reduced form
specifications would still identify the effect of trade protection on long run outcomes under
the weaker assumption that the trade cost shock is uncorrelated with other determinants of
the outcome variables of interest.
Tables 4 - 6 reports the results from estimating the long-run effects. Across the different
tables, the sample size is different for a number of reasons, including changes in territory and
missing observations for the control variables. Relative to the short-run analysis, the sample
is reduced in size because France lost all territorial gains made throughout the period 1793-
1815. In every instance, I have chosen the largest possible sample on which to estimate the
effects of interest instead of limiting the analysis to a significantly smaller, but consistent
sample. I report two types of standard errors; Huber-White robust standard errors are
reported in parentheses, while standard errors clustered at the level of généralités are reported
in curly brackets.
I begin by estimating persistence in the location of mechanized cotton spinning. Figure 4
visualizes the spatial distribution of spindles per thousand inhabitants across the departments
for the two time periods which I examine, 1840 and 1887. One of the most striking aspects of
the evolution of spinning capacity over time is the almost complete decline of cotton spinning
in the more southern departments. As more northern departments kept increasing their
spinning capacity throughout the 19th century, southern departments not only stagnated,
41

but actually shrank in absolute size.42 This is the strongest evidence against an alternative
mechanism under which slowly diffusing technology from Britain drives the results. In this
case, we would expect more southern departments to expand over time as they acquire
technology, which is the opposite of what I find.
Table 4 contains the estimation results that examine persistence in the location of mech-
anized cotton spinning.43 Spinning capacity in 1840 and 1887 is measured as the number
of mechanized spindles per thousand inhabitants, holding population unchanged at its 1811
level. Unsurprisingly, the OLS estimates (Columns (1) - (8) point to a positive and signifi-
cant correlation between spinning capacity in 1812 and subsequent years. The forces which
rendered a particular department attractive for mechanized cotton spinning in 1812 showed
a high degree of persistence across time. More interestingly, the 2SLS estimates (Columns
(9) - (16)), which use only variation in post-blockade mechanized cotton spinning activity
caused by uneven trade protection, are positive and significant. Across both OLS and 2SLS
specifications, I estimate the coefficient without additional controls, and add lagged spin-
ning capacity (measured in 1803) and additional controls measured prior to the blockade.
The preferred specification includes lagged spinning capacity only as an additional control
(Columns (10) and (14)), as it is possible that additional, predetermined controls affect
outcomes through lagged spinning capacity and are thus already controlled for.
The local average treatment effect of one additional spindle in 1812 is about 2.1-3.4
spindles in 1840 and 4.7-6.2 spindles in 1887.44 Inclusion of pre-blockade spinning capacity
as a control is suggestive of the extent to which the blockade caused a significant shift in pre-42Depending on the size of internal trade costs, a less competitive mechanized spinning sector in southern
departments may either survive or decline in the long-run according to the infant industry model. Internaltransportation costs in France were falling throughout the 19th century (Combes et al., 2011) because ofinnovations such as the railroad. It is therefore plausible that less competitive regions which managed tosurvive foreign and internal competition during the blockade, were outcompeted once domestic competitionbecame tougher as regional markets became more integrated throughout the 19th century.
43The first stage and reduced form are reported in Table A.10.44I have not been able to find data on departmental cotton spinning capacity for the 20th century, which
is why the analysis ends in the late 19th century.
42

blockade mechanization patterns; across all specifications, pre-blockade spinning capacity
enters with a negative sign and is generally statistically significant.45 Moreover, inclusion
of lagged spinning capacity strengthens the first stage. For specifications that include this
variable, the Kleibergen-Papp F-statistic for the first stage is consistently above 10, the
rule of thumb suggested by Staiger and Stock (1997) when assessing whether a specification
suffers from a weak instrument problem.46
In thinking about these effects, it is important to note that the size of the cotton industry
grew dynamically throughout the 19th century.47 These results therefore suggest that even
in a dynamically expanding industry, first mover advantage had very long-lasting effects in
the sense that regions which developed their cotton spinning industries early, because of
idiosyncratically high protection, were the ones which kept expanding as the industry grew.
I assess the validity of the instrument by estimating the effect of post-blockade spinning
capacity on pre-blockade spinning capacity in Table 5. The OLS estimates (Columns (1) -
(2)) are positive and statistically significant, highlighting the endogeneity problem caused by
omitted variable bias. The estimated local average treatment effect, however, is statistically
indistinguishable from zero (Columns (3)-(4)) as are the coefficients for the reduced form
(Columns (7)-(8)). In fact, the baseline IV point estimate is 0.03. This constitutes some
support for the validity of the instrument.
Second, I estimate the effect on aggregate departmental value added per capita in in-
dustry in order to understand the wider implications of adopting this technology. Given
the importance of cotton manufacturing for 19th century development, it is plausible that
adopting frontier technology from Britain caused positive aggregate effects for the regional45The raw correlation between spinning capacity in 1803 and 1812 is 0.66.46It should be noted that for specifications estimated for the 1840s data, the reduced forms are marginally
not significant at conventional levels in some cases.47The number of spindles grew from about 1 million in 1812, to 3 million in 1840 and almost 5 million
in 1887. This is despite the fact that France lost one of its largest spinning regions, Alsace, to Germany in1871.
43
economy. Mechanized cotton spinning was one of the most innovative industries in the 19th
century. Crafts (1985) estimates that a full 25 percent of TFP growth between 1780-1860
was accounted for by cotton manufacturing alone. In France, 20 percent (15 percent) of
industrial employment was in cottons in 1840 (1860) according to data from Chanut et al.
(2000). It could also be the case, however, that if France did not have a latent comparative
advantage in mechanized cotton spinning, then specialization in this sector led to negative
effects on the adopting regional economies because of the misallocation of resources from
their most productive use.
I observe industrial value added at four points in time; 1860, 1896, 1930 and 2000 using
data from Combes et al. (2011). I divide these variables by departmental population in 1811
to avoid confounding effects on industrial value added with endogenous population responses.
Table 6 contains the results from estimating equation 2 without additional controls and
adding lagged spinning capacity as a control.48 The OLS estimates in Columns (1) - (8)
are large, positive, statistically significant and remarkably stable for all years through 2000.
The forces which drove some departments to adopt the frontier technology in cotton spinning
in the early 19th century also led them to specialize in the highest value added industries
throughout the last two centuries. Columns (9) - (16) use only variation in post-blockade
spinning capacity caused by the uneven trade cost shock. The estimated local average
treatment effect of having one more spindle in 1812 for industrial value added per capita is
positive and significant in 1860. The point estimate decreases in size over time and from
1896 onwards, the coefficient is longer distinguishable statistically from zero.
The results are robust to the addition of departmental controls and to calculating indus-
trial value added per capita in terms of contemporaneous population (Tables A.12 and A.14
in Appendix A.4). I find no statistically significant effect across all years on value added
in agriculture or services (Tables A.16 and A.18 in Appendix A.4). Taking these results48The first stage and reduced form are reported in Table A.11.
44

together, temporary protection enabled regions to adopt and develop an industry which was
highly innovative throughout the 19th century. Not only did the specific industry develop
in the long-term, but the results point to higher aggregate industrial economic activity in
these regions, though this dissipated over time. Rather than diverting resources from their
most productive use, it seems to be the case that trade protection enabled regions in France
to enter a sector which was key to 19th century development.
5.2 Exporting outcomes
I now turn to examining exporting outcomes. The presence of tariff and non-tariff barriers
implies that the within country results are not sufficient for showing that some regions of
France had become competitive at international prices. Panels A-C in Figure A.13 show
exporting outcomes. In particular, I plot the level of exports, net exports and exports of
cotton manufactures relative to the same in Britain until 1830.49 As the figures make clear,
the French cotton industry underwent a radical transformation during the period I examine.
Prior to the Napoleonic Wars, France was a net importer of cotton manufactures. By the
end of the blockade, they had become net exporters.50 Exports increased dynamically after
the end of the Napoleonic Wars. By 1828, 7.5% of French exports were in cotton textiles.
France had not only become competitive in export markets, but according to all the available
evidence, the sector became important for the overall economy. Exports increased not only
in levels, but also relative to British exports of the same, suggesting some convergence to
Britain.
Was the adoption of mechanized cotton spinning and the emergence of a competitive
cotton sector simply a matter of time for Continental follower countries? Figure A.14 shows49The data do not differentiate between exports and re-exports until the 1820s. I have omitted re-exports
once they are separately entered.50It is difficult to interpret net exports for the period of the blockade, as smuggling meant that much of
the import data is presumably not reported in the official statistics.
45

evidence to the contrary. As late as 1850, France and Belgium – both part of the French
Empire up to 1815 – had a higher level of cotton spinning activity than other countries.51
The transformation which the French Empire’s cotton industry had undergone in the space
of about fifteen years does not seem to match the experience of other Continental countries
in the early 19th century.
6 Conclusion
This paper has used the natural experiment of the Napoleonic Blockade to estimate the causal
effect of temporary trade protection on the short and long-term development of an infant
industry which was key to nineteenth century development, mechanized cotton spinning.
Temporary protection had a large and positive effect on the short-run adoption of mechanized
cotton spinning technology and on the long-term location of the industry and the economy
more generally.
How do the findings from this particular historical episode inform the broader question
of how openness to trade affects development? An interesting aspect of this episode is the
extent to which the setting seems general to the development experience of many countries
as they enter structural transformation. Differences between Britain and France were small
prior to the invention of mechanized cotton spinning, at least relative to differences between
rich and poor countries today. Seen in this light, it would seem that the extent to which
infant industry mechanisms could inhibit economies from moving into these sectors is large.
However, many of the prerequisites for the development of mechanized spinning were in
place across large areas of the French Empire, meaning that once import competition was
sufficiently low, mechanization was rapidly adopted. This point suggests that in cases where
the underlying conditions are not in place, infant industry protection can turn out to be an51Although by 1850, Austria had similar levels to France but not Belgium.
46

extremely blunt tool, irrespective of whether the policy would be optimal or not.
An additional element of the historical setting studied in this paper that is worth bear-
ing in mind when thinking about the challenges faced by developing countries today is the
restriction on exports of British machinery throughout the period of interest. A recent litera-
ture has shown that the reduction of tariffs on imported intermediate inputs has large effects
on firms’ estimated productivity and product scope (Amiti and Konings, 2007; Goldberg
et al., 2010; Halpern et al., 2015). In a world where developing countries have the ability to
import high quality inputs or capital from abroad, an important question is the extent to
which infant industry mechanisms remain relevant.
To the extent that similar mechanisms are present today, the findings of this paper
should highlight the difficult challenges that developing countries face as they enter structural
transformation. Gaining a deeper understanding of these mechanisms, in particular the
precise source of agglomeration economies and the scope for importing capital to alleviate
infant industry problems, would be a fruitful direction for future research.
ReferencesAllen, R. C. (2009). The British Industrial Revolution in Global Perspective. CambridgeUniversity Press.
Amiti, M. and J. Konings (2007). Trade liberalization, intermediate inputs, and productivity:Evidence from indonesia. The American Economic Review 97 (5), 1611–1638.
Aspin, C. (1964). James Hargreaves and the Spinning Jenny. Helmshore Local HistorySociety.
Baldwin, R. and P. Krugman (1988). Industrial policy and international competition in wide-bodied jet aircraft. In R. E. Baldwin (Ed.), Trade Policy Issues and Empirical Analysis,pp. 45–78. University of Chicago Press.
Baldwin, R. E. and P. Krugman (1986). Market access and international competition: A sim-ulation study of 16k random access memories. National Bureau of Economic Research (No.w1936).
Bertrand, M., E. Duflo, and S. Mullainathan (2004). How much should we trust differences-in-differences estimates. The Quarterly Journal of Economics 119 (1), 249–275.
Cameron, A. C., J. B. Gelbach, and D. L. Miller (2008). Bootstrap-based improvements forinference with clustered errors. The Review of Economics and Statistics 90 (3), 414–427.
47

Chabert, A. (1945). Essai sur les Mouvements des Prix en France de 1798 à 1820. Librairiede Médicis.
Chanut, J.-M., J. Heffer, J. Mairesse, G. Postel-Vinay, F. Boccara, P. Sicsic, A. Straus,and P. Verley (2000). L’Industrie Française au Milieu du 19 e Siècle (Les Enquêtes de laStatistique Générale en France). Recherches d’histoire et de sciences sociales.
Chapman, S. D. (1970). Fixed capital formation in the british cotton industry, 1770–1815.The Economic History Review 23 (2), 235–253.
Chassagne, S. (1978). L’industrie lainière en france à l’époque révolutionnaire et impériale(1790-1810). Voies nouvelles pour l’histoire de la Révolution française, 143–167.
Chassagne, S. (1991). Le coton et ses Patrons: France 1760-1840. Editions de l’Ecole desHautes Etudes en Sciences Sociales.
Combes, P.-P., M. Lafourcade, J.-F. Thisse, and J.-C. Toutain (2011). The rise and fallof spatial inequalities in france: A long-run perspective. Explorations in Economic His-tory 48 (2), 243–271.
Connelly, O. (1969). Napoleon’s Satellite Kingdoms. Free Press.Cookson, G. (1994). Innovation, diffusion, and mechanical engineers in britain, 17801850.The Economic History Review 47 (4), 749–753.
Crafts, N. and N. Wolf (2014). The location of the uk cotton textiles industry in 1838: Aquantitative analysis. The Journal of Economic History 74 (4), 1103–1139.
Crafts, N. F. (1985). British Economic Growth During the Industrial Revolution. ClarendonPress.
Crafts, N. F. (1995). Macroinventions, economic growth, and ‘industrial revolution’ in britainand france. The Economic History Review 48 (3), 591–598.
Crouzet, F. (1964). Wars, blockade, and economic change in europe, 1792–1815. The Journalof Economic History 24 (4), 567–588.
Crouzet, F. (1987). L’économie Britannique et le Blocus Continental: 1806-1813. PressesUniversitaires de France.
Daudin, G. (2010). Domestic trade and market size in late-eighteenth-century france. TheJournal of Economic History 70 (3), 716–743.
David, P. A. (1970). Learning by doing and tariff protection: A reconsideration of thecase of the ante-bellum united states cotton textile industry. The Journal of EconomicHistory 30 (3), 521–601.
Davis, D. R. and D. E. Weinstein (2002). Bombs and break points: The geography ofeconomic activity. American Economic Review 92 (5), 1269–89.
Davis, L. E. and S. L. Engerman (2006). Naval Blockades in Peace and War: An EconomicHistory Since 1750. Cambridge University Press.
Edwards, M. M. (1967). The Growth of the British Cotton Trade, 1780-1815. ManchesterUniversity Press.
Ellis, G. J. (1981). Napoleon’s Continental Blockade: The case of Alsace. Oxford UniversityPress.
Feyrer, J. (2009a). Distance, trade, and income - the 1967 to 1975 closing of the suez canalas a natural experiment. National Bureau of Economic Research (No. w15557).
48
Feyrer, J. (2009b). Trade and income – exploiting time series in geography. National Bureauof Economic Research (No. w14910).
Frankel, J. A. and D. Romer (1999). Does trade cause growth? American EconomicReview 89 (3), 379–399.
Furet, F. and J. Ozouf (1982). Reading and Writing: Literacy in France from Calvin to JulesFerry. Cambridge University Press.
Goldberg, P. K., A. K. Khandelwal, N. Pavcnik, and P. Topalova (2010). Imported interme-diate inputs and domestic product growth: Evidence from india. The Quarterly Journalof Economics 125 (4), 1727–1767.
Grab, A. (2003). Napoleon and the Transformation of Europe. Palgrave Macmillan.Halpern, L., M. Koren, and A. Szeidl (2015, 3703). Imported inputs and productivity. TheAmerican Economic Review 105 (12), 3660.
Hamilton, A. (1791). Report on the Subject of Manufactures.Hanlon, W. W. (2015). Necessity is the mother of invention: Input supplies and directedtechnical change. Econometrica 83 (1), 67–100.
Hansen, J. D., C. Jensen, and E. S. Madsen (2003). The establishment of the danish windmillindustry—was it worthwhile. Review of World Economics 139 (2), 324–347.
Harris, C. D. (1954). The market as a factor in the localization of industry in the unitedstates. Annals of the Association of American Geographers 44 (4), 315–48.
Harrison, A. and A. Rodríguez-Clare (2010). Trade, foreign investment, and industrialpolicy for developing countries. In D. Rodrik and M. Rosenzweig (Eds.), Handbook ofDevelopment Economics, Volume 5, pp. 4039–214. Elsevier.
Head, K. (1994). Infant industry protection in the steel rail industry. Journal of InternationalEconomics 37 (3), 141–165.
Head, K. and T. Mayer (2014). Gravity equations: Workhorse, toolkit, and cookbook. InG. Gopinath, E. Helpman, and K. Rogoff (Eds.), Handbook of International Economics,Volume 4. Gopinath, Gita, Elhanan Helpman, and Kenneth Rogoff, eds. Handbook ofinternational economics. Vol. 4. Elsevier.
Heckscher, E. F. (1922). The Continental System: An Economic Interpretation. ClarendonPress.
Horn, J. (2006). The Path Not Taken: French Industrialization in the Age of Revolution,1750-1830. MIT Press.
Irwin, D. A. (2000). Did late-nineteenth-century us tariffs promote infant industries? evi-dence from the tinplate industry. The Journal of Economic History 60 (2), 335–360.
Irwin, D. A. (2005). The welfare cost of autarky: Evidence from the jeffersonian tradeembargo, 1807–09. Review of International Economics 13 (4), 631–645.
Kline, P. and E. Moretti (2014). Local economic development, agglomeration economies,and the big push: 100 years of evidence from the tennessee valley authority. QuarterlyJournal of Economics 129 (1), 275–331.
Krugman, P. (1987). The narrow moving band, the dutch disease, and the competitiveconsequences of mrs. thatcher: Notes on trade in the presence of dynamic scale economies.Journal of Development Economics 27 (1), 41–55.
49
Krugman, P. and R. L. Elizondo (1996). Trade policy and the third world metropolis. Journalof Development Economics 49 (1), 137–150.
Landes, D. S. (2003). The Unbound Prometheus: Technological Change and Industrial De-velopment in Western Europe from 1750 to the Present. Cambridge University Press.
List, F. (1856). National system of political economy. JB Lippincott Company.Lucas, R. E. (1988). On the mechanics of economic development. Journal of MonetaryEconomics 22 (1), 3–42.
Marzagalli, S. (1999). Les Boulevards de la Fraude: le Négoce Maritime et le Blocus Conti-nental, 1806-1813: Bordeaux, Hambourg, Livourne. Presses Univ. Septentrion.
Matsuyama, K. (1992). Agricultural productivity, comparative advantage, and economicgrowth. Journal of Economic Theory 58 (2), 317–334.
Melitz, M. J. (2005). When and how should infant industries be protected? Journal ofInternational Economics 66 (1), 177–196.
Mokyr, J. (2009). The Enlightened Economy: An Economic History of Britain 1700-1850.Yale University Press.
Nunn, N. and N. Qian (2011). The potato’s contribution to population and urbanization:Evidence from a historical experiment. Quarterly Journal of Economics 126 (2), 593–650.
O’Rourke, K. H. (2006). The worldwide economic impact of the french revolutionary andnapoleonic wars, 1793–1815. Journal of Global History 1 (1), 123–149.
O’Rourke, K. H. and J. G. Williamson (2001). Globalization and History: The Evolution ofa Nineteenth-Century Atlantic Economy. MIT Press.
Pascali, L. (2015). The wind of change: Maritime technology, trade and economic develop-ment.
Puga, D. and A. J. Venables (1999). Agglomeration and economic development: Importsubstitution vs. trade liberalisation. The Economic Journal 109 (455), 292–311.
Redding, S. J. and D. M. Sturm (2008). The costs of remoteness: Evidence from germandivision and reunification. The American Economic Review, 1766–1797.
Riello, G. (2013). Cotton: The Fabric that Made the Modern World. Cambridge UniversityPress.
Rodger, N. A. (2005). The Command of the Ocean: A Naval History of Britain, 1649-1815.WW Norton Company.
Saxonhouse, G. R. and G. Wright (2004). Technological evolution in cotton spinning. InD. Farnie and D. Jeremy (Eds.), The Fibre that Changed the World: The Cotton Industryin International Perspective, 1600-1990s, pp. 129–152. Oxford University Press.
Squicciarini, M. P. and N. Voigtländer (2015). Human capital and industrialization: Evidencefrom the age of enlightenment. Quarterly Journal of Economics 30 (4), 1825–83.
Staiger, D. and J. H. Stock (1997). Instrumental variables regression with weak instruments.Econometrica 65 (3), 557–586.
Valero, A. and J. Van Reenen (2015). The economic impact of universities: Evidence fromacross the globe. mimeo.
Young, A. (1991). Learning by doing and the dynamic effects of international trade. TheQuarterly Journal of Economics 106 (2), 369–405.
50
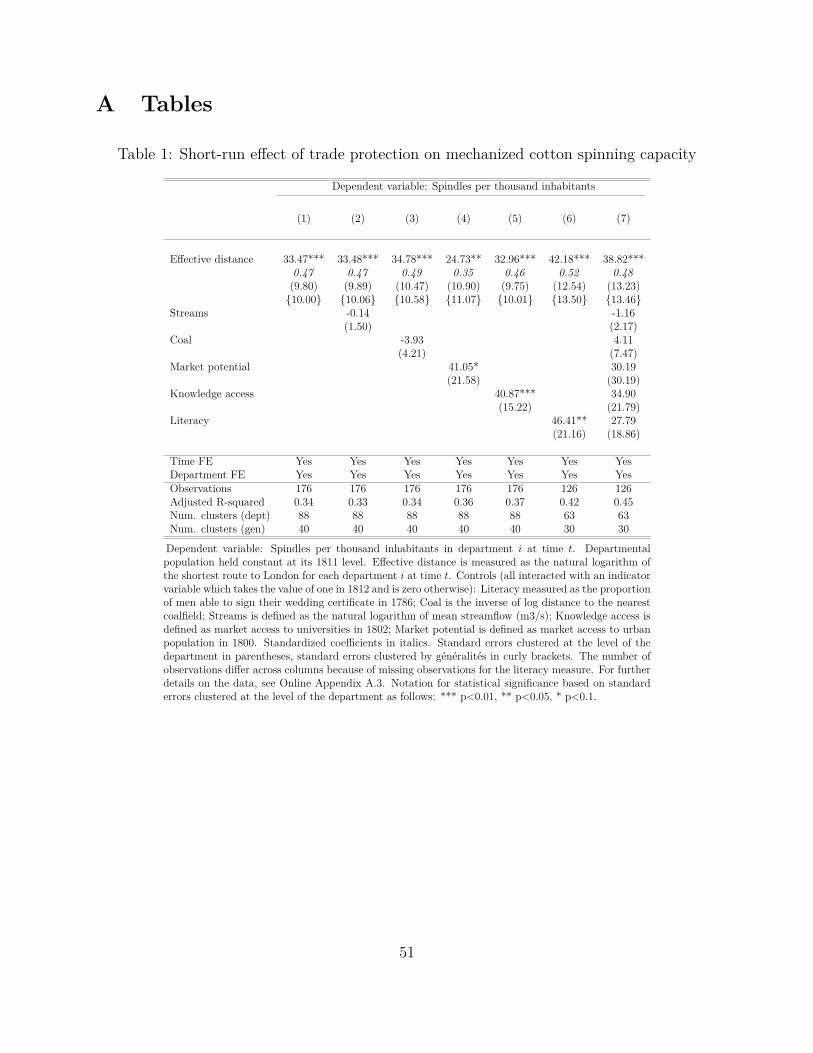
A Tables
Table 1: Short-run effect of trade protection on mechanized cotton spinning capacity
Dependent variable: Spindles per thousand inhabitants
(1) (2) (3) (4) (5) (6) (7)
Effective distance 33.47*** 33.48*** 34.78*** 24.73** 32.96*** 42.18*** 38.82***0.47 0.47 0.49 0.35 0.46 0.52 0.48(9.80) (9.89) (10.47) (10.90) (9.75) (12.54) (13.23){10.00} {10.06} {10.58} {11.07} {10.01} {13.50} {13.46}
Streams -0.14 -1.16(1.50) (2.17)
Coal -3.93 4.11(4.21) (7.47)
Market potential 41.05* 30.19(21.58) (30.19)
Knowledge access 40.87*** 34.90(15.22) (21.79)
Literacy 46.41** 27.79(21.16) (18.86)
Time FE Yes Yes Yes Yes Yes Yes YesDepartment FE Yes Yes Yes Yes Yes Yes YesObservations 176 176 176 176 176 126 126Adjusted R-squared 0.34 0.33 0.34 0.36 0.37 0.42 0.45Num. clusters (dept) 88 88 88 88 88 63 63Num. clusters (gen) 40 40 40 40 40 30 30
Dependent variable: Spindles per thousand inhabitants in department i at time t. Departmentalpopulation held constant at its 1811 level. Effective distance is measured as the natural logarithm ofthe shortest route to London for each department i at time t. Controls (all interacted with an indicatorvariable which takes the value of one in 1812 and is zero otherwise): Literacy measured as the proportionof men able to sign their wedding certificate in 1786; Coal is the inverse of log distance to the nearestcoalfield; Streams is defined as the natural logarithm of mean streamflow (m3/s); Knowledge access isdefined as market access to universities in 1802; Market potential is defined as market access to urbanpopulation in 1800. Standardized coefficients in italics. Standard errors clustered at the level of thedepartment in parentheses, standard errors clustered by généralités in curly brackets. The number ofobservations differ across columns because of missing observations for the literacy measure. For furtherdetails on the data, see Online Appendix A.3. Notation for statistical significance based on standarderrors clustered at the level of the department as follows: *** p<0.01, ** p<0.05, * p<0.1.
51
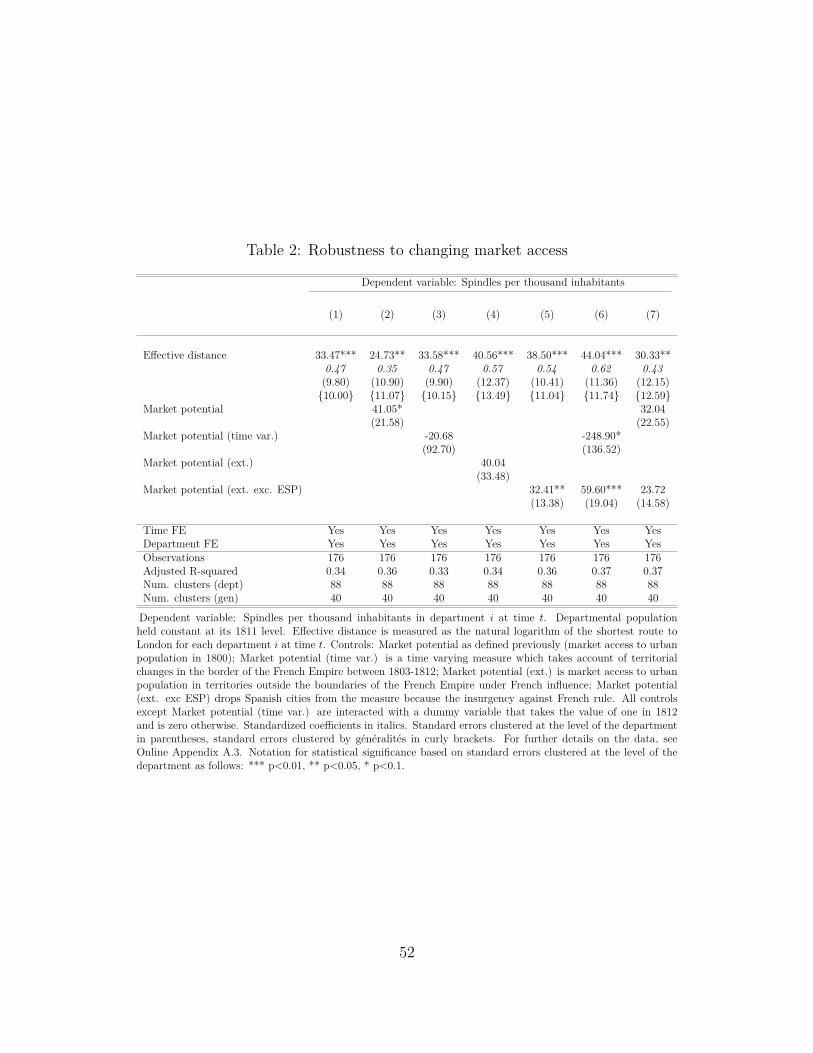
Table 2: Robustness to changing market access
Dependent variable: Spindles per thousand inhabitants
(1) (2) (3) (4) (5) (6) (7)
Effective distance 33.47*** 24.73** 33.58*** 40.56*** 38.50*** 44.04*** 30.33**0.47 0.35 0.47 0.57 0.54 0.62 0.43(9.80) (10.90) (9.90) (12.37) (10.41) (11.36) (12.15){10.00} {11.07} {10.15} {13.49} {11.04} {11.74} {12.59}
Market potential 41.05* 32.04(21.58) (22.55)
Market potential (time var.) -20.68 -248.90*(92.70) (136.52)
Market potential (ext.) 40.04(33.48)
Market potential (ext. exc. ESP) 32.41** 59.60*** 23.72(13.38) (19.04) (14.58)
Time FE Yes Yes Yes Yes Yes Yes YesDepartment FE Yes Yes Yes Yes Yes Yes YesObservations 176 176 176 176 176 176 176Adjusted R-squared 0.34 0.36 0.33 0.34 0.36 0.37 0.37Num. clusters (dept) 88 88 88 88 88 88 88Num. clusters (gen) 40 40 40 40 40 40 40
Dependent variable: Spindles per thousand inhabitants in department i at time t. Departmental populationheld constant at its 1811 level. Effective distance is measured as the natural logarithm of the shortest route toLondon for each department i at time t. Controls: Market potential as defined previously (market access to urbanpopulation in 1800); Market potential (time var.) is a time varying measure which takes account of territorialchanges in the border of the French Empire between 1803-1812; Market potential (ext.) is market access to urbanpopulation in territories outside the boundaries of the French Empire under French influence; Market potential(ext. exc ESP) drops Spanish cities from the measure because the insurgency against French rule. All controlsexcept Market potential (time var.) are interacted with a dummy variable that takes the value of one in 1812and is zero otherwise. Standardized coefficients in italics. Standard errors clustered at the level of the departmentin parentheses, standard errors clustered by généralités in curly brackets. For further details on the data, seeOnline Appendix A.3. Notation for statistical significance based on standard errors clustered at the level of thedepartment as follows: *** p<0.01, ** p<0.05, * p<0.1.
52

Table 3: Falsification tests
Pre-treatment period: 1794-1803 Treatment period: 1803-1812
(1) (2) (3) (4) (5) (6) (7)Spind. Spind. Spind. K/L Mach. Wool Leather
Effective distance 5.890** 3.319 2.076 -0.070 -0.021 -2.246 -0.0190.184 0.104 0.055 -0.067 -0.055 -0.067 -0.134(2.943) (3.560) (4.902) (0.258) (0.102) (2.925) (0.014){3.222} {4.005} {5.691} {3.107}
Market potential 12.080** 9.467(5.852) (8.928)
Streams -0.100(0.534)
Coal 2.527(3.227)
Knowledge access 4.927(5.738)
Literacy 0.438(3.326)
Time FE Yes Yes Yes Yes Yes Yes YesDepartment FE Yes Yes Yes Yes Yes Yes YesObservations 176 176 126 78 74 138 116Adjusted R-squared 0.187 0.211 0.154 0.325 0.114 0.182 0.054Num. clusters (dept) 88 88 63 39 37 69 58Num. clusters (gen) 40 40 30 23 21 32 28Columns (1) - (3): Pre-treatment trends test for mechanized cotton spinning. Columns (4) - (5): Falsification testfor other outcome variables in mechanized cotton spinning. Columns (6) - (7): Placebo test for two other industries;wool spinning and leather tanning. Dependent variable in Columns (1) - (3): Number of spindles per thousandinhabitants in department i in 1794 and 1803. Departmental population held constant at its 1811 level. Column (4):Capital-labor ratio in mechanized cotton spinning in department i at time t measured as the log number of spindlesper unit of labor employed. Column (5): Capacity in different vintages of machines measured as the proportion ofspindles used in mule jennys relative to spindles in “filatures continus” in department i at time t. Column (6): Laboremployed in woolen spinning per thousand inhabitants in department i at time t. Employment measured in 1792and 1811. Column (7): Number of leather tanning firms in department i at time t. Number of firms measured in1794 and 1811. Effective distance is calculated as the natural logarithm of the shortest route to London for eachdepartment i at time t. Controls (all interacted with an indicator variable which takes the value of one in 1812 andis zero otherwise): Literacy measured as the proportion of men able to sign their wedding certificate in 1786; Coalis the inverse of log distance to the closest coalfield, Streams is defined as the natural logarithm of mean streamflow(m3/s); Knowledge access is defined as market access to universities in 1802; Market potential is defined as marketaccess to urban population in 1800. The number of observations differ across columns (1) - (3) because of missingobservations for the literacy measure. Columns (5) - (6) are estimated on the subsample of departments with positivespinning capacity in both 1803 and 1812. The dependent variable is only defined for these departments. Samplesize differs across columns as not all departments reported labor employed and the type of machine used. Columns(6) - (7) are estimated on the largest sample for which the data are available. For further details on the data, seeOnline Appendix A.3. Standardized coefficient in italics. Standard errors clustered at the level of the department inparentheses, standard errors clustered by généralités in curly brackets. The latter is not reported in cases where thenumber of généralités is less than 30. Notation for statistical significance based on robust standard errors clusteredat the level of the department as follows: *** p<0.01, ** p<0.05, * p<0.1.
53
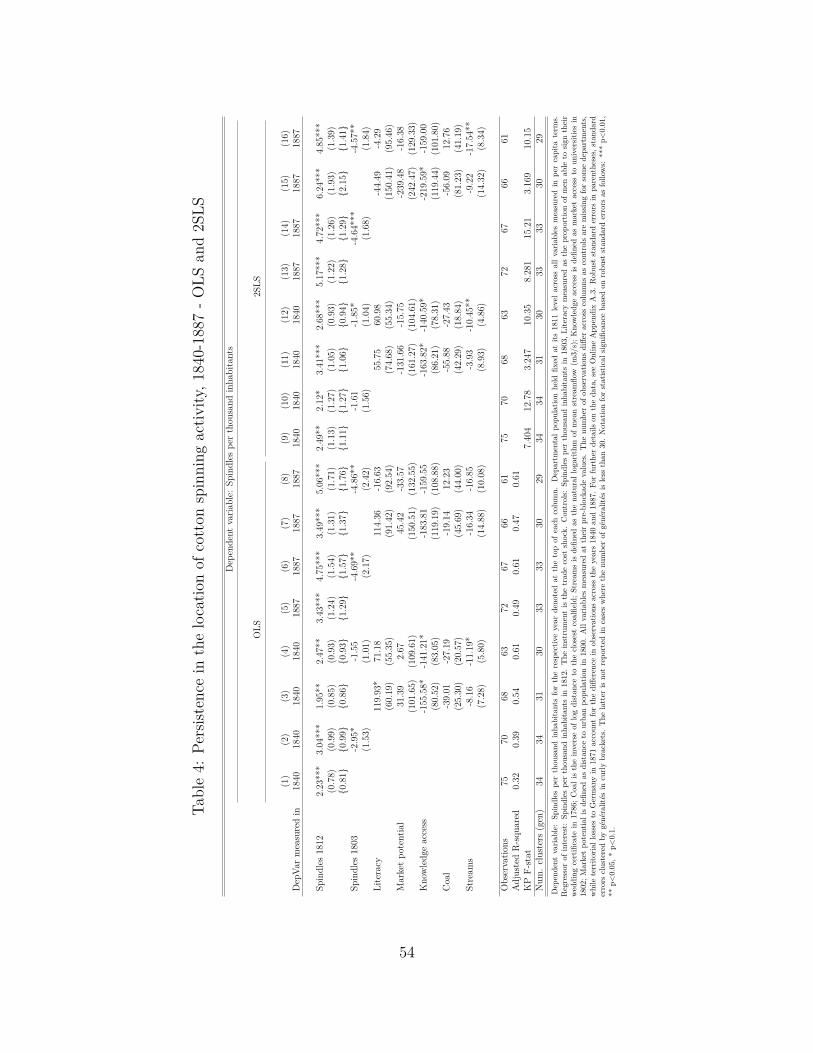
Table4:
Persist
ence
inthelocatio
nof
cotton
spinning
activ
ity,1
840-1887
-OLS
and2S
LS
Dep
endent
varia
ble:
Spindles
perthou
sand
inha
bitants
OLS
2SLS
(1)
(2)
(3)
(4)
(5)
(6)
(7)
(8)
(9)
(10)
(11)
(12)
(13)
(14)
(15)
(16)
DepVa
rmeasuredin
1840
1840
1840
1840
1887
1887
1887
1887
1840
1840
1840
1840
1887
1887
1887
1887
Spindles
1812
2.23***
3.04***
1.95**
2.47**
3.43***
4.75***
3.49***
5.06***
2.49**
2.12*
3.41***
2.68***
5.17***
4.72***
6.24***
4.85***
(0.78)
(0.99)
(0.85)
(0.93)
(1.24)
(1.54)
(1.31)
(1.71)
(1.13)
(1.27)
(1.05)
(0.93)
(1.22)
(1.26)
(1.93)
(1.39)
{0.81}
{0.99}
{0.86}
{0.93}
{1.29}
{1.57}
{1.37}
{1.76}
{1.11}
{1.27}
{1.06}
{0.94}
{1.28}
{1.29}
{2.15}
{1.41}
Spindles
1803
-2.95*
-1.55
-4.69**
-4.86**
-1.61
-1.85*
-4.64***
-4.57**
(1.53)
(1.01)
(2.17)
(2.42)
(1.56)
(1.04)
(1.68)
(1.84)
Literacy
119.93*
71.18
114.36
-16.63
55.75
60.98
-44.49
-4.29
(60.19)
(55.35)
(91.42)
(92.54)
(74.68)
(55.34)
(150.41)
(95.46)
Marketpo
tential
31.39
2.67
45.42
-33.57
-131.66
-15.75
-239.48
-16.38
(101.65)
(109.61)
(150.51)
(132.55)
(161.27)
(104.61)
(242.47)
(129.33)
Kno
wledg
eaccess
-155.58*
-141.21*
-183.81
-159.55
-163.82*
-140.59*
-219.59*
-159.00
(80.52)
(83.05)
(119.19)
(108.88)
(86.21)
(78.31)
(119.44)
(101.80)
Coal
-39.01
-27.19
-19.14
12.23
-55.88
-27.43
-56.09
12.76
(25.30)
(20.57)
(45.69)
(44.00)
(42.29)
(18.84)
(81.23)
(41.19)
Stream
s-8.16
-11.19*
-16.34
-16.85
-3.93
-10.45**
-9.22
-17.54**
(7.28)
(5.80)
(14.88)
(10.08)
(8.93)
(4.86)
(14.32)
(8.34)
Observatio
ns75
7068
6372
6766
6175
7068
6372
6766
61AdjustedR-squ
ared
0.32
0.39
0.54
0.61
0.49
0.61
0.47
0.61
KP
F-stat
7.404
12.78
3.247
10.35
8.281
15.21
3.169
10.15
Num
.clusters
(gen)
3434
3130
3333
3029
3434
3130
3333
3029
Dep
endent
varia
ble:
Spindles
perthou
sand
inha
bitantsfortherespectiv
eyear
deno
tedat
thetopof
each
column.
Departm
entalpo
pulatio
nheld
fixed
atits
1811
levelacross
allvaria
bles
measuredin
percapita
term
s.Regressor
ofinterest:Sp
indles
perthou
sand
inha
bitantsin
1812.The
instrumentis
thetrad
ecost
shock.
Con
trols:
Spindles
perthou
sand
inha
bitantsin
1803,L
iteracy
measuredas
theprop
ortio
nof
men
able
tosig
ntheir
wedding
certificate
in1786;C
oalistheinverseof
logdistan
ceto
theclosestcoalfield;S
treamsis
defin
edas
thena
turallogarith
mof
meanstream
flow
(m3/s);K
nowledg
eaccess
isdefin
edas
marketaccess
toun
iversit
iesin
1802;M
arketpo
tentialisdefin
edas
distan
ceto
urba
npo
pulatio
nin
1800.Allvaria
bles
measuredat
theirpre-blocka
devalues.The
numbe
rof
observations
diffe
racross
columns
ascontrols
aremiss
ingforsomedepa
rtments,
while
territo
riallossesto
German
yin
1871
accoun
tforthediffe
rencein
observations
across
theyears1840
and1887.Fo
rfurtherdetails
ontheda
ta,s
eeOnlineApp
endixA.3.Rob
uststan
dard
errors
inpa
rentheses,
stan
dard
errors
clusteredby
généralités
incurly
brackets.The
latter
isno
trepo
rted
incaseswhere
thenu
mbe
rof
généralités
isless
than
30.Notationforstatist
ical
significan
ceba
sedon
robu
ststan
dard
errors
asfollo
ws:
***p<
0.01,
**p<
0.05,*
p<0.1.
54
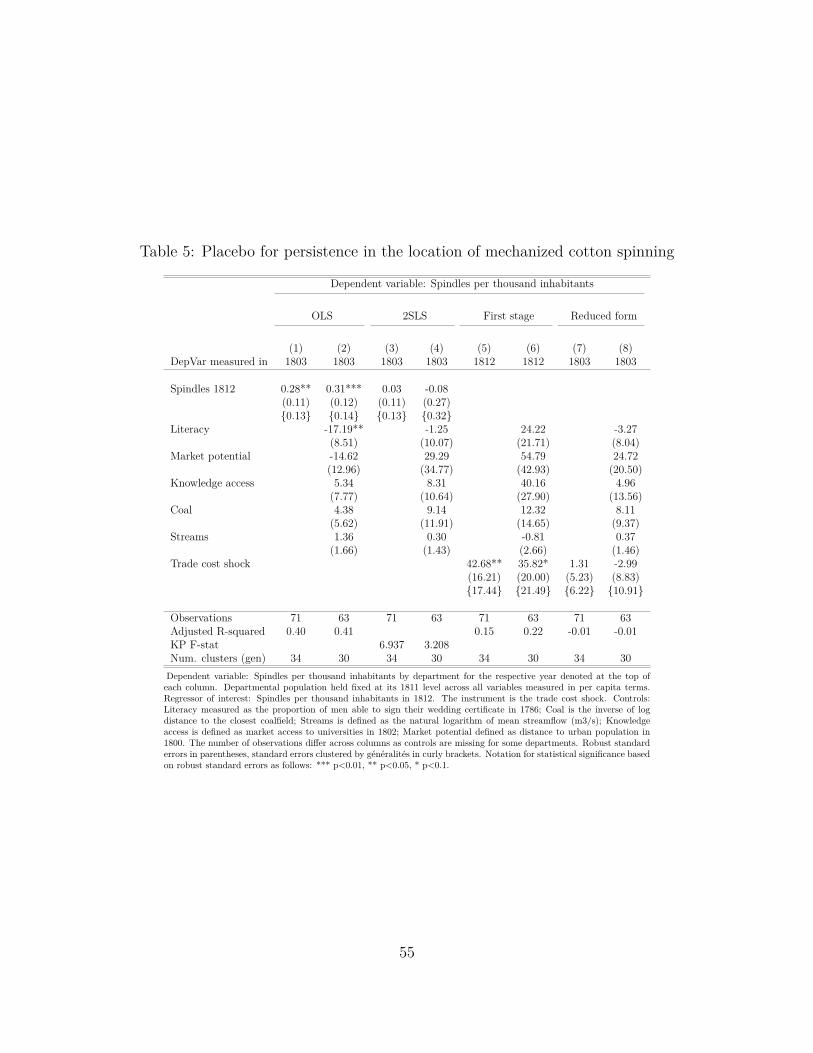
Table 5: Placebo for persistence in the location of mechanized cotton spinning
Dependent variable: Spindles per thousand inhabitants
OLS 2SLS First stage Reduced form
(1) (2) (3) (4) (5) (6) (7) (8)DepVar measured in 1803 1803 1803 1803 1812 1812 1803 1803
Spindles 1812 0.28** 0.31*** 0.03 -0.08(0.11) (0.12) (0.11) (0.27){0.13} {0.14} {0.13} {0.32}
Literacy -17.19** -1.25 24.22 -3.27(8.51) (10.07) (21.71) (8.04)
Market potential -14.62 29.29 54.79 24.72(12.96) (34.77) (42.93) (20.50)
Knowledge access 5.34 8.31 40.16 4.96(7.77) (10.64) (27.90) (13.56)
Coal 4.38 9.14 12.32 8.11(5.62) (11.91) (14.65) (9.37)
Streams 1.36 0.30 -0.81 0.37(1.66) (1.43) (2.66) (1.46)
Trade cost shock 42.68** 35.82* 1.31 -2.99(16.21) (20.00) (5.23) (8.83){17.44} {21.49} {6.22} {10.91}
Observations 71 63 71 63 71 63 71 63Adjusted R-squared 0.40 0.41 0.15 0.22 -0.01 -0.01KP F-stat 6.937 3.208Num. clusters (gen) 34 30 34 30 34 30 34 30Dependent variable: Spindles per thousand inhabitants by department for the respective year denoted at the top ofeach column. Departmental population held fixed at its 1811 level across all variables measured in per capita terms.Regressor of interest: Spindles per thousand inhabitants in 1812. The instrument is the trade cost shock. Controls:Literacy measured as the proportion of men able to sign their wedding certificate in 1786; Coal is the inverse of logdistance to the closest coalfield; Streams is defined as the natural logarithm of mean streamflow (m3/s); Knowledgeaccess is defined as market access to universities in 1802; Market potential defined as distance to urban population in1800. The number of observations differ across columns as controls are missing for some departments. Robust standarderrors in parentheses, standard errors clustered by généralités in curly brackets. Notation for statistical significance basedon robust standard errors as follows: *** p<0.01, ** p<0.05, * p<0.1.
55

Table6:
Indu
stria
lvalue
addedpe
rcapita
outcom
es,1
860-2000
-OLS
and2S
LS
Dep
endent
varia
ble:
Natural
logarit
hmof
indu
stria
lvalue
addedpe
rcapita
OLS
2SLS
(1)
(2)
(3)
(4)
(5)
(6)
(7)
(8)
(9)
(10)
(11)
(12)
(13)
(14)
(15)
(16)
DepVa
rmeasuredin
1860
1860
1896
1896
1930
1930
2000
2000
1860
1860
1896
1896
1930
1930
2000
2000
Spindles
1812
0.0047***
0.0037***
0.0039***
0.0025*
0.0053***
0.0040**
0.0041***
0.0025**
0.0079***
0.0075***
0.0012
0.0010
0.0015
0.0016
0.0040
0.0031
0.50
070.39
250.37
710.23
940.52
440.39
650.41
410.25
270.84
330.79
870.11
730.09
370.14
610.15
900.40
320.31
28(0.0009)
(0.0012)
(0.0010)
(0.0012)
(0.0013)
(0.0016)
(0.0011)
(0.0012)
(0.0026)
(0.0026)
(0.0026)
(0.0026)
(0.0029)
(0.0030)
(0.0025)
(0.0026)
{0.0010}
{0.0013}
{0.0011}
{0.0013}
{0.0014}
{0.0016}
{0.0011}
{0.0012}
{0.0021}
{0.0021}
{0.0024}
{0.0025}
{0.0029}
{0.0028}
{0.0024}
{0.0025}
Spindles
1803
0.0035*
0.0048**
0.0046**
0.0053***
-0.0020
0.0070*
0.0081**
0.0044
(0.0020)
(0.0019)
(0.0020)
(0.0017)
(0.0035)
(0.0036)
(0.0041)
(0.0032)
Observatio
ns73
6871
6673
6873
6873
6871
6673
6873
68AdjustedR-squ
ared
0.2401
0.2414
0.1298
0.1369
0.2648
0.2772
0.1598
0.1718
KP
F-stat
7.079
12.60
7.994
15.25
7.079
12.60
7.079
12.60
ClustersGen
3333
3232
3333
3333
3333
3232
3333
3333
Dep
endent
varia
ble:
Natural
logarit
hmof
indu
stria
lvalue
addedpe
rcapita
measuredat
thelevelo
fthe
depa
rtment.
Forthefirst
stageregressio
ns,d
ependent
varia
bleis
spindles
perthou
sand
inha
bitantsin
1812.Departm
entalp
opulationheld
fixed
atits
1811
levela
crossallv
ariables
measuredin
percapita
term
s.Regressor
ofinterest:Sp
indles
perthou
sand
inha
bitantsin
1812.The
instrumentis
thetrad
ecost
shock.
Stan
dardized
coeffi
cientin
italic
s.The
numbe
rof
observations
diffe
racross
columns
becauseof
territo
riallossesto
German
ybe
tween1871
-1919.
Forfurtherdetails
ontheda
ta,s
eeOnlineApp
endixA.3.Rob
uststan
dard
errors
inpa
rentheses,
stan
dard
errors
clusteredby
généralités
incurly
brackets.Notationforstatist
ical
significan
ceba
sedon
robu
ststan
dard
errors
asfollo
ws:
***p<
0.01,*
*p<
0.05,*
p<0.1
56

B Figures
(a) 1802 (pre-blockade) (b) 1809 (blockade)
Figure 1: Number of ships traveling between the given port and Britain. Source: Lloyd’sList.
Figure 2: Trade cost shock
57

(a) Spindles per ’000 inhabitants, 1803 (b) Spindles per ’000 inhabitants, 1812
Figure 3: Variation used: short-run regressions
Note: Departments observed for only one time period not shown to ensure comparabilityacross the two time periods.
(a) Spindles per ’000 inhabitants, 1840 (b) Spindles per ’000 inhabitants, 1887
Figure 4: Variation used: long-run persistence regressions
Note: The label "X" denotes the two departments, Haut-Rhin and Bas-Rhin, ceded to Ger-many 1871 - 1918. Data for 1887 is not available for these regions. Departments not observedin 1812 not shown as these are missing from the regressions as the regressor of interest is notobserved.
58