
Temporary Job Protection and TFP Growth in EU economies ... · Temporary Job Protection and TFP...
39
1 Temporary Job Protection and TFP Growth in EU economies Mirella Damiani*, Fabrizio Pompei*and Andrea Ricci** ABSTRACT In recent years, one of the main innovations in European labour markets has been new legislation for temporary job contracts. Reforms for these types of contracts have characterised various countries and have been more important than changes in rules for regular contracts. The focus of the present paper is to analyse the impact of these reforms on cross-national and sectoral differences in Total Factor Productivity (TFP) in fourteen European countries and ten sectors from 1995 to 2007. By estimating their effects with a “difference-in-difference” approach, we find that deregulation of temporary workers negatively influences TFP growth rates in European economies. Within sectoral analysis, the effects of these labour liberalisation policies are greater in industry where firms are more used to opening short-term positions. Our estimates also confirm that TFP has improved more in sectors where PMR is lower, which means that organisational improvements, captured by the residual measure TFP, are more likely to be adopted where firms operate in competitive product markets. Keywords: productivity, labour regulation JEL Classifications: O40, O43; O47; J58. *Department of Economics, Finance and Statistics, University of Perugia, Via Pascoli 20, 06123 Perugia, Italy * Area di Analisi e Valutazione delle Politiche per l’Occupazione, ISFOL, Corso Italia n. 33, 00198 Rome, Italy. The contents of this publication are solely the responsibility of the author and do not necessarily represent the official view of ISFOL 1. Introduction 1 The present paper analyses productivity disparities in EU economies over a period (1995-2007) which has witnessed a marked slow-down in average European efficiency growth and significant intra-Europe cross-country diversities. Other studies have shown that, from the mid- 1990s until 2005, EU countries have lost ground with respect to the US, not because of adverse changes in labour composition, or insufficient rates of capital accumulation, but due to the lack 1 We are grateful to the seminar participants of the Workshop ‘Capital deepening labour flexibility and productivity’, Rome 2010, and XVIII AISSEC Conference, Macerata 2011. Special thanks to Wendy Carlin, Paolo Piacentini, Roberto Torrini and Jan Svejnar for their useful comments. All errors remain ours.
Transcript of Temporary Job Protection and TFP Growth in EU economies ... · Temporary Job Protection and TFP...

1
Temporary Job Protection and TFP Growth in EU economies
Mirella Damiani*, Fabrizio Pompei*and Andrea Ricci**
ABSTRACT
In recent years, one of the main innovations in European labour markets has been new legislation for temporary job contracts. Reforms for these types of contracts have characterised various countries and have been more important than changes in rules for regular contracts. The focus of the present paper is to analyse the impact of these reforms on cross-national and sectoral differences in Total Factor Productivity (TFP) in fourteen European countries and ten sectors from 1995 to 2007. By estimating their effects with a “difference-in-difference” approach, we find that deregulation of temporary workers negatively influences TFP growth rates in European economies. Within sectoral analysis, the effects of these labour liberalisation policies are greater in industry where firms are more used to opening short-term positions. Our estimates also confirm that TFP has improved more in sectors where PMR is lower, which means that organisational improvements, captured by the residual measure TFP, are more likely to be adopted where firms operate in competitive product markets.
Keywords: productivity, labour regulation JEL Classifications: O40, O43; O47; J58. *Department of Economics, Finance and Statistics, University of Perugia, Via Pascoli 20, 06123 Perugia, Italy
* Area di Analisi e Valutazione delle Politiche per l’Occupazione, ISFOL, Corso Italia n. 33, 00198 Rome, Italy. The contents of this publication are solely the responsibility of the author and do not necessarily represent the official view of ISFOL
1. Introduction1
The present paper analyses productivity disparities in EU economies over a period (1995-2007)
which has witnessed a marked slow-down in average European efficiency growth and
significant intra-Europe cross-country diversities. Other studies have shown that, from the mid-
1990s until 2005, EU countries have lost ground with respect to the US, not because of adverse
changes in labour composition, or insufficient rates of capital accumulation, but due to the lack
1 We are grateful to the seminar participants of the Workshop ‘Capital deepening labour flexibility and productivity’, Rome 2010, and XVIII AISSEC Conference, Macerata 2011. Special thanks to Wendy Carlin, Paolo Piacentini, Roberto Torrini and Jan Svejnar for their useful comments. All errors remain ours.

2
of innovation capability (van Ark et al. 2008, Inklaar et al. 2008). These prior works also found
that a prominent role in explaining EU divergences was played by Total Factor Productivity
(TFP) growth, the efficiency component which reflects disembodied technical changes, not
embodied in the quality of inputs, and attributable to organisational and institutional
determinants. In this article, we update the analysis to 2007 and, in particular, examine the
effect of labour regulation in explaining TFP heterogeneity within the EU economies, taking a
closer look at the role of labour market reforms covering temporary jobs.
From the mid-1990s onwards, large-scale liberalisations of labour markets have been recorded
in Europe and, among the main policy turnarounds are new regulatory frameworks for
temporary contracts. These kinds of reform have characterised various countries, albeit at
different speeds, and have been more frequently adopted than changes in rules for regular jobs.
The main aim of this paper is thus to ascertain the role of these institutional changes in
explaining the ample differentials in TFP recorded in EU economies. This was done by making
industry-level cross-country estimates which verify whether provisions regulating employment
contracts are more stringent in those sectors where the propensity to use temporary
arrangements is higher.
There is limited empirical evidence on the relationship between employment protection and
productivity. So far, many studies have considered employment protection as a cost incurred by
firms, and the focus has been on employment and labour market flows. Among others, Bentolila
and Bertola (1990) have shown that firing costs prevent lay-offs and discourage hiring, with an
ambiguous overall influence on employment. Other works have analysed the relationship
between labour market flows and jobs security provisions, reaching similar conclusions
(Bentolila and Dolado, 1994; Bertola and Rogerson, 1997; Garibaldi, 1998; Hopenhayn and
Rogerson, 1993; Mortensen and Pissarides, 1999; Garibaldi and Violante, 2005).
However, employment protection affects human capital accumulation and productivity, not only
labour market flows. Especially in environments where training cannot be contracted between
firms and workers because of the unverifiable and unenforceable nature of firm-specific human
capital investments, economies are characterised by under-investment equilibria and, in turn,
excessive lay-offs, lower job creation and sub-optimal outcomes (Belot and van Ours, 2007,
Ricci and Waldman, 2010). In these contexts, restrictions on labour flexibility may represent a
contractual solution to the under-provision of firm-financed training; conversely, liberalisation
favouring short-term contracts may induce detrimental effects.
It should be noted that, in the related literature, few studies have estimated the influence of
aggregate measures of employment protection on productivity, and most of the existing

3
literature, like the works of Nickell and Layard (1999) and Dew-Becker and Gordon (2008), has
used aggregate regression analysis to examine the relationship between employment protection
legislation (EPL) and productivity. However, the validity of these kinds of investigations may
be limited by confounding factors which influence the cross-country effects of EPL. This
problem is handled by Micco and Pages (2006) and Bassanini et al. (2009), who use a
difference-in-difference approach which can estimate the influence of country institutional
variables by controlling for industry effects. The present paper adopts the same difference-in-
difference approach and offers estimates for more recent years, 1995-2007. Its major
contribution is also that it pays special attention to the regulation of temporary jobs, rather than
aggregate measures of employment protection or protection of regular jobs, as done by the
above authors. Two-tier reforms rather than liberalisation of permanent jobs, as noted above,
were recorded in our estimation period, leading us to examine their role in explaining TFP
patterns.
We find that deregulation of temporary workers negatively influences TFP growth rates in
European economies, while changes in the restriction of regular jobs have no significant effect
on efficiency patterns. Within sectoral analysis, the effects of EPLT liberalisation policies are
greater in industry where firms are more used to making staff changes by opening short-term
positions, whereas excessive product market regulation negatively influences TFP growth.
The paper is organised as follows: Section 2 discusses the literature which has explored the
causal links between employment protection and productivity. Section 3 presents data and
sources; Section 4 offers some descriptive statistics concerning the key variables used in the
econometric analysis. Section 5 discusses econometric strategy and estimates, and Section 6
concludes.
2. Employment protection and productivity: relative literature
Many studies have analysed the influence of labour protection on employment and unemployment
rates, or on unemployment inflows and outflows, but have reserved less space to productivity
growth. For instance, Bentolila and Bertola (1990) and Bertola (1990) examined the role of firing
costs in limiting lay-offs and discouraging hiring, with ambiguous overall influence on employment
rates; similar conclusions were reached by Mortensen and Pissarides (1999) who found that EPL
restrictions negatively influence job mobility. However, employment protection affects not only
labour market flows, but also productivity and welfare, as we discuss below.

4
Indeed, the deeper motives for promoting labour market flexibility are found in the theoretical
literature on the potential costs of labour protection, which may generate direct and indirect effects
on efficiency growth. This protection, as argued by Hopenhayn and Rogerson (1993) and Bertola
(1994), perturbs the reallocation of resources from declining firms to more dynamic ones with
above-average productivity growth. In addition, these protective devices tend to alter the allocation
of resources among sectors. Economies with rigid labour markets show distortions in their
innovation activities, since they adopt mainly secondary innovations, which cause cost reductions in
existing goods, but they do not experiment with primary innovations, such as those related to new
products, characterised by higher returns but also higher variance (Saint Paul, 2002).
Other key channels able to explain unfavourable consequences are related to capital returns and
worker effort. Turnover costs, determined by obstacles to labour mobility, reduce returns on
investments and cause a slower rate of growth, as shown by Bertola (1994). Similar negative effects
are brought about by worker incentives, since labour protection lowers the probabilities of lay-offs
for disciplinary reasons; under less threat of dismissal, opportunistic behaviour is encouraged (Boeri
and Jimeno, 2005).
In addition, in the case of rigid regulations for permanent contracts, temporary workers play a role
as ‘buffer stock’, since firms can adjust their workforces by varying the number of temporary
contracts, thus quickly responding to demand and technological change. However, as theoretically
argued by Blanchard and Landier (2002), deregulation of temporary contracts may merely increase
the turnover in the labour market, rather than being “stepping stones” to permanent jobs, since the
latter types of jobs remain costly to dissolve due to severe restrictions on dismissals. Blanchard and
Landier also offer evidence for the French case - over the period 1983-2000 - which unambiguously
confirms that partial reforms of employment protection may be perverse: when firms are allowed to
hire workers on fixed-term contracts and keep them beyond those contracts, they cannot freely
choose for later separation, which is normally subject to firing costs. In the same vein, Boeri and
Garibaldi (2007) focus on the transitional “honeymoon effect” of labour market reforms, aimed at
allowing some flexibility by implementing reforms ‘at the margin’. Two-tier reforms, as argued by
the authors with a dynamic model of labour demand, verified for the Italian case, produce an
increase in the short-run of employment, but also a slowdown in productivity, due to a decrease in
marginal returns of labour services2.
2 Boeri and Garibaldi (2007) examine the Italian experience in the period 1995-2000 and focus on the “honeymoon effect” of labour market reforms, aimed at allowing some flexibility by implementing reforms at the margin, i.e., those involving fixed-term but not open-end contracts. For the Italian case, other evidence has been obtained by examining the role of exemption clauses exonerating small firms from job security norms (Schivardi and Torrini, 2008).

5
Temporary contracts may also exert two probable but opposing effects on productivity. On one
hand, they favour all reallocation processes triggered by shocks in technology or demand which call
for faster adaptation and job changes. They may also have an incentive effect, under the assumption
that fixed-term workers aim at obtaining permanent positions; hence, these arrangements may be
screen devices to select new employees, and are thus potential “stepping stones to generally
preferable permanent jobs” (Engellandt and Riphahn, 2004, p. 2).
Wasmer (2006) uses a matching model to show that employment protection, by reducing turnover
and labour mobility, shifts human capital accumulation towards specific skills. In particular,
workers are induced to invest in firm-specific skills when the employment relationship is expected
to last. This kind of specialisation improves their productivity and makes it possible for them to
obtain wages above their outside options. By contrast, workers tend to invest much more in general
skills when they perceive a high risk of losing their jobs, as in the absence of employment
protection.
Belot, Boone and van Ours (2007) also stress that, when effort and investments in human capital are
non-contractible, employment protection solves hold-up problems. Protection of this kind
encourages employees to invest in match-specific human capital by increasing the probability of the
survival of the match, and this beneficial effect is stronger in those sectors where firm specialisation
in competences is more important. This result is also relevant in all contexts where risk-averse
employees are liquidity-constrained and cannot obtain insurance against dismissals. However, there
is a trade-off between these positive effects and the negative consequences of EPL, which also
raises the costs of separation. Belot, Boone and van Ours suggest an inverse U-shaped relationship
between employment protection and economic growth: there is a positive optimal level of
employment protection, so that, over some ranges, increasing employment protection does improve
welfare. The exact level of optimal employment protection depends on other labour market
institutions, such as minimum wages and wage bargaining institutions.
More general results, not conditioned by the presence of risk-averted employees and financial
imperfections, are obtained by Ricci and Waldman (2010). In their matching model, à la
Mortensen-Pissarides (1994), in which firms finance training of their employees, the introduction of
a firing tax reduces hold-ups and opportunistic behaviour by employers and acts as a Pareto
improving policy. Indeed, when the amount of training is chosen in the first stage of employment
relations, while the returns are realised at the second stage, workers are not able to influence the
amount of training, which is chosen unilaterally by firms. In this economy, a firing tax combined

6
with the use of hiring subsidies always increases the level of training, as well as job tenure, with
unambiguous positive effects on welfare. The new firing tax imposes a second-order cost on the
firm, but induces a first-order benefit to the worker, since it solves the hold-up problem: On
political grounds, a firing tax for newly hired workers finds less resistance if the tax revenue
derived from separations is used to subsidise new hiring. In sum, a well-designed policy which
combines firing taxes for newly hired personnel and hiring subsidies acts as a Pareto improving
intervention.
Concerning empirical evidence, and limiting our short review to comparative studies, it must be
noted that a few works have estimated the relationship between EPL and productivity in cross-
country (Nickell and Layard 1999; Autor et al. 2007; Dew-Becker and Gordon, 2008) or industry-
level cross-country studies (Micco and Pages, 2006; Bassanini et al., 2009). So far, these empirical
studies offer contradictory findings. For instance, Layard and Nickell (1999) performed cross-
country estimates of labour productivity growth over the period 1976-1992, in which it appears that
employment protection is the only institution that has a positive effect on labour productivity
growth in OECD countries; the rationale behind this is that productivity improvements depend on
workers' cooperation and on-the-job training investments which, in turn, are favoured by firing
costs.
Autor et al. (2007), using cross-state differences in the US, consider the adoption of wrongful
discharge protection by US state courts from the late 1970s to the early 1990s and estimate the
influence of dismissal costs on the distortion of production choices and thus on productivity. Their
estimates suggest that job protection reduces TFP and firm entry, but increases capital investments.
Dew-Becker and Gordon (2008) detect significant positive effects of EPL as well as of
unemployment protection, measured by average replacement rates.
Belot, Boone and van Ours (2007) perform an empirical analysis of cross-country time-series data
(17 OECD countries and three periods, ranging from the early 1960s to the late 1990s) and find that
employment protection legislation, as predicted by their model, briefly described above, has a non-
linear relationship with economic growth.
The limitation of these previous works is that the effects of labour policies, defined at aggregate
level, may be obscured by confounding factors which influence cross-country (cross-state)
variations. This problem is handled by recent studies which use a difference-in-difference approach
and estimate the influence of country institutional variables by controlling for industry effects. If
EPL has a different effect on sectors, EPL non-binding sectors are used as a control for EPL-
binding sectors, i.e., for the ‘treated’ group. This method was applied by Micco and Pages (2006) to
a sample of 16 OECD and 18 non-OECD countries. They found that stricter job security regulation,
7
as measured by alternative indicators, slows down job turnover, and that the magnitudes of these
effects are larger in sectors which are intrinsically more volatile. However, they also found less
robust results for productivity. Clearer and robust results are obtained by Bassanini et al. (2009),
who adopt the difference-in-difference method for a sample of OECD countries for the period 1982-
2003. They mainly focus on labour protection of regular contracts and estimate that dismissal
restrictions have a negative effect on productivity growth, especially in sectors where firing
restrictions are more binding. The estimated effect of protection of permanent contracts remains
negative and significant when protection of temporary contracts is controlled for. In contrast, for the
latter form of regulation, they find either positive or no influence on TFP.
The exploration of the role of temporary job restrictions and their effect on TFP growth is the main
aim of our estimates for more recent years (1995-2007).
3 Data and sources
Our empirical investigation relies on several databases, EU KLEMS accounts, the OECD indexes
on employment protection and product marker regulation, and EUROSTAT.
The key variables used to study the influence of employment protection and product market
regulation on TFP growth, as well as other control variables, are included in these different
databases; thus, the first step of our research involved matching them and carrying out
disaggregated analysis at sector and country levels. First, the availability of data and the needs of a
large and consistent sector-country profile led us to select only 14 countries out of the 27 European
Union members and to re-arrange the NACE rev.1 sections into 10 industries.
This made it possible to compare the following economies: Austria, Belgium, the Czech Republic,
Denmark, Spain, Finland, France, Germany, Hungary, Ireland, Italy, the Netherlands, Sweden,
and the United Kingdom. This selection, as noted above, was dictated by data availability and
includes two sets of countries: i) 12 Old Member States; ii) 2 New Member States. The second
small set comprises Hungary and the Czech Republic, two “market-oriented” economies with
some similarities to the Anglo-Saxon countries (European Commission, 2004).
The selected sectors consist of: 1) Agriculture; 2) Mining and Quarrying, 3) Manufacturing; 4)
Energy sectors), 5) Construction, 6) Wholesale and Retail Trade, 7) Hotels and Restaurants, 8)
Transport, Storage and Communications, 9) Financial Intermediation, Real Estate and Business
Services, 10) Community, Social and Personal Services.
We drew the dependent variable of our econometric estimates, TFP growth, from the EU KLEMS
database, which was extensively used in the study by van Ark et al. (2008). One of the main
advantages of this database is the detailed breakdown of industries and service sectors and the

8
decomposition of labour productivity; it is also worth noting that this decomposition was
computed by considering differences in labour quality (highly skilled, medium-skilled and low-
skilled) and a full variety of asset types (distinction between ICT capital and non-ICT capital
services).
In addition, following Bassanini et al. (2009), we used EU KLEMS to estimate TFP levels, which
allowed us to compute the distance of TFP from the technological frontier, i.e., the ratio of TFP in
a specific country and industry to the TFP level of the leader in that industry (Aghion and Griffith,
2005; Griffith et al., 2004).
Other variables used in the descriptive analysis, value added and the contribution of inputs to
growth, were also obtained from the EU KLEMS database.
The set of key explanatory variables related to labour and product market regulation, i.e.,
employment protection legislation for regular and temporary workers (EPLR and EPLT,
respectively) and product market regulation (PMR), are given by the OECD database.
Important explanatory variables of TFP used as controls, particularly those describing unmeasured
innovative input, sectoral R&D expenses, standardised to value added, were taken from
EUROSTAT. The same database was used to gather the share of workers with temporary jobs to
total employees at sector-country level. We also introduced, in our difference-in-difference model,
the sectoral average level of this ratio for the UK as a benchmark, i.e., as the underlying
propensity to use temporary workers, in the absence of EPLT. In addition, in the descriptive
analysis we used the proportion of temporary workers by sector and country, for information on
actual utilisation of labour market flexibility.
Lastly, UK industry-level layoff rates, defined as the percentage ratio of annual lay-offs to total
employment, were introduced as a proxy for lay-off propensity in the absence of EPL, and were
obtained from the waves of the UK Quarterly Labour Force Survey, released by the Office of
National Statistics.
4 Descriptive statistics
4.1 Cross- country productivity differentials
Study of the relationship between regulatory framework and TFP, presented below, is accompanied
by some evidence to show the decomposition of GDP growth into the growth of two components:
hours worked and labour productivity. An overall picture of cross-country differentials from 1995
to 2007 is given in Table 1, which also shows data for contributions to labour productivity.
The lowest position in terms of growth of value added is occupied by Italy, with a rate of only
1.42%, (column 1), mostly because of its collapse in productivity growth. It is followed by

9
Germany where, however, the disappointing performance in output growth was primarily caused by
a marked fall in hours worked. Conversely, at the top we find Ireland, Finland and Spain, but here
too the difference between the three economies is worthy of note, since Ireland and Spain had
extensive growth as a consequence of the greater output contributed by hours worked, whereas
Finland recorded an acceleration in productivity gains.
Table 1 also shows that the slow productivity growth of the old member states of the European
Union, below 2 percent, is a widespread phenomenon - with some notable exceptions, two in
Northern Continental Europe, Finland and Sweden, and two in the Anglo-Saxon economies, Ireland
and the UK.
Table 1: Output, hours and productivity growth in European economies: 1995-2007
(all sectors)
Growth rate of Value Added
Hours Worked
Labour Productivity
Labour Composition
ICT capital per Hour
Non-ICT capital per
HourTFP
LP contributions
from knowledge economy
Austria 2.43 0.52 1.90 0.20 0.43 0.39 0.88 1.51Belgium 2.13 0.63 1.50 0.21 0.77 0.74 -0.22 0.76Denmark 1.87 0.83 1.03 0.10 0.84 0.38 -0.29 0.65Finland 3.57 0.84 2.73 0.23 0.50 0.46 1.54 2.27France 2.14 0.34 1.79 0.33 0.27 0.59 0.60 1.21Germany 1.60 -0.09 1.69 -0.01 0.38 0.64 0.67 1.05Ireland 6.94 1.93 5.01 0.54 0.41 3.46 0.61 1.56Italy 1.42 0.65 0.77 0.12 0.25 0.70 -0.29 0.07Netherlands 2.69 0.78 1.91 0.30 0.53 0.50 0.58 1.41Spain 3.52 1.89 1.63 0.44 0.46 1.43 -0.69 0.21Sweden 2.96 0.40 2.56 0.25 0.47 1.05 0.78 1.50United Kingdom 2.72 0.60 2.13 0.43 0.74 0.58 0.38 1.56Average (EU12) 2.83 0.78 2.06 0.26 0.51 0.91 0.38 1.15Std. Dev. (EU12) 1.46 0.59 1.08 0.16 0.19 0.86 0.63 0.63Czech Republic 2.74 -0.10 2.84 0.30 0.53 1.41 0.60 1.43Hungary 3.92 0.23 3.67 0.61 0.30 0.36 2.40 3.32Average (EU14) 2.90 0.68 2.23 0.29 0.49 0.91 0.54 1.32Std. Dev.(EU14) 1.38 0.60 1.10 0.17 0.18 0.81 0.79 0.82
Output contribution from Labour productivity contributions from
Source: EU KLEMS database. Contribution from knowledge economies is obtained by summing labour composition, ICT capital per hour and TFP. Labour composition is measured by changes in terms of age, gender and educational attainments. EU KLEMS cross-classifies labour input by educational attainment, gender, and age (to proxy for work experience) into 18 labour categories, respectively 3 x 2 x 3 types; see van Ark et al. (2008, p. A2).
Contributions to labour productivity growth reveal other cross-country diversities.
In Ireland, a significant increase in substitution of capital for labour and processes of deepening in
(non-ICT) capital intensity are recorded. Similar measures characterised the mid-1970s to the late
1980s when, on average, European countries engaged in catching up with the US (van Ark et al.

10
,2008). For the other Anglo-Saxon country, the UK, two components of the knowledge economy
(high quality of the labour workforce and capital ICT services) contribute to an important extent.
Lastly, the Northern countries, and Finland in particular, were the only economies in Europe which
showed the indubitable incidence of TFP growth.
Note, as already signalled by van Ark et al. (2008), that there is no significant slowdown in the
quality of the labour force: the skill level of the workforce (captured by the labour composition
effect) gives a positive contribution to efficiency growth (with the only exception of Germany). In
addition, there is no large variation in labour composition effect across European countries, as
shown by the standard deviations for EU12 and EU 14 (0.16 and 0.17, respectively).
We also consider the summed contributions of three factors: changes in labour composition, mostly
determined by greater demand for skilled workers; investments in information and communication
technology, and TFP growth, the last component, as indicated by van Ark et al. (2008, p. 35),
“might include the impact of intangible investments such as organizational changes related to the
use of information technology”. Data for the period 1995-2007 show the lowest performances by
Italy and Spain, while confirming the leading position of Finland.
To better evaluate the relative importance of the various components, we computed their percentage
contributions to labour productivity, as shown in Table 2.
One of the main differences arising in the intra-European context is found not in differences in the
intensity of the production factors, but in total factor productivity. Indeed, the standard deviation of
TFP (32.79%) is much larger than that of the contribution of labour composition (6.54%) or of ICT
and Non-ICT capital deepening (18.77 and 23.79%). This led us to extend analysis of TFP in terms
of country-sectoral differentials.

11
Table 2: Productivity growth components, 1995-2007 (all sectors; percentage point contributions)
Labour
CompositionICT capital per Hour
Non-ICT capital per
HourTFP Labour
Productivity
Austria 10.69 22.38 20.66 46.28 100Belgium 13.84 51.47 49.52 -14.82 100Denmark 9.77 81.29 37.03 -28.10 100Finland 8.24 18.44 16.89 56.43 100France 18.29 15.23 32.83 33.65 100Germany -0.38 22.79 37.67 39.92 100Ireland 10.76 8.20 68.96 12.08 100Italy 15.43 32.16 90.52 -38.11 100Netherlands 15.66 27.96 26.24 30.14 100Portugal 26.76 28.01 87.32 -42.09 100Spain 9.94 18.42 41.19 30.45 100Sweden 20.12 34.79 27.10 17.98 100United Kingdom 12.72 24.57 44.26 18.45 100Average (EU12) 13.22 29.67 44.63 12.48Std. Dev. (EU12) 6.54 18.77 23.79 32.79Czech Republic 10.47 18.85 49.56 21.12 100Hungary 16.61 8.27 9.68 65.44 100Average (EU14) 13.26 27.52 42.63 16.59Std. Dev.(EU14) 6.17 18.39 23.87 33.31 Source: EU KLEMS database.
4.2 TFP and country-sectoral differentials Many factors may cause changes in TFP, since this residual measure includes disembodied
technological change, organisational improvements, and effects from unmeasured output and inputs
which may be captured by R&D expenses. Hence, in addition to technical innovation, there are: i)
effects due to organisational and institutional changes, ii) shifts in returns to scale, iii) any other
deviations from competitive assumptions of equalities between prices and marginal costs; iv) all
computing errors due to the existence of unmeasured inputs. All these effects cause different TFP
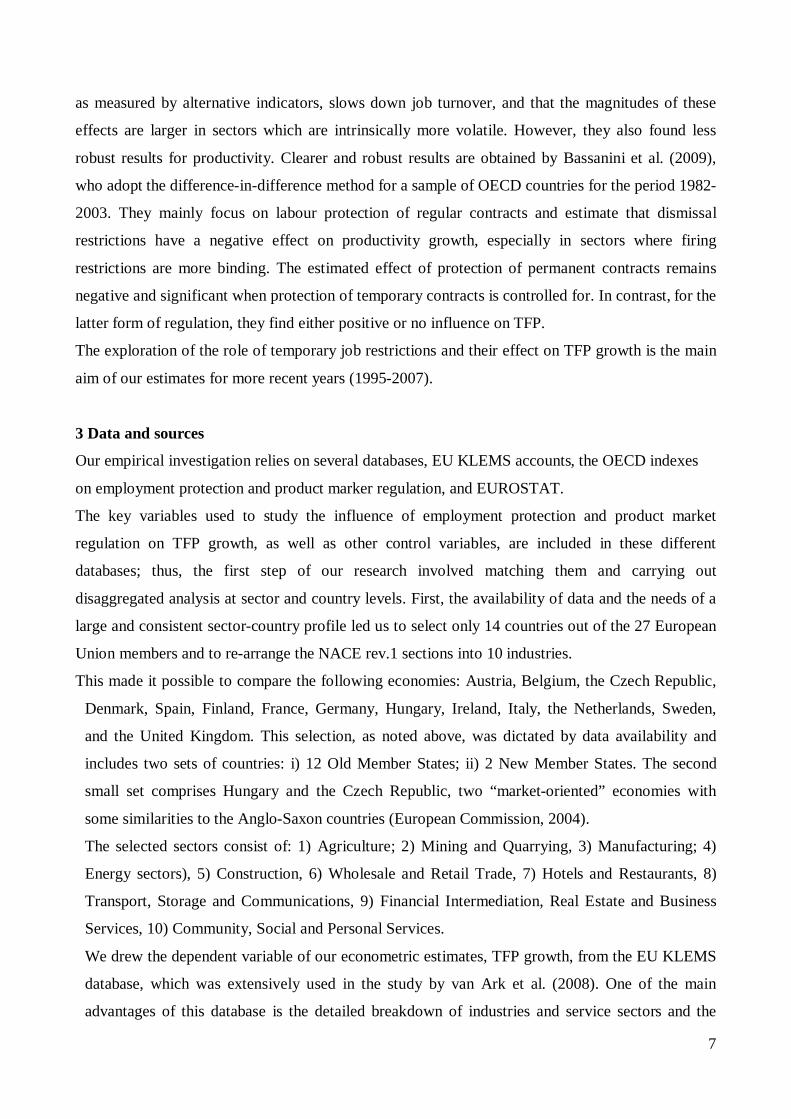
contributions to economic growth at country and sectoral level, as shown in Figure 1.
One general finding, common to almost all countries, is the positive and remarkable contribution of
TFP in manufacturing. For a plausible explanation, we must recall that TFP, as a residual measure,
includes measurement errors: R&D and other intangible assets are the most prominent examples
causing statistical errors when computing inputs. This component has great importance in
manufacturing (Eurostat, 2010, p.52).

12
A second finding concerns the positive contribution of TFP to productivity growth in the Wholesale
and Retail sector (see Figure 1). One probable explanation, as stressed in van Ark et al.(2008), is
that the ample diffusion of chain stores and inventory systems applied to the trade sector are
prominent examples of sectors where returns to scale, as already observed for the American
economy (Foster et al., 2006), have played a significant role and explain faster growth in TFP.
Good performance was also found in Agriculture and Transport, Storage and Communications. One
reason for this finding in Transport and Communications concerns the role of deregulation and
changes in entry barriers, since the removal of restrictions encourages innovation and promotes
growth (Aghion and Griffith, 2005). These effects were empirically tested by Nicoletti and
Scarpetta (2003), who examined the role of entry liberalisation in market services and found a
positive spill-over effect on manufacturing but, unexpectedly, no benefits in services. These
paradoxical results may be due to some statistical problems, since deregulations were introduced in
Europe at different times in different industries, but their aggregation into broad sectors does not
allow us to isolate the single institutional innovation and causes insufficient change over time of the
explanatory variables which represent these innovations. Inklaar et al. (2008) report that moving to
a more detailed analysis for individual service sectors is convenient, since it overcomes these
problems; in particular, for Post and Telecommunications, the authors demonstrate that the effect of
barriers to entry has a negative and significant effect on TFP growth, whereas no significant effects
are detected for Transport and Storage. One explanation is “that the change in barriers to entry for
the post telecommunication services was so strong that its effects became identifiable through the
general noise in the data, while this was not the case in transport” (Inklaar et al., 2008, p. 167). In
our study, in which the two sectors (Transport and Storage, Post and Telecommunications) are not
considered separately, we simply find, on average, good results in terms of TFP growth in various
countries, as shown in Figure 1. Performances in other services, such as hotels and restaurants,
financial sectors or social and personal services, are more disappointing. In these cases, some
failures due to the increasing use of fixed-term contracts may have been some of these
organisational and institutional changes behind the TFP patterns. This point is examined in the next
section.
Figure 2 shows TFP growth rates at sector level.

Figure 1: Contributions of TFP to growth of sectoral added value European economy 1995-2007 Agriculture Manufacturing
-3
-1
1
3
5
7
9A
nnua
l ave
rage
gro
wth
rate
and
TFP
con
trib
utio
n
Value Added growth TFPcontribution
-3
-1
1
3
5
7
9
Ann
ual a
vera
ge g
row
th ra
te a
nd T
FP
cont
ribu
tion
Value Added growth TFPcontribution
Construction Wholesale and Retail trade
-3
-1
1
3
5
7
9
Ann
ual a
vera
ge g
row
th ra
te a
nd T
FP c
ontr
ibut
ion
Value Added growth TFPcontribution
-3
-1
1
3
5
7
9
Ann
ual a
vera
ge g
row
th ra
te a
nd T
FP c
ontr
ibut
ion
Value Added growth TFPcontribution
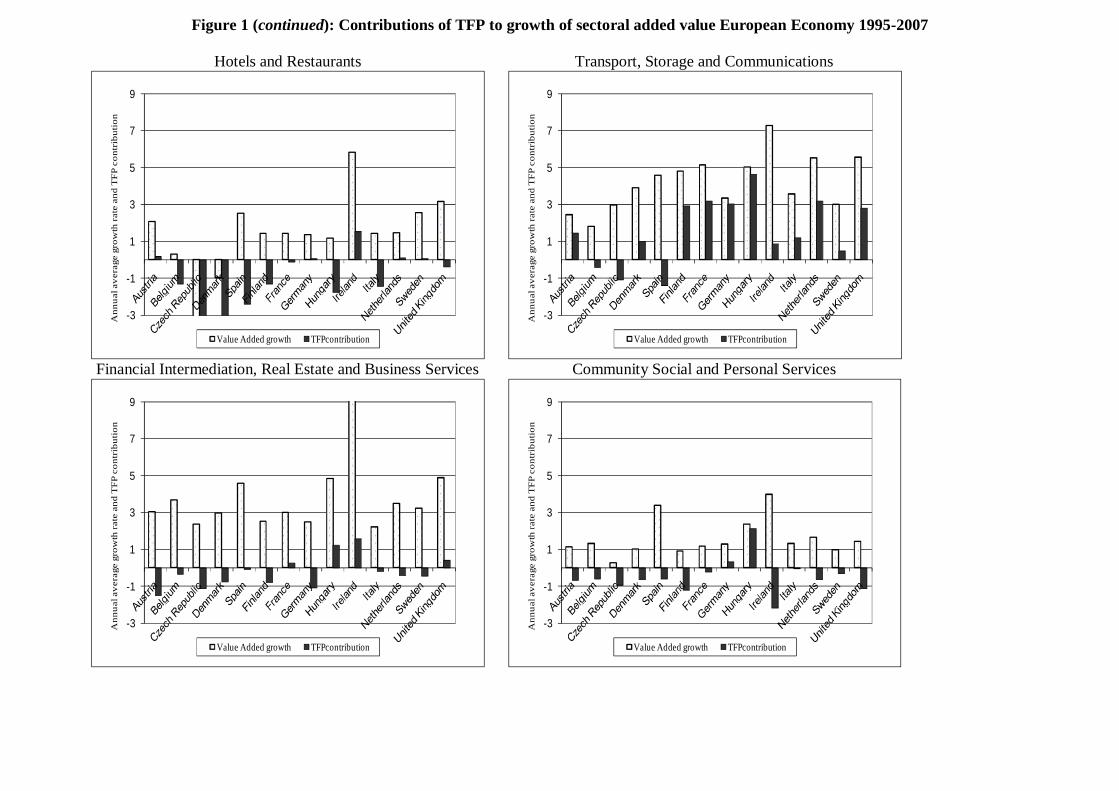
Figure 1 (continued): Contributions of TFP to growth of sectoral added value European Economy 1995-2007
Hotels and Restaurants Transport, Storage and Communications
-3
-1
1
3
5
7
9A
nnua
l ave
rage
gro
wth
rate
and
TFP
con
trib
utio
n
Value Added growth TFPcontribution
-3
-1
1
3
5
7
9
Ann
ual a
vera
ge g
row
th ra
te a
nd T
FP c
ontr
ibut
ion
Value Added growth TFPcontribution
Financial Intermediation, Real Estate and Business Services Community Social and Personal Services
-3
-1
1
3
5
7
9
Ann
ual a
vera
ge g
row
th ra
te a
nd T
FP c
ontr
ibut
ion
Value Added growth TFPcontribution
-3
-1
1
3
5
7
9
Ann
ual a
vera
ge g
row
th ra
te a
nd T
FP
cont
ribu
tion
Value Added growth TFPcontribution
15
Figure 2: TFP annual growth rates by sector (1995-2007)
TFP growth rate in Agriculture TFP growth rate in Manufacturing
TFP growth rate in Constructions TFP growth rate in Wholesale and Retail
TFP growth rate in Hotels and Restaurants TFP growth rate in Transports
-2 -1 0 1 2 3 4 5
GERHUN
FINSWEAUT
IRLUK
CZEFRAITAESPBEL
NLDDNK
-1 0 1 2 3 4 5 6
FINAUTSWEHUNCZEGERNLDFRAUKIRL
BELDNKESPITA
-3 -2 -1 0 1 2 3
AUTBEL
HUNFINUK
DNKGERSWEFRANLDITAESPIRL
CZE
-2 -1 0 1 2 3 4 5 6
CZEFIN
NLDHUNSWEGER
UKAUTDNK
IRLFRAESPITABEL
-10 -8 -6 -4 -2 0 2 4
IRLNLDAUTSWEGERFRAUKFINBELITA
HUNESP
DNKCZE
-2 -1 0 1 2 3 4 5 6
HUNFRANLDGERFINUK
AUTITA
DNKIRL
SWEBELCZEESP
16
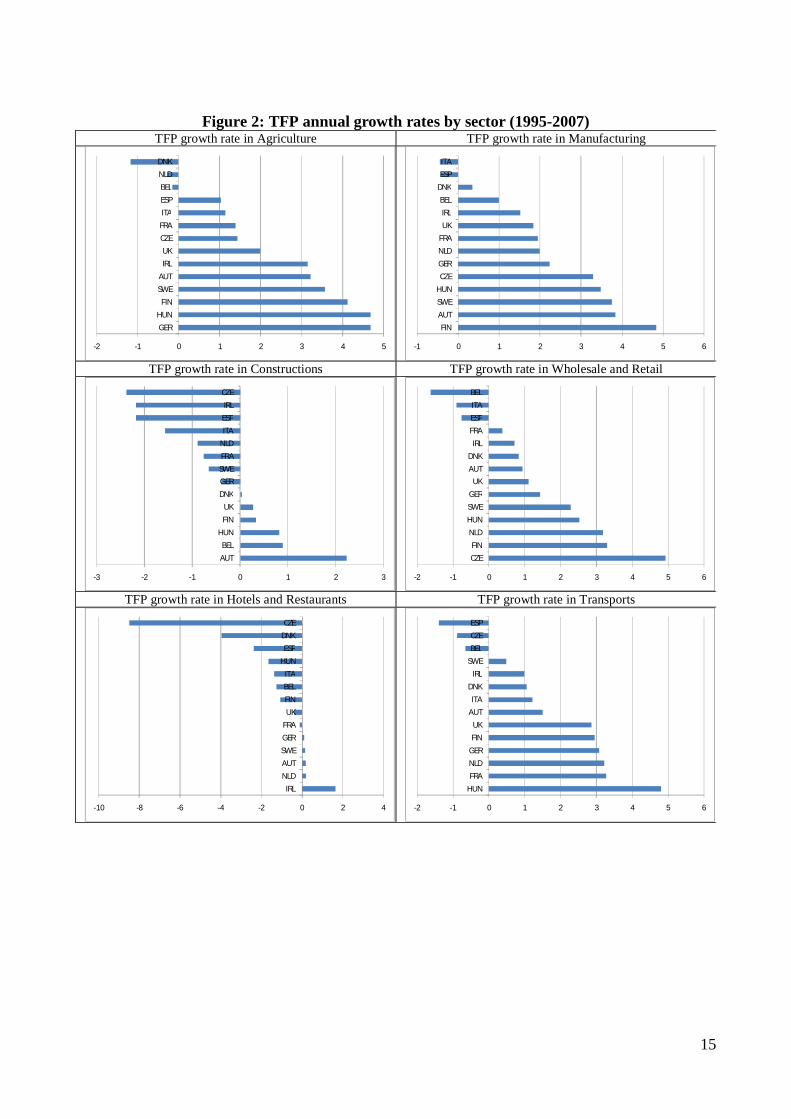
Figure 2 (continued): TFP annual growth rates by sector (1995-2007)
TFP growth rate in Finance and Real Estate TFP growth rate in Public Administration
TFP growth rate in Energy and Gas TFP growth rate in Mining
-2 -1.5 -1 -0.5 0 0.5 1 1.5 2
IRLHUN
UKFRAESPITABEL
NLDSWEDNKFINCZEGERAUT
-3 -2 -1 0 1 2 3
HUNGERITA
FRASWEBELESP
DNKNLDAUTCZEUKFINIRL
-3 -2 -1 0 1 2 3 4 5
AUTFRAFINBEL
NLDGERIRL
ESPUKITA
HUNCZE
SWEDNK
-6 -4 -2 0 2 4 6
AUTHUNGERDNKESPBELCZEFINITA
FRAUK
NLDIRL
SWE
4.3 Labour Protection This section concerns job protection across countries and the most important changes which have
characterised the European economies and which may have influenced their performance in terms
of innovation and productivity.
Job protection considered in most of the estimates of the present paper is measured by using two
time-varying cross-country data: the OECD Employment Protection Legislation index (EPL) for
regular contracts (EPLR) and, for temporary contracts (EPLT).
The EPLR OECD index refers to eight items which weigh three major groups of restrictions: i)
procedural inconvenience (such as notification procedures), ii) severance pay, and iii) difficulty of
individual dismissals (definition of unfair dismissal and related items). The EPLT index includes
norms for fixed-term contracts and temporary work agency employment. For both types of contract,
the OECD sub-indexes include information on the valid cases for which these types of contracts are
legal, restrictions on the number of renewals, and their maximum cumulated duration (OECD,
2004).

17
Our baseline regressions do not include the OECD indicator which covers a third area, i.e.,
restrictions on collective dismissals (EPLC). EPLC has only been available since 1998 and this does
not allow comparisons over our observation period (1995-2007). In any case, for robustness checks,
we also perform a set of estimates to test the role of EPLC and following Bassanini et al., (2009)
introduce an aggregate indicator, obtained by a weighted average of EPLR (time-varying) and the
1998 value of EPLC. Note also that the information for EPLC for the years 1998-2007 confirm no
changes in the restrictiveness of collective dismissals in our sampled European economies, with
only two exceptions, Denmark and Finland where, however, only minor changes were made.
A general look shows considerable variations across EU economies, not only in the stringency of
aggregate values of EPL (obtained by weighting EPLR, EPLT and EPLC), but also in the stance of
these different components. There are economies, such as that of the United Kingdom, where all the
various kinds of restrictions are small, but there are other countries where stringency widely differs
by component. A case in point is Italy, with the highest EPLC values throughout our observation
period (4.88) but where EPLR (1.77) is less than the EU average (Figure 4)3.
In recent years, one of the main innovations in European labour markets has been new legislation
for temporary job contracts. Reforms for these types of contracts have characterised various
countries and have been more important than changes in rules for regular contracts. Indeed, the
changes recorded for our sampled countries, as shown in Figure 3, confirm that the greatest
relaxation in strictness of rules is recorded for temporary contracts.
Figure 3: Changes in employment protection in EU countries 1995-2007
-4.0 -3.5 -3.0 -2.5 -2.0 -1.5 -1.0 -0.5 0.0 0.5 1.0
ItalyGermany
BelgiumNetherlands
SwedenAustria
DenmarkFinlandFrance
United KingdomSpain
Czech RepublicIreland
Hungary
Changes in EPLT Changes in EPLR
Source: OECD 3All OECD EPL indexes are measured on a 0-6 scale, from least to most restrictive.
18
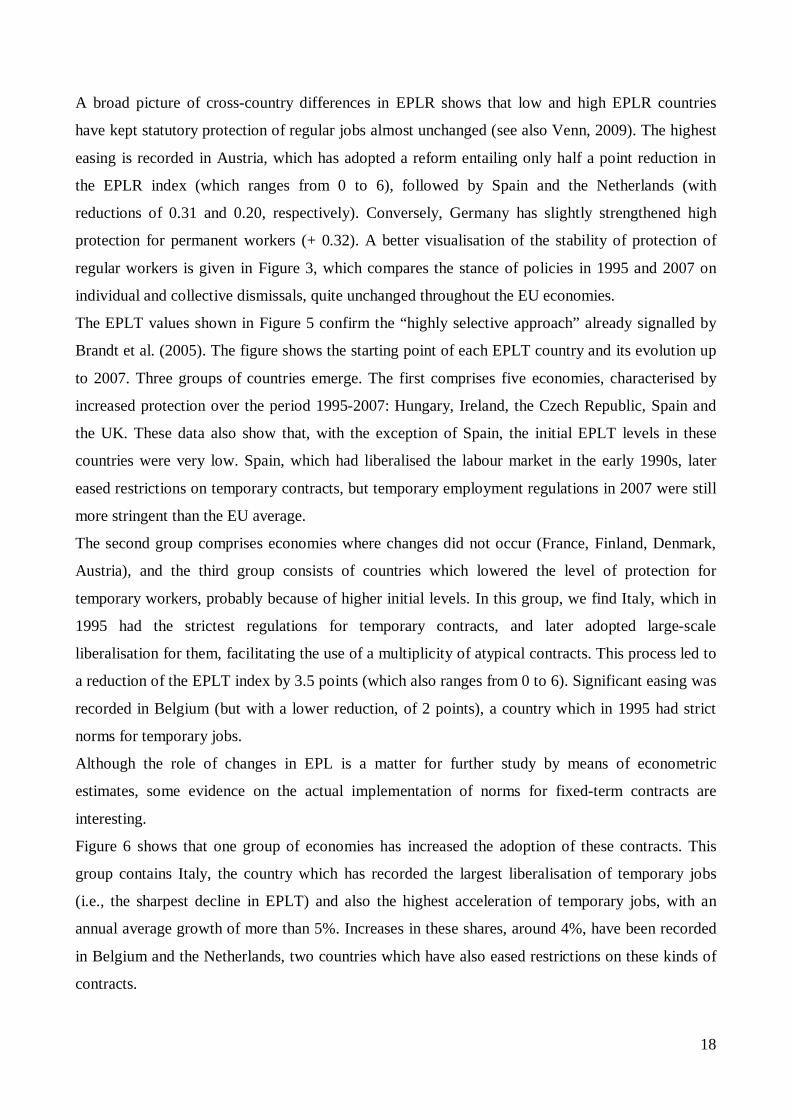
A broad picture of cross-country differences in EPLR shows that low and high EPLR countries
have kept statutory protection of regular jobs almost unchanged (see also Venn, 2009). The highest
easing is recorded in Austria, which has adopted a reform entailing only half a point reduction in
the EPLR index (which ranges from 0 to 6), followed by Spain and the Netherlands (with
reductions of 0.31 and 0.20, respectively). Conversely, Germany has slightly strengthened high
protection for permanent workers (+ 0.32). A better visualisation of the stability of protection of
regular workers is given in Figure 3, which compares the stance of policies in 1995 and 2007 on
individual and collective dismissals, quite unchanged throughout the EU economies.
The EPLT values shown in Figure 5 confirm the “highly selective approach” already signalled by
Brandt et al. (2005). The figure shows the starting point of each EPLT country and its evolution up
to 2007. Three groups of countries emerge. The first comprises five economies, characterised by
increased protection over the period 1995-2007: Hungary, Ireland, the Czech Republic, Spain and
the UK. These data also show that, with the exception of Spain, the initial EPLT levels in these
countries were very low. Spain, which had liberalised the labour market in the early 1990s, later
eased restrictions on temporary contracts, but temporary employment regulations in 2007 were still
more stringent than the EU average.
The second group comprises economies where changes did not occur (France, Finland, Denmark,
Austria), and the third group consists of countries which lowered the level of protection for
temporary workers, probably because of higher initial levels. In this group, we find Italy, which in
1995 had the strictest regulations for temporary contracts, and later adopted large-scale
liberalisation for them, facilitating the use of a multiplicity of atypical contracts. This process led to
a reduction of the EPLT index by 3.5 points (which also ranges from 0 to 6). Significant easing was
recorded in Belgium (but with a lower reduction, of 2 points), a country which in 1995 had strict
norms for temporary jobs.
Although the role of changes in EPL is a matter for further study by means of econometric
estimates, some evidence on the actual implementation of norms for fixed-term contracts are
interesting.
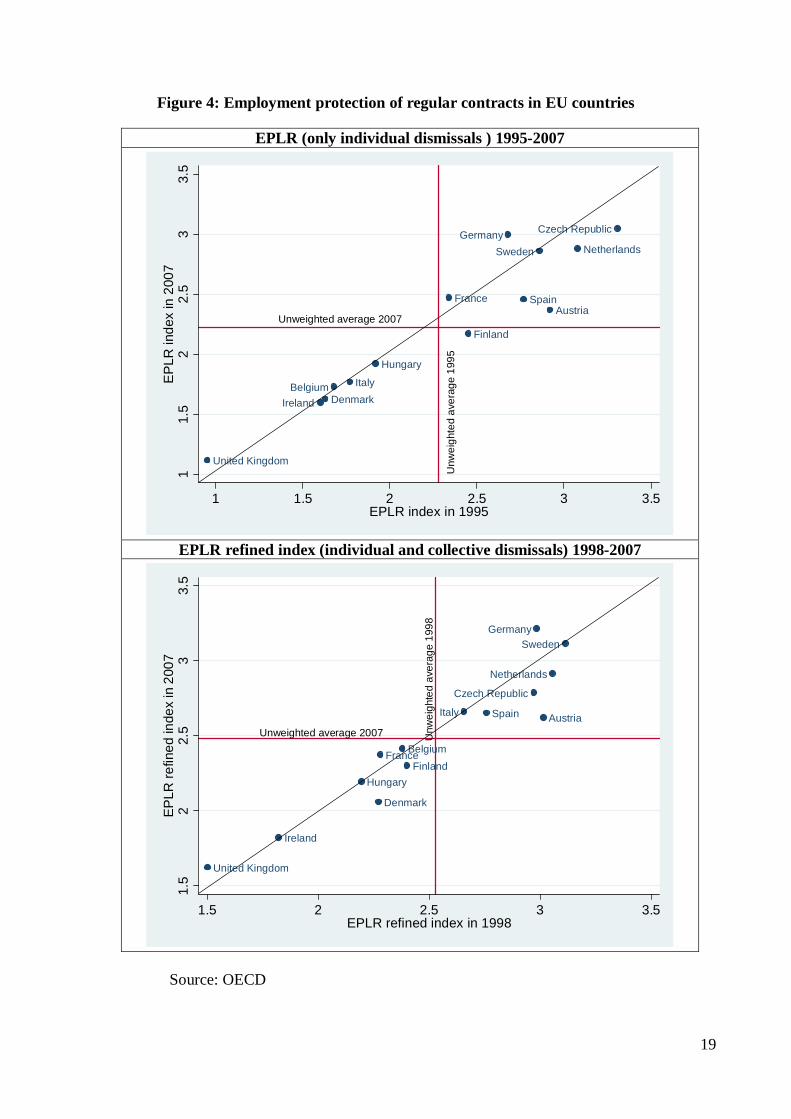
Figure 6 shows that one group of economies has increased the adoption of these contracts. This
group contains Italy, the country which has recorded the largest liberalisation of temporary jobs
(i.e., the sharpest decline in EPLT) and also the highest acceleration of temporary jobs, with an
annual average growth of more than 5%. Increases in these shares, around 4%, have been recorded
in Belgium and the Netherlands, two countries which have also eased restrictions on these kinds of
contracts.
19
Figure 4: Employment protection of regular contracts in EU countries
EPLR (only individual dismissals ) 1995-2007
Austria
Belgium
Czech Republic
Denmark
Finland
France
Germany
Hungary
Ireland
Italy
NetherlandsSweden
United Kingdom
Spain
Unw
eigh
ted
aver
age
1995
Unweighted average 2007
11.
52
2.5
33.
5E
PLR
inde
x in
200
7
1 1.5 2 2.5 3 3.5EPLR index in 1995
EPLR refined index (individual and collective dismissals) 1998-2007
Austria
Belgium
Czech Republic
Denmark
FinlandFrance
Germany
Hungary
Ireland
Italy
Netherlands
Sweden
United Kingdom
Spain
Unweighted average 2007 Unw
eigh
ted
aver
age
1998
1.5
22.
53
3.5
EP
LR re
fined
inde
x in
200
7
1.5 2 2.5 3 3.5EPLR refined index in 1998
Source: OECD

20
Figure 5: Employment protection of temporary contracts in EU countries, 1995-2007
Austria
Belgium
Czech Republic
Denmark
Finland
France
GermanyHungary
Ireland
Italy
Netherlands
Sweden
United Kingdom
Spain
Unw
eigh
ted
aver
age
1995
Unweighted average 2007
01
23
45
6E
PLT
inde
x in
200
7
0 2 4 61 3 5EPLT index in 1995
Source: OECD
A second group comprises economies (Spain, UK, Denmark, Ireland, Finland) which have recorded
negative growth of the proportion of temporary workers (Figure 6), and they are all countries which
have raised or kept unchanged their protection of temporary workers between 1995-2007 (Figure 5).
The only exception is Hungary, which shows small positive growth in the proportion of temporary
jobs, notwithstanding a slight increase in EPLT.
Our data also suggest that catching-up effects due to the use of temporary workers are negligible. In
fact, by omitting the outlier case of our sample, Spain, we obtain a correlation of -0.34 between the
share of temporary contracts and the average annual growth of those shares. This means that trends
in the proportions of fixed-term contracts are weakly explained by their initial levels. Instead,
complementary effects between protection of temporary and regular workers play a major role. For
example, in 1995 the proportions of temporary workers in the UK, Italy, Belgium and Austria were
very similar (6.77%, 7.21%, 5.31%, 5.99%, respectively). However, interesting divergences
emerged in the following years, when the last three countries did not ease their strict legislation for
regular workers but significantly liberalised the hiring of temporary workers, thus causing a
considerable increase in the use of temporary contracts. In sum, our data suggest that changes in
21
employment protection legislations are correlated with differing recourse to temporary contracts,
and led us to explore their effects on productivity.
Figure 8 reports the average values of proportion of temporary contracts (as shares of total
employment) and shows that in UK recourse to temporary workers is below the EU average in all
sectors.
Before discussing econometric results, it is useful to observe that the UK, as mentioned above, is a
benchmark country in that it has the least protection for both regular and temporary workers, in
comparison with other EU countries of our sample, without significant policy turnarounds (see also
Figures 4 and 5). Figure 8 also shows the lowest levels of proportions of temporary workers.
Data on sectoral propensities to use temporary workers reveal uniform patterns across countries: in
both the UK and other EU countries, we find the same group of industries with higher shares of
temporary jobs (Agriculture, Hotels and Restaurants, Construction, Community, Social and
Personal Services, Finance and Business Services). Conversely, trends by sectors are quite
different. In Agriculture and Services we note a falling trend in these arrangements in the UK, but
increasing importance in EU countries (see Figure 9).
Figure 6: Growth of proportion of temporary workers with respect to initial levels
1995-2007
Austria
Belgium
Czech Republic
Denmark
Finland
France
Germany
Hungary
Ireland
Italy
Netherlands
Sweden
United Kingdom
Spain
-4-2
02
46
Ave
rage
ann
ual g
row
th o
f the
sha
reof
tem
pora
ry w
orke
rs o
ut o
f em
ploy
ees
(%)
0 10 20 30 40Share of temporary workers out of employees in 1995 (%)

22
Figure 7: Proportion of temporary workers at beginning and end of period 1995-2007
AustriaBelgium Czech RepublicDenmark
FinlandFranceGermany
HungaryIreland
Italy
Netherlands Sweden
United Kingdom
Spain
Weighted average 2007
Wei
ghte
d av
erag
e 19
95
1015
2025
3035
405
Sha
re o
f tem
pora
ry w
orke
rs o
ut o
f em
ploy
ees
in 2
007
(%)
0 10 20 30 405 15 25 35Share of temporary workers out of employees in 1995 (%)
Figure 8 Proportion of temporary workers by sector (Average 1995-2007) Share of temporary workers out of total employees in
Agriculture (Average 1995-2007) Share of temporary workers out of total employees in
Manufacturing (Average 1995-2007)
Share of temporary workers out of total employees in
Constructions (Average 1995-2007) Share of temporary workers out of total employees in Wholesale
and Retail Trade (Average 1995-2007)
020
4060
Sha
re o
f tem
pora
ry w
orke
rs o
ut o
f tot
al e
mpl
oyee
sAve
rage
199
5-20
07
ESP ITA SWE NLD FIN FRA GER DNK SVN BEL AUT IRL HUN UK CZE
020
4060
Sha
re o
f tem
pora
ry w
orke
rs o
ut o
f tot
al e
mpl
oyee
sAv
erag
e 19
95-2
007
ESP FRA SVN NLD FIN GER SWE AUT CZE ITA HUN BEL DNK UK IRL
020
4060
Sha
re o
f tem
pora
ry w
orke
rs o
ut o
f tot
al e
mpl
oyee
sAv
erag
e 19
95-2
007
ESP FIN SVN FRA GER ITA DNK SWE AUT HUN NLD CZE UK IRL BEL
020
4060
Sha
re o
f tem
pora
ry w
orke
rs o
ut o
f tot
al e
mpl
oyee
sAv
erag
e 19
95-2
007
ESP SWE NLD SVN FIN GER FRA DNK ITA AUT CZE IRL BEL HUN UK
UK UK
UK UK

23
Figure 8 Proportion of temporary workers by sector* (Average 1995-2007) (continued) Share of temporary workers out of total employees in Hotels
and Restaurants (Average 1995-2007) Share of temporary workers out of total employees in
Transports (Average 1995-2007)
Share of temporary workers out of total employees in Finance
and Real Estate (Average 1995-2007) Share of temporary workers out of total employees in Public
Administration (Average 1995-2007)
020
4060
Shar
e of
tem
pora
ry w
orke
rs o
ut o
f tot
al e
mpl
oyee
sA
vera
ge 1
995-
2007
ESP SWE NLD SVN ITA FIN FRA GER AUT DNK IRL BEL CZE HUN UK
020
4060
Shar
e of
tem
pora
ry w
orke
rs o
ut o
f tot
al e
mpl
oyee
sA
vera
ge 1
995-
2007
ESP NLD SWE SVN FIN GER FRA ITA DNK UK AUT BEL IRL CZE HUN
020
4060
Shar
e of
tem
pora
ry w
orke
rs o
ut o
f tot
al e
mpl
oyee
sAv
erag
e 19
95-2
007
ESP SVN FIN NLD SWE GER FRA ITA CZE BEL UK DNK HUN IRL AUT
020
4060
Shar
e of
tem
pora
ry w
orke
rs o
ut o
f tot
al e
mpl
oyee
sAv
erag
e 19
95-2
007
ESP FIN SWE FRA GER SVN DNK NLD BEL ITA CZE UK AUT HUN IRL
Share of temporary workers out of total employees in
Energy Sectors (Average 1995-2007) Share of temporary workers out of total employees in
Mining (Average 1995-2007)
020
4060
Shar
e of
tem
pora
ry w
orke
rs o
ut o
f tot
al e
mpl
oyee
sAv
erag
e 19
95-2
007
ESP NLD FIN BEL GER UK AUT FRA ITA CZE HUN
020
4060
Sha
re o
f tem
pora
ry w
orke
rs o
ut o
f tot
al e
mpl
oyee
sA
vera
ge 1
995-
2007
ESP UK GER CZE
UK
UK
*For Energy Sectors and Mining data are available only for a limited number of countries of our sample.
5. Econometric analysis
5.1 Estimation strategy
In this section we focus on the causal relationship between protection of temporary workers
(EPLT) and total factor productivity growth (TFP). We also include other control variables,
i.e. protection of regular workers (EPLR); disembodied innovation (captured by R&D
intensity) and product market regulation (PMR).
UK
UK
UK UK

24
The empirical strategy is based on the assumption that EPLT influences efficiency growth in
those sectors which need more flexibility to be successful and adjust employment more than
others. We thus exploit differences across sectors to implement a difference-in-difference
method for our sample of 10 industries in 14 EU economies. In this sample, we test the
hypothesis that lower restrictions depress TFP growth in those industries where the
propensity to use flexible employment arrangements are higher. This propensity is measured
in the UK, since this country has the lowest employment protection levels, for both
temporary and regular workers, as noted above. We assume that the differences in
propensity to assume temporary workers in the UK are only motivated by technological and
other sector-specific factors, irrespective of influences caused by protection legislation.
More precisely, following Rajan and Zingales (1998) and Bassanini et al. (2009), we assume
that the difference in TFP growth between any pair of industries (h and k) is equal to the
expected value (E) of a function of EPLT and its change, multiplied by a function g of the
difference between the propensity to employ temporary workers which we find in the two
industries. We also assume that f is linear and g is an identity function g(x) = x. We obtain:
))Λg(ΛΔELPT),Λg(Λf(ELPT=]TFPΔTFPE[Δ hkithk1itihtikt lnln
where TFPikt denotes TFP in country i and time t, k, and h index the pair of industries, and
Λ is the average sectoral propensity to use temporary workers over the period 1995-2007 in
the benchmark country (the UK). The difference in the “natural” propensity to employ
temporary workers among various industries, multiplied by the different stringency of EPLT
across the countries of our sample, explains the differences in TFP growth rates at sector-
country level.

25
Figure 9 Proportion of temporary workers by sector at beginning and end of period 1995-2007 All countries
Agriculture
Constructions
Financial Intermediation, RE &Business Serv.
Hotels&Restaurants
Manufacturing
Community, Social &Personal Serv.
Transports, Storage&Communications
Wholesale&RetailTrade
1015
2025
3035
5Sha
re o
f tem
pora
ry w
orke
rs b
y se
ctor
s in
200
7A
ll co
untri
es
5 10 15 20 25 30 35Share of temporary workers by sectors in 1995
All countries
UK
Agriculture
Constructions
Financial Intermediation, RE &Business Serv.
Hotels&Restaurants
Manufacturing
Community, Social &Personal Serv.
Transports, Storage&CommunicationsWholesale&RetailTrade
45
67
89
10
Sha
re o
f tem
pora
ry w
orke
rs b
y se
ctor
s in
200
7U
K
4 6 8 105 7 9Share of temporary workers by sectors in 1995
UK
We adopt a similar strategy for protection of regular workers (EPLR). In this case, Λ is the
average lay-off propensity over the period 2001-2007 in the benchmark country (UK). Since

26
where i = 14 countries, j = 10 sectors, t = 1995,…2007, and EPL is the overall indicator,
obtained by considering EPLT and EPLR, in turn multiplied by Λ, the indicator equal to the
average industry propensity to use temporary workers in the years of our observation period.
We also include country by year dummies, Dit and sector dummies Dj to control for highly
sector-specific factors which probably influenced TFP growth and which cannot be captured
by means of the labour policy control variables included in our analysis. For instance,
unemployment protection, measured by replacement ratios and duration of unemployment
benefits, should be included as determinants of TFP, but are omitted due to the lack of
availability of time-varying data.
Lastly, we also control for the distance from the technological frontier by inserting the
indicator mentioned in section 3.
The only difference in this second specification is the insertion of log Rel TFP, the distance
from the technological frontier, and Dit, the sector by year dummies. This allows us to omit
controlling for the growth rate of the industry productivity frontier, as reported in Bassanini
et al. (2009).
It must be remarked that specific tests check both heteroscedasticity across panels and
autocorrelation within panels. This is why we fitted a panel-data linear model by using the
feasible generalized least squares method4. The results are shown below.
5.2 Econometric results
5.2.1 Effects of regulation of temporary workers
This subsection presents our main results. Table 3 lists the estimates for the baseline
specifications testing the role of job protection for temporary and regular contracts (EPLT
and EPLR) and their changes (ΔEPLT and Δ EPLR). As noted above, the effects of EPLT
on total factor productivity growth were estimated by means of a difference-in-difference
model on industry-level data, the assumption being that the effect of liberalisation policies
for temporary jobs on TFP growth is greater in industries where the propensity to use
temporary contracts (“policy-binding industries”) is higher.
4All estimates were carried out by STATA 10. Routines adopted, preliminary and post-estimate tests are available upon request.
27
Analogously, we estimated the role of EPLR on TFP growth assuming that the effect of
liberalisations of regular jobs is more important in industries where the layoff propensity is
higher (“policy-binding industries”) (see Bassanini et al., 2009).
The UK temporary contract rates or lay-off rates for each industry are thus used to proxy for
the natural propensity of industries to make high recourse to numerical flexibility in labour
arrangements.
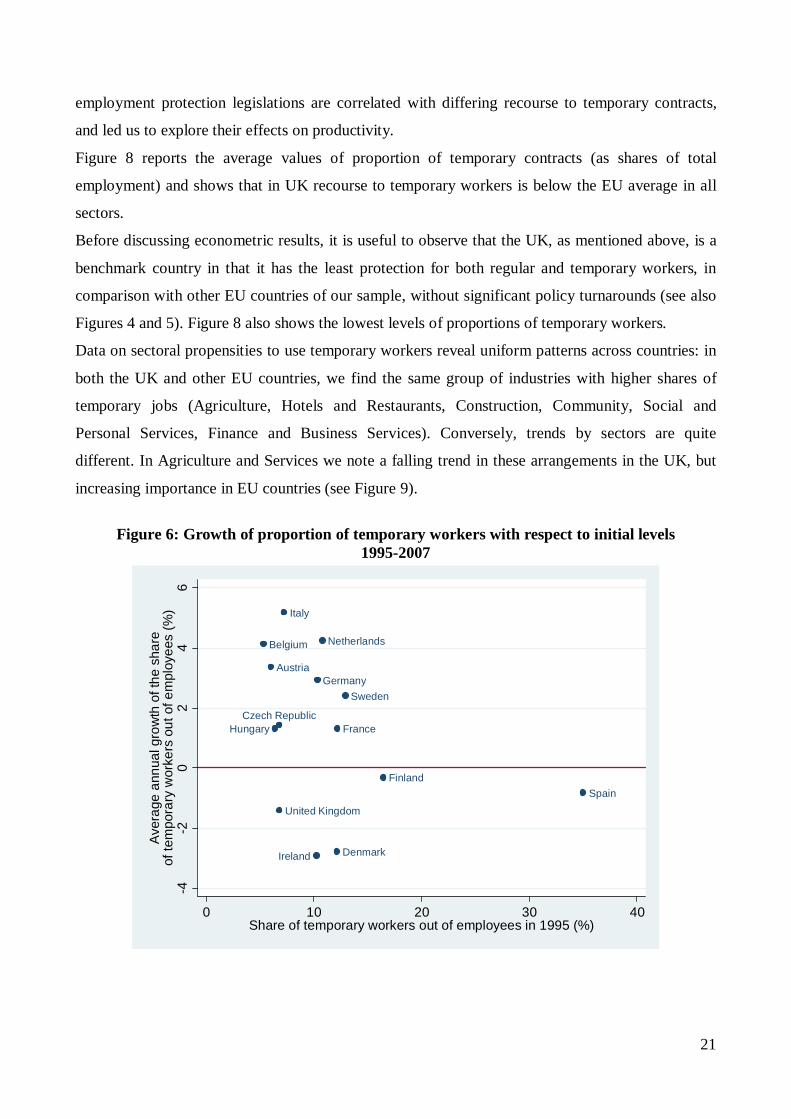
Table 3 shows the positive influence that protection of fixed-term and temporary work
agency (EPLT) exert on TFP growth: both variables, EPLT and Δ EPLT, induce increases in
differences in TFP growth between the two sectors.
Let us now consider the role of EPLT. According to our estimates, one-point restriction on
this legislation should increase by 0.10-0.12 percentage points the difference in TFP growth
between two industries whose average propensity to employ temporary workers rate differs
by 1 percentage point. Note that, even if the estimated effect for EPLT appears to be small,
it is not negligible, since it depends both on the magnitude of change in the EPL indicator
and on sectoral propensities to employ temporary workers. An interesting case in point is
Italy, the country of our sample, which has made the most radical changes in relaxing
temporary job provisions and at the same time recorded the worst performance in efficiency
growth. Let us consider the case of two Italian industries: i) Financial Intermediation, Real
Estate and Business Services and ii) Manufacturing. The first sector has shown higher use
(an average difference around 2.40 percentage points over the period 1995-2007) of
temporary contracts with respect to the other. According to our estimates, the difference in
TFP annual growth between these two sectors would have increased by 0.24 percentage
points in favour of the former for each easing of EPLT by 1 point. This also implies that, if
from the mid-1990s Italy had not lowered restrictions for temporary contracts by 3.5 points,
the difference in the cumulate growth rates of TFP between the same industries would be
10.9 percentage points higher in favour of Finance Real Estate and Business Services
(instead of the differential rate of 3% actually obtained).
The underlying propensity to use temporary contracts and make workforce adjustments in
the absence of EPLT regulation has been also proxied by industry-level UK lay-off rates –
defined as the percentage ratio of annual redundancies to total employment – as done by
Bassanini et al. (2009)5. Our results show that using lay-off rates is not a good choice for
testing the role of EPLT, as revealed by the non-significant effect shown in our estimates
5The authors also use alternative indicators, such as turnover rates, which are more appropriate than lay-off rates to test the role of EPLT

28
(column 2), and our preferred specifications (see also other estimates reported below)
include the share of temporary workers6.
Our findings also signal no significant effects of restrictions for regular jobs and their
changes, as seen from the non-significant coefficients for EPLR and ΔEPLR. Analogous
non-significant effects are obtained for both the lay-off-based and temporary-based
classifications of EPL-binding industries (columns 4 and 5). Controlling for EPLR, we
further have checked our main results and have found that the estimated effect of EPLT is
negative and significant and has approximately the same magnitude (see columns 4 and 5).
Lastly, the estimates of Table 3 have two important specific controls. Countries may be in
different stages of their development and exposed to different demand dynamics; we thus
inserted country-time dummies in all specifications, to take into account country-specific
development and business cycle effects. In addition, we include sector dummies, since
different industries may be in very different stages of their life-cycles and industry-specific
effects must also be taken into account.
6 We also ran all specifications listed in Table 3 with interaction terms EPLT x Lay Off and Δ EPLT x Lay Off, but found that the coefficients were never significantly different from zero. All these results, not reported in Table 3 for reasons of space, are available upon request.

29
Table 3: TFP estimates for period 1995-2007, baseline specifications
Obs. 1670 1169 1670 1670 1670 Groups 140 140 140 140 140 Dependent Variable: TFP (growth rate) 1 2 3 4 5 Explanatory variables EPLT x Temporary Workers Share 0.103*** 0.105*** 0.120*** 0.118*** (0.026) (0.027) (0.017) (0.028) EPLT x Lay Off 0.009 (0.031) EPLT x Temporary Workers Share 0.004** 0.004* (0.002) (0.002) EPLR x Lay Off -0.022 -0.019 (0.063) (0.063) EPLR x Lay Off 0.011 (0.013) EPLR x Temporary Workers Share -0.040 (0.052) EPLR x Temporary Workers Share -0.002 (0.009) Country -by-year dummies Yes Yes Yes Yes Yes Sector dummies Yes Yes Yes Yes Yes Wald chi2 663.17 391.75 659.77 669.61 676.75 Prob > chi2 0.00 0.00 0.00 0.00 0.00
Standard errors in parentheses.
*** significant at 1% level; ** significant at 5% level; *significant at 10% level
5.2.2 Robustness checks Product market regulation and R&D may induce changes in TFP growth. As seen above, in our
sample some sectors had better TFP performance than others, indicating that there are important
product market characteristics which determine these outcomes. One probable candidate is the
degree of competition, which varies across industries.
There is now a consensus view that product market regulation (PMR) has an autonomous effect on
cross-industry productivity differences, since competition may boost innovation and growth. Two
main channels can be identified to explain this causal link: i) competition stimulates incumbent
companies to increase their TFP by adopting new technologies and innovations; ii) and favours a
process of creative destruction generated by the entry of new innovators and exit of former
innovators, as clearly shown in the new Schumpeterian approach proposed by Aghion and Griffith
(2005).
Within the EU, regulatory reforms have never differed so greatly as in recent times, and the
different pace of product market reforms may contribute towards explaining EU divergences in
TFP. This point has been stressed by Nicoletti and Scarpetta (2003) in presenting OECD evidence
for regulation and productivity growth. They signal that “regulatory policies diverged in relative

30
terms, with a widening variance of approaches across countries in the most recent period.
Paradoxically, the recent divergence in policies is widest within the EU, despite efforts by the
European Commission to harmonize the business environment in the Single Market.”(p. 18). In
addition, most of the regulatory reforms were driven by sector-specific easing of regulation.
Previous works have verified these hypotheses and estimated the role of product market regulation
through cross-country studies. Among others, the study mentioned above, Nicoletti and Scarpetta
(2003) tested the role of PMR on total factor productivity for a sample of 23 industries in 18 OECD
countries over the period 1984-1998. They found that productivity growth was closely and
positively linked to liberalisation of product markets, suggesting that limited regulatory reforms
may contribute to explaining the poor performance of European countries, especially in sectors
where Europe has accumulated a technology gap.
In our study, we also address the importance of sector-specific regulatory interventions by including
time-varying measures of product market regulation (PMR) differentiated by sector. We also
control for the role of changes in PMR to capture the role of modifications in competition in each
industry by using the OECD indicator updated to 2007. Lastly, we include as sectoral covariates not
only time-varying measures of product market regulation, but also by-sector R&D. The results are
reported in Table 4.
Our results confirm the significant role played by the regulatory framework, since we find that TFP
improves more in sectors where PMR is lower (column 1), which means that organisational
improvements, captured by the residual measure TFP, are more likely to be adopted where firms are
operating in competitive product markets. We also include changes in PMR and find that all these
covariates have the expected negative sign, although they are not always significant.
The second sectoral covariate is R&D intensity (Table 4, columns 3 and 4). We expect, as clearly
reported by Inklaar et al. (2008, p. 148-149), that many factors cause changes in TFP, including all
computing errors due to the existence of unmeasured inputs.7Our estimates for R&D confirm this
hypothesis. It is worth noting that, even with these controls, EPLT exerts a positive influence on
TFP growth.
7 A recent work documents the importance of computing intangible assets to obtain more precise estimates of TFP (Corrado et al., 2009). From their case-study on the the US non-farm business sector, the authors find that the average annual growth of total factor productivity for the period 1995-2003 falls from 1.42 to 1.08 when intangibles are included. They show that “On the input side, intangibles reached parity with tangible capital as a source of growth after 1995, and when the two are combined, capital deepening supplants MFP as the principal source of growth” (p. 683).

31
Table 4: TFP estimates for period 1995-2007, inclusion of PMR and R&D Obs. 1670 1670 1471 1471 Groups 140 140 130 130 Dependent Variable: TFP (growth rate) 1 2 3 4 Explanatory variables EPLT x Temporary Workers Share 0.094*** 0.114*** 0.122*** 0.141*** (0.027) (0.028) (0.031) (0.019) EPLT x Temporary Workers Share 0.004* 0.004* (0.002) (0.002) EPLR x Lay Off -0.021 -0.018 -0.032 -0.012 (0.062) (0.063) (0.057) (0.064) EPLR x Lay Off -0.008 0.002 (0.013) (0.013) PMR -0.024* -0.015 -0.028* -0.018 (0.015) (0.015) (0.016) (0.016) PMR -0.074** -0.088*** (0.029) (0.028)
R&D 0.266*** (0.006)
0.249*** (0.065)
Country-by-time dummies Yes Yes Yes Yes Sector dummies Yes Yes Yes Yes Wald chi2 655.32 658.70 405.66 661.99 Prob > chi2 0.00 0.00 0.00 0.00
Standard errors in parentheses.
*** significant at 1% level; ** significant at 5% level; *significant at 10% level
5.2.3 Augmented model: the distance from the technological frontier and other controls
The final set of estimates includes the variable Rel TFP, which measures the distance from the
technological frontier of a given industry and is defined as the difference between the log of TFP in
industry j, country i, time t, and the log of TFP country leader in the same industry, at the same
time. Hence, the country-industry having the maximum TFP among all sample countries in a given
year is identified as the technological leader for that year. Catch-up implies that the country-sector
is able to shorten the distance from the frontier and, according to this hypothesis, the expected sign
for Rel TFP is negative. Our findings support the convergence hypothesis, as shown by the negative
and significant coefficient for Rel TFP in all specifications (Table 5, panel A, columns 1-4).
Until now, we have tested the role of protection of regular workers, focussing only on firing costs
for individual dismissals and obtaining their irrelevance on TFP growth. A robustness check has
been performed by including, as done by Bassannini, Nunziata and Venn (2009), a refined indicator
of EPLR which also takes collective dismissals into account8. Replacing EPLR with the new and
more comprehensive indicator, the estimated effects for regulations on individual and collective
8 This indicator is computed as the weighted average of EPLR (time-varying) and EPLC (in 1998) with weights 5/7 and 2/7.

32
dismissals remain non-significant, whereas temporary protection is still positive and significant
(Table 5, Panel B).
These results appear to be robust to the last sensitivity test, performed by excluding the aggregate of
‘Community, Social, Personal Services and No-Market Services’ (Table 6, columns 1-4). The
elimination of this sector, which includes government, health and education, is due to measurement
problems, which make calculations of output and productivity highly problematic, thus justifying its
exclusion, as done in similar analyses (see also EU KLEMS guidelines, 2007)9. Our findings,
restricted to market economy, confirm significant and negative effects of EPLT: lower restrictions
on temporary jobs have negative effects in industries of the market economy where, in the absence
of regulations, firms tend to rely on short-term positions to make workforce changes.
9 http://www.euklems.net/.

33
Table 5: TFP estimates – inclusion of distance from technological frontier
PANEL A (period 1995-2007) Obs. 1418 1418 1257 1257 Groups 119 119 111 111 Dependent Variable: TFP (growth rate) 1 2 3 4 Explanatory variables
Rel TFP -1.593*** (0.385)
-1.533*** (0.387)
-1.342*** (0.420)
-1.265*** (0.423)
EPLT x Temporary Workers Share 0.076*** 0.076*** 0.106*** 0.106*** (0.028) (0.029) (0.033) (0.034) EPLT x Temporary Workers Share -0.000 -0.000 (0.002) (0.003) EPLR x Lay Off -0.006 -0.003 -0.008 0.003 (0.058) (0.060) (0.059) (0.061) EPLR x Lay Off -0.007 0.000 (0.012) (0.013) PMR -0.091*** -0.085*** -0.104*** -0.095*** (0.018) (0.018) (0.020) (0.020) PMR -0.056* -0.072** (0.030) (0.030)
R&D 0.226*** (0.076)
0.232*** (0.075)
Country-by-Year dummies Yes Yes Yes Yes Sector-by-Year dummies Yes Yes Yes Yes Wald chi2 939.74 934.91 832.10 842.76 Prob > chi2 0.00 0.00 0.00 0.00
PANEL B (refined EPLR, period 1998-2007) Obs. 1061 1061 975 975 Groups 119 119 111 111 Dependent Variable: TFP (growth rate) 1 2 3 4 Explanatory variables
Rel TFP -1.328*** (0.403)
-1.276*** (0.406)
-1.396*** (0.459)
-1.331*** (0.460)
EPLT x Temporary Workers Share 0.126*** 0.124*** 0.171*** 0.167*** (0.031) (0.031) (0.034) (0.035) EPLT x Temporary Workers Share -0.000 -0.001 (0.003) (0.003) EPLR(individual and collective dismissals) x Lay Off -0.013 -0.028 0.000 -0.010
(0.083) (0.084) (0.085) (0.086) EPLR(individual and collective dismissals) x Lay Off -0.009 -0.014
(0.019) (0.019) PMR -0.046** -0.041** -0.052** -0.048** (0.020) (0.020) (0.021) (0.021) PMR -0.050* -0.058* (0.030) (0.031)
R&D 0.186** (0.086)
0.197** (0.086)
Country-by-Year dummies Yes Yes Yes Yes Sector-by-Year dummies Yes Yes Yes Yes Wald chi2 832.33 837.77 801.18 803.91 Prob > chi2 0.00 0.00 0.00 0.00
Standard errors in parentheses.
*** significant at 1% level; ** significant at 5% level; *significant at 10% level

34
Table 6: TFP estimates for period 1995-2007, inclusions of distance from – market economy
Obs. 1275 1275 1119 1119 Groups 107 107 99 99 Dependent Variable: TFP (growth rate) 1 2 3 4 Explanatory variables
Rel TFP -1.492*** (0.398)
-1.451*** (0.399)
-1.280*** (0.427)
-1.209*** (0.431)
EPLT x Temporary Workers Share 0.084** 0.092** 0.126*** 0.128*** (0.034) (0.035) (0.045) (0.047) EPLT x Temporary Workers Share 0.002 -0.0005 (0.003) (0.004) EPLR x Lay Off -0.009 -0.012 -0.016 -0.027 (0.098) (0.102) (0.099) (0.103)
EPLR x Lay Off 0.012 (0.020) 0.013
(0.022) PMR -0.096*** -0.088*** -0.106*** -0.097*** (0.019) (0.018) (0.022) (0.022) PMR -0.055* -0.071** (0.032) (0.032)
R&D 0.198*** (0.080)
0.201*** (0.080)
Country-by-Year dummies Yes Yes Yes Yes Sector-by-Year dummies Yes Yes Yes Yes Wald chi2 889.70 890.44 799.92 817.27 Prob > chi2 0.00 0.00 0.00 0.00
Standard errors in parentheses.
*** significant at 1% level; ** significant at 5% level; *significant at 10% level
Summing up, our results confirm the negative influence of liberalising fixed-term and temporary
work employment, which probably tends to discourage training and the acquisition of firm-specific
skills. These results are explained by the model formalized by Ricci and Waldmann (2010). In the
context of a typical situation faced by young, newly hired workers in economies where workers are
liquidity-constrained, those workers cannot afford the cost of training by accepting a wage cut –
with the implicit promise of receiving some kind of training financed by the firm. In addition, under
contract incompleteness, this promise is not enforceable and there will be hold-up problems, the
consequence being that firms will train less than would be socially optimal. In such a situation, the
introduction of a small (or a positive change in) firing tax for new hired workers would increase
training and productivity. All our findings give support to these claims.

35
Conclusions
We find that, since 1995, EU countries have not followed homogenous patterns of growth, and
further heterogeneity has been caused by sectoral diversities: between-sector gaps are crucial and
the worst performances of total factor productivity are recorded in some service sectors.
We have analysed these country-sector disparities in 14 EU economies and then have focussed on
some driving forces such as the stringency of employment protection of temporary jobs. Our
empirical results suggest that liberalisation has had a detrimental influence on TFP, especially in
sectors where firms are more used to opening short-term positions.
One interpretation of these findings is that low levels of employee protection, discouraging long-
term relationships, do not offer incentives for workers to upgrade their skills and produce under
training investments financed by firms. Our results, obtained including the sectoral dimension,
show that, in industries where the propensity to use flexible labour arrangements is higher, labour
deregulation may have perverse effects. In contrast, we find no evidence of significant effects of
reforms concerning regular contracts for the years 1995-2007.
Our estimates also confirm the significant role played by the regulatory framework, since we find
that TFP has improved more in sectors where PMR is lower, which means that organisational
improvements, captured by the residual measure TFP, are more likely to be adopted where firms
operate in competitive product markets. Expectedly, efficiency does accelerate with distance to the
technological frontier.
These findings have been validated by various robustness checks. We have controlled for
employment protection of regular workers, considering restrictions on individual and collective
dismissals, and have used alternative indicators for the propensity to use flexible employment
arrangements. Lastly, our regressions cover whole sectors, but are also restricted to the market
economy, the growth accounting of which is affected by minor measurement problems.
Concerning policy implications, our first general consideration refers to the opposite effects which
liberalisation of the labour and product markets have produced over the years 1995-2007,
characterised by remarkable recourse in various EU economies to fixed-term contracts. For these
years, unlike other studies focussing on the mid-1980s to the early 2000s, we have found that
protection for regular workers did not play any significant role, whereas protection for temporary
workers and pro-competitive product market policies did. In other words, deregulation of the
product market probably plays a positive role in efficiency growth, whereas liberalisation of the
labour market for temporary contracts negatively offsets this positive influence.
36
In addition, our results suggest that the scope of two-tier reforms seems to be limited, not only in
terms of non-lasting employment growth (as shown in other studies, e.g., Boeri and Garibaldi,
2007), but also on efficiency grounds. Countries can reach the same level of aggregate labour
flexibility, but they reach different TFP performance when they choose a different composition of
regular and temporary restrictions. If firms in high-EPL countries can circumvent strict regulations
by hiring workers for short-term jobs, they pay for this form of liberalisation in terms of poor TFP
improvements.
References Aghion P. and Griffith R. (2005) Competition and Growth, Reconciling Theory and Evidence,
Cambridge, MA, MIT Press. Autor, D.H., Kerr W.R. and Kugler A.D. (2007) Do Employment Protections Reduce Productivity?
Evidence from U.S. States. Economic Journal 117: F189-F217. Bassanini A., Nunziata L. and Venn D. (2009) Job Protection Legislation and Productivity Growth
in OECD Countries. Economic Policy 24: 349-402. Belot, M., J. Boone and van Ours J.C. (2007) Welfare-Improving Employment Protection.
Economica 74: 381-396. Bertola, G. (1990). Job security, employment and wages. European Economic Review 34: 851–86. Bertola G. (1994) Flexibility, Investment, and Growth. Journal of Monetary Economics 34: 215–
238. Bentolila, S. and G. Bertola (1990) Firing costs and labour demand: how bad is
eurosclerosis?.Review of Economic Studies 57: 381–402. Bertola, G. and R. Rogerson (1997) Institutions and Labor Reallocation. European Economic
Review 41: 1147-1171. Blanchard O. and Landier A., (2002) The Perverse Effects of Partial Labour Market Reforms: Fixed
Duration Contracts in France The Economic Journal: F214 -F244. Boeri T. and Garibaldi P. (2007) Two Tier Reforms Of Employment Protection: A Honeymoon
Effect?. The Economic Journal 117: F357–F385. Boeri T. and Jimeno J. (2005) The effects of employment protection: Learning from variable
enforcement. European Economic Review 49: 2057-2077. Brandt et al. (2005) Assessing The OECD Jobs Strategy: Past Developments And Reforms,
Economics Department Working Paper No. 429.

37
Corrado C., Hulten C. and Sichel D.(2009) Intangible Capital and U.S. Economic Growth. Review of Income and Wealth 55: 661–685.
Dew-Becker I. and Gordon R.J. (2008) The Role of Labor Market Changes in the Slowdown of
European Productivity Growth. NBER Working Paper 13840. Engellandt, A. and Riphahn R. (2004) Temporary Contracts and Employee Effort. CEPR
Discussion Paper no. 4178. European Commission (2004) Industrial Relations in Europe. European Commission Directorate-
General for Employment and Social Affairs Unit D, Brussels. EUROSTAT (2010) Science, technology and innovation in Europe. 2010 Edition. Eurostat
Statistical Books, Statistical Office of the European Communities, Luxembourg. Foster, L., Haltiwanger J. and Krizan C.J. (2006) Market Selection, Reallocation and Restructuring
in the US Retail Trade Sector in the 1990s, Review of Economics and Statistics, 88: 748-758. Garibaldi, P. (1998) Job Flow Dynamics and Firing Restrictions. European Economic Review 42:
245-275. Garibaldi, P. and G. L. Violante (2005) The Employment Effects of Severance Payments with
Wage Rigidities. Economic Journal 115: 799-832. Griffith, R., S. Redding, and J. Van Reenen (2004) Mapping the two faces of R&D: productivity
growth in a panel of OECD industries. The Review of Economics and Statistics 86: 883–95. Hopenhayn H. and Rogerson R. (1993) Job Turnover and Policy Evaluation: A General Equilibrium
Analysis, Journal of Political Economy 101: 915-938. Inklaar R., Timmer M.P. and van Ark B., (2008) Market services productivity across Europe and
the US. Economic Policy 53: 139-194. Nickell S. and Layard J. (1999) Individual Employment Contracts, in Ashenfelter O. and Card D.
(eds.), Handbook of Labor Economics, North Holland, Amsterdam Micco A. and Pages C. (2006) The Economic Effects of Employment Protection: Evidence from
International Industry-Level Data. IZA Discussion Paper 2433. Mortensen, D.T. and Pissarides C.A. (1994) Job creation and job destruction in the theory of
unemployment. Review of Economic Studies 61: 397–415. Mortensen, D.T. and C.A. Pissarides C.A: (1999) Unemployment responses to ‘skill biased’ shocks:
the role of labor market policy. Economic Journal 109: 242–265. Nickell, S.J. and Layard R. (1999) Labour market institutions and economic performance. In
Ashenfelter O. and Card D. (eds.) Handbook of Labor Economics, Amsterdam: North-Holland. Nicoletti, G. and S. Scarpetta (2003) .Regulation, Productivity and Growth: OECD Evidence.
Economic Policy36: 9-72.
38
OECD (2004), Employment Outlook, Paris. Rajan, R. and Zingales L. (1998) Financial dependence and growth. American Economic Review 88:559–86. Ricci A. and Waldmann R. (2010) Firm Financed Training and Pareto Improving Firing Taxes,
mimeo. Saint-Paul, G. (2002) Employment Protection, International Specialization, and Innovation.
European Economic Review 46: 375-395. Schivardi F. and Torrini R. (2008) Identifying the effects of firing restrictions through size-
contingent differences in regulation. Labour Economics 15: 482-511. van Ark B., O’Mahony M., Timmer M.P., (2008) The productivity gap between Europe and the
United States: trends and causes. Journal of Economic Perspectives 22: 25-44. Venn D. (2009); Legislation, collective bargaining enforcement: Updating the OECD employment
protection indicators, www.oecd.org/els/workingpapers. Wasmer, E. (2006). General versus specific skills in labor markets with search frictions and firing
costs. American Economic Review 96: 811–31.

39
APPENDIX
TABLE A1: DESCRIPTION OF VARIABLES
TFP (growth rate) Growth rate of Total Factor Productivity (sectoral-country data) Source: EU KLEMS database
EPLT Employment Protection of Temporary Contracts.
Source: OECD Temporary workers share
Share of Temporary Contracts (fixed-term and temporary employment): sectoral-country data. Source: EUROSTAT
EPLR Employment protection of regular workers against individual dismissal Source: OECD
EPLR (individual and
collective dismissals)
Index of employment protection for regular contracts including additional provisions for collective dismissals: weighted average of EPLR and EPLC, with weights 5/7 and 2/7, respectively. Source: our elaborations of OECD indicators.
PMR Product Market Regulation Source: OECD
R&D Sectoral R&D expenses standardised to value added Source: EUROSTAT
Rel TFP
Difference between log of TFP in industry j, country I, time t, and log of European productivity frontier for that industry. frontier defined for each industry as country with highest level of TFP. Source: Our elaborations of EUKLEMS and OECD databases
Lay-off UK Lay-off rates: UK Source: Quarterly Labour Force surveys, UK
Lay-off US Lay-off rates: US CPS Displaced Workers Supplement, UK