Temporary Help Agencies and Workers - Repositori UPF
40
Temporary Help Agencies and Workers’ Occupational Mobility ¤ J. Ignacio García–Pérez y U. Pompeu Fabra Fernando Muñoz–Bullón z U. Carlos III — May 2001 — Abstract This paper focuses on the occupational mobility of temporary help agency workers by studying their job–to–job upgrading chances as opposed to those who have not been hired through these intermediaries. A screening approach to the role of those labor ‘brokers’ suggests that agency work- ers may expect greater chances of upgrading from one occupation to an- other. Results obtained with a sample of Spanish workers show that work- ing through those intermediaries comparatively o¤ers stronger prospects of occupational upgrading for workers of a medium quali…cation level. This basic result is reinforced when the existence of self–selection into this type of intermediated work is appropriately taken into account. Keywords: Temporary help agencies, Screening, Self-selection, Switch- ing models. JEL Classi…cation: J24, J62, C34 ¤ This work has bene…ted from …nancial support by CICYT SEC99-1191. We would like to express our gratitude to the Spanish Ministry of Labor for providing the database for this research, to Dörte Dömeland-Narváez, Silvio Rendón and Ernesto Villanueva for all their help and to seminar participants at FEDEA, U. Pompeu Fabra, U. Málaga, U. del País Vasco and III International Workshop on Human Resources Management (Sevilla) for their suggestions and comments. The usual disclaimer applies. y Departament d’Economía i Empresa. Carrer Ramón Trias Fargas, 25-27. 08005 Barcelona (Spain). E-mail: [email protected] z Departamento de Ingeniería Mecánica, Sección de Organización de Empresas. Uni- versidad Carlos III de Madrid. Calle Madrid, 126. 28903 Getafe (Madrid). E–mail: [email protected]
Transcript of Temporary Help Agencies and Workers - Repositori UPF

Temporary Help Agencies and Workers’Occupational Mobility¤
J. Ignacio García–Pérezy
U. Pompeu FabraFernando Muñoz–Bullónz
U. Carlos III
— May 2001 —
Abstract
This paper focuses on the occupational mobility of temporary helpagency workers by studying their job–to–job upgrading chances as opposedto those who have not been hired through these intermediaries. A screeningapproach to the role of those labor ‘brokers’ suggests that agency work-ers may expect greater chances of upgrading from one occupation to an-other. Results obtained with a sample of Spanish workers show that work-ing through those intermediaries comparatively o¤ers stronger prospects ofoccupational upgrading for workers of a medium quali…cation level. Thisbasic result is reinforced when the existence of self–selection into this typeof intermediated work is appropriately taken into account.Keywords: Temporary help agencies, Screening, Self-selection, Switch-
ing models.
JEL Classi…cation: J24, J62, C34
¤This work has bene…ted from …nancial support by CICYT SEC99-1191. We would liketo express our gratitude to the Spanish Ministry of Labor for providing the database for thisresearch, to Dörte Dömeland-Narváez, Silvio Rendón and Ernesto Villanueva for all their helpand to seminar participants at FEDEA, U. Pompeu Fabra, U. Málaga, U. del País Vasco and IIIInternational Workshop on Human Resources Management (Sevilla) for their suggestions andcomments. The usual disclaimer applies.
yDepartament d’Economía i Empresa. Carrer Ramón Trias Fargas, 25-27. 08005 Barcelona(Spain). E-mail: [email protected]
zDepartamento de Ingeniería Mecánica, Sección de Organización de Empresas. Uni-versidad Carlos III de Madrid. Calle Madrid, 126. 28903 Getafe (Madrid). E–mail:[email protected]
1. Introduction
Temporary help agencies (THAs for short1 ) are companies that hire temporary
workers and send them out to do temporary work on the premises of, and under
the supervision of, client …rms solicited from the business world. Their key feature
is that workers remain on the THA’s payroll while working for the client …rm: i.e.,
workers engaged by THAs and placed at the disposal of client …rms become a part
of the triangular relationship between the worker, the THA and the …rm in which
the work is performed. This constitutes the main di¤erence with respect to other
variants on the use of temporary help like employee “leasing” …rms —which have
no role in worker recruitment or screening and basically take on the payroll of the
existing workforce from (mainly) small …rms in order to write the paycheck, pay
the taxes, prepare and implement personnel policies and other paperwork— or
private employment agencies —which do not directly contract workers and rather
limit their operation to only facilitating employment relationships between client
workers and …rms for a fee charged to either the employer or the employee.
In Spain THAs were allowed to operate for the …rst time under regulation
provided for by the 1994 labor market reform. Prior to this date, THAs had
developed in Spain in fairly anarchical conditions, free of the constraints of a
well–de…ned legal framework (for details, vid. Rodriguez–Piñero, 1992 and 1994).
During the last …ve years, the use of THA workers by employers has increased
tremendously. As can be seen in Table 1, in Spain the proportion of temporary
contracts managed by THAs over the total of temporary contracts registered in
the Spanish Public Employment O¢ce (Instituto Nacional de Empleo, INEM ) has
1Other frequent names in the literature in order to address to these private intermediaries(especially in the U.S.) are temporary sta¤ agencies, temporary work businesses, temporaryservices employment agencies or temporary services supply …rms.

almost multiplied by three between 1995 and 1999. Nowadays, almost 16 percent
of all temporary contracts are being managed by THAs. Among these contracts,
the majority are based on unskilled jobs (59 per cent in 1998). However, the
main clients of these …rms are not in general badly educated workers: in 1998,
the proportion of contracts in THAs for individuals in possession of secondary
or higher education was 76 per cent in contrast to a proportion of only 64.7 per
cent in the total number of registered contracts2 . Hence, as the THA labor force
becomes more numerous and diverse, it is important to explore which economic
implications this form of labor contracting may have for workers.
This objective is also important because the opponents to temporary help
agencies have been increasingly vociferous against the pernicious social reality
that those intermediaries are supposedly hiding.3 There is an implicit assump-
tion in much of the literature on motivations for employers’ reliance on THA–
intermediated work that this form of labor contracting serves primarily to bu¤er
…rms’ core regular employees from changing demand conditions and as a means
of cutting per–hour labor costs. Although these demand factors are obviously
relevant for discussing the importance in determining the growth of this form
of temporary employment, this approach neglects an important complementary
point of view: THAs develop a task of screening in order to match the individu-
als with the most appropriate level of skills to the jobs in question. It is to this
2Similarly, for the U.S. labor market, Segal (1996) …nds that personnel supply services workersare more educated, on average, than other hourly workers.
3Literature explaining THA work is scant and in general biased towards rejecting this formof labor contracting. Common criticisms are that (1) THA workers only receive brief assign-ments interspersed with relatively long periods of unemployment (Bronstein, 1991); (2) that notonly THA workers are paid less than core workers for working at similar types of jobs, but alsothat their chance of obtaining employee bene…ts are less than that for traditional core workers(Emerson, 1988; Moberly, 1987); (3) that such a situation may create uncertainty and greatereconomic risk for these workers (Blank, 1998); and (4) that extensive reliance on THA workersmay create two classes of employees: permanent workers with relatively secure, high–paying em-ployment and THA workers (along with temporary workers in general) who have only sporadic,low–paying work (Mangum et al., 1985).
2

issue that the present analysis is addressed. Our goal is to assess empirically the
importance of this THA screening role as revealed by how it may be a¤ecting
workers’ occupational mobility rates. It should be clear at the outset that we are
not asserting that those demand–driven factors are unimportant in in‡uencing
the growth of this form of labor contracting. Rather, we maintain that the THA
screening role is also relevant, judging by its e¤ect on the dynamics of workers’
occupational mobility. That is, we focus on an important indicator of economic
performance: the attainment of economic gain as people advance through their
careers. Our main hypothesis, then, is that workers engaged through those in-
termediaries will have improved chances of increasing their labor earnings over
time.
The analysis is tackled for the Spanish labor market with a data source recently
provided and constituted by the Social Security records. We have information for
a ten–year period on the complete employment histories of two groups of workers:
the …rst one is constituted by workers employed sometime by a THA; the second
one is composed by no–THA workers, and is taken as a control group. There
are two features of this empirical analysis that are worth emphasizing. First, we
provide a new data source for studying intermediation in the labor market in Spain
by making use of the Spanish Social Security records. So far, the lack of studies on
labor market intermediation is largely due to the absence of accurate data bases
on employment histories for workers; our database contains a better employment
history than any other longitudinal survey of comparable length. Second, we focus
on the major output of temporary help agencies, the employment history of their
workers, in order to understand the implications of this type of labor contracting.
Our dataset allows us to estimate the extent to which individual’s progress over
time is achieved by THA workers in comparison to no–THA workers. Mobility in
this study is de…ned as the change in workers’ occupational group as established
3

by the contribution category associated to its wage level. An econometric model
of occupational mobility is presented where the possible existence of self–selection
into THA–intermediated work is also taken into account by jointly estimating two
processes: one for the change in the worker’s occupational group and another one
for the previous selection of whether or not to be working through a THA. Thus,
we will use a switching model to test our hypothesis.
Main …ndings are that —with the only exception of highly quali…ed workers—
THA work allows workers to maintain constant their occupational trajectory more
often once the THA employment spell has …nished. Moreover, the probability of
occupational upgrading is higher for THA workers with a medium quali…cation
level, and that of occupational demotion much lower for those THA workers.
In addition, it is important to underline that self–selection does, indeed, matter:
without adjusting for self–selection bias —as regards THA versus no–THA work—
it is found that no–THA work is associated with similar (or even greater, in some
cases) expected upgrading chances than THA work, controlling for measurable
personal characteristics. However, accounting for self–selection, the chances of
occupational upgrading given THA work is substantially improved over that given
no–THA work.
We organize the paper as follows. First, we show the main theoretical predic-
tions upon which the empirical research is presented. Second, we describe the data
and the econometric model used in our analysis. Third, we present the empirical
results. The last section concludes.
2. Theoretical background
2.1. Screening
When hiring, one of the most important information concerns for …rms is the
“quality” of prospective employees. If individuals di¤er in their capabilities ac-
4

cording to the jobs they perform, and if substitution of labor is imperfect between
jobs, then …rms’ output will be larger if workers can be identi…ed and assigned to
their most productive use.
THAs constitute one of the screening devices available to …rms for identi…ca-
tion of these qualities. The tests implemented by those intermediaries to screen
job applicants —which often include written applications, interviews, physical
exams, cognitive/dexterity checks and reference checks— may well be used by
…rms as predictors of job productivity. It is precisely the imperfect information
about the quality of prospective employees which is giving a stimulus for THA
market screening4 . Indeed, several recent studies con…rm the notion for the U.S.
that THAs generate employees with high productivity; for instance, data on the
use and perceived e¤ectiveness (by employers) of THAs indicate that a majority
of users believed that temporary employees are as e¢cient as or more e¢cient
than regular employees5 . Users especially appreciate the fact that THAs assume
responsibility for sta¤ selection, an often complex task which is all the more bur-
densome when short–term recruitment is involved (Bronstein, 1991). In this same
vein, Houseman (1997) found that one–…fth of client …rms in the U.S. addressed to
THAs as a source for future recruitment6 . And, in some sectors, THAs represent
the primary way to auditing and hiring new workers (See, Autor, 2000). This
qualitative evidence therefore suggests that employers who use THAs seem to
regard workers hired through those intermediaries as being more “reliable” than
direct applications from prospective employees.
Does the fact of being hired by a THA a¤ect opportunity for advancement and
4Naturally, if productivity could be directly measured prior to employment, there would beno need for such screening.
5American Management Association (1991), “Temporary Help Survey Results”, ProfessionalManagement Bulletin, January.
6The use of …xed–term labor contracts in general has also been presented as a source ofcandidates for permanent jobs. For instance, Abraham (1988), found that 23 percent of …rmsthat used “‡exible” forms of employment intended to identify adequate candidates for permanentjobs
5
future wages? Suppose that two otherwise identical individuals end up working
in the same job of the same …rm, but one of them placed by a THA and the other
not. Will their career paths di¤er as a result of the di¤erent hiring procedures
they have gone through?7 In particular, can we expect individuals to achieve
occupational upgrading more likely out of THA jobs than others?
To answer these questions, consider an economy in which neither individu-
als —who di¤er in the comparative skills with which they can perform di¤erent
jobs— nor the market knows workers’ abilities, and where, in addition, …rms act
competitively and no intermediation by THAs were possible. Will the actual em-
ployer —who is able to know worker’s ability after the …rst employment period—
promote this employee to a better–payed job in the following period of work?
Naturally, the decision (or assignment rule) will consist of promoting the
worker if the bene…t obtained by promotion is higher than otherwise (i.e., it will
be the result of her pro…t maximizing behavior). Interestingly, Waldman (1984)
found that for some ability levels, workers will not be assigned to jobs that best
…t their ability: in particular, since the information about the worker’s ability
can be kept secret by her employer, and promotion constitutes a signal of high
ability, it would pay the actual employer to ine¢ciently underpromote some of
their employees (otherwise, the employer would have to pay a too high wage to
the promoted workers, since competition for workers would lead the employer to
pay their expected productivity given the assignment). This underpromotion re-
sult is undesirable because the barriers to better jobs that it creates would lead
those workers to be trapped in jobs either which they dislike or for which they
are relatively unsuited.
It is in this asymmetrically informed labor market where THAs’ screening
devices may be playing an important role. To see this, consider now the existence
7The term ‘path’ refers to the ability to increase one’s labor earnings over time.
6

of a THA which runs tests of ability before the …rst job assignment in order to
…lter out low–ability workers. Then, being a THA worker becomes a publicly
available part of the individual’s employment history: it identi…es her with a
superior group in the pool of workers. That is, the ability certi…cation by the THA
reveals worker’s quality and results in separation from top down. It can be shown
that this THA certi…cation of unobserved worker ability in a labor market under
asymmetric information results in equilibrium characterized by higher promotion
rates for THA workers8 . Therefore, the previous missasignment of workers to
tasks proved by Waldman (1984) can be therefore con…ned. The intuition behind
this result is that THA intermediation helps to attenuate information asymmetry
among employers in the economy: THA certi…cation makes public information on
worker’s ability and if the actual employer intended to underpromote some of the
workers (exploiting, again, the private information on workers’ true ability level),
then the THA would have incentives to reassign the temporary worker to another
…rm, since other …rms would bid for worker’s service.
2.2. Self–selection
To con…rm the predictions arising from these screening considerations, we have
to take into account a problem present in the data: the fact of observing a given
individual working through a THA is not exogenous to the characteristics which
determine whether the worker is promoted or not. That is, our attempt to compare
expected promotion chances of THA and no–THA workers su¤ers from a self–
selection problem.
Several explanations may be o¤ered to justify the presence of self–selection.
However, the most straightful may be to think on the determinants of addressing
to those intermediaries: we may expect that individuals will search employment
8Muñoz–Bullón and Rodes (2001) formalize this idea in a job–assignment signalling modelwhich builds on the ine¢ciency …rst pointed out by Waldman (1984).
7

through a THA only if THA-work o¤ers a particularly high net “return” (as
regards expected upgrading chances after leaving the THA) relative to no-THA
work. That is, it is natural to assume that individuals decide whether or not to
address to a THA to …nd a job depending on their expected upgrading chances
arising from this decision relative to the cost of addressing to a THA9 . Therefore,
according to this view, neither individuals with ability levels high enough to …nd a
better job without an intermediary THA, nor low–ability workers who will likely
fail to pass the THA screening tests will address to those agencies. Hence, it may
be considered that only those with “average” ability levels will address THAs10 .
In addition, it may be the case that workers decide to address THAs only
after direct methods to …nd a job have proved fruitless. Then, the group of
THA workers will be disproportionately composed by the “losers”, i.e., workers
who inherently have more di¢culty …nding direct jobs by themselves. It would
then be precisely those workers who cannot get a job via direct methods who
are e¤ectively “sorted” into the class of THA users11 . Again, and as explained
above, the unobservable characteristics which are making them address THAs
could also be a¤ecting their relative chances of promotion. Therefore, controlling
for the observable worker characteristics when explaining upgrading chances will
be insu¢cient, as some additional process may be in‡uencing those upgrading
9There exists evidence indicating that THA workers may be earning less than no–THAworkers for the same position in the same …rm; therefore, addressing to a THA to …nd a jobmay imply an opportunity cost for the workers. For instance, Blank (1998) found that themedian THA worker receives 63 percent of the wage received by full–time workers.10In the job assignment signalling model previously cited, it is proved the existence of a perfect
Bayesian equilibrium with THA certi…cation of workers’ ability characterized by: (1) a pool ofworkers which opt for certi…cation, this pool consisting of all workers of average ability; (2)and the remaining ones (low and high ability workers) who prefer to remain uncerti…ed (vid.Muñoz–Bullón and Rodes, 2001). Thus, being a THA worker identi…es the individual with the“average” group of workers in the candidate’s pool.11Indeed, as pointed out in the introduction, even though THA workers are not in general
badly educated workers, at the same time most of them are actually on unskilled jobs. This factindicates that —as opposed to no–THA individuals— those addressing to THAs may be havingunobservable variables which make them accept jobs requiring lower quali…cation levels that itmay be expected according to their skills.
8

chances, namely, the process determining whether or not an individual has worked
through a THA. Then, once we have controlled for this sorting e¤ect by taking
into account the self–selection problem present in the data, we will be better
able to analyze the extent to which the prediction of the screening considerations
stated above are con…rmed.
3. Data and variables
The data used are two representative random samples of workers from the Social
Security Records — Fichero de Vida Laboral— provided by the Spanish Ministry
of Labor. They contain the work history from 1990 until 1999 of 15,503 a¢liated
individuals, some of them working for a THA in some moment.12 The original
database’s total number of records is 301.277. Each record corresponds to the
a¢liation of an individual to a particular Social Security account and, therefore,
represents a spell of employment in a particular …rm (i.e., a matching).
The data provided includes information about age and gender of the workers,
professional category of the worker’s contribution to the Social Security13 , dates
when the employment spell starts and ends, type of Social Security system for the
worker, the reason for the termination of the spell (voluntary quit, dismissal or
retirement), the Spanish province where the employment spell took place, an iden-
ti…er indicating whether or not each employment spell is accomplished through
12In fact the sample criterium was to select people who were working for a THA at the 31stof December of 1995 and, as a control group, workers who were non-employed at the samedate. It must be underlined that this control group is not composed by long-term unemployedindividuals, who were, from the beginning, left out of the sample. That is, these non–employedindividuals also have several employment spells along the observed time period, both before andafter the end of 1995.13It must be underlined that the professional categories of the worker’s contribution to the
Social Security in the database do not collect the workers’ level of quali…cation, but the requiredlevel of quali…cation for the job. For instance, an individual working in the lowest category,“peón”, may well be in possession of an academic degree. In any case, we will refer to contributioncategories from here onwards as “quali…cation”, although this remark should be rememberedfor the subsequent analysis.
9

a THA and, …nally, the type of contract the worker is holding (temporary or
permanent).
We eliminate incomplete records and keep only workers a¢liated to the Gen-
eral System (Régimen General) in order to avoid the bias in the estimations that
special systems like Agriculture, Fisheries, and so on would provoke. In order to
achieve greater homogeneity, we also eliminate records destroyed for reasons other
than dismissals. In addition, we keep out of the samples all those employment
records were individuals are holding permanent contracts, since our focus is on
the e¤ect of THA work for individuals who are assigned to temporary assignments
in client …rms compared to other temporary workers (but not with those holding
permanent contracts). Moreover, given that in order to identify our switching
model (see next section) we use a variable indicating the proportion of THA con-
tracts over the total of labor contracts, and that no data for this variable were
disposable before 1995, we restrict our samples to those employment spells be-
ginning from the year 1995 onwards. Finally, in order to avoid capturing changes
that are solely attributable to good or bad years, we also control for the economic
cycle through the annually growth rate of the gross domestic product, and for the
geographical zone in‡uence through both the province unemployment rate and a
dummy for the region where the employment takes place14 . The Appendix o¤ers
a complete description of the variables used in the estimation process.
As other studies using data from the Social Security records have done15 ,
we group contribution categories in the following four groups: Quali…cation High
collects the highest level in between the contribution categories, that is, 1 (inge-
nieros and licenciados), 2 (ingenieros técnicos, peritos and ayudantes titulados)
and 3 (jefes administrativos and de taller). Quali…cation Medium–High collects
contribution categories 4 (ayudantes no titulados), 5 (o…ciales administrativos)
14Six zones are de…ned: Cataluña, Madrid, South, East, Center and North.15See, for instance, García–Fontes and Hopenhayn (1996), or García–Pérez (1997).
10

and 6 (subalternos). Quali…cation Medium–Low collects contribution categories
7 (auxiliares administrativos) and 8 (o…ciales de primera and segunda). Finally,
Quali…cation Low collects contribution categories 9 (o…ciales de tercera and espe-
cialistas) and 10 (peones). We also tried other di¤erent groupings of contribution
categories, and results obtained are maintained, although they are stronger with
the four–class classi…cation actually reported above; this is why we decided to
keep this classi…cation along the paper. In addition, wage di¤erences for this
classi…cation are signi…cant; according to a complementary data set, the median
1984 wage for those four groups in constant 1985 pesetas are: 160,824 for the
Quali…cation High, 110,772 for the Medium–High, 81,460 for the Medium–Low
and 74,763 for the Low group. Hence, the average di¤erences for those four groups
are quite important: 7.51% between the Low and Medium–Low, 37.38% between
the Medium–Low and Medium–High, and 47.51% between the Medium–High and
High16 .
Sample characteristics for each category group are presented in Tables 2, and
Table 3 collects empirical contribution category transitions across successive em-
ployment spells of each individual. In the highest skill category, THA workers are
predominantly men, 53.10%, and are more likely to be under 30 years–old than
no–THA individuals; from Table 3 we also obtain that THA workers in these
categories are substantially more likely to reduce their skill level from the actual
job to the following one when compared to no–THA high quali…ed individuals
(only 51.03% of THA workers keep constant their quali…cation when changing
jobs, as opposed to 75.08% of no–THA workers). Medium–High quali…ed THA
workers are more likely to be women, 62.68%, as opposed to no–THA workers,
only 46.41%. Again, THA individuals are much more likely to be under 30 years–
old. And, as can be observed in Table 3, THA workers from this quali…cation
16We would like to thank Samuel Bentolila and Olympia Bover for providing these information.
11

group are more likely to increase their occupational category across employment
spells. Medium–Low THA workers are basically women, 62.29%, and as in the
other previous groups, in this group many more THA workers than no–THA ones
are under 30 years–old. Table 3 shows that THA workers in these categories are
more likely to maintain constant and even increase their occupational category
than no-THA workers. Finally, both THA and no–THA low–quali…ed workers
are essentially men and younger workers (under 30). Finally, Table 3 shows that
THA low quali…ed individuals are less likely to achieve occupational upgrading
than equally quali…ed no–THA workers.
4. Econometric modelling
By analyzing upward and downward changes across jobs in the individuals’ Social
Security contribution category, we may capture the expected positive impact of
THA–intermediated work on individuals’ wage prospects. Each of the professional
contribution categories in the database has, as an associated element, a certain
range of base de cotización or ‘contribution base’. This constitutes the base for
the payroll tax. The higher the contribution category, the higher the individual
quali…cation level required for the job and, correspondingly, the higher the con-
tribution base associated with the job. This is con…rmed above when we provide
data on median wages for each of the category groups considered.
As the theory predicts (see Section 2 above) given that the THAs make public
individual information by signalling that she has an ability level above a minimum
required for becoming a THA worker, individuals who are employed through these
intermediaries are expected to experiment higher chances of mobility towards a
higher–level occupation after a non–employment spell. Therefore, we focus on
the extent to which —given an occupation of origin— THA–intermediated work
increases the likelihood of occupational upgrading. We consider this probabil-
12

ity of occupational upgrading as a proxy for the wage growth associated with
occupational mobility.
The extent to which the occupation can be improved is also likely to be a¤ected
by the duration of the non–employment spell in between both jobs. Two e¤ects
may be at work here. On the one hand, those who —while unemployed— face
more rapid skill depreciation, might be more likely to accept a job requiring a
quali…cation level below the ones of previously–held jobs. On the other hand,
staying more time unemployed may allow the worker to increase her ability to
look for better jobs, so that the likelihood of better matches could be increasing
with the duration of the unemployment spell. Another important variable which
has to be considered is the duration of the actual employment spell. As tenure in
the current job increases, the accumulation of human capital can be larger and,
therefore, the probability of occupational upgrading should be larger. Finally,
we also control whether or not the employer in the two jobs is the same or not.
We would expect that, after a non–employment spell, working in the same …rm
will have a positive impact on the probability of occupational upgrading. Two
factors may be at work here: …rst, after a …rst employment spell in the …rm, the
employer can screen out low–valued matches, so that the quality of the worker is
better assessed; second, working with the same …rm provides speci…c skills that
a¤ect productivity only as long as workers remain in the same …rm.
We model contribution category transitions by an ordered categorical depen-
dent variable which orders from 0 to 3 the possible changes in contribution cat-
egory, where 0 represents the worst outcome —maximum possible reduction in
quali…cation— and 3 the best outcome —maximum possible increase in quali-
…cation. We have used an ordered dependent variable because not only is the
likelihood of occupational upgrading relevant, but also the “vertical” distance be-
tween occupations. For instance, wage growth actually di¤ers if an individual
13

actually working through a THA as “auxiliar administrativo” expects to be as-
signed in the following mission to work as “subalterno” —which is the immediate
upper category— than if she expects to work as “o…cial administrativo” —i.e.,
two categories up from the actual one. We then use this categorical and ordered
variable as the dependent variable in an ordered probit model describing the verti-
cal distance between contribution categories in two successive occupations of the
same individual17 .
However, we cannot consider the e¤ect of working for a THA as only that of
another explanatory variable in the ordered probit model. As explained in Sec-
tion 2.2. above, a problem that we must take into account is the possibility of
individual self–selection: the data on labor histories that we have are generated
by individuals making choices of addressing or not to a THA to look for a job.
Controlling for the observable characteristics when explaining contribution cate-
gory changes is insu¢cient, as some additional process may be in‡uencing those
category changes, namely, the process determining whether or not an individual
works through a THA. As a consequence, the observed distribution of category
changes is determined by this choice, so that standard regression techniques would
lead to inconsistent estimates of the parameters. Therefore, it is necessary to test
whether selection into THA–intermediated work matters18 .
In order to analyze this issue, we propose a switching model which describes
the choice of THA work along with contribution category transitions under the
assumption that the assignment of individuals to the two groups is by self–selection
17We also estimated two di¤erent probit models, one for the increases in contribution cate-gories, and another for reductions in quali…cations in two successive occupations of the sameindividual, and results obtained do not signi…cantly di¤er from the ones presented with the useof our ordered probit model in the paper.18To be more precise, not only matters the decision of the worker of whether or not to address
to a THA to …nd a job. In addition, the THA decision of whether or not to hire the worker ispresent, given that we observe the worker in a THA spell only if she has actually been hiredby the THA. The database has no available information on individuals who addressed to THAsbut who were not …nally hired by them.
14

rather than by random assignment19 . To implement this model we use two
equations: a selection equation and a category equation.
The selection equation is given by:
z¤ = ¯ 0sxs + us (4.1)
where z¤ is the latent value of addressing to and being hired by a THA for each
worker. We observe a THA employment spell if z¤ > 0, and we observe a no–
THA employment spell otherwise. Vector xs collects worker characteristics, and us
captures unobserved individual speci…c heterogeneity in‡uencing both the decision
of addressing to a THA and the one by the THA of hiring the worker.
The category equations, one for each possible selection choice are given by:
y¤k = ¯0ckxck + uk; k = 0; 1 (4.2)
where 1 denotes THA and 0 denotes no–THA. That is, conditional on the individ-
ual’s choice of THA versus no–THA work, she may later achieve or not occupa-
tional upgrading (i.e., wage growth associated with occupational mobility). Her
initial THA versus no–THA choice enters endogenously into the category equa-
tions by estimating each equation conditional on the THA decision of the worker.
It is this category equation which is estimated by an ordered probit model with
four possible outcomes.
If xs does not contain at least one element that is excluded from the category
equations, the model is not well identi…ed.20 Therefore, satisfactory identi…ca-
tion requires data on factors that a¤ect the value of addressing to a THA but
do not directly a¤ect contribution category transitions. We have selected one
19This model is used normally to consider the e¤ect of an endogenous regressor over ourvariable of interest. Other papers applying this methodology to di¤erent aspects in the …eldof labor studies are, for example, Pezzin and Schone (1999), Carrasco (1998) or Prescott andWilton (1992).20However, given the non-linearity of the model, it can also be just functionally identi…ed.
15

variable from labor statistics that, given worker’s characteristics, we consider to
be unrelated to contribution category changes but is still related to the switching
behavior. This variable is the proportion of THA assignment contracts in each
province and year over the total of temporary contracts registered by the Spanish
Ministry of Labor. Whether a worker addresses or not to a THA may well be
correlated with the relative importance of THA contracts in the province where
she lives (so that as this number is higher, more workers are likely to consider
those intermediaries as potential employers). Therefore, in the analyses below,
we include this variable as another determinant of the selection equation, but we
exclude it from the category equations.
Since in the selection equation the observed dependent variable z assumes two
values, one if z¤ > 0 and zero otherwise, we can describe it by means of a probit
model.
Hence, the switching model can be rewritten as:
THA : y¤ = y¤1 if z¤ > 0
No–THA : y¤ = y¤0 if z¤ · 0
(u1; u0; uS) » N(0;§)
where z¤, y¤1 and y¤0 are given by equations (4.1) and (4.2), and § is the covariance
matrix of the error terms. As usual in switching models, we are able to estimate
the correlation coe¢cient between uS and u1 and that between uS and u0:
5. Empirical results
The estimations of the switching model for each quali…cation group are presented
in Tables 4-7. The “full” model in each of those tables accounts for self–selection,
while the “constrained” model imposes exogeneity of THA–intermediated work
16

in the contribution category equation and, therefore, constrains the correlation
coe¢cient between the selection and contribution category equations (½sc) to be
equal to zero.
Some results for the four groups of individuals can be commented from the
estimated selection equations. Age has an important negative impact on the
probability of working for a THA for any quali…cation group. Except for the
Low and High quali…cation groups, women are more likely to be THA workers
than men. As expected, workers in those Spanish provinces that present larger
yearly proportions of THA contracts are much more likely to work for THAs. And
(when signi…cant) workers are less likely to address to THAs the larger the growth
rate of the gross domestic product —which indicates that the THA business cycle
dependence can be considered as countercyclical. The provincial unemployment
rate has a signi…cant positive impact for the Medium–Low group (i.e., in provinces
with higher unemployment, the likelihood of addressing a THA is larger), while
it is signi…cantly negative for the Medium–High and Low groups. Finally, some
di¤erences can also be observed depending on which exact contribution category
inside each of the four groups the individual has: for example, individuals with
contribution category 3 (jefes administrativos and de taller) are more likely to
address a THA in the highest quali…cation group.
Contribution category equations for each group re‡ect the impact of individual
variables on the likelihood of occupational upgrading from the actual job to the
following one. Estimated coe¢cients vary in the full and constrained models due
to the existence of endogeneity in the THA indicator.
Except for Low–quali…ed THA workers, Age has a positive impact on the
likelihood of occupational upgrading (and at a decreasing rate for Medium–Low
and Low groups). In general, therefore, older workers are more likely to upgrade
their contribution category which —according to the fact that di¤erent categories
17

correspond to di¤erent wage levels— can be associated with steeper wage im-
provements.
We have also included as an explanatory variable the duration of the non–
employment spell in between the two jobs considered for each individual. Its
estimated e¤ect is not signi…cant for the highly quali…ed group, negative for the
Medium-High group, and positive both for Medium-Low quali…ed workers and for
THA Low quali…ed workers.21
With respect to the duration of the actual employment spell (i.e., tenure), the
results are not very clear cut. When signi…cant, the e¤ect is positive for THA
workers, while for no–THA individuals its e¤ect is negative for the Medium–High
category. Thus, the theoretical prediction of higher upgrading probabilities as the
job lengthens is only veri…ed for THA workers. However, we have to take into
account that our sample of estimation is exclusively composed of temporary jobs;
Table 2 shows the mean duration of those employment spells; as can be seen there,
only THA High–quali…ed workers present average durations beyond 200 days.
By last, those workers with two subsequent occupations within the same …rm,
present higher probabilities of occupational upgrading in all quali…cation cate-
gories but for the lowest one, where the e¤ect is negative. This result indicates
that workers in this group —where the quali…cation level cannot even be lower—
achieve occupational upgrading by changing employers: given that the actual em-
ployer already knows workers’ skills and that this type of jobs requires almost
no quali…cation, workers must address di¤erent …rms in order to work in jobs
requiring higher category levels.
Given that di¤erences in the estimated parameters among the full and con-
strained models vary from one quali…cation group to another and that the esti-
21In these two latter categories the e¤ect of this variable has been modelled through aquadratic polynomial along with a dummy variable, dur30, indicating whether (value 1) ornot (value 0) the non–employment spell of the individual is shorter or equal to 30 days. This isthe way of estimating the e¤ect of non-employment duration that o¤ered the best results.
18

mated coe¢cients do not show a sharp contrast between those two models, in order
to aid interpretation, we have calculated predicted probabilities of occupational
upgrading for THA and no–THA workers in Tables 8a and 8b. These tables show
the unconditional probabilities for each skill category both for THA and no-THA
workers; Table 8a reports those probabilities taking into account the self–selection
problem, while Table 8b does not. Important di¤erences attributed to the prob-
lem of self–selection exist between the predictions of the full and the constrained
model22 . We …nd that not accounting for self–selection understates the di¤erences
between THA and no-THA workers. When self-selection is correctly taken into
account, the probability of occupational demotion for THA workers in the two
Medium quali…cation groups is much lower when compared to the no–THA ones.
Moreover, the probability of increasing the professional category is 6.7% higher for
THA workers in the Medium-High category in the exogenous model (2.24% ver-
sus 2.10%) whereas this di¤erence is almost 46% once we control for self-selection
(2.13% versus 1.46%). The e¤ect of self-selection is even stronger for the Medium-
Low category: while the exogenous model predicts higher upgrading probabilities
for no-THA workers, the prediction is reversed once we control by self-selection.
Hence, we can conclude that, in general, the correction for self-selection in this
dataset is resulting in higher di¤erences between THA and no–THA workers.
Hence, according to Table 8a, THA workers can clearly expect “better” results
in the sense of attaining larger wage increases from one occupation to the sub-
sequent one for the Medium–High and Medium–Low groups. Moreover, having
worked for a THA is appealing for those two medium–quali…ed groups in the sense
of avoiding a reduction in the contribution category from the THA employment
spell to the following one. Furthermore, our results are consistent with the hy-
22It must be underlined that for no group do the full model estimations show at the same timenon–signi…cance of the correlation coe¢cients between the selection and category equations (atest of the hypothesis that there is no selection bias is a test of whether the correlation coe¢cient½sc is equal to zero, as this parameter captures the dependence between us and uc).
19

pothesis of the theoretical section. The principal e¤ect of having worked through
a THA is to enhance one’s expectations of occupational upgrading. Moreover, af-
ter controlling for self-selection, the e¤ect for medium-quali…ed groups is stronger;
this con…rms that those workers addressing THAs present unobservable variables
which make them “do worse” along their career path23 .
Going one step forward, we can work out what the predicted conditional prob-
abilities are, in order to study contrafactual probabilities. That is, we desire to
compare the probability of occupational upgrading of a THA worker conditional
on having been engaged by a THA and its contrafactual: i.e., what value this
probability would have acquired if the worker had not been hired by any THA.
Table 9 shows those estimated probabilities. In the …rst panel (Table 9a) the up-
grading probabilities conditional on having been hired by a THA are presented;
in the second panel (Table 9b) the ones conditional on not having been contracted
by a THA are shown.
We can then compare the upgrading and demotion probabilities of those hired
by THAs with their contrafactuals. For instance, for the case of high–skilled
workers (second and …rst columns, respectively, in Table 9a), we obtain that the
demotion probability would have been almost zero in case they had not been hired
by a THA (0.01 as opposed to the actual 51.74). A result in the same direction
is achieved in the subsample of no–THA workers (see Table 9b): their demotion
probability would have been higher in case they had been engaged by a THA
(46.03 as opposed to the actual 16.69). Therefore, this analysis indicates that
THAs do not constitute a proper mechanism in order for those workers to avoid
23We have carried out a test of robustness of this result by estimating a di¤erent modelwhere unobserved heterogeneity of these workers can be better treated. We have estimated aconditional logit model for the probability of upgrading and for that of occupational demotion,making use of the various observations we have for each of the workers in the sample. Theseresults, not shown, basically tell us that, after controlling for unobserved heterogeneity, theprobability of occupational upgrading is, for all category groups, 17.08% higher for THA workers.Moreover, the predicted probability of occupational demotion is 25.06% lower for THA workers.
20

occupational demotions.
As with the previously–obtained unconditional probabilities, the results for
Medium-High and Medium-Low skilled workers are improved when being engaged
by THAs. Those individuals present higher (lower) upgrading (demotion) proba-
bilities than in case they had not been THAworkers —compare columns 3 and 4 (5
and 6) for Medium–High (Medium–Low) skilled workers in Table 9a. Therefore,
for those two groups of workers, THAs are ful…lling a role of career develop-
ment via higher upgrading probabilities. As regards no–THA individuals in those
two medium–quali…cation groups (Table 9b), results do not signi…cantly di¤er for
Medium–High ones, while Medium–Low individuals would have improved their
expectations of wage growth had they become THA workers.
Finally, the impact of THA–intermediation in the labor market as regards the
career potential of the lowest quali…ed workers can be derived from columns 7
and 8 in Tables 9a and 9b: the contrafactual for those THA workers (Table 9a)
is slightly “worse” in terms of upgrading chances; that is, had not they addressed
a THA, their promotion probabilities would have been lower. However, on the
contrary, this result is not reinforced in Table 9b for the subgroup of no–THA
workers: those individuals would have su¤ered reduced expectations of category
improvements had they addressed THAs to …nd a job. Therefore, in spite of
the fact that THA and no–THA workers in this category group present di¤erent
expectations, they are being “correctly” assigned to the “best” subsample in terms
of upgrading chances: for those working through a THA, the intermediary seems
to work well and for those who have not addressed to a THA, their results in
terms of occupational upgrading would have been much worse had they worked
through a THA.
21

6. Conclusion
This paper has examined one of the patterns of occupational mobility related to
THA work in Spain. In particular, our emphasis has been on the extent to which
THA–intermediated work allows individuals to achieve occupational upgrading.
Our empirical testing of the dynamics of workers’ contribution categories is
tackled taking into account the possible existence of self–selection into THA–
intermediated work. That is, we develop a switching model which allows us to
describe the choice of THA work along with contribution category transitions
under the assumption that the assignment of individuals to THA and no–THA
work is by self–selection rather than by random assignment. This represents the
…rst attempt to estimate the determinants of the choice of THA over no–THA
work.
We obtain the main result that all skill categories of THA workers but the
highest one are, indeed, substantially more likely to avoid occupational demotion.
In addition, THA individuals in every category group —except for the lowest
one— present larger chances of occupational upgrading from one job to the fol-
lowing. This lack of career potential as regards the highest and lowest quali…ed
workers might be attributed to the model construction: this group of workers
cannot respectively upgrade (downgrade) their contribution category.
Our results may help to promote a recognition of the social value of Temporary
Help Agencies. Even though the present paper says nothing on the satisfaction
displayed by workers who are in this type of employment arrangement, on the
amount of wages or fringe bene…ts they may be receiving or on the actual level
of provision of social protections for those THA workers, we o¤er one reason why
THA work may be recognized as a valid form of employment in its own right
in spite of being certainly distinct from the standard employment relationship.
In particular, we have found that THA work can not be completely relegated to
22

a second–class status in which temporary workers are doomed to occupational
stagnation: at least, for some groups of workers in our study we have found no
support to the idea that THA work is a form of underemployment because THA
workers may be su¤ering from few advancement opportunities or little chances to
use their skills at the workplace.
23

Appendix: Explanatory variables
The explanatory variables used in this study are the followingones:
² Gender : 1 for men and 0 for women² Age: age of the individual at the beginning of the employment spell² dur(unemployment): length (in days, divided by 100) of the unemploymentspell following the actual employment spell.
² dur(employment): length (in days, divided by 100) of the actual employmentspell.
² Equal employer : 1 if the employer for the following employment spell is thesame as the one of the actual employment spell; 0 otherwise.
² % THA contracts: percent proportion of the number of THA assignmentcontracts registered in each province and year corresponding to the begin-ning year of the employment spell.
² Gross domestic product (GDP) growth rate: for the selection (category)equations, this variable collects the yearly growth rate of the GDP for thebeginning (ending) quarter of the employment spell.
² Unemployment provincial rate: for the selection (category) equations, thisvariable collects the unemployment rate for the province and the …rst quarterof the beginning (ending) year of the employment spell.
24

References
[1] Abraham, K. G. (1988). “Flexible Sta¢ng Arrangements and Employers’Short–term Adjustment Strategies”. In Robert E. Hart (ed.). Employment,Unemployment and Hours of Work. George Allen & Unwin, London.
[2] Autor, D. H. (2000). “Why Do Temporary Help Firms Provide Free Gen-eral Skills Training?”, mimeo (forthcoming in the Quarterly Journal of Eco-nomics).
[3] Becker, G. S. (1964). Human capital, 2nd. ed., Columbia University Press,New York
[4] Blank, R. M. (1998). “Contingent Work in a Changing Labor Market”. InRichard B. Freeman and Peter Gottschalk (eds.). Generating Jobs. How toIncrease Demand for Less–skilled Workers. New York, Russell Sage Founda-tion, pp. 258-294.
[5] Bronstein, A.S. (1991). “Temporary Work in Western Europe — Threat orCompliment to Permanent Employment?”. International Labour Review, vol.130 (3), pp. 291-310.
[6] Carrasco, R. (1998). “Binary Choice with Binary Endogenous Regressors inPanel Data: Estimating the E¤ect of Fertility on Female Labour Participa-tion”, CEMFI Working Paper No. 9805.
[7] Cohen, Y. and Y. Haberfeld (1993). “Temporary Help Service Workers: Em-ployment Characteristics and Wage Determination”. Industrial Relations,vol. 32, pp. 272-287.
[8] Emerson, M. (1988). “Regulation or Deregulation of the Labour Market”.European Economic Review, vol. 32, pp. 775–817.
[9] García–Fontes, W. and H.Hopenhayn (1996). “Flexibilización y Volatilidaddel Empleo”. Moneda y Crédito, vol. 201, pp. 205-227.
[10] García-Pérez, J. I. (1997), “Las Tasas de Salida del Empleo y el Desempleoen España (1978-1993)”, Investigaciones Económicas, XXI(1), pp. 29-53..
[11] Houseman, S.N. (1997). “Temporary, Part–Time and Contract Employmentin the United States: New Evidence from an Employer Survey”. W.E. UpjohnInstitute for Employment Research, Kalamazoo, Mich.
[12] Mangum, G., D. Mayall and K. Nelson (1985). “The Temporary Help In-dustry: Response to the Dual Labor Market”.Industrial and Labor RelationsReview, vol. 38, pp. 599-611.
25

[13] Moberly, R.M. (1987). “Temporary, Part–Time and Other Atypical Employ-ment Relationships in the United States”. Labor Law Journal, November, pp.689–696.
[14] Muñoz–Bullón, F. (1999).“Análisis Económico y Empresas de Trabajo Tem-poral”. Documentación Laboral, no. 60, vol. III, pp. 39–75.
[15] Muñoz–Bullón, F. and Rodes, E. (2000). “Temporary Workers, TemporaryHelp Agencies and Self–Selection in Labor Markets”, Mimeo, UPF.
[16] Neal, D. (1995). “Industry–Speci…c Human Capital: Evidence fromDisplacedWorkers”. Journal of Labor Economics, vol. 13 (4), pp. 653–677.
[17] Pezzin, L. and B.S. Schone (1999). “Intergenerational Household Formation,Female Labor Supply and Informal Caregiving: A Bargaining Approach”.Journal of Human Resources, vol. 34(3), pp. 475-503.
[18] Prescott, D. and D. Wilton (1992). “The Determinants of Wage Changes inIndexed and Nonindexed Contracts: A Switching Model”, Journal of LaborEconomics, Vol. 10(3), pp. 331-355.
[19] Rodriguez–Piñero Royo, M.C. (1992). Cesión de Trabajadores y Empresas deTrabajo Temporal. Ministerio de Trabajo y Seguridad Social, Madrid.
[20] ______ (1994). Las Empresas de Trabajo Temporal en España. Tirant loBlanch, Valencia.
[21] Segal, L. (1996). “Flexible Employment: Composition and Trends”. Journalof Labor Research, vol. XVII, no. 4, pp. 525–542.
[22] Segal, L. and D. G. Sullivan (1997). “The Growth of Temporary ServicesWork”. Journal of Economic Perspectives, vol. 11, no. 2, pp. 117-136.
[23] Waldman, M.(1984) “Job Assignments, Signalling and E¢ciency”. RandJournal of Economics, vol. 2, pp. 255-267.
26

Table 1Temporary contracts managed by THAs in Spain
Year Temporary Con-tracts (1)
Temporary Con-tracts managedby THAs (2)
Proportion[(2)/(1)]*100
1995 5,519,350 361,633 6.55%1996 8,273,175 748,601 9.05%1997 9,386,084 1,260,524 13.43%1998 10,692,315 1,707,842 15.97%1999 12,017,063 1,892,284 15.75%
Source: Spanish Ministry of Labor
27

Table 2Main sample characteristics for estimation of the magnitude of the
change in contribution category
Qual. High Qual.Med-High Qual.Med-Low Qual. LowTHA No THA THA No THA THA No THA THA No THA
Total 145 931 1,037 1,881 6,613 6,552 10,481 9,305Unempl. Dur. 27.76 41.03 40.55 37.20 38.03 35.21 36.93 34.35Employ. Dur. 220.37 83.05 116.18 88.96 87.83 94.72 79.30 101.36Equal Employer 19.31 29.75 35.29 21.79 38.76 19.17 34.64 16.64Male 53.10 37.49 37.32 53.59 37.71 62.21 66.57 62.44Contr.cat=1 34.49 42.33 — — — — — —Contr.cat=2 35.86 41.67 — — — — — —Contr.cat=3 29.65 16.00 — — — — — —Contr.cat=4 — — 9.64 9.73 — — — —Contr.cat=5 — — 44.45 41.04 — — — —Contr.cat=6 — — 45.91 49.23 — — — —Contr.cat=7 — — — — 65.34 33.21 — —Contr.cat=8 — — — — 34.66 66.79 — —Contr.cat=9 — — — — — — 20.23 33.89Contr.cat=10 — — — — — — 79.77 66.11Age 16-25 18.62 9.67 43.29 27.01 42.32 24.01 49.88 32.49Age 25-30 34.48 15.36 25.26 25.68 23.03 17.81 20.25 18.57Age 30-40 37.93 72.71 25.45 43.86 24.06 51.69 22.29 43.93Age>40 8.96 2.25 5.98 3.46 10.58 6.49 7.57 4.99
Notes: All variables are proportions with respect to the …rst rowexcept Employ. Dur. and Unempl. Dur. which represent the meanduration, in days, of the actual employment spell studied and of theintermediate spell of non–employment between this and the followingemployment spell.
28

Table 3Contribution category transitions across employment records
In a THA Not in a THAQuali…cation High= Qual. 51.03 75.08r Qual. = 1 18.62 4.94r Qual. = 2 14.48 9.24r Qual. = 3 15.86 10.74Quali…cation Medium-High¢ Qual. = 1 3.47 3.03= Qual. 46.67 41.57r Qual. = 1 24.78 22.59r Qual. = 2 25.07 32.80Quali…cation Medium-Low¢ Qual. = 2 1.24 1.04¢ Qual. = 1 6.43 5.83= Qual. 72.24 67.03r Qual. = 1 20.10 26.10Quali…cation Low¢ Qual. = 3 0.58 1.06¢ Qual. = 2 3.56 5.29¢ Qual. = 1 14.45 20.12= Qual. 81.40 73.53
Note: Transition rates are computed according to the distribution of con-tribution categories at employment record t + 1, conditional on the category atrecord t.
29
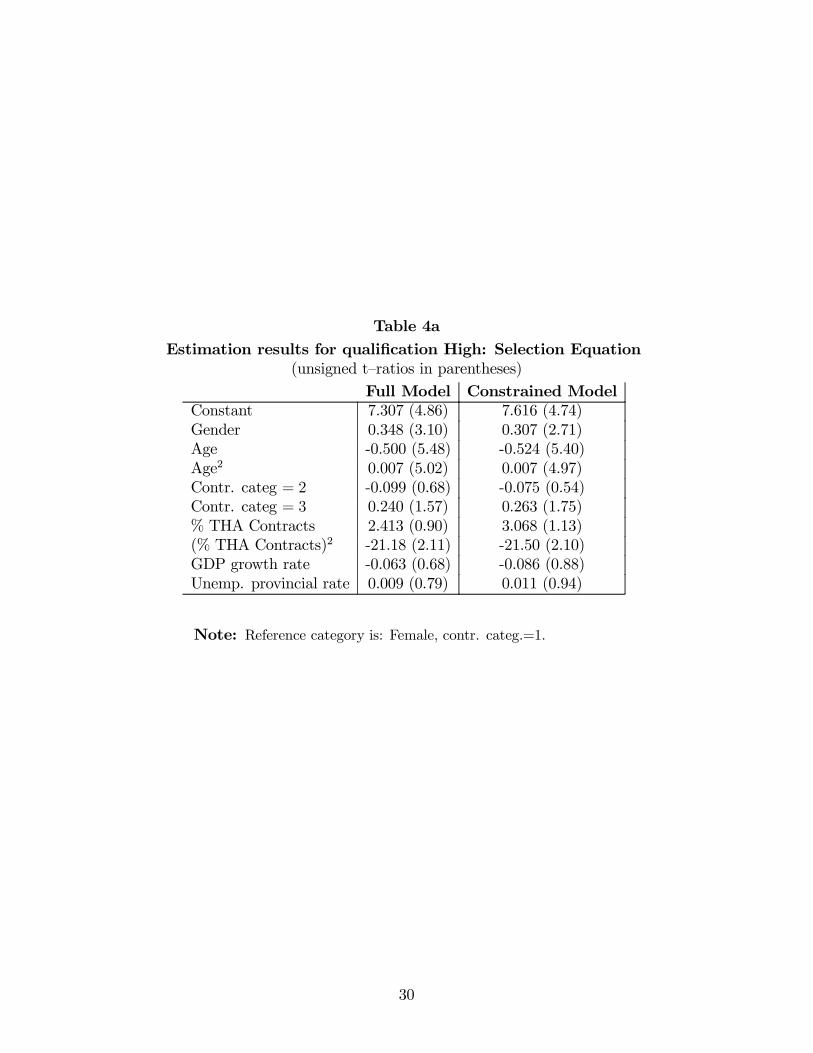
Table 4aEstimation results for quali…cation High: Selection Equation
(unsigned t–ratios in parentheses)Full Model Constrained Model
Constant 7.307 (4.86) 7.616 (4.74)Gender 0.348 (3.10) 0.307 (2.71)Age -0.500 (5.48) -0.524 (5.40)Age2 0.007 (5.02) 0.007 (4.97)Contr. categ = 2 -0.099 (0.68) -0.075 (0.54)Contr. categ = 3 0.240 (1.57) 0.263 (1.75)% THA Contracts 2.413 (0.90) 3.068 (1.13)(% THA Contracts)2 -21.18 (2.11) -21.50 (2.10)GDP growth rate -0.063 (0.68) -0.086 (0.88)Unemp. provincial rate 0.009 (0.79) 0.011 (0.94)
Note: Reference category is: Female, contr. categ.=1.
30

Table 4bEstimation results for quali…cation High: Category Equations
(unsigned t–ratios in parentheses)
Full Model Constrained ModelTHA workers
Constant 1.465 (1.31) 1.391 (1.31)Gender -0.728 (2.77) -0.705 (3.05)Age 0.040 (1.52) 0.037 (1.97)Contr. categ = 2 0.496 (1.70) 0.493 (1.69)Contr. categ = 3 0.313 (0.95) 0.327 (1.03)dur(unemployment) 0.028 (0.10) 0.031 (0.11)dur(employment) 0.364 (2.78) 0.365 (2.80)dur(employment)2 -0.023 (1.37) -0.024 (1.36)Equal employer 0.064 (0.19) 0.067 (0.20)GDP growth rate -0.084 (0.46) -0.089 (0.50)Unemp. provincial rate -0.068 (1.97) -0.066 (2.00)Threshold cett;1 0.610 (4.13) 0.612 (4.11)Threshold cett;2 1.206 (6.91) 1.209 (6.94)½sc -0.074 (0.15) —Non–THA workers
Constant 1.699 (3.80) 1.421 (2.91)Gender 0.102 (0.87) 0.066 (0.52)Age -0.005 (0.59) 0.007 (0.82)Contr. categ = 2 -0.244 (2.05) -0.249 (2.00)Contr. categ = 3 -0.731 (4.97) -0.883 (5.65)dur(unemployment) 0.016 (0.23) 0.022 (0.29)dur(employment) -0.145 (1.49) -0.209 (1.97)dur(employment)2 0.026 (1.51) 0.035 (1.82)Equal employer 1.722 (8.25) 1.845 (8.63)GDP growth rate 0.081 (1.05) 0.107 (1.27)Unemp. provincial rate -0.017 (1.40) -0.026 (2.00)Threshold cnett;1 0.452 (9.39) 0.486 (9.68)Threshold cnett;2 0.647 (11.29) 0.700 (12.07)½sc 0.861 (6.63) —Mean Log Likelihood -1,164.33 -1,169.66Size 1,076 1,076
Note: Reference category is: Female, contr. categ.=1, Madrid. The full modelimposes no constraints on ½sc whereas ½sc = 0 in the constrained one. Controls for
geographical zones are also included.
31

Table 5aEstimation results for quali…cation Medium High: Selection Equation
(unsigned t–ratios in parentheses)Full Model Constrained Model
Constant 0.923 (4.55) 0.962 (4.06)Gender -0.283 (5.66) -0.277 (5.31)Age -0.034 (9.77) -0.029 (8.03)Contr. categ = 4 0.041 (0.50) 0.064 (0.73)Contr. categ = 5 0.063 (1.22) 0.088 (1.64)% THA Contracts 6.019 (5.13) 6.372 (4.78)(% THA Contracts)2 -19.086 (4.86) -23.558 (5.26)GDP growth rate -0.079 (2.26) -0.089 (1.98)Unemp. provincial rate -0.016 (3.27) -0.021 (3.93)
Note:Reference category is: Female, contr. categ.=6.
32

Table 5bEstimation results for quali…cation Medium High: Category
Equations(unsigned t–ratios in parentheses)
Full Model Constrained ModelTHA workers
Constant -0.107 (0.35) -0.109 (0.35)Gender -0.171 (1.42) -0.167 (2.24)Age 0.013 (0.98) 0.013 (2.57)Contr. categ = 4 0.418 (3.38) 0.416 (3.37)Contr. categ = 5 0.683 (8.27) 0.682 (8.34)dur(unemployment) -0.103 (2.54) -0.103 (2.54)dur(employment) 0.130 (2.37) 0.131 (2.37)dur(employment)2 -0.014 (1.60) -0.014 (1.60)Equal employer 0.567 (6.87) 0.568 (6.95)GDP growth rate 0.036 (0.60) 0.036 (0.61)Unemp. provincial rate -0.005 (0.52) -0.005 (0.52)Threshold cett;1 0.757 (16.95) 0.758 (17.10)Threshold cett;2 2.720 (29.41) 2.721 (29.94)½sc 0.020 (0.043) —Non–THA workers
Constant -1.537 (8.58) -0.464 (1.99)Gender -0.003 (0.07) -0.211 (3.79)Age 0.033 (9.62) 0.026 (6.35)Contr. categ = 4 0.221 (2.70) 0.334 (3.43)Contr. categ = 5 0.117 (2.34) 0.193 (3.36)dur(unemployment) -0.032 (1.61) -0.034 (1.13)dur(employment) 0.078 (2.76) 0.149 (3.53)dur(employment)2 -0.003 (0.75) -0.008 (1.26)Equal employer 0.880 (11.44) 1.160 (12.18)GDP growth rate 0.013 (0.40) -0.008 (0.18)Unemp. provincial rate 0.009 (2.01) 0.002 (0.30)Threshold cnett;1 0.497 (18.85) 0.684 (22.69)Threshold cnett;2 2.133 (37.69) 2.634 (43.82)½sc -0.939 (34.04) —Mean Log Likelihood -4,890.51 -4,918.49Size 2,918 2,918
Note: The reference category is: Female, contr. categ.=6, Madrid.The full model imposes no constraints on ½sc whereas ½sc = 0 in the con-strained one. Controls for geographical zones are also included.
33

Table 6aEstimation results for quali…cation Medium Low: Selection Equation
(unsigned t–ratios in parentheses)Full Model Constrained Model
Constant 3.515 (14.42) 3.536 (14.48)Gender -0.131 (4.50) -0.128 (4.39)Age -0.271 (17.88) -0.272 (17.93)Age2 0.004 (17.26) 0.004 (17.30)Contr. categ = 7 0.658 (22.06) 0.662 (22.15)% THA Contracts 7.061 (11.32) 7.041 (11.19)(% THA Contracts)2 -18.702 (8.85) -18.817 (8.83)GDP growth rate -0.197 (9.89) -0.198 (9.85)Unemp. provincial rate 0.019 (8.68) 0.019 (8.34)
Note: Reference category is: Female, contr. categ.=8.
34

Table 6bEstimation results for quali…cation Medium Low: Category Equations
(unsigned t–ratios in parentheses)
Full Model Constrained ModelTHA workers
Constant -0.758 (1.97) -0.615 (1.873)Gender -0.107 (2.74) -0.116 (3.21)Age 0.079 (2.57) 0.063 (3.04)Age2 -0.001 (1.88) -0.0007 (2.00)Contr. categ = 7 0.385 (5.07) 0.429 (10.79)dur(unemployment) -0.049 (1.17) 0.049 (1.18)dur(unemployment)2 0.003 (0.71) 0.035 (0.70)dur(unemployment) · 30 0.027 (0.56) 0.028 (0.58)dur(employment) 0.104 (3.99) 0.103 (3.94)dur(employment)2 -0.007 (1.51) -0.007 (1.49)Equal employer 0.200 (4.85) 0.199 (4.82)GDP growth rate -0.002 (0.07) -0.005 (0.21)Unemp. provincial rate 0.007 (0.17) 0.0016 (0.41)Threshold cett;1 2.350 (66.40) 2.358 (84.63)Threshold cett;2 3.170 (57.26) 3.180 (68.93)½sc -0.106 (0.71) —
Non–THA workersConstant -1.713 (3.59) -0.619 (1.76)Gender -0.056 (1.54) -0.085 (2.42)Age 0.115 (4.12) 0.059 (2.57)Age2 -0.002 (3.51) -0.001 (1.88)Contr. categ = 7 0.097 (1.64) 0.249 (7.05)dur(unemployment) 0.0107 (1.72) 0.112 (1.72)dur(unemployment)2 -0.019 (1.79) -0.020 (1.78)dur(unemployment) · 30 0.093 (1.75) 0.098 (1.79)dur(employment) -0.084 (3.42) -0.087 (3.44)dur(employment)2 0.011 (2.69) 0.011 (2.75)Equal employer 0.389 (6.55) 0.403 (6.56)GDP growth rate 0.032 (1.27) 0.019 (0.73)Unemp. provincial rate 0.002 (0.67) 0.004 (1.43)Threshold cnett;1 2.111 (39.31) 2.184 (79.23)Threshold cnett;2 2.909 (38.18) 3.009 (62.26)½sc -0.346 (3.25) —Mean Log Likelihood -18,402.96 -18,407.70Size 13,165 13,165
Note: Reference category is: Female, contr. categ.=8, Madrid. Thefull model imposes no constraints on ½sc whereas ½sc = 0 in the constrainedone. Controls for geographical zones are also included.
35

Table 7aEstimation results for quali…cation Low: Selection Equation
(unsigned t–ratios in parentheses)Full Model Constrained Model
Constant 4.040 (21.59) 4.047 (21.50)Gender 0.093 (4.87) 0.099 (5.18)Age -0.226 (18.52) -0.229 (18.73)Age2 0.003 (16.01) 0.003 (16.23)Contr. categ = 9 -0.433 (21.09) -0.432 (21.00)% THA Contracts 4.563 (9.87) 4.991 (10.37)(% THA Contracts)2 -11.351 (7.19) -12.795 (7.74)GDP growth rate -0.170 (10.97) -0.168 (10.51)Unemp. provincial rate -0.004 (2.09) -0.003 (1.76)
Note: Reference category is: Female, contr. categ.= 10.
36

Table 7bEstimation results for quali…cation Low: Category Equations
(unsigned t–ratios in parentheses)
Full Model Constrained ModelTHA workers
Constant 0.209 (0.79) -0.890 (3.09)Gender -0.058 (2.11) -0.118 (3.86)Age -0.059 (3.44) 0.029 (1.57)Age2 0.001 (2.71) -0.0005 (1.69)Contr. categ = 9 -0.037 (1.04) 0.164 (4.59)dur(unemployment) 0.202 (4.90) 0.233 (4.84)dur(unemployment)2 -0.021 (3.97) -0.024 (3.97)dur(unemployment) · 30 0.012 (0.30) -0.010 (0.22)dur(employment) -0.025 (1.11) -0.019 (0.71)dur(employment)2 0.001 (0.23) 0.0007 (0.13)Equal employer -0.632 (18.88) -0.721 (20.40)GDP growth rate -0.041 (1.94) -0.032 (1.30)Unemp. provincial rate 0.0005 (0.18) 0.002 (0.63)Threshold cett;1 0.771 (32.76) 0.886 (41.11)Threshold cett;2 1.519 (32.61) 1.699 (36.13)½sc 0.815 (8.66) —
Non–THA workersConstant -3.039 (5.02) -2.504 (7.61)Gender -0.050 (1.68) -0.042 (1.45)Age 0.159 (5.29) 0.137 (6.32)Age2 -0.002 (5.29) -0.002 (5.98)Contr. categ = 9 0.135 (2.74) 0.094 (3.14)dur(unemployment) -0.0035 (0.07) 0.0029 (0.06)dur(unemployment)2 0.0028 (0.40) 0.0028 (0.40)dur(unemployment) · 30 0.002 (0.04) 0.0031 (0.06)dur(employment) -0.083 (3.48) -0.085 (3.56)dur(employment)2 0.008 (1.85) 0.008 (1.90)Equal employer -0.941 (18.26) -0.947 (18.80)GDP growth rate -0.005 (0.23) -0.010 (0.44)Unemp. provincial rate -0.0001 (0.02) -0.0005 (0.17)Threshold cnett;1 0.933 (38.44) 0.940 (46.60)Threshold cnett;2 1.731 (36.23) 1.744 (42.78)½sc -0.162 (1.01) —Mean Log Likelihood -25,404.63 -25,412.54Size 19,786 19,786
Note: Reference category is: Female, contr. categ.=10, Madrid. Thefull model imposes no constraints on ½sc whereas ½sc = 0 in the constrainedone. Controls for geographical zones are also included.
37

Table 8a:Contribution category equation: Unconditional Predictions for Full
ModelHigh Med–High Med–Low LowNo THA THA No THA THA No THA THA No THA THA
¢ Qual=3 – – – – – – 0.43 0.26¢ Qual=2 – – - – 0.46 0.73 2.96 1.79¢ Qual=1 – – 1.46 2.13 3.09 4.49 15.21 8.10= Qual. 85.10 53.35 27.82 45.29 58.43 71.40 81.39 89.85r Qual=1 4.07 21.81 18.80 28.15 38.02 23.38 – –r Qual=2 6.25 14.98 51.92 24.43 – – – –r Qual=3 4.57 9.85 – – – – – –
Table 8b:Contribution category equation: Unconditional Predictions for
Constrained ModelHigh Med–High Med–Low Low
No THA THA No THA THA No THA THA No THA THA¢ Qual=3 – – – – – – 0.59 0.48¢ Qual=2 – – - – 0.81 0.47 3.76 3.33¢ Qual=1 – – 2.10 2.24 4.92 3.34 17.70 14.95= Qual. 82.42 48.71 44.57 46.04 67.07 68.26 77.94 81.22r Qual=1 4.98 22.69 25.94 27.98 27.20 27.93 – –r Qual=2 7.45 16.63 27.39 23.73 – – – –r Qual=3 5.14 11.96 – – – – – –
Note: Predicted probabilities are calculated by holding all vari-ables at their sample mean. Constrained Model imposes that ½sc = 0.Full Model imposes no constraints on ½sc.
38

Table 9a:Contribution category equation: Conditional predictions for THA
workers
High Med–High Med–Low LowPr (yNE) Pr(yE) Pr (yNE) Pr(yE) Pr (yNE) Pr(yE) Pr (yNE) Pr(yE)
¢ Qual=3 – – – – – – 0.28 0.48¢ Qual=2 – – - – 0.18 0.90 2.21 3.32¢ Qual=1 – – 0.00 2.24 1.73 5.23 12.90 14.88= Qual. 99.99 48.26 0.05 46.03 53.24 73.12 84.61 81.32r Qual=1 0.00 22.73 1.95 27.96 44.84 20.75 – –r Qual=2 0.00 16.80 98.00 23.76 – – – –r Qual=3 0.00 12.20 – – – – – –
Table 9b:Contribution category equation: Conditional predictions for no-THA
workers
High Med–High Med–Low LowPr(yNE) Pr (yE) Pr(yNE) Pr (yE) Pr(yNE) Pr (yE) Pr(yNE) Pr (yE)
¢ Qual=3 – – – – – – 0.61 0.00¢ Qual=2 – – - – 1.02 1.40 3.84 0.00¢ Qual=1 – – 2.24 2.07 5.76 7.07 17.91 0.19= Qual. 83.31 53.97 42.63 44.90 69.07 75.29 77.63 99.81r Qual=1 4.57 21.70 27.79 28.24 24.14 16.24 – –r Qual=2 7.00 14.77 27.35 24.78 – – – –r Qual=3 5.12 9.57 – – – – – –
Note: Predicted probabilities are conditional in each panel onbeing in an THA and not being in an THA, respectively. The con-trafactual probabilities are in cursive.
39