Temporal Variation of Particulate Matter (PM) and ...moeseprints.incois.gov.in/944/1/Temporal...
17
Aerosol and Air Quality Research, 14: 1613–1629, 2014 Copyright © Taiwan Association for Aerosol Research ISSN: 1680-8584 print / 2071-1409 online doi: 10.4209/aaqr.2013.10.0310 Temporal Variation of Particulate Matter (PM) and Potential Sources at an Urban Site of Udaipur in Western India Ravi Yadav 1 , Lokesh Kumar Sahu 2* , Saiyed Nisar Ali Jaaffrey 1 , Gufran Beig 3 1 Department of Physics, Mohanlal Sukhadia University, Udaipur-313001, India 2 Physical Research Laboratory, Ahmedabad- 38009, India 3 Indian Institute of Tropical Meteorology, Pune-411008, India ABSTRACT Measurements of mass concentrations of particulate matters (PM 2.5 and PM 10 ) and mixing ratio of carbon monoxide (CO) were made at an urban site of Udaipur (24.58°N, 73.68°E) in India from April 2010 to March 2011. Concentrations of PM 2.5 , PM 10 and CO show strong diurnal and seasonal variations. The highest concentrations coincide with the rush traffic and lower nocturnal boundary layer depth. The lowest concentrations in the afternoon hours are attributed to the dilution caused by higher boundary layer height and reduced traffic. The levels of trace constituents during the weekend were significantly reduced compared to the weekdays of observations. The daily PM 2.5 , PM 10 and CO varied in the large ranges of 8–111 μg/m 3 , 28–350 μg/m 3 and 145–795 ppbv, respectively. PM 2.5 and CO show strong seasonality with higher and lower values during winter and monsoon seasons, respectively, while PM 10 shows highest value during the pre- monsoon season. Flow of cleaner marine air and negligible biomass burning resulted in lower values in the monsoon season. Long-rang transport and extensive biomass burning caused higher values in winter and pre-monsoon seasons. Back trajectories show seasonal shift in the long- range transport which is consistent with the seasonality of aerosols and CO. Except for the monsoon season, mass concentrations of PM 2.5 and PM 10 show good correlation (typically r 2 > 0.5). Relations of PM 2.5 and PM 10 with CO varied with the season but show good correlations (r 2 > 0.5) during the winter season, while poor correlation during monsoon. The correlations suggest dominance of combustion related emissions particularly during winter season. Monthly emission ratios of ΔPM 2.5 /ΔPM 10 , ΔPM 2.5 /ΔCO and ΔPM 10 /ΔCO varied in the ranges of 0.19–0.31 μg/m 3 /ppbv, 0.05–0.10 μg/m 3 /ppbv and 0.15–0.25 μg/m 3 /ppbv, respectively. The mass concentration of PM 2.5 tends to decrease with the increasing wind speed, while PM 10 increases with wind speed. Keywords: Vehicular; Aerosols; Diurnal; Seasonal; Meteorology; Anthropogenic emissions. INTRODUCTION Atmospheric aerosols play important role in air quality and global climate change. Globally, the surface level concentrations of aerosols have increased significantly over the last 150 years (Lavanchy et al., 1999). Recently, the increasing trends of aerosols particularly in the developing countries are related mainly to the rapid urbanization, growth of industries, increase in vehicles and population, etc. Anthropogenic activities have resulted in higher concentrations of aerosols in most of the megacities of Asia (Menon et al., 2002; Akimoto, 2003). The main objectives of most of the studies of aerosols and related species have been to understand the impact on climate (Hobbs et al., * Corresponding author. Tel.: +91 (0)79 - 2631 4553; Fax: +91 (0)79 - 2631 4900 E-mail address: [email protected]; [email protected] 1997; Penner et al., 2001). Aerosols directly impact the radiation budget of the atmosphere via the scattering and absorption processes. On the other hand, the indirect effect of aerosols is mainly due to cloud condensation nuclei (CCN). The lack of measurements addressing the regional distributions of aerosols, their chemical speciation, and aerosol-cloud-radiation interactions constitute the largest part of uncertainty in climate models (Sahu et al., 2012). Airborne Particles with aerodynamic diameters < 10 μm (PM 10 ) are of major concern for environmental issues (Seinfeld and Pandis, 2006). Aerosols with aerodynamic diameters < 2.5 μm (PM 2.5 ) are responsible for climate change and human health hazards. The concentrations of PM beyond the permissible limits (50 μg/m 3 of PM 10 and 10 μg/m 3 of PM 2.5 on annual mean basis) of World Health Organization (WHO) have major impact on mortality and morbidity caused by respiratory and cardiovascular diseases (Schwartz et al., 2001; Chan et al., 2005; Dominici et al., 2005). In recent years, the studies regarding the epidemiological aspect of aerosols have received great attention showing association
Transcript of Temporal Variation of Particulate Matter (PM) and ...moeseprints.incois.gov.in/944/1/Temporal...

Aerosol and Air Quality Research, 14: 1613–1629, 2014 Copyright © Taiwan Association for Aerosol Research ISSN: 1680-8584 print / 2071-1409 online doi: 10.4209/aaqr.2013.10.0310
Temporal Variation of Particulate Matter (PM) and Potential Sources at an Urban Site of Udaipur in Western India Ravi Yadav1, Lokesh Kumar Sahu2*, Saiyed Nisar Ali Jaaffrey1, Gufran Beig3
1 Department of Physics, Mohanlal Sukhadia University, Udaipur-313001, India 2 Physical Research Laboratory, Ahmedabad- 38009, India 3 Indian Institute of Tropical Meteorology, Pune-411008, India ABSTRACT
Measurements of mass concentrations of particulate matters (PM2.5 and PM10) and mixing ratio of carbon monoxide (CO) were made at an urban site of Udaipur (24.58°N, 73.68°E) in India from April 2010 to March 2011. Concentrations of PM2.5, PM10 and CO show strong diurnal and seasonal variations. The highest concentrations coincide with the rush traffic and lower nocturnal boundary layer depth. The lowest concentrations in the afternoon hours are attributed to the dilution caused by higher boundary layer height and reduced traffic. The levels of trace constituents during the weekend were significantly reduced compared to the weekdays of observations. The daily PM2.5, PM10 and CO varied in the large ranges of 8–111 µg/m3, 28–350 µg/m3 and 145–795 ppbv, respectively. PM2.5 and CO show strong seasonality with higher and lower values during winter and monsoon seasons, respectively, while PM10 shows highest value during the pre-monsoon season. Flow of cleaner marine air and negligible biomass burning resulted in lower values in the monsoon season. Long-rang transport and extensive biomass burning caused higher values in winter and pre-monsoon seasons. Back trajectories show seasonal shift in the long- range transport which is consistent with the seasonality of aerosols and CO. Except for the monsoon season, mass concentrations of PM2.5 and PM10 show good correlation (typically r2 > 0.5). Relations of PM2.5 and PM10 with CO varied with the season but show good correlations (r2 > 0.5) during the winter season, while poor correlation during monsoon. The correlations suggest dominance of combustion related emissions particularly during winter season. Monthly emission ratios of ΔPM2.5/ΔPM10, ΔPM2.5/ΔCO and ΔPM10/ΔCO varied in the ranges of 0.19–0.31 µg/m3/ppbv, 0.05–0.10 µg/m3/ppbv and 0.15–0.25 µg/m3/ppbv, respectively. The mass concentration of PM2.5 tends to decrease with the increasing wind speed, while PM10 increases with wind speed. Keywords: Vehicular; Aerosols; Diurnal; Seasonal; Meteorology; Anthropogenic emissions. INTRODUCTION
Atmospheric aerosols play important role in air quality and global climate change. Globally, the surface level concentrations of aerosols have increased significantly over the last 150 years (Lavanchy et al., 1999). Recently, the increasing trends of aerosols particularly in the developing countries are related mainly to the rapid urbanization, growth of industries, increase in vehicles and population, etc. Anthropogenic activities have resulted in higher concentrations of aerosols in most of the megacities of Asia (Menon et al., 2002; Akimoto, 2003). The main objectives of most of the studies of aerosols and related species have been to understand the impact on climate (Hobbs et al., * Corresponding author.
Tel.: +91 (0)79 - 2631 4553; Fax: +91 (0)79 - 2631 4900 E-mail address: [email protected]; [email protected]
1997; Penner et al., 2001). Aerosols directly impact the radiation budget of the atmosphere via the scattering and absorption processes. On the other hand, the indirect effect of aerosols is mainly due to cloud condensation nuclei (CCN). The lack of measurements addressing the regional distributions of aerosols, their chemical speciation, and aerosol-cloud-radiation interactions constitute the largest part of uncertainty in climate models (Sahu et al., 2012). Airborne Particles with aerodynamic diameters < 10 µm (PM10) are of major concern for environmental issues (Seinfeld and Pandis, 2006). Aerosols with aerodynamic diameters < 2.5 µm (PM2.5) are responsible for climate change and human health hazards. The concentrations of PM beyond the permissible limits (50 µg/m3 of PM10 and 10 µg/m3 of PM2.5 on annual mean basis) of World Health Organization (WHO) have major impact on mortality and morbidity caused by respiratory and cardiovascular diseases (Schwartz et al., 2001; Chan et al., 2005; Dominici et al., 2005). In recent years, the studies regarding the epidemiological aspect of aerosols have received great attention showing association

Yadav et al., Aerosol and Air Quality Research, 14: 1613–1629, 2014 1614
between concentrations of PM components and mortality (Schwartz, 1994; Pope et al., 2000; Van et al., 2004). The PM2.5 aerosols have larger impact on climate and radiative budget than PM10 (IPCC, 2007). Among the many air pollutants, particulate matter (PM) spcies have emerged as the most critical pollutants in almost all urban areas of the world and its impacts on human health and ecology are the largest. The major anthropogenic sectors contributing to the coarser fraction (PM10) of aerosols are traffic, industry, agriculture and forestry, households, construction, quarrying and mining, cement plants and ceramic industries, fossil fuel power plants etc. On the other hand, the major natural sources include the sea spray, soil re-suspension, volcanic eruption, biological particles, debris, etc. In India, the major sources of PM2.5 and PM10 are windblown dust, secondary aerosol, bio- and fossil fuel combustion, traffic exhausts and biomass burning (Tiwari et al., 2009). According to Colbeck et al. (2011), the concentrations of aerosols are significantly higher near the road mainly due to re-suspension of dust and emissions from automobiles exhausts. In spite of large variations, the natural aerosols due to their pre-dominant contribution play a crucial role in the global climate whereas the anthropogenic aerosols play a crucial role in regional scales.
Primarily, the variation of aerosols is controlled by emissions, transport and transformation and loss processes in the atmosphere. The determination of factors controlling aerosol distributions over Asia are particularly complex because of strong influences of a variety of emission sources including the dust storms (Sahu et al., 2009). In India, several research organizations have taken initiative to carry out measurements of aerosols and CO in urban sites to understand the impact on regional air quality and climate change. For example, the observations at Delhi show higher mass concentrations of both PM2.5 and PM10 in the pre-monsoon and winter seasons and lower in the monsoon season (Tiwari et al., 2009; Balakrishnaiah et al., 2011; Tiwari et al., 2012; 2013). During the years 2001–2004 at Chennai city, the average mass concentrations of PM2.5 and PM10 were observed to very in the ranges of 42–46 µg/m3 and 145–169 µg/m3, respectively (Oanh et al., 2006). At a semi-urban site of Agra, the average mass concentrations of PM10 and PM2.5 were in the ranges of 234–278 µg/m3 and 80–90 µg/m3, respectively (Pipal et al., 2011). The seasonal measurements of CO have been reported at Ahmedabad (urban), Gadanki (rural), Delhi (urban), Darjeeling (high altitude), Mt. Abu (high altitude) and Pune (urban) in India. The diurnal variation of CO reflects the combined effect of boundary layer process and local (combustion related) emissions causing higher levels during morning and late evening hours (Lal et al., 2000; Beig et al., 2007; Reddy et al., 2010: Singla et al., 2011).
Thus far, there have been no systematic measurements of PM2.5 and PM10 reported over the western region of India. At Udaipur city, the continuous online measurements of aerosols and trace gases have been conducted under the Modeling Atmospheric Pollutants and Networking (MAPAN) project, supported by the Indian Institute of Tropical Meteorology (IITM) and Ministry of Earth Science (MoES).
In the present study, the results based on the continuous measurements of PM2.5, PM10 and CO along with the meteorological parameters during April 2010–March 2011 are presented. The main objective of this study is to investigate both short and long term variations of PM2.5, PM10 and CO. The features of diurnal and seasonal variations and impact of meteorological parameters have been discussed. The relations between the mass concentrations of aerosols and mixing ratio of CO have been investigated.
MEASURMENT SITE AND EMISSIONS SOURCES
The real-time measurements have been carried out on the roof top of the computer center building in the campus of Mohanlal Sukhadia University (MLSU). The Udaipur city is located in the Aravalli hill ranges in the southern part of the Rajasthan, a western state of India (Fig. 1). The city is one of the major tourist destinations in India. The measurement site is about 7 km far from the main city center of Udaipur. According to the consensus of year 2011, the population of Udaipur district was about 3,068,420 (http://www.census 2011.co.in/census/district/455-udaipur.html). The emissions from bus, car, two- and three-wheelers (motorbikes, scooter and auto-rickshaws) are major sources of various particulate and gaseous pollutants near the site. In recent years, the number of vehicles is increasing at the rate of 10–15% per year. Other sources of pollutants like industries and marble factories are located around the Udaipur city. There are several common sources of PM2.5 and PM10 such bio- and fossil-fuel combustion, industrial processes and biomass burning. In addition, PM10 are also contributed by the windblown dust, building construction, lime kilns, slab polishing, marble stone devastating, vehicle travel on paved and unpaved roads, dust from open fields and farmlands, etc.
GENERAL CIRCULATION AND METEOROLOGY
The four seasons in India are winter (December–February), pre-monsoon (March–May), monsoon (June–September) and post-monsoon (October–November). We have used the National Centre for Environmental Prediction (NCEP) wind data archive to study the synoptic scale flow over the western region of India. In Fig. 2, the mean wind vector fields at 925 mb pressure level are plotted for the four different seasons of years 2010–2011. The large scale seasonal circulation over South Asia region is driven primarily by the progression of the Inter-Tropical Convergence Zone (ITCZ) (Asnani, 1993). From early May to September period, the ITCZ moves northward across India and associated wind flow is known as southwest (SW) monsoon. Consequently, the cleaner marine air masses from the Arabian Sea and the Indian Ocean dominate at Udaipur. In the monsoon period, the weather condition is mostly cloudy or rainy and which favors the wet removal of aerosols. In addition, the decreased solar insolation inhibits the photochemical processes in this season. In the pre-monsoon season, the strong westerly winds from continental regions of Africa and Middle East prevail over the western region of India. In the winter season, air masses mostly from the northwest (NW) direction influence

Yadav et al., Aerosol and Air Quality Research, 14: 1613–1629, 2014 1615
Fig. 1. Location of observational site at Udaipur city in the western state of Rajasthan in India.
Fig. 2. Average wind vector fields at 925 mb level (NCEP data reanalysis) for four different seasons during years 2010–2011. The color bar shows the magnitude of wind speed (m/s).

Yadav et al., Aerosol and Air Quality Research, 14: 1613–1629, 2014 1616
the site. In the post-monsoon season, the ITCZ moves back southward and the prevailing wind is from northeast (NE) direction. The biomass burning is highest during winter and pre-monsoon seasons in the Indian subcontinent (Galanter et al., 2000).
In this study, we have used the back trajectory model data to track the origin and pathway of air masses transported over the measurement site in different seasons. The isentropic back trajectories were calculated using the Japanese 25-year Reanalysis data (JRA-25, 6h, 1.25° × 1.25°) (Onogi et al., 2007; Sahu et al., 2013). The Japan Meteorological Agency (JMA) Climate Data Assimilation System (JCDAS) analysis data has been operational since 2005 and used in the present study. The JCDAS uses the same technique as JRA-25 but since it is operational day by day, only real-time observation data were assimilated. Advection algorithm used in the back trajectory model is same as described in (Draxler and Hess, 1997). For this study, the trajectories were calculated for a total run time of 168 h (7 days) at 500 m of altitude with a time step of 5 min.
The time series variations, based on daily mean data, of several meteorological parameters viz. maximum/minimum temperature (°C), relative humidity (%), wind speed (km/hr) and rainfall (mm) during April 2010–March 2011 are shown in Fig. 3. The daily means of maximum temperature and minimum temperature varied in the range of 20–45°C and
0–30°C, respectively. The daily means of RH were in the range of 25–93%. The higher levels of RH (> 90%) observed during August and December months were due to prevailing rainy and foggy weather conditions, respectively. The daily wind speed showed large day-to-day variation, between 0.2–12.2 km/hr. The strong surface level wind influenced the site during May–June period, while calm winds prevailed during rest of the year. Typically, the highest rainfall has been recorded in the months of July and August at Udaipur.
MEASURMENT TECHNIQUES
This is the first study reporting continuous online measurements of the mass concentration of PM2.5 and PM10
aerosols over the western region of India. The mass concentrations of both PM2.5 and PM10 were measured using the Beta Attenuation Monitor (BAM-1020; Met One Instruments, USA). The BAM-1020 measures the mass concentrations of airborne particulate matters in micrograms per cubic meter (µg/m3) using the principal of beta ray attenuation. A small Carbon-14 (14C) element provides a constant source of high energy electrons known as beta rays. The beta particles are detected and counted by a sensitive scintillation counter. The BAM-1020 automatically advances the filter tape to the sample nozzle, where external pump pulls a measured amount of air sample. Subsequently, the
Fig. 3. Daily means of maximum temperature, minimum temperature, relative humidity, wind speed and rainfall during the years 2010–2011.
Yadav et al., Aerosol and Air Quality Research, 14: 1613–1629, 2014 1617
filter tape burdened with ambient dust is automatically placed between the source and the detector. The attenuation of the beta particle signal is used to determine the mass concentration of aerosols collected on the filter tape. This instrument measures mass concentration of ambient aerosol with a lower detection limit of around 1 µg/m3. Span check (or zeroing) of the instrument is automatically performed on hourly basis (Kaushar et al., 2013). The mixing ratio of CO was measured using an Ecotech, model EC 9830 analyzer which is based on the infra red (IR) photometric detection technique. The EC 9830 analyzer uses gas filter wheel correlation technique. Carbon monoxide absorbs IR radiation at wavelengths centered at 4.7 µm. The amount of CO can be determined by the attenuation of IR signal in the sample cell. The Ecotech analyzers are being operated at Tokyo-Ibaraki University (UT-IU) and Peking University (Lu et al., 2013) for the measurements of CO and other
trace gases. The zero measurements and span calibration of CO instrument were performed using the standard calibration mixture from INOX, India. The ambient meteorological parameters like temperature, wind speed, relative humidity, and rainfall were recorded at the Automatic weather station (AWS, model, ME-1310; Microcomm-ESD, UK). The wind sensor (Anemometer technique) measures wind speed in the range 0–56 m/s with an accuracy of ± 0.45 m/s. The tipping bucket rain gauge measures rainfall in the range of around 0–700 mm with an accuracy of ± 1% mm/hr.
TEMPORAL VARIATION OF PM2.5, PM10 AND CO Diurnal Variation
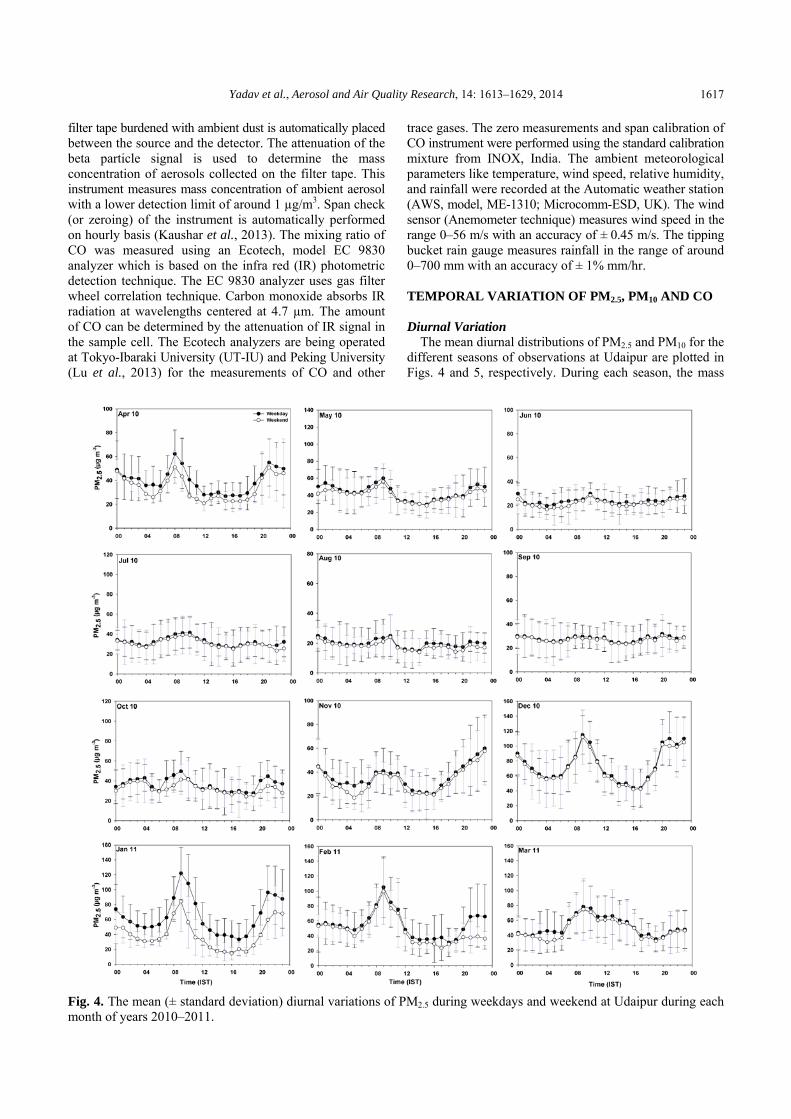
The mean diurnal distributions of PM2.5 and PM10 for the different seasons of observations at Udaipur are plotted in Figs. 4 and 5, respectively. During each season, the mass
Fig. 4. The mean (± standard deviation) diurnal variations of PM2.5 during weekdays and weekend at Udaipur during each month of years 2010–2011.

Yadav et al., Aerosol and Air Quality Research, 14: 1613–1629, 2014 1618
Fig. 5. The mean (± standard deviation) diurnal variations of PM10 during weekdays and weekend at Udaipur during each month of years 2010–2011.
concentrations of both PM2.5 and PM10 show significant diurnal variation. On the other hand, the amplitude of diurnal variability in the mass concentrations of PM2.5 and PM10 varied from month-to-month. The large amplitudes of diurnal variation were observed during the pre-monsoon, post-monsoon and winter seasons, but weaker diurnal variability was observed during the monsoon season.
The most prominent features of diurnal distribution are the highest mass concentrations during 7–10 hr and 19–23 hr, which also coincide with the peak traffic periods in Udaipur city. Later, the moderate levels were observed from night till the early morning hours. After the morning peak period (primary peak), the mass concentration decreased rapidly to lowest values in the afternoon (10–16 hr). In the pre-monsoon months, the mean amplitudes of mass concentrations of PM2.5 and PM10 during primary peak were in the ranges of 50–65 µg/m3 and 220–270 µg/m3, respectively. In the
monsoon season, the morning peak amplitudes of PM2.5 and PM10 were in the ranges of 20–35 µg/m3 and 90–110 µg/m3, respectively. In the winter season, the morning peaks of both PM2.5 (80–120 µg/m3) and PM10 (150–220 µg/m3) were particularly prominent compared to the other seasons.
The morning and evening peaks in aerosol mass concentrations coincide with the highest activities of local anthropogenic emissions associated with the traffic rush in Udaipur. The month -to- month shift in the timing of primary peak could be due to the seasonal change in sunrise/sunset timing and sky conditions (fractions of cloudy/non-cloudy sky) and hence PBL depth cycle. However, further study is required if the timing of peak emission also shifts with the season. Moreover, the height of planetary boundary layer (PBL) depth is relatively low during the morning and evening hours. The lower mass concentrations measured during the afternoon hours can be attributed mainly to the dilution of

Yadav et al., Aerosol and Air Quality Research, 14: 1613–1629, 2014 1619
the aerosols associated with deeper PBL and also lesser traffic density near the site. The development of nocturnal boundary layer (NBL) favors the stagnation causing elevated concentrations of aerosols during the night and early morning hours, even though traffic emissions are not highest. In addition to vehicular emissions, the elevated concentrations of aerosols and CO during evening and night hours could also be caused by the use of bio-fuels for cooking /heating purposes. Therefore, the observed systematic diurnal patterns of both PM2.5 and PM10 aerosols highlight the importance of local emission and meteorology. In the monsoon season, the strength of morning and evening peaks in PM2.5 and PM10 is weaker compared to those for other seasons. In the months of July and August, the episodes of frequent rain and cloudy sky conditions inhibit the diurnal variation of PBL. Diurnal variations of PM2.5 and PM10 aerosols at other urban sites of India viz. Delhi and Anantpur are reported in
the literature (Monkkonen et al., 2004; Balakrishnaiah et al., 2011; Tiwari et al., 2013). However, with slightly different levels of mass concentrations, the diurnal patterns at these sites also show similar patterns to that at Udaipur. In Fig. 6, the diurnal dependency of mixing ratio of CO shows similar pattern to those of PM2.5 and PM10 aerosols at Udaipur. The mean amplitudes of primary peak during the pre-monsoon, monsoon, post-monsoon and winter seasons were in the ranges of 400–500 ppbv, 250–300 ppbv, 400–450 ppbv and 600–700 ppbv, respectively. In monsoon season, the emissions from local sources like vehicular exhaust and bio-fuel burning could be more significant in absence of long range transport.
We have separated the weekdays (Monday–Friday) and weekend (Sunday) data to study the impact of change in traffic density at Udaipur. The “weekend effect” is characterized by the reduction in the levels of primary
Fig. 6. The mean (± standard deviation) diurnal variations of CO during weekdays and weekend at Udaipur during each month of years 2010–2011.

Yadav et al., Aerosol and Air Quality Research, 14: 1613–1629, 2014 1620
pollutants due to the decrease in emissions from anthropogenic activities mainly vehicular during the weekend (Cerveny and Balling, 1998). The evidence of decreased emissions from vehicular sources during the weekend has been a topic of research interest since 1970s (Lebron et al., 1975; Elkus and Wilson et al., 1977). Several studies have reported significant reduction in the atmospheric concentrations of various pollutants in urban regions of the world (Kim Oanh et al., 2008; Han et al., 2009; Sahu et al., 2011).
The monthly mean diurnal distributions of aerosols and CO for weekdays and weekend of observations are shown in Figs. 4–6. The levels of these species during weekdays of measurements were significantly higher than the weekend values throughout the year. The percentage reductions in
the levels of PM2.5, PM10 and CO for morning, afternoon and night hours in four different seasons are plotted in Fig. 7. On average (annual basis), the morning hour percentage reductions of PM2.5, PM10 and CO were 11.3 ± 10%, 13.3 ± 8% and 8.6 ± 5%, respectively during the weekend. The reductions of PM2.5, PM10 and CO during weekend were highest of 16%, 14% and 12%, respectively in the winter season. However, the reductions in all species were lowest during the monsoon season.
Seasonal Variation
As shown in Fig. 8, the time series variations of daily mean mass concentrations of PM2.5, PM10 and mixing ratio of CO show significant day-to-day variation. The temporal
Fig. 7. Percentage reductions of PM2.5, PM10 and CO during weekend of the years 2010–2011.

Yadav et al., Aerosol and Air Quality Research, 14: 1613–1629, 2014 1621
Fig. 8. Daily mean time series and monthly box whisker plots of the mass concentrations of aerosols (PM2.5 and PM10) and mixing ratio CO at Udaipur during years 2010–2011.
trends of PM2.5 and CO show almost similar features but were slightly different in case of PM10. The daily mean values of PM2.5, PM10 and CO varied in the ranges of 8–110 µg/m3, 30–350 µg/m3 and 145–795 ppbv, respectively. The box-whisker plots showing the monthly statistics of PM2.5, PM10 and CO are also shown in Fig. 8. The monthly mean mass concentrations of PM2.5 show highest value of about 70 µg/m3 in the month of December and lowest of about 26 µg/m3 in August. Similarly, the measurements of CO show highest value of 498 ppbv in December and lowest of 217 ppbv in June. On the other hand, the mass concentration of PM10 show highest value of 142 µg/m3 in the month of March and lowest value of 61 µg/m3 in August. The average mass concentrations of PM2.5, PM10 and mixing ratio of CO for each month of observations are presented in Table 1. The mass concentrations of aerosols and mixing ratio of CO show clear seasonality at Udaipur. The mass concentration of PM2.5 and mixing ratio of CO
were highest of 60 ± 21 µg/m3 and 465 ± 121 ppbv during winter season, but PM10 level was observed to be highest of 131 ± 43 µg/m3 during pre-monsoon season. In the monsoon season, the values of PM2.5, PM10 and CO were lowest of 28 ± 9 µg/m3, 84 ± 39 µg/m3 and 269 ± 61 ppbv, respectively. More or less similar seasonal variations of PM2.5, PM10 and CO have been reported at other urban and semi urban sites of India (Monkkonen et al., 2004; Balakrishnaiah et al., 2011; Tiwari, et al., 2013). The comparison of PM2.5, PM10 and CO data between Udaipur with Delhi, Ahmedabad is presented in Fig. 9. In Delhi, the levels of aerosols are low during the monsoon season and high during pre-monsoon and winter season. Overall, the levels of both the types of aerosols at Delhi are much higher than those measured at Udaipur in all seasons. In any case, except for few days in the monsoon season, the daily mean concentrations of both PM2.5 and PM10 at Udaipur exceed the WHO Air Quality Guideline (AQG) limits of 25 µg/m3 and 50 µg/m3, respectively.

Yadav et al., Aerosol and Air Quality Research, 14: 1613–1629, 2014 1622
Table 1. Monthly means of PM2.5 µg/m3, PM10 µg/m3 and CO (ppbv) observed during April 2010–March 2011at Udaipur.
Months PM2.5
(mean ± std)PM10
(mean ± std) CO
(mean ± std) Apr 2010 32 ± 6 121 ± 12 299 ± 63 May 2010 32.9 ± 7 127 ± 11 233 ± 47 Jun 2010 30 ± 4 123 ± 24 217 ± 50 Jul 2010 29 ± 9 64 ± 25 259 ± 55
Aug 2010 25 ± 9 61 ± 16 280 ± 52 Sept 2010 31 ± 10 100 ± 42 309 ± 38 Oct 2010 33 ± 12 81 ± 10 343 ± 66 Nov 2010 40 ± 10 121 ± 10 360 ± 72 Dec 2010 69 ± 20 141 ± 32 497 ± 90 Jan 2011 59 ± 21 120 ± 30 474 ± 87 Feb 2011 50 ± 20 125 ± 33 419 ± 78 Mar 2011 43 ± 17 142 ± 72 361 ± 84
Fig. 9. Seasonal mean mass concentrations of PM2.5, PM10 and mixing ratio of CO at Udaipur and other observational sites.
Generally, the changes in the emission, meteorology, pattern of the long-rang transport and PBL height can play
important role in the observed seasonal variation of PM2.5, PM10 and CO at Udaipur. We have used 7 days back

Yadav et al., Aerosol and Air Quality Research, 14: 1613–1629, 2014 1623
trajectory data to investigate the roles of long-range transport in the seasonal variations of pollutants measured at Udaipur. The back trajectory plots for the different seasons are shown in Fig. 10. In the pre-monsoon season, long-range transport of polluted air from the continental regions of Middle East and Arabian Peninsula affect the measurements site. Especially, the highest mass concentration of PM10 is in this season, indicates the abundance of coarser mode particles from minerals and dust storms. In monsoon seasons, the site is influenced by the transport of cleaner air from the Arabian Sea due to prevailing SW wind. In this season, the height along the trajectory path indicates that the air masses were confined within the marine boundary layer (MBL) before arriving over the continental region of India. Another reason for lower levels of pollutants in the monsoon season could be washout of aerosols due to precipitation. The total rainfall record was highest during July–August period at Udaipur. In the post-monsoon season, the trajectories clearly show the change in the wind pattern from SW to NW. In the winter season, the transport from polluted Indo-Gangetic plain (IGP) influenced the site leading to the highest level of aerosols and CO. CORRELATION AND POTENTIAL SOURCES OF PM
Carbon monoxide is an excellent tracer for pollutants emitted from the combustion related sources (Sahu and Lal, 2006). The emissions of primary pollutants like PM2.5 and PM10 and CO are mainly from common or co-located sources in urban region. Typically, the sources of aerosols include vehicular exhaust, wind-blown dust, biomass burning,
etc. in Udaipur. The predominance of a given category of sources varies from season to season. However, to some extent, the correlation studies between primary pollutants can be used to investigate the role of emissions and atmospheric processes responsible for the observed seasonal distributions at Udaipur. The scatter plots between PM2.5 and PM10 aerosols for the different months of observations are shown in Fig. 11. Based on the least square regression fit of hourly data, the correlation coefficient (r2) and slope (∆PM2.5/∆PM10) have been estimated for the different months. Very evidently, however except for the rainy months, the observations show good to excellent correlations (r2 = 0.5–0.82). The slope of ∆PM2.5/∆PM10 shows lower values in the monsoon but increases from post-monsoon to winter and declines in the pre-monsoon season. The seasonality in the relations between PM2.5 and PM10 suggest competing effects of natural and anthropogenic (combustion) sources and wet scavenging in the levels of aerosols at Udaipur. In the monsoon season, the lower values of ∆PM2.5/∆PM10 indicate the predominance of wind-blown dust and marine aerosols having higher proportions of PM10 aerosols. The present results are consistent with the fact that the activities of biomass burning are almost negligible in the monsoon season.
The correlation of PM2.5 and PM10 with the mixing ratio of CO can be useful to examine the role of incomplete combustion of fuels and biomass burning in urban area. Scatter plots of PM2.5-CO and PM10-CO for the different months of observations are shown in Figs. 12 and 13, respectively. However, only in the winter months, the mass concentrations of both PM2.5 and PM10 aerosols show reasonably good correlations (r2 > 0.4) with CO. The slopes of ∆PM2.5/∆CO (0.5–0.10 µg/m3/ppbv) and ∆PM10/∆CO
Fig. 10. Back trajectories at 500 m level over Udaipur in different seasons (pre-monsoon, monsoon, post-monsoon and winter) of the years 2010–2011.

Yadav et al., Aerosol and Air Quality Research, 14: 1613–1629, 2014 1624
Fig. 11. Scatter plots between hourly mean mass concentrations of PM2.5 and PM10 at Udaipur during years 2010–2011.
(0.15–0.25 µg/m3/ppbv) estimated in the winter season are higher than the other seasons. In summary, the correlation study clearly demonstrates the predominance of non-combustion (mostly natural) and combustion (anthropogenic) in the monsoon and winter seasons, respectively. The combined study of back trajectory data and CO indicate the predominance of long-range transport of aerosols from the desert region of Rajasthan and Arabia during the pre-monsoon season while marine aerosols dominate during the monsoon season. On the other hand, the emissions of aerosols from biomass and bio-fuel burning in the IGP
region dominate during the post-monsoon and winter seasons. In this discussion it is obvious to assume that local emissions mainly from vehicular sources influence the site throughout the year. IMPACT OF LOCAL WIND ON PM
In addition to emissions from the local sources, the levels of PM2.5 and PM10 can also be influenced by other factors like meteorology and long- rang transport in the troposphere. The variations in meteorological parameters were observed

Yadav et al., Aerosol and Air Quality Research, 14: 1613–1629, 2014 1625
Fig. 12. Scatter plots between hourly mean mass concentrations of PM2.5 and mixing ratio of CO at Udaipur during years 2010–2011.
to play important role in the levels of pollutants in many urban areas of the world (Verma et al., 2010 and references therein). Among the several meteorological parameters, the local wind can significantly influence the concentrations of various pollutants in urban and industrial sites. A recent study of carbonaceous aerosols in Bangkok show strong dependencies with the wind speed (Sahu et al., 2011). In this study, we have investigated the dependency of both
PM2.5 and PM10 aerosols on the local wind speed. The dependencies of mass concentration of aerosols on
the wind speed (averaged for a bin of 1 km/hr) are shown in Fig. 14. The mass concentration of PM2.5 was observed to be highest in the low wind flow regime (0–1 km/hr). This suggests accumulation of pollutants under calm weather conditions. The level of PM2.5 decrease gradually with the wind speed under the moderate wind flow conditions (2–6

Yadav et al., Aerosol and Air Quality Research, 14: 1613–1629, 2014 1626
Fig. 13. Scatter plots between hourly mean mass concentrations of PM10 and mixing ratio of CO at Udaipur during years 2010–2011.
km/hr). However, the mass concentrations of PM2.5 do not change significantly and remained almost constant in strong wind flow regime (7–13 km/hr). Therefore, accumulation under weak wind and dilution with increasing wind indicate the predominance of local sources in the loading of PM2.5 at Udaipur.
The relation between PM10 and wind speed is different than what we have discussed for PM2.5. The mass concentrations of
PM10 were observed to be lower in the low wind flow regime (0–2 km/hr). In the moderate wind flow regime (2–8 km/hr), the levels increased gradually with the increase in wind speed. The levels of PM10 tend to increase rapidly in the strong wind flow regime (9–13 km/hr). Therefore, the higher levels of PM10 in stronger wind regimes indicate the predominance of wind-blown dust and long-rang transport with elevated backgrounds of PM10. This result is

Yadav et al., Aerosol and Air Quality Research, 14: 1613–1629, 2014 1627
Fig. 14. Scatter plots between the daily mean mass concentration of aerosols and wind speed and regression plots of aerosols versus wind speed (averaged for a bin of 1.0 km/hr) at Udaipur during years 2010–2011.
expected, as discussed in the introduction section that the wind-blown emission/dust storms are the significant and important source of PM10 particles in Udaipur. Therefore, the concentration of PM10 increased with the increasing wind speed. In ambient air, it is the counterbalance of two processes wind-blown emission and dilution due to strong wind speed. Ultimately, the wind blow emission seems to have stronger effect than the dilution. Resultantly, the concentration of PM10 tends to increase with the increasing wind speed at Udaipur. It will be interesting to see if similar dependencies exist at other urban sites of India. SUMMARY AND CONCLUSION
The surface level mass concentrations of PM2.5, PM10 and mixing ratio of CO were measured in Udaipur during April 2010–March 2011. Udaipur is an urbanized city located in the Aravali hills of southern part of Rajasthan, a western state of India. Local emission from vehicular traffic and windblown dust are the prominent sources of aerosols and trace gases. The long-range transport and regional biomass burning sources also contribute significantly during the pre-monsoon and winter seasons. In the pre-monsoon season, the westerly wind flow transported continental polluted air
mainly from regions of Africa and Middle East. The observation site was influenced by the flow of cleaner air from Arabian Sea prevailing southwest monsoon during the monsoon season. In the post-monsoon season, the northeast flow transported from highly polluted Indo-Gangetic Plain (IGP).
The diurnal distributions of PM2.5, PM10 and CO show elevated levels during the evening and morning hours which coincide with the rush (traffic) hours in Udaipur. Their lowest values in the afternoon hours are due to lesser vehicular traffic and higher PBL heights. The levels of aerosols and CO show significant reductions during weekend compare to their weekday values. In the winter season, the weekend reductions in PM2.5, PM10 and CO were highest of 16%, 14% and 12%, respectively. The effects of weekend reductions in anthropogenic emissions in all species were lowest during the monsoon season.
The annual variations of aerosols and CO show lowest concentrations in the monsoon season and highest in the winter/pre-monsoon seasons. The average concentrations of both PM2.5 and CO were highest of 60 ± 21 µg/m3 and 465 ± 121 ppbv, respectively during winter season, while lowest values of 28 ± 9 µg/m3 and 269 ± 61 ppbv were observed during monsoon season. On the other hand, the

Yadav et al., Aerosol and Air Quality Research, 14: 1613–1629, 2014 1628
mean mass concentration of PM10 was highest 131 ± 43 µg/m3 during pre-monsoon season. In the monsoon season, the concentrations of aerosols and CO emitted from local sources were diluted due to the flow of cleaner air from Arabian Sea and wet removal. In the winter season, the mass concentration of PM2.5 and mixing ratio of CO were highest also due to the long-rang transport of pollutants. The mass concentration of PM10 was highest during pre-monsoon season due to frequent episodes of dust storm.
The mass concentration of PM2.5 and PM10 showed tight correlations during pre-monsoon, post-monsoon and winter seasons but were poor correlated in the monsoon season. On the other hand, correlations between the mass concentrations of aerosols and CO showed good correlations only during the winter season. The study clearly demonstrates that the emissions from non-combustion (mostly natural) and combustion (anthropogenic) were predominant during the monsoon and winter seasons, respectively. The mass concentrations of PM2.5 tend to decrease with the increase in wind speed representing the impact of dilution. On the other hand, PM10 increased with the increase in wind speed mainly due to wind-blown dust. ACKNOWLEDGMENTS
The authors thank Dr. M. Kajino (Meteorological Research Institute, Japan Meteorological Agency, Tsukuba, Japan) for providing the back trajectory data. The NCEP reanalysis data were downloaded from NOAA-CIRES Climate Diagnostics Center, Boulder, CO, USA. REFERENCES Akimoto, H. (2003). Air Quality and Pollution. Science
302: 1716–1719. Asnani, G.C. (1993). Tropical Meteorology, Indian Institute
of Tropical Meteorology, Pune, India, p. 100–204. Balakrishnaiah, G., Raghavendra, K.K., Reddy, K.S.B.,
Ramagopal, K., Reddy, R.R., Reddy, S.S.L., Narasimhulu, K., Ahammed Nazir, Y., Balanarayana, C., Krishnamoorthy, K. and Babu, S.S. (2011). Characterization of PM, PM10 and PM2.5 Mass Concentration at a Tropical Semi Arid Station in Anantapur, India. Indian J. Radio Space Phys. 40: 95–104.
Beig, G., Gunthe, S. and Jadhav, D.B. (2007). Simultaneous Measurements of Ozone and Its Precursors on a Diurnal Scale at a Semi Urban Site in India. J. Atmos. Chem. 57: 239–253.
Cerveny, R.S. and Balling, R.C. Jr. (1998). Weekly Cycles of Air Pollutants, Precipitation and Tropical Cyclones in the Coastal NW Atlantic Region. Nature 394: 561–563.
Chate, D.M. and Devara, P.C.S. (2005). Parametric Study of Scavenging of Atmospheric Aerosols of Various Chemical Species during Thunderstorm and Non Thunderstorm Rain Events. J. Geophys. Res. 110: D23208, doi: 10.1029/2005JD006406
Chen, L.H., Knutsen, S.F., Beeson, I., Ghamsary, M., Shavlik, D., Petersen, F. and Abbey, D. (2005). The
Association between Ambient Particulate Air Pollution and Fatal Coronary Heart Disease among Persons with Respiratory Symptoms/Disease. Ann. Epidemiol. 15: 642–642.
Colbeck, I., Nasir, Z.A., Ahmad, S. and Ali, Z. (2011). Exposure to PM10, PM2.5, PM1 and Carbon Monoxide on Roads in Lahore, Pakistan. Aerosol Air Qual. Res. 11: 689–695.
Dominici, F., McDermott, A., Daniels, M., Zeger, S.L. and Samet, J.M. (2005). Revised Analyses of the National Morbidity, Mortality, Air Pollution Study: Mortality among Residents of 90 Cities. J. Toxicol. Environ. Health Part A 68: 1071–1092.
Draxler, R.R. and Hess, G.D. (1997). Description of the Hysplit_4 Modeling System, NOAA Technical Memorandum ERL ARL-224, December, 24p.
Elkus, B. and Wilson, K. (1977). Photochemical Air Pollution: Weekday Weekend Differences. Atmos. Environ. 11: 509–515.
Galanter, M., Levy II, M. and Carmichael, G.R. (2000). Impacts of Biomass Burning on tropccospheric CO, NOx, O3. J. Geophys. Res. 105: 6633–6653.
Han, S. et al. (2009). Temporal Variations of Elemental Carbon in Beijing. J. Geophys. Res. 114: D23202.
Hobbs, P.V., Reid, J.S., Kotchenruther, R.A., Ferek, R.J. and Weiss, R. (1997). Direct Radiative Forcing by Smoke from Biomass Burning. Science 275: 1776–1778.
IPCC (2007). Climate Change 2007: The Physical Science Basis, Contribution of Working group I to the Fourth Assessment Report of the IPCC (ISBN 978 0521 88009-1 Hardback; 978-0521 70596-7 Paperback).
Kaushar, A., Chate, D., Beig, G., Srinivas, R.a, Parkhi, N., Satpute, T., Sahu, S., Ghude, S., Kulkarni, S., Surendran, D., Trimbake, H. and Trivedi, D.K. (2013). Spatio-Temporal Variation and Deposition of Fine and Coarse Particles during the Commonwealth Games in Delhi. Aerosol Air Qual. Res. 13: 748–755.
Kim Oanh, N.T., Martel, M., Pongkiatkul, P. and Berkowicz, R. (2008). Determination of Fleet Hourly Emission and On-road Vehicle Emission Factor Using Integrated Monitoring and Modeling Approach. Atmos. Environ. 44: 15–22.
Lal, S., Naja, M. and Subbaraya, B.H. (2000). Seasonal Variations in Surface Ozone and Its Precursors over an Urban Site in India. Atmos. Environ. 34: 2713–2724.
Lavanchy, M.G., Schotterer, U., Schwikowski, M., Gaggeler, H.W. and Baltensperger, U. (1999). Historical Record of Carbonaceous Particle Concentrations from a European High-alpine Glacier. J. Geophys. Res. 104: 21227–21236.
Lebron, F.A. (1975). Comparison of Weekend-weekday Ozone and Hydrocarbon Concentrations in the Baltimore-Washington Metropolitan Area. Atmos. Environ. 9: 861–863.
Lu, D.K. et al. (2013). Missing OH Source in a Suburban Environment near Bejing: Observed and Modelled OH and HO2 Concentrations in Summer 2006. Atmos. Chem. Phys. 13: 1057–1080.
Menon, S., Hansen, J., Nazarenko, L. and Luo, Y. (2002). Climate Effects of Black Carbon Aerosols in China and

Yadav et al., Aerosol and Air Quality Research, 14: 1613–1629, 2014 1629
India. Science 297: 2250–2253. Monjjonen, P., Uma, R., Srinivasan, D., Koponen, I.K.,
Lehtinen, K.E.J., Ameri, K.H., Suresh, R., Sharma, V.P. and Kulmala, M. (2004). Relationship and Variations of Aerosol Number and PM10 Mass Concentrations in a Highly Polluted Urban Environment-New Delhi, India. Atmos. Environ. 38: 425–433.
Oanh, N.T.K. et al. (2006). Particulate Air Pollution in Six Asian Cities: Spatial and Temporal Distributions, and Associated Sources. Atmos. Environ. 40: 3367–3380, doi: 10.1016/j.atmosenv.2006.01.050.
Onogi, K. et al. (2007). The JRA-25 Reanalysis. J. Meteorol. Soc. Jpn. 85: 369–432.
Penner, J.E., Hegg, D. and Leatich, R. (2001). Unrevalling the Role of Aerosols in Climate Change. Environ. Sci. Technol. 35: 332A–340A.
Pipal, A.S., Kulshreshtha, A. and Taneja, A. (2011). Characterization and Morphological Analysis of Airborne PM2.5 and PM10 in Agra Located in North Central India. Atmos. Environ. 45: 3621–3630.
Pope, C.A. (2000). Epidemiology of Fine Particulate Air Pollution and Human Health: Biologic Mechanisms and Who’S at Risk. Environ. Health Perspect. 108: 713–724.
Reddy, B.S.K. et al. (2010). Observational Studies on the Variations in Surface Ozone Concentration at Anantapur in Southern India. Atmos. Res. 98: 125–139.
Sahu, L.K. et al. (2012). Emission Characteristics of Black Carbon in Anthropogenic and Biomass Burning Plumes over California during ARCTAS-CARB 2008. J. Geophys. Res. 117, doi: 10.1029/2011JD017401.
Sahu, L.K., Kondo, Y., Miyazaki, Y., Kuwata, M., Koike, M., Takegawa, N., Tanimoto, H., Matsueda, H., Yoon, S.C. and Kim, Y.J. (2009). Anthropogenic Aerosols Observed in Asian Continental Outflow at Jeju Island, Korea, in Spring 2005. J. Geophys. Res. 114, doi: 10.1029/2008JD010306.
Sahu, L.K., Kondo, Y., Miyazaki, Y., Pongkiatkul, P. and Kim Oanh, N.T. (2011). Seasonal and Diurnal Variations of Black Carbon and Organic Carbon Aerosols in Bangkok. J. Geophys. Res. 116: D15302.
Sahu, L.K. and Lal, S. (2006). Distributions of C2-C5
NMHCs and Related Trace Gases at a Tropical Urban Site in India. Atmos. Environ. 40: 880–891.
Sahu, L.K., Varun Sheel, Kajino, M. and Nedelec, P. (2013). Variability in Tropospheric Carbon Monoxide over an Urban Site in Southeast Asia. Atmos. Environ. 68: 243–255.
Schwartz, J. (1994). Air Pollution and Daily Mortality: A Review and Meta-analysis. Environ. Res. 64: 36–52.
Schwartz, J., Laden, F., Zanobetti, A. and Dockery, D.W. (2001). Is there a Threshold in the Association of PM2.5 with Daily Deaths? Epidemiology 12: S65–S65.
Seinfeld, J.H. and Pandis, S.N. (2006). Atmospheric chemistry and Physics, John Wiley and Sons, Inc., New York.
Singla, V., Satsangi, A., Pachauri, T., Lakhani, A. and Kumari, K.M. (2011). Ozone Formation and Destruction at a Sub-urban Site in North Central Region of India. Atmos. Res. 101: 373–385
Tiwari, S., Chate, D.M., Pragya, P., Ali, K. and Bisht, D.S. (2012). Variations in Mass of the PM10, PM2.5 and PM1 during the Monsoon and the Winter at New Delhi. Aerosol Air Qual. Res. 12: 20–29
Tiwari, S., Srivastava, A.K., Bisht, d.S., Bano, T., Singh, S., Behura, S., Srivastava, M.k., Chate, D.M. and Padmanabhamurty, B. (2009). Black Carbon and Chemical Characteristics of PM10 and PM2.5 at an urban Site of North India. J. Atmos. Chem. 62:193–209.
Tiwari, S., Srivastava, A.K., Bisht, D.S., Parmita, P., Srivastava, M.K. and Attri, S.D. (2013). Diurnal and Seasonal Variations of Black Carbon and PM2.5 over New Delhi, India: Influence of Meteorology. Atmos. Res. 125–126: 50–62.
Verma, R.L., Sahu, L.K., Kondo, Y., Takegawa, N., Han, S., Jung, J.S., Kim, Y.J., Fan, S., Sugimoto, N., Shammaa, M.H., Zhang, Y.H. and Zhao, Y. (2010). Temporal Variations of Black Carbon in Guangzhou, China, in Summer 2006. Atmos. Chem. Phys. 10: 6471–6485, doi: 10.5194/acp-10-6471-201.
Received for review, October 11, 2013 Accepted, January 17, 2014