TEMPORAL VARIATION IN FOOD WEB...
32
Ecological Monographs, 61(3), 1991, pp. 267-298 © 1991 by the Ecological Society of America TEMPORAL VARIATION IN FOOD WEB STRUCTURE: 16 EMPIRICAL CASES 1 KENNETH ScHOENLY AND JoEL E. CoHEN Rockefeller University, 1230 York Avenue, Box 20, New York, New York 10021-6399 USA Abstract. Analysis of food web structure and temporal dynamics is essential to un- derstanding energy flow and population dynamics of species, and may contribute to con- servation, wildlife management, and disease and pest control. This report synthesizes all the observational studies of food web dynamics to which we have access. Most published food webs are static and cumulative: they depict information gathered over many occasions. A web observed over a single, relatively short time period is time specific. Here we analyze the relation between cumulative and time-specific versions of webs in 16 published cases. Fourteen of the 16 webs are from detritus-based habitats that harbor large fractions of arthropod species: carcasses, tree fluxes, felled logs, tree holes, dung pads, and an acidic pond. The other two webs describe soybean fields and the arctic tundra. These webs are presented here in a consistent format and are analyzed in four ways. First, we quantified temporal trends and levels of variation in nine web properties: the percentages of species in the web that are top predators (%1), intermediate species (%/), and basal species (%B); the ratio of number of prey species to number of predator species (P); the mean chain length the product of species richness and connectance (Sx C); and the numbers of total species, newly arriving species, and local extinctions. In most webs %/ and %T fluctuated widely; the latter generally increased in time or remained constant, while the former correspondingly decreased or remained constant. Since the number of basal species usually varied little, changes in %B were inversely associated with changes in species richness over successional and seasonal time scales. Predictable changes in P, and Sx C accompanied the changes in %B, %!, and %T. The numbers of total species, new arrivals, and local extinctions displayed no consistent increasing or decreasing trends. Second, we compared cumulative and time-specific webs from the same habitat to determine which properties, if any, of time-specific webs might be predicted from cumu- lative webs. In cumulative webs, P, and %T came closest to the median of the values from time-specific webs, followed by%!, Sx C. and %B. Cumulative webs, which usually appear in general ecology textbooks, overestimate Sx C and underestimate %B relative to time-specific versions. In five studies cumulative webs were completed when the last or next-to-last samples were taken; additional sampling in these cases would probably have uncovered more species. Third, opportunistic species were removed from four time-specific webs to determine how these species influenced web structure. Removing one top-feeding opportunistic species from each web caused a dramatic rise in %T, small reductions in%/, Sx C. P, and a negligible rise in %B. A single opportunistic species, even though it makes only rare and brief visits to a habitat, can dramatically reshape web structure. Fourth, properties of cumulative and time-specific versions of the 16 food webs were compared to properties of cumulative webs in two published web catalogs. The cumulative versions of the 16 webs grossly resemble the cumulative webs in both prior catalogs, but the median Sx Cis greater and the median %B is lower in the 16 cumulative webs than in either prior catalog. Even for these two statistics, the median value for the 16 cumulative webs falls well within the range of variation of both prior catalogs. The time-specific webs in the 16 cases differ from those of the two prior catalogs somewhat more than do the cumulative webs. Comparisons between time-specific and cumulative versions of a web, one system at a time, are more sensitive than rough comparisons between collections of webs because the methods used to define species and links are (usually) consistent within a study. Key words: arthropod-rich food webs; community structure and assembly; cumulative vs. time- specific food webs; detritus-based systems; food web dynamics;food web structure; opportunistic species; predator-prey relationships; successional and seasonal variation in food webs; temporal variability; top predators. 1 Manuscript received 13 August 1990; revised 19 October 1990; accepted 31 October 1990.
Transcript of TEMPORAL VARIATION IN FOOD WEB...

Ecological Monographs, 61(3), 1991, pp. 267-298 © 1991 by the Ecological Society of America
TEMPORAL VARIATION IN FOOD WEB STRUCTURE: 16 EMPIRICAL CASES 1
KENNETH ScHOENLY AND JoEL E. CoHEN Rockefeller University, 1230 York Avenue, Box 20, New York, New York 10021-6399 USA
Abstract. Analysis of food web structure and temporal dynamics is essential to understanding energy flow and population dynamics of species, and may contribute to conservation, wildlife management, and disease and pest control. This report synthesizes all the observational studies of food web dynamics to which we have access.
Most published food webs are static and cumulative: they depict information gathered over many occasions. A web observed over a single, relatively short time period is time specific. Here we analyze the relation between cumulative and time-specific versions of webs in 16 published cases. Fourteen of the 16 webs are from detritus-based habitats that harbor large fractions of arthropod species: carcasses, tree fluxes, felled logs, tree holes, dung pads, and an acidic pond. The other two webs describe soybean fields and the arctic tundra. These webs are presented here in a consistent format and are analyzed in four ways.
First, we quantified temporal trends and levels of variation in nine web properties: the percentages of species in the web that are top predators (%1), intermediate species (%/), and basal species (%B); the ratio of number of prey species to number of predator species (P); the mean chain length (~); the product of species richness and connectance (Sx C); and the numbers of total species, newly arriving species, and local extinctions. In most webs %/ and %T fluctuated widely; the latter generally increased in time or remained constant, while the former correspondingly decreased or remained constant. Since the number of basal species usually varied little, changes in %B were inversely associated with changes in species richness over successional and seasonal time scales. Predictable changes in P, ~. and Sx C accompanied the changes in %B, %!, and %T. The numbers of total species, new arrivals, and local extinctions displayed no consistent increasing or decreasing trends.
Second, we compared cumulative and time-specific webs from the same habitat to determine which properties, if any, of time-specific webs might be predicted from cumulative webs. In cumulative webs, P, ~. and %T came closest to the median of the values from time-specific webs, followed by%!, Sx C. and %B. Cumulative webs, which usually appear in general ecology textbooks, overestimate Sx C and underestimate %B relative to time-specific versions. In five studies cumulative webs were completed when the last or next-to-last samples were taken; additional sampling in these cases would probably have uncovered more species.
Third, opportunistic species were removed from four time-specific webs to determine how these species influenced web structure. Removing one top-feeding opportunistic species from each web caused a dramatic rise in %T, small reductions in%/, Sx C. ~.and P, and a negligible rise in %B. A single opportunistic species, even though it makes only rare and brief visits to a habitat, can dramatically reshape web structure.
Fourth, properties of cumulative and time-specific versions of the 16 food webs were compared to properties of cumulative webs in two published web catalogs. The cumulative versions of the 16 webs grossly resemble the cumulative webs in both prior catalogs, but the median Sx Cis greater and the median %B is lower in the 16 cumulative webs than in either prior catalog. Even for these two statistics, the median value for the 16 cumulative webs falls well within the range of variation of both prior catalogs. The time-specific webs in the 16 cases differ from those of the two prior catalogs somewhat more than do the cumulative webs. Comparisons between time-specific and cumulative versions of a web, one system at a time, are more sensitive than rough comparisons between collections of webs because the methods used to define species and links are (usually) consistent within a study.
Key words: arthropod-rich food webs; community structure and assembly; cumulative vs. timespecific food webs; detritus-based systems; food web dynamics;food web structure; opportunistic species; predator-prey relationships; successional and seasonal variation in food webs; temporal variability; top predators.
1 Manuscript received 13 August 1990; revised 19 October 1990; accepted 31 October 1990.

268 KENNETH SCHOENLY AND JOEL E. COHEN Ecological Monographs
INTRODUCTION
Food webs summarize predator-prey relationships in ecological communities. Studies oflarge collections of published webs have provided several new generalizations about the organization of ecological communities (Cohen 1978, Pimm 1982, Briand 1983, Schoener 1989, Sugihara eta!. 1989, Cohen eta!. 1990a; for a recent review, see Lawton 1989). These generalizations are open to criticism in part because the underlying data are frequently of poor quality (e.g., see Paine 1988); the data often blur spatial and temporal heterogeneity in web structure. Most reported webs are vague about the duration ofthe period of observation. Here we assemble, describe, and analyze the first substantial collection of webs in which changes over time are reported in detail.
The analysis of web structure and dynamics is essential to a realistic understanding of the population dynamics of species, energy flow, and other ecological processes. Though these dynamic processes are of greater intrinsic interest than web structure for some ecologists, the study of one or a few species in theoretical or experimental isolation provides little or no useful guidance, in many instances, to the organization and likely behavior of species embedded in real communities. Moreover, an understanding of webs may contribute to diverse practical applications, such as conservation and wildlife management, pest and disease vector control, and medical (including forensic) entomology (Schoenly I 991 ).
Food web dynamics can be approached in three ways: theoretically, experimentally, and observationally. There are numerous theoretical studies of web dynamics(e.g.,PimmandLawton 1977, Yodzis 1981,1984, Post and Pimm 1983, Cohen and Newman 1988, Cohen et a!. 1990b), but most dynamic models lack detailed empirical foundations. A realistic general dynamic theory of webs does not yet exist. Few experimental studies of web dynamics are available (e.g., Drake 1985, Pimm and Kitching 1987, Jenkins and Kitching 1990). Several observational field studies of individual habitats have demonstrated that webs can vary substantially in time and in space (Brooks and Dodson 1965, Beaver 1985, Kitching 1987, Warren 1989, Winemiller 1990; see also Crowder eta!. 1988, Frost et a!. 1988, Lodge et a!. 1988, and Porter et a!. 1988).
This report synthesizes all the observational studies of food web dynamics to which we have access. The observed patterns in the temporal dynamics of webs may provide empirical guidance to future theoretical developments.
Most published webs depict information gathered cumulatively, over many occasions and sometimes several locations. We will call a web gathered over many occasions within spatial limits specified by an author a "cumulative" web. Cumulative webs present
Vol. 61, No.3
static images of trophic interactions and they routinely appear in general ecology textbooks (e.g., Odum 1983, Krebs 1985, Begon eta!. 1986, Ricklefs 1990). We will call a web observed in one place over a single, relatively short time period, a "time-specific" web. Our analysis of the relation between cumulative and time-specific webs has four parts. First, using published time-specific web data, we quantify temporal variation in nine properties. Second, we compare cumulative and time-specific webs from the same habitat to determine which properties, if any, of time-specific webs might be predicted from cumulative webs. Does a cumulative web differ greatly from the time-specific webs that it cumulates? Third, we hypothetically remove opportunist species from time-specific webs to determine how much these rare but potentially important species influence web structure. Fourth, we compare properties of cumulative and time-specific webs to properties of webs in two published catalogs (Cohen eta!. 1990a, Schoenly et a!. I 991 ).
DATA SOURCES, METHODS, AND FOOD WEB STATISTICS
Sixteen food webs from eight published studies are included in this analysis (Table 1 ). Most webs are based on detritus that supports large numbers of arthropod species. All but two of the eight studies (Naumov 1972, Warren 1989) were part of investigations on insect trophic structure (Schoenly 1990, Schoenly eta!. 1991 ), and in these six studies all webs but one (Robinson 1953) were classified by one of us (Schoenly eta!. 1991) as community webs (as originally defined by Cohen 1978). Robinson's (1953) web is classified as a source web (the source is tree flux, or oozing sap).
In all the webs except that ofSdobnikov (1958), both vertebrates and invertebrates are identified to species and genus. Hence, the taxonomic resolution is uniform across trophic levels. In approximately one-half ofthese webs, predator-prey links are simply present or absent, but not otherwise quantified. Three studies include relative abundances or species biomasses (Valiela 1974, Kitching 1987, Warren 1989). In studies of small and relatively short-lived dungpats and carcasses (Valiela 1974, McK.innemey 1978), the interval between consecutive samples is short, usually only a single day. In studies oflarger and more perennial habitats, like soybean fields (Mayse and Price 1978) and rotting)ogs (Savely 1939), the interval between samples varies from several weeks to one year.
McK.innemey (1977, 1978) studied carrion communities at three locations in the Chihuahuan Desert: Hueco Mountains, Texas (26 time-specific samples); White Sands National Monument, New Mexico (39); and Aden Crater, New Mexico (II). Prey and predator lists were collected for invertebrate species but not for vertebrates at White Sands and Aden Crater; carrionfrequenting vertebrates were not studied at the Hueco Mountains site. At Aden Crater, carcasses were sam-
September 1991 TEMPORAL VARIATION IN FOOD WEBS 269
pled less frequently than carcasses at the other sites, a higher proportion of species were vertebrates, and prey of vertebrates were not reported. We therefore elected to exclude the Aden Crater data set from this analysis.
The authors determined trophic links using varied methods. All the authors used direct field observation. Some studies (Savely 1939, Mayse and Price 1978, McKinnerney 1978, Warren 1989) also used literature accounts of the same or related species in different locations. In addition, Savely (1939), Robinson (1953), and Warren (1989) analyzed gut contents of some species. Valiela (1974) and Warren (1989) also performed laboratory feeding trials on selected sets of predators and prey. Details on the method(s) used by Sdobnikov (1958, cited by Naumov 1972: 549) to construct his arctic tundra webs are unavailable to us.
We constructed cumulative and time-specific webs from each study in the form of matrices, each containing one column per predator and one row per prey. When species A eats species B there is a 'I' in column A and row B; otherwise there is a '0.' Where the reported data made it possible to do so, we constructed site-specific cumulative webs by cumulating over time the trophic links of reported time-specific and sitespecific webs (Naumov 1972, Valiela 1974, Mayse and Price 1978, Kitching 1987, Warren 1989). Where the original report presented only a cumulative web and time-specific species lists (Robinson 1953, McKinnerney 1977, 1978), we constructed time-specific webs by assuming that a feeding link from prey A to predator B was present in the time-specific web if and only if such a link was present in the cumulative web and species A and B occurred together at the time of observation. Savely (1939: appendix) listed diets and times of occurrence of species in a form substantially equivalent to our Table A4 and Table AS. (He also graphed one time-specific web for pine logs.) We constructed cumulative and time-specific webs from his list.
McKinnerney (1978) and Mayse and Price (1978) gave detailed information about the distribution over time of sampling effort and field observations. In the other studies, temporal variation in web structure is an unknown compound of variation in the observer's sampling effort and variation in the underlying web. As have others before (e.g., R. T. Paine, as cited in Cohen 1978: 121; Winemiller 1990), we urge that future studies of temporal change in webs give explicit reports of sampling effort over time.
Our reconstructions of prey records, time data, and species lists for all 16 webs appear in the Appendix. Cumulative and time-specific webs from each study will be available in version 2 of ECOWeB. One set of time-specific webs from each of four published reports (Savely 1939, Valiela 1974, Mayse and Price 1978, McKinnerney 1978) is already available in version I of ECOWeB (Cohen 1989).
Warren (1989) drew time-specific web graphs for two
sites (the margin and open water) in a pond at Skipwith observed on each of five sampling dates. Warren observed the relative abundance, life-history stage, and length of organisms. In his data, unlike the data from all the other studies, the simultaneous presence of two species A and B does not automatically imply a feeding relation between them, even if there is a feeding relation between them in the cumulative web, because "not all sizes or stages of particular species can feed on all sizes or stages of another species" (P. H. Warren, personal communication, 4 April 1990).
Because of inconsistencies between field workers in the reporting of cannibalism, we elected simply to exclude cannibalistic links. This decision accords with the practice of some other investigators (e.g., Pimm 1982: 125; Cohen et a!. 1990a, Schoenly et a!. 1991 ). Reported cannibalistic links are included in the Appendix but were dropped prior to our analyses.
The only reported cases of mutual predation (i.e., species A eats species B and simultaneously species B eats species A) occurred in the Queensland tree-hole webs of Kitching (1987: 281, Fig. 1). There each of three species (numbered 6, 7, and 8 in our Table A6) is reported to prey on both of the other two. This reported mutual predation is also consistent with the feeding relations reported for these three species in a more recent report by the same author (Jenkins and Kitching 1990: 200, Fig. 1) but was not reported consistently in three other studies (Kitching 1983: 216, Fig. 8, Kitching and Pimm 1985: 133, Fig. 4a, Kitching and Beaver 1990: 152, Fig. 9 .2). R. L. Kitching (personal communication, 12 July 1990) stated that his 1987 analysis used "a slightly different form of presentation than the earlier descriptive papers and did not require the same degree of detail in the web used." We included these links of apparent mutual predation in the Appendix. However, as we did for cannibalism, we excluded all links among these three species prior to analysis to make Kitching's data more comparable to the data in the seven other reports.
There were no predatory cycles of length 3 (i.e., A eats B, Beats C, and C eats A) or longer in any of the webs. Consequently, after the exclusion of cannibalism and of Kitching's report of mutual predation, all webs were acyclic.
Quantitative measures of web structure were calculated for each time-specific web and, where applicable, each cumulative web. These statistics are based on investigator-defined species and links, not on trophic species and trophic links obtained by lumping (lumping is defined by Briand and Cohen [1984]). The first six statistics (a-f) apply to both time-specific and cumulative webs:
a) %T, the percentage of top predators in the web, i.e., I 00 times the number of species with no reported predators divided by S, the total number of species reported in the web (Briand and Cohen 1984);
b) %/, the percentage of intermediate species, i.e.,

270 KENNETH SCHOENLY AND JOEL E. COHEN Ecological Monographs Vol. 61, No.3
TABLE I. Structural statistics of time-specific and cumulative versions of 16 food webs.
% top species % intermediate % basal species Prey/Predator
(%7) species (%/) (%B) (P)
Food web N* Ranget Med.* Cum.§ Range Med. Cum. Range Med. Cum. Range Med. Cum.
Carrion; Hueco Mts., USA 27 4-86 55 34 0-92 41 64 4-25 6 0.17-l.O 0.48 0.67
Carrion; White Sands, USA 40 67-92 83 76 0-22 20 5-33 4 0.08-D.50 0.20 0.25
Elm flux; Sheffield, 25 29-50 33 25 25-57 50 63 14-33 17 12 0.66-l.O 0.89 0.86
United Kingdom Pine logs; N. Carolina, USA 57-70 65 61 26-38 32 35 3-5 4 0.31...{).45 0.37 0.41
Oak logs; N. Carolina, USA 54-76 67 70 21-40 29 26 3-6 4 0.25...{).49 0.35 0.32
Treeholes; Australia, site 1 13-38 29 10 24-49 32 60 38-40 38 30 l.0-1.40 l.l7 1.29 Treeholes; Australia, site 2 10-43 31 9 28~0 31 64 29-43 31 27 0.80-1.29 1.13 1.25
Treeholes; Australia, site 4 29-44 37 40 23-33 29 30 30-43 33 30 0.83-1.75 0.93 0.86 Treeholes; Australia, site 5 29-38 34 30 24-40 26 40 30-43 38 30 l.0-1.25 1.0 1.0
Treeholes; Australia, site 10 25-33 29 33 33-37 35 33 33-38 36 33 l.0-1.20 l.l 1.0 Treeholes; Australia, site II 14-50 29 40 12-43 35 30 33-43 38 30 0.80-1.50 l.l 0.86
Soybean; Illinois, USA 29-33 31 33 57~0 59 60 7-14 ll 0.7l-D.83 0.77 0.71
Arctic tundra; USSR 45-50 48 45 33-40 37 40 15-17 16 15 0.60-D.65 0.62 0.65
Dung; New York, USA 37-45 39 41 52~1 57 57 2-3 0.57-D.64 0.61 0.60
Pond; United Kingdom, open 6 17-38 21 18 54-79 73 78 4-8 4 0.67-D.87 0.83 0.85
water site
Pond; United Kingdom, pond 6 19-26 25 24 70-77 72 73 3-5 4 0.76-D.84 0.79 0.78
margin site
*The number of time-specific webs plus the cumulative version. t Range of variation in the time-specific versions. t Median in the time-specific versions. §Value for the cumulative version. II C = connectance, the ratio of actual links to possible links in a food web.
100 times the number of species with both predators and prey, divided by S;
c) %B, the percentage of basal species (pure autotrophs and detritus), i.e., I 00 times the number of species with no reported prey, divided by S;
d) P, the ratio of the number of prey species to the number of predator species (Cohen 1977);
e) IJ., the mean chain length of the web, i.e., the average length (counting links, not counting species) of all maximal food chains from a basal species to a top predator (Cohen 1978);
f) Sx C, the product of species richness Sand connectance C, where C = L/[S(S - 1)/2] and L is the number of predator-prey links reported in the web (Briand 1983). Thus Sx C = 2L/(S- 1) is very nearly twice the ratio of links to species.
The following characteristics pertain only to timespecific webs:
g) S, the total number of species (species richness), defined as the number of investigator-defined species observed in a particular time-specific web.
h) The number of newly arriving species, defined as the number of investigator-defined species who were not observed in any previous time-specific web. For the first time-specific web, the number of newly arriving species is defined to equal the number of total species.
i) The number of local extinctions, defined as the number of investigator-defined species that are present in the current time-specific web and are absent from the next time-specific web, the first time that such species disappear.
By definition, the statistics on new arrivals and local extinctions pertain to the first interval during which species are present in the web. For example, if a species is present in a first time-specific web, is absent from a second, reappears in a third, and is absent from a fourth, it is not counted as a newly arriving species at the time of the third time-specific web, and it is not counted as a local extinction at the time of the fourth web.
RESULTS
Temporal variation in food web properties
Food web structure varies substantially over time (Figs. 1-7). We shall summarize this variability using the median, over all 16 webs, of the range of each statistic over the time-specific versions. Among the trophic positions%/ varies most, with a median range of21, followed closely by %Tat 18, and %Bat 6 (Table 1). Large fluctuations in both %1 and %T reflect extensive reshuffling of species with different diets and residence times in the community. Since the number

September 1991 TEMPORAL VARIATION IN FOOD WEBS 271
TABLE 1. Continued.
Mean chain length Sxq~2U
(~) Total no. species (S) No. links (L) (S- I)
Range Med. Cum. Range Med. Cum. Range
L0-3.30 1.77 2.55 4-28 16 47 3-92
L0-1.65 1.25 1.65 3-20 14 25 2-39
1.5-2.25 2.20 2.17 4-7 6 3-9
2.0-2.55 2.34 2.43 36-86 55 112 47-156 2.09-2.64 2.41 2.47 48-88 81 139 70-117
2.0-2.67 2.0 2.75 5-8 10 4-11 2.0-2.77 2.0 2.76 7-10 II 7-16
1.67-1.89 1.75 1.8 7-10 10 6-11 1.5-1.9 1.64 1.9 7-10 10 5-13
1.67-1.89 1.8 1.89 6-9 9 6-11 1.67-2.0 1.8 1.8 7-9 10 7-9 2.0-2.27 2.14 2.27 7-15 II 15 10-35
1.79-1.91 1.86 1.91 12-20 16 20 23-54
3.23-3.59 3.41 3.51 29-43 36 46 86-211 2.04-3.85 3.17 3.76 13-24 18 28 29-110
3.72-4.57 4.03 4.81 26-34 26 37 75-194
of basal species in most webs varies little, changes in %B are inversely associated with changes in S.
We now present detailed graphs and describe temporal variation in web structure, one property at a time, for seven of the most frequently sampled cases (McKinnemey 1977, Hueco Mountains and White Sands sites; Robinson, 1953, elm flux; Savely 1939, oak and pine logs; Warren 1989, margin and open water sites; Figs. 1-7). Temporal variation in the remaining nine cases (Kitching 1987, six sites; Mayse and Price 1978, Naumov 1972, Valiela 1974) is summarized in Table I.
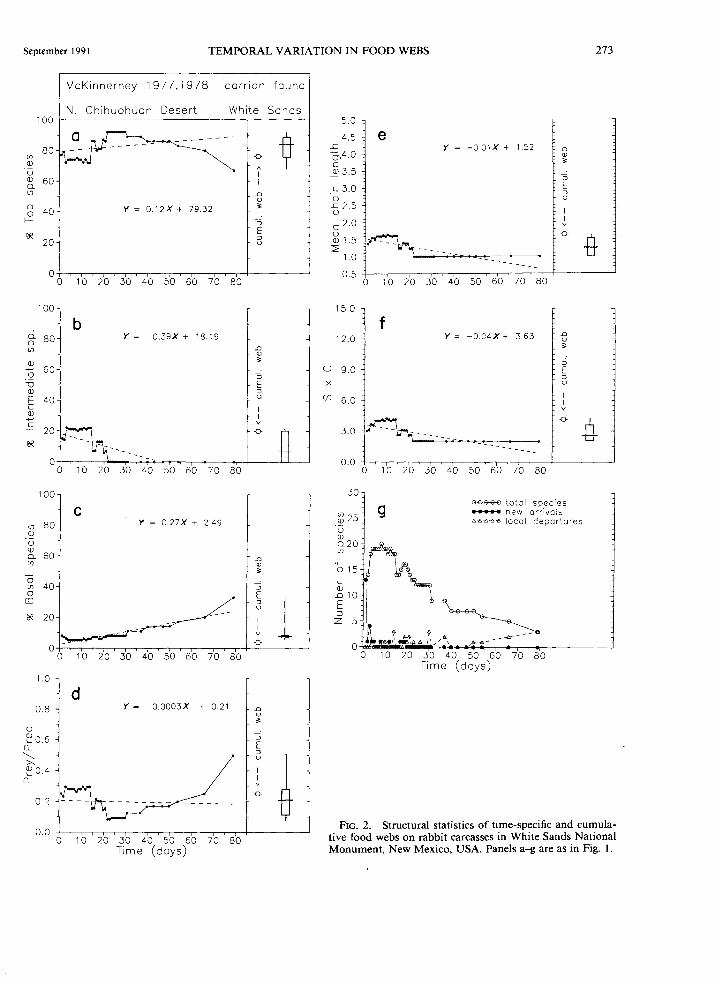
In a rabbit necrovore study of McKinnemey ( 197 8) in the Hueco Mountains, Texas, %T and %/change dramatically, with values spanning nearly the entire possible range for these properties (Fig. la,b). High numbers of both new arrivals and local extinctions are strongly influenced by the quality and availability of carcass resources, and account for a substantial fraction of the total variation. Early successional species, such as carrion-breeding flies, that are at first intermediate species later become top predators after their natural enemies leave the carcass. As the time since carcass deposition increases, detritivorous species become more numerous than predators. As a result, P, J.L, and Sx C also decrease (Fig. ld-f). Similar trends in %T, %/, P, J.L, and Sx Care observed on carrion in White Sands
Me d. Cum. Range Med. Cum. Reference(s)
36 195 2.0-8.06 4.4 8.48 McKinnerney (1977. 1978)
22 50 2.0-4.22 2.62 4.17 McKinnemey (1977, 1978)
II 2.0-3.0 2.8 3.14 Robinson (1953)
75 192 2.57-3.67 2.82 3.46 Savely (1939) 116 199 2.69-2.99 2.90 2.88 Savely (1939)
9 19 2.0-3.14 2.57 4.22 Kitching (1987)
10.5 21 2.33-3.56 2.96 4.2 Kitching (1987) 9.5 12 1.98-2.75 2.35 2.67 Kitching (1987) 6.5 13 1.67-2.89 1.86 2.89 Kitching (1987)
8 II 2.0-2.75 2.29 2.75 Kitching (1987)
7.5 12 2.0-2.33 2.27 2.67 Kitching (1987) 22.5 35 3.33-5.0 4.17 5.0 Mayse and Price
(1978)
39 54 4.18-5.68 4.93 5.68 Naumov ( 1972, after Sdobnikov 1958)
149 218 6.14-10.1 8.1 9.69 Valiela (1974)
69 134 4.83-9.65 8.12 9.93 Warren (1989)
136 262 7.9-12.52 10.9 14.6 Warren (1989)
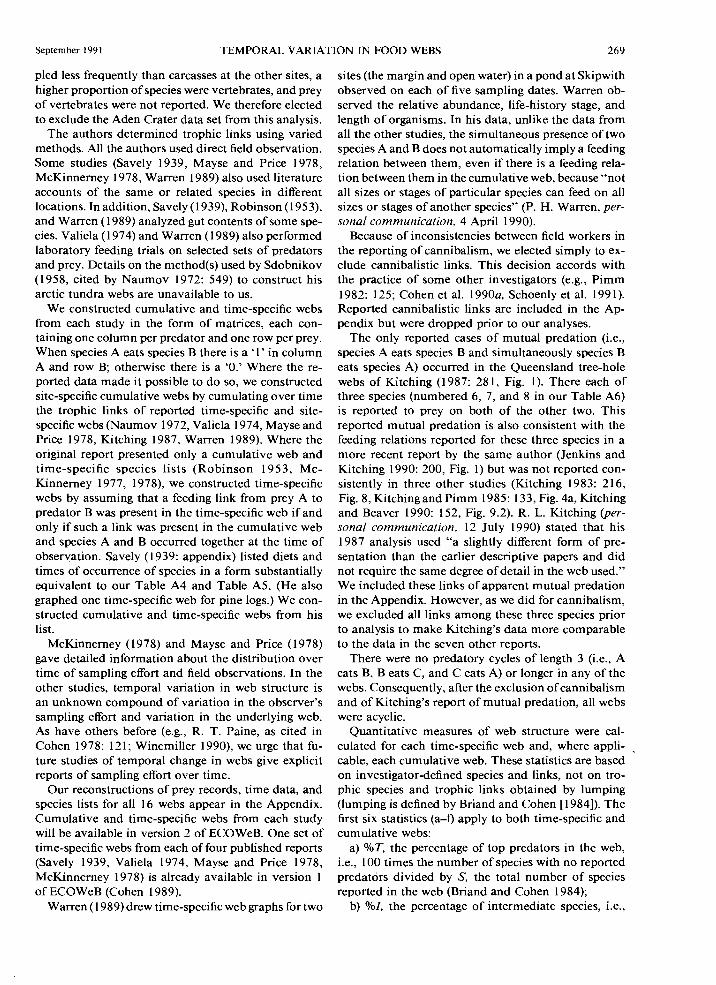
(McKinnemey 1978) (Fig. 2) and in decaying oak logs and pine logs (Savely 1939) (Figs. 4 and 5).
The elm flux web of Robinson (1953) has fewer species and seasonal rather than successional turnover of species. Compared to the webs of McKinnemey and Savely, variation in all properties is dampened considerably in the flux web (Fig. 3a-f). This reduced variation may be largely attributable to an uninterrupted presence of flux material-a sap oozing from branch scars of elms-and the nearly continuous presence of four arthropod species (numbered 1, 2, 4, and 7 in the Appendix) that live and breed in the flux material year round. This web appears to owe its low level of temporal variability to a relatively stable basal resource, elm flux.
According to Warren (1989), both the margin and. the open water of an acidic pond at Skipwith Common held increasing numbers of species from mid-March to early October (Figs. 6g and 7g). Accompanying these changes were increases in J.L and S x C. slight decreases in %B, and varying trends in %T, %1, and P (a-fin Figs. 6 and 7). More litter and more species were found in the pond margin than in open water. Warren (1989) hypothesized that higher energy input in the pond margin may have contributed to the observed differences between the two sites in species richness and foodchain lengths.

272 KENNETH SCHOENL Y AND JOEL E. COHEN Ecological Monographs Vol. 61, No.3
McKinnerney 1977,1978 carrion fauna
N. Chihuahuan Desert Hueco Mts. 100+---------------------------,-------~
Ul Q)
u
80
g_ 60 Ul
g- 40 1-
tR 20
100
iS= 80 Ul
Q) ~ 60 0
u Q)
§ 40
.;:; c
20
0
b
Y = 158X + 31.53
Y = -1.83X + 64.92
.D Q)
'<
::J
E ::J u
I I
v
A
I I
.D Q)
'<
::J
E ::J u
o+.~~~~~~~~~~~~~~~----L---
100
Ul 80 Q)
u Q)
0. 60 Ul
0 Ul 40 0
CD
1.0
0.8
u 2:' 0.6
Q.
"'-.. >-,
2:'0.4 Q.
0.2
o 5
c
5
0 5
10 15 20 25
y 0.26X + 3.55
10 15 20 25
Y = -0.02X + 0.72
10 15 20 Time (days)
30
30
.D Q)
'<
A
I I
.D Q)
'<
::J
E ::J u
.r:
5.0
4.5
0,4.0 c ~3.5
.~ 3.0 0 £2.5 u c 2.0
~ 1.5 .2
1.0
0.5
15.0
12.0
u 9.0
X
(_() 6.0
3.0
e
0 5 10
f
Y = -0.03X + 2.12
15 20 25 30
Y = -0.1 5X + 6.30
.D QJ
'<
::J
E ::J u
-o A
I I
.D Q)
'<
::J
E ::J
0.0 +.~rr,rTT~~~"~""~"rr~~~u~----~
30
:G 25 u Q)
o_20 Ul
L Q)
.D 10 E :::J z 5
0 5
g
5
10 15 20 25 30
G-e-e-e-f) total species new a rriva Is
ts&t>t>t:> local departures
10 15 20 Time (days)
25 30
FIG. I. Structural statistics of time-specific and cumulative food webs on rabbit carcasses in the Hueco Mountains, Texas, USA. The value for the cumulative web is shown on the right side of each panel. Variation in time-specifio webs is summarized for each statistic by box plots. In each box plot the vertical line represents the range, the lower and upper edges of the box represent the first and third quartiles, respectively, and the horizontal line represents the median value. An open, unconnected circle shows the value for each statistic after an opportunistic predator, Proctacanthella leucopogon (Asilidae: Diptera), was removed from the day-9 web.
September I 991 TEMPORAL VARIATION IN FOOD WEBS 273
McKinnerney 1977,1978 carrion
N. Chihuohuan Desert White 100
80 (})
Q)
u Q) 60 Q_
0~~ t=.-:- -----0
A
I I
(}) .n
"' Q_ 40 0
Y = 0.12X + 79.32 ~
f- -:J
(1< 20
E :J u
0 0 1 0 20 30 40 50 60 70 80
100
b D. 80 y = -0 . .39X + '8.' 9 Q_ (}) .n
"' Q)
~
+" 60 0 :J
""0 E Q) :J
E 40 u 1.... I 2 I c v
20 0
(1<
10 20 30 40 50 60 70 80
100
c (}) 80 y 0.27 X + 2.49 QJ
u QJ Q_ 60 (})
.n
"' ~ 0 (}) 40 :J 0 m E
:J u
tR 20 I I v
0
10 20 50 60 70 80
.0
d 0.8 Y = -0.0003X + 0.21
""0
~0.6 Q_
"'-->-. ~ 0.4
Q_
0.2
0 1 0 20 30 40 50 60 70 80 Time (days)
fauna
Sonds
y
1
5.0
4.5 ..c (J,4.0 c
_(!) 3.5
c 3.0 0
..c 2.5 u c 2.0 0 Q) 1.5
2 1.0
0.5
15.0
12.0
u 9.0 X
Ul 6.0
3.0
0.0
30
:ij25 u Q)
Q20 (})
015 1.... Q)
.D 10 E :::J z 5
e y = -0.01X + 1.52 .n
"' ~ :J
E :J u
I I v
0
-8-0 10 20 30 40 50 60 70 80
f Y= -0 04X + 3.63 .n
"' ~ :J
E :J u
I I
v
r~-------0
_g_ . . .... 0 10 20
g
30 40 50 60 70 80
~ ~otol spec'es ......... new arrivals .c..-o!'l-1!'..-6-6 local c'e;::JOrtures
6-1!!. ___ ..-A--
30 40 50 60 70 80 Time (doys)
FIG. 2. Structural statistics of time-specific and cumulative food webs on rabbit carcasses in White Sands National Monument, New Mexico, USA. Panels a-g are as in Fig. I.

274 KENNETH SCHOENL Y AND JOEL E. COHEN Ecological Monographs Vol. 61, No.3
Robinson 1953 tree flux insects
Sheffield, U.K. elm trees 100
a 80
(f)
Q)
y = -0.04 )( + 35.42 .D (l)
" () _; Q) 60 o_
::> E
(f)
o_ 40 0
f- ~~ ::>
~ u
I I
v
eR 20
-o
0 0 8 1 6 24 32 40 48
100
b ci.. 80 Y = 0.09X + 45.55 o_ (f)
Q) -o _,_., 60 0 f4t\Jrr\ A
1 u I Q) I
t: 40 .D L (l) Q) " _,_., c
20 ::>
eR E ::> u
0 c.'s 0 8 16 24 32 40
100
c (f) 80 Y = -o.o5x + 18.95 Q)
() .D Q) (l) o_ 60 " (f)
::> 0 E (f) 40 ::> 0 u m
~ I
eR 20 I v
-o
0 0 8 16 24 32 40 48
1.0
~ -o 0.8 A
I I u
2: 0.6 .D
Y = 0.0003X (l)
Q_ d + 0.86 " '-....._ >, ::> 2: 0.4 E
Q_ ::> u
0.2
0. 0 t-~-:c-~...--~...--...--...--...---,-~--,-l__--__j 0 8 16 24 32 40
Time (weeks) 48
5.0 .D
4.5 e (l)
..c y -0.002 X + 2.09 " (;,4.0 ::>
c E ..'lo! 3.5 ::> u
-~ 3.0 I 0 I
..c 2.5 v () -o r c 2.0 -------- ---------0 QJ 1 .5 2
1 .0
0.5 0 8 16 24 32 40 48
15.0
f 12.0 Y = 0.002 X+ 2.59
.D (l)
" u 9.0 ::>
X E ::> u
(/] 6.0 I I v
3.0 -o ~
0.0 0 8 16 24 32 40 48
30
~ 25 g
() G-e-6-e-8 toto I species QJ ............ new arrivals o_2o (f) &6666 loco I deportu res
015 L
QJ .0 10 t: ::J z 5
ti
8 16 24 32 40 48 Time (weeks)
FIG. 3. Structural statistics of time-specific and cumulative food webs on elm flux in Sheffield, United Kingdom. Panels a-g are as in Fig. I.

September 1991 TEMPORAL VARIATION IN FOOD WEBS 275
.-----------------------------------------Savely 1939 rotting wood fauna
N. Carolina woodland p1ne logs 100+-----------------------------,---~--~
(f)
QJ
()
80
g;_ 60 (f)
g- 40 f-
20
a Y = 2.6X + 57.50
" I I
Ll
" " ::l
E ::l u
0+-----.-----.-----.-----.-----~------~
100
23:: 80 (f)
GJ 0 60
u QJ
E 40 'QJ
c 20
0 2
b
3 4 5
y = -1.9X + 36.50 Ll <lJ
" ::l
E ::l u
I I v
0+-----,----,----,-----,----+------~
100
(f) 80 GJ ()
g_ 60 (f)
0 (f) 40 0 m
"' 20
1.0
0.8
u 2:'06
Q_
'-...... ~
2:'0.4 Q_
0.2
0 2
c
d
3 4 5
y -0.7X + 6.0
y -0.03X + 0.45
Ll <lJ
" ::l
E ::l u
I I
v
Ll <lJ
" ::l
E ::l u
I I v otJ
0. 0 +-----,-------,----..------,-----+------~ 0 2 3 4 5
Time (yecrs)
..c
5.0
4.5
0,4.0 c
_GJ 3.5
.~ 3.0 0
..c 2.5 ()
c 2.0 0 GJ 1. 5
2 1.0
e Y = -0.18X + 2.76
Ll <lJ
" ::l
E ::l u
I I v
0.5 T-----,-----,-----,-----,-----~------~ 0 2
15.0
f 12.0
u 9.0 X
(f) 6.0
3.0
3 4 5
Y = -0.33X + 3.81 Ll <lJ
" ::l
E ::l u
I I v
0.0 +-------,,----,----,-----,----+------~
100
(f)
GJ 80 u GJ 0.. (f) 60 ~
0
~ 40 .D
E ~ 20
0
g
2 3 4 5
G-e-e-e-€l total species ........,. new arrivals &666<> local departures
2 3 4 5 Time (yecrs)
FIG. 4. Structural statistics of time-specific and cumulative food webs on rotting pine logs in North Carolina, USA. Panels a--g are as in Fig. I.

276 KENNETH SCHOENL Y AND JOEL E. COHEN Ecological Monographs Vol. 61, No.3
Several overall temporal patterns emerge. We shall describe these patterns in qualitative terms, without attempting to attach levels of statistical significance to the slopes of the regressions shown in Figs. 1-7, because successive data points within each panel in these figures are not statistically independent.
In six of the seven webs pictured the proportion of top species either increases or is nearly constant over time; in the exceptional cases (Warren's open water site, Fig. 6a), %T decreases very slightly. Except for the White Sands carrion study, there is little increasing or decreasing temporal trend in %B. It follows that where %T increases and %B is roughly constant in time,%/ must decrease. These patterns determine the behavior of the prey/predator ratio P = (%B + %/)/(%/ + %T) = (%B + %1)1(100 - %B), for if %B is constant and %1 is decreasing in time, then P must be decreasing in time. This is indeed generally the case (d in Figs. 1-7), again with the not very strong exception ofWarren's open water site (Fig. 6d). Further, if%T increases, %B is roughly constant, and %/ decreases in time, and if the presence or absence of a link between any two species does not depend on time, then J.L should decrease in time, since there are relatively fewer intermediate species among which a food chain can travel before terminating in a top species. Indeed, J.L remains constant or decreases with time in Figs. 1-5 (series e). In Figs. 6e and 7e the regressions of mean chain lengths increase slightly with time amid substantial fluctuations in the individual points, giving only weak evidence for a real increase in mean chain lengths. The temporal pattern of S x C = 2L/(S - I) (fin Figs. 1-7) corresponds exactly to the temporal pattern of J.L; in each case, both S x C and J.L increase, or both decrease, or both are nearly constant in time. Careful comparison of S x C and J.L, study by study, shows that even minor fluctuations in one variable are often reflected in the other.
The correspondence between S x C and J.L has a simple but rough (not exact) explanation. Any chain of n links contains n + I species, so the longer a chain is, the higher the ratio of links to species for that chain. (For example, a chain of one link has a links-to-species ratio of 0.5, while a chain of four links has a links: species ratio of 0.8.) Therefore, the higher the mean chain length, the higher is the mean links : species ratio over all chains, counting each link and each species as many times as it occurs in a chain. The mean links : species ratio over all chains does not correspond exactly to S x C = 2L!(S - I), because the latter counts each link and each species exactly once, but it is not surprising that the mean links : species ratio over all chains and Sx C vary similarly.
Thus the temporal patterns in %B, %1, and %T (series a--c of Figs. 1-7) largely or approximately determine the temporal patterns of the prey: predator ratio P, the mean chain length /J., and S x C.
Changes over time in the numbers of total species, newly arriving species, and local species extinctions followed a diversity of patterns (g in Figs. 1-7). The numbers of total species showed a unimodal peak in two cases (McKinnerney's webs, for which reported sampling effort was nearly uniform over time), three cases of increasing trend (g in Figs. 5-7), one case of decreasing trend (Fig. 4g), and one case of essentially no trend (Fig. 3g). As a whole, the number of total species displayed no systematic trend. If most observers (other than McKinnerney and Mayse and Price) had systematically increased or systematically decreased their sampling effort over time, one might have expected a similar systematic pattern in the number of total species reported (superimposed on possible successional or seasonal effects on the number of total species). The absence of such systematic patterns in the number of total species, plus the presence of systematic patterns in some other features, such as the percentage of top species, suggests that these systematic patterns in other features are genuine, and not artifacts of changes in sampling effort.
The numbers of newly arriving species and local species extinctions similarly displayed no systematic increasing or decreasing trend over time, as a whole (g in Figs. 1-7). These statistics describe the great majority of the appearances of species in these webs, because in most webs most species were present for a single interval (Table 2). For example, in the Hueco Mountains 94% of the 4 7 species observed appeared only for a single interval, never reappearing after once going locally extinct; the remaining 6% of species were reported as present in two intervals of time-specific webs. Only in the elm flux web of Robinson (1953) were less than half of the species present for a single interval.
The cumulative web is determined when the last new species arrives. In three of the seven webs illustrated (Savely 1939, oak logs and pine logs; Warren 1989, open water site), the cumulative webs were completed when the last samples were taken (g in Figs. 4-6), and in two other webs (Hueco Mountains rabbit carrion, McKinnerney 1978; pond margin, Warren 1989), in the next-to-last sample (g in Figs. I and 7). However, in the White Sands carrion web and the elm flux web the cumulative web was reached before one-half of the samples had been taken (day 19 and week 20, respec-tively; g in Figs. 2 and 3). ·
These observations strongly suggest that additional sampling might have uncovered additional species in the first five cases mentioned. It seems very unlikely that the cumulative webs in these cases really include all the species that visit these communities. But it is possible that some species arrive only as a resource (carcass, log, or dungpat) is almost completely consumed; Schoenly and Reid ( 198 7) refer to such species in carrion as members of the "endpoint fauna."

September 1991 TEMPORAL VARIATION IN FOOD WEBS 277
100
80 Ul (l)
u (l) 60 Q_ Ul
Q_ 40 0
I-
~ 20
0 0
100
ci 80 Q_ Ul
(l)
60 ~
0
u (l)
E 40 '--
2 c
20 ~
0 0
100
Ul 80 (l)
u (l) Q_ 60 Ul
0 Ul 40 0
m
~ 20
0 0
1.0
0.8
u 2:' 0.6
Q_
"---... ~
2:' 0.4 Q_
0.2
0.0 0
Savely 1939 ratting
N. Carolina woodland
a Y = 7.2X + 48.0
~
2 3 4
b Y = -6.2X + 45.0
2 3 4
c y -1.CX + 7.0
2 3 4
d Y = -O.OBX + 0.55
2 3 4 Time (years)
wood fauna
oak logs
5
5
5
5
-o A
I I
.0 Q)
" -:J
E :J u
.0 Q)
" :J
E :J u
.0 Q)
" :J
E :J u
-o
.0 Q)
" :J
E ::J u
t
-e-
5.0 .0 Q)
4.5 e " ..c: y -0.19X + 2.86 ::J 0,4 0 E c :J
~3.5 u
.'::: 3.0 I I
0 v
..c: 2.5 ~ -o 1t u
c 2.0 0 (l) 1.5
2 1.0
0.5 0 2 3 4 5
15.0
f 12.0 y = -0.10X + 3.13
.0 Q)
" u 9.0 :J
X E :J
Vl 6.0 u
I I v
3.0 -o -o-
0.0 0 2 3 4 5
100
Ul g
(l) 80 ' u ' (l) ' Q_ ' Ul 60
4- G-e-&&EJ total spp 0 ._._...... new spp.
' '-- 40 ' fr666£> departures (l)
D
E :J 20 z .!:>
1!5
0 0 2 3 4 5
Time (years)
FIG. 5. Structural statistics of time-specific and cumulative food webs on rotting oak logs in North Carolina, USA. Panels a-g are as in Fig. I.

278
100
80 U1 CJ
u (') 60 0. U1
0. 40 0
I-
1R 20
0 0
100
0. 80 0. U1
CJ 60 ~
0
u (')
§ "-0 (') ~
c 20
CR
0 0
100
U1 80 CJ
u CJ 0. 60 U1
0 <:0 U1
0 m
CR 20
0 0
1.0
0.8
u = 0.6 c_ ~ >,
2:l0.4 c_
0.2
0.0 0
KENNETH SCHOENL Y AND JOEL E. COHEN Ecological Monographs Vol. 61, No.3
Worren 1989 acidic pond fauna
N. Yori<shire, UK open water site
a y = -0.27 X + 27.58
.D Q)
" -::J
E ::J u
I
~ --- I ---- ---- ----- 0 v - -~ 0
4 8 12 1 6 20 24 28
b y C.40X + 64.54
TI1 0
0 A
I I
.D
"' " ::J
E ::J u
4 8 12 1 6 20 24 28
c y -0.14X + 7.88
.D Q)
" ::J
E ::J u
0 .,;,-
4 8 12 '6 20 24 28
d 0
tr 0 A
I I
.D Q)
y = 0.002X-'- 0 78 " ::J
E ::J u
4 8 12 1 6 20 24 28 t"ne (wee:,.s)
5.0
4.5 e Y = O.C2X-. 2.87
.s.:: (;4.0
~~~~---~~ 0
TI
c ~3.5 A
I
-~ 3.0 - I
0 .D
.s.:: 2.5 "' u " c 2.0 ::J
0 E Q) 1 .5 ::J
2 u
1 .0
0.5 0 4 8 12 16 20 24 28
15.0
f y 0.11X + 6.17
12.0
0
u 9.0 A
TI 0 I
X I
(J) 6.0 .D Q)
" 3.0
::J
E ::J u
0.0 0 4 8 12 16 20 24 28
"-0
g GBBBB total species U1 35 ........ new arrivals Q) 6-6-6-6-6 local departures
·c::; 30 Ql 0. U1 25
0 20
Q;15 ' ' _D ' E1o ' ::J ' z '
5 ----6
0 -6--
0 4 8 12 16 20 24 28 time (weeks)
FIG. 6. Structural statistics of time-specific and cumulative food webs in the open water of an acidic pond in North Yorkshire, United Kingdom. Panels a-g are as in Fig. 1. An open, unconnected circle shows the value for each statistic after an opportunistic predator, Argyroneta aquatica (Argyronetidae: Arachnida), was removed from the week-29 web.

September 1991 TEMPORAL VARIATION IN FOOD WEBS 279
Warren 1989 acidic pond fauna
N. Yorkshire, U.K. pond marg1n 100
a 80 y = 0.21X + 20.42 .D
(f) Q)
Q) " 0 ~
::J
E ::J
Q) 60 Q_ (f)
u
I I
Q_ 40 0
1-v
~ -~ 0 u <l(
20
0 0 4 8 12 16 20 24 28
100
b y -0 16X + 74.96
Q_ 80 Q_ (f) 0 -& Q)
+-' 60 0 -6
~
I I
Q) .D
E 40 Q)
" '--Q)
+-' ::J c 20 E
::J
<l( u
0 0 4 8 12 16 20 24 28
100
c (f) 80 y -0.06 )( + 4.63 Q)
0 Q) Q_ 60 .D (f) Q)
" 0 (f) 40 ::J
0 E rn ::J u
<l( 20 I I v
0 0 --c-0 4 8 12 16 20 24 28
1.0
d y -0 003)( + 0.83
0.8 0 -r!r ~
v I
~0.6 I ll. ~
.D Q)
>-, " ~0.4 ll. ::J
E ::J
0.2 u
0 4 8 12 16 20 24 28 bme (weeks)
5.0 0
4.5 e _c
0,4.0 c ~3.5
~
-& ' .D Q)
y 0.01X + 3.96 " .~ 3.0 0
_c 2.5 0
::J
E ::J u
c 2.0 0 (j) 1.5
2 1.0
0.5 0 4 8 12 16 20 24 28
15.0 0
f 12.0
u 9.0 X
y = 0.12X+ 8.38 ~
I
~ I
.D Q)
" :; E
UJ 6.0 ::J u
3.0
0.0 0 4 8 12 16 20 24 28
40 GBBBtl total species .......,. new arrivals
(f) 35 g 6~~~~ local departures (j)
·u 3o (j) Q_ (f) 25
020
v15 D
E1o ::J z
5
0 0 4 8 12 16 20 24 28
time (weeks)
FIG. 7. Structural statistics of time-specific and cumulative food webs on the margin of an acidic pond in North Yorkshire, United Kingdom. Panels a--g are as in Fig. I.

280 KENNETH SCHOENL Y AND JOEL E. COHEN Ecological Monographs Vol. 61, No.3
TABLE 2. Frequency of observation and frequency of appearance of species in 16 food webs.
Number of Average investi- Number interval gator- of time- between Number of intervals taxon was observed
defined specific time-specific Food web taxa (S) webs webs* 2 3 4
(%of taxa) Carrion; Hueco Mts., USA 47 26 1 d 94 6 0 0 Carrion; White Sands, USA 25 39 2.0 d 88 12 0 0 Elm flux; Sheffield, United Kingdom 8 24 2 wk 38 50 0 12 Pine logs; N. Carolina, USA 112 4 1 yrt 100 0 0 0 Oak logs; N. Carolina, USA 139 4 1 yrt 99 1 0 0 Treeholes; Australia, site 1 10 4 1.7 mo 80 20 0 0 Treeholes; Australia, site 2 11 4 1.7 mo 73 27 0 0 Treeholes; Australia, site 4 10 4 1.7 mo 80 20 0 0 Treeholes; Australia, site 5 10 4 1.7 mo 100 0 0 0 Treeholes; Australia, site 10 9 4 1.7 mo 100 0 0 0 Treeholes; Australia, site 11 10 4 1.7 mo 90 10 0 0 Soybean; Illinois, USA* 15 2 9 wk Arctic tundra; USSR* 20 2 6 mo Dung; New York, USA* 46 2 4d Pond; United Kingdom, open water site 28 5 7.0 wk 86 14 0 0 Pond; United Kingdom, pond margin site 37 5 7.0 wk 62 35 3 0
* When time-specific webs were reported at fixed intervals, the average interval is reported without a decimal point. When time-specific webs were reported at irregular intervals, the average interval is reported with a decimal point.
t See Tables A4 and AS. *The number of intervals observed was calculated only for studies with four or more time-specific webs.
Cumulative vs. time-specific webs
The 16 cumulative webs had from 8 to 139 investigator-defined species (Table I). The median number of species was 17.5. The webs had from II to 262links, with a median of 43links. The number of investigatordefined species is greater than or equal to the number of lumped trophic species, and the number of links
among investigator-defined species is greater than or equal to the number of links among trophic species (Cohen et a!. 1990a).
We now compare each property in each cumulative web with the range of values of that property in timespecific versions of the same web (Table I). If the cumulative value falls outside the range from the corresponding time-specific webs, then we shall say that
TABLE 3. Comparison of cumulative and time-specific versions of the same web.
%change*
Percent- Mean Percentage Percentage age basal Prey/ chain top species intermediate species Predator length
Food web <Ofon species (%1) (%B) (P) {!.t) S X ct Carrion; Hueco Mts., USA -38 56 -67 40 44 93 Carrion; White Sands, USA -8 186 -43 25 32 59 Elm flux; Sheffield, United Kingdom -24 26 -29 -3 -1 12 Pine logs; N. Carolina, USA -6 9 -20 10 4 23 Oak logs; N. Carolina, USA 4 -10 -20 -9 2 -1 Treeholes; Australia, site 1 -66 88 -21 10 38 64 Treeholes; Australia, site 2 -71 106 -13 11 38 42 Treeholes; Australia, site 4 8 3 -9 -8 3 l4 Treeholes; Australia, site 5 -12 54 -21 0 16 55 Treeholes; Australia, site 10 14 -6 -8 -9 5 20 Treeholes; Australia, site 11 38 -14 -21 -22 0 18 Soybean; Illinois, USA 6 2 -36 -8 6 20 Arctic tundra; USSR -6 8 -6 5 3 15 Dung; New York, USA 5 0 -33 -2 3 20 Pond; United Kingdom, open water site -14 7 -33 3 19 22 Pond; United Kingdom, pond margin site -4 1 -25 -2 19 34
Median -6% 8% -21% -1% 6% 21% Range 109 200 61 62 45 94
*% change = [(cumulative value - median time-specific value)/median time-specific value] X 100. Positive numbers indicate that the cumulative value exceeded the median time-specific value.
t S = species richness, and C = connectance = the ratio of actual links to possible links in a food web.
September 1991 TEMPORAL VARIATION IN FOOD WEBS 281
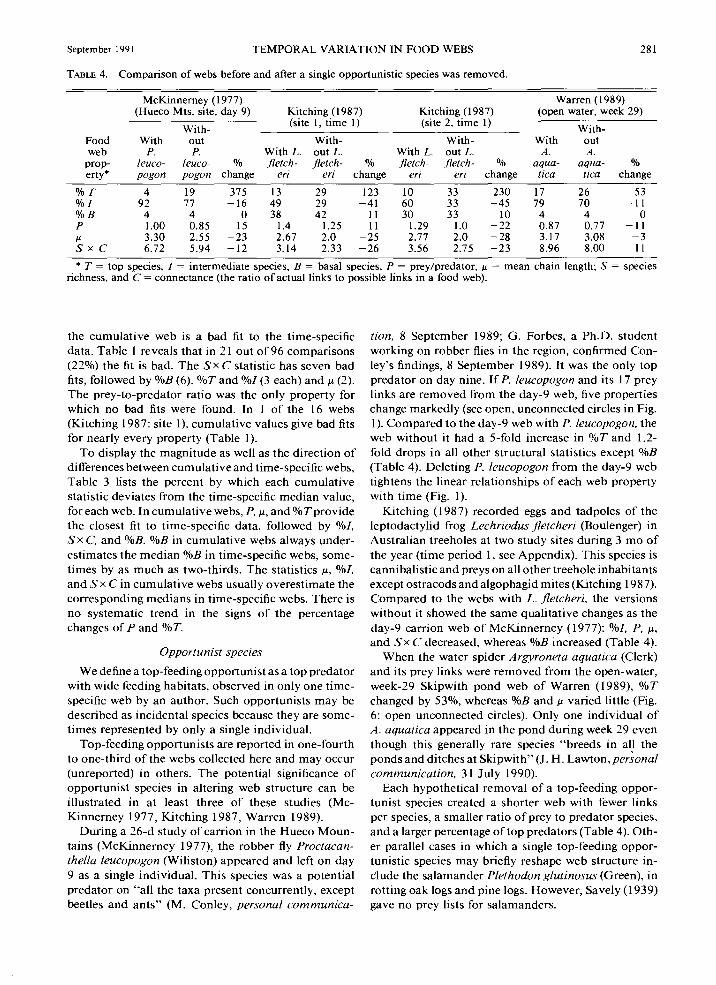
TABLE 4. Comparison of webs before and after a single opportunistic species was removed.
McKinnemey (1977) Warren (1989) (Hueco Mts. site, day 9) Kitching (1987) Kitching (1987) (open water, week 29)
With- (site 1, time I) (site 2, time I) With-
Food With out With- With- With out web P. P. With L. out L. With L. out L. A. A.
prop- leuco- leuco- % fletch- fletch- % fletch- fletch- o,.u aqua- aqua- % erty* pogon pogon change eri eri change eri eri change tic a tica change
%T 4 19 375 13 29 123 10 33 230 17 26 53 %! 92 77 -16 49 29 -41 60 33 -45 79 70 -II %B 4 4 0 38 42 11 30 33 10 4 4 0 p 1.00 0.85 -15 1.4 1.25 -II 1.29 1.0 -22 0.87 0.77 -II !J. 3.30 2.55 -23 2.67 2.0 -25 2.77 2.0 -28 3.17 3.08 -3 Sx c 6.72 5.94 -12 3.14 2.33 -26 3.56 2.75 -23 8.96 8.00 -II
* T = top species, I = intermediate species, B = basal species, P = prey/predator, !J. = mean chain length; S = species richness, and C = connectance (the ratio of actual links to possible links in a food web).
the cumulative web is a bad fit to the time-specific data. Table I reveals that in 21 out of 96 comparisons (22%) the fit is bad. The sx C statistic has seven bad fits, followed by %B (6}, %T and%/ (3 each) and !J. (2). The prey-to-predator ratio was the only property for which no bad fits were found. In I of the 16 webs (Kitching 1987: site 1), cumulative values give bad fits for nearly every property (Table 1).
To display the magnitude as well as the direction of differences between cumulative and time-specific webs, Table 3 lists the percent by which each cumulative statistic deviates from the time-specific median value, for each web. In cumulative webs, P, !J., and %Tprovide the closest fit to time-specific data, followed by %/, Sx C, and %B. %Bin cumulative webs always underestimates the median %B in time-specific webs, sometimes by as much as two-thirds. The statistics !J., %/, and Sx C in cumulative webs usually overestimate the corresponding medians in time-specific webs. There is no systematic trend in the signs of the percentage changes of P and %T.
Opportunist species
We define a top-feeding opportunist as a top predator with wide teeding habitats, observed in only one timespecific web by an author. Such opportunists may be described as incidental species because they are sometimes represented by only a single individuaL
Top-feeding opportunists are reported in one-fourth to one-third of the webs collected here and may occur (unreported) in others. The potential significance of opportunist species in altering web structure can be illustrated in at least three of these studies (McKinnerney 1977, Kitching 1987, Warren 1989).
During a 26-d study of carrion in the Hueco Mountains (McK.innerney 1977), the robber fly Proctacanthella leucopogon (Wiliston) appeared and left on day 9 as a single individuaL This species was a potential predator on "all the taxa present concurrently, except beetles and ants" (M. Conley, personal communica-
tion, 8 September 1989; G. Forbes, a Ph.D. student working on robber flies in the region, confirmed Conley's findings, 8 September 1989). It was the only top predator on day nine. If P. leucopogon and its 17 prey links are removed from the day-9 web, five properties change markedly (see open, unconnected circles in Fig. I). Compared to the day-9 web with P. leucopogon, the web without it had a 5-fold increase in %T and 1.2-fold drops in all other structural statistics except %B (Table 4). Deleting P. leucopogon from the day-9 web tightens the linear relationships of each web property with time (Fig. 1).
Kitching (1987) recorded eggs and tadpoles of the leptodactylid frog Lechriodus jletcheri (Boulenger) in Australian treeholes at two study sites during 3 mo of the year (time period I, see Appendix). This species is cannibalistic and preys on all other treehole inhabitants except ostracods and algophagid mites (Kitching 19 8 7). Compared to the webs with L. fletcheri, the versions without it showed the same qualitative changes as the day-9 carrion web of McK.innerney ( 1977): %/, P, !J.,
and Sx C decreased, whereas %B increased (Table 4). When the water spider Argyroneta aquatica (Clerk)
and its prey links were removed from the open-water, week-29 Skipwith pond web of Warren (1989), %T changed by 53%, whereas %Band J.l varied little (Fig. 6: open unconnected circles). Only one individual of A. aquatica appeared in the pond during week 29 even though this generally rare species "breeds in all the ponds and ditches at Skipwith" (J. H. Lawton, personal communication, 31 July 1990).
Each hypothetical removal of a top-feeding opportunist species created a shorter web with fewer links per species, a smaller ratio of prey to predator species, and a larger percentage of top predators (Table 4). Other parallel cases in which a single top-feeding opportunistic species may briefly reshape web structure inClude the salamander Plethodon glutinosus (Green), in rotting oak logs and pine logs. However, Savely (1939) gave no prey lists for salamanders.

282 KENNETH SCHOENL Y AND JOEL E. COHEN Ecological Monographs Vol. 61, No.3
TABLE 5. Summary food-web statistics of the Schoenly-Beaver and Briand-Cohen collections and of the cumulative and time-specific webs.
Schoenly et al. (1991) Cohen et al. ( 1990a) Cumulative webs Time-specific webs (N = 41 webs*) (N = 113 webs) (N = 16 webs) (N = 16 systems)
Medi- Medi- Medi- Medi-Food web property Range an Range an Range an Range an
% top species (% T) 8-95 39.0 6-55 23.5 9-76 33.5 21-83 33.5 % in termed. species (%I) 0-92 47.0 26-83 55.6 20-78 48.5 17-73 35.0 % basal species (% B) 2-53 16.0 4-40 18.8 2-33 9.5 3-38 13.5 Prey/predator (P) 0.05-l. 73 0.75 0.50-1.42 0.96 0.25-1.29 0.82 0.2-1.17 0.81 Mean chain length (!L) 1.0-4.28 2.0 l.0-5.92 2.63 1.65-4.81 2.39 1.25-4.03 2.0 s XC= 2LI(S- l)t 1.75-9.03 3.92 2.0-12.1 3.65 2.67-14.6 4.19 1.86-10.9 2.86
*Includes only cumulative webs; the remaining 20 of the 61 community webs in this collection are time specific. t S = species richness, C = connectance (the ratio of actual links to possible links in a food web), and L = the number of
predator-prey links in the food web.
Comparison of cumulative and time-specific food webs with prior catalogs
We now compare the 16 sets of cumulative and timespecific webs with two prior collections of community webs described by Schoenly et a!. ( 1991) and Cohen eta!. (1990a). The sets of webs in Table 5 are without overlap. The 41 cumulative community webs of the Schoenly-Beaver collection used in Table 5 do not share any webs with the 16 cumulative webs listed in Table I. Time-specific versions have been excluded from the webs of the Schoenly-Beaver collection in Table 5. There is also no overlap between the webs, all of which are community webs, of the Briand-Cohen collection and the cumulative webs in Table I. Thus there is no correlation among the Schoenly-Beaver, Briand-Cohen, and cumulative collections caused by shared webs. The Schoenly-Beaver webs are not lumped into trophic species, whereas the Briand-Cohen webs are lumped into trophic species. Like the Schoenly-Beaver webs, the cumulative and time-specific webs are unlumped.
We deal first with the cumulative webs, then with the time-specific webs. By the crude statistics used in Table 5, the cumulative webs grossly resemble the webs in both prior catalogs. (Notice that the medians of the percentages of top, intermediate, and basal species need not add to I 00.) For all six statistics a-f, the range of variation among the cumulative webs heavily overlaps the range of variation in the catalogs. For four of the six statistics the median value for the cumulative webs falls between the median value for the two catalogs. The two exceptions are the Sx C product, the median of which ( 4.19) is greater in the cumulative webs than in either prior catalog, and %B, the median of which (9.5%) is lower in the cumulative webs than in either prior catalog. Even for these two statistics, the median value for the cumulative webs falls well within the range of variation of both prior catalogs.
This gross comparison glosses over the substantial differences between the two prior catalogs and between both of them and the cumulative webs (compare the
three median values of%T and %B, for example). The differences are partly due to the presence or absence of lumping, the inclusion (Cohen et a!. 1990a) or exclusion (Schoenly et al. I 991) of vertebrate top predators, the inclusion of one source web here (Robinson 1953), and other methodological differences among the original observers and between cataloguers. The differences may also be partly due to intrinsic variation among webs. Given the methodological differences, a more refined comparison seems premature now.
We now consider the time-specific webs. In Table 5, the variation in %T among the time-specific webs is summarized by the range and median, over the 16 systems, of the median of% T for each system shown in Table I. Thus, among the 16 systems the smallest median % T shown in Table I is 21% and the largest median %Tis 83%; these values are shown as the range of% Tin Table 5 for the time-specific webs, even though individual time-specific webs may have had lower or higher values of%T. Similarly, the median %T shown in Table 5 is actually the median of the 16 medians shown in Table I. The variation of the other statistics of time-specific webs in Table 5 are computed similarly.
For all six statistics a-f, the median of the medians for the time-specific webs falls well within the range of variation of both prior catalogs, and the range of variation among the time-specific webs heavily overlaps the range of variation in the catalogs. Nevertheless, even by these gross measures, the time-specific webs differ from those of the two prior catalogs somewhat more than do the cumulative webs. The median of the medians for the time-specific webs does not fall between the medians of the Schoenly-Beaver and BriandCohen collections for%/, %B, or Sx C. That the timespecific webs are not very different from the cumulative webs by the measures shown in Table 5 reflects the limited sensitivity of those measures. Comparisons between time-specific and cumulative versions of a web, one system at a time, as in Table 3, are more appro-

September 1991 TEMPORAL VARIATION IN FOOD WEBS 283
priate and more sensitive because the methods used to define species and links are (usually) consistent within a study.
DISCUSSION
Whenever food webs are studied over different temporal and spatial scales, previously concealed variation emerges. Kitching (1987) and Warren (1989) superimposed time- and site-specific data over a single cumulative or "regional" web. Like Kitching and Beaver ( 1990), we examined temporal variation in web structure, one property at a time. In the future, the combination of temporal and spatial variation should be examined more closely, along with information on the relative abundances or biomasses of species such as was reported by Kitching (1987), Warren (1989), and Winemiller (1990).
Properties of cumulative vs. time-specific webs
A time-specific food web represents a subset of the predator-prey interactions recorded during an observation period. Comparison of time-specific webs with cumulative webs from the same habitat reveals that some properties depend on the temporal scale at which observations are made. In three cases here, cumulative and time-specific webs taken from the same environment differed dramatically. Some properties of timespecific webs, such as P, %1, and !J., could be more accurately estimated from cumulative data than other properties, such as S x C and %B. In nearly every one of the 16 webs studied here, S x C, which is roughly twice the ratio of links to species, was consistently larger and %B was consistently smaller in cumulative webs than in time-specific versions. These findings strongly suggest that cumulative webs, which routinely appear in general ecology textbooks, overestimate S x C and underestimate %B relative to time-specific versions.
We offer the following tentative explanation of why %B is smaller in cumulative webs than in time-specific versions. In most webs, the same organisms are basal species in most time-specific versions. While there is typically little turnover among the basal species, there is typically much more turnover among the intermediate and top species. Consequently, when all the timespecific webs are cumulated, the number of basal species increases little compared to the number in any time-specific web, while the number of top and intermediate species may increase substantially compared to the number in any time-specific web. Thus the fraction of basal species is smaller in cumulative webs.
The low turnover of basal species in the detritusbased webs is a consequence of counting the detritus, which is always present, as one or more species. In other webs, the low turnover of basal species is due to the continuous presence of plants.
In addition to varying in time and in space, reported webs vary conspicuously in the taxonomic and trophic
resolution oftheir trophic groups. Sugihara et al. ( 1989) found that eight commonly reported properties (including five studied here) were generally robust to trophic lumping when 61 webs from the Schoenly-Beaver collection were progressively reduced to one-half their original, unaggregated number of species or to ten species, whichever was larger. However, as webs were lumped trophically, Sx C and %B changed systematically more than the other statistics: Sx C tended to decrease and %B tended to rise. Equivalently, with more refined (and therefore larger numbers of) species, Sx Cincreased and %Bdecreased. This pattern of variation parallels that in our investigation of temporal variation, and may have the same explanation.
Another parallel finding is that, in both studies, the fraction of intermediate species %/ is more variable than either %B or %T (Table I and Table 3). Thus some properties fluctuate similarly as the number of trophic species is reduced either by trophic lumping or by time-specific observation. The class of web properties for which this is generally so, and a general explanation, remain to be determined.
Opportunist species
The concept of"tourist" species, introduced by Moran and Southwood ( 1982: 292), differs from the concept of "opportunist" species defined here. According to Moran and Southwood, "tourists" are "non-predatory [our italics] species which have no intimate or lasting association with the plant but which may be attracted to trees for shelter and sustenance (honeydew and other substances), or as a site for sun-basking and sexual display. Since they fall victim to local predators, tourists may become part of the trophic web of the arboreal community." By contrast, we define an opportunist as a predator with wide feeding habitats, observed in only one time-specific web by an author, which upon appearing becomes a top predator. By definition, the primary trophic role of a tourist species, if it has any at all in the community under observation, is as a prey species, while the necessary trophic role of an opportunist species is as a predator.
Our analysis of opportunist species helps answer a question raised by Roughgarden et al. (1989: 6): "How are ecosystem structure and function influenced by the rare but important events that may occur every century or so?'' We showed that the hypothetical removal of a single top-feeding opportunist species in four· webs caused a dramatic rise in %T, small reductions in %/, S x C. !J., and P, and a negligible rise in %B. In each case we assumed that none of the other species altered its diet qualitatively after the opportunist was removed. This assumption may not be realistic. Nevertheless, these naive calculations show that a single opportunistic species, even if it makes only rare and brief appearances in a habitat, can dramatically reshape web structure.
Roughgarden et a!. (1989: 6) also asked: "What is

284 KENNETH SCHOENL Y AND JOEL E. COHEN Ecological Monographs Vol. 61, No.3
the role of 'tourist' species (in Southwood's phrase), which occasionally wander into a food web but are not a permanent part of it?'' While our results do not pertain to tourist species, as defined by Southwood, we have shown that a transient opportunist species can be important to community structure. It remains to be shown what effects a transient top-feeding opportunist has on population dynamics and other ecological processes. The recognition that transient top-feeding opportunists exist and are trophically linked to many other species is an early step toward measuring any such effects.
Our results pertain to only top-feeding opportunist species. It would be highly informative to repeat these hypothetical removals on different species of top-feeding opportunists and on different types of opportunist species (e.g., intermediate-feeding opportunists vs. topfeeding opportunists) in the same web to see if our results hold for opportunist species feeding at similar as well as at different trophic positions.
Questions for future work
Many open questions remain to be resolved by future empirical work. Before posing specific questions, let us describe some improvements we would like to see in future reports of the temporal dynamics of a web. The spatial boundaries of the study site would be completely specified in physical terms and would not be changed by the observer during the study. A systematic plan of time-specific sampling effort would be chosen in advance (perhaps following a pilot study), and would be reported in detail, along with a yield-effort curve (Cohen 1978: 120-121) for species and for links. Organisms would be identified to species; further, lifecycle stages of a single species with different diets or different predators would be treated as separate trophic species. All transient organisms observed within the boundaries of the study site would be reported. The presence or absence of a trophic link between any two species would be determined afresh for each time-specific web; it would not be assumed that species A always (or alternatively never) eats species B when they occur together on the basis of observations made at one time. Both abundance and body size would be reported for each species; this would allow wide use of sensitive descriptors, such as prey-predator density ratios (Lockwood et al. 1990). Laboratory feeding trials and stomach content analyses would supplement observational records on predator and prey behavior. Accompanying each time-specific web would be detailed data on physical and chemical factors in the environment that might affect web structure and population dynamics, such as temperature, salinity, wave action or turbulence, and light availability in aquatic habitats, or temperature, moisture, and nutrient availability in terrestrial habitats.
desiderata would make it possible to answer the following specific questions.
First, if A eats B at time t 1, under what conditions is it true that A eats B at all t 2 =F t 1? Equivalently, how generally valid is the assumption we used to construct time-specific webs from time-specific species lists and a cumulative web? Warren (1989) showed that not all life-history stages of a given predator feed on all stages or abundance levels of its established prey. How do the levels of abundance and the life-cycle development of predators and prey affect web structure in most communities?
Second, in food webs, are spatial and temporal variation interchangeable? In certain physical systems the observation of a single system over a long time period reveals variation that is identical to that found by observing many systems of the same kind at different places at the same time. This interchangeability of temporal and spatial variability is called ergodicity (not to be confused with the usual demographic use of the term). In this sense of the word "ergodic" are webs ergodic?
Third, how long does a community need to be observed before its cumulative web is (nearly) complete? Are there community characteristics that can be measured in advance that will aid in predicting the necessary duration of observation? In a large web of Little Rock Lake, carefully constructed from the reports of at least seven specialists, Martinez ( 1991) identified 182 taxa by using all the information available up to 1985. A year later, after a specialist in macrophytes had joined the study at Little Rock Lake, the number of macrophytic taxa jumped from zero to I 7 and the total number of taxa jumped from 182 to 260; there were substantial increases in every major category of taxon except the microbiological catch-all called "Fine Organic Matter." There is every reason to believe that additional specialists might further increase the number of reported taxa. This example shows that even under very favorable conditions of prolonged collaborative research, it may be difficult to specify a web completely. But it may not take forever to describe a web with, say, 9 5% completeness. The question is: how long, and how can we know how long?
Fourth, if a web contains data on the strengths of the interactions between species and an approximate version of the web is assembled by ignoring any interaction whose strength falls below a certain arbitrarily chosen threshold level (called the 'link threshold'), how does the structure of the approximate version depend on the link threshold? To answer this question, Winemiller (1990) analyzed the stomach contents of neotropical fishes in Venezuela and Costa Rica and used a manual on North American freshwater invertebrates (Pennak 1978) to determine the prey of invertebrate predators. He constructed sink webs for 13 sites and evaluated the effects of the link threshold on several
A sufficiently large number of webs satisfying these web properties. He found that the approximate webs
September l 991 TEMPORAL VARIATION IN FOOD WEBS 285
obtained by using different link thresholds at a given site varied extensively in the numbers of links, connectance, compartmentation (Pimm and Lawton 1980), and mean numbers of links per species. Because Winemiller ( 1990) did not directly investigate the food habits of the invertebrate predators in this study, it is possible that many trophic links at lower trophic levels went unreported. The question Winemiller studied deserves further investigation.
Fifth, how are population dynamics, energy and material flows, and other ecological processes affected by the rare appearance of top-feeding and other types of opportunist species?
Sixth, how do exogenous physical and chemical factors affect web structure and dynamics? For example, what are the web effects of major physical perturbations, such as El Niiio in marine and freshwater habitats or fire in terrestrial habitats? In short, how are webs coupled to the abiotic environment?
In addition to empirical questions, theoretical questions abound. We mention only two. First, how can a simple model be constructed that provides a unified, quantitatively accurate account of the temporal trends observed here? It would be nice if the model were not totally ad hoc but were related to at least one of the models previously proposed for web statics (e.g., Cohen and Newman 1985, Cohen et a!. 1990a) or dynamics (e.g., Pimm 1982, Post and Pimm 1983, Carpenter 1988, Cohen et a!. 1990b).
Second, what explains the difference between the apparently low turnover rates ofbasal species, the higher turnover rates of top species, and the still higher turnover rates of intermediate species? Are these turnover rates related to body size or other life-history characteristics of species? These turnover rates seem to be the key to explaining the differences between time-specific and cumulative webs, and may contribute to explaining the temporal patterns in the fractions of top, intermediate, and basal species.
AcKNOWLEDGMENTs
This work was supported in part by United States National Science Foundation grant BSR 87-05047 and by the hospitality (to J. E. Cohen) of the Institute for Advanced Study, Princeton, New Jersey, and Mr. and Mrs. William T. Golden. We thank G. Forbes, R. L. Kitching, J. H. Lawton, M. Mayse, P. W. Price, P. H. Warren, and especially M. R. Conley for clarifying food web data. We thank a helpful referee, R. A. Beaver, M. R. Conley, P. W. Price, J. H. Brown, R. L. Kitching, and J. H. Lawton for useful comments on an earlier draft.
LITERATURE CITED
Beaver, R. A. 1985. Geographical variation in food web structure in Nepenthes pitcher plants. Ecological Entomology 10:241-248.
Begon, M., J. L. Harper, and C. R. Townsend. 1986. Ecology: individuals, populations, and communities. Sinauer, Sunderland, Massachusetts, USA.
Briand, F. 1983. Environmental control of food web structure. Ecology 64:253-263.
Briand, F., and J. E. Cohen. 1984. Community food webs
have scale-invariant structure. Nature (London) 307:264-267.
Brooks, J. L., and S. I. Dodson. 1965. Predation, body size, and composition of plankton. Science 150:28-35.
Carpenter, S. R. 1988. Transmission of variance through lake food webs. Pages 119-135 inS. R. Carpenter, editor. Complex interactions in lake communities. Springer-Verlag, New York, New York, USA.
Cohen, J. E. 1977. Ratio of prey to predators in community food webs. Nature (London) 270:165-167.
---. 1978. Food webs and niche space. Monographs in Population Biology II. Princeton University Press, Princeton, New Jersey, USA.
---. (compiler). 1989. Ecologists' Co-Operative Web Bank [ECOWeB]. Version 1.0. Machine-readable data base of food webs. Rockefeller University, New York, New York, USA.
Cohen, J. E., F. Briand, and C. M. Newman. i990a. Community food webs: data and theory. Springer-Verlag, New York, New York, USA.
Cohen, J. E., T. Luczak, C. M. Newman, and Z. Zhou. I990b. Stochastic structure and nonlinear dynamics of food webs: qualitative stability in a Lotka-Volterra cascade model. Proceedings ofthe Royal Society (London) B 240:607-627.
Cohen, J. E., and C. M. Newman. 1985. A stochastic theory of community food webs. I. Models and aggregated data. Proceedings of the Royal Society (London) B 224:449-461.
Cohen, J. E., and C. M. Newman. 1988. Dynamic basis of food web organization. Ecology 69:1655-1664.
Crowder, L. B., R. W. Drenner, W. C. Kerfoot, D. J. McQueen, E. L. Mills, U. Sommer, C. N. Spencer, and M. J. Vanni. 1988. Food web interactions in lakes. Pages 141-160 in S. R. Carpenter, editor. Complex interactions in lake communities. Springer-Verlag, New York, New York, USA.
Drake, J. A. 1985. Some theoretical and empirical explorations of structure in food webs. Dissertation, Purdue University, West Lafayette, Indiana, USA.
Frost, T. M., D. L. DeAngelis, S.M. Bartell, D. J. Hall, and S. H. Hurlbert. 1988. Scale in the design and interpretation of aquatic community research. Pages 229-258 inS. R. Carpenter, editor. Complex interactions in lake communities. Springer-Verlag, New York, New York, USA.
Jenkins, B., and R. L. Kitching. 1990. The ecology of waterfilled treeholes in Australian rainforests: food web reassembly as a measure of community recovery after disturbance. Australian Journal of Ecology 15:199-205.
Kitching, R. L. 1983. Community structure in water-filled treeholes in Europe and Australia-comparisons and speculations. Pages 205-222 in J. H. Frank and L. P. Lounibos, editors. Phytotelmata: terrestrial plants as hosts for aquatic insect communities. Plexus, Medford, New Jersey, USA.
---. 1987. Spatial and temporal variation in food webs in water-filled treeholes. Oikos 48:280-288.
Kitching, R. L., and R. A. Beaver. 1990. Patchiness and community structure. Pages 147-175 in B. Shorrocks and I. R. Swingland, editors. Living in a patchy environment. Oxford University Press, Oxford, England.
Kitching, R. L., and S. L. Pimm. 1985. The length of food chains: phytotelmata in Australia and elsewhere. Proceedings of the Ecological Society of Australia 14:123-140.
Krebs, C. J. 1985. Ecology: the experimental analysis of distribution and abundance, third edition. Harper & Row, New York, New York, USA.
Lawton, J. H. 1989. Food webs. Pages 43-78 in J. M. Cherrett, editor. Ecological concepts. Blackwell Scientific, Oxford, England.
·Lockwood, J. A., T. A. Christiansen, and D. E. Legg. 1990. Arthropod prey-predator ratios in a sagebrush habitat: methodological and ecological implications. Ecology 71: 996-1005.

286 KENNETH SCHOENL Y AND JOEL E. COHEN Ecological Monographs
Lodge, D. M., J. W. Barko, D. Strayer, J. M. Melack, G. G. Mittelbach, R. W. Howarth, B. Menge, and J. E. Titus. 1988. Spatial heterogeneity and habitat interactions in lake communities. Pages 181-208 in S. R. Carpenter, editor. Complex interactions in lake communities. Springer-Verlag, New York, New York, USA.
Martinez, N. I 991. Artifacts or attributes? Effects of resolution on the Little Rock Lake food web. Ecological Monographs 61, in press.
Mayse, M.A., and P. W. Price. 1978. Seasonal development of soybean arthropod communities in East Central Illinois. Agro-Ecosystems 4:387-405.
McK.innemey, M. 1977. Carrion communities in the Northem Chihuahuan Desert. Thesis. University ofTexas-El Paso, El Paso, Texas, USA.
---. 1978. Carrion communities in the Northern Chihuahuan Desert. Southwestern Naturalist 23:563-576.
Moran, V. C., and T. R. E. Southwood. 1982. The guild composition of arthropod communities in trees. Journal of Animal Ecology 51:289-306.
Naumov, N. P. 1972. The ecology of animals. Norman D. Levine, editor; Frederick K. Pious, Jr., translator. University of Illinois Press, Urbana, Illinois, USA.
Odum, E. P. 1983. Basic ecology. Saunders, Philadelphia, Pennsylvania, USA.
Paine, R. T. 1988. Food webs: road maps of interactions or grist for theoretical development? Ecology 69: 1648-1654.
Pennak, R. W. 1978. Freshwater invertebrates of the United States. John Wiley & Sons, New York, New York, USA.
Pimm, S. L. 1982. Food webs. Chapman and Hall, New York, New York, USA.
Pimm, S. L., and R. L. Kitching. 1987. The determinants of food chain lengths. Oikos 50:302-307.
Pimm, S. L., and J. H. Lawton. 1977. Number of trophic levels in ecological communities. Nature (London) 268: 329-331.
Pimm, S. L., and J. H. Lawton. 1980. Are food webs divided into compartments? Journal of Animal Ecology 49:879-898.
Porter, K. G., H. Paerl, R. Hodson, M. Pace, J. Priscu, B. Riemann, D. Scavia, and J. Stockner. 1988. Microbial interactions in lake food webs. Pages 209-227 in S. R. Carpenter, editor. Complex interactions in lake communities. Springer-Verlag, New York, New York, USA.
Post, W. M., and S. L. Pimm. 1983. Community assembly and food web stability. Mathematical Biosciences 64:169-192.
Ricklefs, R. E. 1990. Ecology. Third edition. W. H. Freeman, New York, New York, USA.
Ridgway, R. L., and S. L. Jones. 1968. Plant feeding by
Vol. 61, No.3
Geocoris pal!ens and Nabis americoferus. Annals of the Entomological Society of America 61:232-233 (cited by Mayse and Price 1978).
Robinson, I. 1953. On the fauna of a brown flux of an elm tree, Ulmus procera Salisb. Journal of Animal Ecology 22: 149-153.
Roughgarden, J., R. M. May, and S. A. Levin, editors. 1989. Perspectives in ecological theory. Princeton University Press, Princeton, New Jersey, USA.
Salas-Aguilav, J., and L. E. Ehler. 1977. Feeding habits of Orius tristico!or. Annals of the Entomological Society of America 70:60-62 (cited by Mayse and Price 1978).
Savely, H. E. 1939. Ecological relations of certain animals in dead pine and oak logs. Ecological Monographs 9:321-385.
Schoener, T. W. 1989. Food webs from the small to the large. Ecology 70:1559-1589.
Schoenly, K. 1990. The predators of insects. Ecological Entomology 15:333-345.
---. 1991. Food web structure in dung and carrion arthropod assemblages, null models and Monte Carlo simulation: applications to medical/veterinary entomology. Journal of Agricultural Entomology, in press.
Schoenly, K., R. A. Beaver, and T. A. Heumier. 1991. On the trophic relations of insects: a food web approach. American Naturalist, in press.
Schoenly, K., and W. Reid. 1983. Community structure of carrion arthropods in the Chihuahuan Desert. Journal of Arid Environments 6:253-263.
Schoenly, K., and W. Reid. 1987. Dynamics of heterotrophic succession in carrion arthropod assemblages: discrete seres or a continuum of change? Oecologia (Berlin) 73:192-202.
Sdobnikov, V. M. !958. Comparative ecological analysis of the fauna of the tundra and the taiga. Zoologicheskii Zhumal 37(4). As cited in Naumov ( 1972: 549).
Sugihara, G., K. Schoenly, and A. Trombla. 1989. Scaleinvariance in food web properties. Science 245:48-52.
Valiela, I. 1974. Composition, food webs, and population limitation in dung arthropod communities during invasion and succession. American Midland Naturalist 92:370-385.
Warren, P. H. 1989. Spatial and temporal variation in the structure of a freshwater food web. Oikos 55:299-311.
Winemiller, K. 0. I 990. Spatial and temporal variation in tropical fish trophic networks. Ecological Monographs 60: 331-367.
Yodzis, P. 1981. The structure of assembled communities. Journal of Theoretical Biology 92: I 03-117.
---. 1984. The structure of assembled communities II. Journal ofTheoretical Biology 107:115-126.
APPENDIX
Reconstructions of prey records, time data, and species lists for 16 food webs that appear in eight published studies (see Table I). For some details of our reconstruction methods, see Data sources, methods, and food web statistics.

September 1991 TEMPORAL VARIATION IN FOOD WEBS 287
TABLE A I. Cumulative food web of the rabbit necrovore-predator community reported by McKinnemey (1977, 197 8) for the Hueco Mountains, Texas, for days 1-26 following carcass placement on day 1.* Numbers in the column "Time in web" refer to the day(s) each species was found. Species considered incidental by McKinnemey are not included. McKinnemey did not study carrion-feeding vertebrates at this site.
Species
I. Bootettix argentatus Bruner 2. Taeniopoda eques (Burmeister) 3. Sinea complexa Caudell 4. Saprinus discoida/is LeConte 5. S. pennsylvanicus Paykul 6. Nicrophorus marginatus Fab. 7. N. caroli nus L. 8. Si/pha truncata Say 9. S. truncata larvae
I 0. staphylinid (Aleocharinae) II. Dermestes vulpinus Fab. 12. Necrobia rufipes (DeGeer)* 13. Nitidula ziczac Say 14. Eleodes entricatus Hald. 15. Trox punctatus Aermar 16. Proctacanthe//a leucopogon (Wiliston)* 17. Promachus giganteus Hine* 18. Euxesta sp. 19. Piophi/a sp. 20. Trupanea actinobolo (Loew) 21. Musca domestica L. 22. M. domestica larvae 23. Cochliomyia mace//aria (Fab.) 24. C. mace//aria larvae 25. Phaenicia sericata (Mg.) 26. P. sericata larvae 27. Oxysarcodexia ochripyga (Wulp) 28. 0. ochripyga larvae 29. Goniochaeta plagiodes Tns. * 30. ldiasta sp. 31. Pogonomyrmex desertorum Wheeler 32. P. rugosus Emery 33. Conomyrma insana (Buckley) 34. Pheidole sp. 35. Solenopsis xyloni McCook 36. lridomyrmex pruinosum (Roger) 37. Myrmecocystus mimicus Wheeler 38. Rygchium annulatum (Say) 39. Ca//iopsis hirsutifrons Cockerell 40. Nomia tetrazonata Cockerell 41. Lasioglossum mori//i (Cockerell) 42. Dialictus microlepiodes (Ellis) 43. Dialictus sp. 44. Apis me//ifera L. 45. Trachrhinus sp. 46. Misumena sp. 47. Carcass
Time in web (days 1-26)
20 25
9 4-24
9 4-8 4-8 3-22 8-11
11-23 4-24 6-23 14
8-14 4-24
9 12
3-19 6-16
15-24 1-24 l-I4t 1-24 l-I4t 4-9 4-I4t 1-23 l-I4t 9-17 5-7 4-25
2 2-4
2 1-25 2-4
2 12, 13 12, 15 9, 12 9-26 9-26 9-26 II 4
10, 14, 15 1-26
47 47
Prey species
4, 5, 8-12, 14, 15, 18, 19,21-29,31,35 9, 22,24,26,28 9,22,24,26,28
47 47 22,24,26,28,47 47 18-21,23,27,29 47 19 47 47 47
3,18-29,40-43 18, 19,21-24,26-29, 38-43 47 47 47 47 47 47 47 47 47 47 47
9 22,24,26,28 19,21-28,47 21-28,47 21-28,47 21-28,47 19,21-28,47 21-28,47 21-28,47 47 47 47 47 47 47 47 22,24,26,28,47 18-24,26-29,39,41-43
* M. Conley (formerly M. McKinnemey) corrected two errors in her published data (personal communication, 5 September 1989). In her Fig. 4 (1978), tachinids (species 29 above) eat prey 9 (not prey 22, 24, 26, 28) and consumer 12 eats prey 19 (not dermestid larvae). Also, in the day-9 and day-12 webs, asilid flies (spp. 16 and 17, respectively) are potential predators on "all the taxa present concurrently, except beetles and ants" (confirmed by G. Forbes, personal communication). Another predator of the day-9 web, Sinea complexa (Reduviidae: Hemiptera), reportedly ate flies, beetles, and ants (McKinnerney 1977). However, the likelihood that this species ate the highly mobile asilid fly Proctacanthe//a leucopogon was small (M. Conley, personal communication, 24 May 1990); therefore, both the day-9 and cumulative webs are acyclic (no cannibalistic or mutual predation links were found).
t For these larvae, information on total residence time in the web was not available in McKinnemey (1977, 1978). M. Conley (personal communication, 5 September 1989) reported that her data "were very inadequate on larvae; field ID [identification] is virtually impossible for most of them .... " Instead, total residence times on dipteran larvae were taken from rabbit necrovore data collected by Schoenly and Reid (1983) from a desert-scrub habitat in the Northern Chihuahuan Desert near the study sites of McKinnemey (1978). M. Conley (personal communication, 16 July 1990) found no mention in her 197 6 field notebooks of dipteran larvae occurring on rabbit carcasses beyond day 14, thereby confirming Schoenly and Reid's endpoint estimates of dipteran larva residence times in these carcasses; however, she reports that " ... there might be maggots in the rabbit carcasses at the later stages during earlier summer or later fall, when temperatures are lower and desiccation is not as complete in the early period."

288 KENNETH SCHOENLY AND JOEL E. COHEN Ecological Monographs Vol. 61, No.3
TABLE A2. Cumulative food web of the rabbit necrovore-predator community reported by McK.innemey (1977, 1978) for White Sands National Monument. New Mexico. fordavs 1-31,37,40. 43, 47, 50, 54. 66, and 79 following carcass placement on day I. Numbers in the column "Time in web" refer to the day(s) each species was found.*
Species
I. Saprinus discoida!is LeConte 2. S. pennsy!vanicus Paykul* 3. Nicrophorus marginatus Fab. 4. Dermestes vu!pinus Fab. 5. Embaphion contusum Lee. 6. Eleodes hispilabris Blais 7. Trox scutellaris Say 8. T. nodosus Robinson 9. T. suberosus Fab.
10. Euxesta sp. II. Diacrita plana Steyskal 12. Coenosia sp. 13. Cochliomyia macel!aria (Fab.) 14. Sarcophaga uti/is Aldrich 15. Oxysarcodexia ochripyga (Wulp) 16. Isoptera (unspecified) I 7. C. mace!! aria larvae 18. S. uti/is larvae 19. 0. ochripyga larvae 20. Idiasta sp. 21. Pogonomyrmex apache Wheeler 22. Myrmecocystus mimicus Wheeler 23. So!enopsis xyloni McCook 24. lridomyrmex pruinosum (Roger) 25. Carcass
Time in web (days 1-31,37,40, 43, 47, 50, 54, 66, 79)
2-26 19,21 4 3-23
18, 19 1-31,37,40,43,47, 50,54,66 1-30 1-30 1-30 1-31,37,40,43,47, 50,54,66
12,20 3-9 3-21 1-31,37 1-31, 37
17-19 3-14t l-14t l-14t 8. 10 1-31, 37,40,43,47, 50, 54,66, 79 1-31, 37,40,43,47, 50,54,66, 79 5-31, 37,40,43,47, 50,54 1-31, 37,40,43,47, 50 1-31, 37,40,43,47, 50,54,66, 79
Prey species
17-19 17-19
25 25 25 25 25 25 25 25 25 25 25 25 25 25 25 25 25
17-19 13, 16-19,25 13, 16-19,25 13, 16-19,25 13, 16-19,25
*Species considered incidental by McK.innemey are not included. Species 2 and its reported prey (species 17-19) do not occur jointly on any day. We included these species and their trophic links in our cumulative web to preserve the author's original species list and web data. McK.innemey reported several vertebrate species as probable carrion feeders at various times in the succession but did not specify the carrion insects they may have also consumed: Ho!brookia maculata Girard, Sce!oporus undu!atus (Bose), Uta stansburiana Baird and Girard, Cnemidophorus inornatus Baird, Cathartes aura (Linneaus), Bubo virginianus (Gmelin), Canis !atrans Say, Mephitis mephitis (Schreber), and Conepatus mesoleucus (Lichtenstein). These vertebrates are not included in this web.
t For these larvae, information on total residence time in the web was not available in McK.innemey ( 1977, 1978). Instead, total residence times on dipteran larvae were estimated from rabbit necrovore data collected by Schoenly and Reid (1983) from a desert-scrub habitat in the Northern Chihuahuan Desert near the study sites of McK.innemey ( 1978). M. Conley (personal communication, 16 July 1990) found no mention in her 1976 field notebooks of dipteran larvae occurring on rabbit carcasses beyond day 14, thereby confirming Schoenly and Reid's endpoint estimate of dipteran larvae residence times in these carcasses; however, she reports that " ... there might be maggots in the rabbit carcasses at the later stages during earlier summer or later fall, when temperatures are lower and desiccation is not as complete in the early period."
TABLE A3. Cumulative food web of the brown elm flux community in Sheffield, United Kingdom, as reported by Robinson (1953) for the months January through December. Numbers in the column "Time in web" refer to the week(s) each species was found during the year, starting with January; for example, week 10 refers to the second week in March.
Species
I. Phaomia sp. larvae 2. Thamiarea hospita Maerk larvae, adults 3. Systenus sp. larvae* 4. Brachyopa insensilis Collin larvae 5. Dasyhe!ea obscura Winnertz larvae 6. Au!acigaster !eucopeza (Meigen) larvae 7. Hericia hericia Kramer (all stages) 8. Tree flux
* Cannibalistic species.
Time in web (weeks 2-48)
4-20, 30-46 2-48 2-18, 30-46 4-16, 20-48 2-16, 34-48
20-30 4-10,16-24,30-38,42-48 2-48
Prey species
3-5 5-7
5 8 8 8 8

September 1991 TEMPORAL VARIATION IN FOOD WEBS 289
TABLE A4. Cumulative food web of the felled pine log community reported by Savely ( 1939) from a North Carolina woodland. Numbers in the column "Time in web" refer to the year(s) each species was found in pine logs of different ages (years 1-4); fourth-year logs refer to all logs aged over 3 yr (Savely 1939). We omitted questionable links. Savely (1939) observed salamanders, Plethodon glutinosus (Green), in pine logs > 3 yr old, but reported no specific prey that they eat.
Species
I. Entornobrya sp. 2. E. ligata Nic. 3. E. corticola Nic. 4. Pseudachorutes sp. 5. Isotorna sensibilis Tlb. 6. Tornocerajlavescens Tlb. 7. Reticuliterrnes jlavipes Ko!L 8. Parcoblatta sp. 9. heteropteran (undet.)
I 0. Epiptera sp. II. Tachyrnenis flavicauda (Say) 12. Saprinus sp. 13. Plegaderus sp. 14. Cylistix cylindrica (Payk.) 15. Platysorna lecontei Mars. 16. Platysorna parallelurn Say I 7. Thanasirnus dub ius Fa b. 18. Copidita thoracica Fab. 19. Boros unicoi or Say 20. Dendroides bicolor Newn. 21. Alaus rnyops Fab. 22. Ischiodontus sp. 23. Orthostethus infuscatus Germ. 24. Melanotus sp. 25. Elater verticinus Beauv. 26. Megapenthes lirnbalis (Hbst.) 27. Buprestis linea/a Fab. 28. Buprestis sp. 29. Chalcophora sp. 30. Chrysobothris sp. 31. Ternnochila virescens (Fab.) 32. Rhizophagus cylindricus (Lee.) 33. Brontes dubius Fab. 34. Mycetophagus pini Zieg. 35. Colopterus sernitectus Say 36. Synchita sp. 3 7. Ulorna punctulata Lee. 38. Xylopinus rufipes (Say) 39. Scotobates calcaratus (Fab.) 40. Bolitotherus cornu/us (Panz.) 41. Platyderna jlavipes Fa b. 42. Hypulus concolor (Lee.) 43. Stephanopachys rugosus Oliv. 44. Stelidota gerninata Say 45. Passalus cornu/us Fab. 46. Pseudolucanus capreolus (L) 47. Derobrachus brunneus (Forst.) 48. Asernurn rnoesturn Hald. 49. Rhagiurn linea/urn Oliv. 50. Xylotrechus sagitta/us (Germ.) 51. Callidiurn antenna/urn Newm. 52. Acanthocinus obsoletus (Oliv.) 53. A. nodosus (Fab.) 54. Eupogonius tornentosus Hald. 55. Monocharnrnus titillator (Fab.) 56. Leptura sp. 57. Rhyncolus sp. 58. Cossonus corticola Say 59. Pissodes rnernorensis Germ. 60. Pachylobins picivorus Germ. 61. Hylobius pales Hbst. 62. Platypus flavicornis Fa b. 63. Ips grandicollis Eichh. 64. I. calligraphus Germ. 65. Xyleborusfitchi Hopk. 66. Orthotornicus coelatus (Eichh.)
Time in web (years 1-4)
1-4 1-4 1-4 1-2 1-4 1-2 2-3 1-4
I I
1-4 1-2 1-3 1-2 1-4 1-2 I 3
1-2 1-2 1-4 1-2 3-4 1-4 1-4 2-3 1-2 1-3 I I I I
1-3 1-2
I 2-3 3-4 2-4 3-4
I 1-3 2
1-2 I
3-4 3-4
4 I I I I I I I I
2-4 1-3 1-3
I I I I I I I I
Prey species
109, 110 109, 110 109, 110 109, 110 109, 110 109, 110 Ill 110 55,63,64,66-70
110 1-6, 101-106
73-78 110 75 71-78 63-70 63-70
109 109 109 20,46,47,49, 52,55
109 109 109 109 109 Ill Ill 112 112 30, 51,55,63-69 51,62-70
110 110 110 109 109 109 109 110 110 109 Ill 110 109 109 109 Ill, 112 112 112 112 112 112 112 112 109 110 110 112 112 112 110 112 112 110 112

290 KENNETH SCHOENL Y AND JOEL E. COHEN
TABLE A4. Continued.
Time in web Species (years 1-4)
67. Pithyophthorus annectens Lee. I 68. P. pu//us Simm. I 69. Dendroctonus va/ens Lee. I 70. D. tenebrans (Oiiv.) I 71. Chironomid larvae (unsp.) 3-4 72. Cecidomyiid larvae (unsp.) 3-4 73. Xy/ophagus fascial us Walker I 74. Dolicopodid larvae (unsp.) 2-4 75. Lonchaea sp. 1-2 76. Theresia monohammi (Ins.) I 77. Sciara coprophi/a Lint. 1-2 78. Sarcophaga repax Walker I 79. Sirex nigricornia Fab. I 80. Oryssus sp. I 81. Coeloides pissodis Ashm. I 82. Camponotus herculeanus DeG. 1-3 83. Leptinothorax curvispinosus Mayr 1-4 84. Ponera coarctata Emery 1-4 85. Lasius umbra/us Nyl 1-2 86. Lumbricid (unsp.) 3-4 87. Po/ygyra thyriodus Say 4 88. Euconu/us chersinus Say 2-3 89. Zonitoides arboreus Say 2-4 90. Phi/omycus caro/inensis (Bose.) 3-4 91. Camba/a annu/ata Say 3-4 92. Fontaria coriacen Koch. 2-4 93. Polydesmus serratus (Say) 4 94. Geophilus varians McNeil 1-4 95. Linotaenia bidens (Woods) 1-4 96. Cryptops hya/ina Say 1-3 97. Bothropo/ys mu/tidentatus Newport 1-3 98. Che/anops ob/ongus 1-2 99. C. virginnae 1-2
100. Che/ifer cancroides (L.) 1-2 101. Uropoda sp. 1-4 102. Parasitus sp. 1-2 103. Dendro/aelaps sp. 1-2 104. Pergamasus sp. 1-2 105. Tyroglyphid (unsp.) 2-3 106. Orabatid (unsp.) 2-3 107. Dead cerambycid 1-2 108. Various larvae (unsp.) 1-4 109. Rotting wood 1-4 I 10. Fungi 1-4 Ill. Sapwood 1-3 112. Phloem 1-2
112 112 112 112 110 110 49
110 110 55
107 55
Ill 30 59
108 108 108 108 109 110 110 110 110 109 109 109 108 108 108 108
Ecological Monographs Vol. 61, No.3
Prey species
101-106, 108 108 108 110 108 108 108 110 110
109, II0-112
109, III, 112
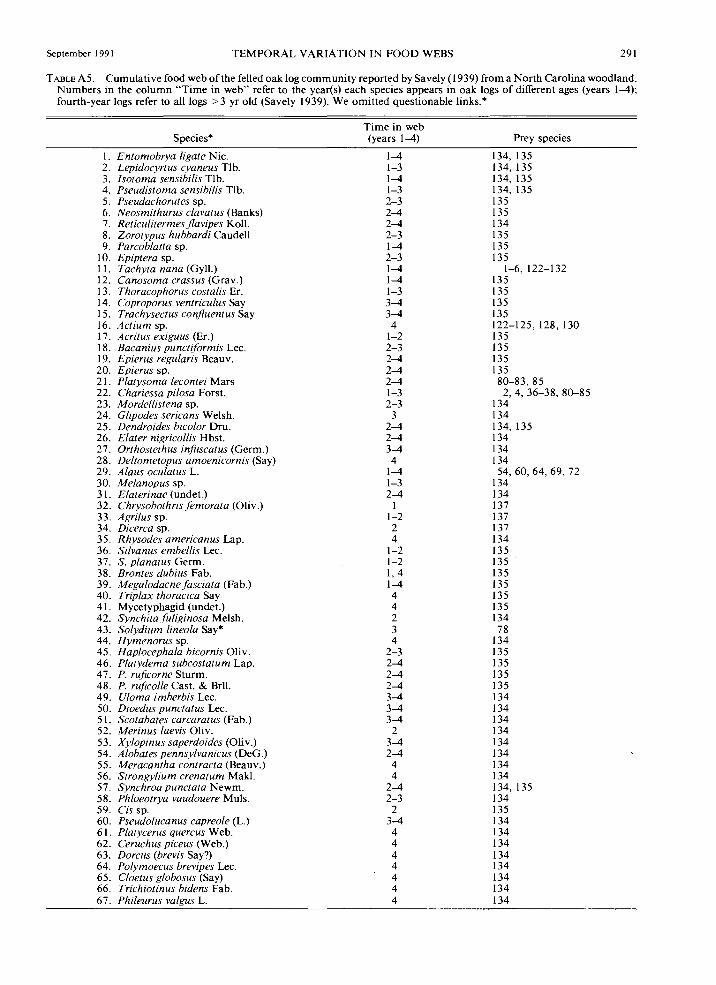
September I 991 TEMPORAL VARIATION IN FOOD WEBS 291
TABLE A5. Cum ula ti ve food web of the felled oak log community reported by Savely (I 9 39) from a North Carolina woodland. Numbers in the column "Time in web" refer to the year(s) each species appears in oak logs of different ages (years 1-4); fourth-year logs refer to all logs > 3 yr old (Savely 1939). We omitted questionable links.*
Species*
I. Entomobrya ligate Nic. 2. Lepidocyrtus cyaneus Tlb. 3. lsotoma sensibilis Tlb. 4. Pseudistoma sensibilis Tlb. 5. Pseudachorutes sp. 6. Neosmithurus clava/us (Banks) 7. Reticulitermes jlavipes Koll. 8. Zorotypus hubbardi Caudell 9. Parcoblatta sp.
10. Epiptera sp. II. Tachyta nana (Gyll.) 12. Canosoma crassus (Grav.) 13. Thoracophorus costalis Er. 14. Coproporus ventriculus Say 15. Trachysectus corifluentus Say 16. Actium sp. 17. Acritus exiguus (Er.) 18. Bacanius punctiformis Lee. 19. Epierus regularis Beauv. 20. Epierus sp. 21. Platysoma lecontei Mars 22. Chariessa pilosa Forst. 23. Mordellistena sp. 24. Glipodes sericans Welsh. 25. Dendroides bicolor Dru. 26. Elater nigricollis Hbst. 27. Orthostethus infuscatus (Germ.) 28. Deltometopus amoenicornis (Say) 29. Alaus oculatus L. 30. Melanopus sp. 31. Elaterinae (undet.) 32. Chrysobothris femora/a (Oliv.) 33. Agrilus sp. 34. Dicerca sp. 35. Rhysodes american us Lap. 36. Silvanus embellis Lee. 37. S. planatus Germ. 38. Brontes dubius Fab. 39. Megalodacne fascial a (Fab.) 40. Trip/ax thoracica Say 41. Mycetyphagid (undet.) 42. Synchitafuliginosa Melsh. 43. Solydium lineola Say* 44. Hymenorus sp. 45. Haplocephala bicornis Oliv. 46. Platydema subcostatum Lap. 47. P. rujicorne Sturm. 48. P. rujicolle Cast. & Brll. 49. Uloma imberbis Lee. 50. Dioedus puncta/us Lee. 51. Scotabates carcaratus (Fab.) 52. Merinus laevis O!iv. 53. Xylopinus saperdoides (Oliv.) 54. Alobates pennsylvanicus (DeG.) 55. Meracantha contracta (Beauv.) 56. Strongylium crenatum Makl. 57. Synchroa puncta/a Newm. 58. Phloeotrya vaudouere Muls. 59. Cis sp. 60. Pseudolucanus capreole (L.) 61. Platycerus quercus Web. 62. Ceruchus piceus (Web.) 63. Dorcus (brevis Say?) 64. Polymoecus brevipes Lee. 65. Cloetus globosus (Say) 66. Trichiotinus bidens Fab. 67. Phileurus valgus L.
Time in web (years 1-4)
1-4 1-3 1-4 1-3 2-3 2-4 2-4 2-3 1-4 2-3 1-4 1-4 1-3 3-4 3-4
4 1-2 2-3 2-4 2-4 2-4 1-3 2-3
3 2-4 2-4 3-4 4
1-4 1-3 2-4
I 1-2 2 4
1-2 1-2 I, 4 1-4 4 4 2 3 4
2-3 2-4 2-4 2-4 3-4 3-4 3-4
2 3-4 2-4 4 4
2-4 2-3
2 3-4 4 4 4 4 4 4 4
Prey species
134, 135 134, 135 134, 135 134, 135 135 135 134 135 135 135
1-6, 122-132 135 135 135 135 122-125, 128, 130 135 135 135 135 80-83, 85 2,4, 36-38,80-85
134 134 134, 135 134 134 134 54, 60,64,69, 72
134 134 137 137 137 134 135 135 135 135 135 135 134 78
134 135 135 135 135 134 134 134 134 134 134 134 134 134, 135 134 135 134 134 134 134 134 134 134 134
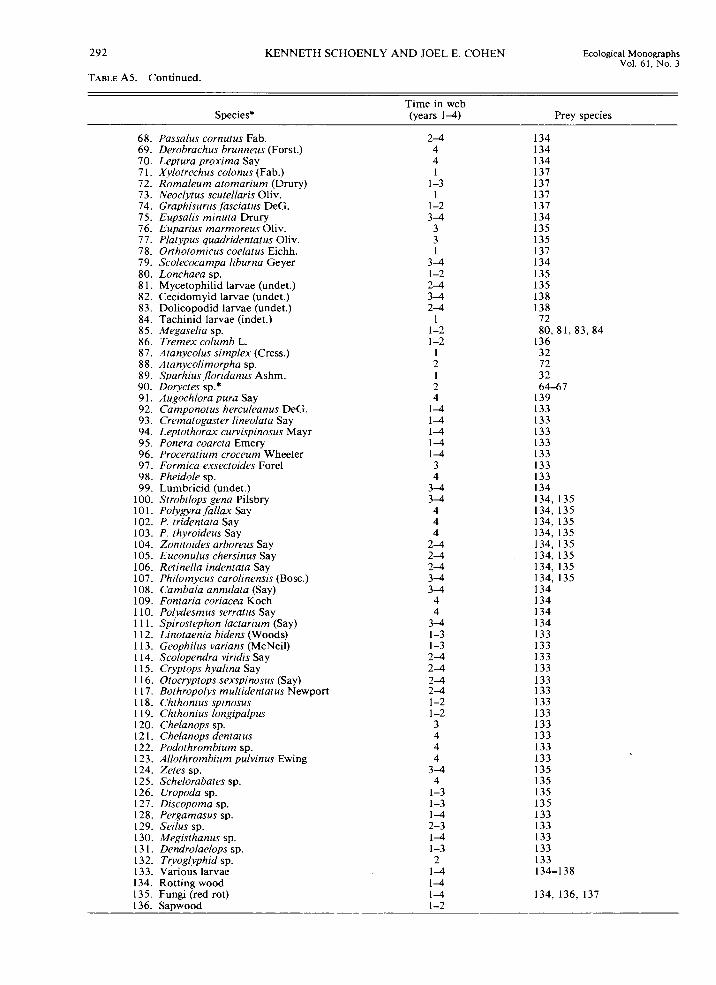
292 KENNETH SCHOENL Y AND JOEL E. COHEN
TABLE A5. Continued.
Time in web Species* (years 1-4)
68. Passalus cornutus Fab. 2-4 69. Derobrachus brunneus (Forst.) 4 70. Leptura proxima Say 4 71. Xylotrechus co/onus (Fab.) I 72. Romaleum atomarium (Drury) 1-3 73. Neoclytus scutellaris Oliv. I 74. Graphisurus fasciatus DeG. 1-2 75. Eupsalis minuta Drury 3-4 76. Euparius marmoreus Oliv. 3 77. Platypus quadridentatus Oliv. 3 78. Orthotomicus coelatus Eichh. I 79. Scolecocampa liburna Geyer 3-4 80. Lonchaea sp. 1-2 81. Mycetophilid larvae (undet.) 2-4 82. Cecidomyid larvae (undet.) 3-4 83. Dolicopodid larvae (undet.) 2-4 84. Tachinid larvae (indet.) I 85. Megaselia sp. 1-2 86. Tremex columb L. 1-2 87. Atanycolus simplex (Cress.) I 88. Atanycolimorpha sp. 2 89. Spar hi us florid anus Ashm. I 90. Doryctes sp.* 2 91. Augochlora pura Say 4 92. Camponotus herculeanus DeG. 1-4 93. Crematogaster lineolata Say 1-4 94. Leptothorax curvispinosus Mayr 1-4 95. Ponera coarcta Emery 1-4 96. Proceratium croceum Wheeler 1-4 97. Formica exsectoides Forel 3 98. Pheidole sp. 4 99. Lumbricid (undet.) 3-4
100. Strobilops gena Pilsbry 3-4 10 I. Polygyra fa/lax Say 4 102. P. tridentata Say 4 103. P. thyroideus Say 4 104. Zonitoides arboreus Say 2-4 105. Euconulus chersinus Say 2-4 106. Retinella indentata Say 2-4 107. Philomycus carolinensis (Bose.) 3-4 108. Cambala annulata (Say) 3-4 109. Fontaria coriacea Koch 4 110. Polydesmus serratus Say 4 Ill. Spirostephon lactarium (Say) 3-4 112. Linotaenia bidens (Woods) 1-3 113. Geophilus varians (McNeil) 1-3 114. Scolopendra viridis Say 2-4 115. Cryptops hyalina Say 2-4 116. Otocryptops sexspinosus (Say) 2-4 117. Bothropolys multidentatus Newport 2-4 118. Chthonius spinosus 1-2 119. Chthonius longipalpus 1-2 120. Chelanops sp. 3 121. Chelanops dentatus 4 122. Podothrombium sp. 4 123. Allothrombium pulvinus Ewing 4 124. Zetes sp. 3-4 125. Schelorabates sp. 4 126. Uropoda sp. 1-3 127. Discopoma sp. 1-3 128. Pergamasus sp. 1-4 129. Seilus sp. 2-3 130. Megisthanus sp. 1-4 131. Dendrolaelops sp. 1-3 132. Tryoglyphid sp. 2 133. Various larvae 1-4 134. Rotting wood 1-4 135. Fungi (red rot) 1-4 136. Sapwood 1-2
Ecological Monographs Vol. 61, No.3
Prey species
134 134 134 137 137 137 137 134 135 135 137 134 135 135 138 138 72 80, 81, 83,84
136 32 72 32 64-67
139 133 133 133 133 133 133 133 134 134, 135 134, 135 134, 135 134, 135 134, 135 134, 135 134, 135 134, 135 134 134 134 134 133 133 133 133 133 133 133 133 133 133 133 133 135 135 135 135 133 133 133 133 133 134-138
134, 136, 137

September I 991
TABLE AS. Continued.
Species*
137. Phloem 138. Microorganisms 139. Pollen
TEMPORAL VARIATION IN FOOD WEBS
Time in web (years 1-4)
1-3 2-4
4
293
Prey species
*Species 43 and 90 and their prey (species 78 and 64-67, respectively) do not occur jointly on any day though Savely reports them as predators and prey in his appendix. We included these species and their trophic links in our cumulative web to preserve the author's original species list and food web data. Savely (1939) observed salamanders, Plethodon g/utinosus (Green), in oak logs > 3 yr old, but reported no specific prey they eat.
TABLE A6. Cumulative food web oftreehole communities of box forest (mostly Tristania conferta and Agrodendron actinophy//um) in southeast Queensland, Australia, reported by Kitching (1987) for six study sites and four sampling periods. Each time period represents 3 mo; period I: January, October, and December 1982, period 2: January to March 1983, period 3: April to June 1983, and period 4: July to September 1983. According to Jenkins and Kitching (1990), species 6, 7, and 8 are mutual predators.*
Species
A. Site I I. Prionocyphon niger 2. C/ogdia sp. 3. Algophagid mites 4. Mosquito larvae S. Ostracods 6. Anatopynia pennipes Freeman 7. Cu/icoides angu/aris Lee and Reye 8. Arrhenurus sp. 9. Lechriodus fletcheri (Boulenger)t
I 0. Large particle detritus II. Small particle detritus 12. Suspended organic matter
B. Site 2 I. Prionocyphon niger 2. C/ogida sp. 3. Algophagid mites 4. Mosquito larvae S. Ostracods 6. Anatopynia pennipes 7. Cu/icoides angu/aris 8. Arrhenurus sp. 9. Lechriodus fletcherit
I 0. Large particle detritus II. Small particle detritus 12. Suspended organic matter
c. Site 4 I. Prionocyphon niger 2. C/ogdia sp. 3. Aigophagid mites 4. Mosquito larvae S. Ostracods 6. Anatopynia pennipes 7. Cu/icoides angu/aris 8. Arrhenurus sp. 9. Lechriodus fletcherit
I 0. Large particle detritus II. Small particle detritus 12. Suspended organic matter
Time in web (periods 1-4)
1-4 2
I, 3, 4
I, 3, 4 3,4 1-4
I 1-4 1-4 1-4
1-4 2,4
I I, 3, 4
1-4 1-4
I, 2, 4 I
1-4 1-4 1-4
1-4 I, 2, 4
I, 2 2-4 1-4 1-4
I, 2, 4
1-4 1-4 1-4
Prey species
10 II II II, 12 12
I, 2, 4, 7, 8 I, 2, 4, 6, 8 1-4, 6, 7 I, 2,4,6-8
10 II II II, 12 12
I, 2, 4, 7, 8 I, 2, 4, 6, 8 1-4, 6, 7 1,2,4,6-8
10 II II II, 12 12
I, 2, 4, 7, 8 I, 2, 4, 6, 8 1-4, 6, 7 1,2,4,6-8

294 KENNETH SCHOENL Y AND JOEL E. COHEN
TABLE A6. Continued.
Species
D. Site 5 I. Prionocyphon niger 2. Clogdia sp. 3. Algophagid mites 4. Mosquito larvae 5. Ostracods 6. Anatopynia pennipes 7. Culicoides angularis 8. Arrhenurus sp. 9. Lechriodus fletcherit
10. Large particle detritus II. Small particle detritus 12. Suspended organic matter
E. Site 10 I. Prionocyphon niger 2. Clogdia sp. 3. Algophagid mites 4. Mosquito larvae 5. Ostracods 6. Anatopynia pennipes 7. Culicoides angularis 8. Arrhenurus sp. 9. Lechriodus jletcherit
10. Large particle detritus II. Small particle detritus 12. Suspended organic matter
F. Site II I. Prionocyphon niger 2. Clogdia sp. 3. Algophagid mites 4. Mosquito larvae 5. Ostracods 6. Anatopynia pennipes 7. Culicoides angularis 8. Arrhenurus sp. 9. Lechriodus fletcher it
10. Large particle detritus II. Small particle detritus 12. Suspended organic matter
Time in web (periods 1-4)
1-4 2-4 1-3 I, 2 1-4 1-4
2
1-4 1-4 1-4
1-4 1-4 1-4 1-3
1-4 I
1-4 1-4 1-4
1-4 1-4
I, 2, 4 1-3
I 1-4 4
1-4 1-4 1-4
Ecological Monographs Vol. 61, No.3
Prey species
10 II II II, 12 12
I, 2, 4, 7, 8 I, 2, 4, 6, 8 1-4, 6, 7 I, 2, 4, 6-8
10 II II II, 12 12
I, 2, 4, 7, 8 I, 2, 4, 6, 8 1-4, 6, 7 I, 2, 4, 6-8
10 II II II, 12 12
I, 2, 4, 7, 8 I, 2, 4, 6, 8 1-4, 6, 7 I, 2, 4, 6-8
*Kitching (personal communication, 12 July 1990) reports that " ... mutual predation probably does happen [between these species] although not with symmetrical strength."
t Cannibalistic species.

September 1991 TEMPORAL VARIATION IN FOOD WEBS 295
TABLE A7. Cumulative food web of the soybean arthropod community in east central Illinois reported by Mayse and Price (1978) for weeks 3 and 12 of the study. According to the authors, this list excludes some of the more uncommon arthropods found in this system. We include both observed and probable feeding links.*
Species
I. Predatory red mites (undet.)t 2. Orius insidiosus (Say)t 3. Nabis sp.t 4. Spiders (unspecified) 5. Aeolothrips sp. 6. Syrphid larvae 7. Parasitic Hymenoptera 8. Empoascafabae (Harris) 9. Sericothrips variabilis (Beach)
10. Other herbivorous thrips II. Black alate aphids 12. Platypena scabra (Fab.) 13. Colias eurytheme Boisduval 14. Acrosternum hi/are (Say) 15. Soybeanplant
Time in web (weeks 3 and/or 12)
3, 12 12 12
3, 12 12 12 12
3, 12 3, 12 3, 12 3, 12
12 12 12
3, 12
Prey species
5, 8-10 8-13, 15 2, 8, 12-15 8, 11-13 9, 10 9, II
II, 12, 14 15 15 15 15 15 15 15
* M. Mayse (personal communication. 2 November 1988) revised his (and P. Price's) published data. In their Fig. II (1978). add a cannibalism link to species 3 (Nabis sp. to Nabis sp.). Although their caption in Fig. II mentions two studies where consumers 2 and 3 reportedly eat 15 (Salas-Aguilav and Ehler 1977, Ridgway and Jones 1968), Mayse and Price did not "specifically observe such feeding in [their] study." Given that the authors included both observed and probable interactions in their time-specific webs, we elected to incorporate both links (2-15 and 3-15) in our reconstructions.
t Cannibalistic species.
TABLE A8. Cumulative food web for the Arctic tundra (N a umov I 9 72, from Sbodnikov I 9 58) during winter (W) and summer (S).
Species
I. Marine mammals, fish and invert. 2. Tundra vegetation 3. Water & soil invertebrates, etc. 4. Guillemots 5. Polar bear 6. Polar fox 7. Gulls 8. Northern reindeer 9. Lemmings
I 0. Ptarmigan II. Sparrows 12. Geese, brants 13. White hare 14. Snipe 15. Loons, eiders, ducks 16. Tundra wolf 17. Ermine 18. White owl 19. Falcon 20. Hawk
Time in web (Wand/or S)
W,S W,S s s w, s w, s w, s W,S w,s w,s s s w, s s s W,S W, S W, S s s
I I
Prey species
I, 8-15 I, 9-12, 14, 15 2 2 2 2 2 2 2, 3 I, 3 I, 8-10, 12, 13, 15 9-11, 14 9-11, 13, 14 9-12, 14, 15 9-11, 14

296 KENNETH SCHOENL Y AND JOEL E. COHEN Ecological Monographs Vol. 61, No.3
TABLE A9. Cumulative food web of the dung arthropod community in a cow pasture near Ithaca, New York, reported by Valiela (1974) during days I and 5 of his 5-d study.* Only major taxa were included in his original food web graphs. Prey and time data for other "minor" species were determined using Figs. 1-3 and Table I of Valiela (1974). We include both established and presumed feeding links.
Species
I. Phi/onthus cruentatus Gmelin 2. A/eochara bipustu/ata (L.) 3. Aleochara sp. 4. Hyponigrus obsidianus Melsh. 5. Oxytelus tetracarinatus Block 6. Macroche/us sp. 7. Parasitus sp. 8. Uropodid sp. 9. Acarid sp.
10. Aphodius haemorrhoida/is (L.) II. A. erraticus (L.) 12. A. fimetarius (L.) 13. A. stercorosus Melsh. 14. A. prodiomus (Brahm) 15. A. fossor (L.) 16. Cothonaspis sp. 17. Cercyon sp. A 18. Cercyon sp. B 19. Cercyon sp. C 20. Cercyon sp. F 21. Sarcophaga sp. A 22. Ravinia /'herminieri (Desv.) 23. Musca autumna/is De Geer 24. Collembola (unspecified) 25. Leptocera adults 26. Acrotrichis sp. (n. sericans) 27. Sepsis neocynipsea M. & S. larvae 28. Sepsis sp. B 29. Sa/tel/a sphondy/ii (Schrank) larvae 30. Aphodius larvae 31. Cercyon larvae 32. Oxyteline larvae 33. Platystethus americanus Erichson 34. Atheta sordida Marsh 35. Atheta sp. 36. Falagria dissecta Erichson 3 7. Leptocera larvae 38. Diptera B66 39. Diptera C66 40. S. bipostu/atum Fab. larvae 41. S. scarabaeoides (L.) larvae 42. Hydrophilid A65 43. Sphaeridum scarabaeoides (L.) 44. S. bipostu/atum Fab. 45. S. lunatum Fab. 46. Bovine dung
Time in web (days I
and/or 5)
I, 5 I, 5 I, 5 I, 5 I, 5 I, 5 I, 5 I, 5 I, 5 I, 5 I, 5 I, 5 I, 5 I, 5 I, 5 I, 5 I, 5 I, 5 I, 5 I, 5 I, 5 I, 5 I, 5 I, 5 5 5 5 5 5 5 5 5 5 5 5 5 5 5 5 5 5
I, 5 I I I
I, 5
Prey species
3, 5-9, 17-23, 25, 27-29, 33-39, 42, 46 3, 5-9, 17-23, 25, 27-29, 33-39, 42, 46 6-9,24,46 3, 5-9, 17-23, 25, 27-29, 33-39, 42, 46 6-9,24,46
21-24,27-29,37-39,46 21-24,27-29,37-39,46 21-24,27-29,37-39,46 21-24,27-29,37-39,46 46 46 46 46 46 46 21-23,27-29,37-39 46 46 46 46 46 46 46 46 46 46 46 46 46 46 46 46 6-9,24,46 6-9,24,46 6-9,24,46 6-9,24,46
46 46 46 6-9, 24, 27-29, 37-39 6-9, 24, 27-29, 37-39 46 46 46 46
*Professor Ivan Valiela sent us unpublished detailed daily data for his 5-d dung arthropod web (personal communication, 19 December 1990). We plan to analyze these data in the near future.

September 1991 TEMPORAL VARIATION IN FOOD WEBS 297
TABLE AIO. Cumulative food web for the acidic permanent pond on the Skipwith Common, North Yorkshire, United Kingdom, sampled from the open water by Warren (1989). Numbers in the column "Time in web" refer to the week(s) each species was recorded, starting from the week of 12-13 March 1986. Pond invertebrates were sampled on each of the following 5 dates: week I, 12-13 March; week 10,22-23 May; week 12, 7-8 June; week 23,21-23 August; and week 29, 3-4 October. Warren found no fish or amphibians. For week 23 we combined Warren's observations of vegetated open water and unvegetated open water.
Species
I. Polyce/is tenuis (Ijima) 2. Enchytraeidae 3. Lumbriculus variegatus (Muller) 4. Oribatei sp. 5. Argyroneta aquatica (Clerk) 6. Chydorus latus Sars 7. Acanthocyc/ops vernalis (Fischer)* 8. Ena//agma cyathigerum (Charpentier)* 9. Sympetrum scoticum (Donovan)
10. Ca//icorixa praeusta (Fieber) II. Corixa punctata (lllinger) 12. Hesperocorixa /innei (Fieber) 13. Hesperocorixa sah/bergi (Fieber) 14. Arctocoris germari (Fieber) 15. Sigaria semistriata (Fieber) 16. Corixid nymphs 17. Hydroporus erythrocepha/us (L.) 18. Agabus! !lybius larvae* 19. Sia/is /utaria (L.)* 20. Ho/ocentropus picivornis (Stephens) 21. Limnephilus marmoratus Curtis 22. Proc/adius sagitta/is (Kieffer) 23. Corynoneura scutellata Winnertz 24. Chironomus dorsalis Meigen 25. G/yptotendipes pal/ens (Meigen) 26. Tanytarsus bruchonius Reiss & Fittkau 27. Other chironomids 28. Detritus
* Cannibalistic species.
Time in web (weeks I, 10, 12,
23, and/or 29)
23,29 I, 10, 12, 23,29
29 I, 10, 12, 23,29
29 I, 10, 12, 23,29 I, 10, 12, 23,29
23, 29 12, 23 I, 10, 12, 23,29
23,29 12 29
I, 10, 12, 23, 29 23 10, 12, 23,29 23
I, 10, 12, 23,29 I, 12, 23, 29
12,23, 29 I, 10, 23, 29 I, 12, 23,29 I, 23,29 I, 10, 12, 23,29 I, 10, 12, 23, 29 I, 10, 12, 23, 29
12,23,29 I, 10, 12, 23,29
Prey species
2, 23-27 28 28 28
4, 6, 7, 10, 13, 14, 16, 20-27 28
2, 6,23,26 2-4, 6, 7, 16, 22-27 2, 4, 6-8, 15-20, 22-27
23-28 28 28 28 23-28 28 28 2,6, 7 3, 8, 16, 19-27 2-4, 6, 7, 16, 22-27 2, 6, 7, 16, 22-27 2,4,23-28 2,4,6, 7,23,25-27
28 2, 28
28 28 28

298 KENNETH SCHOENL Y AND JOEL E. COHEN Ecological Monographs Vol. 61, No.3
TABLE All. Cumulative food web for the acidic permanent pond on the Skipwith Common, North Yorkshire, United Kingdom, sampled from the margins of the pond by Warren (1989).* Numbers in the column "Time in web" refer to the week(s) each species was recorded, starting from the week of 12-13 March 1986. Pond invertebrates were sampled on 5 dates: week I, 12-13 March; week 10, 22-23 May; week 12, 7-8 June; week 23,21-23 August; and week 29, 3-4 October. Warren found no fish or amphibians.
Species
I. Polycelis tenuis (ljima) 2. Enchytraeidae 3. Lumbriculus variegatus (Muller) 4. Oribatei sp. 5. Argyroneta aquatica (Clerk) 6. Scaphaloberis mucronata (Muller) 7. Chydorus latus Sars 8. Acanthocyclops vernalis (Fischer)t 9. Enallagma cyathigerum (Charpentier)t
I 0. Lestes sponsa (Hansemann)t II. Aeshnajuncea (L.)t 12. Sympetrum scoticum (Donovan) 13. Notonecta glauca L.t 14. Callicorixa praeusta (Fieber) 15. Corixa dentipes (Thomson) 16. Corixa punctata (lllinger) 17. Hesperocorixa linnei (Fieber) 18. Hesperocorixa sahlbergi (Fieber) 19. Arctocoris germari (Fieber) 20. Sigaria semistriata (Fieber) 21. Corixidae nymphs 22. Hydroporus erythrocephalus (L.) 23. Agabus sturmii (Gyllenhal) 24. Agabus bipustulatus (L.) 25. I!ybius fuliginosus (Fa b.) 26. Agabus! Jlybius larvaet 27. Dytiscus marginalis L.t 28. Sialis lutaria (L.)t 29. Holocentropus picicornis (Stephens) 30. Lim nephi/us marmoratus Curtis 31. Procladius sagitta/is (Kieffer) 32. Corynoneura scutellata Winnertz 33. Chironomus dorsalis Meigen 34. Glyptotendipes pall ens (Meigen) 35. Tanytarsus bruchonius Reiss & Fittkau 36. Other chironomids 37. Detritus
Time in web (weeks I, 10, 12,
23, and/or 29)
I, 12, 23,29 I, 10, 12, 23, 29 I, 29 I, 10, 12, 23, 29
10, 12, 23, 29 12,23 I, 10, 12, 23,29 I, 10, 12, 23,29 I, 12, 23, 29
10, 12,29 I, 10, 12,29
12, 23, 29 I, 23, 29 I, 10, 12, 23,29 I, 10, 23,29 I, 10, 12, 23,29 I, 12,29 I, 23,29 I, 12, 23,29 I, 10,29
10, 12, 23, 29 23 23,29 23, 29 23,29
I, 10, 12, 23,29 12, 23
I, 23, 29 I, 10, 12, 23, 29 I, 10, 12, 23, 29 I, 10, 12, 23,29 I, 12, 23,29 I, 10, 23,29 I, 10, 12, 23,29 I, 10, 12, 23,29
12,23,29 I, 10, 12, 23, 29
2,3,32-36 37 37 37
Prey species
4, 6-8, 14, 19-21, 29-36 37 37
2, 7,32, 35 2,4,6-8,21,31-36 2,4, 6-9,21,28,29, 31-36 2-10, 12, 20, 21, 26, 28-36 2-4,6-9,21,22,26,28,29,31-36 3,6,9, 10, 12, 14,17-21,26,28-36
32-37 37 37 37 37 32-37 37 37
2, 6, 7 2,4,6-9 2,4,6-9 2,4,6-9 3, 6, 9, 10 5, 7, 9, 10, 12 2-4,6-8,21,31-36 2, 6-8,21,31-36 2,4, 32-37 2-4,6-8,32,34-36
37 2,37
37 37 37
* P. Warren (personal communication, 4 April 1990) corrected several errors in the published data. To the predation matrix of Warren ( 1989: Table 2), add the entries "2b" (following Warren's code) to column 19 in rows 32-36. In his Fig. 3b (margin), consumer II eats prey 2, 10 eats 29, 5 eats 14, 20 and 29. His Table 2 shows 5 eating 14 and 20 but not his Fig. 3, so we assumed these links are present.
t Cannibalistic species.