Spatial and Temporal Variability of GPCP Precipitation Estimates

Current Research in Earth Sciences, Bulletin 258, part 3 (http://www.kgs.ku.edu/Current/2010/Macfarlane/index.html)
Temporal Variability in Quality of Produced Water from Wells Tapping Ozark Aquifer of Southeast Kansas, Macfarlane 1
Temporal Variability in the Quality of Produced Water from Wells Tapping the Ozark Aquifer of Southeast Kansas
P. Allen MacfarlaneKansas Geological Survey
Abstract
State and local agencies have become concerned that the available water supply from the Ozark aquifer in the Tri-state region of southeast Kansas, southwest Missouri, and northeastern Oklahoma may become unusable or require additional water treatment because of deteriorating quality resulting from overdevelopment. Many southwest Missouri and southeast Kansas water supplies withdraw water from a 30–60-mi (48–96-km)-wide transition zone in the Ozark aquifer that separates calcium, magnesium-bicarbonate ground water with low dissolved solids to the east from sodium-chloride brines to the west. Water-quality deterioration within the transition zone could potentially come about as a result of eastward migration or upward movement from deeper horizons of saline water. This study assessed variability in the quality of water produced from wells within the transition zone in southeast Kansas across a variety of time scales. Water samples were collected monthly from nine wells located in the transition zone over a two-year period and frequently during two 50+ hr chemical-quality pumping tests of Pittsburg well 8. The samples were analyzed for conductance and pH, and all major and selected minor dissolved inorganic constituents. Mixing curves of chloride versus bicarbonate/chloride ratio and chloride versus sodium/chloride ratio demonstrate that the produced water from Ozark aquifer wells is a mixture of low dissolved solids, calcium, magnesium-bicarbonate ground waters and sodium-chloride brines. Produced water from wells tapping sources in the Ozark and the overlying Springfi eld Plateau aquifers is a blend of waters from these sources, although the data suggest that the contribution from the Springfi eld is small relative to the Ozark aquifer. Fluctuations in the quality of the produced water during pumping most likely result from complex mixing of waters of differing quality from different parts of the Ozark aquifer within the well bore. This is borne out by bicarbonate/chloride ratio versus chloride concentration mixing curves and the dissolved constituent ratios indicative of bicarbonate and sodium in excess of that required to balance calcium + magnesium and chloride, respectively. Comparison of the 1979–1980 data with the 2006–08 data from this project indicates that the chloride concentration in some of the sampled supplies has increased. Based on extrapolation of the maximum estimated rate of chloride concentration increase, the earliest that water from Pittsburg wells 8 and 10 would exceed the recommended drinking water limit for chloride is estimated to be by the years 2045 and 2060, respectively, assuming continuation of the present rates of pumping.
Introduction The Ozark aquifer is the single most important source of water in the Tri-state region of southeast Kansas, southwest Missouri, and northeast Oklahoma. Kansas water agencies and the Tri-State Coalition (a multi-state, nongovernmental organization consisting of water-related interest groups) are concerned that the available supply from the Ozark may become inadequate, rendered unusable, or require additional water treatment in the near future because of water-quality degradation. Many southeast Kansas and southwest Missouri water supplies withdraw water from wells that tap a 30–60-mi (48–96-km)-wide transition zone in the Ozark aquifer separating calcium-bicarbonate type ground waters with low dissolved solids to the east from sodium-chloride brines to the west (fi g. 1). Two earlier regional studies indicated signifi cant short- and long-term changes in the chemical quality of
produced water from wells within or near the Ozark aquifer transition zone. Darr (1978) used 1966–1976 chloride data collected from public water supplies to infer the eastward movement of brackish water into Barton, Vernon, and Bates counties in southwestern Missouri. Macfarlane and Hathaway (1987) noted increases in the concentrations of sodium and chloride in the water produced from well 1 of the now defunct Crawford County RWD 7 between 1972 and 1980. Long-term pumping from the confi ned aquifer has signifi cantly reduced and in some areas has reversed the hydraulic head gradient, which is generally from east to west across the water-quality transition zone in the Ozark aquifer. Development has produced coalesced cones of depression on the potentiometric surface within or near the transition zone in the Pittsburg, Kansas, and Miami, Oklahoma, areas (fi g. 2; Macfarlane and Hathaway, 1987; Gillip et al., 2007). Macfarlane and Hathaway
Current Research in Earth Sciences, Bulletin 258, part 3 (http://www.kgs.ku.edu/Current/2010/Macfarlane/index.html)
Temporal Variability in Quality of Produced Water from Wells Tapping Ozark Aquifer of Southeast Kansas, Macfarlane 2
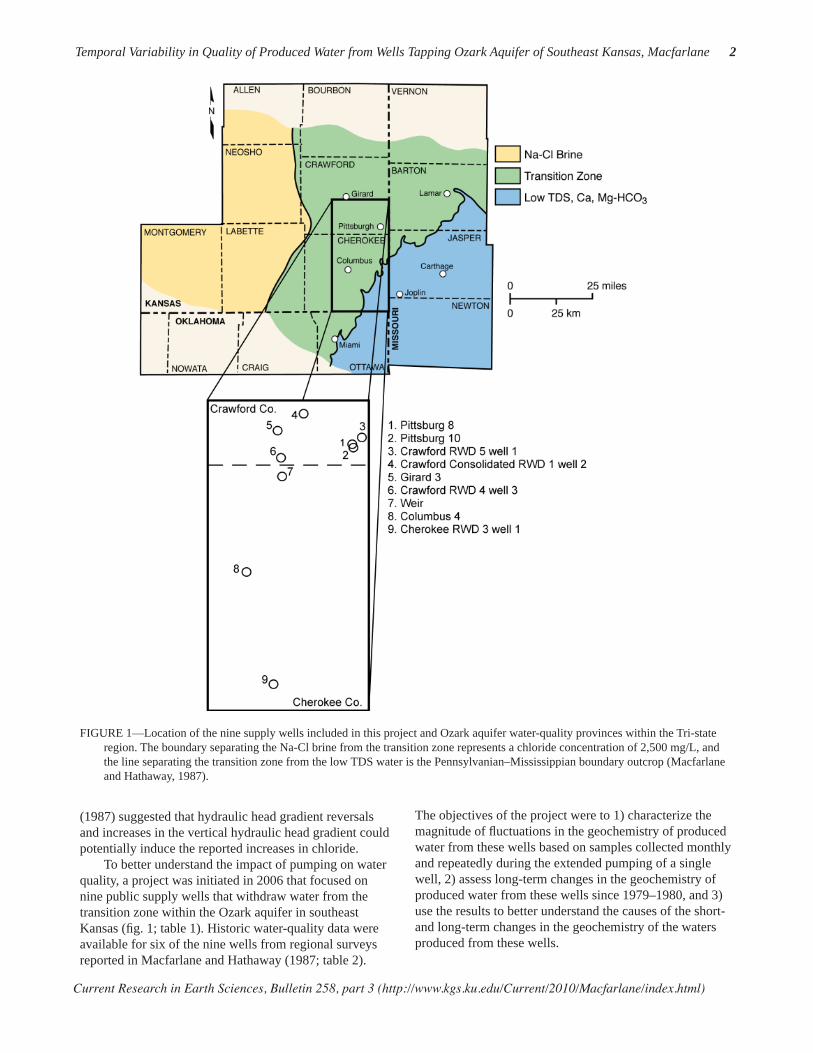
FIGURE 1—Location of the nine supply wells included in this project and Ozark aquifer water-quality provinces within the Tri-state region. The boundary separating the Na-Cl brine from the transition zone represents a chloride concentration of 2,500 mg/L, and the line separating the transition zone from the low TDS water is the Pennsylvanian–Mississippian boundary outcrop (Macfarlane and Hathaway, 1987).
(1987) suggested that hydraulic head gradient reversals and increases in the vertical hydraulic head gradient could potentially induce the reported increases in chloride. To better understand the impact of pumping on water quality, a project was initiated in 2006 that focused on nine public supply wells that withdraw water from the transition zone within the Ozark aquifer in southeast Kansas (fi g. 1; table 1). Historic water-quality data were available for six of the nine wells from regional surveys reported in Macfarlane and Hathaway (1987; table 2).
The objectives of the project were to 1) characterize the magnitude of fl uctuations in the geochemistry of produced water from these wells based on samples collected monthly and repeatedly during the extended pumping of a single well, 2) assess long-term changes in the geochemistry of produced water from these wells since 1979–1980, and 3) use the results to better understand the causes of the short- and long-term changes in the geochemistry of the waters produced from these wells.

Current Research in Earth Sciences, Bulletin 258, part 3 (http://www.kgs.ku.edu/Current/2010/Macfarlane/index.html)
Temporal Variability in Quality of Produced Water from Wells Tapping Ozark Aquifer of Southeast Kansas, Macfarlane 3
FIGURE 2—The 2006 Ozark aquifer potentiometric surface map of the Tri-state region with the water-quality transition zone in southeast Kansas and southwest Missouri. The heavy red and blue lines defi ne the area of the saltwater to freshwater transition zone. The black dots labeled RWD 1C and Pittsburg 8 are the approximate locations of Crawford Consolidated RWD 1 well 2 and Pittsburg well 8, respectively. From Macfarlane and Hathaway (1987) and Gillip et al. (2007).
Regional Hydrogeology The Tri-state region is located astride the boundary between the Ozark Dome in Missouri and the Cherokee basin in Kansas. The bedrock units generally dip westward at approximately 20 ft/mi (3.75 m/km; fi gs. 3–4; Macfarlane and Hathaway, 1987). The Ozark Plateaus aquifer system in southeast Kansas and western Missouri consists of karstic and fractured Mississippian, Lower Ordovician, and Upper Cambrian carbonate rock units and has been subdivided into the Springfi eld Plateau, Ozark, and St. Francois regional aquifers (Jorgensen et al.,
1993; Macfarlane, 2000; table 3). The Springfi eld Plateau aquifer framework consists of Mississippian limestones and dolomitic limestone, whereas the Ozark consists primarily of Lower Ordovician and Upper Cambrian dolostones with quartzose sandstones most prominently developed within the Roubidoux Formation and at the base of the Gasconade Dolomite. Sandstones of the Roubidoux Formation rest on a regional unconformity developed at the top of the Gasconade Dolomite (Jorgensen et al., 1993). The rocks of the Roubidoux, Gasconade Dolomite, and

Current Research in Earth Sciences, Bulletin 258, part 3 (http://www.kgs.ku.edu/Current/2010/Macfarlane/index.html)
Temporal Variability in Quality of Produced Water from Wells Tapping Ozark Aquifer of Southeast Kansas, Macfarlane 4
Well Name PLS Location1Well Depth
(ft [m])
Ozark Aquifer Thickness
Penetrated (ft [m])
Source(s) Tapped2
Cherokee RWD 3 well 1 SWSWSE sec. 17, T. 34 S., R. 24 E. 1,050 (320) 530 (162) OColumbus 4 NENENW sec. 13, T. 32 S., R. 23 E. 1,785 (544) 747 (228) S,O, SFCrawford Cons. RWD 1 well 2 SESESE sec. 2, T. 30 S., R. 24 E. 1,013 (309) 348 (106) OCrawford RWD 4 well 3 NENENE sec. 16, T. 31 S., R. 24 E. 970 (296) 342 (104) OCrawford RWD 5 well 1 SESWSW sec. 23, T. 30 S., R. 25 E. 1,045 (319) 615 (187) S, OGirard 3 NESENE sec. 21, T. 30 S., R. 24 E. 1,165 (355) 445 (136) OPittsburg 8 NENESE sec. 28, T. 30 S., R. 25 E. 1,050 (320) 550 (168) OPittsburg 10 NESESE sec. 28, T. 30 S., R. 25 E. 1,052 (321) 550 (168) OWeir SWSESW sec. 27, T. 31 S., R. 24 E. 920 (280) 300 (91) P,S,O
1Public Land Survey2Aquifers sourced by the supply wells: P = Pennsylvanian, S = Springfi eld Plateau, O = Ozark, and SF = St. Francois
Well NameDate
SampledTDS
(mg/L)Ca
(mg/L)Mg
(mg/L)Na
(mg/L)K
(mg/L)Sr
(mg/L)HCO3(mg/L)
SO4(mg/L)
Cl(mg/L)
Pittsburg 10 4/18/799/26/795/15/80
577601446
656962
272831
485455
5.04.14.6
0.790.730.85
325324326
688081
384141
Crawford RWD 5 well 1 4/18/799/26/795/14/80
468487365
424546
191922
586162
3.63.13.8
0.510.520.56
265271275
212726
586058
Crawford Cons. RWD 1 well 2(Formerly Crawford RWD 7 well 2)
10/7/80 625 71 32 111 8.9 1.37 341 87 135
Weir 4/19/799/24/795/12/80
546567417
606258
272832
435150
6.05.05.7
0.950.861.01
318319319
536365
373738
Columbus 4 9/25/79 743 56 28 123 7.3 1.42 329 78 119
Cherokee RWD 3 well 1 4/19/799/20/795/13/80
594644544
444846
202424
115126122
5.56.16.4
1.071.191.20
189195195
283938
191204200
TABLE 1—Water-supply wells sampled in this project.
TABLE 2—Chemical analyses of water samples collected in 1979–1980 from water-supply wells included in this project.
Potosi formations are considered to be the most productive sources of water (Imes and Emmett, 1994). Most of the supply wells sampled in this project withdraw water from only the upper 600 ft (183 m) of the aquifer and do not extend below the Gasconade (table 1). Dissolution along fractures and bedding planes is the primary process by which secondary permeability has developed in the carbonate rocks, whereas sandstone-matrix permeability depends on the size, sorting, and degree of cementation of the grains (Imes and Emmett, 1994). As a result of these factors, the permeability of the Ozark aquifer is likely to vary over several orders of magnitude across its thickness (Doveton, 1986). Wells in southeast Kansas do not use the St. Francois aquifer as a source of water and as a result very little is known about it.
Ozark Plateaus aquifer system thickness ranges from 1,735 ft (529 m) in the Joplin, Missouri, area to 1,390 ft (424 m) at Parsons, Kansas (Macfarlane and Hathaway, 1987). The average thickness of the Ozark and Springfi eld Plateau aquifers is close to 1,000 ft (305 m) and 350 ft (114 m), respectively, within the study area (Imes and Emmett, 1994). The Springfi eld Plateau aquifer is unconfi ned across much of southwest Missouri and the southeast corner of Cherokee County, Kansas. Elsewhere, the Ozark Plateaus aquifer system is confi ned above by a sequence of Carboniferous (Pennsylvanian) shales and limestones and below by rocks of Precambrian age (fi g. 4). One or more low-permeability units separate the Springfi eld Plateau from the Ozark aquifer in southern Crawford and Cherokee counties. Confi ning-layer thickness is generally less than

Current Research in Earth Sciences, Bulletin 258, part 3 (http://www.kgs.ku.edu/Current/2010/Macfarlane/index.html)
Temporal Variability in Quality of Produced Water from Wells Tapping Ozark Aquifer of Southeast Kansas, Macfarlane 5
FIGURE 3—Contour map of the elevation of the top of the Ozark aquifer in parts of southeast Kansas and adjacent southwest Missouri showing the location of the Pittsburg well fi eld on the crest of the Pittsburg anticline (from Macfarlane and Hathaway, 1987).
20 ft (6.1 m) in these counties (Macfarlane and Hathaway, 1987). Pre-development ground-water fl ow in both aquifers is generally in a northwesterly direction from southwest Missouri into the southeast Kansas study area (Macfarlane et al., 1981; Imes and Emmett, 1994). Recharge to the confi ned Ozark aquifer comes primarily from leakage moving downward from the Springfi eld Plateau aquifer across the confi ning layer (Imes and Emmett, 1994). Localized concentrations of high-yielding supply wells in
northeast Oklahoma, southwest Missouri, and southeast Kansas, including the Pittsburg area, have produced extensive cones of depression in the Ozark aquifer potentiometric surface (fi g. 2; Macfarlane et al., 1981; Macfarlane and Hathaway, 1987; Gillip et al., 2007). Declines in the Ozark aquifer potentiometric surface since pre-development exceed 150 ft (45.7 m) at some locations in the Pittsburg area (Stramel, 1957; Macfarlane and Hathaway, 1987; Gillip et al., 2007).
Current Research in Earth Sciences, Bulletin 258, part 3 (http://www.kgs.ku.edu/Current/2010/Macfarlane/index.html)
Temporal Variability in Quality of Produced Water from Wells Tapping Ozark Aquifer of Southeast Kansas, Macfarlane 6
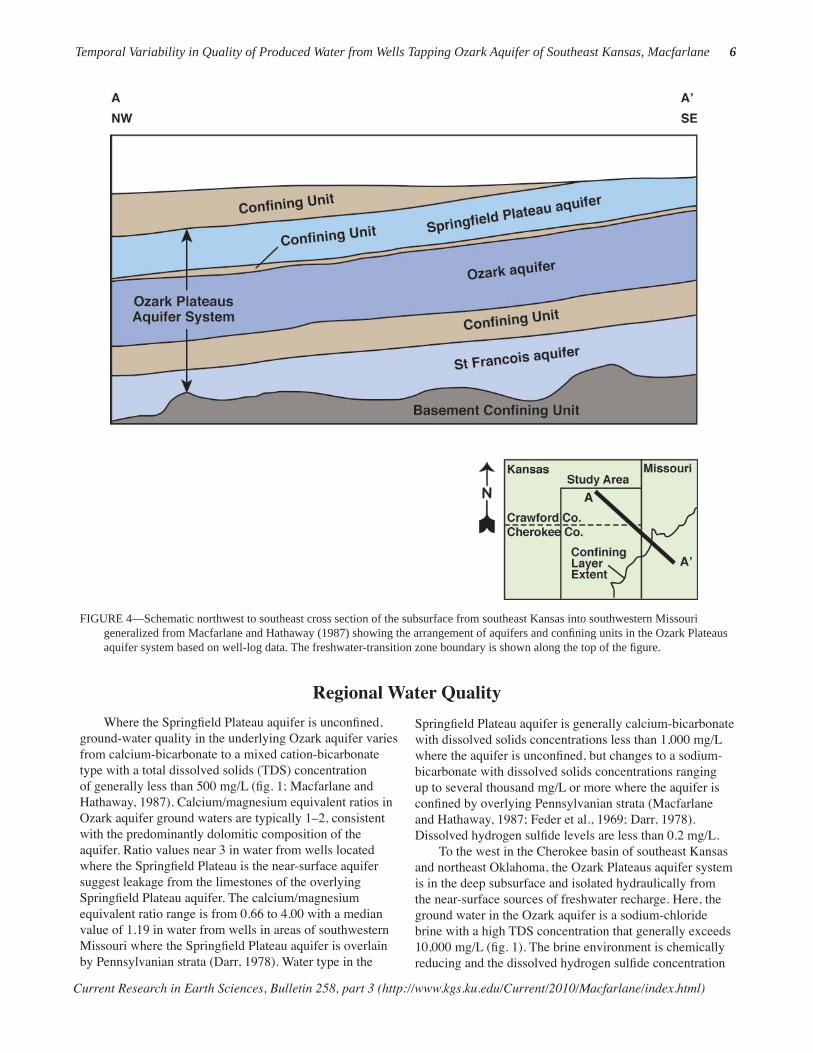
FIGURE 4—Schematic northwest to southeast cross section of the subsurface from southeast Kansas into southwestern Missouri generalized from Macfarlane and Hathaway (1987) showing the arrangement of aquifers and confi ning units in the Ozark Plateaus aquifer system based on well-log data. The freshwater-transition zone boundary is shown along the top of the fi gure.
Regional Water Quality
Where the Springfi eld Plateau aquifer is unconfi ned, ground-water quality in the underlying Ozark aquifer varies from calcium-bicarbonate to a mixed cation-bicarbonate type with a total dissolved solids (TDS) concentration of generally less than 500 mg/L (fi g. 1; Macfarlane and Hathaway, 1987). Calcium/magnesium equivalent ratios in Ozark aquifer ground waters are typically 1–2, consistent with the predominantly dolomitic composition of the aquifer. Ratio values near 3 in water from wells located where the Springfi eld Plateau is the near-surface aquifer suggest leakage from the limestones of the overlying Springfi eld Plateau aquifer. The calcium/magnesium equivalent ratio range is from 0.66 to 4.00 with a median value of 1.19 in water from wells in areas of southwestern Missouri where the Springfi eld Plateau aquifer is overlain by Pennsylvanian strata (Darr, 1978). Water type in the
Springfi eld Plateau aquifer is generally calcium-bicarbonate with dissolved solids concentrations less than 1,000 mg/L where the aquifer is unconfi ned, but changes to a sodium-bicarbonate with dissolved solids concentrations ranging up to several thousand mg/L or more where the aquifer is confi ned by overlying Pennsylvanian strata (Macfarlane and Hathaway, 1987; Feder et al., 1969; Darr, 1978). Dissolved hydrogen sulfi de levels are less than 0.2 mg/L. To the west in the Cherokee basin of southeast Kansas and northeast Oklahoma, the Ozark Plateaus aquifer system is in the deep subsurface and isolated hydraulically from the near-surface sources of freshwater recharge. Here, the ground water in the Ozark aquifer is a sodium-chloride brine with a high TDS concentration that generally exceeds 10,000 mg/L (fi g. 1). The brine environment is chemically reducing and the dissolved hydrogen sulfi de concentration
Current Research in Earth Sciences, Bulletin 258, part 3 (http://www.kgs.ku.edu/Current/2010/Macfarlane/index.html)
Temporal Variability in Quality of Produced Water from Wells Tapping Ozark Aquifer of Southeast Kansas, Macfarlane 7
ranges up to 100 mg/L where some of the brines are associated with oil fi elds (Macfarlane and Hathaway, 1987). Within the transition zone that separates the saline from freshwater in the Ozark aquifer, the ground-water type changes laterally from calcium, magnesium-bicarbonate, and mixed cation-bicarbonate on the east to sodium-chloride on the west (fi g. 1). Macfarlane and Hathaway (1987) noted that water samples from wells tapping the Ozark aquifer near the updip edge of the Pennsylvanian outcrop belt exhibited many of the geochemical changes associated with the transition from freshwater to brine. Hence, they set the freshwater-transition zone boundary in the Ozark aquifer to coincide with the updip edge of the Pennsylvanian outcrop belt. The brine/transition zone boundary shown in fi gs. 1 and 2 was set arbitrarily as the 10,000 mg/L TDS isocon, the limit that defi nes usable water in Kansas. Data are not available to determine the vertical variability in water quality from top to bottom within the Ozark aquifer in the transition zone. Based on a review of the data from the drilling of shallower Ozark wells, Macfarlane and Hathaway (1987) concluded that the
complexity of the aquifer framework and the regional and local structural fabric probably precludes a simple picture of increasingly saline water with depth within the transition zone. Water pumped from wells completed in the Ozark aquifer transition zone contains measurable amounts of hydrogen sulfi de ranging from trace amounts near the eastern side up to 40 mg/L near the western side, and sulfate concentrations from 110 mg/L near the eastern edge to 3 mg/L near the western edge. The simultaneous occurrence of these constituents in produced water indicates either that 1) a state of chemical equilibrium exists, 2) a very slow transition is occurring in the oxidation state of sulfur in the aquifer, or 3) pumping has produced a disequilibrium blend of waters from different parts of the aquifer (Macfarlane and Hathaway, 1987). Macfarlane et al. (1981) suggested that mixing different amounts of the water from the freshwater and brine sources could approximate the chemistries of water samples from the transition zone of the Ozark aquifer.
Methodology
Water samples were collected monthly from nine public water-supply wells located within the transition zone in Crawford and Cherokee counties in southeast Kansas (fi g. 1; table 1). Newer wells tapping supplies in the Ozark Plateaus aquifer system are steel-cased through the Pennsylvanian to prevent fl uids and natural gas from entering the well in the upper part of the boreholes. Below the casing and down to total depth, wells are completed as open boreholes from which water is produced. Five of the monitored wells tap supplies in the Ozark aquifer, and three tap supplies in both the Springfi eld Plateau and the Ozark aquifers (referred to in this paper as multi-aquifer wells). Of the three multi-aquifer wells, the older Weir city well potentially taps minor sources of water in the overlying Pennsylvanian rocks in addition to the Springfi eld Plateau and Ozark aquifers. Water samples were collected in 500-mL polyethylene bottles after the well had been pumped for at least 15 minutes, or after the specifi c conductance and temperature had stabilized. If the well was running on arrival at the site, the water-supply operator was queried to obtain an estimate of how long the well had been pumping. Most of the time the well had been running for at least one hour prior to sampling. Some of the wells could not be sampled every month because of restrictions on the amount of water that could be pumped or mechanical problems. Temperature, pH, and specifi c conductance were measured at the time of sampling. Samples were kept in an ice-chest after collection and later transferred to a refrigerator in the Analytical Services laboratory at the Kansas Geological Survey (KGS).
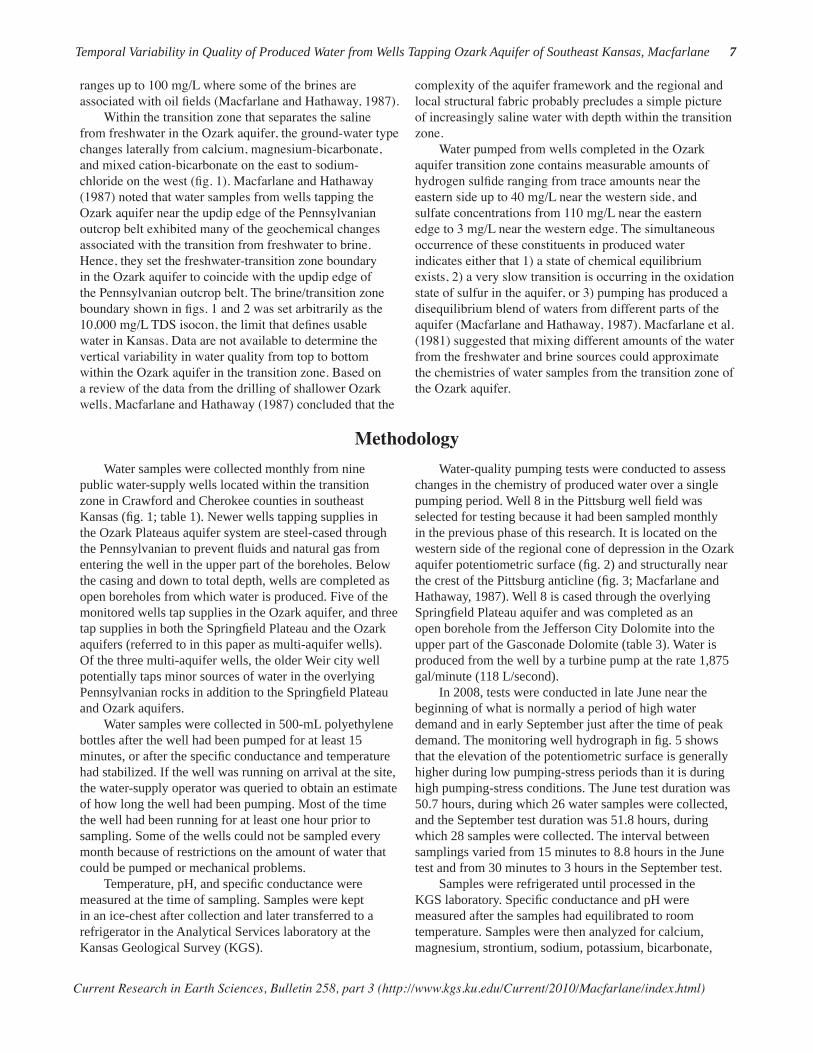
Water-quality pumping tests were conducted to assess changes in the chemistry of produced water over a single pumping period. Well 8 in the Pittsburg well fi eld was selected for testing because it had been sampled monthly in the previous phase of this research. It is located on the western side of the regional cone of depression in the Ozark aquifer potentiometric surface (fi g. 2) and structurally near the crest of the Pittsburg anticline (fi g. 3; Macfarlane and Hathaway, 1987). Well 8 is cased through the overlying Springfi eld Plateau aquifer and was completed as an open borehole from the Jefferson City Dolomite into the upper part of the Gasconade Dolomite (table 3). Water is produced from the well by a turbine pump at the rate 1,875 gal/minute (118 L/second). In 2008, tests were conducted in late June near the beginning of what is normally a period of high water demand and in early September just after the time of peak demand. The monitoring well hydrograph in fi g. 5 shows that the elevation of the potentiometric surface is generally higher during low pumping-stress periods than it is during high pumping-stress conditions. The June test duration was 50.7 hours, during which 26 water samples were collected, and the September test duration was 51.8 hours, during which 28 samples were collected. The interval between samplings varied from 15 minutes to 8.8 hours in the June test and from 30 minutes to 3 hours in the September test. Samples were refrigerated until processed in the KGS laboratory. Specifi c conductance and pH were measured after the samples had equilibrated to room temperature. Samples were then analyzed for calcium, magnesium, strontium, sodium, potassium, bicarbonate,

Current Research in Earth Sciences, Bulletin 258, part 3 (http://www.kgs.ku.edu/Current/2010/Macfarlane/index.html)
Temporal Variability in Quality of Produced Water from Wells Tapping Ozark Aquifer of Southeast Kansas, Macfarlane 8
TABLE 3—Bedrock and hydrostratigraphic units in the study area modifi ed from Jorgensen et al. (1993).
System/Subsystem Series Rock Unit Hydrostratigraphic Unit
Pennsylvanian Middle Pennsylvanian Marmaton GroupCherokee Group
confi ning unit
Mississippian Undifferentiated
-
Oza
rk P
late
aus A
quife
r Sys
tem
Springfi eld Plateau aquiferNorthview Shale
Compton Limestoneconfi ning unit
Ordovician Lower OrdovicianJefferson City DolomiteRoubidoux FormationGasconade Dolomite
Ozark aquifer
Cambrian Upper Cambrian
Eminence DolomitePotosi Formation
Derby and Doe Run Dolomites confi ning unit
Bonneterre DolomiteLamotte Sandstone
St. Francois aquifer
Precambrian - - confi ning unit
sulfate, and chloride. Anion analyses were performed using ion chromatography with a Dionex ICS-3000 and cation concentrations were measured using a Jarrel–Ash ICP. Prior to analysis, samples processed for the Dionex and the Jarrel–Ash were passed through 0.2-micron and 0.45-micron fi lters, respectively. Bicarbonate was determined using an automated titrimeter. Most of the analytical results are within 2% of electrical balance based on milliequivalent/liter (meq/L) values, and all of the analyses are within 5% of balance. TDS concentration was calculated by summing the major and minor constituent concentrations. In the TDS calculation, the bicarbonate concentration was multiplied by 49.17% to approximate the amount of carbonate that would be left in the residual solids after evaporating to dryness. The analytical results are in tables 4–15. Water-type classifi cation is based on whether the percent meq/L contributions of individual dissolved cations and anions exceed 50% of the total meq/L concentration of cations or anions. Waters in which none of the constituent concentrations exceed 50% of the total cations or anions were classifi ed as mixed. Graphical displays of the concentration data were used to explore spatial and temporal relationships and develop mixing relationships between constituents and constituent ratios that represent the contributions of end-member ground waters of differing chemistry to the produced waters sampled in this project. The diamond-shaped fi eld of the Piper diagram (Piper, 1944) was modifi ed by rotation
of the coordinate axes 90° to allow for easier plotting and display of the monthly sample data from spreadsheets. Mixing curves are useful for testing the hypothesis that a given water is a mixture of two end-member waters of differing chemistry based on their dissolved constituents. In the case of two end-member mixtures, the relationship between relative amounts and observed end-member concentrations and the mix in a water sample can be expressed as a mass balance equation (Hem, 1985):
C1V1 + C2V2 = C3(V1 + V2), (1) where C1 and C2, and V1 and V2, are the constituent concentrations and the volumes from sources 1 and 2, respectively, and C3 and (V1 + V2) are the constituent concentration and the volume of water produced at the well. In the case of relative contributions, the quantity (V1 + V2) is equal to 1, and V1 and V2 are volume fractions. Monthly pumpage data could not be obtained for most of the wells sampled because of the manner in which water withdrawals are tabulated by the water utilities. Some of the utilities rely on sources of both ground water from the Ozark Plateau aquifer system and surface water from Bone Creek Reservoir in Crawford County. Thus, it is diffi cult to quantify withdrawals from individual wells. However, on the basis of the types of pumps, the pumping rate, and frequency of use information, it is likely that Pittsburg 8 and Girard 3 are used more heavily than any of the other wells in this study.
Current Research in Earth Sciences, Bulletin 258, part 3 (http://www.kgs.ku.edu/Current/2010/Macfarlane/index.html)
Temporal Variability in Quality of Produced Water from Wells Tapping Ozark Aquifer of Southeast Kansas, Macfarlane 9
FIGURE 5—(A) Aerial photograph showing the location of the observation well (from which the hydrograph in B was generated) in relation to wells 8 and 10 in the city of Pittsburg, Kansas, fi eld. (B) Hydrograph of the monitoring well completed in the Ozark aquifer in the Pittsburg well fi eld showing depth to water from land surface. The arrows indicate the approximate start time of each chemical-quality pumping test.
Current Research in Earth Sciences, Bulletin 258, part 3 (http://www.kgs.ku.edu/Current/2010/Macfarlane/index.html)
Temporal Variability in Quality of Produced Water from Wells Tapping Ozark Aquifer of Southeast Kansas, Macfarlane 10
Results
Monthly Sampling
The overall trend in the 2006–08 monthly samples from the Ozark and multi-aquifer wells collected during the study refl ects spatial and temporal changes in water type across the Ozark transition zone described in Macfarlane and Hathaway (1987) from the 1979–1980 sampling events in the Tri-state region (tables 2, 4–13; fi g. 6). Water samples from Pittsburg 8 and 10 and Crawford RWD 4 well 3 in the Ozark aquifer are a mixed cation-bicarbonate type with a TDS range of 478–551 mg/L. In contrast, water samples from the Cherokee County RWD 3 well 1 in the Ozark aquifer are a sodium-chloride type with a TDS range of 541–644 mg/L. In between these chemistries, water samples from Crawford Consolidated RWD 1 well 2 and Girard 3 fall into the mixed cation-mixed anion classifi cation. TDS concentration ranges from 639–674 mg/L and 663–721 mg/L for the samples collected from Girard 3 and Crawford Consolidated RWD 1 well 2, respectively. The Crawford RWD 5 well 1 and the Weir city well are both multi-aquifer wells. Samples from Crawford RWD 5 well 1 are a mixed cation-bicarbonate type with a TDS range of 516–566 mg/L. Samples from the Weir city well are a mixed cation-bicarbonate type and range from more sodium rich to more calcium and magnesium rich with a TDS range of 396–497 mg/L. In contrast, the water type in the samples from another multi-aquifer well, Columbus 4, varies from a mixed cation-bicarbonate to a sodium-bicarbonate type with a TDS range of 466–617 mg/L. However, points on fi g. 6 for the Columbus well 4 samples with higher bicarbonate and lower sulfate and chloride percentages fall within the ranges of bicarbonate
and sulfate and chloride percentages for the other two multi-aquifer wells. Some of the monthly data sets exhibit linear trends on the modifi ed Piper diagram in fi g. 6, while others do not. Vertical trends in the data on fi g. 6 for Pittsburg well 8, Crawford Consolidated RWD 1 well 2, and Crawford RWD 4 well 3 indicate that fl uctuations in water quality could be primarily attributed to changes in the relative proportions of bicarbonate to sulfate + chloride concentrations in the water from one monthly sampling to the next. The linear trend in the data for Columbus well 4 indicates fl uctuations in the relative proportions of both cations and anions, and the horizontal trend in the data for the Weir city well indicates primarily variations in the relative proportions of calcium + magnesium to sodium + potassium. Calcium/magnesium equivalent ratios of waters from all the monitored wells range from about 1.2 to 1.4.
Changes in Water Quality1979–1980 to 2006–08
Six wells that were sampled for water quality in 1979–1980 (table 2) were included in the 2006–08 monthly sampling events (fi gs. 7–10). Comparison of the Crawford County water analyses from the 2006–08 events with those from 1979–1980 indicates signifi cant changes in the quality and chloride concentrations of water produced by Pittsburg well 10 and Crawford Consolidated RWD No. 1 well 2. These wells are located within a regional cone of depression in the Ozark aquifer potentiometric surface (fi g. 2; Macfarlane and Hathaway, 1987; Gillip et al., 2007).
Water Supply Well Water Type TDS ConcentrationRange (mg/L)
Number of Samples
Cherokee RWD 3 well 1
Sodium-chloride 541–644 20
Columbus well 4 Mixed cation-bicarbonate to sodium-bicarbonate
466–617 19
Crawford Consolidated RWD 1 well 2
Mixed cation-mixed anion 663–721 20
Crawford RWD 4 well 3
Mixed cation-bicarbonate 478–534 20
Crawford RWD 5 well 1
Mixed cation-bicarbonate 516–566 20
Girard 3 Mixed cation-mixed anion 639–674 20
Pittsburg 8 Mixed cation-bicarbonate 481–551 16
Pittsburg 10 Mixed cation-bicarbonate 516–545 3
Weir Mixed cation-bicarbonate 396–497 18
TABLE 4—Water type and TDS concentration range for each of the nine wells sampled monthly from 2006–08.

Current Research in Earth Sciences, Bulletin 258, part 3 (http://www.kgs.ku.edu/Current/2010/Macfarlane/index.html)
Temporal Variability in Quality of Produced Water from Wells Tapping Ozark Aquifer of Southeast Kansas, Macfarlane 11
FIGURE 6—Plot of chemical data for the 2006–08 monthly series of water sampling events from the nine wells and for samples from downgradient wells with >500 mg/L chloride concentration and for upgradient and downgradient wells sampled in 1980 from Crawford and Cherokee counties on a modifi ed Piper diagram. See Appendix 3 in Macfarlane and Hathaway (1987) for a complete tabulation of the sample analysis data from the upgradient and downgradient wells.
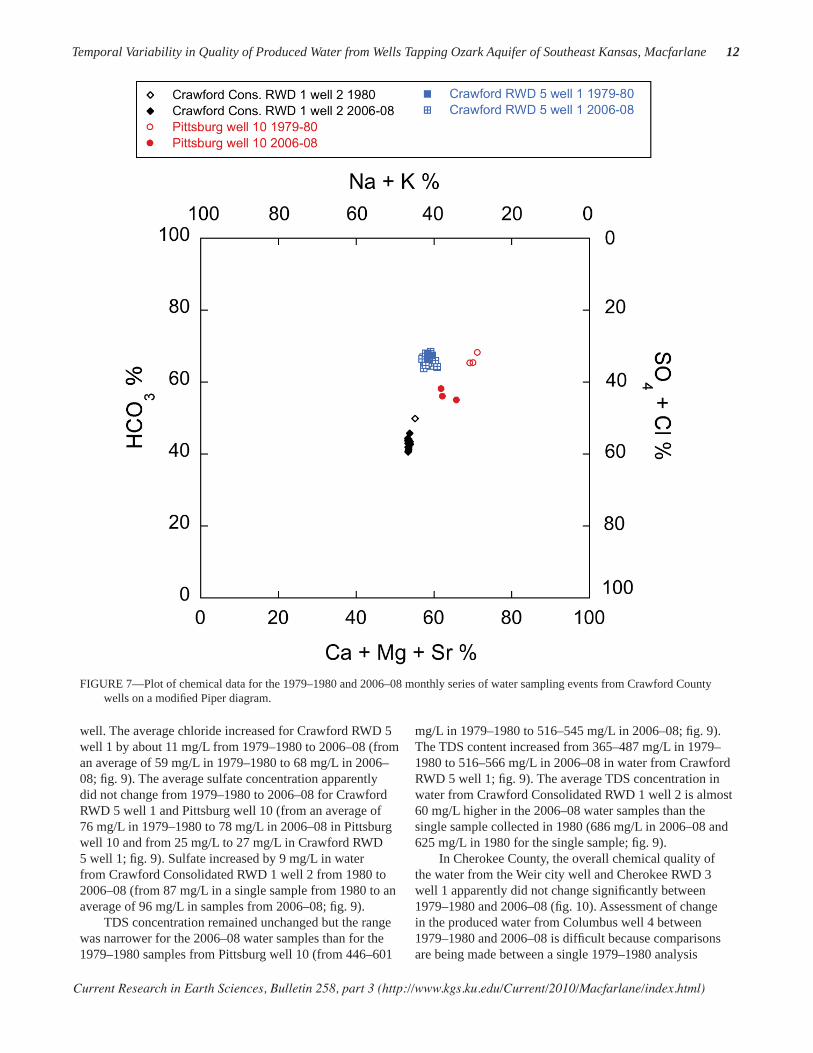
The analyses of water from the Crawford County Consolidated RWD No. 1 well 2 and Pittsburg well 10 (fi g. 7) reveal slight changes in the relative amounts of calcium + magnesium + strontium and sodium + potassium but an increase in the relative amount of sulfate + chloride that is more pronounced. In all cases the chloride generally increased more than the sulfate concentration (fi g. 9). The
average chloride concentration increased by about 50 mg/L from 1979–1980 to 2006–08 in water from both wells (from 40 to 90.7 mg/L for Pittsburg well 10 and 135 mg/L for a single sample from Crawford Consolidated RWD 1 well 2 in 1980 to 180 mg/L in 2006–08; fi g. 9). However, this increase represented a doubling of chloride for the Pittsburg well but only about a 37% increase for the RWD
Current Research in Earth Sciences, Bulletin 258, part 3 (http://www.kgs.ku.edu/Current/2010/Macfarlane/index.html)
Temporal Variability in Quality of Produced Water from Wells Tapping Ozark Aquifer of Southeast Kansas, Macfarlane 12
FIGURE 7—Plot of chemical data for the 1979–1980 and 2006–08 monthly series of water sampling events from Crawford County wells on a modifi ed Piper diagram.
well. The average chloride increased for Crawford RWD 5 well 1 by about 11 mg/L from 1979–1980 to 2006–08 (from an average of 59 mg/L in 1979–1980 to 68 mg/L in 2006–08; fi g. 9). The average sulfate concentration apparently did not change from 1979–1980 to 2006–08 for Crawford RWD 5 well 1 and Pittsburg well 10 (from an average of 76 mg/L in 1979–1980 to 78 mg/L in 2006–08 in Pittsburg well 10 and from 25 mg/L to 27 mg/L in Crawford RWD 5 well 1; fi g. 9). Sulfate increased by 9 mg/L in water from Crawford Consolidated RWD 1 well 2 from 1980 to 2006–08 (from 87 mg/L in a single sample from 1980 to an average of 96 mg/L in samples from 2006–08; fi g. 9). TDS concentration remained unchanged but the range was narrower for the 2006–08 water samples than for the 1979–1980 samples from Pittsburg well 10 (from 446–601
mg/L in 1979–1980 to 516–545 mg/L in 2006–08; fi g. 9). The TDS content increased from 365–487 mg/L in 1979–1980 to 516–566 mg/L in 2006–08 in water from Crawford RWD 5 well 1; fi g. 9). The average TDS concentration in water from Crawford Consolidated RWD 1 well 2 is almost 60 mg/L higher in the 2006–08 water samples than the single sample collected in 1980 (686 mg/L in 2006–08 and 625 mg/L in 1980 for the single sample; fi g. 9). In Cherokee County, the overall chemical quality of the water from the Weir city well and Cherokee RWD 3 well 1 apparently did not change signifi cantly between 1979–1980 and 2006–08 (fi g. 10). Assessment of change in the produced water from Columbus well 4 between 1979–1980 and 2006–08 is diffi cult because comparisons are being made between a single 1979–1980 analysis

Current Research in Earth Sciences, Bulletin 258, part 3 (http://www.kgs.ku.edu/Current/2010/Macfarlane/index.html)
Temporal Variability in Quality of Produced Water from Wells Tapping Ozark Aquifer of Southeast Kansas, Macfarlane 13
Date Sampled
Sp. Con. (μS/cm) pH
TDS(mg/L)
Ca(mg/L)
Mg(mg/L)
Na(mg/L)
K(mg/L)
Sr(mg/L)
HCO3(mg/L)
SO4(mg/L)
Cl(mg/L)
4/13/06 1081 7.60 590 44.4 21.9 136 7.5 1.32 220 39.6 2115/15/06 1040 7.40 572 46.3 22.2 134 6.4 1.26 216 45.5 1996/15/06 1010 7.45 559 45.9 22.3 130 6.2 1.21 212 43.2 1957/13/06 1067 7.83 578 45.5 22.2 136 6.8 1.32 221 36.8 2098/15/06 1140 8.00 592 44.1 21.8 142 8.3 1.38 224 42.7 2109/19/06 1052 8.10 570 45.7 22.1 129 5.6 1.19 219 44.8 203
10/16/06 1021 7.52 562 46.8 22.5 133 6.0 1.31 209 40.0 19811/21/06 1051 7.80 583 46.1 22.7 134 6.3 1.27 214 46.8 20912/19/06 1011 8.00 564 46.5 22.6 129 5.8 1.19 213 42.9 2001/26/07 1072 7.80 598 45.3 22.1 144 7.1 1.36 223 38.4 2193/20/07 1137 7.90 618 46.0 22.5 149 6.7 1.30 239 47.2 2174/1/07 1159 7.80 641 44.5 22.3 161 7.2 1.44 263 42.8 222
5/15/07 1163 7.95 644 47.2 22.8 152 7.3 1.50 243 47.5 2356/1/07 1036 7.80 573 46.8 22.3 133 6.1 1.28 215 43.4 2058/1/07 1031 7.34 558 47.8 22.8 129 6.0 1.24 210 44.5 193
10/1/07 1085 7.65 591 47.5 22.5 137 6.8 1.37 224 42.7 21112/1/07 1145 7.90 545 49.5 23.4 129 6.0 1.23 211 31.9 189.1/04/08 931 7.40 585 45.3 21.9 138 6.6 1.33 233 47.3 2001/25/08 1015 7.41 571 46.8 22.7 131 6.1 1.25 222 41.9 2012/28/08 1044 7.29 541 47.6 22.7 136 6.4 1.32 176 34.2 195
TABLE 5—Chemical analyses of the monthly 2006–08 samples collected from Cherokee RWD 3 well 1.
TABLE 6—Chemical analyses of the monthly 2006–08 samples collected from Columbus well 4.
Date Sampled
Sp. Con. (μS/cm) pH
TDS(mg/L)
Ca(mg/L)
Mg(mg/L)
Na(mg/L)
K(mg/L)
Sr(mg/L)
HCO3(mg/L)
SO4(mg/L)
Cl(mg/L)
4/13/06 828 7.73 487 48.3 24.6 93.5 6.6 1.37 356 57.6 63.25/15/06 796 7.62 491 49.1 24.8 91.8 5.7 1.35 361 69.7 59.16/15/06 789 7.66 477 48.5 24.2 91.4 6.0 1.36 362 53.3 62.58/15/06 966 8.00 574 53.3 26.9 122 7.3 1.50 350 52.6 1269/19/06 872 7.85 519 50.6 24.9 102 5.8 1.45 357 61.8 85.1
10/16/06 904 7.52 536 53.2 26.3 110 6.2 1.53 354 59.1 93.211/21/06 982 7.70 579 52.8 26.4 122 7.0 1.49 361 62.7 11712/19/06 726 7.65 473 47.9 25.0 91.8 5.5 1.32 363 46.9 64.41/26/07 866 7.85 512 50.5 25.1 104 6.5 1.40 364 46.5 86.53/19/07 886 7.95 496 51.5 24.9 97 5.7 1.30 366 55.5 69.14/1/07 1037 7.80 594 54.8 27.0 127 6.6 1.59 356 54.5 1366/1/07 815 7.70 470 50.1 24.9 91.0 5.2 1.38 362 47.0 61.48/1/07 980 7.20 573 53.6 25.7 121 7.0 1.54 361 66.3 108
10/1/07 1096 7.56 617 57.4 27.5 134 7.6 1.65 353 62.3 14112/1/07 1102 7.58 612 55.0 27.2 137 7.0 1.59 364 54.6 1401/04/08 787 7.45 530 52.0 25.4 111 6.8 1.48 362 54.7 88.81/25/08 776 7.62 466 48.7 24.6 94.4 5.7 1.37 374 39.3 56.02/28/08 806 7.42 469 50.8 24.8 94.9 6.2 1.44 359 43.0 59.45/15/08 829 7.75 484 51.6 25.3 93.3 5.4 1.41 361 55.1 62.3
Current Research in Earth Sciences, Bulletin 258, part 3 (http://www.kgs.ku.edu/Current/2010/Macfarlane/index.html)
Temporal Variability in Quality of Produced Water from Wells Tapping Ozark Aquifer of Southeast Kansas, Macfarlane 14
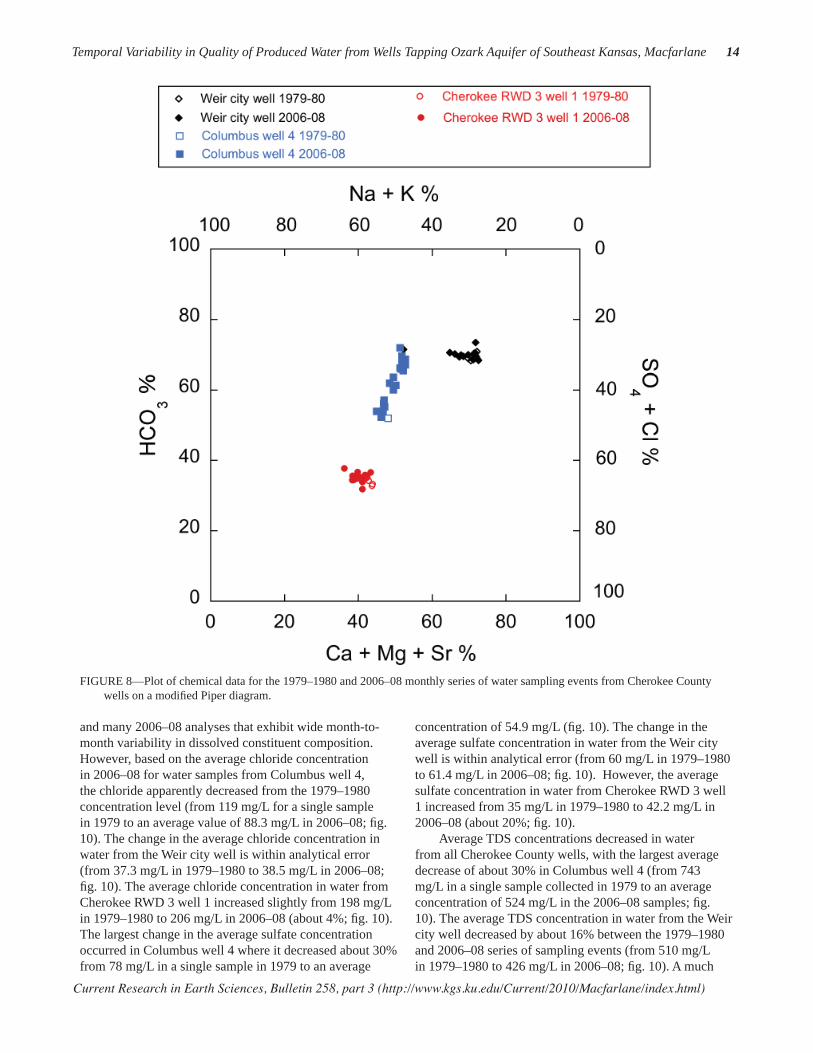
FIGURE 8—Plot of chemical data for the 1979–1980 and 2006–08 monthly series of water sampling events from Cherokee County wells on a modifi ed Piper diagram.
and many 2006–08 analyses that exhibit wide month-to-month variability in dissolved constituent composition. However, based on the average chloride concentration in 2006–08 for water samples from Columbus well 4, the chloride apparently decreased from the 1979–1980 concentration level (from 119 mg/L for a single sample in 1979 to an average value of 88.3 mg/L in 2006–08; fi g. 10). The change in the average chloride concentration in water from the Weir city well is within analytical error (from 37.3 mg/L in 1979–1980 to 38.5 mg/L in 2006–08; fi g. 10). The average chloride concentration in water from Cherokee RWD 3 well 1 increased slightly from 198 mg/L in 1979–1980 to 206 mg/L in 2006–08 (about 4%; fi g. 10). The largest change in the average sulfate concentration occurred in Columbus well 4 where it decreased about 30% from 78 mg/L in a single sample in 1979 to an average
concentration of 54.9 mg/L (fi g. 10). The change in the average sulfate concentration in water from the Weir city well is within analytical error (from 60 mg/L in 1979–1980 to 61.4 mg/L in 2006–08; fi g. 10). However, the average sulfate concentration in water from Cherokee RWD 3 well 1 increased from 35 mg/L in 1979–1980 to 42.2 mg/L in 2006–08 (about 20%; fi g. 10). Average TDS concentrations decreased in water from all Cherokee County wells, with the largest average decrease of about 30% in Columbus well 4 (from 743 mg/L in a single sample collected in 1979 to an average concentration of 524 mg/L in the 2006–08 samples; fi g. 10). The average TDS concentration in water from the Weir city well decreased by about 16% between the 1979–1980 and 2006–08 series of sampling events (from 510 mg/L in 1979–1980 to 426 mg/L in 2006–08; fi g. 10). A much

Current Research in Earth Sciences, Bulletin 258, part 3 (http://www.kgs.ku.edu/Current/2010/Macfarlane/index.html)
Temporal Variability in Quality of Produced Water from Wells Tapping Ozark Aquifer of Southeast Kansas, Macfarlane 15
TABLE 7—Chemical analyses of the monthly 2006–08 samples collected from Crawford RWD 4 well 3.
Date Sampled
Sp. Con. (μS/cm) pH
TDS(mg/L)
Ca(mg/L)
Mg(mg/L)
Na(mg/L)
K(mg/L)
Sr(mg/L)
HCO3(mg/L)
SO4(mg/L)
Cl(mg/L)
4/13/06 917 7.32 511 64.9 31.0 78.1 9.9 1.15 337 72.9 86.25/15/06 907 7.41 534 68.4 32.2 80.6 7.7 1.22 332 80.2 99.36/15/06 886 7.25 508 67.8 31.7 79.9 6.7 1.20 329 80.0 78.47/13/06 905 7.46 506 64.0 30.5 76.0 7.1 1.13 335 79.8 82.08/15/06 910 7.75 514 65.7 32.1 78.0 6.6 1.14 329 83.2 84.89/19/06 919 7.95 522 66.5 31.6 78.5 5.7 1.17 333 88.8 85.1
10/16/06 892 7.53 505 67.6 31.9 79.5 5.6 1.19 327 76.6 80.911/20/06 918 7.45 524 66.2 31.5 78.4 5.7 1.17 333 88.7 87.712/18/06 912 7.55 518 67.2 33.0 79.2 6.3 1.17 335 81.9 83.71/25/07 901 7.45 517 68.3 31.9 80.5 6.5 1.19 330 79.5 85.63/19/07 916 7.60 519 68.1 31.2 79.6 6.4 1.10 334 80.9 86.84/1/07 914 7.50 511 66.8 31.5 77.8 6.0 1.21 334 75.5 86.7
5/14/07 958 7.45 512 67.7 31.5 78.8 6.2 1.22 331 77.2 85.46/1/07 908 7.45 519 67.3 30.8 78.7 6.3 1.19 331 85.5 85.68/1/07 907 6.97 518 68.3 31.5 80.5 6.7 1.22 334 83.0 81.5
10/1/07 1319 7.26 517 68.2 31.4 80.4 6.6 1.21 337 79.4 83.112/1/07 925 7.21 504 71.2 33.6 83.2 6.7 1.26 336 60.8 81.41/04/08 773 7.13 515 68.0 29.7 80.1 6.5 1.18 334 83.6 80.41/25/08 875 7.16 513 67.8 31.0 80.1 6.5 1.20 331 77.8 84.52/27/08 893 6.82 478 67.9 31.5 80.4 6.7 1.21 337 58.9 64.7
Date Sampled
Sp. Con. (μS/cm) pH
TDS(mg/L)
Ca(mg/L)
Mg(mg/L)
Na(mg/L)
K(mg/L)
Sr(mg/L)
HCO3(mg/L)
SO4(mg/L)
Cl(mg/L)
4/13/06 680 7.62 545 46.9 21.0 66.7 4.3 0.64 291 26.7 69.75/15/06 665 7.54 531 47.1 20.8 63.7 4.3 0.63 287 32.1 65.06/15/06 660 7.40 538 46.9 21.0 65.5 4.0 0.64 290 26.1 73.47/13/06 680 7.70 516 48.4 21.3 59.7 3.8 0.62 275 29.4 67.38/15/06 651 7.90 520 47.1 21.2 61.0 4.2 0.61 279 27.9 68.59/19/06 709 7.95 538 47.0 20.7 64.2 3.4 0.63 293 32.0 67.1
10/16/06 662 7.42 523 49.4 21.5 61.1 3.2 0.63 279 31.3 66.811/20/06 692 7.60 556 48.0 21.6 69.3 3.9 0.66 296 30.8 74.712/18/06 682 7.80 540 46.4 21.0 66.9 4.0 0.64 295 29.2 66.31/25/07 684 7.65 544 47.0 21.7 68.5 4.0 0.64 296 18.6 77.23/19/07 691 7.80 541 47.1 20.9 66.8 4.1 0.60 293 31.4 66.84/1/07 675 7.60 525 49.0 21.9 62.3 3.6 0.64 286 22.4 69.0
5/14/07 705 7.75 535 48.4 21.2 67.6 3.9 0.67 285 31.1 67.66/1/07 694 8.00 541 49.2 21.6 70.7 4.0 0.69 296 19.2 70.68/1/07 685 7.16 546 48.0 21.1 69.6 4.2 0.68 297 31.1 64.2
10/1/07 686 7.45 566 48.9 22.4 65.9 3.9 0.64 319 29.5 65.612/1/07 692 7.51 534 49.7 21.7 69.3 4.1 0.68 293 22.5 63.41/04/08 579 7.22 525 48.0 20.9 65.7 3.8 0.65 285 29.1 62.91/25/08 654 7.28 527 48.5 21.4 65.8 3.8 0.66 292 22.9 63.42/27/08 660 7.10 522 48.4 21.3 64.0 4.0 0.64 290 22.8 60.9
TABLE 8—Chemical analyses of the monthly 2006–08 samples collected from Crawford RWD 5 well 1.

Current Research in Earth Sciences, Bulletin 258, part 3 (http://www.kgs.ku.edu/Current/2010/Macfarlane/index.html)
Temporal Variability in Quality of Produced Water from Wells Tapping Ozark Aquifer of Southeast Kansas, Macfarlane 16
FIGURE 9—Box plot comparing the chloride, sulfate, and TDS concentrations of the 1979–1980 and 2006–08 water samples from wells in Crawford County.
smaller decrease in TDS concentration occurred in water from Cherokee RWD 3 well 1 from 594 mg/L in 1979–1980 to 582 mg/L from 2006–08 (fi g. 10). In general, the temporal chemical variations in water from individual wells represented on fi gs. 6–8 are smaller than the spatial chemical differences in water from the various wells. The grouping of all of the Ozark aquifer wells in southeast Kansas for which points are plotted on these fi gures is substantially different from the grouping of the sodium-bicarbonate type waters for wells in the Springfi eld Plateaus aquifer and of the sodium-chloride brines just to the west. Figure 6 includes points for waters from the Ozark Plateaus aquifer in Crawford and Cherokee counties that contained >500 mg/L when sampled during 1980; these points illustrate the trend towards lower bicarbonate and combined divalent cation (calcium, magnesium, and strontium) percentages and higher chloride and sulfate and monovalent cation (sodium and potassium) percentages. The points for these saline waters, Cherokee RWD 3 well 1, and Columbus 4 form a trend representing the mixing of ground water substantially affected by the Na-Cl type brine with freshwater of mixed cation-bicarbonate type. The group of points for the other wells in fi g. 6 sampled in 2006–08 form a general trend of mixed cation-bicarbonate type waters with generally decreasing sodium and chloride concentrations that parallels the trend for the saline ground waters to Cherokee RWD 3 well 1 and Columbus well 4 freshwaters, but that is shifted to higher divalent cation percentages.
Chemical Quality Pumping Tests
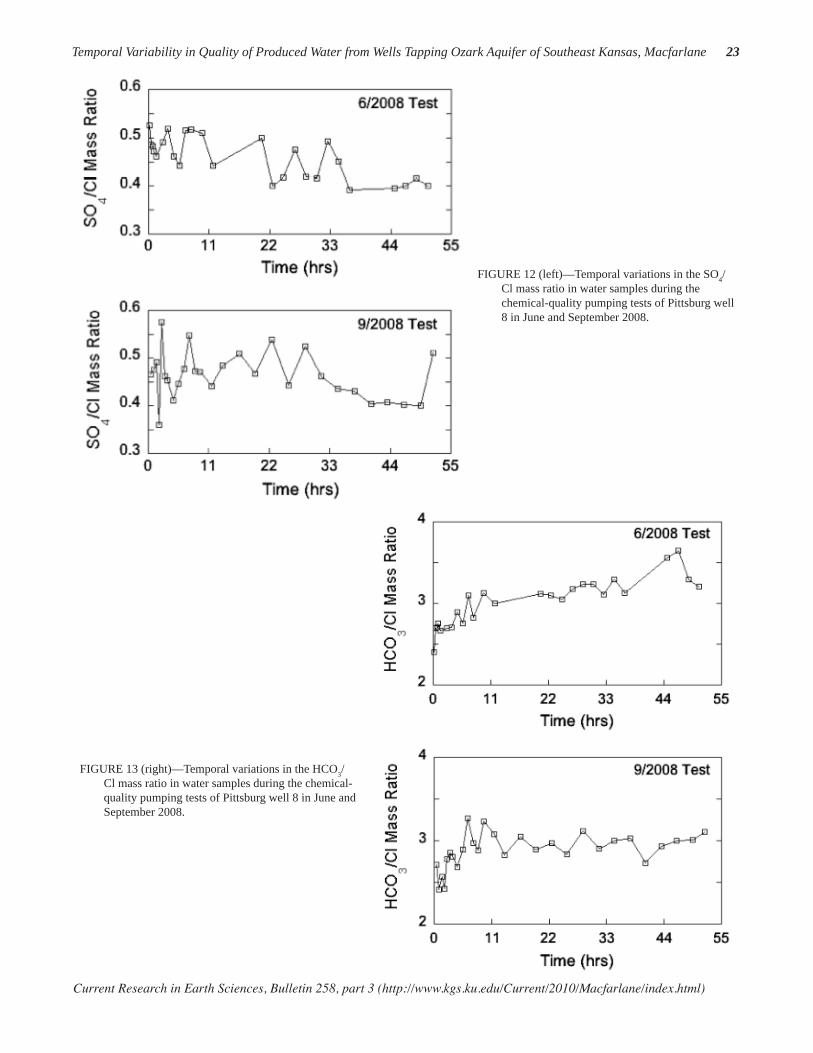
Calcium, magnesium, sodium, and potassium concentrations decreased slowly with time in the June and September 2008 chemical-quality pumping tests for Pittsburg well 8 (fi g. 11). In about the fi rst 10 hours of both tests, the calcium/magnesium equivalent ratio fl uctuated and then stabilized at approximately 1.34 until the end of the test. The bicarbonate concentration remained around 319 mg/L ± 6 mg/L and 318 mg/L ± 2 mg/L throughout the June and September tests, respectively. In the June test, the chloride and sulfate concentrations both generally decreased rapidly in the early part and then more gradually later in the test. In the September test, the chloride decreased during the fi rst 10 hours of pumping and then leveled off at approximately 105 mg/L with some small fl uctuation for the remainder of the test, while sulfate decreased slowly throughout the test. In both tests, the sulfate/chloride mass ratio trended towards lower values over time (fi g. 12). In the June test, the sulfate/chloride ratio was in the range of 0.5 at the beginning of the test, but, in the September test, that ratio was somewhat less than 0.5 for most of the early part of that test. The bicarbonate/chloride mass ratio increased throughout the pumping period in the June test, but, in the September test, the ratio increased only during the fi rst 10 hours and then
A
B
C

Current Research in Earth Sciences, Bulletin 258, part 3 (http://www.kgs.ku.edu/Current/2010/Macfarlane/index.html)
Temporal Variability in Quality of Produced Water from Wells Tapping Ozark Aquifer of Southeast Kansas, Macfarlane 17
TABLE 9—Chemical analyses of the monthly 2006–08 samples collected from Crawford Consolidated RWD 1 well 2.
Date Sampled
Sp. Con. (μS/cm) pH
TDS(mg/L)
Ca(mg/L)
Mg(mg/L)
Na(mg/L)
K(mg/L)
Sr(mg/L)
HCO3(mg/L)
SO4(mg/L)
Cl(mg/L)
4/13/06 1247 6.97 684 74.8 34.8 130 6.1 1.51 331 97.6 1765/15/06 1247 7.06 686 76.1 35.2 128 7.4 1.48 323 99.9 1786/15/06 1248 7.24 663 75.8 35.3 130 7.9 1.49 291 89.8 1797/13/06 1233 7.31 689 75.3 35.2 129 7.5 1.48 334 91.1 1848/15/06 1188 7.50 677 75.3 34.6 128 6.8 1.47 326 89.3 1819/19/06 1229 7.50 688 74.3 34.8 127 6.7 1.46 325 106 177
10/16/06 1211 7.24 676 75.8 35.5 129 6.8 1.49 323 92.1 17611/20/06 1250 7.30 679 74.0 34.5 127 6.9 1.45 326 96.5 17812/18/06 1136 7.45 708 76.6 35.4 131 7.0 1.50 330 102 1911/25/07 1223 7.30 682 75.6 34.6 130 7.4 1.45 324 90.5 1833/19/07 1239 7.45 684 77.0 34.3 130 7.2 1.50 330 97.0 1744/1/07 1255 7.20 721 77.0 35.3 131 7.1 1.54 334 109 195
5/14/07 1270 7.35 694 76.7 35.3 132 7.0 1.55 321 92.9 1906/1/07 1137 7.35 680 77.6 35.1 132 7.1 1.56 328 89.4 1768/1/07 1225 6.87 695 77.6 35.0 132 7.4 1.57 334 101 175
10/1/07 1245 6.93 681 74.6 34.1 125 7.0 1.49 327 97.8 18012/1/07 1261 7.18 672 78.2 36.0 132 7.4 1.57 336 74.7 1761/04/08 1055 7.09 676 77.6 35.6 133 7.5 1.56 294 101 1751/25/08 1195 7.06 704 77.6 35.5 132 7.1 1.55 332 102 1832/27/08 1221 6.60 690 77.8 35.4 133 7.5 1.56 335 95.9 174
Date Sampled
Sp. Con. (μS/cm) pH
TDS(mg/L)
Ca(mg/L)
Mg(mg/L)
Na(mg/L)
K(mg/L)
Sr(mg/L)
HCO3(mg/L)
SO4(mg/L)
Cl(mg/L)
4/13/06 1157 7.34 639 71.0 33.0 113 7.4 1.33 323 90.0 1535/15/06 1165 7.48 654 69.9 33.1 118 7.4 1.31 315 88.4 1636/15/06 1112 7.30 674 72.9 32.9 113 7.3 1.36 314 99.0 1537/13/06 1171 7.47 661 74.7 34.1 120 7.5 1.34 324 90.7 1648/15/06 1108 7.65 656 72.3 33.2 115 7.2 1.33 313 98.9 1559/19/06 1183 7.19 672 75.9 35.2 118 7.0 1.45 320 101 172
10/16/06 1144 7.62 651 74.4 33.9 118 6.3 1.35 313 95.2 15511/20/06 1189 7.45 655 74.0 33.6 120 6.6 1.33 318 92.8 16912/18/06 1145 7.65 656 75.4 34.9 121 7.0 1.38 320 97.2 1791/25/07 1184 7.60 661 75.5 33.2 122 6.9 1.33 314 92.1 1753/19/07 1181 7.80 673 75.7 33.1 120 6.8 1.30 320 95.6 1654/1/07 1164 7.45 663 77.6 34.0 122 7.1 1.43 319 109 164
5/14/07 1221 7.60 639 75.3 34.1 123 6.5 1.39 309 90.2 1686/1/07 1176 7.60 654 76.2 33.6 121 6.7 1.39 315 94.5 1658/1/07 1162 6.95 654 76.1 34.1 122 7.0 1.43 320 96.9 160
10/1/07 1199 7.14 656 75.0 33.3 119 6.7 1.35 321 95.2 17210/1/07 1204 7.20 639 76.5 34.3 124 6.9 1.39 322 96.5 17410/1/07 1157 7.09 654 77.0 34.1 119 7.1 1.44 326 102 16112/1/07 1203 7.33 674 78.9 35.2 124 7.0 1.43 321 68.9 1641/04/08 991 7.30 661 76.4 34.0 120 7.0 1.40 319 99.3 1591/25/08 1116 7.28 656 74.9 33.7 117 6.8 1.40 321 101 1602/27/08 1164 6.97 672 76.1 33.7 123 7.0 1.39 321 94.7 161
TABLE 10—Chemical analyses of the monthly 2006–08 and other samples collected from Girard well 3.
Current Research in Earth Sciences, Bulletin 258, part 3 (http://www.kgs.ku.edu/Current/2010/Macfarlane/index.html)
Temporal Variability in Quality of Produced Water from Wells Tapping Ozark Aquifer of Southeast Kansas, Macfarlane 18
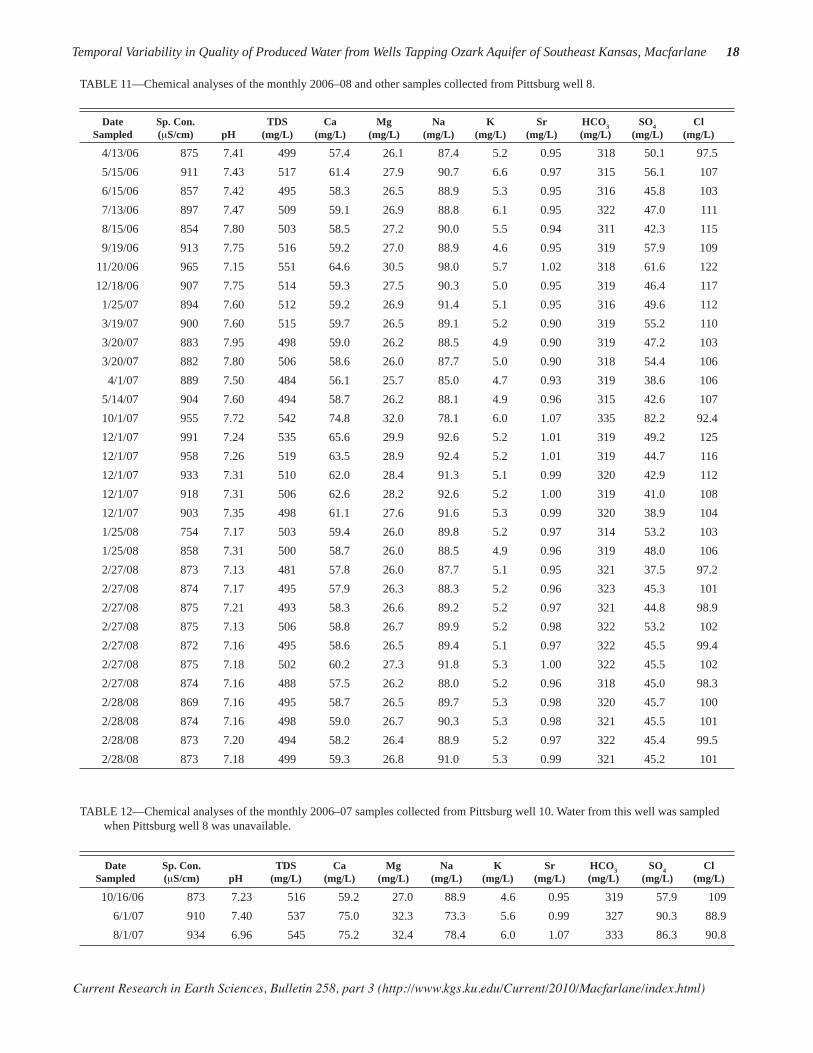
TABLE 11—Chemical analyses of the monthly 2006–08 and other samples collected from Pittsburg well 8.
TABLE 12—Chemical analyses of the monthly 2006–07 samples collected from Pittsburg well 10. Water from this well was sampled when Pittsburg well 8 was unavailable.
Date Sampled
Sp. Con. (μS/cm) pH
TDS(mg/L)
Ca(mg/L)
Mg(mg/L)
Na(mg/L)
K(mg/L)
Sr(mg/L)
HCO3(mg/L)
SO4(mg/L)
Cl(mg/L)
4/13/06 875 7.41 499 57.4 26.1 87.4 5.2 0.95 318 50.1 97.55/15/06 911 7.43 517 61.4 27.9 90.7 6.6 0.97 315 56.1 1076/15/06 857 7.42 495 58.3 26.5 88.9 5.3 0.95 316 45.8 1037/13/06 897 7.47 509 59.1 26.9 88.8 6.1 0.95 322 47.0 1118/15/06 854 7.80 503 58.5 27.2 90.0 5.5 0.94 311 42.3 1159/19/06 913 7.75 516 59.2 27.0 88.9 4.6 0.95 319 57.9 109
11/20/06 965 7.15 551 64.6 30.5 98.0 5.7 1.02 318 61.6 12212/18/06 907 7.75 514 59.3 27.5 90.3 5.0 0.95 319 46.4 1171/25/07 894 7.60 512 59.2 26.9 91.4 5.1 0.95 316 49.6 1123/19/07 900 7.60 515 59.7 26.5 89.1 5.2 0.90 319 55.2 1103/20/07 883 7.95 498 59.0 26.2 88.5 4.9 0.90 319 47.2 1033/20/07 882 7.80 506 58.6 26.0 87.7 5.0 0.90 318 54.4 1064/1/07 889 7.50 484 56.1 25.7 85.0 4.7 0.93 319 38.6 106
5/14/07 904 7.60 494 58.7 26.2 88.1 4.9 0.96 315 42.6 10710/1/07 955 7.72 542 74.8 32.0 78.1 6.0 1.07 335 82.2 92.412/1/07 991 7.24 535 65.6 29.9 92.6 5.2 1.01 319 49.2 12512/1/07 958 7.26 519 63.5 28.9 92.4 5.2 1.01 319 44.7 11612/1/07 933 7.31 510 62.0 28.4 91.3 5.1 0.99 320 42.9 11212/1/07 918 7.31 506 62.6 28.2 92.6 5.2 1.00 319 41.0 10812/1/07 903 7.35 498 61.1 27.6 91.6 5.3 0.99 320 38.9 1041/25/08 754 7.17 503 59.4 26.0 89.8 5.2 0.97 314 53.2 1031/25/08 858 7.31 500 58.7 26.0 88.5 4.9 0.96 319 48.0 1062/27/08 873 7.13 481 57.8 26.0 87.7 5.1 0.95 321 37.5 97.22/27/08 874 7.17 495 57.9 26.3 88.3 5.2 0.96 323 45.3 1012/27/08 875 7.21 493 58.3 26.6 89.2 5.2 0.97 321 44.8 98.92/27/08 875 7.13 506 58.8 26.7 89.9 5.2 0.98 322 53.2 1022/27/08 872 7.16 495 58.6 26.5 89.4 5.1 0.97 322 45.5 99.42/27/08 875 7.18 502 60.2 27.3 91.8 5.3 1.00 322 45.5 1022/27/08 874 7.16 488 57.5 26.2 88.0 5.2 0.96 318 45.0 98.32/28/08 869 7.16 495 58.7 26.5 89.7 5.3 0.98 320 45.7 1002/28/08 874 7.16 498 59.0 26.7 90.3 5.3 0.98 321 45.5 1012/28/08 873 7.20 494 58.2 26.4 88.9 5.2 0.97 322 45.4 99.52/28/08 873 7.18 499 59.3 26.8 91.0 5.3 0.99 321 45.2 101
Date Sampled
Sp. Con. (μS/cm) pH
TDS(mg/L)
Ca(mg/L)
Mg(mg/L)
Na(mg/L)
K(mg/L)
Sr(mg/L)
HCO3(mg/L)
SO4(mg/L)
Cl(mg/L)
10/16/06 873 7.23 516 59.2 27.0 88.9 4.6 0.95 319 57.9 1096/1/07 910 7.40 537 75.0 32.3 73.3 5.6 0.99 327 90.3 88.98/1/07 934 6.96 545 75.2 32.4 78.4 6.0 1.07 333 86.3 90.8

Current Research in Earth Sciences, Bulletin 258, part 3 (http://www.kgs.ku.edu/Current/2010/Macfarlane/index.html)
Temporal Variability in Quality of Produced Water from Wells Tapping Ozark Aquifer of Southeast Kansas, Macfarlane 19
FIGURE 10—Box plot comparing the chloride, sulfate, and TDS concentrations of the 1979–1980 and 2006–08 water samples from wells in Cherokee County.

Current Research in Earth Sciences, Bulletin 258, part 3 (http://www.kgs.ku.edu/Current/2010/Macfarlane/index.html)
Temporal Variability in Quality of Produced Water from Wells Tapping Ozark Aquifer of Southeast Kansas, Macfarlane 20
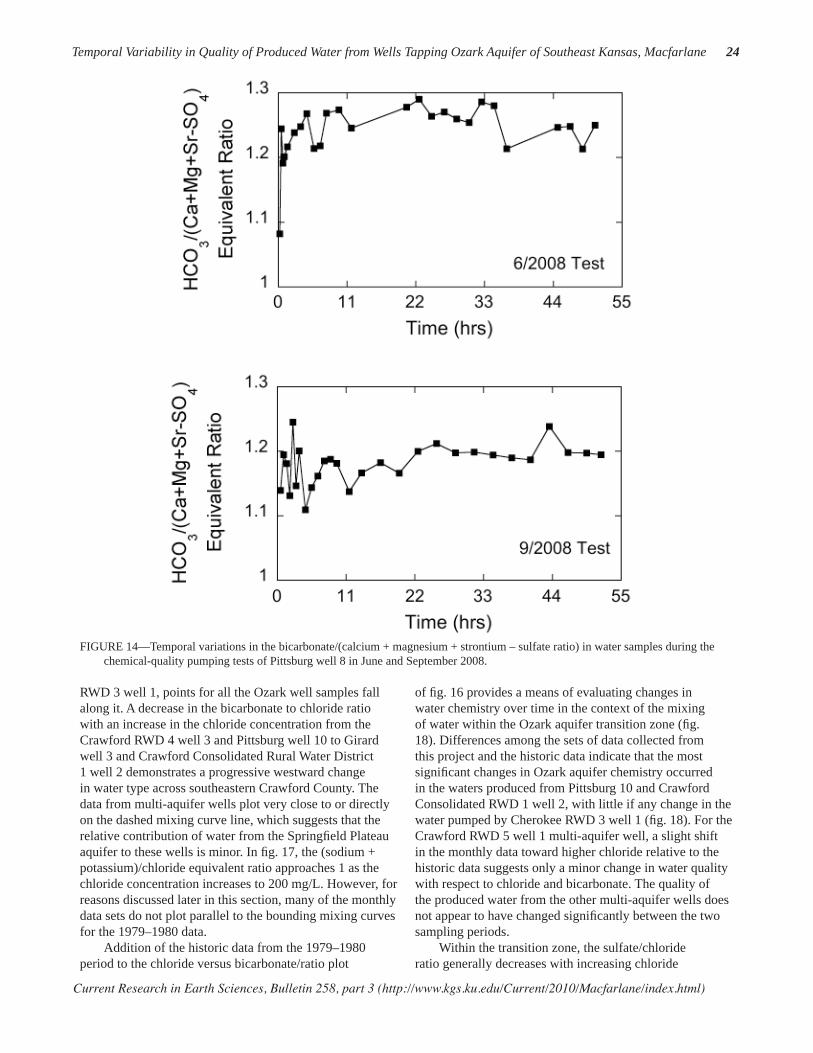
was about 3 for remainder of the test (fi g. 13). The TDS concentration decreased from 566 mg/L to 478 mg/L during the June test and from 543 mg/L to 484 mg/L during the September test. The bicarbonate/(calcium + magnesium + strontium – sulfate) equivalent ratio is a measure of the amount of bicarbonate relative to that required to satisfy the calcium, magnesium, and strontium in the water that match up with carbonate mineral sources. The sulfate equivalent concentration is subtracted from the cation equivalent concentration to remove cation sources that match up with sulfate minerals. The (sodium + potassium)/chloride equivalent ratio is a measure of the amount of sodium + potassium relative to that required to satisfy the chloride equivalent concentration in the water. Because both ratios exceeded 1, they are defi ned as the excess bicarbonate and excess sodium + potassium ratios, respectively. In the June test, the lowest value of the excess bicarbonate ratio was near 1.1 in the very fi rst sample but fl uctuated between
about 1.2 and 1.3 for the remainder of the pumping period, while the excess sodium + potassium ratio varied but trended upward from 1.2 to around 1.4 to 1.5 (fi gs. 14 and 15). In the September test, the excess bicarbonate ratio fl uctuated appreciably during the fi rst 4 hours and then stabilized around 1.2. The excess sodium + potassium ratio also varied substantially in the fi rst four hours of the test and then increased and fl uctuated around a value of approximately 1.4 (fi g. 15). The low excess bicarbonate and sodium indicated by the ratios suggest that a signifi cant amount of sodium-bicarbonate water was not contributed from the Springfi eld Plateau aquifer to the Ozark aquifer while Pittsburg well 8 was pumping.
Mixing of Ground Waters from Differing Sources
Overall, the produced waters from the wells monitored in this project are mixtures of ground waters
FIGURE 11—Temporal variations in the concentrations of selected major and minor constituents in water samples during the chemical-quality pumping tests of Pittsburg well 8 in June and September 2008.

Current Research in Earth Sciences, Bulletin 258, part 3 (http://www.kgs.ku.edu/Current/2010/Macfarlane/index.html)
Temporal Variability in Quality of Produced Water from Wells Tapping Ozark Aquifer of Southeast Kansas, Macfarlane 21
TABLE 13—Chemical analyses of the monthly 2006–08 samples collected from the Weir city well.
Date Sampled
Sp. Con. (μS/cm) pH
TDS(mg/L)
Ca(mg/L)
Mg(mg/L)
Na(mg/L)
K(mg/L)
Sr(mg/L)
HCO3(mg/L)
SO4(mg/L)
Cl(mg/L)
4/13/06 707 7.54 423 62.1 29.7 47.8 5.69 1.04 325 61.3 35.05/15/06 732 7.49 430 58.7 28.1 55.3 5.6 1.02 339 63.3 40.26/15/06 722 7.55 440 61.1 29.5 61.4 5.4 1.07 344 59.9 40.77/13/06 745 7.41 442 58.9 28.6 62.6 6.5 1.04 350 60.0 40.78/15/06 700 7.85 417 60.5 29.4 51.0 5.8 1.04 327 61.0 36.59/19/06 767 7.80 427 59.4 28.8 54.2 4.5 1.04 337 62.9 39.5
10/16/06 824 7.34 497 49.5 27.2 97.0 4.2 1.10 405 53.0 55.011/21/06 707 7.45 421 61.8 30.8 46.1 4.9 1.02 325 67.8 37.412/18/06 726 7.65 432 59.6 29.9 56.6 5.1 1.03 339 62.2 39.01/26/07 720 7.50 414 62.8 29.1 46.5 5.5 1.04 323 62.9 35.93/19/07 720 7.80 424 61.7 28.8 48.1 5.2 1.00 329 68.7 36.74/1/07 708 7.45 414 61.7 29.6 46.0 5.1 1.07 322 63.6 37.5
5/14/07 723 7.50 414 63.7 29.3 47.0 5.2 1.07 319 62.6 37.06/1/07 679 7.60 421 62.9 29.4 48.8 5.2 1.07 325 63.2 39.98/1/07 701 7.21 421 63.0 29.4 48.3 5.3 1.07 334 62.9 35.2
10/1/07 718 7.46 426 63.0 29.5 47.3 5.6 1.06 341 63.7 36.412/1/07 744 7.36 396 61.7 29.1 46.5 5.3 1.05 327 45.0 35.51/25/08 614 7.30 409 61.4 27.9 46.3 5.4 1.03 321 62.2 35.1
Date/Time Sampled Sp. Con.
(μS/cm)
T(°C) pH
TDS(mg/L)
Ca(mg/L)
Mg(mg/L)
Na(mg/L)
K(mg/L)
Sr(mg/L)
HCO3(mg/L)
SO4(mg/L)
Cl(mg/L)
6/23/2008 11:01:00 968 22.5 6.89 566 70.9 32.1 100.8 5.8 1.10 315 68.8 1316/23/2008 11:16:00 938 22.1 6.99 519 60.9 28.6 89.7 4.9 0.97 320 57.6 1196/23/2008 11:31:00 935 22.1 6.93 521 62.7 29.2 92.2 5.1 1.00 318 56.6 1186/23/2008 11:46:00 931 22.1 6.99 505 60.5 28.3 89.4 5.0 0.97 312 53.4 1136/23/2008 12:14:00 922 22.4 6.97 519 61.2 28.8 90.7 5.0 0.98 319 55.1 1196/23/2008 13:21:00 917 23.0 6.95 522 61.1 28.9 91.0 5.1 0.99 320 58.3 1186/23/2008 14:21:00 919 22.8 6.94 523 61.2 28.8 91.7 5.1 1.00 318 60.9 1176/23/2008 15:21:00 914 22.8 6.96 500 59.6 26.6 88.8 5.0 0.95 319 50.9 1106/23/2008 16:29:00 906 22.8 7.04 506 59.4 28.6 89.8 4.9 0.98 317 50.9 1156/23/2008 17:29:00 902 22.8 7.05 499 61.5 27.8 91.3 5.0 0.98 318 52.8 1036/23/2008 18:29:00 894 22.6 7.10 515 61.4 27.4 91.4 5.2 0.99 319 58.5 1136/23/2008 20:29:00 896 22.2 7.00 494 59.4 27.0 88.8 5.1 0.96 320 52.3 1036/23/2008 22:29:00 888 21.7 7.01 493 59.3 26.9 88.9 5.1 0.97 320 47.2 1076/24/2008 7:19:00 878 20.7 7.02 494 59.0 27.0 89.5 5.1 0.97 321 51.4 1036/24/2008 9:19:00 874 21.4 6.99 477 56.1 25.8 85.6 4.9 0.92 321 41.5 104
6/24/2008 11:19:00 873 22.1 7.07 486 57.8 26.4 88.0 5.0 0.95 321 43.9 1056/24/2008 13:19:00 876 22.6 7.05 485 58.1 26.6 88.9 5.0 0.96 319 47.7 1006/24/2008 15:19:00 876 22.2 6.89 475 57.3 26.1 87.7 4.9 0.95 320 41.5 996/24/2008 17:19:00 872 22.3 6.99 450 58.0 26.4 88.3 5.0 0.96 323 41.6 99.96/24/2008 19:19:00 871 21.9 6.93 490 58.3 26.6 88.8 5.1 0.97 319 50.6 1036/24/2008 21:19:00 869 21.8 6.99 475 57.1 26.0 87.3 5.0 0.95 320 43.8 97.16/24/2008 23:19:00 863 21.8 6.97 480 58.7 26.6 89.6 5.1 0.98 319 39.9 1026/25/2008 7:28:00 866 21.1 6.95 458 56.2 25.8 86.3 5.0 0.93 320 35.6 89.96/25/2008 9:28:00 865 21.5 6.94 457 56.5 25.8 86.8 5.0 0.94 322 35.3 88.2
6/25/2008 11:28:00 865 22.3 6.96 470 58.1 26.3 88.5 5.1 0.96 315 39.8 95.66/25/2008 13:28:00 871 22.4 7.04 478 57.6 26.3 88.4 5.0 0.96 322 40.2 101
TABLE 14—Chemical analyses of samples collected during the June 2008 chemical-quality pumping test for Pittsburg 8.
Current Research in Earth Sciences, Bulletin 258, part 3 (http://www.kgs.ku.edu/Current/2010/Macfarlane/index.html)
Temporal Variability in Quality of Produced Water from Wells Tapping Ozark Aquifer of Southeast Kansas, Macfarlane 22
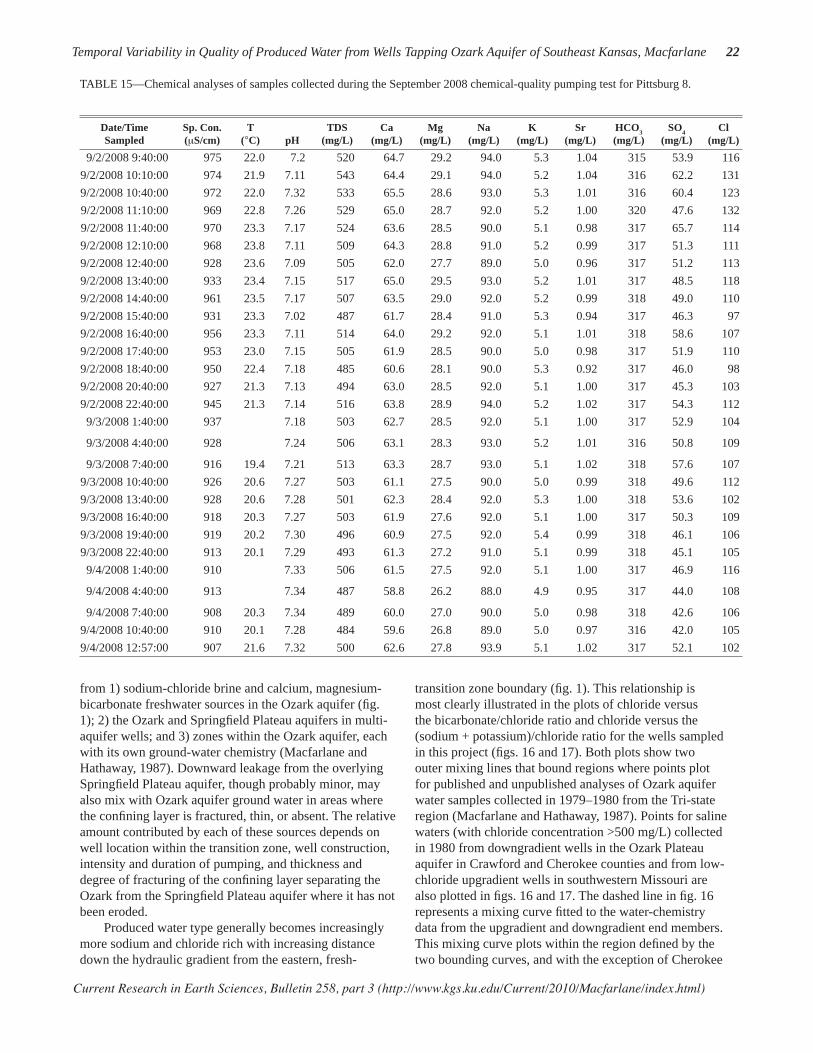
TABLE 15—Chemical analyses of samples collected during the September 2008 chemical-quality pumping test for Pittsburg 8.
Date/Time Sampled
Sp. Con. (μS/cm)
T(°C) pH
TDS(mg/L)
Ca(mg/L)
Mg(mg/L)
Na(mg/L)
K(mg/L)
Sr(mg/L)
HCO3(mg/L)
SO4(mg/L)
Cl(mg/L)
9/2/2008 9:40:00 975 22.0 7.2 520 64.7 29.2 94.0 5.3 1.04 315 53.9 1169/2/2008 10:10:00 974 21.9 7.11 543 64.4 29.1 94.0 5.2 1.04 316 62.2 1319/2/2008 10:40:00 972 22.0 7.32 533 65.5 28.6 93.0 5.3 1.01 316 60.4 1239/2/2008 11:10:00 969 22.8 7.26 529 65.0 28.7 92.0 5.2 1.00 320 47.6 1329/2/2008 11:40:00 970 23.3 7.17 524 63.6 28.5 90.0 5.1 0.98 317 65.7 1149/2/2008 12:10:00 968 23.8 7.11 509 64.3 28.8 91.0 5.2 0.99 317 51.3 1119/2/2008 12:40:00 928 23.6 7.09 505 62.0 27.7 89.0 5.0 0.96 317 51.2 1139/2/2008 13:40:00 933 23.4 7.15 517 65.0 29.5 93.0 5.2 1.01 317 48.5 1189/2/2008 14:40:00 961 23.5 7.17 507 63.5 29.0 92.0 5.2 0.99 318 49.0 1109/2/2008 15:40:00 931 23.3 7.02 487 61.7 28.4 91.0 5.3 0.94 317 46.3 979/2/2008 16:40:00 956 23.3 7.11 514 64.0 29.2 92.0 5.1 1.01 318 58.6 1079/2/2008 17:40:00 953 23.0 7.15 505 61.9 28.5 90.0 5.0 0.98 317 51.9 1109/2/2008 18:40:00 950 22.4 7.18 485 60.6 28.1 90.0 5.3 0.92 317 46.0 989/2/2008 20:40:00 927 21.3 7.13 494 63.0 28.5 92.0 5.1 1.00 317 45.3 1039/2/2008 22:40:00 945 21.3 7.14 516 63.8 28.9 94.0 5.2 1.02 317 54.3 1129/3/2008 1:40:00 937 7.18 503 62.7 28.5 92.0 5.1 1.00 317 52.9 104
9/3/2008 4:40:00 928 7.24 506 63.1 28.3 93.0 5.2 1.01 316 50.8 109
9/3/2008 7:40:00 916 19.4 7.21 513 63.3 28.7 93.0 5.1 1.02 318 57.6 1079/3/2008 10:40:00 926 20.6 7.27 503 61.1 27.5 90.0 5.0 0.99 318 49.6 1129/3/2008 13:40:00 928 20.6 7.28 501 62.3 28.4 92.0 5.3 1.00 318 53.6 1029/3/2008 16:40:00 918 20.3 7.27 503 61.9 27.6 92.0 5.1 1.00 317 50.3 1099/3/2008 19:40:00 919 20.2 7.30 496 60.9 27.5 92.0 5.4 0.99 318 46.1 1069/3/2008 22:40:00 913 20.1 7.29 493 61.3 27.2 91.0 5.1 0.99 318 45.1 1059/4/2008 1:40:00 910 7.33 506 61.5 27.5 92.0 5.1 1.00 317 46.9 116
9/4/2008 4:40:00 913 7.34 487 58.8 26.2 88.0 4.9 0.95 317 44.0 108
9/4/2008 7:40:00 908 20.3 7.34 489 60.0 27.0 90.0 5.0 0.98 318 42.6 1069/4/2008 10:40:00 910 20.1 7.28 484 59.6 26.8 89.0 5.0 0.97 316 42.0 1059/4/2008 12:57:00 907 21.6 7.32 500 62.6 27.8 93.9 5.1 1.02 317 52.1 102
from 1) sodium-chloride brine and calcium, magnesium-bicarbonate freshwater sources in the Ozark aquifer (fi g. 1); 2) the Ozark and Springfi eld Plateau aquifers in multi-aquifer wells; and 3) zones within the Ozark aquifer, each with its own ground-water chemistry (Macfarlane and Hathaway, 1987). Downward leakage from the overlying Springfi eld Plateau aquifer, though probably minor, may also mix with Ozark aquifer ground water in areas where the confi ning layer is fractured, thin, or absent. The relative amount contributed by each of these sources depends on well location within the transition zone, well construction, intensity and duration of pumping, and thickness and degree of fracturing of the confi ning layer separating the Ozark from the Springfi eld Plateau aquifer where it has not been eroded. Produced water type generally becomes increasingly more sodium and chloride rich with increasing distance down the hydraulic gradient from the eastern, fresh-
transition zone boundary (fi g. 1). This relationship is most clearly illustrated in the plots of chloride versus the bicarbonate/chloride ratio and chloride versus the (sodium + potassium)/chloride ratio for the wells sampled in this project (fi gs. 16 and 17). Both plots show two outer mixing lines that bound regions where points plot for published and unpublished analyses of Ozark aquifer water samples collected in 1979–1980 from the Tri-state region (Macfarlane and Hathaway, 1987). Points for saline waters (with chloride concentration >500 mg/L) collected in 1980 from downgradient wells in the Ozark Plateau aquifer in Crawford and Cherokee counties and from low-chloride upgradient wells in southwestern Missouri are also plotted in fi gs. 16 and 17. The dashed line in fi g. 16 represents a mixing curve fi tted to the water-chemistry data from the upgradient and downgradient end members. This mixing curve plots within the region defi ned by the two bounding curves, and with the exception of Cherokee
Current Research in Earth Sciences, Bulletin 258, part 3 (http://www.kgs.ku.edu/Current/2010/Macfarlane/index.html)
Temporal Variability in Quality of Produced Water from Wells Tapping Ozark Aquifer of Southeast Kansas, Macfarlane 23
FIGURE 12 (left)—Temporal variations in the SO4/Cl mass ratio in water samples during the chemical-quality pumping tests of Pittsburg well 8 in June and September 2008.
FIGURE 13 (right)—Temporal variations in the HCO3/Cl mass ratio in water samples during the chemical-quality pumping tests of Pittsburg well 8 in June and September 2008.
Current Research in Earth Sciences, Bulletin 258, part 3 (http://www.kgs.ku.edu/Current/2010/Macfarlane/index.html)
Temporal Variability in Quality of Produced Water from Wells Tapping Ozark Aquifer of Southeast Kansas, Macfarlane 24
RWD 3 well 1, points for all the Ozark well samples fall along it. A decrease in the bicarbonate to chloride ratio with an increase in the chloride concentration from the Crawford RWD 4 well 3 and Pittsburg well 10 to Girard well 3 and Crawford Consolidated Rural Water District 1 well 2 demonstrates a progressive westward change in water type across southeastern Crawford County. The data from multi-aquifer wells plot very close to or directly on the dashed mixing curve line, which suggests that the relative contribution of water from the Springfi eld Plateau aquifer to these wells is minor. In fi g. 17, the (sodium + potassium)/chloride equivalent ratio approaches 1 as the chloride concentration increases to 200 mg/L. However, for reasons discussed later in this section, many of the monthly data sets do not plot parallel to the bounding mixing curves for the 1979–1980 data. Addition of the historic data from the 1979–1980 period to the chloride versus bicarbonate/ratio plot
of fi g. 16 provides a means of evaluating changes in water chemistry over time in the context of the mixing of water within the Ozark aquifer transition zone (fi g. 18). Differences among the sets of data collected from this project and the historic data indicate that the most signifi cant changes in Ozark aquifer chemistry occurred in the waters produced from Pittsburg 10 and Crawford Consolidated RWD 1 well 2, with little if any change in the water pumped by Cherokee RWD 3 well 1 (fi g. 18). For the Crawford RWD 5 well 1 multi-aquifer well, a slight shift in the monthly data toward higher chloride relative to the historic data suggests only a minor change in water quality with respect to chloride and bicarbonate. The quality of the produced water from the other multi-aquifer wells does not appear to have changed signifi cantly between the two sampling periods. Within the transition zone, the sulfate/chloride ratio generally decreases with increasing chloride
FIGURE 14—Temporal variations in the bicarbonate/(calcium + magnesium + strontium – sulfate ratio) in water samples during the chemical-quality pumping tests of Pittsburg well 8 in June and September 2008.

Current Research in Earth Sciences, Bulletin 258, part 3 (http://www.kgs.ku.edu/Current/2010/Macfarlane/index.html)
Temporal Variability in Quality of Produced Water from Wells Tapping Ozark Aquifer of Southeast Kansas, Macfarlane 25
FIGURE 15—Temporal variations in the (sodium + potassium)/chloride ratio in water samples during the chemical-quality pumping tests of Pittsburg well 8 in June and September 2008.
concentration (fi g. 19) as mixing with sodium-chloride type water increases down the hydraulic gradient towards the Cherokee basin brines. In addition, the sulfate concentration generally decreases as hydrogen sulfi de concentration increases (Macfarlane and Hathaway, 1987). This relationship is thought to refl ect a lateral change within the Ozark aquifer toward more chemically reducing conditions. Although, in aggregate, the monthly sample data generally follow a pattern of decreasing sulfate/chloride ratio with increasing chloride concentration, only the Weir city well and Columbus well 4 monthly data had a substantial change in chloride concentration that followed the overall trend of points in fi g. 19.
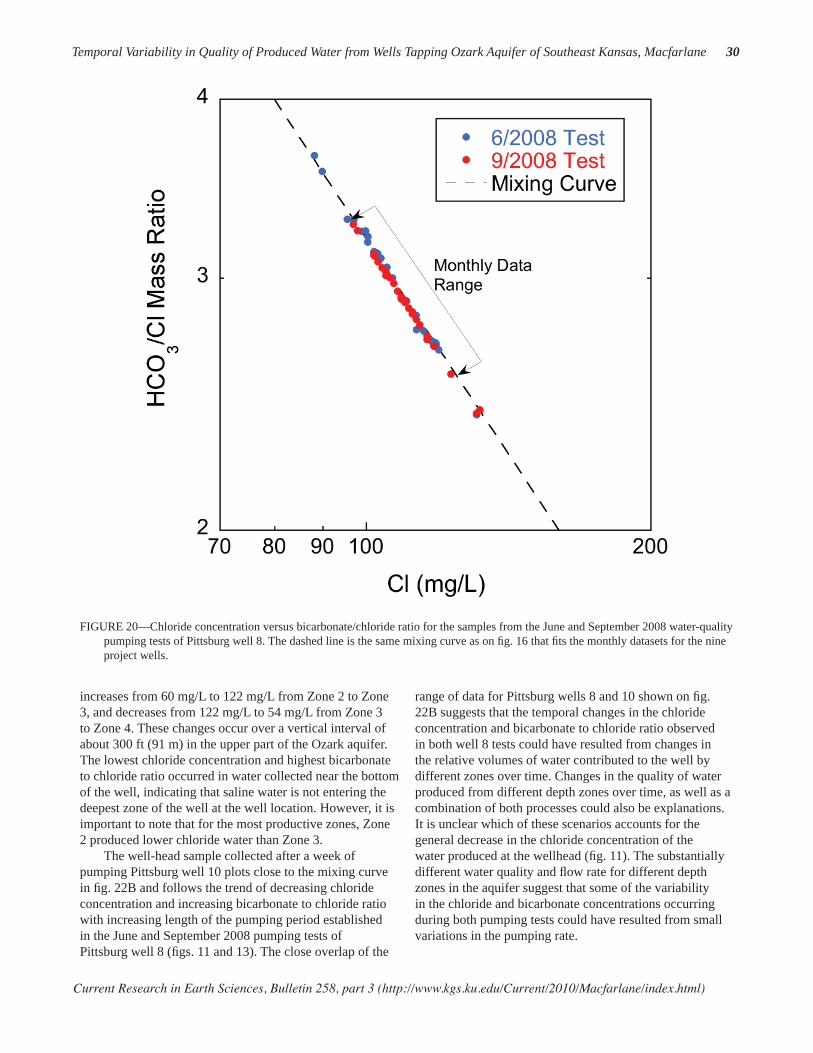
Data from the water-quality pumping tests also suggest that zones of differing water quality within the aquifer contribute water to a pumping well at different rates throughout a single pumping period. It is also possible that the quality of water produced by individual zones may change without a change in the relative amount contributed to the well during pumping. Figure 20 is a plot of the bicarbonate/chloride ratio versus chloride concentration for the samples from both pumping tests plotted with the same mixing curve as the dashed line on fi g. 16. The plot shows an excellent fi t between the data and the chloride-bicarbonate mixing curve. The trend of the plotted pumping test chloride and the (sodium + potassium)/chloride ratio

Current Research in Earth Sciences, Bulletin 258, part 3 (http://www.kgs.ku.edu/Current/2010/Macfarlane/index.html)
Temporal Variability in Quality of Produced Water from Wells Tapping Ozark Aquifer of Southeast Kansas, Macfarlane 26
FIGURE 16—Chloride concentration versus bicarbonate/chloride ratio for the monthly samples of 2006–08 and for samples from upgradient and downgradient wells sampled in 1979–1980 from Crawford and Cherokee counties and adjacent southwestern Missouri. The solid lines are curves that describe the mixing curves that bound where points would plot for the 1979–1980 sample data for the Tri-state region and the dashed line is a mixing curve based on a low-chloride end member for the freshest waters from the 2006–08 monthly data and a high-chloride end member for the middle of the group of the saline waters. The curves describe the mixing of various proportions of waters from the low TDS concentration, calcium, magnesium-bicarbonate province and the high TDS, sodium-chloride sources.
values follows well the trend of the monthly data for Pittsburg 8 and many of the other supplies sampled, but not as well as the overall trend of the data from the 1979–1980 samplings (fi g. 21). The ranges of the bicarbonate to chloride and sodium + potassium to chloride ratios and the chloride concentration values are greater for the samples from the pumping tests than for the Pittsburg well 8 monthly samples. The differences in trend between the regional 1979–1980 data sets and the monthly data and the high degree of variability of the sodium + potassium/chloride ratios over the pumping period are both consistent with time varying amounts of these constituents being contributed to the open borehole from different zones each with its own water chemistry. Springfi eld Plateau aquifer wells located above the Ozark aquifer transition zone in southeast Kansas and
southwest Missouri produce sodium-bicarbonate type water (Darr, 1978; Macfarlane and Hathaway, 1987). Macfarlane and Hathaway (1987) noted that water samples from some of the multi-aquifer wells within the bounds of the Ozark aquifer transition zone contained bicarbonate in excess of that required to satisfy the equivalent carbonate contribution of calcium, magnesium, and strontium in the sample. The excess bicarbonate ratio is about the same for both the Ozark and multi-aquifer wells, but the excess sodium + potassium ratios are generally higher for the multi-aquifer wells. Excess sodium + potassium values range from about 1.5 to almost 3 in samples from the multi-aquifer wells and 1 to about 1.5 for samples from the Ozark wells. The lower values for the Ozark well samples suggest that leakage across the confi ning unit is at most minor.

Current Research in Earth Sciences, Bulletin 258, part 3 (http://www.kgs.ku.edu/Current/2010/Macfarlane/index.html)
Temporal Variability in Quality of Produced Water from Wells Tapping Ozark Aquifer of Southeast Kansas, Macfarlane 27
Discussion
FIGURE 17—Chloride concentration versus sodium/chloride ratio values for the monthly samples of 2006–08 and for samples from upgradient and downgradient wells sampled in 1979–1980 from Crawford and Cherokee counties and adjacent southwestern Missouri. The solid lines are curves that describe the mixing curves that bound where points would plot for the 1979–1980 sample data for the Tri-State region. The curves describe the mixing in various proportions of waters from the low TDS concentration, calcium, magnesium-bicarbonate province and the high TDS, sodium-chloride province.
The vertical variation in water quality in any well within the transition zone ultimately depends on the amount of mixing that has occurred over long periods between the infl owing low TDS freshwater from recharge areas in southwest Missouri and the resident sodium-chloride
brines to the west in the Cherokee basin (Macfarlane and Hathaway, 1987). The plots in fi gs. 11–15 for the Pittsburg well 8 pumping tests imply that waters of differing quality are contributed from different parts of the aquifer at different rates to the well during pumping. Changes in the

Current Research in Earth Sciences, Bulletin 258, part 3 (http://www.kgs.ku.edu/Current/2010/Macfarlane/index.html)
Temporal Variability in Quality of Produced Water from Wells Tapping Ozark Aquifer of Southeast Kansas, Macfarlane 28
constituent concentrations as pumping progressed during the tests indicate that the amounts contributed from each source within the aquifer change with time. In particular, the excellent fi t of the data points from both tests with the mixing curve on a bicarbonate to chloride ratio versus chloride plot clearly indicates changes in the mixing of water from fresh and more saline end-members within the open borehole of the well. This interpretation is supported by U.S. Geological Survey data from August 2007 fl owmeter measurements and sampling of produced water collected at various depths within the open borehole section from the Pittsburg well 10 after it had been pumped for one week (fi gs. 1, 22A1, 22A2; Pope et al., 2009). The depth and construction of well 8 are nearly identical to those of well 10, which is located approximately 1,400 ft (427 m) to the south. The pump in well 10 is situated in the cased portion of the borehole, 350 ft (107 m) below the well top. A well-bore fl owmeter survey of Pittsburg well 10 revealed that 77% of the fl ow into the open borehole was contributed by two thin zones from 837 ft to 857 ft (255 m to 261 m) in the lower part of the Roubidoux Formation (Zone 2) and from 977 ft to 997 ft (298 m to 304 m) in the middle of the Gasconade Dolomite (Zone 3; fi g. 22A1). More of the total fl ow
FIGURE 18—Comparison of the 1979–1980 and 2006–08 chloride and bicarbonate/chloride ratios in samples from Pittsburg well 10, Crawford Consolidated RWD 1 well 2, and Crawford RWD 5 well 1.
came from Zone 2 (about 46%) than Zone 3 (about 31%). Because of the close proximity, similar construction, and depth of the wells, it is reasonable to conclude that the open borehole section of well 8 also penetrates Zones 1 through 4. Chloride concentration and the bicarbonate to chloride ratio for six water samples collected within the borehole from 487 to 1,030 ft below the top of well 10 after a week of pumping ranged from 54 mg/L to 110 mg/L and 2.73 to 5.37, respectively (fi g. 22A2). The chloride concentration entering from each of the four zones in the open borehole of well 10 was estimated using a rearranged form of equation 1, the fl owmeter data (fi g. 22A1), and chloride concentrations of water sampled from various levels within the well (fi g. 22A2). In the calculation, it is assumed that the fl ow entering the open borehole from each of the zones moves upward toward the pump and mixes with water below the zone. Equation 1 can be expressed as
C1 f1 + C2 f2 = C3( f1 + f2), (2) where f1 is the fractional amount of water in relation to the total at the top of the zone with a chloride concentration of C1 that is moving upward from below the zone in question,

Current Research in Earth Sciences, Bulletin 258, part 3 (http://www.kgs.ku.edu/Current/2010/Macfarlane/index.html)
Temporal Variability in Quality of Produced Water from Wells Tapping Ozark Aquifer of Southeast Kansas, Macfarlane 29
FIGURE 19—Chloride concentration versus sulfate/chloride ratio for the monthly samples of 2006–08 and for samples from upgradient and downgradient wells sampled in 1979–1980 from Crawford and Cherokee counties and adjacent southwestern Missouri. The solid lines are curves that describe the mixing curves that bound where points would plot for the 1979–1980 sample data for the Tri-state region. The curves describe the mixing of various proportions of water of low TDS concentration and calcium, magnesium-bicarbonate type with water of low to moderate sulfate and high TDS concentration and sodium-chloride type with very low sulfate.
f2 is the fractional amount of water in relation to the total at the top of the zone with a chloride concentration of C2 that is moving into the well from the zone, and C3 is the concentration of the mix at the top of the zone. With two end-member mixing, f1 + f2 are equal to 1 and
f2 = 1- f1. (3)
Substitution of equation 3 into equation 2 and solving for C2 produces
C2 = (C3 - C1 f1)/(1- f1). (4)
The profi le in fi g. 22A3 combines the calculated chloride concentrations of water entering the well in each zone with the chloride concentrations of the samples collected between the zones. The calculation was performed starting at the top of zone 3 and moving upward. The plot shows that the chloride concentration does not change monotonically with depth from zone to zone but rather decreases from 77 mg/L to 60 mg/L from Zone 1 to Zone 2,
Current Research in Earth Sciences, Bulletin 258, part 3 (http://www.kgs.ku.edu/Current/2010/Macfarlane/index.html)
Temporal Variability in Quality of Produced Water from Wells Tapping Ozark Aquifer of Southeast Kansas, Macfarlane 30
FIGURE 20—Chloride concentration versus bicarbonate/chloride ratio for the samples from the June and September 2008 water-quality pumping tests of Pittsburg well 8. The dashed line is the same mixing curve as on fi g. 16 that fi ts the monthly datasets for the nine project wells.
increases from 60 mg/L to 122 mg/L from Zone 2 to Zone 3, and decreases from 122 mg/L to 54 mg/L from Zone 3 to Zone 4. These changes occur over a vertical interval of about 300 ft (91 m) in the upper part of the Ozark aquifer. The lowest chloride concentration and highest bicarbonate to chloride ratio occurred in water collected near the bottom of the well, indicating that saline water is not entering the deepest zone of the well at the well location. However, it is important to note that for the most productive zones, Zone 2 produced lower chloride water than Zone 3. The well-head sample collected after a week of pumping Pittsburg well 10 plots close to the mixing curve in fi g. 22B and follows the trend of decreasing chloride concentration and increasing bicarbonate to chloride ratio with increasing length of the pumping period established in the June and September 2008 pumping tests of Pittsburg well 8 (fi gs. 11 and 13). The close overlap of the
range of data for Pittsburg wells 8 and 10 shown on fi g. 22B suggests that the temporal changes in the chloride concentration and bicarbonate to chloride ratio observed in both well 8 tests could have resulted from changes in the relative volumes of water contributed to the well by different zones over time. Changes in the quality of water produced from different depth zones over time, as well as a combination of both processes could also be explanations. It is unclear which of these scenarios accounts for the general decrease in the chloride concentration of the water produced at the wellhead (fi g. 11). The substantially different water quality and fl ow rate for different depth zones in the aquifer suggest that some of the variability in the chloride and bicarbonate concentrations occurring during both pumping tests could have resulted from small variations in the pumping rate.
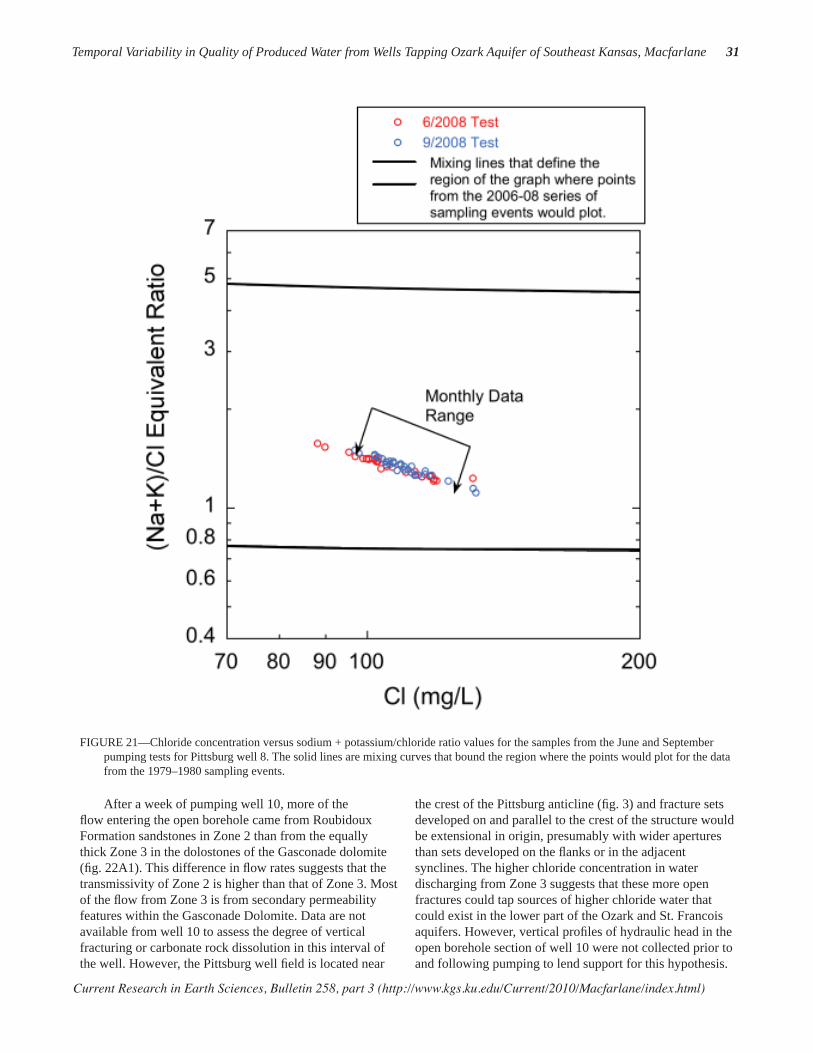
Current Research in Earth Sciences, Bulletin 258, part 3 (http://www.kgs.ku.edu/Current/2010/Macfarlane/index.html)
Temporal Variability in Quality of Produced Water from Wells Tapping Ozark Aquifer of Southeast Kansas, Macfarlane 31
After a week of pumping well 10, more of the fl ow entering the open borehole came from Roubidoux Formation sandstones in Zone 2 than from the equally thick Zone 3 in the dolostones of the Gasconade dolomite (fi g. 22A1). This difference in fl ow rates suggests that the transmissivity of Zone 2 is higher than that of Zone 3. Most of the fl ow from Zone 3 is from secondary permeability features within the Gasconade Dolomite. Data are not available from well 10 to assess the degree of vertical fracturing or carbonate rock dissolution in this interval of the well. However, the Pittsburg well fi eld is located near
FIGURE 21—Chloride concentration versus sodium + potassium/chloride ratio values for the samples from the June and September pumping tests for Pittsburg well 8. The solid lines are mixing curves that bound the region where the points would plot for the data from the 1979–1980 sampling events.
the crest of the Pittsburg anticline (fi g. 3) and fracture sets developed on and parallel to the crest of the structure would be extensional in origin, presumably with wider apertures than sets developed on the fl anks or in the adjacent synclines. The higher chloride concentration in water discharging from Zone 3 suggests that these more open fractures could tap sources of higher chloride water that could exist in the lower part of the Ozark and St. Francois aquifers. However, vertical profi les of hydraulic head in the open borehole section of well 10 were not collected prior to and following pumping to lend support for this hypothesis.

Current Research in Earth Sciences, Bulletin 258, part 3 (http://www.kgs.ku.edu/Current/2010/Macfarlane/index.html)
Temporal Variability in Quality of Produced Water from Wells Tapping Ozark Aquifer of Southeast Kansas, Macfarlane 32
Drawdown from individual pumping events could induce 1) lateral fl ow of lower chloride water through the Roubidoux Formation sandstones from the shallow part of the aquifer and 2) upward fl ow of higher chloride water from deeper transmissive intervals within the Gasconade
FIGURE 22— (A) Cumulative fl ow (A1), chloride concentration and bicarbonate to chloride ratio (A2), and calculated zonal chloride concentration (A3) versus depth in Pittsburg well 10; and (B) chloride concentration and bicarbonate to chloride ratio range for samples from the June and September 2008 pumping tests of Pittsburg well 8 in comparison to the wellhead sample collected from Pittsburg well 10. All samples were collected after one week of continuous pumping. Pittsburg well 10 data are from Pope et al. (2009).
Dolomite into the well and the adjacent sandstones. The June test was conducted prior to the annual period of high pumping stress, and hydraulic head in the aquifer was higher in the well fi eld (fi g. 5) and presumably in both Zones 2 and 3. Prior to this test, the hydraulic head in Zone
A
B
1
23

Current Research in Earth Sciences, Bulletin 258, part 3 (http://www.kgs.ku.edu/Current/2010/Macfarlane/index.html)
Temporal Variability in Quality of Produced Water from Wells Tapping Ozark Aquifer of Southeast Kansas, Macfarlane 33
3 could have been higher than in Zone 2, which would have allowed higher chloride water to move into this upper zone. When the pump for well 8 was turned on, water from all of the zones would start to fl ow into the well. In the early part of the pumping period, the higher chloride water from Zone 3 and the part of Zone 2 affected by Zone 3 water would have entered the well resulting in the observed higher chloride concentration (fi g. 11). Continued pumping would have gradually fl ushed the higher chloride water from Zone 2, resulting in a gradual decline in the chloride concentration with time. Turning off the well could potentially have allowed water from deeper zones to continue to fl ow slowly upwards into the well from Zone 3 into Zone 2 during recovery. Prior to the September well 8 pumping test, higher pumping stress lowered the hydraulic head in the Ozark aquifer in the Pittsburg area generally as indicated by the lower water levels in the monitoring well (fi g. 5). This could have increased the vertical hydraulic head gradients within the Ozark aquifer and consequently, the potential for upward fl ow from deeper fl ow zones during pumping. The early drawdown in the September well 8 test could have initially induced more fl ow into the well from Zone 2 than from Zone 3 causing the chloride in the produced water in the early part of the pumping period to decrease (fi g. 11). As pumping progressed, the fl ow from Zone 2 could have slowed suffi ciently relative to Zone 3 because of further increases in the vertical hydraulic head gradient so that the continued decline in the chloride concentration of the produced water over time would have eventually ceased (fi g. 11). Alternatively, vertical head gradients could have induced leakage of water from Zone 3 to Zone 2 within the aquifer resulting in a decreasing rate of decline in the chloride concentration. Long-term change in the quality of produced water is occurring very slowly and over many cycles of pumping and recovery and high and low stress periods at Pittsburg well 10 and Crawford Consolidated RWD 1 well 2 as indicated by the datasets from this project, the 1979–1980 sampling events, and from Darr (1978). Because of the limited sampling that was done in 1979–1980, the amount of change in the bicarbonate and chloride concentrations over the last 25 years is diffi cult to gauge (fi g. 18). However, if the variability in the monthly data from Pittsburg well 8 is similar to that of Pittsburg 10, the apparent change in produced water quality from Pittsburg well 10 from 1979–1980 to 2006–08 is much greater than the monthly variability (fi g. 16). The chloride concentration versus bicarbonate/chloride mixing plot in fi g. 16 shows that the long-term change in quality of the produced water from Pittsburg well 8 follows the mixing curve from lower chloride to higher chloride values. Assuming that the water quality in Pittsburg well 10 has evolved over time in a manner similar to that of Pittsburg well 8, then the general decrease in chloride concentration and an increase in the bicarbonate/chloride ratio during both pumping tests appears opposite to the long-term trend. Higher levels of
pumping during certain times of the year cause a general lowering of the hydraulic head within the Ozark aquifer and the Pittsburg area wells to produce higher chloride water after extended pumping such as indicated by fi g. 18. Upward migration of saline water from the lower part of the Ozark and St. Francois aquifers is a much simpler explanation of the increased salinity in the Pittsburg area wells than eastward migration of more saline water into the area. The observed decrease in the chloride concentration with extended pumping in the well 8 pumping tests is diffi cult to explain if it is assumed that saline water is moving into the area from the west. In that scenario, the chloride concentration in the produced water during a single pumping period should be relatively constant or possibly increase with time. However, data are currently lacking to evaluate the potential for upward movement of more saline water into the upper part of the Ozark aquifer from deeper zones. Macfarlane and Hathaway (1987) and Imes and Emmett (1994) speculated that downward leakage from the Springfi eld Plateau aquifer was a major source of recharge to the Ozark aquifer in the Tri-state region. This is not evident in the results of the Pittsburg 8 chemical-quality pumping tests (fi gs. 14–15). Ground waters from the Springfi eld Plateau aquifer in southeast Kansas are a sodium-bicarbonate type (Macfarlane and Hathaway, 1987). A Springfi eld Plateau aquifer well located 1 mi (1.3 km) northeast of Pittsburg 8 was sampled twice in 1979–1980. The average excess sodium + potassium and bicarbonate ratios from the two samplings are 15.3 and 21.7, respectively. In the June pumping test, the excess sodium + potassium ratio rose to approximately 1.5 with some fl uctuation throughout the pumping period. In the September test, the ratio rose early and then remained relatively constant at approximately 1.35 throughout the remainder of the pumping period. In both tests, the excess bicarbonate ratio remained relatively constant with values below 1.25. The low excess bicarbonate and sodium + potassium ratios from the June and September tests suggest that pumping-induced recharge from leakage is either negligible or, if small, is masked by cation exchange and carbonate equilibria that alter the water chemistry. The chloride concentration for the three monthly samples collected from Pittsburg well 10 during 2006 to 2007 ranged from 88.9 to 109 mg/L. The chloride concentration range for three samples obtained from the same well during 1979–1980 was 38–41 mg/L. If the minimum and maximum differences in chloride concentration between the two sampling periods are divided by the time between the periods, the rate of chloride increase ranges from 1.8 to 2.6 mg/L/yr. The minimum and maximum chloride concentrations observed for the two pumping tests of Pittsburg well 8 during 2008 were 88.2 and 132 mg/L, respectively. If the chloride content of Pittsburg well 8 during 1979–1980 was about the same as for Pittsburg well 10 (around 40 mg/L), then the

Current Research in Earth Sciences, Bulletin 258, part 3 (http://www.kgs.ku.edu/Current/2010/Macfarlane/index.html)
Temporal Variability in Quality of Produced Water from Wells Tapping Ozark Aquifer of Southeast Kansas, Macfarlane 34
rate of chloride increase for Pittsburg well 8 ranges from 1.7 to 3.2 mg/L/yr. Based on the value and the date of the maximum chloride concentration observed for each of the two wells and the maximum rate of chloride increase, and assuming that the increase rate remains linear with time, the chloride level would not exceed the recommended drinking water limit of 250 mg/L until approximately 37 years (the year 2045) for Pittsburg well 8 and 54 years (the year 2060) for Pittsburg well 10. The range in increase rate estimates indicate that the data from the monthly sampling and pumping tests of Pittsburg well 8 have important ramifi cations for designing a water-quality monitoring protocol to determine long-term
changes in water quality. For this well, the greater ranges of chloride concentration for the pumping test samples than for the monthly samples underscores the need to factor short-term variability in produced water chemistry into the frequency of sampling, the timing of sampling relative to pump start-up and possibly to seasonal water use, and the analysis of the resulting data for trend. The monthly sampling results for many of the other wells sampled in this project exhibit trends indicating changes in the relative proportions of the cations, anions, or both (fi g. 6). Longer-term pumping tests of these other wells could reveal results similar to those found for Pittsburg well 8.
Conclusions The results of this study refl ect the lateral variability in the chemical quality of the water within the Ozark aquifer transition zone described in Macfarlane and Hathaway (1987) and provide documentation of the effects of pumping on produced-water quality. The chemical character of water produced from the Ozark aquifer ranges from mixed cation-bicarbonate type for Pittsburg wells 8 and 10 and Crawford RWD 4 well 3 to a sodium-chloride type for Cherokee RWD 3 well 1 and other wells yielding even higher chloride concentration. As a group, water from the multi-aquifer wells with a chloride content less than 80 mg/L (Weir city well, Crawford RWD 5 well1, and about half of the Columbus well 4 samples) had a higher bicarbonate percentage and a lower sulfate and chloride percentage of total anions than water only from the Ozark aquifer. However, the much lower sodium and potassium percentage and higher calcium and magnesium percentage of total cations for the multi-aquifer wells than for samples from the Springfi eld Plateau aquifer suggest that the contribution of water from the Springfi eld Plateau aquifer is minor relative to the contribution produced from the Ozark aquifer. With the exception of Columbus well 4 and the Weir city well, variability in the chemistry of the monthly samples collected during 2006–08 was small for each site relative to the range among the sample sites. Data for the chemical-quality pumping tests indicate that different zones within the Ozark aquifer produce waters of differing chemistries at variable rates to Pittsburg well 8 as it pumps. The general decrease in TDS and chloride concentrations relative to bicarbonate concentration indicates mixing of a relatively greater amount of ground water of low TDS concentration and of calcium, magnesium-bicarbonate type than of sodium-chloride type. Differences in the manner in which the bicarbonate/chloride ratio changed over time between the June and September tests suggest that vertical head gradients, both under pumping and nonpumping conditions, play an important role in the temporal pattern of changes in salinity during these pumping tests. Variability in the water chemistry of the monthly samples from most of the sites
seems to be primarily related to the range in water quality within the Ozark aquifer. This may also be the main cause of changes observed in the water quality for the Columbus 4 and Weir city wells. The results of this study compared with the results of the 1979–1980 sampling of Macfarlane and Hathaway (1987) indicate that Pittsburg well 10 and Crawford Consolidated RWD 1 well 2 have experienced long-term increases in chloride. Changes for the other sites from 1979–1980 to 2006–08 were either small or insignifi cant. Chloride concentration increase in water from wells in the Pittsburg area most likely has resulted from pumping stress associated with the higher density of high-yielding supply wells in southeastern Crawford County and the adjacent area of Missouri. It is possible that the changes in quality are infl uenced by local upconing of higher chloride, higher TDS, transition-zone water from deeper zones within the Ozark or the St. Francois aquifers. If the long-term increases in chloride concentration are linear with time, the earliest dates that Pittsburg wells 8 and 10 would produce water greater than the recommended drinking water limit of 250 mg/L are the years 2045 and 2060, respectively. The variability in the chemical data from monthly sampling and the Pittsburg well 8 pump tests indicates that detection of long-term water-quality changes in the produced water from the wells within the transition zone will be diffi cult unless its variability over shorter time scales is factored into the analysis. To be successful, 1) water sampling events over the entire network and at individual well sites need to be more frequent to assess decadal changes and monthly variability and 2) the changes in water chemistry that occur under different levels of pumping stress during a single extended pumping event need to be considered in the analysis of trend. However, for these recommendations to more fully contribute to our understanding of the Ozark Plateaus aquifer system as a whole, attention needs also to focus on gathering vertical hydraulic-head profi les and water-quality pumping tests like those conducted in Pittsburg well 10 in existing and future wells. Data from these tests are a requisite for

Current Research in Earth Sciences, Bulletin 258, part 3 (http://www.kgs.ku.edu/Current/2010/Macfarlane/index.html)
Temporal Variability in Quality of Produced Water from Wells Tapping Ozark Aquifer of Southeast Kansas, Macfarlane 35
fully assessing the mechanisms that cause water-quality degradation in individual, open borehole wells.
Acknowledgments
This work was made possible by grant funds from the U.S. Geological Survey managed by the Kansas Water Resources Research Institute at Kansas State University, Manhattan, Kansas. The author wishes to acknowledge the assistance of Ed Reboulet with the fi eldwork for this project and Rudy Ghijsen, Elizabeth Petroske, and Mike Magnuson of the KGS Analytical Services Laboratory for their careful analysis of the water samples collected for this project. The author also wishes to express appreciation to the operators of the water supplies that were sampled in this project. The author especially wishes to express his appreciation to Steve Gillis, City of Pittsburg, for his
assistance that enabled the KGS to conduct the pumping tests on Pittsburg well 8. While working on this project, the author benefi ted from discussions with Walt Aucott, Mike Pope, and John Czarnecki of the U.S. Geological Survey on the work they were conducting on the Ozark aquifer in the Tri-state region. Margaret Townsend, Jim Butler, and Don Whittemore of the Kansas Geological Survey; Jim Vandyke of the Division of Geology and Land Survey, Missouri Department of Natural Resources; John Schumacher, Supervisory Hydrologist of the U.S. Geological Survey’s Missouri Water Science Center; and Ralph Davis, professor and chair of the Department of Geosciences, University of Arkansas–Fayetteville, critically edited and reviewed the manuscript and provided helpful suggestions that solidifi ed the ideas expressed in the manuscript and strengthened its overall message.
ReferencesDarr, J. D., 1978, Geochemistry of ground water, southwestern
Missouri: M.S. thesis, University of Missouri, 113 p.Doveton, J. H., 1986, Log analysis of Arbuckle aquifer; in,
Geohydrology of and Potential for Fluid Disposal in the Arbuckle Aquifer in Kansas, J. E. Carr, H. E. McGovern, and T. Gogel: U.S. Geological Survey, Open-fi le Report 86–491, p. 88–101.
Feder, G. L., Skelton, J., Jeffery, H. G., and Harvey, E. D., 1969, Water resources of the Joplin area, MO: Division of Geology and Land Survey, Missouri Department of Natural Resources, Water Resources Report 24, 97 p.
Gillip, J. A., Czarnecki, J. B., and Mugel, D. N., 2007, Potentiometric surfaces in the Springfi eld Plateau and Ozark aquifers of northwestern Arkansas, southeastern Kansas, southwestern Missouri, and northeastern Oklahoma, 2006: U.S. Geological Survey, Scientifi c Investigations Report 2007–5253, 25 p.
Hem, J. D., 1985, Study and interpretation of the chemical characteristics of natural water: U.S. Geological Survey, Water-Supply Paper 2254, 263 p.
Imes, J. L., and Emmett, L. F., 1994, Geohydrology of the Ozark Plateaus aquifer system in parts of Missouri, Arkansas, Oklahoma, and Kansas: U.S. Geological Survey, Professional Paper 1414D, 127 p.
Jorgensen, D. G., Helgesen, J. O., and Imes, J. L., 1993, Regional aquifers in Kansas, Nebraska, and parts of Arkansas, Colorado, Missouri, New Mexico, Oklahoma, South Dakota, Texas, and Wyoming—Geohydrologic framework: U.S. Geological Survey, Professional Paper 1414–B, 72 p.
Macfarlane, P. A., 2000, Revisions to the nomenclature for Kansas aquifers; in, Current Research in Earth Sciences: Kansas Geological Survey, Bulletin 244, part 2, http://www.kgs.ku.edu/Current/2000/macfarlane/macfarlane1.html.
Macfarlane, P. A., and Hathaway, L. R., 1987, The hydrogeology and chemical quality of ground waters from the lower Paleozoic aquifers in the Tri-state region of Kansas, Missouri, and Oklahoma: Kansas Geological Survey, Ground-water Series 9, 37 p.
Macfarlane, P. A., Whittemore, D. W., and Hathaway, L. R., 1981, A report to the Kansas Department of Health and Environment on the hydrogeology and chemical quality in the lower Paleozoic aquifers in southeast Kansas and adjoining areas of Missouri and Oklahoma: Kansas Geological Survey, Open-fi le Report 81–16, 48 p.
Piper, A. M., 1944, A graphic procedure in the geochemical interpretation of water analyses: American Geophysical Union, Transactions, v. 25, p. 914–923.
Pope, L. M., Mehl, H. E., and Coiner, R. L., 2009, Quality characteristics of ground water in the Ozark aquifer of northwestern Arkansas, southeastern Kansas, southwestern Missouri, and northeastern Oklahoma, 2006–07: U.S. Geological Survey, Scientifi c Investigations Report 2009–5093, 60 p.
Stramel. G. J., 1957, The hydraulic properties of the Ordovician rocks at Pittsburg, Kansas: Kansas Geological Survey, Bulletin 127, part 5, p. 153–178.