
Temporal Comparison of Atmospheric Stability Classification Methods Ken Sejkora Entergy Nuclear...
49
Temporal Comparison of Atmospheric Stability Classification Methods Ken Sejkora Entergy Nuclear Northeast – Pilgrim Station Presented at the 14 th Annual RETS-REMP Workshop Syracuse, NY / 28-30 June 2004
-
Upload
lora-henderson -
Category
Documents
-
view
213 -
download
0
Transcript of Temporal Comparison of Atmospheric Stability Classification Methods Ken Sejkora Entergy Nuclear...

Temporal Comparison of Atmospheric Stability Classification Methods
Ken SejkoraEntergy Nuclear Northeast – Pilgrim
Station
Presented at the 14th Annual RETS-REMP WorkshopSyracuse, NY / 28-30 June 2004
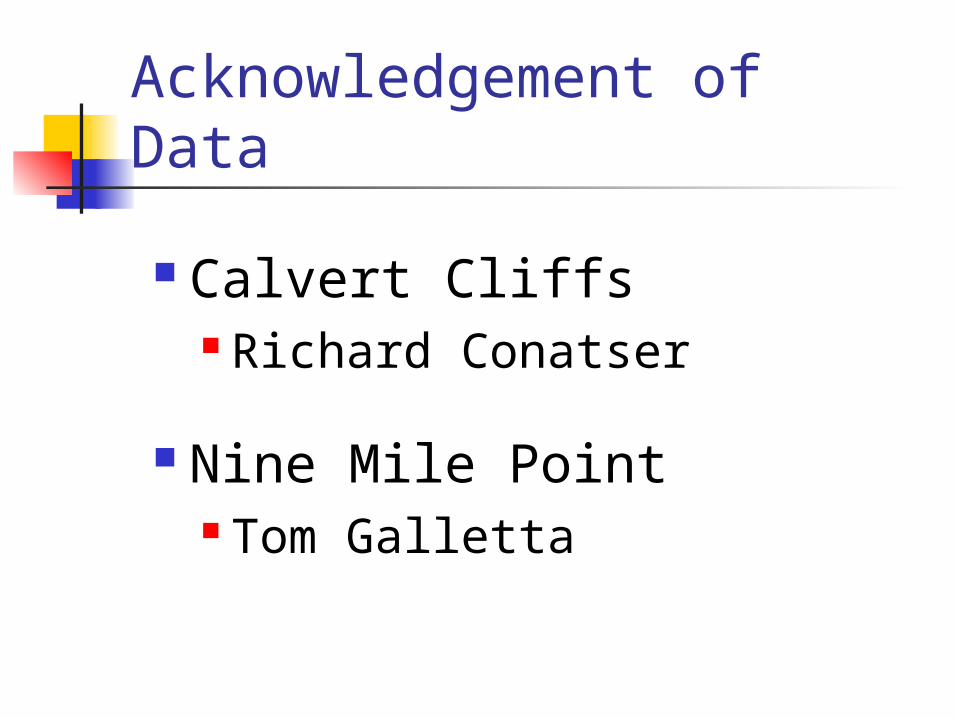
Acknowledgement of Data
Calvert Cliffs Richard Conatser
Nine Mile Point Tom Galletta

Basis of Problem Pilgrim Station was experiencing some
problems with the upper-level temperature indication used to derive delta-T on its primary tower
Question: Can Pilgrim substitute data from its backup tower, or another estimate of stability class, to meet data recovery goals?
Proposed Solution: Compare various estimates of stability class to determine suitability for substitution
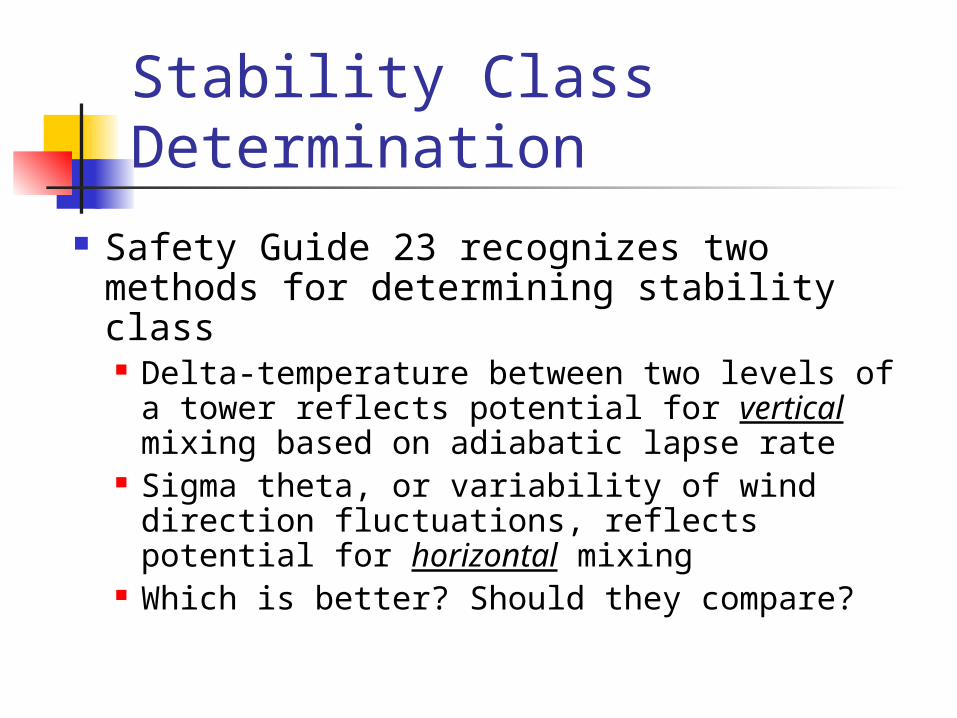
Stability Class Determination
Safety Guide 23 recognizes two methods for determining stability class Delta-temperature between two levels of
a tower reflects potential for vertical mixing based on adiabatic lapse rate
Sigma theta, or variability of wind direction fluctuations, reflects potential for horizontal mixing
Which is better? Should they compare?

Delta-T Method Employed by most plants as their primary
method for determining stability class Most plants measure temperature
differential between sensors at the top of the tower, and at the standard height of 10 meters (“bottom” of tower)
Some plants have temperature sensor at midpoint, and can derive multiple delta-T values (Top-Bottom, Middle-Bottom)
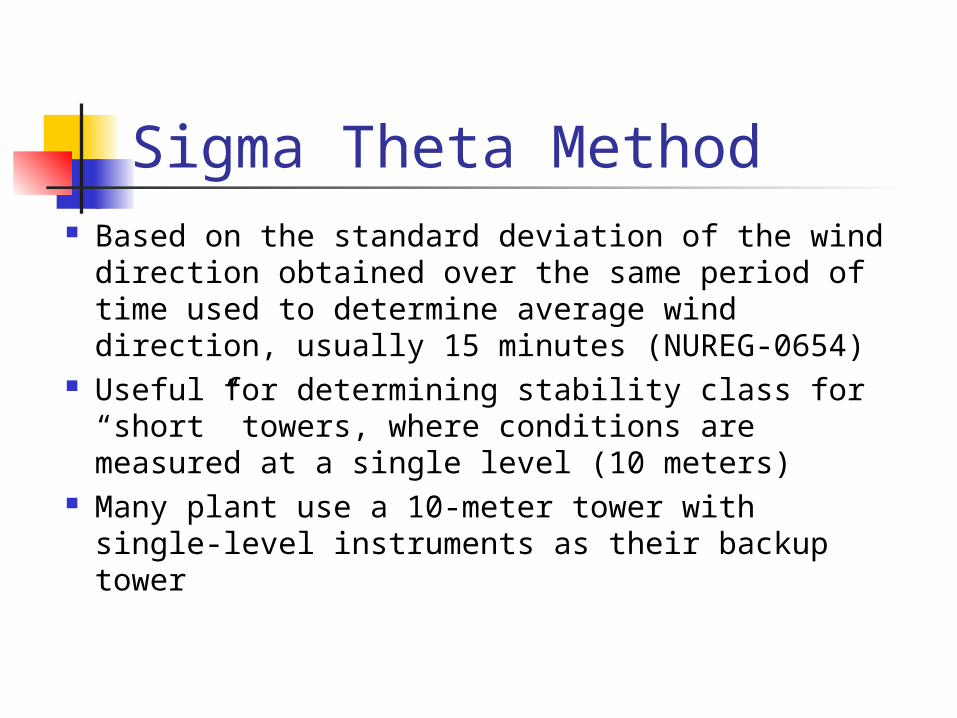
Sigma Theta Method Based on the standard deviation of the wind
direction obtained over the same period of time used to determine average wind direction, usually 15 minutes (NUREG-0654)
Useful for determining stability class for “short” towers, where conditions are measured at a single level (10 meters)
Many plant use a 10-meter tower with single-level instruments as their backup tower
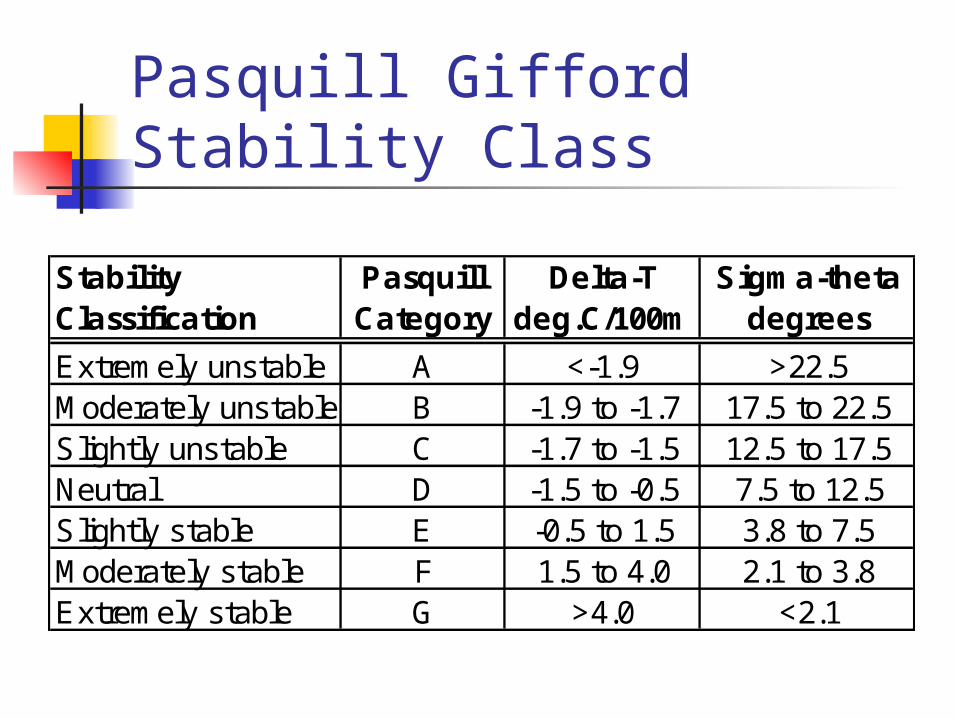
Pasquill Gifford Stability Class
Stability Classification
Pasquill Category
Delta-T deg.C/100m
Sigma-theta degrees
Extremely unstable A <-1.9 >22.5Moderately unstable B -1.9 to -1.7 17.5 to 22.5Slightly unstable C -1.7 to -1.5 12.5 to 17.5Neutral D -1.5 to -0.5 7.5 to 12.5Slightly stable E -0.5 to 1.5 3.8 to 7.5Moderately stable F 1.5 to 4.0 2.1 to 3.8Extremely stable G >4.0 <2.1

Dispersion Χ/Q Equation
2
2
2
2
2
2
2
)(exp
2
)(exp
2exp
2
1
zzyzy
hzhzy
uQ
X
Horizontal Dispersion Componen
t
Vertical Dispersion Component, Including
Reflection
y = distance from release point
z = terrain height above ground at distance ‘y’
h = elevation of release point above ground
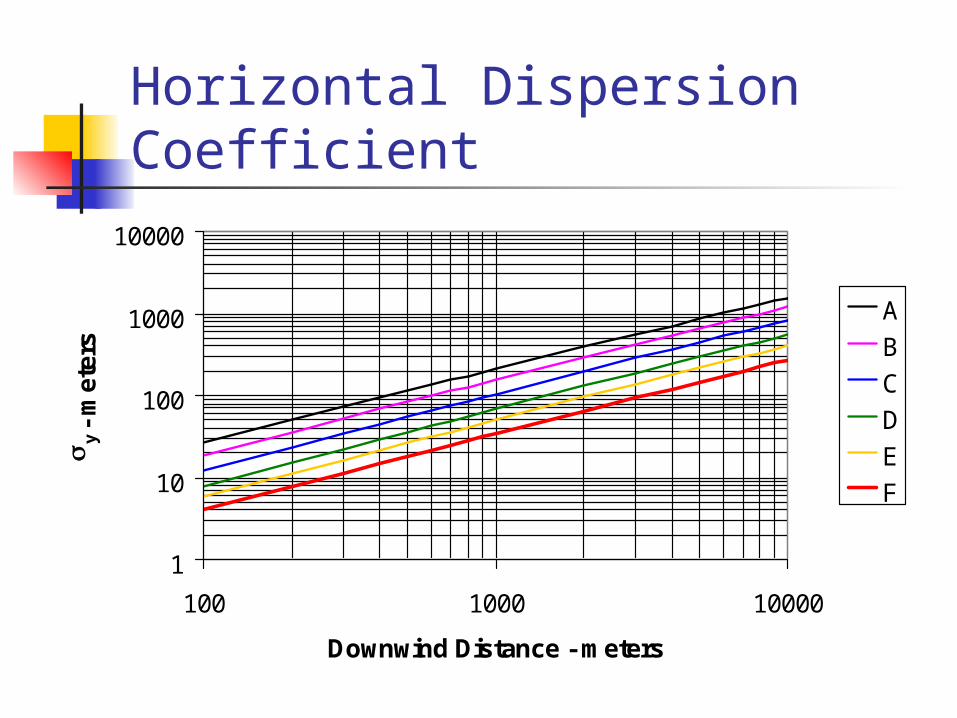
Horizontal Dispersion Coefficient
1
10
100
1000
10000
100 1000 10000
Downwind Distance - meters
y -
met
ers
A
B
C
D
E
F
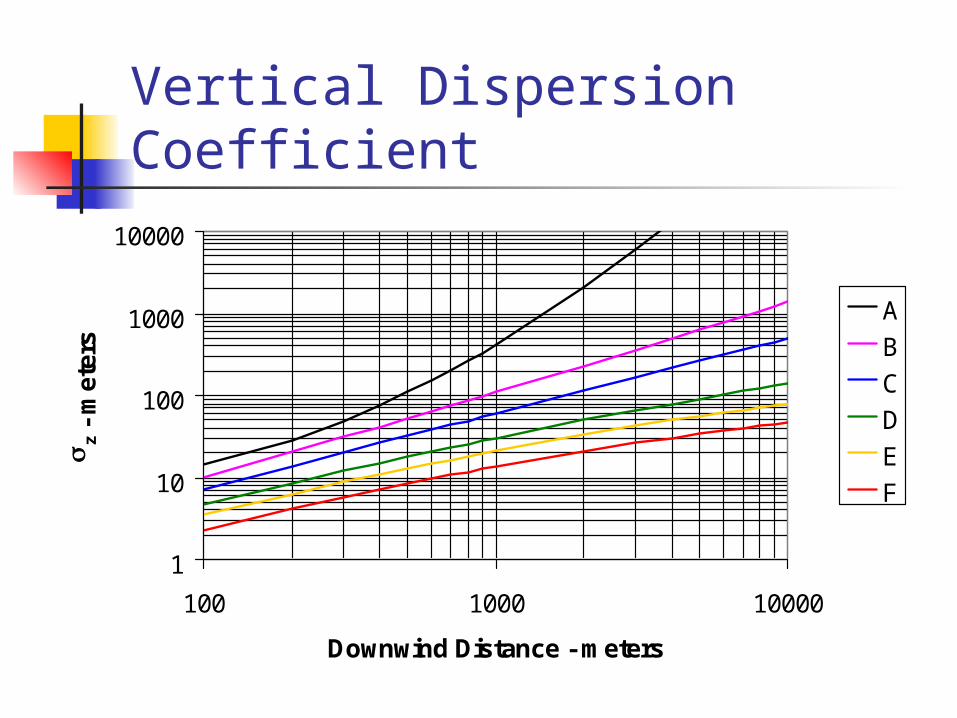
Vertical Dispersion Coefficient
1
10
100
1000
10000
100 1000 10000
Downwind Distance - meters
z
- m
eter
s
A
B
C
D
E
F
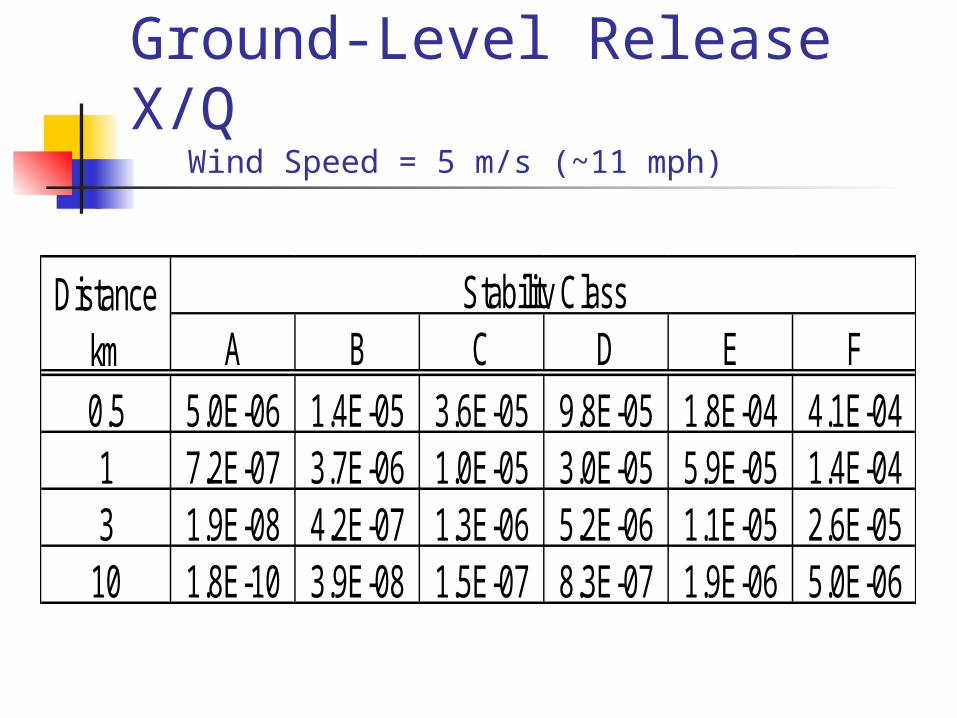
Ground-Level Release X/Q Wind Speed = 5 m/s (~11 mph)
A B C D E F0.5 5.0E-06 1.4E-05 3.6E-05 9.8E-05 1.8E-04 4.1E-041 7.2E-07 3.7E-06 1.0E-05 3.0E-05 5.9E-05 1.4E-043 1.9E-08 4.2E-07 1.3E-06 5.2E-06 1.1E-05 2.6E-05
10 1.8E-10 3.9E-08 1.5E-07 8.3E-07 1.9E-06 5.0E-06
Stability ClassDistance km

Elevated Release X/Q Stack Height = 60 m, Wind Speed = 5 m/s
A B C D E F0.5 4.3E-06 7.5E-06 6.3E-06 3.6E-07 4.2E-09 6.0E-151 7.1E-07 3.2E-06 6.1E-06 4.3E-06 1.1E-06 9.7E-093 1.9E-08 4.2E-07 1.3E-06 3.4E-06 4.0E-06 2.0E-06
10 1.8E-10 3.9E-08 1.5E-07 7.5E-07 1.5E-06 2.2E-06
Stability ClassDistance km

Pilgrim Meteorological Towers
Primary Tower 220-ft tall, based at ~80 ft above sea level on vegetated
area 270m from ocean Effective height = 300 ft Wind and temperature at top and 10m
Secondary (Backup) Tower 160-ft tall, based at ~20 ft above sea level in parking lot
100m from ocean Effective height = 180 ft Wind and temperature at top and 10m
Hourly averages for 3-year period, yielded ~25,000 observations

Stability Class Frequencies Pilgrim Station
Stability Class FrequenciesPilgrim Station
0%
10%
20%
30%
40%
50%
A B C D E F G
Stability Class
Fre
qu
ency
P S

Agreement Matrix
A B C D E F G Total
A 1751 821 318 857 278 15 3 4043
B 240 279 128 330 71 5 0 1053
C 173 261 191 451 112 2 2 1192
D 384 481 592 5037 813 54 26 7387
E 70 66 65 2281 3657 560 127 6826
F 138 35 21 180 720 794 432 2320
G 82 25 13 99 83 179 343 824
Total 2838 1968 1328 9235 5734 1609 933 23645
Primary
Secondary
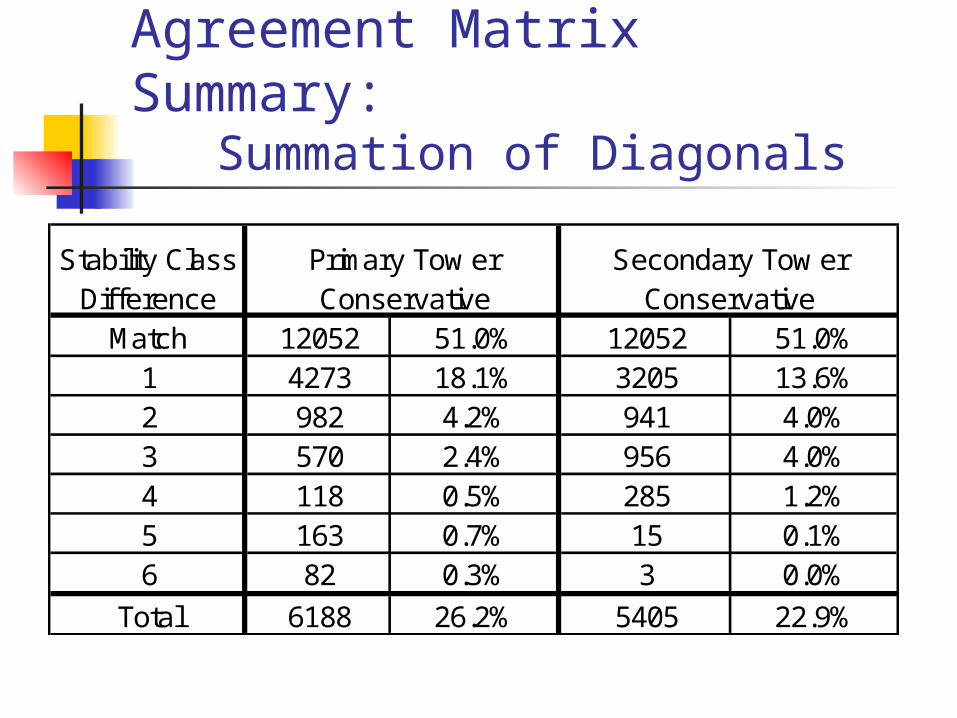
Match 12052 51.0% 12052 51.0%1 4273 18.1% 3205 13.6%2 982 4.2% 941 4.0%3 570 2.4% 956 4.0%4 118 0.5% 285 1.2%5 163 0.7% 15 0.1%6 82 0.3% 3 0.0%
Total 6188 26.2% 5405 22.9%
Stability Class Difference
Primary Tow er Conservative
Secondary Tow er Conservative
Agreement Matrix Summary: Summation of Diagonals
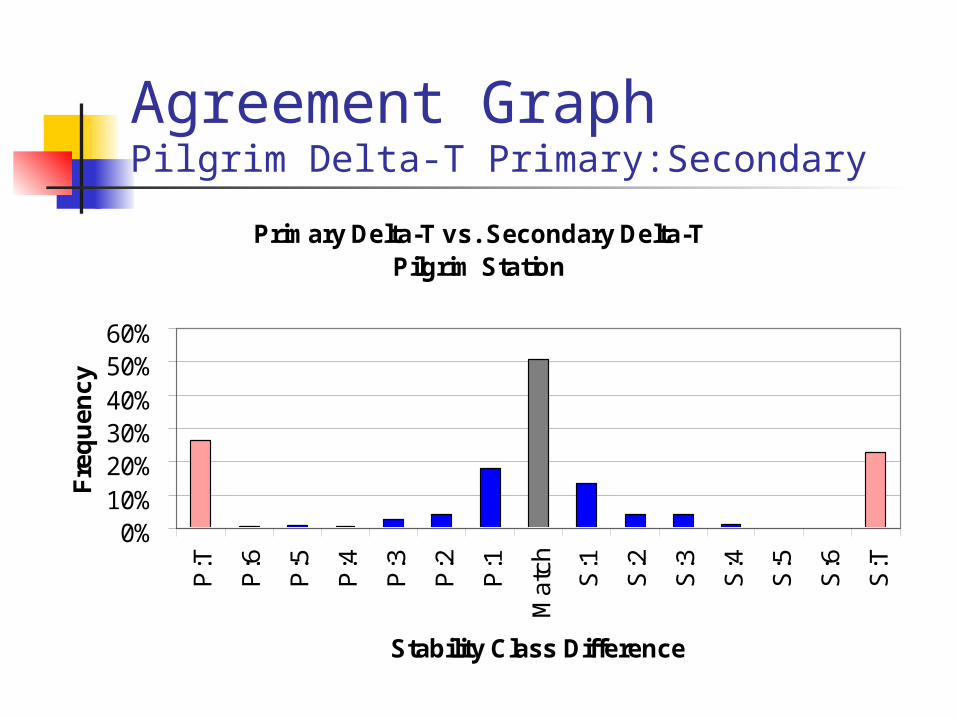
Agreement GraphPilgrim Delta-T Primary:Secondary
Primary Delta-T vs. Secondary Delta-TPilgrim Station
0%10%20%30%40%50%60%
P:T
P:6
P:5
P:4
P:3
P:2
P:1
Mat
ch S:1
S:2
S:3
S:4
S:5
S:6
S:T
Stability Class Difference
Fre
qu
ency

Class A Hour DistributionPilgrim Station
Class A Stability vs. Time of DayPilgrim Station
0%
5%
10%
15%
0 2 4 6 8
10 12 14 16 18 20 22
Hour of Day
Fre
qu
ency
of
Cla
ss A
P S

Class G Hour DistributionPilgrim Station
Class G Stability vs. Time of DayPilgrim Station
0%
2%
4%
6%
8%
10%
0 2 4 6 8
10 12 14 16 18 20 22
Hour of Day
Fre
qu
ency
of
Cla
ss G
P S
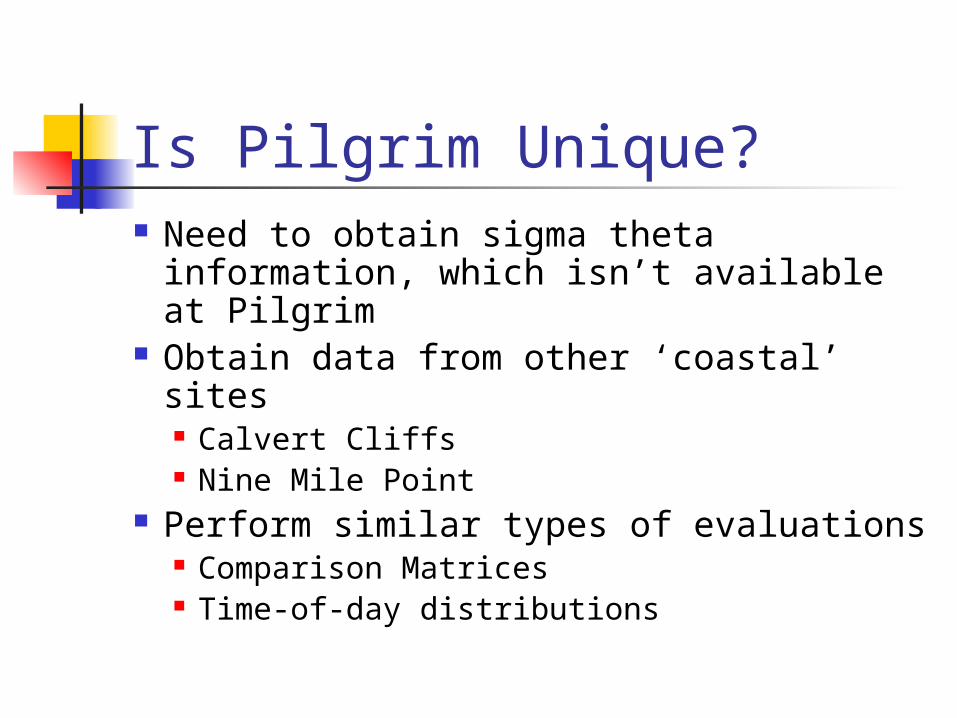
Is Pilgrim Unique? Need to obtain sigma theta
information, which isn’t available at Pilgrim
Obtain data from other ‘coastal’ sites Calvert Cliffs Nine Mile Point
Perform similar types of evaluations Comparison Matrices Time-of-day distributions

Calvert Cliffs Data Obtained from single tower, with
instruments at 10m and 60m Hourly averages for 3-year period: 2000,
2001, 2002, yielded ~25,000 observations Calvert Cliffs adjusts stability class based on
guidance in EPA-454/R-99-005, "Meteorological Monitoring Guidelines For Regulatory Modeling Applications.”
However, I used “raw” data categorized by Safety Guide 23 guidance… I had to process data

Stability Class Frequencies Calvert Cliffs
Stability Class FrequenciesCalvert Cliffs
0%
20%
40%
60%
80%
A B C D E F G
Stability Class
Fre
qu
en
cy
Delta L-Sigma U-Sigma

Agreement GraphCalvert Delta-T:Lower Sigma Theta
60-m Delta-T vs. 10-m Sigma
0%
10%
20%
30%
40%
50%
60%
DT
:T
DT
:6
DT
:5
DT
:4
DT
:3
DT
:2
DT
:1
Ma
tch
LS
:1
LS
:2
LS
:3
LS
:4
LS
:5
LS
:6
LS
:T
Stability Class Difference
Fre
qu
en
cy

Agreement GraphCalvert Delta-T:Upper Sigma Theta
60-m Delta-T vs. 60-m Sigma
0%
10%
20%
30%
40%
50%
60%
DT
:T
DT
:6
DT
:5
DT
:4
DT
:3
DT
:2
DT
:1
Ma
tch
US
:1
US
:2
US
:3
US
:4
US
:5
US
:6
US
:T
Stability Class Difference
Fre
qu
en
cy
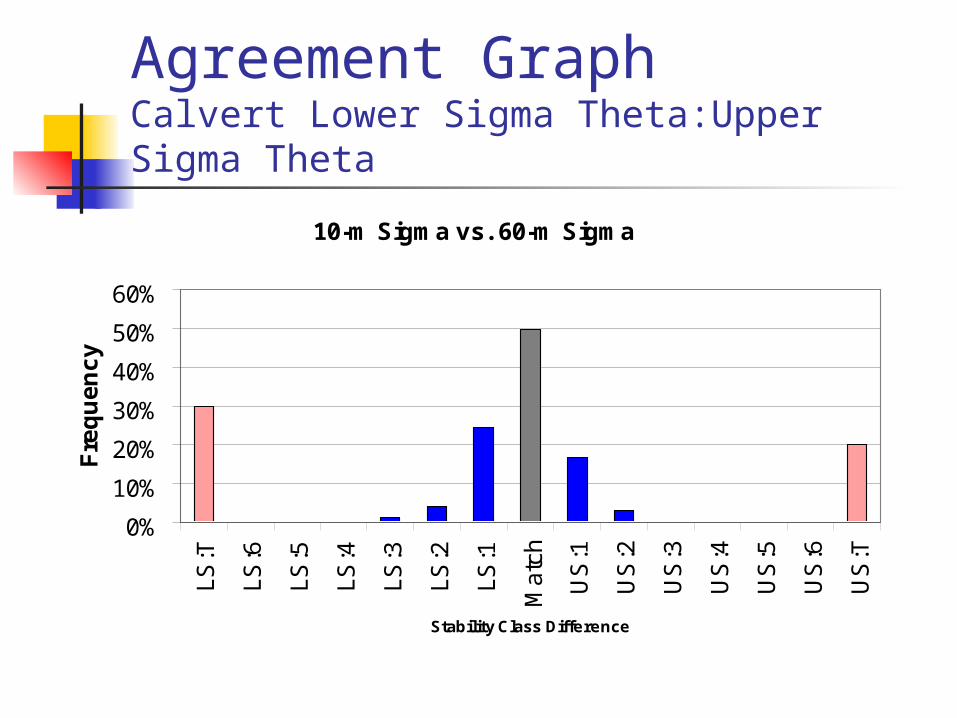
Agreement GraphCalvert Lower Sigma Theta:Upper Sigma Theta
10-m Sigma vs. 60-m Sigma
0%
10%
20%
30%
40%
50%
60%
LS
:T
LS
:6
LS
:5
LS
:4
LS
:3
LS
:2
LS
:1
Ma
tch
US
:1
US
:2
US
:3
US
:4
US
:5
US
:6
US
:T
Stability Class Difference
Fre
qu
en
cy

Class A Hour DistributionCalvert Cliffs
Class A Stability vs. Time of Day
0%
5%
10%
15%
20%
25%
30%
0 2 4 6 8
10
12
14
16
18
20
22
Hour of Day
Fre
qu
en
cy
of
Cla
ss
A
Delta L-Sigma U-Sigma
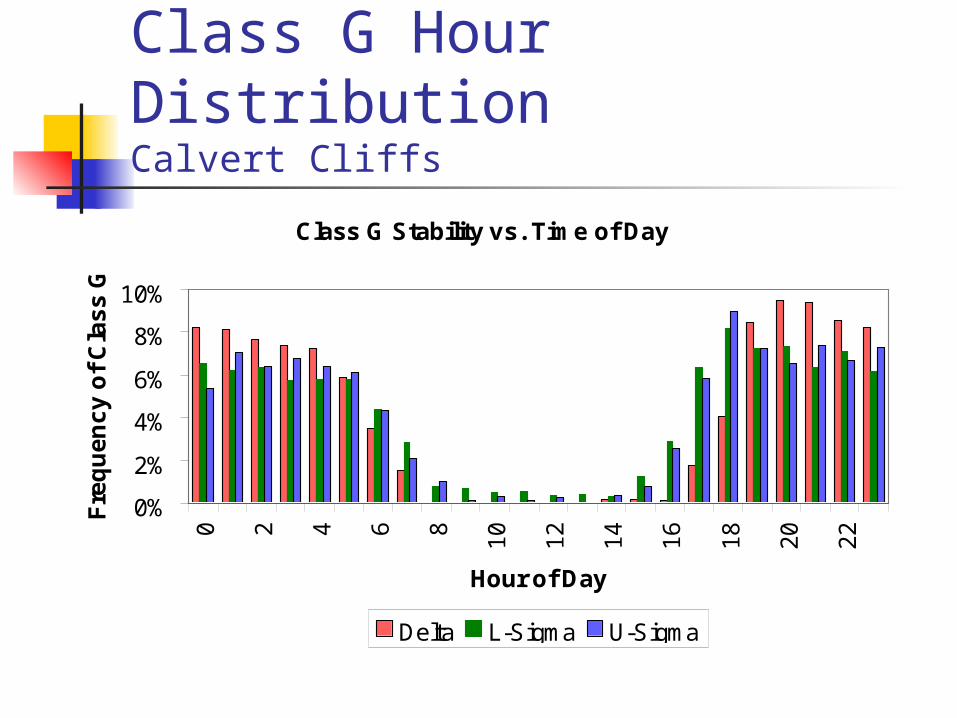
Class G Hour DistributionCalvert Cliffs
Class G Stability vs. Time of Day
0%
2%
4%
6%
8%
10%
0 2 4 6 8
10
12
14
16
18
20
22
Hour of Day
Fre
qu
en
cy
of
Cla
ss
G
Delta L-Sigma U-Sigma

Nine Mile Point Data Obtained from single tower, with
instruments at 30ft, 100ft, and 200ft 15-min averages for 2-year period: 2001,
2002, yielded ~70,000 observations Used ‘processed’ 15-minute stability class
data categorized by Safety Guide 23 guidance… I used what Nine Mile provided
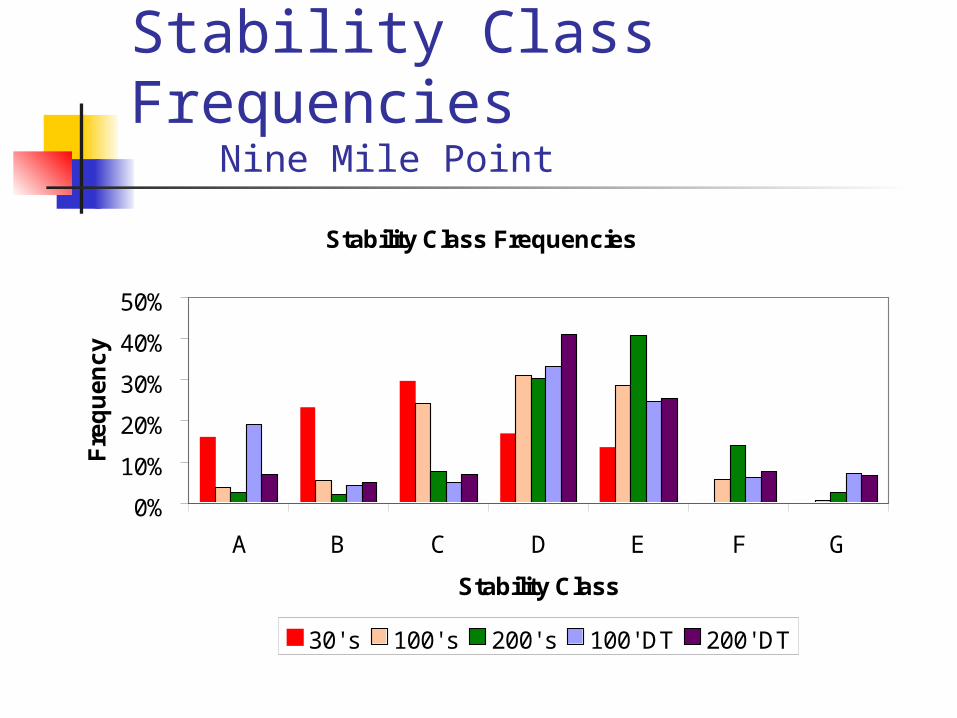
Stability Class Frequencies Nine Mile Point
Stability Class Frequencies
0%
10%
20%
30%
40%
50%
A B C D E F G
Stability Class
Fre
qu
en
cy
30' s 100' s 200' s 100' DT 200' DT

Agreement GraphNine Mile Lower Delta-T:Upper Delta-T
100-ft Delta-T vs. 200-ft Delta-T
0%
20%
40%
60%
80%
100%
10
0t-
T
10
0t-
6
10
0t-
5
10
0t-
4
10
0t-
3
10
0t-
2
10
0t-
1
Ma
tch
20
0t-
1
20
0t-
2
20
0t-
2
20
0t-
4
20
0t-
5
20
0t-
6
20
0t-
T
Stability Class Difference
Fre
qu
en
cy
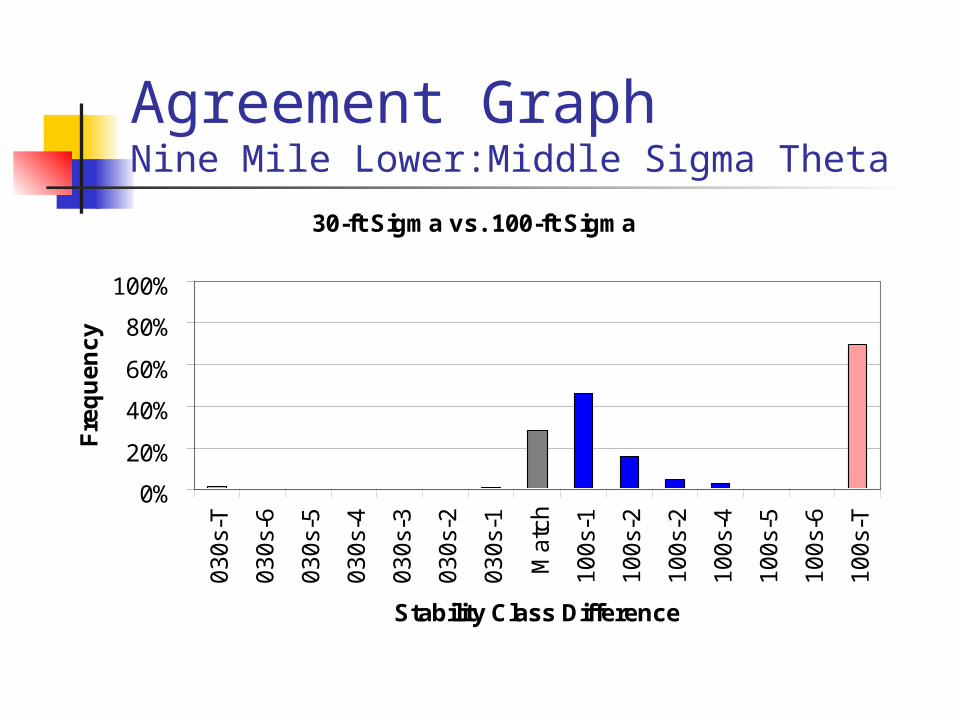
Agreement GraphNine Mile Lower:Middle Sigma Theta
30-ft Sigma vs. 100-ft Sigma
0%
20%
40%
60%
80%
100%
03
0s-
T
03
0s-
6
03
0s-
5
03
0s-
4
03
0s-
3
03
0s-
2
03
0s-
1
Ma
tch
10
0s-
1
10
0s-
2
10
0s-
2
10
0s-
4
10
0s-
5
10
0s-
6
10
0s-
T
Stability Class Difference
Fre
qu
en
cy
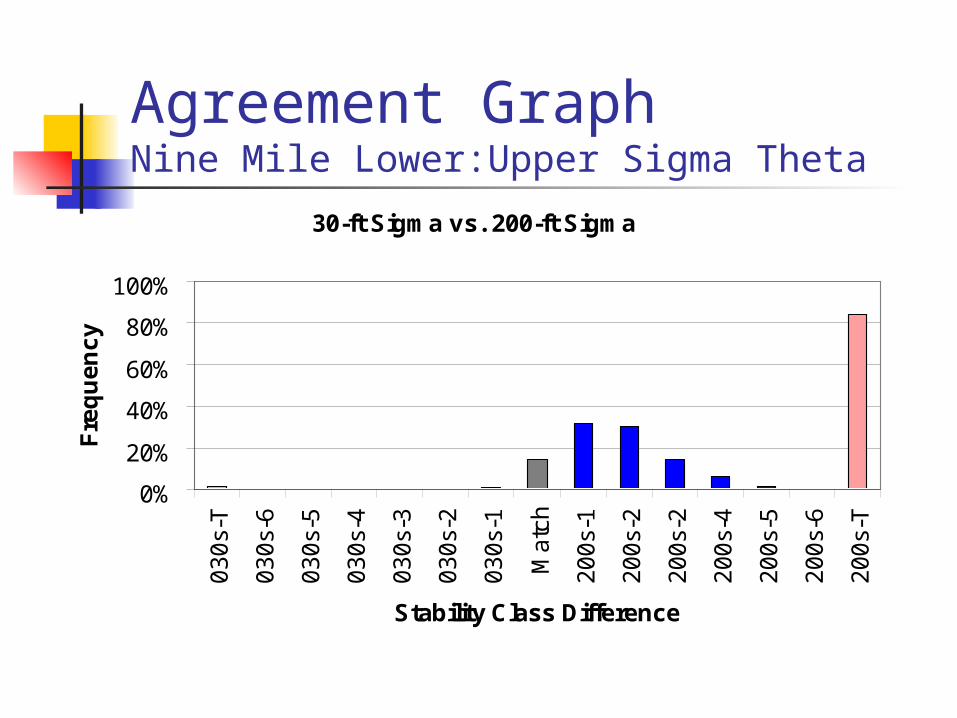
Agreement GraphNine Mile Lower:Upper Sigma Theta
30-ft Sigma vs. 200-ft Sigma
0%
20%
40%
60%
80%
100%
03
0s-
T
03
0s-
6
03
0s-
5
03
0s-
4
03
0s-
3
03
0s-
2
03
0s-
1
Ma
tch
20
0s-
1
20
0s-
2
20
0s-
2
20
0s-
4
20
0s-
5
20
0s-
6
20
0s-
T
Stability Class Difference
Fre
qu
en
cy

Agreement GraphNine Mile Middle:Upper Sigma Theta
100-ft Sigma vs. 200-ft Sigma
0%
20%
40%
60%
80%
100%
10
0s-
T
10
0s-
6
10
0s-
5
10
0s-
4
10
0s-
3
10
0s-
2
10
0s-
1
Ma
tch
20
0s-
1
20
0s-
2
20
0s-
2
20
0s-
4
20
0s-
5
20
0s-
6
20
0s-
T
Stability Class Difference
Fre
qu
en
cy
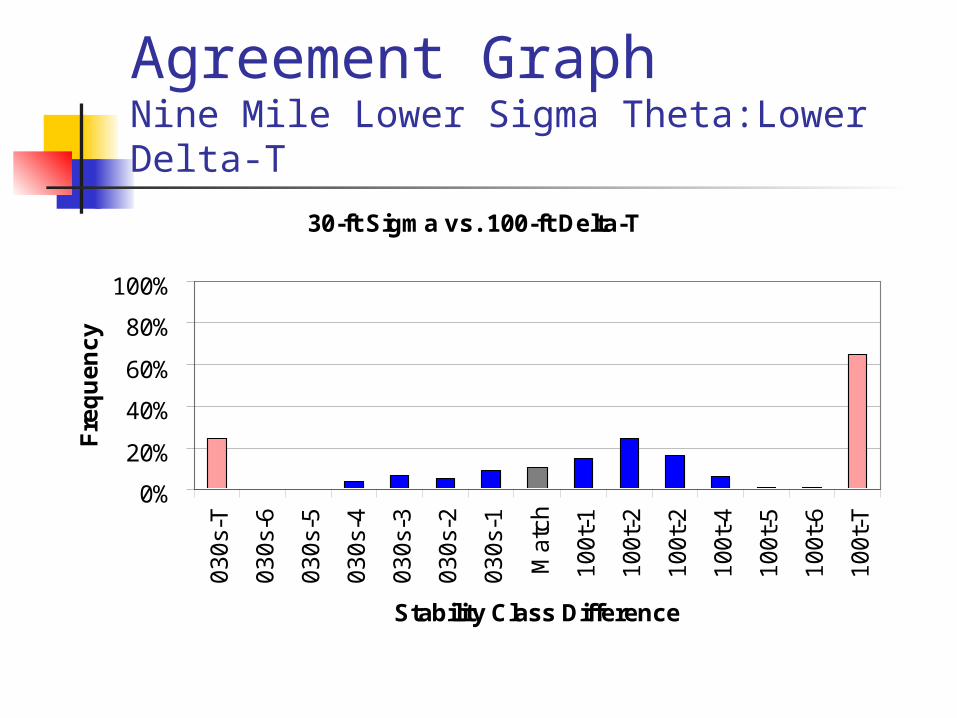
Agreement GraphNine Mile Lower Sigma Theta:Lower Delta-T
30-ft Sigma vs. 100-ft Delta-T
0%
20%
40%
60%
80%
100%
03
0s-
T
03
0s-
6
03
0s-
5
03
0s-
4
03
0s-
3
03
0s-
2
03
0s-
1
Ma
tch
10
0t-
1
10
0t-
2
10
0t-
2
10
0t-
4
10
0t-
5
10
0t-
6
10
0t-
T
Stability Class Difference
Fre
qu
en
cy

Agreement GraphNine Mile Lower Sigma Theta:Upper Delta-T
30-ft Sigma vs. 200-ft Delta-T
0%
20%
40%
60%
80%
100%
03
0s-
T
03
0s-
6
03
0s-
5
03
0s-
4
03
0s-
3
03
0s-
2
03
0s-
1
Ma
tch
20
0t-
1
20
0t-
2
20
0t-
2
20
0t-
4
20
0t-
5
20
0t-
6
20
0t-
T
Stability Class Difference
Fre
qu
en
cy
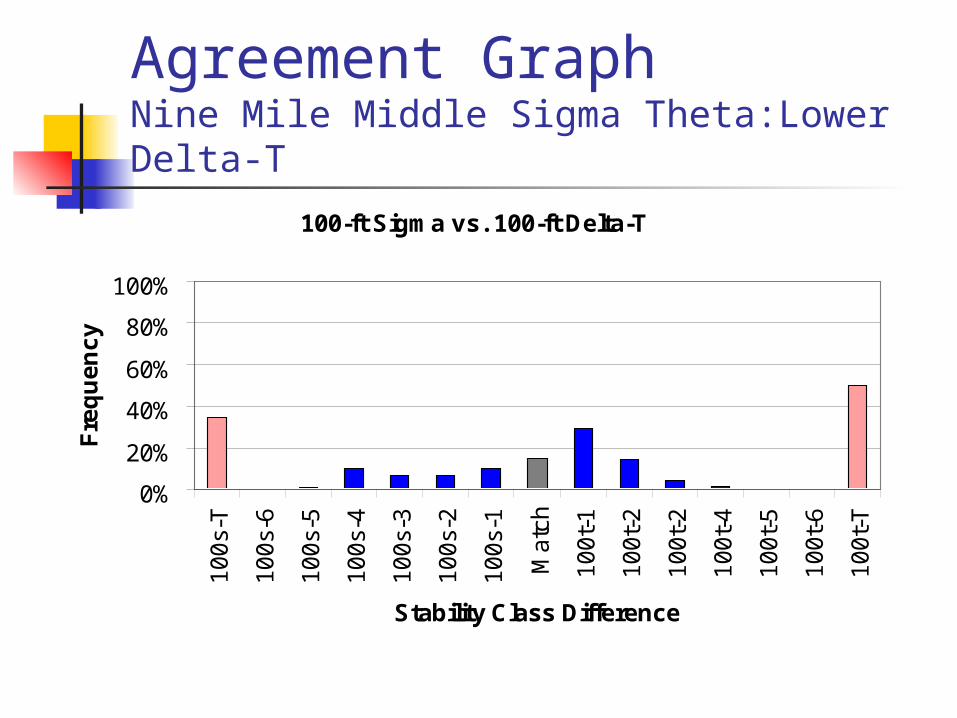
Agreement GraphNine Mile Middle Sigma Theta:Lower Delta-T
100-ft Sigma vs. 100-ft Delta-T
0%
20%
40%
60%
80%
100%
10
0s-
T
10
0s-
6
10
0s-
5
10
0s-
4
10
0s-
3
10
0s-
2
10
0s-
1
Ma
tch
10
0t-
1
10
0t-
2
10
0t-
2
10
0t-
4
10
0t-
5
10
0t-
6
10
0t-
T
Stability Class Difference
Fre
qu
en
cy

Agreement GraphNine Mile Middle Sigma Theta:Upper Delta-T
100-ft Sigma vs. 200-ft Delta-T
0%
20%
40%
60%
80%
100%
10
0s-
T
10
0s-
6
10
0s-
5
10
0s-
4
10
0s-
3
10
0s-
2
10
0s-
1
Ma
tch
20
0t-
1
20
0t-
2
20
0t-
2
20
0t-
4
20
0t-
5
20
0t-
6
20
0t-
T
Stability Class Difference
Fre
qu
en
cy
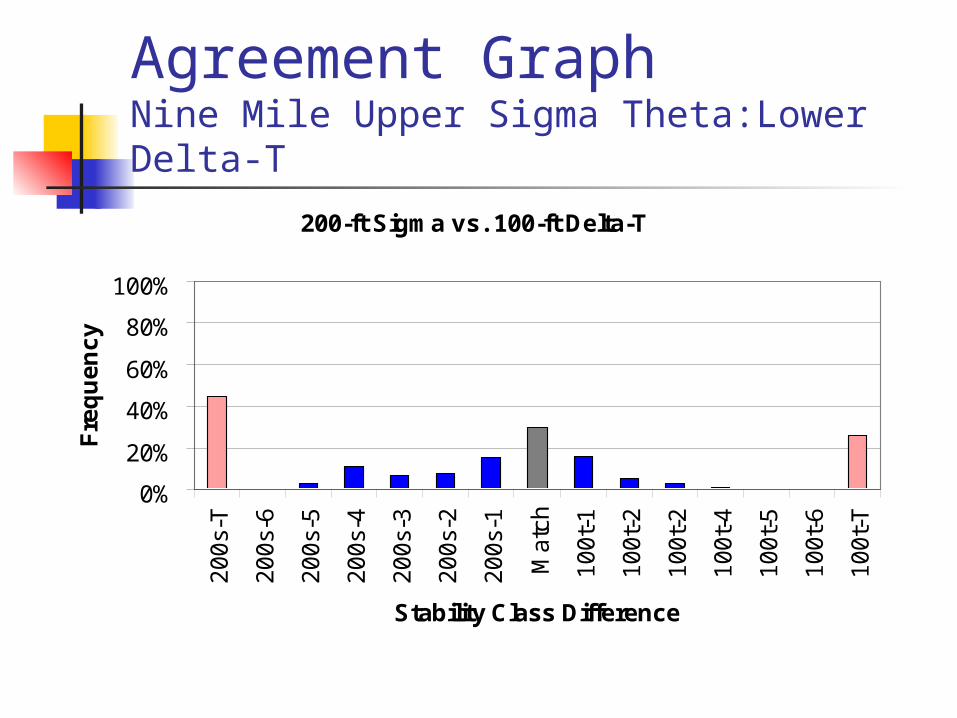
Agreement GraphNine Mile Upper Sigma Theta:Lower Delta-T
200-ft Sigma vs. 100-ft Delta-T
0%
20%
40%
60%
80%
100%
20
0s-
T
20
0s-
6
20
0s-
5
20
0s-
4
20
0s-
3
20
0s-
2
20
0s-
1
Ma
tch
10
0t-
1
10
0t-
2
10
0t-
2
10
0t-
4
10
0t-
5
10
0t-
6
10
0t-
T
Stability Class Difference
Fre
qu
en
cy

Agreement GraphNine Mile Upper Sigma Theta:Upper Delta-T
200-ft Sigma vs. 200-ft Delta-T
0%
20%
40%
60%
80%
100%
20
0s-
T
20
0s-
6
20
0s-
5
20
0s-
4
20
0s-
3
20
0s-
2
20
0s-
1
Ma
tch
20
0t-
1
20
0t-
2
20
0t-
2
20
0t-
4
20
0t-
5
20
0t-
6
20
0t-
T
Stability Class Difference
Fre
qu
en
cy

Class A Hour DistributionNine Mile Point: Delta-T Data
Class A Frequency vs. Time of Day
0.0%2.0%4.0%6.0%8.0%
10.0%12.0%14.0%
0 2 4 6 8
10
12
14
16
18
20
22
Hour of Day
Fre
qu
en
cy
of
Cla
ss
A
100' DT 200' DT
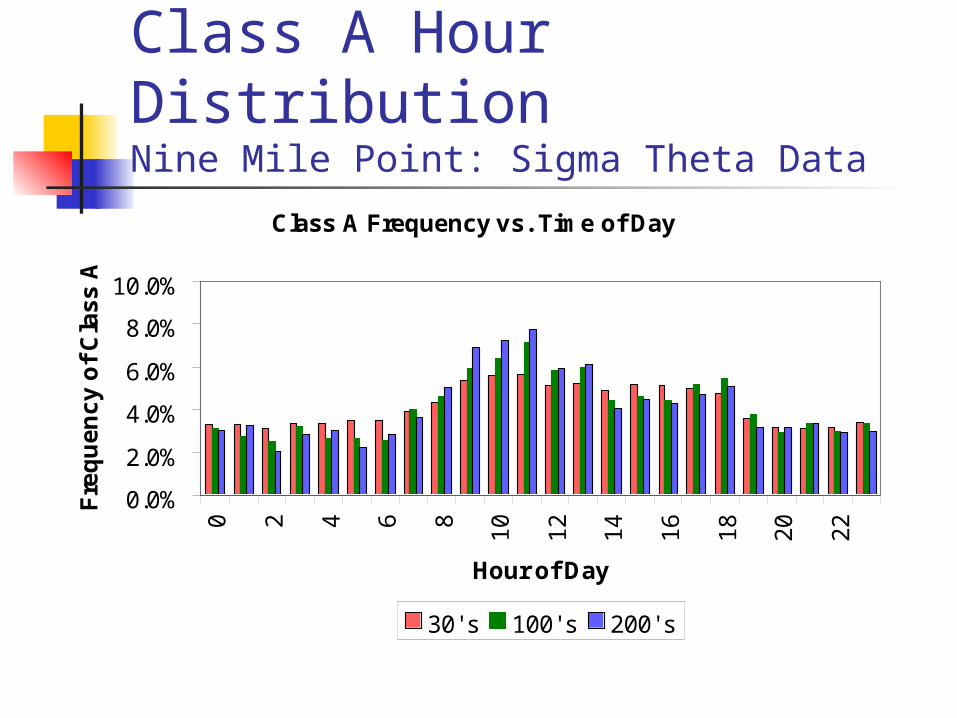
Class A Hour DistributionNine Mile Point: Sigma Theta Data
Class A Frequency vs. Time of Day
0.0%
2.0%
4.0%
6.0%
8.0%
10.0%
0 2 4 6 8
10
12
14
16
18
20
22
Hour of Day
Fre
qu
en
cy
of
Cla
ss
A
30' s 100' s 200' s
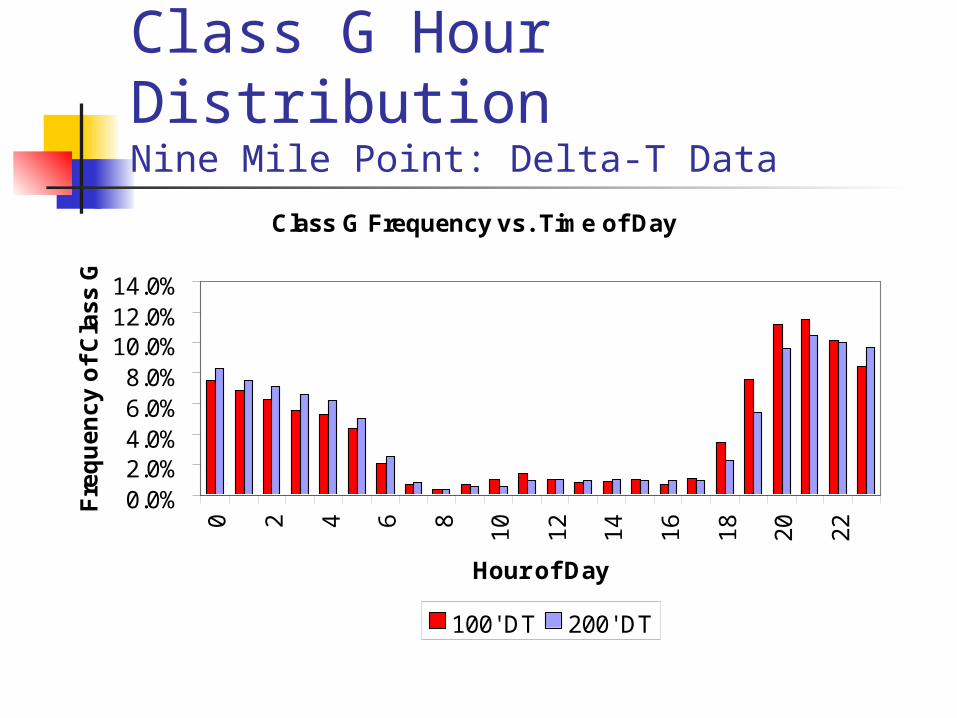
Class G Hour DistributionNine Mile Point: Delta-T Data
Class G Frequency vs. Time of Day
0.0%2.0%4.0%6.0%8.0%
10.0%12.0%14.0%
0 2 4 6 8
10
12
14
16
18
20
22
Hour of Day
Fre
qu
en
cy
of
Cla
ss
G
100' DT 200' DT

Class G Hour DistributionNine Mile Point: Sigma Theta Data
Class G Frequency vs. Time of Day
0.0%2.0%4.0%6.0%8.0%
10.0%12.0%14.0%
0 2 4 6 8
10
12
14
16
18
20
22
Hour of Day
Fre
qu
en
cy
of
Cla
ss
G
30' s 100' s 200' s

Summary Stability classes derived from delta-T
do not compare well with those derived from sigma theta method… limited applicability for substitution
Measurements at the top of the tower (delta-T and/or sigma theta) tend to yield higher stability classes

Summary – continued Stability classes derived from
delta-T show a higher dependence on time of day… due to solar heating of the ground
All three plants had a higher than expected frequency of class A compared to other stability classes… coastal phenomenon?
Summary – continued Each increase in stability class will tend
to increase concentrations and resulting doses by 2 to 10 times, or maybe even more… implications to using substitute or alternate data?
‘Adjustments’ of stability class information outlined in EPA-454/R-99-005 may provide an avenue to improve comparability

Concerns - I If primary source of stability class is lost, is using
an alternate source that could yield a stability class that is different by 2 or more classes appropriate?
Especially of concern if primary source is delta-T, and backup is sigma theta from a short tower.
However, consider – Any local data is better than remote data Most remote sources of data (airport, NWS) are not
equipped to provide information for derivation of stability class
Concerns - II Is it appropriate to extrapolate stability class
from a given level of a tower to a different level of a release point?
Consider – Stability class measured at a given level of a tower
reflects conditions at that level Need to match level of measurement with level of
release point as much as practicable Delta-T reflects vertical mixing, whereas sigma theta
reflects horizontal mixing… both are needed in X/Q determination, but seldom independently measured and simultaneously applied

Concerns - III
Which method is better… delta-T or sigma theta?
Consider – Safety guide 23 references both methods, so either
is appropriate for regulatory compliance… does the NRC have a preference?
You may want to perform your own evaluation or comparison so that you are familiar with the specifics at your site, are comfortable with any differences, and understand enough to defend your approach