ACS$InstrumentStatus$ · ACS$InstrumentStatus$ $$ (N.$Grogin$and$the$ACS$Team)$ STUC$–Apr$2015$ 1
Supplementary Material
Coupled production and emission of short chain perfluoroalkyl acids from a
fast developing fluorochemical industry: evidence from yearly and seasonal
monitoring in Daling River Basin, China
Pei Wang a, Yonglong Lu a, *, Tieyu Wang a , Zhaoyun Zhu a,b, Qifeng Li a,b, Jing Meng a,b,
Hongqiao Su a,b, Andrew C. Johnson c, Andrew J. Sweetman c,d
a State Key Lab of Urban and Regional Ecology, Research Center for Eco-Environmental
Sciences, Chinese Academy of Sciences, Beijing 100085, China
b University of Chinese Academy of Sciences, Beijing 100049, China
c Centre for Ecology & Hydrology, Maclean Building, Crowmarsh Gifford Wallingford, Oxon,
OX 10 8BB, UK
d Lancaster Environment Centre, Lancaster University, Lancaster LA1 4YQ, UK
Corresponding author:
Tel: 86-10-62917903; Fax: 86-10-62918177;
E-mail: [email protected]
1 / 25
1
2
3
4
5
6
7
8
9
10
11
12
13
14
15
16
17
18
1
2

Content
Standards and Reagents
Quality Assurance and Quality Control (QA/QC)
Tables
Table S1 Geographical coordinates and time for all the sampling campaigns in this study.
Table S2 Water parameters measured in-situ during annual sampling campaign.
Table S3 Water parameters measured in-situ during seasonal sampling campaign.
Table S4 QA/QC information including monitoring transitions, matrix spike recovery (MSR),
procedure recovery (PR), limit of detection (LOD), and limit of quantification (LOQ)
(Mean: Arithmetic mean; SD: Standard deviation; n indicates the number of samples
analyzed.)
Table S5 Conditions for HPLC and ESI- MS.
Table S6 PFAA concentrations (ng/L) in Daling River water in 2011.
Table S7 PFAA concentrations (ng/L) in Daling River water in 2012.
Table S8 PFAA concentrations (ng/L) in Daling River water in 2013.
Table S9 PFAA concentrations (ng/L) in Daling River water in 2014.
Table S10 PFAA concentrations (ng/L) in Daling River water in January, 2013.
Table S11 PFAA concentrations (ng/L) in Daling River water in April, 2013.
Table S12 PFAA concentrations (ng/L) in Daling River water in July, 2013.
Table S13 PFAA concentrations (ng/L) in Daling River water in October, 2013.
Table S14 PFAA concentrations (ng/L) in drinking water around Park 1.
Table S15 Pearson correlations among products capacities and PFAA concentrations (mean
values from site 3 to site 8X in the Xihe River) from 2011 to 2014.
2 / 25
19
20
21
22
23
24
25
26
27
28
29
30
31
32
33
34
35
36
37
38
39
40
41
3
4
Table S16 One-way ANOVA analysis of the dominant PFAA concentrations (from site 3 to site
8X in the Xihe River) from 2011 to 2014.
Figures
Figure S1 The geology of the drinking water sampling.
References
3 / 25
42
43
44
45
46
5
6

Standards and Reagents
A mixture of 17 native linear PFAAs (PFAC-MXB) including Perfluorobutanoic acid (PFBA),
Perfluoropentanoic acid (PFPeA), Perfluorohexanoic acid (PFHxA), Perfluoroheptanoic acid
(PFHpA), Perfluorooctanoic acid (PFOA), Perfluorononanoic acid (PFNA), Perfluorodecanoic
acid (PFDA), Perfluoroundecanoic acid (PFUnDA), Perfluorododecanoic acid (PFDoDA),
Perfluorotridecanoic acid (PFTrDA), Perfluorotetradecanoic acid (PFTeDA),
Perfluorohexadecanoic acid (PFHxDA), Perfluorooctadecanoic acid (PFODA), Potassium
Perfluorobutanesulfonate (PFBS), Sodium Perfluorohexanesulfonate (PFHxS), Potassium
Perfluorooctanesulfonate (PFOS), Sodium Perfluorodecanesulfonate (PFDS) and a mixture of 9
mass-labeled linear PFAAs (MPFAC-MXA) including PFBA [1,2,3,4 13C], PFHxA [1,2,3,4
13C], PFOA [1,2,3,4 13C], PFNA [1,2,3,4 13C], PFDA [1,2,3,4 13C], PFUnDA [1,2,3,4 13C],
PFDoDA [1,2 13C], PFHxS [1,2 18O] and PFOS [1,2,3,4 13C] were purchased from Wellington
Laboratories with purities of >98% (Guelph, Ontario, Canada). HPLC grade methanol and
acetonitrile (ACN) were purchased from J.T. Baker (Phillipsburg, NJ, USA). Ammonium acetate
(~98%) and ammonium hydroxide solution (28%~30% NH3 basis) were purchased from Sigma-
Aldrich Co. (St. Louis, MO, USA). Milli-Q water was obtained from a Milli-Q synthesis A10
(Millipore, Bedford, MA, USA) and used throughout the experiment.
Quality Assurance and Quality Control (QA/QC)
To minimize background contamination, use of polytetrafluoroethylene (PTFE) or other
fluoropolymer materials was avoided during collection and extraction of samples as much as
possible. In order to avoid cross contamination in the field sampling, after the samples were
taken, outside of the PP bottles were washed thoroughly with Milli-Q water, wiped with clean
4 / 25
47
48
49
50
51
52
53
54
55
56
57
58
59
60
61
62
63
64
65
66
67
68
69
7
8
towel paper and then kept in three-layers sealed PP bags for further storage and transportation.
Field blank and transportation blank prepared in Milli-Q water were introduced to monitor if
there was still cross contamination after this treatment. To monitor cross and background
contamination during extraction and clean-up, procedure blanks were executed along with every
sample batch by use of Milli-Q water. Solvent blank was prepared using 100% methanol and ran
after 10 samples to monitor background contamination of the instrument and minimize cross
contamination. A guard column immediately in front of the injector loop was used to displace
any contaminants introduced in the instrument from analytes in samples. No detectable PFAAs
were observed at concentrations greater than the Limit of Quantification (LOQ) in any of the
field, transport, procedure or solvent blanks. Concentrations of PFAAs greater than the LOD in
blank samples were not used to correct concentrations in this study.
Concentrations of 12 PFAAs in water were quantified using 10-point external calibration
curves containing a concentration series of 0.01, 0.1, 0.5, 1, 5, 10, 50, 100, 500 and 1000 ng/mL,
and 10 ng/mL of mass-labelled standards were used for surrogates. Curves for all PFAAs
showed strong linearity with R2 > 0.99 and the deviation of every calibration point was less than
±20% from its theoretical value. The concentration of 10 ng/mL in the calibration curve was
also used as calibration check standard (CCS) and ran after every 10 samples. When the
deviation of a CCS was more than ±20% from its theoretical value, a new calibration curve was
prepared. For concentrations of PFAAs in any extracts measured over 1000 ng/mL for the first
time, the volume of the samples would be reduced and the samples would be extracted again to
make sure the concentrations of PFAAs in the final extracts fall in the range of the calibration
series.
5 / 25
70
71
72
73
74
75
76
77
78
79
80
81
82
83
84
85
86
87
88
89
90
91
9
10

In order to assess overall efficiency of extraction, two kinds of recovery experiments were
performed (Loi et al., 2011). For procedure recovery test and matrix spike recovery test in water,
20 ng mixtures of 12 native PFAAs standards were spiked into 400 mL Milli-Q water via 4
duplicates and 400 mL water samples at site 1, 2, 17 and 18, respectively. Results are listed in
Table S3.
The limit of detection (LOD) was defined as the lowest concentration that provided a
signal/noise (S/N) > 3 (peak height), and the limit of quantification (LOQ) was defined as the
lowest concentration providing S/N >10. Both values were determined in three successive
injections with a standard deviation less than 20%. The values are listed in Table S3.
6 / 25
92
93
94
95
96
97
98
99
100
101
11
12
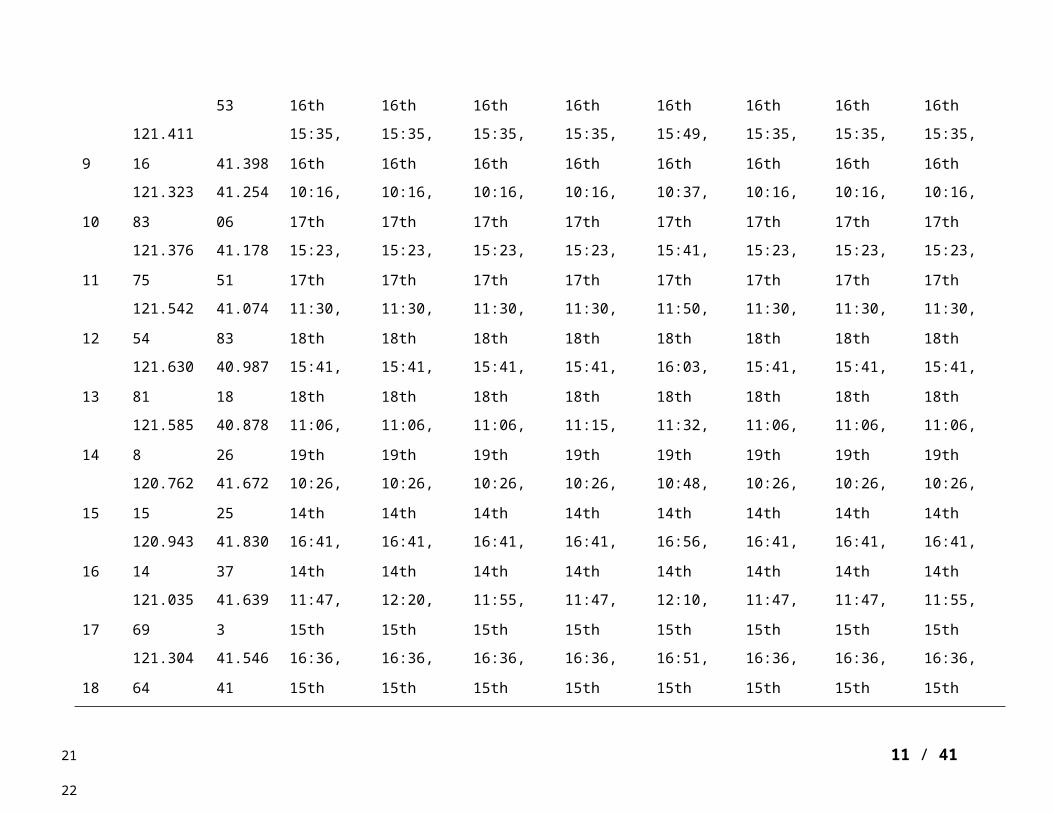
Table S1 Geographical coordinates and time for all the sampling campaigns in this study.
Sites Longitude LatitudeYearly sampling (in October) Seasonal sampling (in 2013)
2011 2012 2013 2014 January April July October
1 121.68784 42.02185 8:33, 11th 8:45, 11th 8:41, 11th 8:33, 11th 8:36, 11th 8:48, 11th 8:33, 11th 8:41, 11th
2 121.59971 41.98277 10:10, 11th 10:19, 11th 10:10, 11th 10:15, 11th 10:10, 11th 10:30, 11th 10:14, 11th 10:10, 11th
3 121.5819 41.94097 14:40, 11th 14:40, 11th 14:40, 11th 14:40, 11th 14:40, 11th 14:40, 11th 14:40, 11th 14:40, 11th
4 121.56385 41.90167 9:52, 12th 10:11, 12th 9:52, 12th 9:52, 12th 9:52, 12th 9:52, 12th 9:52, 12th 9:52, 12th
5 121.53707 41.80181 13:45, 12th 13:45, 12th 13:45, 12th 13:45, 12th 13:45, 12th 13:45, 12th 13:45, 12th 13:45, 12th
6 121.50677 41.7309 10:38, 13th 10:38, 13th 10:38, 13th 10:38, 13th 10:38, 13th 10:38, 13th 10:38, 13th 10:38, 13th
7 121.43224 41.66286 16:02, 13th 16:21, 13th 16:02, 13th 16:02, 13th 16:02, 13th 16:02, 13th 16:02, 13th 16:02, 13th
8x 121.4401 41.46353 11:14, 16th 11:14, 16th 11:14, 16th 11:14, 16th 11:41, 16th 11:21, 16th 11:14, 16th 11:14, 16th
8d 121.44 41.46353 11:14, 16th 11:14, 16th 11:14, 16th 11:14, 16th 11:55, 16th 11:21, 16th 11:14, 16th 11:14, 16th
9 121.41116 41.398 15:35, 16th 15:35, 16th 15:35, 16th 15:35, 16th 15:49, 16th 15:35, 16th 15:35, 16th 15:35, 16th
10 121.32383 41.25406 10:16, 17th 10:16, 17th 10:16, 17th 10:16, 17th 10:37, 17th 10:16, 17th 10:16, 17th 10:16, 17th
11 121.37675 41.17851 15:23, 17th 15:23, 17th 15:23, 17th 15:23, 17th 15:41, 17th 15:23, 17th 15:23, 17th 15:23, 17th
12 121.54254 41.07483 11:30, 18th 11:30, 18th 11:30, 18th 11:30, 18th 11:50, 18th 11:30, 18th 11:30, 18th 11:30, 18th
13 121.63081 40.98718 15:41, 18th 15:41, 18th 15:41, 18th 15:41, 18th 16:03, 18th 15:41, 18th 15:41, 18th 15:41, 18th
14 121.5858 40.87826 11:06, 19th 11:06, 19th 11:06, 19th 11:15, 19th 11:32, 19th 11:06, 19th 11:06, 19th 11:06, 19th
15 120.76215 41.67225 10:26, 14th 10:26, 14th 10:26, 14th 10:26, 14th 10:48, 14th 10:26, 14th 10:26, 14th 10:26, 14th
16 120.94314 41.83037 16:41, 14th 16:41, 14th 16:41, 14th 16:41, 14th 16:56, 14th 16:41, 14th 16:41, 14th 16:41, 14th
17 121.03569 41.6393 11:47, 15th 12:20, 15th 11:55, 15th 11:47, 15th 12:10, 15th 11:47, 15th 11:47, 15th 11:55, 15th
18 121.30464 41.54641 16:36, 15th 16:36, 15th 16:36, 15th 16:36, 15th 16:51, 15th 16:36, 15th 16:36, 15th 16:36, 15th
7 / 25
102
103
13
14
Table S2. Water parameters measured in-situ during annual sampling campaign.
Site
Water Temperature, ℃ pH Dissolved Oxygen, mg/L Conductivity, us/cm 2011 2012 2013 2014 2011 2012 2013 2014 2011 2012 2013 2014 2011 2012 2013 2014
1 17.4 17.0 14.0 16.9 8.85 7.01 7.14 7.94 10.6 2.40 3.75 5.38 1130 1800 1110 12702 11.0 19.2 13.2 20.3 7.47 7.36 7.51 9.07 11.2 12.13 4.90 9.06 2640 1710 1220 11003 18.2 21.3 14.4 20.9 7.49 7.23 7.18 7.96 0.22 3.49 6.91 6.82 1620 1710 1310 12704 18.4 21.7 11.0 21.8 7.70 7.25 7.29 8.78 0.60 4.91 8.27 6.70 1550 1810 1160 12905 15.4 21.9 9.2 22.5 7.93 7.49 7.36 8.80 2.96 4.12 9.43 6.91 1620 1840 1170 13406 14.4 22.3 10.0 24.3 8.16 7.77 7.98 8.68 4.37 3.51 9.87 7.39 1790 1820 1240 18907 17.2 22.5 9.8 23.6 8.05 7.78 7.86 8.69 5.05 6.82 10.1 8.48 1700 1530 1070 16208X 12.3 22.2 12.1 18.8 8.13 7.85 7.94 8.47 7.53 7.00 11.6 10.2 1560 1150 1080 14609 14.2 21.1 11.6 18.9 8.03 7.90 7.80 8.42 6.82 8.32 9.44 8.82 1220 692 900 129010 15.3 20.7 12.3 18.4 7.88 7.80 7.89 8.23 8.41 7.26 10.2 11.0 1010 746 847 108011 14.5 19.9 14.3 18.0 8.33 7.78 8.18 7.53 10.7 8.00 12.2 10.3 1050 838 754 71112 16.4 21.6 14.5 19.2 8.26 7.89 8.31 6.73 10.2 8.00 12.7 0.93 1050 864 932 153013 15.3 21.2 12.9 18.8 8.21 7.97 8.22 6.86 10.4 8.64 13.6 1.26 1040 861 899 349014 14.7 20.8 12.4 19.5 8.34 7.94 8.09 8.17 10.0 8.34 11.6 8.06 1880 942 1080 864015 10.8 21.8 10.3 20.8 8.10 7.78 7.70 8.59 13.2 9.97 11.0 10.1 712 731 468 144016 16.5 20.8 5.4 20.9 8.32 8.03 7.86 8.36 11.1 7.79 12.8 10.9 471 496 348 78217 9.5 22.0 10.6 21.5 8.14 7.69 7.97 8.53 10.4 7.73 12.7 11.8 539 522 391 49418 15.0 22.0 12.6 21.3 8.16 7.94 6.73 9.67 12.4 9.09 11.0 13.7 729 575 561 6318D 12.3 21.4 12.0 19.1 8.34 8.00 7.91 8.34 12.2 8.88 10.2 10.6 757 664 587 1510
8 / 25
104
105
106
15
16

Table S3. Water parameters measured in-situ during seasonal sampling campaign.
SiteWater Temperature, ℃ pH Dissolved Oxygen, mg/L Conductivity, us/cm
Jan Apr Jul Oct Jan Apr Jul Oct Jan Apr Jul Oct Jan Apr Jul Oct1 3.8 9.5 25.7 14.0 7.69 7.50 7.68 7.14 6.12 7.60 10.4 3.75 1740 1750 1050 11102 0.6 14.5 26.4 13.2 7.61 8.34 8.06 7.51 5.46 17.8 14.1 4.90 1720 1430 1130 12203 8.1 13.7 25.0 14.4 7.80 7.46 7.17 7.18 5.60 3.47 4.90 6.91 1550 1600 1460 13104 6.3 17.8 24.0 11.0 7.68 7.68 7.37 7.29 6.32 4.04 4.72 8.27 1530 1580 1380 11605 2.3 18.0 28.2 9.2 8.10 7.96 7.73 7.36 8.71 4.70 7.24 9.43 1540 1640 1430 11706 0.6 17.3 28.7 10.0 8.00 8.19 7.81 7.98 8.91 6.23 7.84 9.87 1620 1710 1280 12407 0.1 11.6 28.9 9.8 7.83 8.26 7.89 7.86 9.32 8.48 7.78 10.1 1650 1530 1150 10708X 0.2 9.2 30.3 12.1 7.96 8.36 7.72 7.94 8.63 9.92 7.23 11.6 1550 1460 1110 10809 0.2 8.8 30.3 11.6 8.40 8.44 8.80 7.80 10.3 11.0 8.20 9.44 1100 776 755 90010 0.1 9.1 28.0 12.3 7.75 8.41 7.87 7.89 8.42 11.1 7.49 10.2 2760 773 851 84711 5.0 10.9 28.9 14.3 7.54 8.28 8.10 8.18 0.49 10.9 9.52 12.2 1250 777 840 75412 0.1 13.2 30.1 14.5 7.84 8.21 8.02 8.31 12.3 10.5 7.76 12.7 743 817 855 93213 0.2 11.4 29.7 12.9 7.71 8.31 7.88 8.22 13.3 10.3 7.10 13.6 1560 811 844 89914 0.1 10.5 29.0 12.4 7.85 8.33 7.81 8.09 11.3 10.1 6.99 11.6 830 873 1430 108015 0.1 12.8 29.7 10.3 7.86 8.00 8.38 7.70 8.83 11.7 11.8 11.0 874 683 621 46816 0.2 13.2 30.4 5.4 8.03 8.39 7.87 7.86 12.6 10.1 7.99 12.8 609 481 556 34817 2.0 8.0 23.4 10.6 7.85 8.32 7.64 7.97 9.03 12.2 7.75 12.7 604 638 581 39118 0.1 7.9 26.7 12.6 7.65 8.24 7.99 6.73 10.3 11.6 9.80 11.0 818 645 593 5618D 1.2 7.6 27.1 11.8 8.28 8.45 7.87 6.90 12.2 12.3 9.64 10.3 721 661 605 549
9 / 25
107
108
17
18

Table S4. QA/QC information including monitoring transitions, matrix spike recovery (MSR),
procedure recovery (PR), limit of detection (LOD), and limit of quantification (LOQ) (Mean:
Arithmetic mean; SD: Standard deviation; n indicates the number of samples analyzed.)
AnalyteCarbon
number
MS/MS
transition*
MSR (n=4) PR (n=4)LOD
(ng/L)
LOQ
(ng/L)% Mean
±SD
% Mean
±SD
PFCAs
PFBA C4 213.0 → 169.1 90±14 101±9 0.15 0.71
PFPeA C5 263.0 → 218.9 102±11 98±10 0.05 0.15
PFHxA C6 313.0 → 269.0 113±8 115±7 0.04 0.15
313.0 → 119.0
PFHpA C7 363.0 → 318.9 101±9 105±16 0.06 0.15
363.0 → 169.0
PFOA C8 413.0 → 368.9 107±12 113±11 0.05 0.19
413.0 → 169.0
413.0 → 219.0
PFNA C9 463.0 → 419.0 112±15 124±9 0.06 0.13
463.0 → 169.0
PFDA C10 513.0 → 468.9 102±10 113±11 0.05 0.15
513.0 → 219.0
PFUnDA C11 563.0 → 519.0 82±14 86±12 0.03 0.08
563.0 → 319.0
PFDoA C12 613.0 → 569.0 73±9 81±14 0.05 0.12
613.0 → 169.0
PFSAs
PFBS C4 299.0 → 80.0 99±8 101±10 0.03 0.09
299.0 → 99.0
PFHxS C6 399.0 → 80.0 112±11 115±17 0.01 0.06
399.0 → 99.0
10 / 25
109
110
111
19
20
PFOS C8 498.9 → 80.0 90±12 105±15 0.03 0.10
498.9 → 99.0
Surrogates13C4 PFBA - 217.0 → 172.0 94±20 97±13 - -13C4 PFHxA - 315.0 → 270.0 102±11 108±9 - -13C4 PFOA - 417.0 → 372.0 105±10 113±14 - -13C4 PFNA - 468.0 → 423.0 106±8 102±12 - -13C4 PFDA - 515.0 → 470.0 115±7 110±13 - -13C4 PFUnDA - 565.0 → 520.0 82±17 81±12 - -13C2 PFDoA - 615.0 → 570.0 71±10 76±7 - -18O2 PFHxS - 403.0 → 103.0 101±14 105±16 - -13C4 PFOS - 503.0 → 99.0 89±13 92±15 - -*: The first transitions for each compound were used for quantification, while the left ones were used for qualification.
11 / 25
112113
21
22
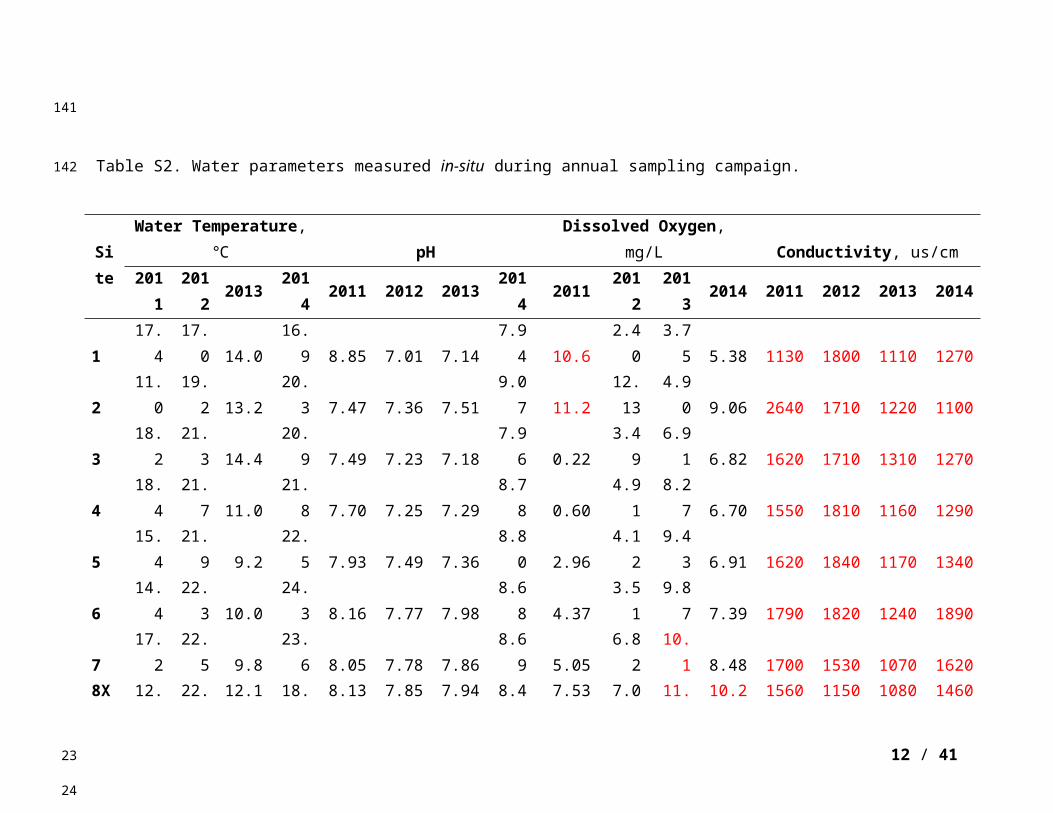
Table S5. Conditions for HPLC and ESI- MS.
HPLC conditions
Analytical column Aglient ZORBAX Eclipse Plus C18, 2.1×100 mm, 3.5μm
Guard column Agilent 1290 Infinity In-line filter with 0.3μm SS frit
Column temperature 40 ℃
Injection volume 5 μL
Mobile phase A= 2 mM ammonium acetateB= 100% Acetonitrile
Run time 14 min + 6 min post time
Flow rate 0.3 mL/min
Gradient Time (min) Mobile phase
0 20% B
0.5 20% B
12 90% B
14 90% B
MS conditions
Acquisition parameters ESI mode, negative ionization, MRM
Source gas temperature 350 ℃
Source gas flow rate 9 L/min
Nebulizer pressure 40 psi
Capiliary 3500 V negative
Delta EMV(-) 400 V
Table S6. PFAA concentrations (ng/L) in Daling River water in 2011.
12 / 25
114
115
116
23
24

Site PFBA PFPeA PFHxA PFHpA PFOA PFBS PFOSPFBS/
PFBA
PFBS/
PFOS
PFBA/
PFOA
PFOA/
PFOS
1 34.6 1.40 3.19 4.11 81.4 3.18 5.92 0.1 0.5 0.4 14
2 144 2.49 4.23 7.07 166 19.5 0.11 0.1 174 0.9 1490
3 962 47.2 15.2 3.52 102 1820 0.69 1.9 2630 9.4 147
4 1350 82.2 49.2 15.9 348 2900 0.77 2.2 3780 3.9 454
5 455 43.1 39.8 7.03 344 2390 12.6 5.3 190 1.3 27
6 763 28.1 31.9 6.57 284 2280 9.35 3.0 243 2.7 30
7 1150 39.2 37.3 11.0 330 2390 6.23 2.1 384 3.5 53
8X 654 27.6 59.2 5.92 194 1310 5.59 2.0 234 3.4 35
9 348 21.8 21.3 3.27 146 752 7.90 2.2 95 2.4 19
10 223 15.9 14.3 2.44 76.1 386 2.42 1.7 160 2.9 32
11 189 12.4 11.3 2.50 72.2 331 1.29 1.8 257 2.6 56
12 223 14.1 13.9 2.74 96.6 371 2.50 1.7 149 2.3 39
13 243 29.2 26.7 4.59 137 714 9.47 2.9 75 1.8 15
14 263 19.4 19.2 3.34 131 589 3.95 2.2 149 2.0 33
15 0.87 0.64 0.27 0.18 0.60 7.63 0.05 8.8 153 1.4 12
16 0.31 0.08 0.03 0.04 1.15 0.04 0.05 0.1 0.8 0.3 23
17 0.31 0.04 0.03 0.04 0.09 0.64 0.71 2.1 0.9 3.4 0.1
18 59.2 1.18 0.65 0.08 1.22 0.39 4.53 0.0 0.1 49 0.3
8D 55.2 1.03 0.73 0.24 3.25 1.34 1.27 0.0 1.1 17 2.6
13 / 25
117
25
26

Table S7. PFAA concentrations (ng/L) in Daling River water in 2012.
Site PFBA PFPeA PFHxAPFHp
APFOA PFBS PFOS
PFBS/
PFBA
PFBS/
PFOS
PFBA/
PFOA
PFOA/
PFOS
1 8.05 0.56 0.77 0.76 8.84 0.47 0.37 0.1 1.3 0.9 24
2 270 5.07 11.4 12.6 197 38.6 0.60 0.1 64 1.4 325
3 194 39.7 124 27.5 554 447 0.46 2.3 966 0.3 1200
4 1570 48.8 161 38.6 451 2260 0.77 1.4 2930 3.5 586
5 1450 81.2 180 45.5 675 2340 0.93 1.6 2510 2.1 725
6 207 56.5 122 33.9 571 1460 1.65 7.0 882 0.4 346
7 362 41.3 105 23.9 421 1040 1.48 2.9 704 0.9 284
8X 239 24.5 61.1 15.8 269 653 1.49 2.7 437 0.9 180
9 104 7.46 17.3 4.52 68.6 198 0.79 1.9 249 1.5 87
10 125 9.63 22.2 5.46 81.4 223 0.70 1.8 319 1.5 116
11 156 15.4 35.1 8.45 119 279 0.76 1.8 365 1.3 156
12 151 12.1 29.5 6.72 97.8 253 0.57 1.7 444 1.5 172
13 157 12.8 33.8 8.49 163 289 2.27 1.8 127 1.0 72
14 167 13.8 33.0 7.80 113 312 0.92 1.9 340 1.5 124
15 3.28 0.31 0.13 0.08 0.58 3.48 0.28 1.1 12 5.7 2.0
16 1.56 0.25 0.09 0.14 0.96 5.50 0.16 3.5 35 1.6 6.0
17 2.53 0.58 0.42 0.40 1.94 0.68 0.78 0.3 0.9 1.3 2.5
18 5.75 0.29 0.35 0.34 2.12 1.47 0.63 0.3 2.3 2.7 3.4
8D 86.2 1.97 1.42 0.36 2.53 1.88 1.22 0.0 1.5 34 2.1
14 / 25
118
119
27
28
29
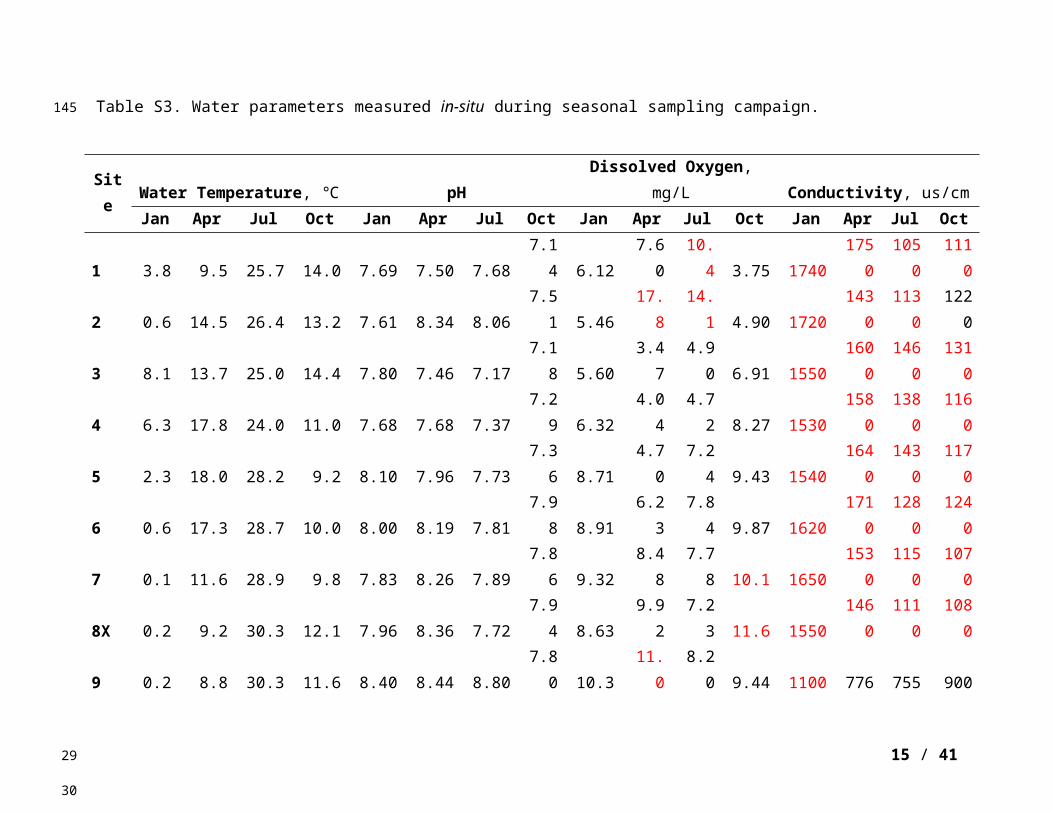
Table S8. PFAA concentrations (ng/L) in Daling River water in 2013.
Site PFBA PFPeA PFHxAPFHp
APFOA PFBS PFOS
PFBS/
PFBA
PFBS/
PFOS
PFBA/
PFOA
PFOA/
PFOS
1 19.5 1.25 0.97 1.11 12.1 1.43 0.21 0.1 6.8 1.6 58
2 186 3.12 4.88 4.50 72.4 26.4 4.42 0.1 6.0 2.6 16
3 3700 198 795 103 1950 2410 5.60 0.7 431 0.9 705
4 3690 124 204 51.2 1190 2710 5.37 0.7 506 3.1 222
5 2060 66.6 146 39.5 904 1920 4.83 0.9 397 2.3 187
6 1010 47.0 88.3 25.4 451 977 2.07 1.0 472 2.2 218
7 1650 62.1 133 32.8 692 1360 3.40 0.8 399 2.4 203
8X 1770 67.9 159 39.0 704 1480 7.78 0.8 190 2.5 91
9 1410 48.9 82.0 22.8 506 1310 3.06 0.9 428 2.8 165
10 945 33.7 55.1 20.1 348 712 2.08 0.8 342 2.7 167
11 711 34.0 56.4 19.9 277 643 1.22 0.9 529 2.6 228
12 402 20.0 40.9 13.8 255 427 2.43 1.1 175 1.6 105
13 1310 48.9 73.4 27.2 411 988 2.16 0.8 457 3.2 190
14 1070 38.5 63.9 22.1 344 798 2.11 0.7 378 3.1 163
15 7.38 0.34 0.58 0.26 1.82 0.86 1.69 0.1 0.5 4.1 1.1
16 1.62 0.28 0.08 0.10 0.61 0.94 0.06 0.6 15 2.6 9.5
17 2.89 0.05 0.11 0.27 1.49 0.74 0.82 0.3 0.9 1.9 1.8
18 12.6 0.19 0.46 0.27 2.92 1.10 11.4 0.1 0.1 4.3 0.3
8D 8.35 0.12 0.21 0.11 3.86 1.24 7.54 0.1 0.2 2.2 0.5
15 / 25
120
121
122
30
31
32
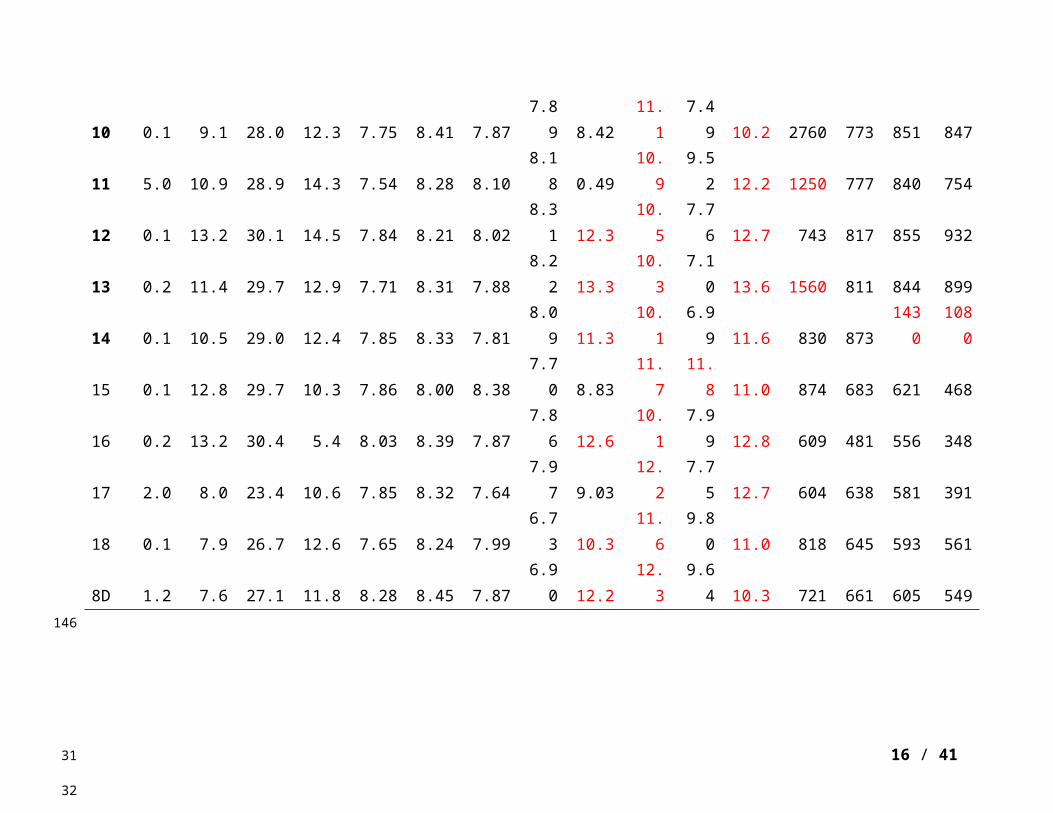
Table S9. PFAA concentrations (ng/L) in Daling River water in 2014.
Site PFBA PFPeAPFHx
APFHpA PFOA PFBS PFOS
PFBS/
PFBA
PFBS/
PFOS
PFBA/
PFOA
PFOA/
PFOS
1 21.1 1.47 1.34 1.71 21.9 2.78 1.52 0.1 1.8 1.0 14
2 76.5 28.3 21.2 13.9 80.7 81.8 3.69 1.1 2220 95 22
3 2580 47.0 138 35.4 566 3580 4.42 1.4 810 4.6 128
4 2560 25.8 48.7 17.3 241 3780 0.55 1.5 6880 11 439
5 1840 44.5 137 40.1 554 2450 0.68 1.3 3610 3.3 815
6 1560 38.0 107 31.9 470 1990 6.71 1.3 297 3.3 70
7 1870 53.5 196 53.8 772 2510 4.12 1.3 610 2.4 188
8X 1500 56.1 175 55.0 593 1920 2.39 1.3 802 2.5 248
9 1110 42.8 101 35.6 397 1390 4.53 0.0 3.0 13 14
10 970 43.8 108 37.7 373 1210 0.68 1.3 307 2.8 88
11 677 21.1 43.6 15.5 171 673 0.92 1.2 1770 2.6 548
12 536 18.0 42.2 16.8 156 668 3.55 1.0 731 4.0 186
13 161 9.75 14.2 5.60 71.9 310 6.95 1.2 188 3.4 44
14 153 11.5 13.0 4.37 46.2 127 4.71 1.9 45 2.2 10
15 17.9 0.53 2.22 0.14 4.61 2.98 1.26 0.8 27 3.3 9.8
16 1.42 ND 0.11 0.24 2.77 ND 0.56 0.2 2.4 3.9 3.7
17 1.68 0.08 0.48 0.10 2.17 0.59 0.47 0.0 0.0 0.5 5.0
18 65.7 2.46 2.51 0.36 4.07 0.98 1.21 0.4 1.3 0.8 4.6
8D 89.3 3.15 1.32 0.54 7.02 1.54 0.52 0.0 0.8 16 3.4
16 / 25
123
124
125
33
34
35

Table S10. PFAA concentrations (ng/L) in Daling River water in January, 2013.
Site PFBA PFPeA PFHxA PFHpA PFOA PFBS PFOSPFBS/
PFBA
PFBS/
PFOS
PFBA/
PFOA
PFOA/
PFOS
1 9.48 0.33 0.49 0.40 5.39 0.72 25.7 0.1 0.0 1.8 0.2
2 242 2.89 6.12 6.96 133 18.7 1.48 0.1 12.6 1.8 90
3 569 139 183 29.4 753 457 2.27 0.8 201 0.8 331
4 628 122 125 23.8 581 690 10.0 1.1 69 1.1 58
5 479 102 111 19.0 501 518 1.36 1.1 381 1.0 368
6 504 86.4 94.0 16.6 438 540 10.7 1.1 50 1.2 41
7 438 84.3 91.9 15.1 411 427 1.54 1.0 278 1.1 267
8X 377 84.5 96.4 15.8 402 415 9.27 1.1 45 0.9 43
9 235 37.5 42.6 7.01 186 193 39.9 0.8 4.8 1.3 4.7
10 171 27.5 32.5 5.87 150 141 8.00 0.8 18 1.1 19
11 165 9.63 8.76 1.99 40.9 130 2.91 0.8 45 4.0 14
12 138 12.9 17.0 3.40 66.1 106 0.87 0.8 122 2.1 76
13 174 14.5 28.5 5.69 102 216 1.26 1.2 172 1.7 81
14 135 8.60 14.7 3.31 56.3 117 1.49 0.9 78 2.4 38
15 2.52 0.23 0.54 0.12 0.83 0.43 13.6 0.0 0.1 26 0.4
16 0.64 0.52 0.37 0.47 0.27 0.04 1.45 0.2 0.0 3.0 0.1
17 0.87 0.06 0.33 0.36 0.63 0.14 8.44 0.1 0.0 2.3 0.2
18 75.4 1.20 0.88 0.20 1.04 0.40 6.59 0.2 0.0 1.4 0.1
8D 42.6 0.74 0.69 0.26 1.64 0.37 4.08 0.0 0.1 72 0.2
17 / 25
126
127
128
36
37
38
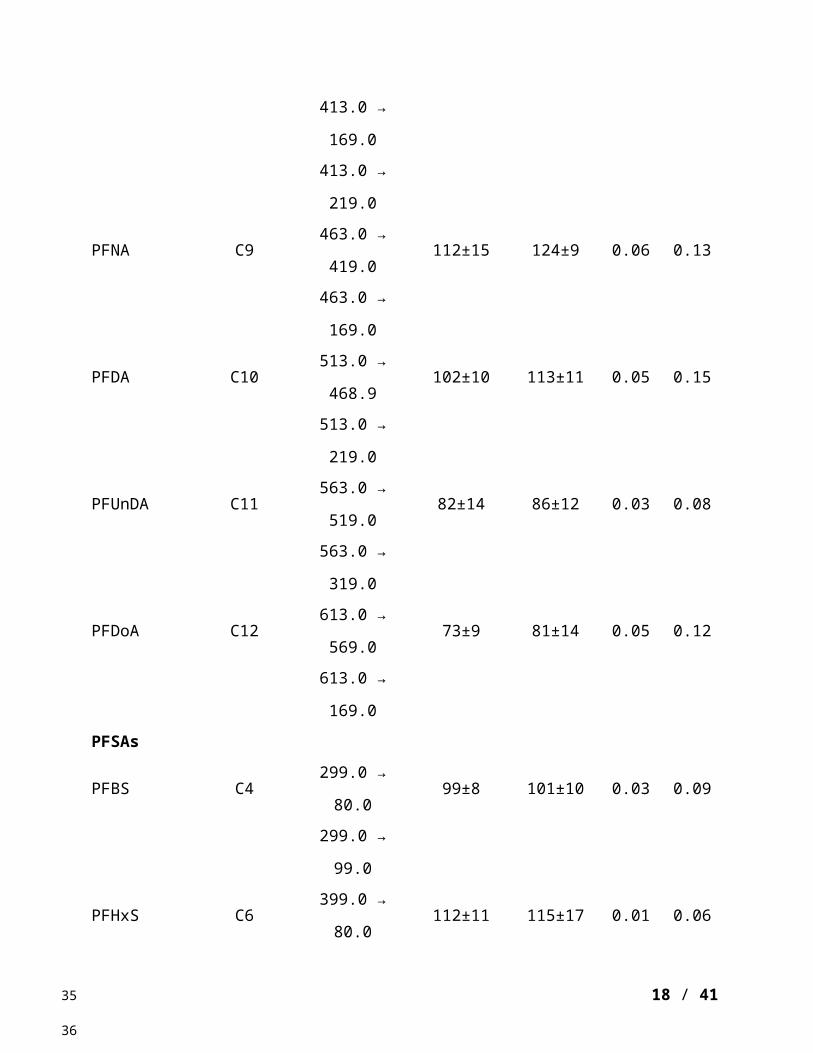
Table S11. PFAA concentrations (ng/L) in Daling River water in April, 2013.
Site PFBA PFPeA PFHxA PFHpA PFOA PFBS PFOSPFBS/
PFBA
PFBS/
PFOS
PFBA/
PFOA
PFOA/
PFOS
1 8.62 0.39 0.95 0.58 51.2 0.61 88.9 0.1 0.0 0.2 0.6
2 88.3 1.02 2.35 2.73 57.6 10.8 1.12 0.1 9.6 1.5 52
3 1970 79.6 168 36.8 749 1980 1.35 1.0 1463 2.6 553
4 1140 38.6 71.1 19.9 385 1030 1.54 0.9 671 3.0 250
5 459 40.1 78.0 23.1 401 1000 483 2.2 2.1 1.1 0.8
6 817 46.4 95.4 28.4 390 1290 147 1.6 8.7 2.1 2.6
7 528 25.0 50.0 13.4 240 633 107 1.2 5.9 2.2 2.2
8X 416 35.1 98.1 19.2 304 918 111 2.2 8.3 1.4 2.7
9 328 7.50 15.3 3.83 56.7 224 15.6 0.7 14 5.8 3.6
10 151 5.12 9.93 2.94 45.8 157 7.43 1.0 21 3.3 6.2
11 369 5.06 10.4 2.84 42.62 149 6.54 0.4 23 8.7 6.5
12 125 4.06 7.61 2.35 39.0 118 4.74 0.9 25 3.2 8.2
13 114 3.31 6.42 2.05 34.7 100 4.09 0.9 25 3.3 8.5
14 121 5.40 9.65 3.16 47.9 150 18.9 1.2 7.9 2.5 2.5
15 4.05 0.05 0.02 0.09 0.47 0.11 0.59 0.0 0.1 15 0.3
16 1.36 0.06 0.06 0.08 0.54 0.04 1.84 0.0 0.2 8.6 0.8
17 2.42 0.10 0.16 0.20 1.96 0.38 19.5 0.0 0.0 2.5 0.3
18 7.32 0.18 0.23 0.21 1.36 0.54 0.99 0.2 0.0 1.2 0.1
8D 14.7 0.29 0.29 0.11 0.97 0.33 3.31 0.1 0.5 5.4 1.4
18 / 25
129
130
131
39
40
41
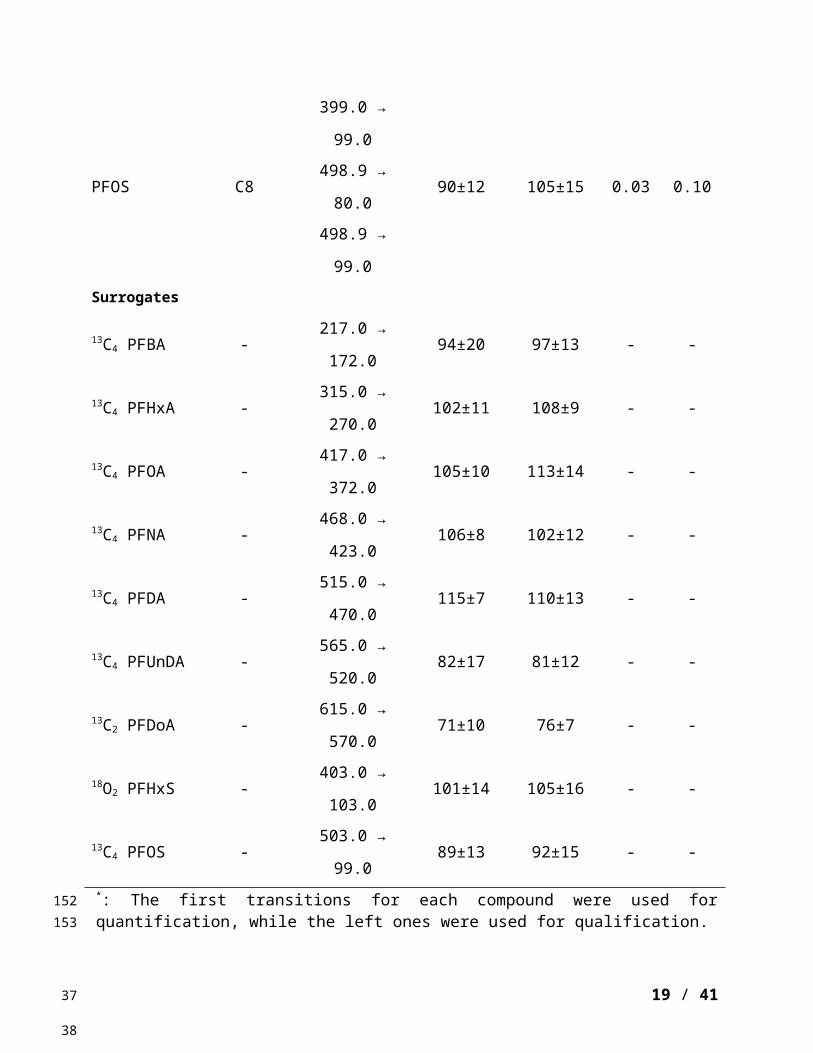
Table S12. PFAA concentrations (ng/L) in Daling River water in July, 2013.
Site PFBA PFPeA PFHxA PFHpA PFOA PFBS PFOSPFBS/
PFBA
PFBS/
PFOS
PFBA/
PFOA
PFOA/
PFOS
1 33.4 1.93 3.40 3.81 41.5 4.91 1.44 0.1 3.4 0.8 29
2 109 2.97 5.94 5.70 78.2 35.4 1.37 0.3 26 1.4 57
3 1840 273 603 112 2100 2610 3.28 1.4 794 0.9 638
4 2440 272 529 119 2280 3870 2.90 1.6 1340 1.1 787
5 1680 181 361 79.6 1500 2790 4.88 1.7 572 1.1 307
6 1260 96.7 189 41.9 786 1890 1.59 1.5 1190 1.6 495
7 1430 96.5 189 41.6 814 2330 4.91 1.6 474 1.8 166
8X 933 75.0 148 32.8 625 1380 3.63 1.5 380 1.5 172
9 307 18.4 39.5 8.89 150 369 3.59 1.2 103 2.0 42
10 524 34.4 71.3 16.5 289 698 1.23 1.3 566 1.8 234
11 476 26.7 52.4 12.2 213 685 2.85 1.4 241 2.2 75
12 349 20.7 43.0 10.1 179 490 3.44 1.4 142 2.0 52
13 412 22.9 45.8 10.5 185 581 1.09 1.4 533 2.2 170
14 372 17.6 32.6 9.32 154 651 10.2 1.8 64 2.4 15
15 28.5 1.95 3.80 1.67 14.6 26.7 1.02 0.3 0.2 1.2 0.6
16 5.78 0.28 0.46 0.38 2.74 0.26 1.84 0.9 26 2.0 14
17 11.9 0.36 0.61 0.63 3.48 1.39 1.44 0.0 0.1 2.1 1.5
18 10.7 0.39 0.52 0.42 2.51 1.20 21.2 0.1 1.0 3.4 2.4
8D 6.37 0.21 0.15 0.44 5.33 1.65 9.38 0.1 0.1 4.3 0.1
19 / 25
132
133
134
42
43
44

Table S13. PFAA concentrations (ng/L) in Daling River water in October, 2013.
Site PFBA PFPeA PFHxAPFHp
APFOA PFBS PFOS
PFBS/
PFBA
PFBS/
PFOS
PFBA/
PFOA
PFOA/
PFOS
1 19.5 1.25 0.97 1.11 12.1 1.43 0.21 0.1 6.8 1.6 58
2 186 3.12 4.88 4.50 72.4 26.4 4.42 0.1 6.0 2.6 16
3 3700 198 795 103 1950 2410 5.60 0.7 431 0.9 705
4 3690 124 204 51.2 1190 2710 5.37 0.7 506 3.1 222
5 2060 66.6 146 39.5 904 1920 4.83 0.9 397 2.3 187
6 1010 47.0 88.3 25.4 451 977 2.07 1.0 472 2.2 218
7 1650 62.1 133 32.8 692 1360 3.40 0.8 399 2.4 203
8X 1770 67.9 159 39.0 704 1480 7.78 0.8 190 2.5 91
9 1410 48.9 82.0 22.8 506 1310 3.06 0.9 428 2.8 165
10 945 33.7 55.1 20.1 348 712 2.08 0.8 342 2.7 167
11 711 34.0 56.4 19.9 277 643 1.22 0.9 529 2.6 228
12 402 20.0 40.9 13.8 255 427 2.43 1.1 175 1.6 105
13 1310 48.9 73.4 27.2 411 988 2.16 0.8 457 3.2 190
14 1070 38.5 63.9 22.1 344 798 2.11 0.7 378 3.1 163
15 7.38 0.34 0.58 0.26 1.82 0.86 0.39 0.1 0.2 2.2 0.5
16 1.62 0.14 0.08 0.10 0.61 0.52 0.06 0.1 2.2 4.1 4.7
17 2.89 0.05 0.11 0.27 1.49 0.74 0.17 0.3 8.1 2.6 9.5
18 12.6 0.19 0.46 0.27 2.92 1.10 11.4 0.3 4.3 1.9 8.8
8D 8.35 0.12 0.21 0.11 3.86 1.24 7.54 0.1 0.1 4.3 0.3
20 / 25
135
136
45
46
47
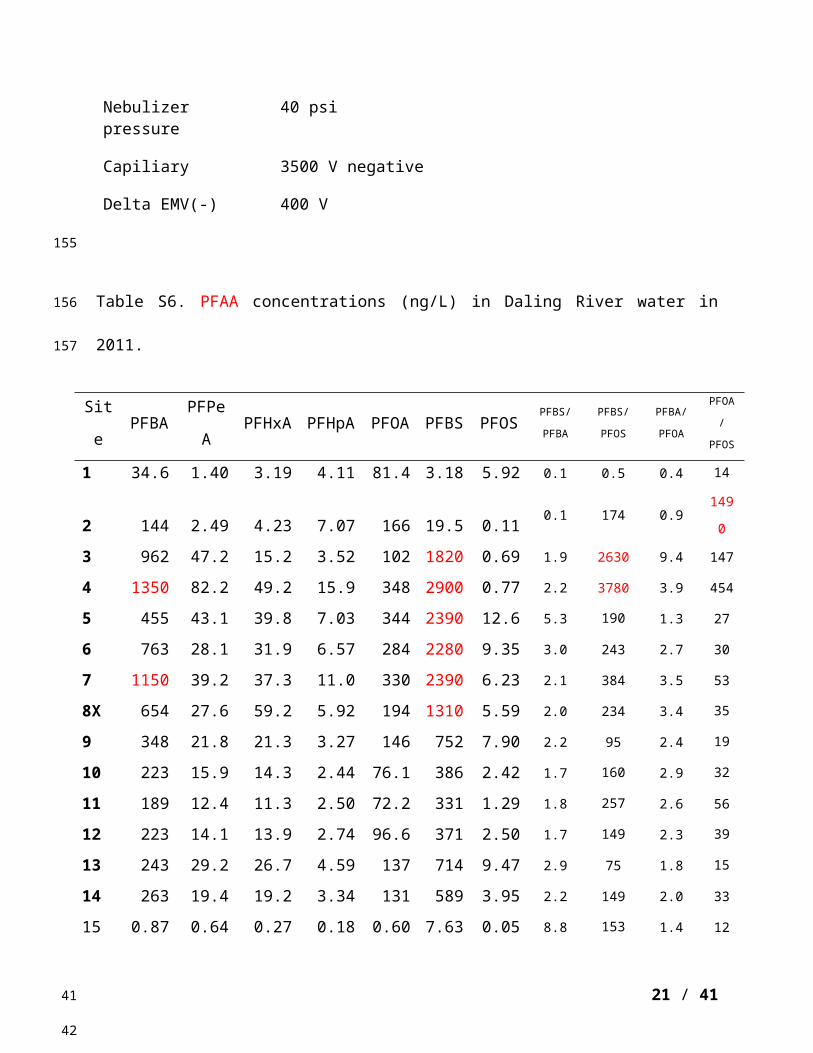
Table S14. PFAA concentrations (ng/L) in drinking water around Park 1.
Sites Typen*
PFBAPFPe
APFHxA PFHpA
PFO
A
PFNA PFDA PFUnDAPFBS
PFOS
W1 Groundwater 5 3610 951 1180 579 4150 1.98 0.70 0.24 588 1.05
Tap water 5 4.68 0.29 0.96 0.26 2.38 0.74 0.05 0.01 1.09 0.30
W2 Groundwater 5 1780 114 88.9 54.2 1390 0.67 0.14 0.15 865 0.20
Tap water 5 4.34 0.36 0.66 0.41 1.74 0.67 0.08 0.01 0.93 0.35
W3 Groundwater 5 434 3.76 4.91 5.91 64.5 0.60 0.14 0.20 22.7 0.15
Tap water 5 5.59 0.10 0.31 0.16 1.21 0.30 0.01 ND 1.64 0.13
W4 Groundwater 5 352 3.47 2.13 1.59 81.7 0.27 0.10 0.43 22.4 0.20
Tap water 5 92.3 4.09 5.32 2.81 74.2 0.11 0.04 ND 97.8 0.43
*: n indicated the number of samples taken at each village, and the concentrations were presented at the average values.ND: not detected
21 / 25
137
138139140141
48
49
50

Table S15 Pearson correlations among products capacities and PFAA concentrations (mean
values from site 3 to site 8X in the Xihe River) from 2011 to 2014.
PTFE FCA
Fine
Chemicals
Intermediate
s
Sum
Products PFBS
PFB
A
PFO
A
PFAA
s
PTFE 1
-.97
3* -0.853 -.977* -.947*
-
0.228 -.900*
-
0.764 -0.867
FCA 1 .942* 1.000** .996** 0.324 0.827 0.598 0.802
Fine
Chemicals 1 .935* .965* 0.576 0.736 0.318 0.742
Inermediates 1 .994** 0.312 0.833 0.614 0.808
Sum Products 1 0.366 0.788 0.521 0.769
PFBS 1 0.439
-
0.228 0.522
PFBA 1 0.769 .995**
PFOA 1 0.709
PFAAs 1
*: Correlation is significant at the 0.05 level.**: Correlation is significant at the 0.01 level.
22 / 25
142
143
144145146
51
52
53
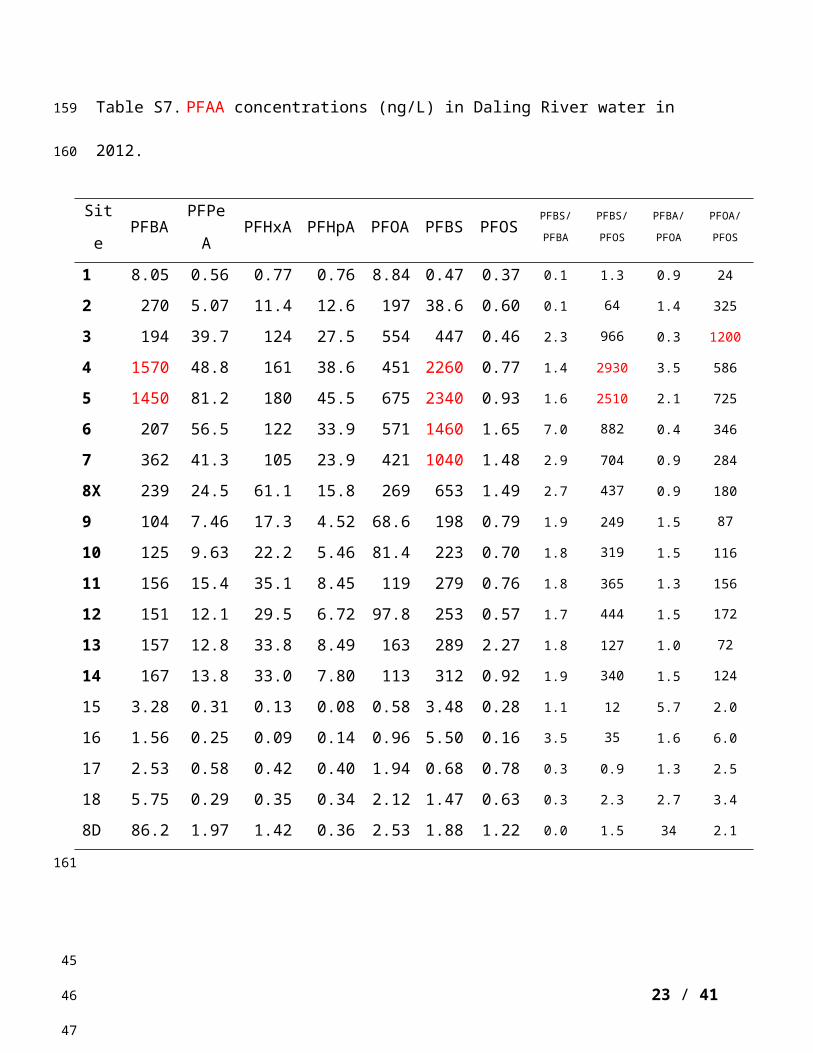
Table S16 One-way ANOVA analysis of the dominant PFAA concentrations (from site 3 to site
8X in the Xihe River) from 2011 to 2014.
n Mean Grouping
PFBA
2011 6 888 BC
2012 6 669 C
2013 6 2310 A
2014 6 1980 AB
PFOA
2011 6 267 A
2012 6 490 A
2013 6 1320 A
2014 6 533 A
PFBS
2011 6 2180 AB
2012 6 1370 B
2013 6 1810 AB
2014 6 2710 A*: Grouping Information Using the Tukey Method and 95% Confidence.
23 / 25
147
148
149
150
54
55
56
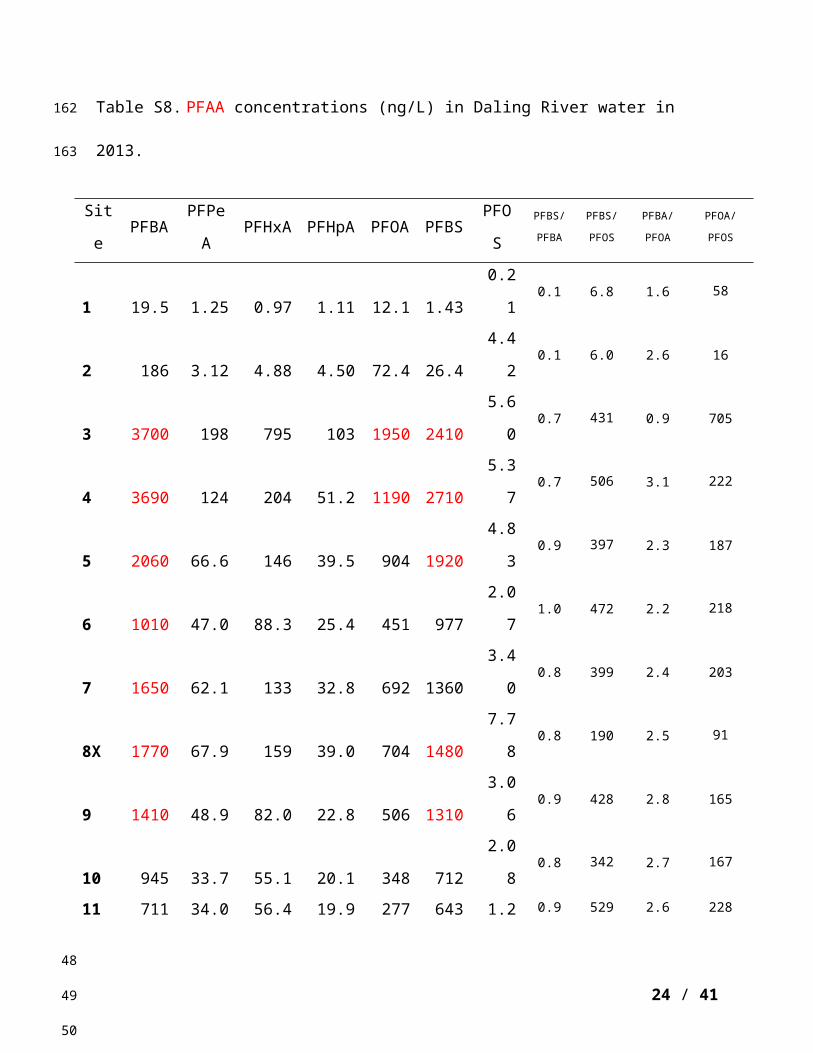
Figure S1. The geographic location of the drinking water sampling.
Note: The Location 3 is the sampling site for river water. W1-W4 are the villages for ground
water and tap water sampling.
24 / 25
Xihe River
151
152
153
154
155
57
58
59

References
Loi, E. I. H., Yeung, L. W. Y., Taniyasu, S., Lam, P. K. S., Kannan, K., Yamashita, N. 2011. Trophic Magnification of Poly- and Perfluorinated Compounds in a Subtropical Food Web. Environmental Science & Technology. 45(13): 5506-5513.
25 / 25
156
157158159
160
60
61
62