Tempering Inuence on Residual Stresses and Mechanical ...
32
Tempering Inァuence on Residual Stresses and Mechanical Properties of AISI 4340 Steel Marcel Souza ( [email protected] ) Universidade Federal Fluminense https://orcid.org/0000-0002-2489-7399 Luana Ferreira Serrão Universidade Federal Fluminense Juan Manuel Pardal Universidade Federal Fluminense Sérgio Souto Maior Tavares Universidade Federal Fluminense Maria Cindra Fonseca Universidade Federal Fluminense Research Article Keywords: AISI 4340 steel, heat treatments, mechanical properties, residual stresses, X ray diffraction, magnetic Barkhausen noise Posted Date: November 9th, 2021 DOI: https://doi.org/10.21203/rs.3.rs-1051431/v1 License: This work is licensed under a Creative Commons Attribution 4.0 International License. Read Full License
Transcript of Tempering Inuence on Residual Stresses and Mechanical ...

Tempering In�uence on Residual Stresses andMechanical Properties of AISI 4340 SteelMarcel Souza ( [email protected] )
Universidade Federal Fluminense https://orcid.org/0000-0002-2489-7399Luana Ferreira Serrão
Universidade Federal FluminenseJuan Manuel Pardal
Universidade Federal FluminenseSérgio Souto Maior Tavares
Universidade Federal FluminenseMaria Cindra Fonseca
Universidade Federal Fluminense
Research Article
Keywords: AISI 4340 steel, heat treatments, mechanical properties, residual stresses, X ray diffraction,magnetic Barkhausen noise
Posted Date: November 9th, 2021
DOI: https://doi.org/10.21203/rs.3.rs-1051431/v1
License: This work is licensed under a Creative Commons Attribution 4.0 International License. Read Full License

1
1
Tempering influence on residual stresses and mechanical properties of AISI
4340 steel
Marcel Freitas de Souza, Luana Ferreira Serrão, Juan Manuel Pardal, Sérgio Souto Maior
Tavares, Maria Cindra Fonseca*
Department of Mechanical Engineering, School of Engineering/PGMEC, Universidade
Federal Fluminense – Rua Passo da Patria, 156 - CEP 24210-240, Niteroi, RJ, Brazil.
*E-mail: [email protected]
Abstract
The present work evaluated the tempering temperature influence on microstructure, mechanical
properties and residual stresses of AISI 4340 steel. The residual stresses were measured by
X-ray diffraction (XRD) by the sin²ψ method and compared to magnetic Barkhausen noise
(MBN). The residual stresses exhibited high tensile values after quenching, but a small relief
was observed in tempering treatments at 300°C and 400°C, which also presented a hardness
decrease compared to the as-quenched condition. XRD and MBN analyses indicated that
residual stresses became compressive in tempering performed between 500°C and 650°C.
Therefore, compressive residual stresses combined with appropriate hardness and toughness
values (35 HRC and 33 J) obtained from 500°C tempering temperature can be used to improve
the mechanical properties of AISI 4340 steel components. Additionally, a mathematical model
was established to estimate the tempered martensite hardness for different tempering
temperature conditions. This model showed high accuracy (R2=0.99) for a holding time of
90 minutes.
Keywords: AISI 4340 steel; heat treatments; mechanical properties; residual stresses; X-ray
diffraction; magnetic Barkhausen noise.

2
2
1. Introduction
The AISI 4340 steel is employed in quenched and tempered conditions, however, is
susceptible to embrittlement phenomena when tempered between 300 and 400ºC. This problem
has been investigated by several researchers, who have evaluated changes in microstructure and
mechanical properties at different tempering temperatures [1-3].
Tempering can be used as a stress relief process, ensuring reduction or even absence of
tensile residual stresses, which have a deleterious effect on fatigue life. Despite the wide
industrial use of AISI 4340 steel and in-depth study of the mechanical behaviour of this
material, there is little information in the literature regarding the influence of heat treatment
parameters on residual stresses.
Incorrect selection of heat treatment parameters leads to significant changes in material
properties and hence performance in service. Therefore, it is important to evaluate non-
destructive and low-cost residual stresses techniques, such as magnetic Barkhausen noise
(MBN), which can be implemented in production lines and provide reliable results, highlighting
X-ray diffraction technique (XRD) in these conditions [4-8].
The present work evaluated changes in mechanical properties, microstructure, residual
stresses and MBN for AISI 4340 steel at different tempering temperatures.
2. Materials and Experimental Techniques
The AISI 4340 steel studied was obtained from a disc of 10.5 mm thickness, cut from a
forged and normalized bar of 228.6 mm. Chemical composition and mechanical properties
(σYS - yield strength, σUTS - ultimate tensile strength, elongation, reduction of area - RA and
Rockwell hardness - HRC), according to the manufacturer, are shown in Table 1 and Table 2,
respectively.
Table 1. Chemical composition of AISI 4340 (% weight).
C Mn Si P
(max)
S
(max) Cr Ni Mo Al Cu
Manufacturer 0.40 0.73 0.28 0.01 0.02 0.78 1.73 0.21 0.02 0.11
SAE 4340
0.38
–
0.43
0.60
–
0.80
0.15
–
0.35
0.04 0.04
0.70
–
0.90
1.65
–
2.00
0.20
–
0.30
- -

3
3
Table 2. Mechanical properties of AISI 4340.
σYS (MPa) σUTS (MPa) Elongation (%) RA (%) Rockwell Hardness (HRC)
765 960 14.8 39.5 32
Two different types of samples were made from the AISI 4340 steel. One type had Charpy
dimensions and was used to assess residual stresses by XRD, MBN and absorbed energy (AE)
in the Charpy impact test, which also enabled fractured surface analysis. The other type, called
reduced sample, was manufactured to analyse microstructure and Rockwell C hardness (HRC).
Quenching treatment was carried out in a tubular furnace with a controlled argon inert gas
atmosphere to avoid decarburizing. The samples were placed in a furnace at 660°C, which was
heated gradually until the soaking temperature of 860°C. After 60 min soaking time, the
samples were removed and dipped in oil. A quenched sample of each type was selected for
tempering, which was carried out using five different temperatures, 300°C, 400°C, 500°C,
600°C and 650°C, for 90 min and later air-cooled.
Rockwell C hardness test was performed in as-received condition and after tempering
treatment. Metallographic samples were etched with 2% Nital for 10 s.
Charpy impact test was performed at room temperature using a universal impact machine
with 300 J capacity and 0.5 J accuracy and broken Charpy specimens were observed through a
stereo microscope.
Fracture surfaces were characterized by scanning electron microscope (SEM) and energy
dispersive spectroscopy (EDS) was used to determine the chemical composition of the phases
and inclusions in fracture surfaces.
Residual stresses of as-received and heat-treated conditions were measured by XRD using
sin²ψ method, CrΚα radiation and diffracting the plane {211} in the longitudinal direction
(LRS), coincident with the largest length direction, and also in the transverse direction (TRS).
MBN used a sinusoidal magnetic field with 125 Hz frequency, 4.8 Vpp excitation
magnetization amplitude and 0.6 V gain for signal amplification in the longitudinal (LMBN)
and transverse (TMBN) directions.
The tests performed in this work are shown in Figure 1.
4
4
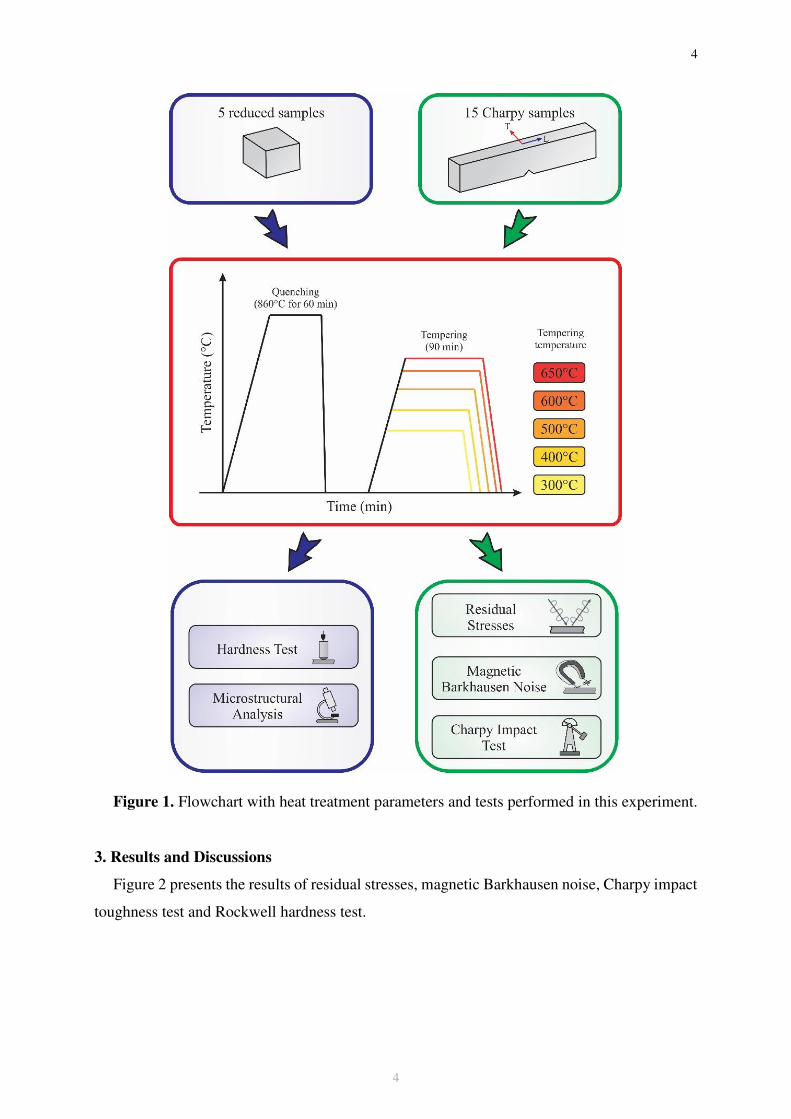
Figure 1. Flowchart with heat treatment parameters and tests performed in this experiment.
3. Results and Discussions
Figure 2 presents the results of residual stresses, magnetic Barkhausen noise, Charpy impact
toughness test and Rockwell hardness test.

5
5
Figure 2. Mechanical properties, residual stresses and MBN vs. tempering temperature.
Oil quenching provided higher hardness values than as-received material, which presented
30±1 HRC. The tempering at 300°C led to a reduction of less than 8% in the hardness
concerning quenched condition and, therefore, low tempering does not significantly change
hardness [9].
Hardness gradually decreased with increasing tempering temperature, as also verified by
Kashefi et al. [4], who affirmed that tempering temperature is significant in hardness reduction
due to softening of martensitic matrix by carbon rejection. Manokaran et al. [10] reported
hardness values similar to that observed in the present research considering different tempering
temperature for AISI 4340. In this way, higher tempering temperatures provide sufficient
mobility for the substitutional alloying elements to cause cementite growth, resulting in a
continuous decrease in strength during tempering [11].
The absorbed energies of the specimens tempered at 300°C and 400°C were considerably
low and below that found by Kwon et al. [2] and Chi et al. [3]. Temper embrittlement occurs,
according to Clarke et al. [1], with tempering in 200°C to 400°C probably due to the formation
of intra-lath cementite from retained austenite. For this reason, this temperature range is critical,
making it recommendable to use temperatures between 150°C and 200°C for low tempering
treatment to obtain an adequate combination of strength and ductility.
For tempering temperatures above 500°C, the absorbed energy increased considerably and,
therefore, a sharp growth of energy absorbed with increased tempering temperature was
verified, which is consistent with Jiang et al. [8].

6
6
Residual stresses in the as-received condition indicated a mean of 86 MPa in longitudinal
(LRS) direction and -220 MPa in transverse (TRS) direction. The magnitude and nature of
residual stresses are influenced by heat treatment and machining process, and probably the
thermal effects of electrical discharge machining prevailed in the longitudinal direction,
generating tensile residual stresses [12].
Residual stresses after quenching were close to 300 MPa in the longitudinal direction and
230 MPa in the transverse direction. Tensile residual stresses are undesirable since they can
decrease the fatigue life by promoting nucleation and propagation of surface cracks [13].
In tempering carried out above 500°C, the stress relief was even more significant and
provided the inversion of stresses nature, generating compressive residual stresses in both
directions. Thus, the increase in the tempering temperature made the treatment more efficient
in terms of reducing the tensile residual stresses resulting from the quenching.
The hardness profile is similar to the residual stresses behaviour, since both were inversely
proportional to tempering temperature increase and, therefore, opposite to the Charpy impact
toughness result.
The magnetic Barkhausen noise measured after tempering between 300°C and 500°C were
low and without a significant difference concerning the direction. Tempering performed above
500°C increased MBN and this behaviour corresponds to a compressive residual stresses state.
The increase in tempering temperature caused the decrease of anchor points of the magnetic
domain and, thus, increasing MBN. Davut and Gür [5] state that with increasing tempering
temperature for low alloy steel, MBN also rises due to the greater amount of the domain wall
displacement because of the microstructural change of the tempered martensite, which becomes
softer.
Residual stresses and microstructure changes affect MBN, since significant changes can be
observed during martensite transformation. Higher tempering temperature influences the
precipitated carbides sizes, allowing dislocations to move more easily, causing a sharp decrease
in hardness and a MBN increase. As described by Moorthy et al. [6], there is an increment in
MBN magnitude with hardness reduction, because the domain wall displacement would be
facilitated with microstructure softening.
Therefore, MBN can be applied to reduce inspection costs in production lines, using a faster
and cheaper technique, avoiding destructive tests and ensuring that all samples could be quickly
inspected. In ultra-high strength alloy steels, such as AISI 4340, the heat treatment in the range
of 300-400°C provides an evident reduction in mechanical properties and tensile residual
stresses, and this behaviour can be predicted using the MBN technique [7].

7
7
The mathematical model proposed by Hassan and Jabbar [14] can estimate the hardness of
4340 steel submitted to quenching and tempering treatments. The parameter of tempering (PT)
considers that martensite softening is a phenomenon of diffusion controlled throughout the
tempering of steels. The PT is a function of tempering temperature, T in Kelvin, and holding
temperature, t in hours, according to Equation (1) given by Hollomon and Jaffe [15]. 𝑃𝑇 = 𝑇 ∙ [log(𝑡) + 𝐺] (1)
Where G is a constant, being equal to 10.3 for AISI 4340 [16].
Another equation for PT, according to Equation (2), involves the parameters of the alloy
elements of the material [14].
𝑃𝑇 = 𝑇 ∙ [log(𝑇) + (𝐻0 + ∑ 𝐻𝑖𝑋𝑖𝑖 )] (2)
Where 𝐻𝑖 is the constant for the alloying element, 𝑋𝑖 is the mass amount % of the alloying
element, 𝐻0is a constant for tempered pure iron, as shown in Table 3.
Table 3. Equation parameters for alloying effect according to Kang and Lee [16].
Parameter 𝐻0 𝐻𝐶 𝐻𝑀𝑛 𝐻𝑆𝑖 𝐻𝑁𝑖 𝐻𝐶𝑟 𝐻𝑀𝑜
Value 17.396 -6.661 -1.604 -3.412 -0.248 -1.112 -4.355
Equation (3) describes the hardness of tempered martensite (HTM) in Vickers (HV) with the
implementation of the exponential function factor correction, as performed by Hassan and
Jabbar [14] in the original methodology proposed by Kang and Lee [16]. This exponential
function factor correction was based on the values described in Figure 3 using the conversion
of Rockwell hardness into Vickers hardness according to ASTM E140 [17].
𝐻𝑇𝑀 = (1542.9 − 25.3𝑋𝐶 ) ∙ exp(−1.64 × 10⁻⁴ ∙ 𝑃𝑇) (3)
A correlation factor was implemented in Equation (3) to obtain a better fit of the data. This
correction factor expressed in Equation (4) is related specifically to a holding time of 1.5 hours. 𝐹𝑎𝑐𝑡𝑜𝑟 𝑜𝑓 𝑐𝑜𝑟𝑟𝑒𝑙𝑎𝑡𝑖𝑜𝑛 = [85.5 ∙ ln(𝑇) − 564] (4)
Equation (5) can be written by adding the factor of correlation to Equation (3).
8
8
𝐻𝑇𝑀 = [(1542.9 − 25.3𝑋𝐶 ) ∙ exp(−1.64 × 10⁻⁴ ∙ 𝑃𝑇)] + [85.5 ∙ ln(𝑇) − 564] (5)
Using the methodology developed by Hassan and Jabbar [14] the value of HTM can be
expressed using the values of PT expressed in Equations 1 and 2.
𝐻𝑇𝑀 = 0,5 ∙ {(1542.9 − 25.3𝑋𝐶 )∙ [exp(−1.64 × 10⁻⁴ ∙ 𝑃𝑇1) + exp(−1.64 × 10⁻⁴ ∙ 𝑃𝑇2)]}+ [85.5 ∙ ln(𝑇) − 564]
(6)
Where PT1 and PT2 are tempering parameters that were calculated from Equations (1) and
(2), respectively.
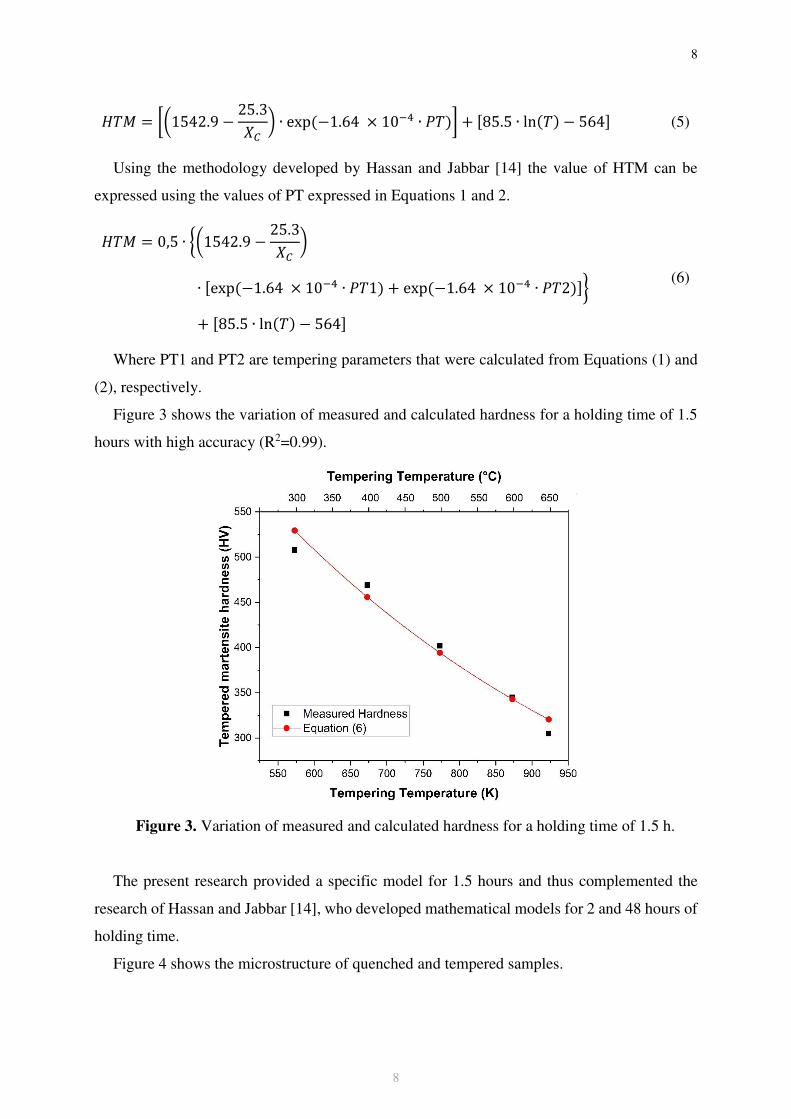
Figure 3 shows the variation of measured and calculated hardness for a holding time of 1.5
hours with high accuracy (R2=0.99).
Figure 3. Variation of measured and calculated hardness for a holding time of 1.5 h.
The present research provided a specific model for 1.5 hours and thus complemented the
research of Hassan and Jabbar [14], who developed mathematical models for 2 and 48 hours of
holding time.
Figure 4 shows the microstructure of quenched and tempered samples.
9
9
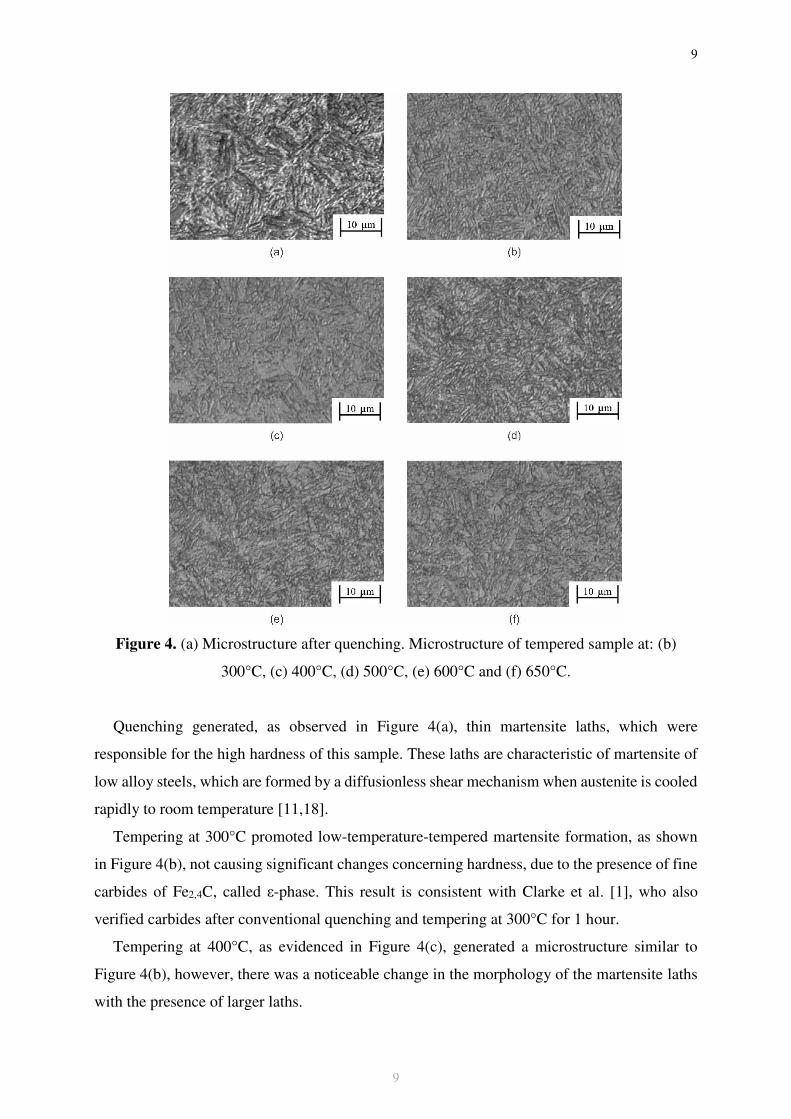
Figure 4. (a) Microstructure after quenching. Microstructure of tempered sample at: (b)
300°C, (c) 400°C, (d) 500°C, (e) 600°C and (f) 650°C.
Quenching generated, as observed in Figure 4(a), thin martensite laths, which were
responsible for the high hardness of this sample. These laths are characteristic of martensite of
low alloy steels, which are formed by a diffusionless shear mechanism when austenite is cooled
rapidly to room temperature [11,18].
Tempering at 300°C promoted low-temperature-tempered martensite formation, as shown
in Figure 4(b), not causing significant changes concerning hardness, due to the presence of fine
carbides of Fe2,4C, called ε-phase. This result is consistent with Clarke et al. [1], who also
verified carbides after conventional quenching and tempering at 300°C for 1 hour.
Tempering at 400°C, as evidenced in Figure 4(c), generated a microstructure similar to
Figure 4(b), however, there was a noticeable change in the morphology of the martensite laths
with the presence of larger laths.

10
10
Diffusion reactions occur more easily with increasing tempering temperature and, thus, there
was a trend towards the formation of more stable carbides, such as Fe3C, M7C3 and M23C6,
providing martensite with less hardness, as observed in Figure 4(d).
For tempering temperatures at 600°C, diffusional reactions are even more intense when
compared to previous conditions. Thus, in addition to the formation of more thermodynamically
stable carbides, their growth and coalescence can also occur. Additionally, in this tempering
condition, based on the Fe-Fe3C diagram, the temperature is close to the critical temperature
A1, favouring the formation of ferrite in the microstructure. In Figure 4(e), coarser
morphological aspects of quenched martensite were observed with signs of precipitation of
ferrite in the microstructure, which, combined, with the formation of more stable and coarser
carbides, led to a decrease in hardness.
The sample tempered at 650°C showed characteristics of martensite quenched at high
temperatures, highlighting the formation of a microstructure of ferrite and coarse carbides, as
evidenced in Figure 4(f). As expected, the hardness suffered a decrease in relation to the
tempering condition at 600°C and the values were very close to those of the material in the
as-received condition.
Fracture surfaces using a stereo microscope with low magnifications are shown in Figure 5.

11
11
Figure 5. Fracture surfaces of tempered sample at: (a) 300°C, (b) 400°C, (c) 500°C, (d)
600°C and (e) 650°C.
Figure 5(a) and Figure 5(b) presented brittle fracture surfaces with a low level of plastic
deformation, which agrees with the low energy impact test verified in Figure 2. The fracture
occurred due to the cleavage mechanism, quite common for this type of fracture and
characteristic of samples susceptible to tempering embrittlement phenomena.
Fracture surfaces showed for Figures 5(c), (d) and (e) presented ductile characteristics with
a dull appearance and clear signs of plastic deformation with lateral expansion.
Figure 6 shows the microstructures obtained by scanning electron microscope (SEM), in the
mode of secondary electrons (SE), for different tempering temperatures.

12
12
Figure 6. SEM of tempered samples at: (a) 300°C, (b) 400°C, (c) 500°C, (d) 600°C and (e)
650°C.
Figure 6(a) highlighted a mixed-type martensite microstructure composed of laths and large
plates, a feature confirmed by Lee and Su [19], who stated that the medium carbon steels have
a complex microstructure. The martensite laths, previously highlighted by optical microscopy,
were clear, as well as the contours of previous austenite. At this temperature, the hardness
changed little because the fine carbides still provide good strength and counteract the carbon
depletion in martensite, which is still small.

13
13
Furthermore, the presence of retained austenite was not detected, although it is more
appropriate to characterize the presence of this phase by X-ray or magnetic diffraction
measurements. Ajus et al. [20] did not detect the presence of austenite retained in AISI 4340
steel tempered at the same temperature used in this work. This is because the martensite finish
temperature, Mf, is above the room temperature and the austenitizing temperature of 860°C,
which is well below the temperature at which retained austenite formation begins.
Figure 6(b) shows a mixed microstructure consisting of laths and some large martensite
sheets. As the annealing temperature increased, conditions were more favourable for greater
diffusion. Therefore, the carbon in supersaturation in the martensite precipitates in the form of
more stable carbides, which have larger dimensions compared to tempering at 300°C. In this
sense, some carbides in the order of 200 nm were identified by the arrows in Figure 6(b). These
particles tended to deplete the matrix in terms of precipitated carbon content, but the hardness
remained high because the precipitated carbides were still very fine.
In Figure 6(c), a tempered martensite microstructure was observed and, as well as for the
tempering at 400°C, the precipitated carbides were still very fine. These precipitates hamper
the movement of dislocation in the matrix, therefore, the hardness values were still high, but
smaller compared to low tempering.
Figure 6(d) showed a tempered martensite microstructure with ferrites and rounded carbides,
about the size of 400 nm. In this way, dislocations could move more easily, causing a hardness
fall.
Figure 6(e) presented a microstructure similar to Figure 6(d), but with even coarser and
rounded carbides (500 nm), further reducing the hardness shown in Figure 1.
Figure 7 shows the characterization using SEM by secondary electron (SE) and electron
backscattered diffraction (EBSD) analysis of fracture surfaces. In some cases, energy dispersive
spectroscopy (EDS) was used as an elemental micro-analysis tool to qualitatively determine the
chemical composition of certain regions of the fracture surface.

14
14
Figure 7. Fracture surface of tempered samples at: (a) 300°C, (b) 400°C, (c) 500°C, (d)
600°C, (e) 600°C with a selected-area amplification of (d), (f) 650°C, (g) 650°C with a
selected-area amplification of (f), (h) 650°C with a selected-area amplification of (g), (i)
650°C with a selected-area amplification of (h).
Figure 7(a) showed a quasi-cleavage fracture surface and small colonies of dimples or
microcavities indicated by the white arrows. A faceted surface was also observed,
corresponding to planes of lower atomic density in which the defects have propagated, named
as cleavage planes. The dark arrow indicated river patterns, which would correspond to the
crack propagation place.

15
15
Figure 7(b) revealed a quasi-cleavage mechanism similar to Figure 7(a), although with
smaller microcavities or dimples in a larger proportion.
Figure 7(c) presented elongated inclusions in the direction perpendicular to the notch, having
a more fibrous surface appearance than samples tempered at 300°C and 400°C. Thus, the largest
proportion and size of dimples were consistent with the absorbed energy for this condition.
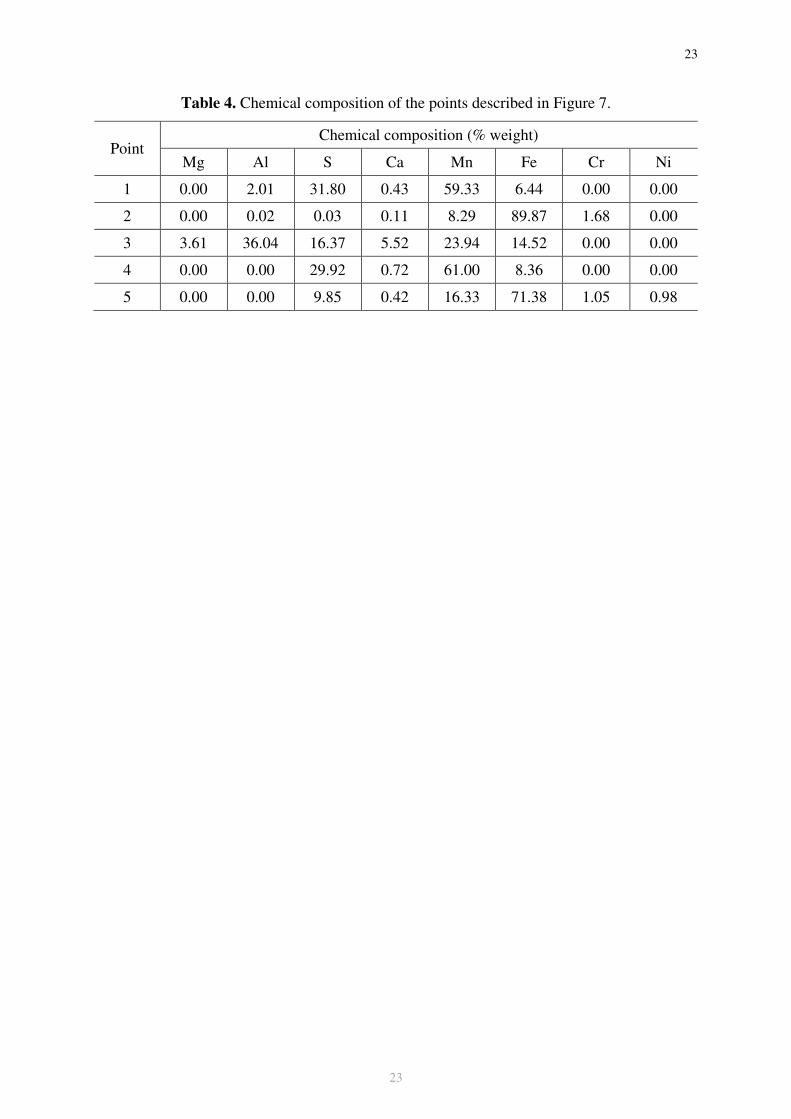
Figure 7(d) exhibited inclusions and a more fibrous-looking morphology compared to
previous conditions. EDS of point 1 indicated that the inclusion was rich in S and Mn, giving
sufficient evidence of this inclusion being a manganese sulfide (MnS), as shown in Table 4.
The manufacturer indicated that the material in the as-received condition had 50% less S than
the maximum allowable by the standard. However, the precise composition of S should be
determined by more accurate methodologies, such as combustion, as this element has a
significant harmful action in the drop of toughness.
Figure 7(e) showed a fibrous appearance with large sized dimples. An elemental
microanalysis was also carried out in point 2, which corresponded to an inclusion particle that
gave rise to a dimple, product of the shear stresses acting on this region. The results shown in
Table 4 indicated that the particle was rich in Mn and Cr.
Table 4. Chemical composition of the points described in Figure 7.
Point Chemical composition (% weight)
Mg Al S Ca Mn Fe Cr Ni
1 0.00 2.01 31.80 0.43 59.33 6.44 0.00 0.00
2 0.00 0.02 0.03 0.11 8.29 89.87 1.68 0.00
3 3.61 36.04 16.37 5.52 23.94 14.52 0.00 0.00
4 0.00 0.00 29.92 0.72 61.00 8.36 0.00 0.00
5 0.00 0.00 9.85 0.42 16.33 71.38 1.05 0.98
Figure 7(f) evidenced elongated inclusions in the direction perpendicular to the notch. The
fibrous aspect of the fracture was more marked when compared to the sample tempered at
600°C.
Figure 7(g), (h) and (i), which were amplifications of Figure 7(f), showed dimples colonies.
EDS analysis was carried out in points 3, 4 and 5 to characterize the chemical composition of
particles and/or inclusions.
Point 3 showed the preponderant presence of Al, Mn, S, Ca and Mg, highlighting once again
the need for strict control of the elements of the studied alloy.

16
16
Point 4 corresponded to an elongated inclusion of MnS and point 5 was also rich in Mn and
S, noting that, in general, the results were in accordance with what was exposed by Lee and
Su19. It is noteworthy that although this type of inclusion is not considered the most damaging
in steels in general, the elongated sulfides influence the reduction of impact toughness, since
voids are initially formed in the MnS inclusions during the fracture process.
The arrangement of the sulphides reduced the toughness, since the crack propagation
occurred more easily along the grain boundary, clarifying the results below the expected
obtained in the impact tests [21].
Additionally, the higher the tempering heat treatment temperature, the greater the amount
and size of dimples observed on the fracture surface.
4. Conclusions
The present study evaluated the influence of tempering temperature on residual stresses and
mechanical properties of AISI 4340 steel and the findings can be summarized as follows:
1- Tempering temperatures above 500°C caused a significant residual stresses relief,
providing compressive residual stresses in longitudinal and transverse directions.
2- With tempering temperature increase, precipitated carbides become coarser and
microstructure, in general, less refined, which explains hardness reduction.
3- The tempering temperature increase caused the decrease of the anchor points of the
magnetic domain, facilitating the movement of these domains, thus, producing higher
magnetic Barkhausen noise.
4- The mathematical model obtained by regression analysis method allowed predicting the
hardness of tempered martensite (HTM) with high accuracy for 1.5 hours holding time.
Declarations
Acknowledgments
This study was financed in part by the Coordenação de Aperfeiçoamento de Pessoal de Nível
Superior - Brasil (CAPES) - Finance Code 001. The authors would also like to thank the CNPq
(304129/2018-6) and FAPERJ (E 26/211.114/2019 (250854) and 03-2017 of Young Scientist
of Our State).
Conflict of interest The authors declare that they have no conflict of interest.
Availability of data and material Not applicable.

17
17
Code availability Not applicable.
Ethics approval Not applicable.
Consent to participate Written informed consent for publication was obtained from all
participants.
Consent for publication Written informed consent for publication was obtained from all
participants.
Authors' contributions Marcel Freitas de Souza: Investigation, Writing – original draft,
Writing – review & editing.
Luana Ferreira Serrão: Conceptualization, Formal analysis, Investigation, Methodology.
Juan Manuel Pardal: Investigation, Methodology, Resources, Supervision, Validation, Writing
– original draft.
Sérgio Souto Maior Tavares: Validation, Writing – original draft.
Maria Cindra Fonseca: Conceptualization, Formal analysis, Funding acquisition, Investigation,
Methodology, Project administration, Resources, Supervision, Validation, Visualization,
Writing – review & editing.
References
1. Clarke AJ, Klemm-Toole J, Clarke KD et al (2020) Perspectives on Quenching and
Tempering 4340 Steel. Metall Mater Trans A 51:4985-5005. https://doi.org/10.1007/s11661-
020-05972-1
2. Kwon H, Cha JC, Kim CH (1988) The effect of grain size on fracture behavior in tempered
martensite embrittlement for AISI 4340 steel. Mater Sci Eng 100:121-128.
https://doi.org/10.1016/0025-5416(88)90247-9
3. Chi YC, Lee S, Cho K, Duffy J (1989) The effects of tempering and test temperature on the
dynamic fracture initiation behavior of an AISI 4340 VAR steel. Mater Sci Eng A 114:105-126.
https://doi.org/10.1016/0921-5093(89)90850-2
4. Kashefi M, Rafsanjani A, Kahrobaee S, Alaee M (2012) Magnetic nondestructive technology
for detection of tempered martensite embrittlement. J Magn Magn Mater 324:4090-4093.
https://doi.org/10.1016/j.jmmm.2012.07.029
18
18
5. Davut K, Gür CH (2007) Monitoring the microstructural changes during tempering of
quenched SAE 5140 steel by Magnetic Barkhausen Noise. J Nondestr Eval 26:107-113.
https://doi.org/10.1007/s10921-007-0025-x
6. Moorthy V, Shaw BA, Evans JT (2003) Evaluation of tempering induced changes in the
hardness profile of case carburized EN36 steel using magnetic Barkhausen noise analysis. NDT
& E Int 36(1):43-49. https://doi.org/10.1016/S0963-8695(02)00070-1
7. Santa-aho S, Sorsa A, Honkanen M, Vippola M (2020) Detailed Barkhausen noise and
microscopy characterization of Jominy end-quench test sample of CF53 steel. J Mater Sci
55:4896-4909. https://doi.org/10.1007/s10853-019-04284-z
8. Jiang B, Wu M, Zhang M, Zhao F, Zhao Z, Liu Y (2017) Microstructural characterization,
strengthening and toughening mechanisms of a quenched and tempered steel: Effect of heat
treatment parameters. Mater Sci Eng A 707:306-314.
https://doi.org/10.1016/j.msea.2017.09.062
9. ASM Handbook Volume 4A (2013) Steel Heat Treating Fundamentals and Processes. ASM
International, Materials Park
10. Manokaran M, Kashinath AS, Jha JS, Toppo SP, Singh RP (2020) Influence of Tempering
in Different Melting Routes on Toughness Behavior of AISI 4340 Steel. J Mater Eng Perform
29(10):6748-6760. https://doi.org/10.1007/s11665-020-05164-3
11. Ning D, Dai CR, Wu JL, Wang YD, Wang YQ, Jing Y, Sun J (2021) Carbide precipitation
and coarsening kinetics in low carbon and low alloy steel during quenching and subsequently
tempering. Mater Charact 176: 111111. https://doi.org/10.1016/j.matchar.2021.111111
12. García Navas V, Ferreres I, Marañón JA, Garcia-Rosales C, Sevillano JG (2008)
Electro-discharge machining (EDM) versus hard turning and grinding – Comparison of residual
stresses and surface integrity generated in AISI O1 tool steel. J Mater Process Technol 195(1-
3):186-194. https://doi.org/10.1016/j.jmatprotec.2007.04.131
13. Withers PJ, Bhadeshia HKDH (2001) Residual stress. Part 1 – Measurement techniques.
Mater Sci Technol 17:355-365.
14. Hassan AD, Jabbar MA (2021) New Prediction Model of Tempered Martensite Hardnesses
for Quenched and Tempered Low-Alloy Steel. Mater Perform Charact 10(1):267-277.
https://doi.org/10.1520/MPC20200104
15. Hollomon JH, Jaffe LD (1945) Time-Temperature Relations in Tempering Steel. Trans
Metall Soc AIME 162:223-249.

19
19
16. Kang S, Lee S (2014) Prediction of Tempered Martensite Hardness Incorporating the
Composition-Dependent Tempering Parameter in Low Alloy Steels. Mater Trans 55(7):1069-
1072. https://doi.org/10.2320/matertrans.M2014004
17. ASTM E140 (2019) Standard Hardness Conversion Tables for Metals Relationship Among
Brinell Hardness, Vickers Hardness, Rockwell Hardness, Superficial Hardness, Knoop
Hardness, Scleroscope Hardness, and Leeb Hardness. https://doi.org/10.1520/E0140-
12BR19E01
18. Thompson S (2018) Further Observations of Linear Arrays of Transition-Iron-Carbide
Precipitates in Tempered 4340 Steel. Metall Microstruct Anal 7:680-691.
https://doi.org/10.1007/s13632-018-0492-8
19. Lee W, Su T (1999) Mechanical properties and microstructural features of AISI 4340
high-strength alloy steel under quenched and tempered conditions. J Mater Process Technol
87(1-3):198-206. https://doi.org/10.1016/S0924-0136(98)00351-3
20. Ajus C, Tavares SSM, Silva MR, Corte RRA (2009) Magnetic properties and retained
austenite quantification in SAE 4340 steel. Revista Matéria 14(3):993-999.
https://doi.org/10.1590/S1517-70762009000300011
21. Tavares SSM, Pardal JM, Souza JA, Pereira OC, Luz TS (2016) Failure of alloy steel
socket-head cap screws used in offshore oil production. Eng Fail Anal 70:16-21.
https://doi.org/10.1016/j.engfailanal.2016.07.004

20
20
Table 1. Chemical composition of AISI 4340 (% weight).
C Mn Si P
(max)
S
(max) Cr Ni Mo Al Cu
Manufacturer 0.40 0.73 0.28 0.01 0.02 0.78 1.73 0.21 0.02 0.11
SAE 4340
0.38
–
0.43
0.60
–
0.80
0.15
–
0.35
0.04 0.04
0.70
–
0.90
1.65
–
2.00
0.20
–
0.30
- -

21
21
Table 2. Mechanical properties of AISI 4340.
σYS (MPa) σUTS (MPa) Elongation (%) RA (%) Rockwell Hardness (HRC)
765 960 14.8 39.5 32

22
22
Table 3. Equation parameters for alloying effect according to Kang and Lee [16].
Parameter 𝐻0 𝐻𝐶 𝐻𝑀𝑛 𝐻𝑆𝑖 𝐻𝑁𝑖 𝐻𝐶𝑟 𝐻𝑀𝑜
Value 17.396 -6.661 -1.604 -3.412 -0.248 -1.112 -4.355
23
23
Table 4. Chemical composition of the points described in Figure 7.
Point Chemical composition (% weight)
Mg Al S Ca Mn Fe Cr Ni
1 0.00 2.01 31.80 0.43 59.33 6.44 0.00 0.00
2 0.00 0.02 0.03 0.11 8.29 89.87 1.68 0.00
3 3.61 36.04 16.37 5.52 23.94 14.52 0.00 0.00
4 0.00 0.00 29.92 0.72 61.00 8.36 0.00 0.00
5 0.00 0.00 9.85 0.42 16.33 71.38 1.05 0.98

24
24
Figure 1. Flowchart with heat treatment parameters and tests performed in this experiment.

25
25
Figure 2. Mechanical properties, residual stresses and MBN vs. tempering temperature.

26
26
Figure 3. Variation of measured and calculated hardness for a holding time of 1.5 h.

27
27
Figure 4. (a) Microstructure after quenching. Microstructure of tempered sample at: (b)
300°C, (c) 400°C, (d) 500°C, (e) 600°C and (f) 650°C.

28
28
Figure 5. Fracture surfaces of tempered sample at: (a) 300°C, (b) 400°C, (c) 500°C, (d)
600°C and (e) 650°C.

29
29
Figure 6. SEM of tempered samples at: (a) 300°C, (b) 400°C, (c) 500°C, (d) 600°C and (e)
650°C.

30
30
Figure 7. Fracture surface of tempered samples at: (a) 300°C, (b) 400°C, (c) 500°C, (d)
600°C, (e) 600°C with a selected-area amplification of (d), (f) 650°C, (g) 650°C with a
selected-area amplification of (f), (h) 650°C with a selected-area amplification of (g), (i)
650°C with a selected-area amplification of (h).

31
31
Figure captions
Figure 1. Flowchart with heat treatment parameters and tests performed in this experiment.
Figure 2. Mechanical properties, residual stresses and MBN vs. tempering temperature.
Figure 3. Variation of measured and calculated hardness for a holding time of 1.5 h.
Figure 4. (a) Microstructure after quenching. Microstructure of tempered sample at: (b)
300°C, (c) 400°C, (d) 500°C, (e) 600°C and (f) 650°C.
Figure 5. Fracture surfaces of tempered sample at: (a) 300°C, (b) 400°C, (c) 500°C, (d) 600°C
and (e) 650°C.
Figure 6. SEM of tempered samples at: (a) 300°C, (b) 400°C, (c) 500°C, (d) 600°C and (e)
650°C.
Figure 7. Fracture surface of tempered samples at: (a) 300°C, (b) 400°C, (c) 500°C, (d) 600°C,
(e) 600°C with a selected-area amplification of (d), (f) 650°C, (g) 650°C with a selected-area
amplification of (f), (h) 650°C with a selected-area amplification of (g), (i) 650°C with a
selected-area amplification of (h).