TEMPERATURE VARIATIONS OF DIPTERAN … VARIATIONS OF DIPTERAN LARVAL MASSES ANALYZED ON FLORIDA...
107
TEMPERATURE VARIATIONS OF DIPTERAN LARVAL MASSES ANALYZED ON FLORIDA BLACK BEAR CARCASSES By SONJA LISE PETERS A THESIS PRESENTED TO THE GRADUATE SCHOOL OF THE UNIVERSITY OF FLORIDA IN PARTIAL FULFILLMENT OF THE REQUIREMENTS FOR THE DEGREE OF MASTER OF SCIENCE UNIVERSITY OF FLORIDA 2003
Transcript of TEMPERATURE VARIATIONS OF DIPTERAN … VARIATIONS OF DIPTERAN LARVAL MASSES ANALYZED ON FLORIDA...

TEMPERATURE VARIATIONS OF DIPTERAN LARVAL MASSES ANALYZED
ON FLORIDA BLACK BEAR CARCASSES
By
SONJA LISE PETERS
A THESIS PRESENTED TO THE GRADUATE SCHOOL OF THE UNIVERSITY OF FLORIDA IN PARTIAL FULFILLMENT
OF THE REQUIREMENTS FOR THE DEGREE OF MASTER OF SCIENCE
UNIVERSITY OF FLORIDA
2003

Copyright 2003
by
Sonja Lise Peters

This document is dedicated to my parents, Bob and Susan. They have always supported all the decisions I have made and left a clear pathway to follow. They have showed their
love and passed on all their knowledge so I can continue to strive through life.
I also dedicate this work to Ron. He has provided the extra care and support I needed to achieve my dreams.

ACKNOWLEDGMENTS
I send the greatest gratitude and appreciation to my advisor, Dr. J. Hogsette, for his
assistance in this research. I extend appreciation to Dr. J. Butler for his guidance and
knowledge and for providing the useful equipment to complete this project. Appreciation
also goes to Dr. R. Rutledge and Dr. A. Falsetti for their added support and contributions
to this project.
I also gratefully appreciate Mr. Walt McCown for providing the carrion for the
experiment and facilities.
iv

TABLE OF CONTENTS page ACKNOWLEDGMENTS ................................................................................................. iv
LIST OF TABLES............................................................................................................ vii
LIST OF FIGURES ......................................................................................................... viii
ABSTRACT..................................................................................................................... xiv
CHAPTER 1 FORENSIC ENTOMOLOGY LITERATURE REVIEW............................................1
Introduction to Forensic Entomology...........................................................................1 History Behind the Field .......................................................................................1 Description of Insects and the Law .......................................................................2 First Uses of Forensic Entomology .......................................................................3
Studies Since 1980........................................................................................................6 Succession .............................................................................................................6 Post Mortem Interval (PMI) ..................................................................................7 Examining Forensically Important Flies .............................................................10 Advancements in DNA........................................................................................11 Miscellaneous ......................................................................................................12 Thermal Energy ...................................................................................................14
2 EXAMINING THE MAGGOT MASS......................................................................16
Host Selection and Scope of Study.............................................................................16 Methods and Materials ...............................................................................................17
Bear 1, June 2002 ................................................................................................20 Bear 2, August 2002 ............................................................................................20 Bear 3, November 2002.......................................................................................20
Species Composition ..................................................................................................21 Species Pictorial..........................................................................................................25 Decomposition............................................................................................................43
Bear 1, June 2002 ................................................................................................44 Bear 2, August 2002 ............................................................................................48 Bear 3, November 2002.......................................................................................51
v

3 MAGGOT MASS OBSERVATIONS .......................................................................55
Bear 1, June 2002 .......................................................................................................55 Bear 2, August 2002 ...................................................................................................58 Bear 3, November 2002..............................................................................................61
4 SUMMARY................................................................................................................78
Discussion...................................................................................................................78 Species Interaction...............................................................................................78 Thermal Energy of the Maggot Mass..................................................................79
Conclusion ..................................................................................................................84 LIST OF REFERENCES...................................................................................................87
BIOGRAPHICAL SKETCH .............................................................................................93
vi

LIST OF TABLES
Table page 2-1 Adult insects collected from Bear 1, June 2002, cataloged by species per day for
the hours of decomposition. .....................................................................................22
2-2 Adult insects collected from Bear 2, August 2002, cataloged by species per day for the hours of decomposition.................................................................................23
2-3 Adult insects collected from Bear 3, November 2002, cataloged by species per day for the hours of decomposition..........................................................................24
3-1 Descriptive statistics of temperatures recorded for Bear 1, June 2002 throughout decomposition. .........................................................................................................56
3-2 Significance of daily means for Bear 1, June 2002 from Duncan’s test. .................57
3-3 Descriptive statistics of temperatures recorded for Bear 2, August 2002 throughout decomposition........................................................................................59
3-4 Significance of daily means for Bear 2, August 2002 from Duncan’s test. .............61
3-5 Descriptive statistics of temperatures recorded for Bear 3, November 2002 throughout decomposition........................................................................................62
3-6 Significance of daily means for Bear 3, November 2002 from Duncan’s test.........63
vii

LIST OF FIGURES
Figure page 2-1 Bear 1, June 2002 larval succession pattern during decomposition.........................23
2-2 Bear 2, August 2002 larval succession pattern during decomposition ....................24
2-3 Bear 3, November 2002 larval succession pattern during decomposition ...............25
2-4 Adult Hairy Maggot Blow fly, Chrysomya rufifacies..............................................26
2-5 Maggot mass of Chrysomya rufifacies.....................................................................27
2-6 Adult Chrysomya megacephala ovipositing on fresh tissue ....................................27
2-7 Maggot mass composed solely of Chrysomya megacephala...................................28
2-8 Adult Secondary Screwworm, Cochliomyia macellaria..........................................28
2-9 Maggot mass composed of Cochliomyia macellaria ...............................................29
2-10 Adult Phaenicia coeruleiviridis ...............................................................................30
2-11 Phaenicia sericata adult...........................................................................................31
2-12 Phaenicia sericata larva...........................................................................................31
2-13 Adult Sarcophagidae, Flesh Fly ...............................................................................32
2-14 Adult Red-Tailed Flesh Fly......................................................................................32
2-15 Adult Black Dump Fly, Hydrotaea leucostoma.......................................................33
2-16 Adult Black Soldier Fly, Stratiomyidae ...................................................................34
2-17 Suriname Carrion Beetle, adult ................................................................................35
2-18 Necrophilia americana adult....................................................................................35
2-19 The Burying Beetle adult, Nicrophorus carolinus ...................................................36
2-20 Nicrophorus orbicollis adult preserved....................................................................37
viii

2-21 Adult Dermestes ater ...............................................................................................37
2-22 Adult Dermestes maculates......................................................................................38
2-23 Preserved Dermestes caninus adult..........................................................................39
2-24 Hairy Rove Beetle, Creophilus maxillosus ..............................................................40
2-25 Adult Creophilus maxillosus ....................................................................................40
2-26 Hister sp, Clown Beetle adult ..................................................................................41
2-27 Saprinus pennsylvanicus adult specimen .................................................................41
2-28 Red Legged Ham beetle adult ..................................................................................42
2-29 Adult Trox suberosus ...............................................................................................43
2-30 Day 3, the early stages of decomposition have begun and maggot masses are present at the orifices on Bear 1, June 2002.............................................................44
2-31 Day 4, maggot masses of C. rufifacies have formed around the extremities and head region of Bear 1, June 2002. ............................................................................45
2-32 Day 5, the larval masses have increased in size and are more observable on Bear 1, June 2002. ....................................................................................................45
2-33 Day 6, the skin of Bear 1, June 2002, is becoming weathered while the larvae consume the tissue underneath. ................................................................................46
2-34 Day 8, the bear mass of Bear 1, June 2002, has become depleted by the feeding of the larvae and the skin is being pulled close around the bones............................46
2-35 Day 9, the skin has tightened and the bones are becoming exposed on Bear 1, June 2002. .........................................................................................................................47
2-36 Day 11, the majority of Bear 1, June 2002, has been eaten and the bones are exposed.....................................................................................................................47
2-37 Bear 2, August 2002, is a large 195 lb female, this picture taken Day 1 shows her in the fresh stage.......................................................................................................48
2-38 Day 1, Bear 2, August 2002 is bloating and shows signs of trauma on her back. ...48
2-39 Day 4, large maggot masses have begun to consume the head, neck, chest and extremities of Bear 2, August 2002..........................................................................49
2-40 Day 6, the mass of Bear 2, August 2002 is deteriorating with the ferocious appetite of the larvae. ...............................................................................................49
ix

2-41 Day 9, most of the tissue mass of Bear 2, August 2002 has been consumed and the larvae have begun to migrate down the fence line where they will pupate at....50
2-42 Day 11, Bear 2, August 2002 bones from the extremities are becoming visible and fly activity has slowed..............................................................................................50
2-43 Day 12, larval activity has ended while the beetles continue to utilize the hair and skin of Bear 2, August 2002.....................................................................................51
2-44 Day 1, initial photo of a male cub (Bear 3) about 38 lbs hit by a car on November 1, 2002, in Ocala, FL. .............................................................................51
2-45 Day 1, close up of the wound present above the right shoulder blade of fore limb of Bear 3, November 2002. ......................................................................................52
2-46 Day 1, photo showing the fly activity that has begun to occur within 2 hours after Bear 3, November 2002 arrived at the study site. ....................................................52
2-47 Day 4, the hair has begun to slough off as the maggot masses form at the orifices and around the perimeter of Bear 3, November 2002. .............................................53
2-48 Day 5, larval masses have consumed several areas of Bear 3, November 2002 such as the abdomen, chest, head and extremities. ..................................................53
2-49 Day 6, C. rufifacies is the dominant species forming the maggot mass on Bear 3, November 2002. .......................................................................................................54
2-50 Day 6, Bear 3, November 2002 mass has been consumed by the larvae, which leave very little amounts of flesh behind. ................................................................54
3-1 Temperature readings recorded on 15-minute intervals during decomposition of Bear 1, June 2002. ....................................................................................................56
3-2 Daily means for temperature from Duncan’s test for Bear 1, June 2002.................57
3-3 Mean growth rate of Chrysomya rufifacies over time compared to mean maggot mass temperature for Bear 1, June 2002. .................................................................58
3-4 Temperature readings recorded on 15-minute intervals during decomposition of Bear 2, August 2002.................................................................................................59
3-5 Daily means for temperature from Duncan’s test for Bear 2, August 2002.............60
3-6 Mean growth rate of Chrysomya rufifacies over time compared to mean maggot mass temperature for Bear 2, August 2002. .............................................................60
3-7 Temperature readings recorded on 15-minute intervals during decomposition of Bear 3, November 2002. ..........................................................................................62
x

3-8 Daily means for temperature from Duncan’s test for Bear 3, November 2002. ......63
3-9 Mean growth rate of Chrysomya rufifacies over time compared to mean maggot mass temperature for Bear 3, November 2002.........................................................64
3-10 Day 3, maggot mass positions that have formed within the first 72 hours for Bear 1, June 2002, with comparison of the maggot mass temperature to the soil under the bear temperature. ......................................................................................65
3-11 Day 4, the movement of the maggot masses for Bear 1, June 2002, with comparison of the maggot mass temperature to the soil under the bear temperature...............................................................................................................66
3-12 Day 5, the maggot masses are present in the same locations as those of Day 4 for Bear 1, June 2002, the temperature of the maggot mass compared to the soil temperature under bear is shown..............................................................................66
3-13 Drawing shows the variation in locations upon which the larvae prefer to grow at after Day 6 on Bear 1, June 2002, it also compares the maggot mass temperature with the soil temperature under the bear. .................................................................67
3-14 Maggot mass movement fluctuates in size as the temperature difference increases from the ambient soil temperature on Bear 1, June 2002.........................................67
3-15 This drawing shows how the larvae come closer together as they feed and grow together in a mass on Bear 1, June 2002 and compares the maggot mass temperature with the soil temperature. .....................................................................68
3-16 As the larvae slowly reach the post-feeding stage on Bear 1, June 2002, they begin to spread out on the surfaces of the bear and surrounding areas, a comparison of the maggot mass temperature to the soil under the bear temperature is shown. ......68
3-17 Day 11, the maggot masses activity is starting to slow and remain in a constant location until ready to migrate away from Bear 1, June 2002, the maggot mass temperature is shown in relation to the soil temperature..........................................69
3-18 The final day of the maggot masses on Bear 1, June 2002, before the post-feeding larvae migrate away from the carcass to pupate, the soil temperature is still less than the maggot mass. ..............................................................................................69
3-19 Drawing from Day 1 showing the first maggot mass to form on Bear 2, August 2002, the temperature of the maggot mass is compared to the soil temperature underneath the bear. .................................................................................................70
3-20 The original maggot mass is increasing in size while other areas of the carcass are beginning to form masses on Bear 2, August 2002. A comparison is done between the maggot mass temperature and the soil. ................................................70
xi

3-21 Day 3, all of the orifices of Bear 2, August 2002, have maggot masses along with areas of the carcass that are touching the ground. The maggot mass temperature is compared to the soil temperature under the bear..................................................71
3-22 The larvae have increased in size as well have the masses that they have formed on Bear 2, August 2002, the maggot mass temperature is compared to the soil temperature under the bear. ......................................................................................71
3-23 Day 5, the larval masses are found mostly on one side of Bear 2, August 2002 feeding on the tissue of the extremities, head and abdominal regions, the temperature produced by these masses are compared to that of the soil..................72
3-24 The drawing shows the main areas of interest to the developing larvae on Bear 2, August 2002 with a comparison of the maggot mass temperature to the soil temperature...............................................................................................................72
3-25 The developing larvae, which are close to migrating in order to pupate, have consumed the majority of Bear 2, August 2002 tissue but the maggot mass temperature is still higher than the soil. ...................................................................73
3-26 Day 17, a new wave of blow fly larvae has begun to develop on Bear 2, August 2002 and the maggot mass temperature is being compared to the soil temperature under the bear. ..........................................................................................................73
3-27 The larvae of the new maggot masses are developing rapidly on Bear 2, August 2002 but the numbers are much lower than those from the first wave of blow fly, the maggot mass temperature is still higher than that of the soil. ............................74
3-28 Day 20, one small maggot mass still remains on Bear 2, August 2002 even in the late stage of decay, its temperature is not much more than that of the soil..............74
3-29 Day 2, early signs of maggot mass formation taking place at the mouth and the chest for Bear 3, November 2002, the temperature of the maggot mass is compared to that of the soil temperature under the bear. .........................................75
3-30 The larvae in the chest mass on Bear 3, November 2002 have begun to increase in numbers and size, so has the difference between the maggot mass and soil temperatures. ............................................................................................................75
3-31 By day 4, the larval masses of Bear 3, November 2002 have moved throughout the body and the numbers have increased greatly, the maggot mass temperature is still significantly higher than that of the soil............................................................76
3-32 Although there are larger maggot masses present on Bear 3, November 2002, the soil temperature underneath the bear is slightly hotter on day 5..............................76
3-33 On day 6, the maggot mass temperatures on Bear 3, November 2002 was higher than that of the soil. The larval masses have also increased in numbers and size. .77
xii

3-34 The larval masses have become a little bit smaller and the larvae are reaching migration on Bear 3, November 2002 but the heat they generate is still higher than that of the soil. ..........................................................................................................77
xiii

Abstract of Thesis Presented to the Graduate School
of the University of Florida in Partial Fulfillment of the Requirements for the Degree of Master of Science
TEMPERATURE VARIATIONS OF DIPTERAN LARVAL MASSES ANALYZED ON FLORIDA BLACK BEAR CARCASSES
By
Sonja Lise Peters
August 2003
Chair: Jerome Hogsette Major Department: Entomology and Nematology
The first colonizers of carrion are necrophagous flies from the families
Calliphoridae and Sarcophagidae. The larvae grow in groups referred to as maggot
masses that help enhance decomposition. The larvae produce heat that enables them to
sustain continual growth despite ambient temperature. The maggot masses in North
Central Florida are composed primarily of the species Chrysomya rufifacies (Macquart).
The objective of this experiment was to analyze the varying temperatures of the
maggot mass on three different black bear carcasses. Temperature reading from the air,
wet bulb, soil underneath the bear, and maggot mass were taken every 15 minutes. All
four of the different temperature readings were compared to determine the role of the
maggot mass in decomposition and how this effects Post Mortem Interval (PMI)
determination.
xiv
CHAPTER 1 FORENSIC ENTOMOLOGY LITERATURE REVIEW
Introduction to Forensic Entomology
History Behind the Field
Entomologists have used carrion flies and sarcophagous beetles with the intent of
solving criminal cases. Dating back to the 13th Century, this division of medical
entomology was first understood and used in China by a leading criminalist trying to
solve a mysterious murder-by-slashing in a small town (Hall 2001). With a basic
knowledge of flies, it was possible to determine which of the villagers had committed the
crime. From then on, the field of forensic entomology progressed slowly until the mid
1800s when it became of interest to Bergeret in Europe. Then in the late 1800s, J.P.
Megnin was credited with focusing forensic entomology studies in the West (Hall 2001).
Megnin identified eight stages in the decomposition of a human body in air; and
determined the insects associated with each stage (Greenberg 1991). Since that time,
entomological evidence has been used sporadically in several murder cases in Britain and
more frequently on the North American continent with increasing success (Smith 1986).
Even with an increased interest in forensic entomology and extensive research
being done, death investigators still regarded these insects as merely a sign of decay, to
be washed away or otherwise disposed of as quickly as possible, rather than potentially
significant evidence (Goff 2000). It was not until the last two decades that the value of
insects found infesting corpses became apparent to those in the forensic field. Because
the emphasis of forensic medical entomology has been placed on the use of arthropod
1

2
evidence for solving crimes, most often violent in nature, the name medicocriminal
entomology has been coined for the field (Hall 1990). Forensic entomology contains the
intrigue surrounding human death, the decay process with its grisly aspects, the detective
work necessary to bring perpetrators to trial, the adversarial criminal justice system with
its arcane terminology, and the drama of the courtroom (Hall 2001).
Description of Insects and the Law
Forensic entomology is the study of arthropods, especially insects, associated with
crimes and other aspects of the court and judicial system. It involves the identification of
insects and other arthropods associated with human remains as an aid to determine time
and place of death (Mullen & Durden 2002). The exposed remains of an individual
present a temporary habitat and food source for a wide variety of organisms, most
importantly carrion insects (Goff & Odom 1987). As the initial colonizers they may
arrive just minutes after death and lay eggs within a few hours (Greenberg & Kunich
2002). The insects provide information to scientists and investigators as to the time of
death for that individual. They can also provide information on the location of death.
When an insect is collected from a corpse that is not present in the region that the corpse
was left, it can indicate possible movement of the body. The movement can be a distance
from one town to the next one over or several states in between.
Insects are major players in nature’s recycling effort, and in nature a corpse is
simply organic matter to be recycled (Goff 2000). To further comprehend the lifestyle of
these particular insects, entomologists have taken an interest in their temporary habitats,
life cycle, and growth rates, which can be used in criminal investigations. The insects
and other invertebrates feeding on carrion form a distinct faunal succession associated
with the various stages of decay. Recognition of the immature stages of the species

3
involved in the succession, united with a knowledge of their rates of development, can
give an indication of the age of the corpse (Smith 1986). Succession is the idea that as
each organism or group of organisms feeds on the body, the corpse changes thereby
making it more attractive to another group of organisms (Goff 2000). The first
generation of initial colonizers can provide a biological clock that more precisely
measures the time of death for up to two or more weeks; medical examiner’s estimates
are limited to about a day or two (Greenberg & Kunich 2002).
Forensic entomology is the study of arthropods most notably associated with
crimes and used to solve matters of legal interest. “It’s mostly a repeated tale of human
tragedy combined with some remarkable insect ecology,” says Dr. Jeffery Wells (Lewis
2001). The use of forensic entomology is utilized less when compared to the other
scientific methods such as ballistics or blood splatter, hair, and fiber analyses for solving
a crime (Lewis 2001). Although still viewed by the public as something of an oddity,
insect evidence is recognized by the courts and increasingly introduced in cases involving
accidents, homicides, and suspicious deaths, especially where time of death is a key issue
(Greenberg & Kunich 2002). Forensic entomology is inextricably linked with the
broader scientific fields of medical entomology, insect taxonomy, and forensic pathology
(Hall 1990).
First Uses of Forensic Entomology
Following the introduction of arthropods to criminal studies in the United States
several medical entomologists expanded their field of interest. Several different research
studies were conducted to further understand the fly and its role in forensics. The most
notable studies were conducted by Bernard Greenberg who is widely regarded as the
father of forensic entomology (Goff 2000). He is now a world authority on the

4
Calliphoridae family due to all the time and work he has put into researching the biology
and life cycles of many species (Goff 2000). In the mid-1960s Jerry Payne, a student of
Greenberg, began to lay the groundwork for another aspect of forensic entomology:
succession. In his landmark paper he detailed the changes that occurred during the
decomposition of pig carcasses exposed to insects compared to pigs that were protected
(Goff 2000). Forensic entomologists with the consciousness of insect succession patterns
in carcasses and comparing this with corpses were able to determine the post mortem
interval (PMI) the time elapsed since death. The ability to determine the PMI was the
next big step forward for forensic entomology. It is accredited with giving entomologists
a place in the criminal field.
The principal methodology used in medicocriminal entomology is application of
the temperature-dependent development of insects, especially flies, for estimating a
decedent’s PMI (Hall 2001). Work conducted on the life cycle of the Calliphoridae and
Sarcophagidae, the two families most likely be found on a decomposing corpse was used
to figure out the time of death. The perception that the Calliphoridae and Sarcophagidae
were found together on carcasses lead some researchers to examine how they managed to
cultivate concurrently. Denno and Cothran (1976) explored the interaction between these
two families. They examined experimentally the role that interspecific competition
played in determining niche relationships within the fly guild. They determined that the
only factor limiting Sarcophagidae populations was the calliphorids. When the
calliphorid population was reduced, the sarcophagid population increased 6-fold.
Several of the first studies conducted looked at temperature and its relation to other
variables. One of the earliest papers published involved experiments showing the

5
relationship between carcass temperature and the winter blow fly populations (Deonier
1940). It was found that blow flies of the southwestern United States feed extensively in
carcasses and their development depends on temperature of the medium along with that
of exposure to the sun. The ambient temperature combined with the temperature of the
masses of blow fly larvae furnished favorable conditions for larval development during
cool weather (Deonier 1940). In 1944, Davidson conducted a project “On The
Relationship Between Temperature and Rate of Development of Insects at Constant
Temperatures.” He was able to write equations that showed the relationship between
temperature and the time required for development in insects and other poikilothermic
animals. The curves from these data represent the development trend rate of the insects
for 85-90% of the temperature range at which development can occur. The ‘peak’
temperature is defined as the temperature at which the given stage of the animal develops
the fastest.
In 1975, Ash and Greenberg researched the rate of development from two sibling
Calliphorid species based on temperature. It was determined that Phaenicia sericata
(Meigen) developed at a much slower rate than its sibling, with more variability at each
stage and tended to diapause at both low and high temperatures. Phaenicia pallescens
(Meigen) develops at a much faster rate, does not diapause and is found in sub-tropical
regions.
Although entomologists in the United States had been introduced to forensic
entomology in the late 1800s much of the research advances did not take place until the
1980s. Most of the literature does not date back earlier than 1975; however the earlier
work set the groundwork for what was to follow.

6
Studies Since 1980
Succession
Succession of carrion insects has been studied for many years by an array of
entomologists. To further understand the behavior of sarcophagous insects, whether
beetles or flies, research has been conducted with several kinds of carcasses in a wide
variety of locations to make this science as accurate and useful as it can be for law
enforcement agencies. It is known that insects are usually the first organisms to arrive to
a body after death, and they colonize in a predictable sequence. The body progresses
through a recognized sequence of decompositional stages, from fresh to skeletal, over
time. Each of these stages of decomposition is attractive to a different group of
sarcosaprophagous arthropods, primarily insects (Anderson 2001).
Blow flies are the most common dipterans seen in abundance around carcasses,
which serve as oviposition sites and larval food sources. Adult flies are attracted to the
carrion until it is nearly dry, but other species visit the carcasses only during specific
stages of decomposition; thus a succession of species can be observed (Goddard & Lago
1985). Blow flies are dipteran vultures with a keen ability to locate ephemeral resources
in a large landscape (Greenberg 1991). When the sequence of insects colonizing carrion
is known for a given area and a set of circumstances, an analysis of the arthropod fauna
on a carcass can be used to determine the time of death (Anderson 2001). Arthropod
succession on carrion during the decomposition process is generally divided into
microseral stages, but there has been little agreement as to the number of stages (Goddard
and Lago 1985).
Several factors can alter the succession process for a carcass: geographical
differences, effects of season, effects of sun exposure, urban vs. rural scenarios, bodies

7
inside buildings, effects of burial, bodies in water, bodies in vehicles, bodies in enclosed
spaces, hung bodies, burned remains, and wrapped remains (Anderson 2001). Succession
studies have been conducted on a variety of carcasses ranging from small to very large
animals and the data have been extrapolated to help law enforcement agencies solve
crime. In 1991, Hewadikaram & Goff addressed this topic and found that there were no
size-related differences between the carcasses with respect to the composition of the
arthropod fauna or patterns of succession. A greater number of arthropods were attracted
to the larger carcass and the rate of decomposition observed was more rapid. It has also
been discovered that an exposed carcass will decompose at an increased rate compared to
a shaded carcass. Temperature readings for the sun exposed site and the observed
maggot masses are higher for most part throughout the day (Shean et al.. 1993).
Post Mortem Interval (PMI)
Insects, by their activities, begin a biological clock that will allow for an estimation
of the PMI (Goff 1993). PMI is defined as the time from death to discovery of the
corpse; it is the most familiar use of entomological evidence in criminal investigations
(Schoenly et al. 1996). Entomologists have applied developmental and successional data
of carrion-associated arthropods to assist medicolegal investigators in cases of homicide,
suicide, and accidental death (Schoenly et al. 1996). Determining time of death is
extremely important in a death investigation as it focuses the investigation into the
correct time frame. This can support or refute a suspect’s alibi and improves the
efficiency of the criminal investigation (Anderson 1999).
The time of death is determined by an examination of the arthropod fauna
surrounding a carcass or corpse. The insects are analyzed in detail and the entomologist
will count backwards from collection date to pin point the PMI. The estimate is based on

8
either the period of time required for a given species to reach the stage of development
that is collected from decomposing remains or an analysis of patterns of succession of a
number of different species of arthropods onto the decomposing remains (Goff and Win
1997). Data from Hall and Doisy (1993) indicate that bodies dead between 0 and 96 h
attract different assemblages of blow flies and flesh flies, depending upon the time lapsed
since death.
Upon collection of arthropod fauna from a carcass/corpse, the instar and length of
the most mature maggots will be determined and compared with data from laboratory
rearing to see how long it took a similar maggot to reach that stage under controlled
conditions (Goff 2000). The time period is then adjusted to fit the circumstances of the
site where the body was found. This is done by converting the temperatures and times
into accumulated degree hours (ADH) or accumulated degree days (ADD) by multiplying
the time by the temperature in degrees Celsius. Since the time required for development
decreases as the temperature increases, the total number of ADH required to develop to
any given stage remains constant (Goff 2000). Once the total number of ADH is
determined from laboratory rearing data, the entomologist works backward from the time
that the biological clock of the maggots were stopped until the total number of ADH is
reached (Goff 2000).
In rare cases insects can be used to determine more than the time of death. They
can also lead to the assertion that a wound was inflicted after the time of death. Upon
discovery of a mutilated body, it can be concluded whether death occurred after or prior
to mutilation. One such case took place in Canada. With the discovery of a severed head
and no body, the entomologist was able to conclude with the use of the few maggots

9
found on the neck that the individual was killed prior to mutilation (Anderson 1997).
This was verified by the absence of maggots in the orifices but the presence of maggots
on the wound created by the decapitation.
There have been a few rare recorded cases of using social insects to determine time
of death but it is possible only if their behavior and lifestyle is completely understood.
The developmental time for an Anoplolepsis longipes (Jerdon) (Hymenoptera:
Formicidae) colony was used to calculate a post mortem interval for a set of human
remains discovered in a metal toolbox in Hawaii (Goff and Win 1997).
A factor that can alter the estimated PMI is the nocturnal oviposition of certain
blow flies. It has been stated that blow flies need sunlight and warmth to oviposit but in
1988 and 1989 three fly species – Calliphora vicina (Robineau-Desvoidy), Phaenicia
sericata and Phormia regina (Meigen) – were observed ovipositing in the dark hours of
the night in the summer (Greenberg 1990).
Geographical diversity contributes to difficulties in estimating post mortem
intervals because of physical factors in the environment, such as temperature, wind and
rainfall or humidity. These may greatly alter the gross appearance of decomposing
remains that have the same post mortem interval in different habitats (Goff et al. 1988).
The wrapping of a dumped body causes difficulties in determining PMI because the wrap
will delay oviposition. The delay in colonization of the remains by insects at the death
scene due to wrapping in the blankets serves to emphasize the necessity for consideration
of all the circumstances surrounding the remains when providing a post mortem interval
estimate (Goff 1992). In determining the PMI other factors of interest must be
considered such as the effect of sun on the carcass, bacterial effect, and maggot masses

10
which form on the carcass and cause increased temperatures that can affect
developmental times (Greenberg and Kunich 2002).
Examining Forensically Important Flies
Research in forensic entomology has shown that the leading contributors for
determining PMI are the flies and most notably the blow flies. The blow flies are of main
interest because they are ubiquitous and typically the first to find a body, often before the
police do. Because most bodies are discovered in the first few weeks after death, blow
flies are encountered more frequently and can reveal time of death more accurately than
their successors (Greenberg 1991). This has lead to the development of several new and
extensive taxonomic keys for identifying the adult and immature larvae stages of blow
flies. Scientists have colonized several species of forensically important blow flies in
order to depict the eggs, three larval stages and puparia to aid in identification. Without
this work it would still be difficult to identify the immatures, particularly the early instars
of several species used to determine the PMI. This is crucial when eggs or early larval
instars are the only available insect evidence after all specimens have been preserved (Lui
and Greenberg 1989).
Extensive work has been done on the eggs from a few species of forensically
important blow flies (Greenberg and Singh 1995). This is useful for identification in
cases where only preserved specimens are available and can help lead to a positive
identification. Identification of the eggs was confounded by three facts: (1) variability
within and among populations of the same species, (2) similarities among some
congeneric species, and (3) similarities between some species of different genera.
Reliable separation based on morphology should take into account relevant aspects of

11
blow fly biology as it is affected by locality, climate, season, and weather (Greenberg and
Singh 1995).
Some forensic entomologists use the maggot’s weight to pin point its age. Using
the spiracles and length is the most effective way to determine age of a maggot, but in
some cases the maggots are not preserved correctly and the exact length cannot be
recorded and the spiracles can be difficult to identify. Most techniques used today by
uninformed individuals to preserve maggots can lead to shrinkage and deformation. The
most appropriate way to preserve these specimens is to fix their internal protein by
placing them in boiling water for approximately 10 seconds (Tantawi and Greenberg
1993). To use the weight of the maggot for age determination, a statistical model relating
distributions of weights to age must be formulated and fit to the data. The weight of a
larva of unknown age is then compared to the fitted model via inverse prediction to
compute the confidence interval on age of the larva (Wells and LaMotte 1995).
Advancements in DNA
The study of DNA has become a breakthrough in science for many fields. Modern
technology has given researchers the ability to isolate, amplify, and analyze minute
quantities of human DNA (DiZinno et al. 2002). Within the past ten years, entomologists
have employed this technique to rapidly and effectively identify insects used to determine
the post mortem interval (Sperling et al. 1994).
A problem posed to entomologists is that for most cases the only insects present are
early instar larvae, which are hard to identify and therefore need to be reared to adults for
confirmation of species. This takes more time for species identification and PMI
configuration; with the use of DNA analysis, the immature larvae can be identified to
species correctly and more rapidly. DNA analysis is also helpful in distinguishing

12
between species that are very similar in appearance and nature such as Cochliomyia
macellaria (Fabricius) and Cochliomyia hominivorax (Coquerel) (Roehrdanz and
Johnson 1996).
The analysis of mitochondrial DNA (mtDNA) with restriction enzymes had proven
to be a useful method in investigations of genetic variability and evolution within species
as well as the systematic relationship of closely related species (Azeredo-Espin and
Madeira 1996). Unambiguous species diagnoses with the use of mtDNA, particularly of
immature stages of two very closely related species such as Chrysomya rufifacies
(Macqaurt) and C. albiceps (Wiedemann), are of primary importance to forensic
entomologists and will be invaluable for any future studies of the ecological and genetic
interaction between them (Wells and Sperling 1999). Mitochondrial DNA analyses have
been utilized to identify both the human remains upon which fly larvae have fed and the
species of the larvae themselves. Preliminary work details for the first time the
successful application of mtDNA sequencing techniques to the analysis of necrophagous
beetle larvae that have fed on the bone remains of a human (DiZinno et al. 2002). It is
also suggested that there is a possible use of mtDNA from fly feces deposits, which may
contain DNA of the victim or perpetrator, critical to a case, after other sources are no
longer available.
Miscellaneous
With all of the major work being conducted by forensic entomologists in the areas
previously discussed there are still some individuals that take interest in other
applications. One particular topic of interest looks at the effects various drugs ingested
by a victim has on the growth and appearance of the maggots. In addition to their use in
the estimation of post mortem intervals, insects may serve as reliable alternate specimens

13
for toxicological analyses in the absence of tissues and fluids normally taken for such
purposes (Goff and Lord 1994).
In some cases when a victim is in the advanced stages of decomposition there are
no tissues or fluids available to test for toxins, such as organophosphate insecticides, in
the blood. It was found that the toxins could be extracted from the maggots present on
the remains (Gunatilake and Goff 1989). It has also been discovered from case studies
and confirmed with research that cocaine has an enhanced effect on the growth rate of the
species Boettcherisca peregrina (Robineau-Desvoidy). In the presence of cocaine, the
larvae develop 12-14 hours faster and pupation can occur up to 24 h earlier (Goff et al.
1989). This was also found to be true when the species was reared on carcasses that had
their tissues ingested with heroin. The differences observed in the rates of development
were sufficient to alter post mortem interval estimates based on larval development by up
to 29 h and estimates based on pupal development by 18 to 38 h (Goff et al. 1991).
Increased growth effects were observed with the drug 3,4-
Methylenedioxymethamphetamine in a different species of Sarcophagidae, which were
fed on carcasses with the drug. It was also noted that the larval growth was relative to the
dosage of the drug from the carcass (Goff et al. 1997).
Other research conducted by forensic entomologists depicts the effects that
temperature presents on several species of forensically important Diptera. Three studies
in particular look at the effects that temperature had on the growth rate of three different
fly species of interest, Cochliomyia macellaria, Chrysomya rufifacies and Sarcophaga
haemorrhoidalis (Fallen) (Byrd and Butler 1996; Byrd and Butler 1997; Byrd and Butler
1998). Understanding the effects of temperature on several species of Diptera

14
corresponds with determining the post mortem interval. It is important to recognize the
variations in growth that can occur due to temperature thus ensuring the PMI is calculated
accurately and precisely. Because entomologists are participating more often in criminal
investigations to assist in post mortem interval determinations, the availability of accurate
developmental and successional data on sarcophagous insects is of primary importance
(Byrd and Butler 1997).
Thermal Energy
A maggot mass originates in the collective oviposition site selection frenzy of
female flies. After penetration of the body, the invading larvae become a feeding
aggregation (Greenberg and Kunich 2002). Although insects are cold-blooded and
generally must develop as a function of ambient temperature, the teeming, writhing mass
of maggots that sometimes occurs during decomposition may produce significantly
elevated temperatures (Greenberg 1991). These elevated temperatures have rarely been
experimentally examined in order to completely understand the effects of the maggot
mass on developmental time and the role it plays in determining post mortem interval.
The experiment reported here examines the role the maggot mass has in decomposition
and its thermal effects.
An extremely imperative topic of interest among forensic entomologists, thermal
energy of the larvae and the carcass, is very rarely discussed and researched even less.
Many of the leaders in forensic entomology (Greenberg 1991; Greenberg and Kunich
2002; Goff 2000; Byrd and Butler 1996; Byrd and Butler 1997; Byrd and Butler 1998;
Campobasso et al. 2001; Hewadikaram and Goff 1991) talk about this phenomenon and
refer to the event as the massing of the maggots, coining the name maggot mass.
However, very few utilize it for research or have felt a need to further understand it. A

15
study conducted in 1990 by Cianci and Sheldon examined the thermal influence of the
maggot mass on the decomposition of four pigs. The temperature dynamics of the
maggots were studied to determine the thermal influence of the three larval instars, the
magnitude of the temperature rise and the degree to which the elevated temperature
remains independent of ambient temperature variation (Cianci and Sheldon 1990). Very
little work has been done on the thermal energy of the maggot mass and therefore maggot
mass has not been incorporated into determination of post mortem interval. The research
experiment reported here examines the temperature produced by the maggot mass. The
purpose of this experiment is to understand the maggot mass, observe the temperature
produced by it, determine how this effects the growth rate of the maggots, and determine
any effects this will have on the current ways of calculating the post mortem interval.

CHAPTER 2 EXAMINING THE MAGGOT MASS
Host Selection and Scope of Study
In any forensic experiment conducted, the proper host must be chosen before any
research can begin. Several different types of hosts have been used to conduct forensic
research, the most common being the pig (Goff 2000; Anderson 2001; Cianci and
Sheldon 1990; Shean et al. 1993; Hewadikaram and Goff 1991; Carvalho et al. 2000;
Komar and Beattie 1998; Goff 1992; Watson and Carlton 2003); others include domestic
cats (Early and Goff 1986), human cadavers (Rodriquez and Bass 1983; Mann et al.
1990; Barreto et al. 2002; Grassberger and Reiter 2001; Anderson 1997; Goff et al.
1988), rabbit carcasses (Wells and Greenberg 1992; Denno and Cothran 1976; Goff et al.
1989; Goff et al. 1991; Goff et al. 1997), Leghorn chicken hens (Hall and Doisy 1993),
large mouth bass (Goddard and Lago 1985) laboratory rats (Greenberg 1990), alligator,
deer and bear (Watson and Carlton 2003). One of the major areas for concern in
obtaining baseline data from decomposition studies has been the choice of the animal
model used (Goff 1993). The domestic pig, Sus scrofa L., appears to be the most
acceptable animal model and has been widely used in decomposition studies (Goff 1993).
Researchers have determined the pig to be most closely related to a human in physical
similarities such as skin texture and hair coverage.
For this experiment the researcher and committee chose the Florida black bear,
Ursus americanus floridanus, instead of the conventional pig. The Florida black bear is
one of three distinct subspecies of the American black bear recognized in the
16
17
southeastern United States (Florida Fish and Wildlife Conservation Commission 2001-
2003). It is listed as a protected animal in the state of Florida. Mr. Walter McCown,
from the Florida Fish and Wildlife Conservation Commission (FFWCC) office in
Gainesville, FL, approved the use of dead bears for this experiment. All the bears used in
the experiment were accidentally hit by a car at locations within a two-hour drive from
Gainesville, FL and were picked up by Mr. McCown. The bears were placed in a
wooded area of the FFWCC property upon retrieving them from the location where they
were found.
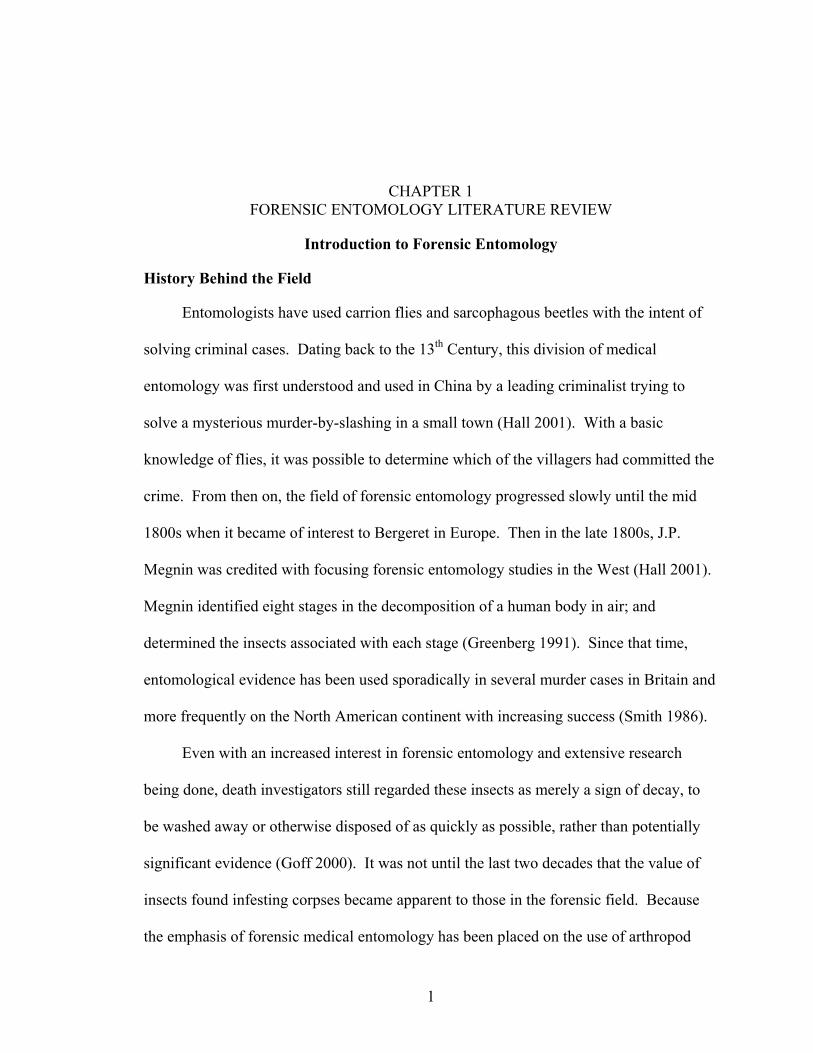
The Florida black bear was chosen as the host because of some of the similar
characteristics it has with humans in physical appearance. The Florida black bear is more
closely related to a human in size than a pig, the thick hair has similar effects in
decomposition that clothing would on a human, and the Florida black bear has more
comparable eating habits to those of humans. The use of the Florida Black bear is
beneficial to forensic studies related to humans and in cases of wildlife poaching.
These thesis objectives were to evaluate
• Insect species found on the Florida black bear hosts. • Species succession. • Development and movement of maggot masses of the host.
Methods and Materials
Bears were placed in a clearing in a semi-wooded area in heavy shade with barely
visible sky. Much of the site was over grown with brush. The vegetation consisted of
large pine and oak trees along with smaller oaks and vines. Bears were placed within a
wooden fenced area surrounded by a chain-link fence that enclosed the entire facility.
Bears were first observed within four hours of their arrival at the study site. Maggot

18
mass temperatures were collected daily from the largest dipteran larval mass present on
the carcass. A HOBO external logger (Onset Computer Corporation, Bourne, MA,
1995-1999) was placed at the carcass site and set to record four different temperatures.
The HOBO external logger was preprogrammed in the lab to take temperature readings
every 15 minutes throughout the entire decomposition process. The base of the HOBO
external logger was tied to the wooden fence while one of the probes was placed about 3
inches (7.62 cm) beneath the bear in the soil. The next probe was set out above ground
out of direct sunlight, another was attached to a water bottle by cloth in order to record
the wet bulb temperature. The wet bulb is used to record the relative humidity in the
location of the bear and is done so with the cloth and water bottle. The last probe was
moved daily to the largest maggot mass. It was placed first in the mouth of the bear until
a maggot mass developed on the surface of the animal.
The bears were never moved after they were placed at the study site. Only one bear
was present at a time; a total of three bears were used for the entire experiment. Each
experiment occurred in a different month. A cage was not constructed to secure the
carcass from vertebrate scavengers and there were never any signs of attempted removal
of the carcass or pieces of it.
Adult and developing immature insects were collected daily with a sweep net,
forceps and gloved hands at approximately 5-6 PM from day one continuing until the
carcass decomposition was complete. Adult beetles and flies were killed in an ethyl
acetate kill jar. Fly larvae were initially placed into empty vials, and returned to the lab
for further processing. Photographs of the various insects and the growing maggot
masses were taken every other day, along with photographs of the different carcass

19
decomposition stages. The photographs of the insects and masses were made with an
Olympus 4T (MF9) 35mm camera with macro close up attachments. A separate camera,
a Kodak Advantix, was used to photograph the carcass. An Olympus 1 35mm camera
with an infrared filter was used to take daily photos of the maggot mass for observation
of the heat spots. Sketches of the maggot mass locations and decomposition stages were
made daily for visual reference.
After examination of the carcass, collections of the adult and immature insects were
taken to the lab. The adults were removed from the kill jar, pinned and attached to date
labels. Adults were then identified to species and properly labeled (James 1947; Smith
1986; Catts and Haskell 1990). The larvae were boiled for approximately 10 seconds in
water to fix their internal proteins, then placed into vials of 70% ethyl alcohol for
preservation and labeled. The larvae were identified by instar and species at a later date
(Stojanovich et al. 1962; Wells et al. 1999). Larvae from each vial were chosen at
random and measured to estimate the growth rate of the larvae in the carcass.
After decomposition was complete, the HOBO external logger was removed from
the site and returned to the lab. The temperature data were downloaded from the HOBO
onto a computer. This process stops the logger from recording and resets it for use at the
next carcass. The data were stored in the BoxCar HOBO computer program (Onset
Computer Corporation, Bourne, MA, 1995-1999) until analyzed further in the statistical
program of Microsoft Excel 97 SR-2 (Copyright 1985 – 1997, Microsoft Corporation)
and SAS (Windows NT Version 5.0 2195, 1999-2000 by SAS Institiute Inc, Cary, NC).

20
Bear 1, June 2002
The first experiment began on June 3, 2002. A female, approximately 160 lbs
(75.57 kg) was hit accidentally by a car the previous night. The first visit to the bear
occurred at 4:45 PM on June 3, 2002, upon which fly eggs and adults were collected.
The HOBO external logger was set up and the probes were placed in their appropriate
positions. Photographs were taken of the initial appearance of the bear and the insects
present. Infrared (IR) photographs of the maggot mass were taken for observation of the
heat spots. On the final day of observation, June 23, 2002, only a small amount of skin
and filth fly larvae such as muscids and Stratiomyidae were present.
Bear 2, August 2002
On August 30, 2002, the second bear, a 195 lb (88.45 kg) female, was placed at the
same study site as the bear from June, however, not in the exact spot. A car hit the bear
at approximately 8 am that morning; the first visit occurred at 7:10 PM that evening. The
HOBO external logger was set up and the temperature probes were put in their
appropriate locations. Insects were collected and pictures were taken every other day. IR
photographs of the maggot mass were taken for observation of the heat spots. October 2,
2002 was the last day data were recorded. On this date, the bear was completely
skeletonized and only Stratiomyidae larvae were present.
Bear 3, November 2002
The third bear for the experiment arrived on November 1, 2002. It was a male cub,
weighing approximately 38 lbs (17.24 kg). Upon visiting the bear at 12:30 PM on
November 1, 2002, for the first time, the HOBO external logger was set up and the bear
was moved onto a piece of screening. The screening was used to prevent unnecessary

21
overflow of insects from the other bears not used in these studies that had been placed in
the area prior to November but had not completely their decomposed. By November 7,
2002, the bear was completely skeletonized and adult fly activity had concluded.
Photographs were taken daily to show the insects and decomposition stages of the cub.
Species Composition
In forensic entomology, when a study is conducted there will be some collection of
insects. For the most part the species collected will come from a few families and there
might even be only a dozen or so different species. Even if the experiment is not based on
succession or a species, a collection is useful to the researcher in many ways to help
analyze the data (Goff 2000; Byrd and Castner 2001a; Greenberg and Kunich 2002).
Sometimes there is not a designated use for the specimens at the time of collection but
later they may have much to do with the underlying results.
For all three of the bear carcasses, insect specimens were randomly collected to get
an idea of the species found in this region of Florida that are attracted to carrion. Adults
of 20 different species were collected from the three bear carcasses, with some
Sarcophagidae and Bibionidae that could only be identified to family. There were also
some Dipteran adults that were not identified to species and grouped together as
miscellaneous. Tables 2-1 to 2-3 shows the adult insects collected daily during the time
of decomposition for each bear. Figures 2-1 to 2-3 show the larval succession pattern
recorded during decomposition for each bear.
The larval species present varied depending on month, which is a reflection of the
season. Bear 1 and Bear 2 had similar species diversity, but different species
compositions. Bear 3 had little diversity of species present and the least amount of
collected specimens.

22
Table 2-1. Adult insects collected from Bear 1, June 2002, cataloged by species per day for the hours of decomposition.
Catalog of Daily Collections of Adult Insects from Bear 1
Adults Hours 0 48 72 96 120144168192216240 264 312 408480
Hydrotaea leucostoma 4 14 12 13 6 2 11 5 3 4
Chrysomya rufifacies 6 1 1 3
Chrysomya megacephala 5 2 2 1 2 2 1
Cochliomyia macellaria 1
Sarcophagidae 3
Phaenicia coeruleiviridis. 4 3 1
Necrophila americana 2 2
Nicrophorus carolinus 1 1 1
Nicrophorus orbicollis 2 4 4 2 1 1
Creophilus maxillosus 5 7 9 6 5 1 1 1
Necrodes surinamensis 10 1 4 15
Necrobia rufipes 1 1 1 1 1 5 6
Dermestes caninus 6 1 1 6 3 14 1
Dermestes maculates 5 4 3 9 1
Dermestes ater 4 1 2
Trox suberosus 5 3 1 1 3 4 17 6
Saprinus pennsylvanicus 2 6 2 10
Hister sp. 4 4 24 20 18 11 3 21 9

23
Figure 2-1. Bear 1, June 2002 larval succession pattern during decomposition
Larval Composition Collected Throughout Decomposition for Bear 1, June 2002
Hours
0 24 48 72 96 120 144 168 192 216 240 264 288 312 336 360 384 408 432 456 480
Phaenicia coeruleiviridis Cochliomyia macellaria
Chrysomya megacephala
Muscidae Misc.
Phaenicia sericata Hermetia illucens
Sarcophagidae F.canicularis Phormia regina
Chrysomya rufifacies2nd Instar 1st Instar Eggs
Species
Table 2-2. Adult insects collected from Bear 2, August 2002, cataloged by species per
day for the hours of decomposition.
Adults Chrysomya megacChrysomya rufifacieCochliomyia macelHermetia illucens Hydrotaea leucostoPhaenicia sericata Sarcophagidae Creophilus maxillosDermestes caninusDermestes maculaHister sp. Necrobia rufipes Necrodes surinameNicrophoris carolinuNicrophoris orbicollSaprinus pennsylvaTrox suberosus Misc.
Catalog of Daily Collections of Adult Insects for Bear 2
Hours 0 24 48 72 96 144 168 192 240 336 408 432 456 480 552
ephala 4 4 1 1 1 s 2 1 1
laria 1 3 2 1
ma 2 7 1 4 2 13 2 2 6 1 1 1 1 1 1 1
us 6 4 2 5 4 2 1 1 2 2 tus 2 1 8 6 3 7
6 5 12 11 8 3 4 8 7 5 1 1 2 4
nsis 8 6 1 1 1 s 2
is 1 nicus 1 1 1 5 1 1 6 3
1 3 1 3 3 2 3 2 1 17 6

24
Phaenicia coeruleiviridis
Cochliomyia macellaria
Chrysomya megacephala
Chrysomya rufifacies
2nd Instar
1st Instar
Eggs
0 24 48 72 96 120 144 168 192 216 240 264 288 312 336 360 384 408 432 456 480 504 528 552 576 600 624 648
Species Hours
Larval Composition Collected Throughout Decomposition for Bear 2, August 2002
Phormia regina
F
T
CCCHPPCHNNNTM
Wohlfahrtia sp
Hermetia illucens
e
Phaenicia sericata
Sarcophagidae
Muscida
Misc.igure 2-2. Bear 2, August 2002 larval succession pattern during decomposition
able 2-3. Adult insects collected from Bear 3, November 2002, cataloged by species per day for the hours of decomposition.
Catalog of Daily Collections of Adult Insects for Bear 3
Adults Hours 24 48 72 96
hrysomya megacephala 3 1 12 hrysomya rufifacies 4 ochliomyia macellaria 1 3 2 ydrotaea leucostoma 4 17 6 haenicia illustris 1 haenicia sericata 1 reophilus maxillosus 1 ister sp. 1 2 9 ecrobia rufipes 1 ecrodes surinamensis 3 ecrophilia americana 1 rox suberosus 1 isc. 4

25
Larval Composition Collected Throughout Decomposition for Bear 3, November 2002
Phaenicia sericata
Cochliomyia macellaria
Chrysomya megacephala
Phaenicia coeruleiviridis
2nd Instar
Chrysomya rufifacies
1st Instar
Eggs 0 24 48 72 96 120 144
Species Hours
Figure 2-3. Bear 3, November 2002 larval succession pattern during decomposition
Species Pictorial
The small amount of variation in insect species that are attracted to carrion in the
North Central region of Florida makes identification easier and the species diversity is
not as broad as it is in other parts of the United States and around the world. In Louisiana
a total of 93 species were collected from pig, alligator, bear and deer (Watson and
Carlton 2003) and in Brazil 54 species were collected from pigs (Carvalho et al. 2000),
but only 22 total species were collected in Hawaii from humans (Goff 1991), to name a
few. The different species collected from all three bear carcasses are shown in Figures 2-
4 to 2-29. The white arrow lines in the photographs represent the actual size of the
insect.
Chrysomya rufifacies (Macquart), the Hairy Maggot Blow fly (Figures 4 & 5), is
the most abundant of all the species collected in North Central Florida. Indigenous to the

26
Figure 2-4. Adult Hairy Maggot Blow fly, Chrysomya rufifacies
Australian Asian regions, it was introduced in to the U.S. after becoming established in
Central America (Byrd and Castner 2001b). Found mostly in the southern U.S., it is
slowly moving northward (Baumgartner 1993). Its method of entry into the American
tropics is uncertain but it could have been through commerce, which continues to
increase, especially by air (Gagne 1981). The larvae have a ferocious appetite and must
consume live tissue from other developing larvae along with decaying flesh in order to
complete their life cycle (Butler, personal communication; Goff 2000). The hairy maggot
blow fly is an important indicator in forensic cases and is becoming the dominant species
on carrion in North Central Florida (Byrd and Butler 1997).
Chrysomya megacephala (Fabricius), the Oriental Latrine Fly (Figures 6 & 7)
originated from Australian and Pacific locations. So it migrated to Africa and then the
Americas (Wells and Kurahashi 1994). The flies are attracted to carrion and sweet foods
as well as urine and excrement (Byrd and Castner 2001b). They are known to transmit

27
Figure 2-5. Maggot mass of Chrysomya rufifacies
Figure 2-6. Adult Chrysomya megacephala ovipositing on fresh tissue

28
Figure 2-7. Maggot mass composed solely of Chrysomya megacephala
Figure 2-8. Adult Secondary Screwworm, Cochliomyia macellaria

29
enteric pathogens and parasites (Wells and Kurahashi 1994). Adults are common near
human dwellings and thus likely to be encountered in forensic work. They are a great
nuisance in open meat markets, slaughterhouses, and around latrines and cess pools
(Smith 1986).
Cochliomyia macellaria (Fabricius), the Secondary Screwworm, (Figures 8 & 9)
ranges throughout the U.S. and American tropics (Byrd and Castner 2001b). It is
primarily a scavenger that is very abundant in carrion and also known to cause myiasis
(Smith 1986). The Secondary Screwworm prefers humid weather and frequents carrion
that is located in either shaded or sunny places (Byrd and Castner 2001b; Smith 1986).
igure 2-9. Maggot mass composed of Cochliomyia macellaria F

30
Figure 2-10. Adult Phaenicia coeruleiviridis
Phaenicia coeruleiviridis (Macquart), the Green Bottle Fly (Figure 10), has a
Nearctic distribution and is very common in the southern U.S. (Byrd and Castner 2001b).
The adults are attracted to almost all decaying animal matter and are one of the most
common species attracted to fresh carrion. It is probably the most predominate blow fly
in the southeastern U.S. during the spring and fall (Byrd and Castner 2001b).
Phaenicia sericata (Meigen), the Sheep Blow Fly (Figures 11 & 12), are typically
found around both garbage and meat (Ash and Greenberg 1975). The larvae are best
suited to feed on carrion. The Sheep Blow Fly arrives very early to the carrion and
oviposition occurs within a few hours of death (Byrd and Castner 2001b).

31
31
Figure 2-11. Phaenicia sericata adult
Figure 2-12. Phaenicia sericata larva

32
Figure 2-13. Adult Sarcophagidae, Flesh Fly
Flesh Flies from the large family Sarcophagidae (Figure 13) are found throughout
the U.S. with most species located in tropical regions (Byrd and Castner 2001b). The
adults are attracted to nectar and are found on flowers. The family name refers to the
larvae, which feed on some type of animal material: carrion and feces (Byrd and Castner
2001b).
ly Figure 2-14. Adult Red-Tailed Flesh F

33
Sarcophaga haemorrhoidalis (Fallen), the Red-Tailed Flesh Fly (Figure 14), adults
are attracted to the excrement of carrion but are more commonly found on human corpses
located indoors (Byrd and Castner 2001b). It is a follower of man and consequently has
an almost worldwide distribution (Smith 1986). The females do not lay eggs but the
larvae hatch within the abdomen and are laid as first instars therefore giving them an
advantage over the blow flies.
Figure 2-15. Adult Black Dump Fly, Hydrotaea leucostoma
Hydrotaea leucostoma (Wiedemann), the Black Dump Fly (Figure 15), is found
throughout the U.S. The flies are attracted to carrion and excrement and the larvae are
facultative predators (Byrd and Castner 2001b). Males can be seen hovering on calm
days, and the larvae appear during late or active decay stages (Byrd and Castner 2001b).
34
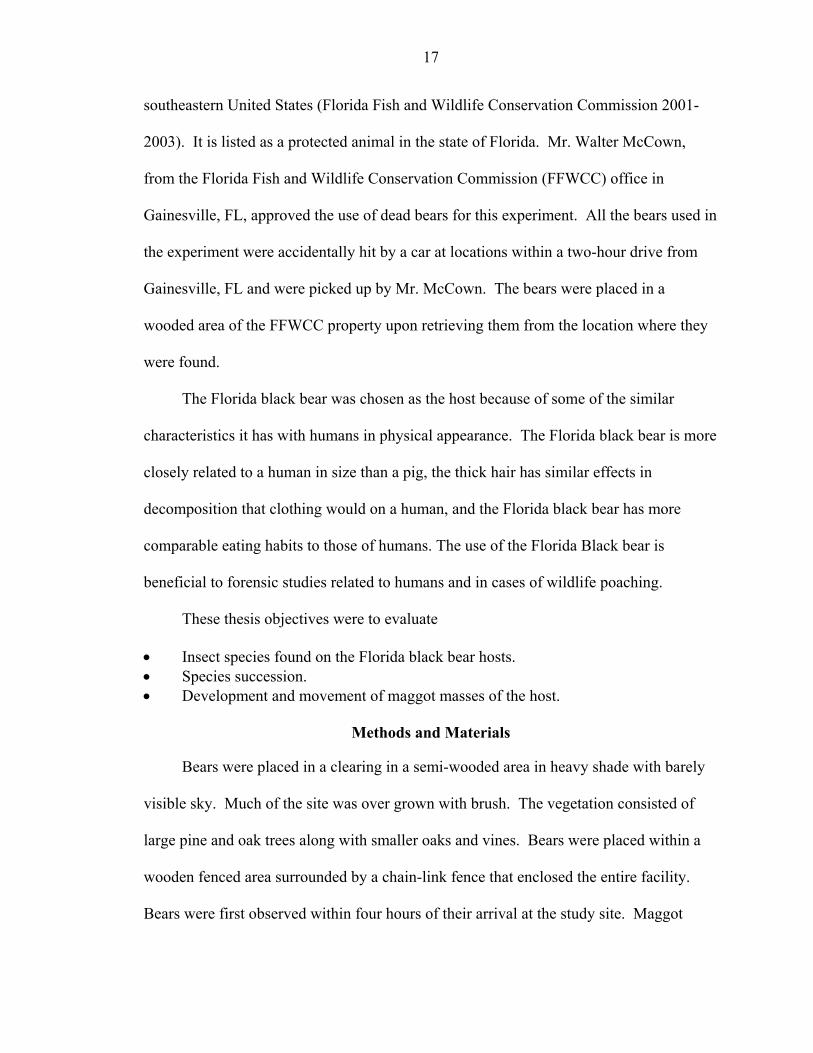
Figure 2-16. Adult Black Soldier Fly, Stratiomyidae
Hermetia illucens (Linnaeus), the Black Soldier Fly (Figure 16), is Neotropical in
origin, but now found in almost all temperate and tropical areas of the world where it
probably arrived through distribution of contaminated food (Byrd and Castner 2001b).
Larvae can be found in decaying fruit and vegetable matter, outdoor lavatories and
carrion, and human cadavers (Smith 1986; Lord et al. 1994).
Adult Necrodes surinamensis (Fabricius), the Suriname Carrion Beetle (Figure 17),
The immatures feed on the
carrio
r
adults feed only on the maggots while present at the carrion.
n and are present after the Dipteran larvae have left (Smith 1986). The adults and
larvae are most commonly found on large carcasses such as bear, deer and human. The
adults secrete an offensive odor as a mode of defense when disturbed (Byrd and Castne
2001b).

35
Figure 2-17. Suriname Carrion Beetle, adult
Figure 2-18. Necrophilia americana adult

36
Necrophilia americana (Linnaeus), the American Carrion Beetle (Figure 18), are
found throughout the United States. The adults and larvae feed on carrion, fly larvae, and
the larvae of other beetles (Byrd and Castner 2001b). They are found from spring to fall
throughout the U.S. and the adults are diurnal (Byrd and Castner 2001b).
Figure 2-19. The Burying Beetle adult, Nicrophorus carolinus
Nicrophorus carolinus (Linnaeus), the Burying Beetle (Figure 19), is typically
found in the Atlantic coastal states from Virginia to Florida and across the Gulf Coast
states to Texas (Byrd and Castner 2001b). They feed on the developing maggots at the
carcass.
Nicrophorus orbicollis (Say), the Sexton Beetle (Figure 20), are most abundant in
the midsummer months and overwinters as adult. The adults feed on the maggots while
the larvae feed on the decaying carrion. They are mainly nocturnal and most commonly
2001b). found in wooded habitats (Byrd and Castner

37 37
Figure 2-20. Nicrophorus orbicollis adult preserved
Figure 2-21. Adult Dermestes ater

38
Dermestes ater (DeGeer), the Black Larder Beetle (Figure 21), are very similar in
appearance to Dermestes maculatus (DeGeer) (Figure 19). It is a serious pest of dried
fish, mushrooms, and cheese, and is particularly attracted to the protein-rich tissues of
decaying vertebrates (Byrd and Castner 2001b). The adults feed of the carcass skin and
hide.
Figure 2-22. Adult Dermestes maculates
Dermestes maculatus (DeGeer), the Hide or Leather Beetle (Figure 22), has a
worldwide distribution. The adults are cannibalistic and will eat young larvae. The larvae
are typically found on human corpses and can reduce a human body to a skeleton in only
24 days (Byrd and Castner 2001b).

39
Figure 2-23. Preserved Dermestes caninus adult
Dermestes caninus (Germar) (Figure 23) is distributed throughout the U.S. except
the Northwest Pacific region. It is attracted to stored food products and carrion of all
types (Byrd and Castner 2001b). The adults are similar in appearance with D. maculatus
(Figure 19) and D. ater (Figure 18) but the elytra are more densely covered with fine
yellow hairs. The adults feed on the hide and skin of the carcass.
e (Byrd and Castner 2001b).
Creophilus maxillosus (Linnaeus), the Hairy Rove Beetle (Figures 24 & 25), is
found throughout the eastern United States. The adults can be found on carcasses within
hours after death as well as during the advanced stages of decomposition. The adults
feed on the developing Dipteran larva

40
Figure 2-24. Hairy Rove Beetle, Creophilus maxillosus
Figure 2-25. Adult Creophilus maxillosus

41
Figure 2-26. Hister sp, Clown Beetle adult
Figure 2-27. Saprinus pennsylvanicus adult specimen

42
Clown Beetle (Figure 26) adults have a worldwide distribution and are found on
cadavers from bloat through the dry stages of decomposition (Byrd and Castner 2001b).
They occur wherever there is decay and putrefaction and are reported to play a factor in
the reduction of dipterous larvae (Smith 1986).
Saprinus pennsylvanicus (Paykull) (Figure 27) is one Histeridae species commonly
recovered from carcasses. It has shiny green metallic elytra and is present throughout all
stages of decay.
Figure 2-28. Red Legged Ham beetle adult
Necrobia rufipes (DeGeer), the Red-Legged Ham Beetle (Figure 28), is distributed
worldwide and recovered throughout the U.S. It is known for infesting cured meat
products. The adults and larvae are also predacious on fly eggs and maggots (Byrd and
Castner 2001b). They are also found on dried bones, which are a source of food, and can
be a nuisance for anthropologists if the bones are not preserved correctly.
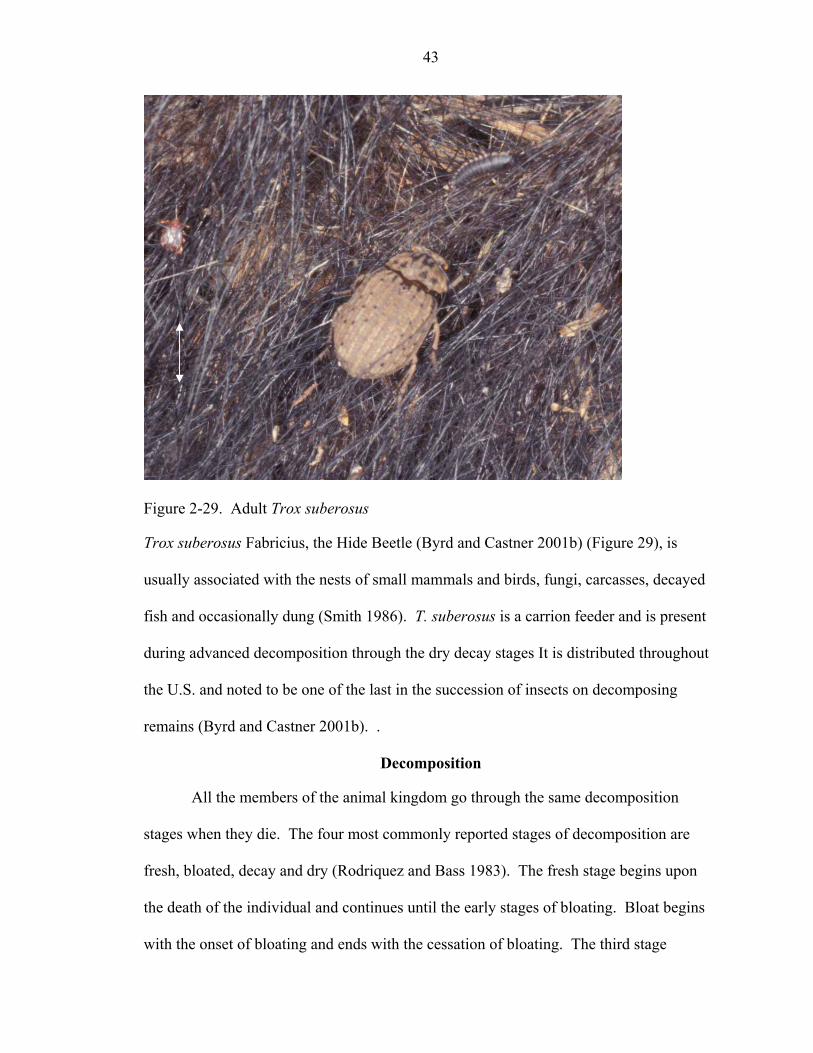
43
Figure 2-29. Adult Trox suberosus
Trox suberosus Fabricius, the Hide Beetle (Byrd and Castner 2001b) (Figure 29), is
usually associated with the nests of small mammals and birds, fungi, carcasses, decayed
fish and occasionally dung (Smith 1986). T. suberosus is a carrion feeder and is present
during advanced decomposition through the dry decay stages It is distributed throughout
the U.S. and noted to be one of the last in the succession of insects on decomposing
remains (Byrd and Castner 2001b). .
Decomposition
All the members of the animal kingdom go through the same decomposition
stages when they die. The four most commonly reported stages of decomposition are
fresh, bloated, decay and dry (Rodriquez and Bass 1983). The fresh stage begins upon
the death of the individual and continues until the early stages of bloating. Bloat begins
with the onset of bloating and ends with the cessation of bloating. The third stage

44
observed is decay. Decay begins with ceased bloating and ends when most of the
remains are dry. The final stage is the dry stage and is particularly more difficult to
identify cause it lacks precise characteristics (Rodriquez and Bass 1983).
The stages of decay are shown in the following figures for each of the three bears.
The pictures shown begin at in the early stages of decay and continue to show the final
dry stages observed during the experiment. Bear 1, June 2002, can be observed in
Figures 27-33; Bear 2, August 2002, is represented in Figures 34- 40; and Bear 3,
November 2002, is depicted in Figures 41- 47.
Bear 1, June 2002
Figure 2-30. Day 3, the early stages of decomposition have begun and maggot masses are present at the orifices on Bear 1, June 2002.

45
Figure 2-31. Day 4, maggot masses of C. rufifacies have formed around the extremities and head region of Bear 1, June 2002.
Figure 2-32. Day 5, the larval masses have increased in size and are more observable on Bear 1, June 2002.

46
Figure 2-33. Day 6, the skin of Bear 1, June 2002, is becoming weathered while the larvae consume the tissue underneath.
Figure 2-34. Day 8, the bear mass of Bear 1, June 2002, has become depleted by the feeding of the larvae and the skin is being pulled close around the bones.

47
Figure 2-35. Day 9, the skin has tightened and the bones are becoming exposed on B1, June 2002.
ear
6. Day 11, the majority of Bear 1, June 2002, has been eaten and the bonesFigure 2-3 are exposed.

48
Bear 2, August 2002
Figure 2-37. Bear 2, August 2002, is a large 195 lb female, this picture taken Day 1 shows her in the fresh stage.
Figure 2-38. Day 1, Bear 2, August 2002 is bloating and shows signs of trauma on her back.

49
Figure 2-39. Day 4, large maggot masses have begun to consume the head, neck, chest and extremities of Bear 2, August 2002.
Figure 2-40. Day 6, the mass of Bear 2, August 2002 is deteriorating with the ferocious appetite of the larvae.

50
Figure 2-41. Day 9, most of the tissue mass of Bear 2, August 2002 has been consumed and the larvae have begun to migrate down the fence line where they will pupate at.
Figure 2-42. Day 11, Bear 2, August 2002 bones from the extremities are becoming visible and fly activity has slowed.

51
Figure 2-43. Day 12, larval activity has ended while the beetles continue to utilize the
hair and skin of Bear 2, August 2002.
Bear 3, November 2002
4. Day 1, initial photo of a male cubFigure 2-4 (Bear 3) about 38 lbs hit by a car on November 1, 2002, in Ocala, FL.

52
Figure 2-45. Day 1, close up of the wound present above the right shoulder blade of fore
limb of Bear 3, November 2002.
Figure 2-46. Day 1, photo showing the fly activity that has begun to occur within 2 hours
after Bear 3, November 2002 arrived at the study site.

53
Figure 2-47. Day 4, the hair has begun to slough off as the maggot masses form at the orifices and around the perimeter of Bear 3, November 2002.
igure 2-48. Day 5, larval masses have consumed several areas of Bear 3, November
2002 such as the abdomen, chest, head and extremities. F

54
Figure 2-49. Day 6, C. rufifacies is the dominant species forming the maggot mass on
Bear 3, November 2002.
Figure 2-50. Day 6, Bear 3, November 2002 mass has been consumed by the larvae, which leave very little amounts of flesh behind.

CHAPTER 3 MAGGOT MASS OBSERVATIONS
The maggot mass temperatures were found to be increasingly higher than the
ambient temperature for all three of the bears after the first 24 hours. At the beginning of
decomposition, when eggs and 1st instar larvae were present, the temperature of the
maggot mass, not yet fully formed, was less than the ambient temperature. The highest
ranges of temperature were recorded when there were 3rd instar larvae present and the
highest peak occurred at the transition stage of 2nd instars into 3rd instar larvae.
Due to the inconclusive photographs and technical difficulties from the IR camera,
the photos were unable to be used in the results. The relative humidity was not
determined due to the water bottle boiling at the study site and altering the recorded
temperatures. In order to compare the four different temperatures: wet bulb, air, maggot
mass, and underground beneath the bear, the extreme temperatures recorded by the wet
bulb were removed before charting.
Bear 1, June 2002
After 24 hours, the maggot mass temperatures surpassed the ambient, wet bulb and
underground temperatures. The mean maggot mass temperature was 31.17°C, the
minimum was 23.63°C and the maximum was 45.89°C (Table 3-1). A one-way ANOVA
and Duncan’s test and found the data to be significant with a P value of <0001.
s
that depict he temperatures and their
correlation with each other during decomposition. Figure 3-2 shows the daily means of
The increasing maggot mass temperature can be observed in the following graph
the temperatures recorded. Figure 3-1 shows all t
55

56
the temperatures analyzed with a Duncan’s test graphed together. Table 3-2 shows the
daily means for all temperatures and their significance from a Duncan’s test. Figure 3-3
represents the mean growth rate of the species Chrysomya rufifacies Macquart compared
with the mean maggot mass temperatures. The peak in maggot mass temperature at 72
hours to 45.89°C represents the growth of 2nd instars into 3rd instar larvae.
Table 3-1. Descriptive statistics of temperatures recorded for Bear 1, June 2002 throughout decomposition.
Temperature Data Recorded from Bear 1, June 2002
Wet Bulb Underground Maggot Mass Air Mean temperaturea 23.58D 29.81B 31.17A 25.02C Standard Error 0.044 0.07 0.128 0.053 Minimum Temperature 17.14 24.01 23.63 19.04 Maximum Temperature 35.7 36.13 45.89 33.17 Confidence level 0.085 0.138 0.252 0.103 aMeans in the same row followed by the same letter are not significantly different (P=0.05; Duncan’s multiple range test [SAS Institute 2003])
Daily Temperature Recorded Every 15 Minutes for Bear # 1 - June 2002
01020304050
0.00
20.0
040
.00
60.0
080
.00
100.
0012
0.00
140.
0016
0.00
180.
0020
0.00
220.
0024
0.00
260.
0028
0.00
300.
0032
0.00
340.
0036
0.00
380.
0040
0.00
420.
0044
0.00
460.
0048
0.00
500.
0052
0.00
Time (Hours)
Tem
pera
ture
(C)
Wet Bulb Underground Maggot Mass Air
Figure 3-1. Temperature readings recorded on 15-minute intervals during decomposition of Bear 1, June 2002.

57
Daily Means of the four Recorded Temperatures for Bear # 1 - June 2002
0
10
20
30
40
50
1 3 5 7 9 11 13 15 17 19 21
Days
Tem
pera
ture
(C)
AirUnderbearMaggot MassWet Bulb
Figure 3-2. Daily means for temperature from Duncan’s test for Bear 1, June 2002.
Table 3-2. Significance of daily means for Bear 1, June 2002 from Duncan’s test. Duncans On Daily Means for Bear 1, June 2002 Day Air Underbear Maggot Mass Wet Bulb
1 25.0806B 24.1385C 26.7919A 23.9886B2 25.5204B 24.4244C 26.2476A 24.244C 3 26.7514C 27.9286B 30.3676A 24.7303D4 24.1923C 34.136B 43.1999A 23.3692D5 23.5077C 34.8842A 40.3094B 23.6985C6 24.2897C 33.496B 40.767A 23.5223D7 24.7214C 32.6725B 38.7343A 23.3125D8 25.8386C 33.1145B 39.5651A 24.5308D9 26.8169C 32.6195B 33.3911A 25.5808D10 27.2749C 32.6506A 32.0373B 24.4232D11 26.8514C 31.3087A 29.9598B 24.0611D12 27.3469C 31.3332B 33.978A 24.4634D13 26.0746C 32.1607A 30.0875B 22.4356D14 24.2494C 31.0507A 27.0573B 22.0399D15 24.3839C 29.425A 27.7814B 22.9457D16 24.6278C 28.2985A 27.2628B 23.8699D17 24.2527C 27.649A 26.2445B 22.9652D18 23.82854C 27.1026A 26.44615B 22.48813D19 23.31875C 26.665A 25.83417B 22.22094D20 23.5582C 26.0516A 25.3146B 22.7827D21 24.2539B 27.0682A 27.0053A 23.9799B22 23.7669B 27.7088A 27.2951A 23.0029C

58
Growth Rate of C. rufifacies Over Time vs. Temperature
0
5
10
15
20
25
0 24 48 72 96 120
144
168
192
216
240
264
288
312
336
360
384
408
432
456
480
504
Time (Hours)
Mea
n Le
ngth
in m
m
036912151821242730333639424548
Tem
pera
ture
(C)
1st 2nd 3rd temperature
Figure 3-3. Mean growth rate of Chrysomya rufifacies over time compared to mean
e first 24 hours was very similar to the
te ratu e maggot mass temperature increased
g t ty as ize of the mass. Figure 3-4 shows the
r t t at te he time the bear decomposed. Figure
3 s o e ed
together. Table 3-4 shows the daily mea temperatures and their significance
from u w ased temperature produced in the
m g m nstars. The mean maggot mass
t im °C, the minimum temperature was
2 was 54.13°C (Table 3-3). The one-
way ANOVA and Duncan’s test found the data to be significant with a P value of <.0001.
maggot mass temperature for Bear 1, June 2002.
Bear 2, August 2002
The maggot mass temperature within th
other mpe res recorded. Shortly thereafter, th
rea ly as the larval activi increased, did the s
ela ionship of he temper ures collec d during t
-6 hows the daily means f the temp ratures analyzed with a Duncan’s test graph
ns for all
a Duncan’s test. Fig re 3-6, sho s the incre
ag ot mass as the larvae olted from 2nd to 3rd i
emperature for the exper ent on Bear 2 was 33.89
2.48°C, and the maximum-recorded temperature

59
Table 3-3. Descriptive statistics of temperatures recorded for Bear 2, August 2002 position.
Temperature Data Recorded for Bear 2, August 2002
throughout decom
Wet Bulb Maggot Mass Underground Air
Mean Temperaturea 24.97B 33.89A 32.56A 25.24CStandard error 0.037 0.091 0.06 0.039 Minimum temperature 20.19 22.48 23.24 20.95 Maximum temperature 37.44 54.13 39.67 35.27 Confidence level 0.073 0.178 0.117 0.076 aMeans in the same row followed by the same letter are not significantly different (P=0.05; Duncan’s multiple range test [SAS Institute 2003])
Daily Temperature Recorded Every 15 Minutes for Bear 2, August 2002
10
20
40
50
00 00 00 00 00 00 00 00 00 00 00 00 00 00 00 00 00 00 00 00 00 00 00 00 00 00 00Time (Hours)
pera
ture
(C)
Wet Bulb Maggot Mass Underground Air
60
0
30
0. 26.
52.
78.
104.
130.
156.
182.
208.
234.
260.
286.
312.
338.
364.
390.
416.
442.
468.
494.
520.
546.
572.
598.
624.
650.
676.
Tem
Figure 3-4. Temperature readings recorded on 15-minute intervals during decomposof Bear 2, August 2002.
ition

60
Recorded Temperatures for Bear 2, August 2002
0
50
1 3 5 7 9 11 13 15 17 19 21 23 25 27
Days
AirUnderbearMaggot Mass
Daily Means of the four
10Wet Bulb
20
30
40
Tem
pera
ture
(C)
Figure 3-5. Daily means for temperature from Duncan’s test for Bear 2, August 2002.
Growth Rate of C. rufifacies Over Time vs. Temperature
0
4
68
101214
161820
0 24 48 72 96 120
144
168
192
216
240
264
288
312
336
360
384
408
432
456
480
504
Time (Hours)
Mea
n Le
ngth
in m
m
0
121620242832364044
Tem
pera
ture
(C)
1st 2nd 3rd Temperature
Figure 3-6. Mean growth rate of Chrysomya rufifacies over time compared to mean maggot mass temperature for Bear 2, August 2002.
2 48

61
Table 3-4. Significance of daily means for Bear 2, August 2002 from Duncan’s test. Duncans On Daily Means for Bear 2, August 2002 Day Air Underbear Maggot Mass Wet Bulb 1 24.2731C 26.0511B 26.6206A 24.066C 2 25.5047B 25.9906B 28.4656A 24.715C 3 26.1398C 30.7927B 36.7181A 25.2866D4 25.9667C 34.1235B 38.7817A 24.618D 5 25.6825C 35.3234B 41.6851A 24.5005D6 25.4554B 33.9924A 34.4442A 25.1002B7 24.6336C 32.5811B 34.1073A 24.2113C8 25.3024C 33.1466B 37.5952A 24.6695C9 25.4973B 34.4431A 34.5021A 24.2269C10 25.893B 25.104A 33.63A 27.97B 11 25.3215B 34.4034A 33.7581A 24.5217B12 25.6556B 34.709A 34.0343A 24.8175C13 24.199C 34.18A 31.069B 28.611B 14 24.1027B 30.8139A 30.9231A 25.3932B
17 25.3719C 28.3404B 30.7935A 25.6121C8 26.001D 30.1684B 33.6088A 27.4676C9 25.814D 32.536B 35.684A 28.24C
20 25.959B 34.858A 35.39A 32.05A 21 26.058C 36.447B 35.56B 46.509A 22 25.304C 33.403A 32.476A 28.066B 23 24.716C 34.133B 35.756B 44.672A 24 24.485C 36.529B 41.897AB 45.079A 25 25.0295C 28.5188B 40.012A 25.1149C26 24.8703C 31.6621A 31.6929A 27.3933B27 25.31B 30.055B 29.917B 38.139A 28 25.718B 29.899B 29.528B 37.726A
Bear 3, November 2002
The cooler temperatures of November did not inhibit the thermal energy production
by the developing larvae. After the first 24 hours, the maggot mass temperatures were
higher than the ambient. The mean maggot mass temperature was calculated to be
26.48°C; the minimum was 13.70°C and the maximum was 43.91°C. Temperature data
are shown in Table 3-5. The one-way ANOVA and Duncan’s test showed significance in
15 24.79C 30.658B 35.903A 29.3398B16 24.2294B 28.7881A 28.4537A 24.2568B
11
the data with a P value of <.0001.

62
The high temperatures of the maggot mass and the steady increase of the
underground soil temperature are shown in Figure 3-7. Figure 3-8 shows the daily means
e te rature aphed together. Table 3-6 shows the
ily m u eir ce from a Duncan’s test. Figure 3-9
the re a with time and compared to the
t
ble 3 s peratures recorded for Bear 3, November 2002 m n.
T co ear er 2002
of th mpe s analyzed with a Duncan’s test gr
da eans for all temperat res and th significan
is lationship of the me n growth for C. rufifacies
mean maggot mass tempera ure.
Ta -5. Descriptive stati tics of temthroughout deco positio
emperature Data Re rded For B 3, Novemb
as und Wet Bulb
Air Maggot M s UndergroMean te e 3C 17.19D mperatur a 17.9 26.48B 34.09A Standar 0.125
imum 7.83 imu t 25.56 fiden 7 0.246
d error 0.212 0.223 0.221 Min temperature 9.03 13.7 18.66 Max m tempera ure 37.88 43.91 44.4 Con ce level 0.41 0.438 0.434 aMeans lo the sa r are not significantly different
0.05 ’ e st [SA e 2003]) in the same row fol wed by me lette
(P= ; Duncan s multipl range te S Institut
Daily Tempera re Recor d Every # 3 - N mber 200
tu de 15 Minutes for Bear ove 2
10
20
3035404550
pera
ture
(C)
Air Maggot mass Under bear in ground Wet bulb
Figure 3-7. Temperature readings recorded on 15-minute intervals during decomposition of Bear 3, November 2002.
05
15
25
0.00
7.45
15.3
0
23.1
5
31.0
0
38.4
5
46.3
0
54.1
5
62.0
0
69.4
5
77.3
0
85.1
5
93.0
0
100.
45
108.
30
116.
15
124.
00
131.
45
139.
30
147.
15
155.
00
162.
45
Time (Hours)
Tem

63
Daily Means of the four Recorded Temperatures for Bear # 3 - November 2002
05
1015202530354045
1 2 3 4 5 6 7 8 9 10 11 12 13
Days
Tem
pera
ture
(C)
AirUnderbearMaggot MassWet Bulb
Figure 3-8. Daily means for temperature from Duncan’s test for Bear 3, November 2002.
Table 3-6. Significance of daily means for Bear 3, November 2002 from Duncan’s test. Duncans On Daily Means for Bear 3, November 2002 Day Air Underbear Maggot Mass Wet Bulb
1 34.114A 21.028B 20.169B 13.555C 2 17.286B 19.337B 23.397A 13.004C 3 19.6399C 23.5848B 34.9302A 17.1308D4 22.4036C 34.0753B 38.4028A 20.4081D5 22.3549C 38.899A 37.2429B 20.9029D6 13.0654D 39.2501A 25.5395B 13.0654C7 15.3749C 36.3875A 32.5645B 12.833D 8 19.941C 37.55A 22.44B 16.748D 9 21.3121C 40.1286A 22.823B 20.6413D
10 22.9493C 41.578A 24.6341B 22.3459D11 22.2334C 41.1297A 23.9821B 21.8266C12 16.7182C 36.9007A 19.515B 16.3894C13 11.7707C 33.25A 15.3585B 11.6052C

64
Growth Rate of C. rufifacies Over Time vs. Temperature
0
5
10
15
20
25
0 24 48 72 96 120 144
Time (Hours)
Mea
n Le
ngth
in m
m
024681012141618202224262830323436384042
Tem
pera
ture
(C)
2nd 3rd Temperature
Figure 3-9. Mean growth rate of Chrysomya rufifacies over time compared to mean
he maggot mass first developed in or around the mouth of all three bears.
hat was laying on the ground. The
an ly u arms in the crevices of the skin, hidden
from at w iced in a few of the locations until the
m a rm a arcass. The maggot mass produced its
e t m nd ss and grew larger with the increasing
s va jo maggot masses were formed between
t ou im e carcass. Often when most of the skin
o s diti o viposition in parts of the carcass that
ome in contact with the soil (Deonier 1940); this could be the case here due to the heat
and humidity of Florida. Figures 3-10 to 3-18 show the maggot mass heat production
maggot mass temperature for Bear 3, November 2002.
T
Although superficial wounds were present from the car accident, the flies preferred to
oviposit in the orifices and on the side of the face t
eggs d ear instar larvae were found nder the
the weather and pred ors. Some ent unnot
aggot mass st rted to fo and move bout the c
levated temperatures as i oved arou the carca
ize and number of the lar e. The ma rity of the
he bear and the ground ar nd the per eter of th
f the carcass i dry, con ons are fav rable for o
c

65
versus the underground temperature and the movement of the masses for Bear 1, June
2002. Figures 3-19 to 3-28 show the maggot mass heat versus the underground
temperature for Bear 2, August 2002. Figures 3-29 to 3-34 show the maggot mass heat
production versus the underground temperature and the masses movement about the bear
for Bear 3, November 2002.
Figure 3-10. Day 3, maggot mass positions that have formed within the first 72 hours for
soil under the bear temperature.
Bear 1, June 2002, with comparison of the maggot mass temperature to the
Day 3 – 33.17°C 31.52°C

66
Day 4 – 45.89°C 31.52°C
er the bear
Figure 3-12. Day 5, the maggot masses are present in the same locations as those of Day
4 for Bear 1, June 2002, the temperature of the maggot mass compared to the soil temperature under bear is shown.
Figure 3-11. Day 4, the movement of the maggot masses for Bear 1, June 2002, with comparison of the maggot mass temperature to the soil undtemperature.
Day 5 – 43.91°C 28.31°C

67
D
ay 6 – 44.4°C 29.1°C
Figure 3-13. Drawing shows the variation in locations upon which the larvae prefer to grow at after Day 6 on Bear 1, June 2002, it also compares the maggot mass temperature with the soil temperature under the bear.
igure 3-14. Maggot mass movement fluctuates in size as the temperature difference
Day 7 – 40.59°C 29.5°C
Fincreases from the ambient soil temperature on Bear 1, June 2002.

68
Day 8 – 41.52°C 28.31°C
Figure 3-15. This drawing shows how the larvae come closer together as they feed and
s
Figure 3-16 2002, they begin to spread out on the surfaces of the bear and surrounding areas, a comparison of the maggot mass temperature to the soil under the bear temperature is shown.
grow together in a mass on Bear 1, June 2002 and compares the maggot mastemperature with the soil temperature.
Day 10 – 37.0°C 31.52°C
. As the larvae slowly reach the post-feeding stage on Bear 1, June

69
11 – 37.44°C 30.71°C
Day
Figure 3-17 away from Bear 1, June 2002, the
maggot mass temperature is shown in relation to the soil temperature.
Figure 3-18. The final day of the maggot masses on Bear 1, June 2002, before the post-e is
. Day 11, the maggot masses activity is starting to slow and remain in a constant location until ready to migrate
31.52°C Day 12 – 37.88°C
feeding larvae migrate away from the carcass to pupate, the soil temperaturstill less than the maggot mass.

70
Day 1 – 29.1°C 26.34°C
Figure 3-20 creasing in size while other areas of the
carcass are beginning to form masses on Bear 2, August 2002. A comparison is done between the maggot mass temperature and the soil.
Figure 3-19. Drawing from Day 1 showing the first maggot mass to form on Bear 2,August 2002, the temperature of the maggot mass is compared to the soil temperature underneath the bear.
Day 2 – 36.57° 26.73°
. The original maggot mass is in

71
ong
nder the bear.
Day 3 – 42.94°C 33.17°C
Figure 3-21. Day 3, all of the orifices of Bear 2, August 2002, have maggot masses alwith areas of the carcass that are touching the ground. The maggot mass temperature is compared to the soil temperature u
C C
Day 4 – 41.99°
35.7°
Figure 3-22. The larvae have increased in size as well have the masses that they haveformed on Bear 2, August 2002, the maggot mass temperature is compared to the soil temperature under the bear.

72
Day 5 –47.96°C 37.44°C
Figure 3-23. Day 5, the larval masses are found mostly on one side of Bear 2, August 2002 feeding on the tissue of the extremities, head and abdominal regions, the
ss temperature to the
temperature produced by these masses are compared to that of the soil.
Figure 3-24. The drawing shows the main areas of interest to the developing larvae on August 2002 with a comp ison of the maggot ma
soil temperature.
Day 8 – 43.91°C 34.43°C
Bear 2, ar

73
ve
Figure 3-2the maggot mass temperature is being compared to the soil
temperature under the bear.
Day 9 – 42.94°C 36.13°C
Figure 3-25. The developing larvae, which are close to migrating in order to pupate, haconsumed the majority of Bear 2, August 2002 tissue but the maggot mass temperature is still higher than the soil.
29.1°C Day 17 – 35.7°C
6. Day 17, a new wave of blow fly larvae has begun to develop on Bear 2, August 2002 and

74
Day 18 – 39.22°C 31.12°C
Figure 3-27. The larvae of the new maggot masses are developing rapidly on Bear 2,
August 2002 but the numbers are much lower than those from the first waveof blow fly, the maggot mass temperatur
e is still higher than that of the soil.
igure 3-28. Day 20, one small maggot mass still remains on Bear 2, August 2002 even in the late stage of decay, its temperature is not much more than that of the soil.
Day 20 – 38.32°C
36.57°C
F

75
Day 2 – 37°C 19.81°C
. Day 2, early signs of maggot mass formation taking place at the mouth andthe chest for Bear 3, November 2002, the temperature of the maggot mass is
Figure 3-29
compared to that of the soil temperature under the bear.
aggot mass and soil temperatures.
Figure 3-30. The larvae in the chest mass on Bear 3, November 2002 have begun to
increase in numbers and size, so has the difference between the m
Day 3 – 43.42°C 29.1°C

76
D 37.44°C
ay 4 – 43.91°C
Figure 3-31. By day 4, the larval masses of Bear 3, November 2002 have moved throughout the body and the numbers have increased greatly, the maggot mastemperature is still significantly higher than that of the so
s il.
Figure 3-32. Although there are larger maggot masses present on Bear 3, November
2002, the soil temperature underneath the bear is slightly hotter on day 5.
Day 5 – 40.13°C 41.99°C

77
C C
Day 6 – 42.46° 40.59°
. On day 6, the maggot mass temperatures on Bear 3, November 2002 was higher than that of the soil. The larval masses have also incr
Figure 3-33eased in numbers
and size.
rvae are
igure 3-34. The larval masses have become a little bit smaller and the la
Day 7 – 43.42°C 40.13°C
Freaching migration on Bear 3, November 2002 but the heat they generate isstill higher than that of the soil.

78
slower rate in
the beginning. This gives the other larvae present a chance to begin their life cycle and
rufifacies larvae were found on opposite sides of the carcass from the other larval fly
ecies present (Goodbrod and Goff 1990). Thus C. rufifacies larvae will consume one
C.
ove around the carcass
on)]. It has also
rd
C.
ickly
into large m
rufifacies larvae were 1st and 2nd instars. For the first 24 hours the maggot masses present
CHAPTER 4 SUMMARY
Discussion
pecies Interaction
As mentioned before, the most abundant blow fly species found in North Central
Florida is the Hairy Maggot Blow Fly, Chrysomya rufifacies. The Hairy Maggot Blow
Fly is one of the earliest to arrive to a carcass but the larvae g e
S
row at a littl
prosper before the C. rufifacies begin to increase in size. During the late 2nd instar, the C.
sp
side of the carcass while the other side is infested with other larval species. As the
fifacies larvae grow and molt into 3rd instars, they will slowly m
the side with the other larval species and consume them along with the carcass. Other
rensic entomologists have observed this phenomenon in the southern locations of the
.S. [Goff (personal communication) and Butler (personal communicati
een reported that the C. rufifacies larvae need live flesh in order to progress into 3
stars (Butler, personal communication; Goodbrod and Goff 1990; Baumgartner 1993).
The first larval developers at the carcasses were either C.
ru
to
fo
U
b
in
macellaria or
megacephala. The larvae of these species have similar characteristics and grow qu
aggot masses. When these species were late 2nd and early 3rd instars, the C.
79
were composed of these species but shortly after that the C. rufifacies would overpower
them. They were either forced away from their food source (the carcass) or consumed by
the C. rufifacies. The same observation has been made in laboratory settings (Wells and
Greenberg 1992) when C. macellaria es were reared together. But it was
not certain at that time if the same would occur in the field.
siderable differences in the size of the maggot masses formed by the
two species. The C. rufifacies larval mass were very large and covered most of the
carcass’ surface area, while the other maggot masses were relatively small and made up
small clusters on the surface. The increased maggot mass size for C. rufifacies is a
characteristic that enables them to be the dominant species when present (Goodbrod and
Goff 1990).
Thermal Energy of the Maggot Mass
l
tempe is one
and C. rufifaci
There were con
The thermal energy of the maggot mass, or the energy being produced by the
massing larvae, was shown to be higher than the ambient temperature throughout larva
development during the early stages of decomposition. The largest temperature increase
occurred at approximately 48 hours when the C. rufifacies were observed molting from
2nd to 3rd instars. The first 24 hours of larval growth can be contributed more to the
ambient temperature than the maggot mass, which had not formed completely. This has
been recorded by Goff (2000) who observed the heat generated by the maggot mass as
influencing the rate of development but the heat is not generated immediately. A
rature probe was inserted into the mouth of the bear upon arrival because it
of the first orifices where eggs are laid. But during the first 24 hours the small 1st instars
do not produce intense thermal energy on their own like the larger larvae, therefore
preventing the early maggot mass from surpassing the ambient temperature. Deonier

80
(1940) found that the heat came at first from the sun, but as larval development
progressed, the maggot mass temperature increased and remained at least 5°C higher than
the ambient regardless of daily weather fluctuations. This phenomenon was also
observed in the data recorded for the bears in this experiment and at times the heat was
over 20°C higher than ambient. The increased peak of temperature in the maggot mass is
seen w
he 3rd
ll 3rd
instar larvae. It is reported to take several days for a maggot mass to develop (Goff
2000). It was observed during this experiment that massing began after 24 hours and the
largest increase of temperature was recorded around 48 hours.
The data presented in Tables 3-2, 3-4, and 3-6, show the daily mean variations that
occur between the four temperatures (air, wet bulb, underground soil and maggot mass)
as the bear carcass decomposes. This represents the significance that can occur between
temperatures during decomposition and how they can fluctuate from day to day. The
Duncan's test run on the data to show significance verifies that the maggot mass is higher
than the ambient air temperature throughout decomposition. The data also shows the
decrease and increase of the maggot mass on a daily basis in regards to the other three
temperatures. The changing temperatures can be seen in Figures 3-2, 3-5, and 3-8 for the
bear carcasses
In Figures 3-3, 3-6, and 3-9, the larval growth of C. rufifacies is compared to the
average maggot mass temperature over time. A peak is observed at approximately 48
ith the appearance of the 3rd instar larvae. This was also observed by Cianci and
Sheldon (1990). For Bear 1 there was a 17°C increase from the 2nd instar larvae to t
instars. Bear 2 showed a 17°C increase in temperature with the onset of 3rd instar larvae.
The increased peak for Bear 3 resulted in a 22°C difference from the 2nd instars to fu

81
hours. This peak represents the changes in instar from 2nd to 3rd. This phenomen
been reported previously and shown in Greenberg (1991). The increased temperature
was recorded as the mean larval growth increased between 24 and 72 hours.
Forensic entomologists utilize the ambient air temperature when determining the
post mortem interval (PMI). This is accomplished by contacting the closet weather
station to get daily temperature and humidity readings for the time in question (Goff
2000). The entomologist will also take readings from the crime scene site at the time of
collection and for the next few days to average the mean (Byrd and Castner 2001a; Goff
2000; Catts 1990; Goff 1993; Anderson 2001). This is of course an effective way to get a
on has
mean growth cycle for the larval species in question, but it does not incorporate the
thermal energy produced by the developing larvae. The data shown here give evidence
that the larvae prefer to choose a specific mean temperature at which they like to grow,
seen i °
0, pg. 62) also recognized the movement of the larvae in the mass and
expre
temperatures at which the maggots are developing. The temperature of the mass is
n Byrd and Butler (1996; 1997; 1998). The maggot mass can fluctuate from 45 C
to nearly 20°C. The larvae in the mass will move about between the varying
temperatures to find the optimum location to develop. Cianci and Sheldon (1990) report
that the formation of an endothermic environment can alleviate the stress on individual
maggots and allow each maggot in the mass to function at its maximum efficiency.
Using just the ambient air temperature gives the assumption that the larvae grow based
only on the ambient mean without considering the effects the maggot mass has on the
larvae.
Goff (200
ssed a clear insight of what events were taking place:
“The temperature of the maggot mass does not necessarily reflect the actual

82
recorded at the middle of the mass, and temperatures are lower on the outer
regulate their own temperatures, at ambient temperatures above 50°C they are in
moving to the inside to feed and, as their temperatures become dangerou
portions of the mass and in other parts of the corpse. Since maggots cannot
danger of thermal death, and thus they seem to circulate throughout the mass, sly high,
moving back to the outside of the mass to cool down and digest. After a period of
good deal of their time at temperatures lower than the temperature at the center of
he
but after that its effect decreases rapidly. Maggot activity generates its own heat drop. The
early maggot mass will develop at a rate somewhat in synchrony with fluctuations
the massed maggots can far exceed ambient heat and in effect produces a stable e
maggot-mass serves also to warm the substrate underlying the remains so that he
mass scatter during postfeeding dispersal, the ground and corpse warming also
he underground soil temperatures recorded for all three bears was elevated from
the no
sing. But, the underground
soil te vae
cooling, they reenter the mass and repeat the cycle. In the process, they spend a
the maggot mass.”
The maggot mass mean thermal energy should be considered when estimating t
PMI based on the data shown here. The maggot mass temperature is consistently higher
than that of the ambient. Deonier (1940) found that the high temperatures in the
carcasses he studied were due partially to heat absorbed from the sun but principally from
the heat generated by blow fly larvae, which were developing in the carcasses.
The effect of the maggot mass are explained by Catts (1990, pg. 127) all of which
were observed in my experiment:
“Ambient heat does play a dominant role during egg and early larval development,
that can prevent cooling and slowed development when air temperatures
in ambient temperatures. However, in the late 2nd and 3rd instars, heat generated by
optimal heat level for accelerated larval development. The warmth produced by th
subcorpse temperatures also may exceed that of the air. As the maggots from t
dissipates.”
This statement clearly explains the function and activity of the maggot mass in
nature. T
rm and at times was observed to be 12°C – 18°C warmer than the ambient
temperature. This is believed to occur due to the larval mas
mperature for Bear 3 reached its highest temperature of 41.99°C when the lar

83
were t
aroun
place e
screen
nt cannot be solely based on ambient temperature. Although
the ac
940).
n lower
than t
ough the three stages of mortis: rigor, livor and algor,
the bo
a corp
determ
corps
actua
rate of decomposition.
s
in the late 3rd instar or early migration stage and the temperature held constan
d 41°C for the next few days. This event could have been due to the screening
d between the bear and the soil to prevent insect overflow from the other bears. Th
might have heated the soil further even after larval development had ended.
Larval developme
cumulated heat from the sun warms the surface of a carcass, this is still not
sufficient to spawn extensive larval growth (Deonier 1940). Shaded carcasses were
reported to lack higher temperatures until larval development occurred (Deonier 1
The carcasses for this experiment were located in a semi-wooded shaded area. So
therefore without the larval development the carcass temperature would have bee
hat of the ambient. In the event no adverse effect occurred from the developing
larvae, once the body had gone thr
dy would essentially cool to a base temperature similar to the ambient. The idea of
se being uninhabited by larvae leads to the speculation that if the PMI
ination is based on the ambient temperature, it could be under estimated. The
e will appear as if it has been in the environment a shorter amount of time than it
lly was due to lack of the increased heat for the larvae, which in turn increases the
The maggot mass temperature was found to be several degrees higher than the
ambient throughout the time that the larvae were growing from 2nd instars and through to
the late 3rd instar stage. The maggot mass temperature for Bear 1, June, 2002, wa
recorded 23°C above the ambient temperature of 20°C during 3rd instar larval growth.
The greatest difference recorded during decomposition of Bear 2, August 2002, was

84
when the maggot mass temperature was 22°C over the ambient temperature of 32°C.
Bear 3, November 2002, the largest variation between maggot mass and the ambient
temperature of 9°C occurred at about 145 hours when the maggot mass was 33°C higher.
Goff (2000) also experienced a 22°C maggot mass temperature above the ambient in
For
Hawa in
sses.
t air
id
e increased
the
months and regions of the U.S., the ambient air temperature will
play m
urate
of
e
ii. Deonier (1940) observed temperatures 70 degrees (Fahrenheit) above ambient
certain parts of carcasses and more than 50 degrees above the ambient in larval ma
It appears that the thermal maggot mass has more influence when the ambien
temperature is lower due to weather and season. For Bear 1 and 2 the difference was
much less due to the high temperatures being recorded as the ambient. The summer
months and early fall months have high daily temperatures in Florida and the late fall
months begin to show signs of winter coming with decreased temperature. It can be sa
that when determining the PMI in colder regions of the U.S. or at colder times of the
year, the maggot mass thermal energy should be the main heat contributor. This is
because the low ambient temperatures would not be high enough to sustain th
development of the larvae present. Mann et al. (1990) report that the maggots within
body cavities such as the head, chest, abdomen, and vagina will continue to feed and
develop even in freezing weather because they produce their own heat due to their large
numbers. In the warmer
ore of a role even though maggot mass thermal heat development is decreased.
Conclusion
Temperature is a main contributor when estimating the time of death. An acc
growth rate of Dipteran larvae cannot be determined without knowing the temperature
the median where the flies are growing. When an individual approaches a crime scen

85
where the PMI will be needed, the appropriate temperatures should be taken. Many are
unaware of the correct procedure and some important temperatures will not be collect
(Smith 1986), thereby making the closest weather station’s data extremely important to a
case (Goff 2000). If a maggot mass is still present when a corpse is discovered, sever
temperatures should be taken throughout to get a relative mean. As seen in this
experiment, the maggot mass temperature can have a great effect on the development of
ed
al
the la
ond
at
It
ars
continually moving in and out of the h ture areas.
rvae based on season and weather.
Maggot mass temperature does not stay constant in the field and thus the use of
laboratory tests can give altered predictions. The results from my experiment corresp
with several growth curves developed by Byrd and Butler (1996, 1997, 1998) and Byrd
and Allen (2001), but the actual field data are very unpredictable. In a laboratory setting,
larvae of Phormia regina (Meigen) were unable to sustain life through the adult stage
temperatures above 35°C, but a larval mass can reach temperatures well above this.
can be said that when the larvae have control of the thermal temperature they are growing
in, they are more likely to survive in extensive heat. Even so, it is apparent that extensive
heat is more important at varying times of development. The molting of 2nd to 3rd inst
produces increased thermal energy, which continues during the 3rd instar feeding frenzy.
However, during post-feeding, the maggot mass temperature slowly starts to decline.
One must keep in mind that a maggot mass is a dynamic process with maggots
igher tempera
Species composition of the maggot mass is thought to have dissimilar effects on the
results. In North Central Florida the dominant species Chrysomya rufifacies made up all
of the large maggot masses studied on the carcasses. Therefore, the data presented here

86
applies only to that species. Other species might have different effects when massing
together on carrion and they might not be able to produce as much heat. This is
something that needs to be researched in other locations. In conducting this experiment
the temperature readings for the first 24 hours were taken from a species other than C.
rufifacies, which gave very low readings compared to the rest of the data. It can b
assumed that the first instars did not produce extensive heat. It can also be stated that the
larval species present within the first 24 ho
e
urs are unable to produce extensive heat.
In conclusion, the maggot mass plays a significant role in controlling the
developmental time of Dipteran larvae. The thermal energy that the growing larvae
produce in the mass should be taken into consideration when determining the post
mortem interval. There are substantial data recorded in this experiment to show the
importance of the maggot mass and help to understand how the larvae are able to live
under such extreme conditions.

LIST OF REFERENCES
Anderson, G. S. 1997. The use of insects to determine time of decapitation: A case-from British Columbia, J. Foren. Sci., 42:947-950.
Anderson, G. S. 1999. Wildlife forensic entomology: Determining time of death in two illegally killed black bear cubs, J. Foren. Sci., 44:856-859.
study
Anderson, G. S. 2001. Insect succession on carrion and its relationship to determining s in
Legal Investigations, J. H Byrd and J. L. Castner, Eds., CRC Press, Boca Raton,
g species Phaenicia sericata and Phaenicia pallescens, Ann. Entomol. Soc. Am., 68:
Phaenicia eximia (Diptera: Calliphoridae) and preliminary mitochondrial DNA azil, J. Med. Entomol., 33:839-843.
Barreto, M., M. E. Burbano, and P. Barreto. 2002. Flies (Calliphoridae, Muscidae) and Beetles (Silphidae) from human cadavers in Cali, Colombia, Mem. Inst. Oswaldo
ruz., 97: 137-138.
Baum artner, D. L. 1993. Review of Chrysomya rufifacies (Diptera: Calliphoridae), J. Med. Entomol., 30:338-352.
Byrd, J. H. and J. C. Allen. 2001. The development of the black blow fly, Phormia regina (Meigen), Foren. Sci. Internat., 120:79-88, 1-2.
Byrd, J. H. and J. F. Butler. 1996. Effects of temperature on Cochilomyia macellaria (Diptera: Calliphoridae) development, J. Med. Entomol., 33:901-905.
Byrd, J. H. and J. F. Butler. 1997. Effects of temperature on Chrysomya rufifacies (Diptera: Calliphoridae) development, J. Med. Entomol., 34:353-358.
Byrd, J. H. and J. F. Butler. 1998. Effects of temperature on Sarcophaga haemorrhoidalis (Diptera: Sarcophagidae) development, J. Med. Entomol., 35:694-698.
Byrd, J. H. and J. L. Castner. 2001a. Forensic Entomology: The Utility of Arthropods in Legal Investigations, CRC Press, Boca Raton, FL.
time of death (143-175), in Forensic Entomology: The Utility of Arthropod
FL.
Ash, N. and B. Greenberg. 1975. Developmental temperature responses of the siblin
197-200.
Azeredo-Espin, A. M. I. and N. G. Madeira. 1996. Primary myiasis in dog caused by
analysis of the species in Br
C
g
87

88
Byrd, J. H. and J. L. Castner. 2001b. Insects of forensic importance (43-80), in Forensic Entomology: The Utility of Arthropods in Legal Investigations, J. H Byrd and J. L. Castner, Eds., CRC Press, Boca Raton, FL.
Campobasso, C. P., G. Di Vella, and F. Introna. 2001. Factors affecting decomposition and Diptera colonization, Foren. Sci. Internat., 120:18-27, 1-2.
Carvalho, L. M. L., P. J. Thyssen, A. X. Linhares, and F. A. B. Palhares. 2000. A
35-138
s Print Shop,
Clemson, SC.
Catts ce’s
Cianci, T. J. and J. K. Sheldon. 1990. Endothermic generation by blow fly larvae
Davidson, J. 1944. On the relationship between temperature and rate of development of insects at constant temperatures, J. Ani. Ecol., 13:26-38.
Denn ies n. Entomol. Soc.
Am., 69:109-113.
Deonity in the southwest, J. Econom. Entomol., 33:166-170.
. ng of beetle larvae (Nitidulidae: Omosita) recovered
from human bone, J. Foren. Sci., 47:1337-1339.
Early atterns in exposed carrion on the island of O’ahu, Hawaiian Islands, USA, J. Med. Entomol., 23:520 – 531.
Florid h and Wildlife Conservation Commission Fishing Capital of the World,
Gagne, R. J. 1981. Chrysomya spp., old world blow flies (Diptera: Calliphoridae),
Goddard, J. and P. K. Lago. 1985. Notes on blow fly (Diptera: Calliphoridae) succession
checklist of arthropods associated with pig carrion and human corpses in Southeastern Brazil, Mem. Inst. Oswaldo Cruz., 95:1
Catts, E. P. 1990. Analyzing entomological data (124-137), in Entomology and Death - aprocedural guide, E. P. Catts and N. H. Haskell, Eds., Joyce’
E. P. and N. H. Haskell. 1990. Entomology and Death - a procedural guide, JoyPrint Shop, Clemson, SC.
Phormia regina developing in pig carcasses, Bull. Soc. Vector Ecol., 15:33-40.
o, R. F. and W. R. Cothran. 1976. Competitive interactions and ecological strategof Sarcophagid and Calliphorid flies inhabiting rabbit carrion, An
ier, C. C. 1940. Carcass temperatures and their relation to winter blowfly populations and activ
DiZinno, J. A., W. D. Lord, M. B. Collins-Morton, M. R. Wilson, and M. L. Goff. 2002Mitochondrial DNA sequenci
, M. and M. L. Goff. 1986. Arthropod succession p
a Fish and Wildlife Conservation Commission. 2001-2003. Florida Fis
http://www.wildflorida.org/. June, 2003.
recently established in the Americas, Entomol. Soc. Am., 27:21-22.
on carrion in Northern Mississippi, J. Entomol. Sci., 20:312-317.

89
Goff, M. L. 1991. Comparison of insect species associated with decomposing remains recovered inside dwellings and outdoors on the island of Oahu, Hawaii, J. Foren. Sci., 36:748-753.
Goff, M. L. 1992. Problems in estimation of postmotem interval resulting from wrappinof the corpse: A case study from Hawaii, J. Agric. Entomol., 9:2
g 37-243.
and
Goff, M. L. 2000. A Fly for the Prosecution, Harvard University Press, Cambridge, MA.
Goff, heroin tissues on the development rate of Boettcherisca peregrina
(Diptera: Sarcophagidae) and implications of this effect on estimation of
Goff, M. L. and W. D. Lord. 1994. Entomotoxicology: A new area for forensic
Goff, M. L., M. L. Miller, J. D. Paulson, W. D. Lord, E. Richards, and A I. Omori. 1997.
cophagidae) and detection of the drug in postmortem blood, liver tissue, larvae, and puparia, J. Foren. Sci.,
Goff, M. L. and C. B. Odom. 1987. Forensic Entomology in the Hawaiian Islands, Am. J. Foren. Med. Pathol., 8: 45-50.
Goff, the development rate of Boettcherisca peregrina (Diptera: Sarcophagidae), J. Med.
Goff, mation of postmortem interval by arthropod succession, Am. J. Foren. Med. Pathol., 9:220-225.
Goff, lony development time for Anoplolepsis longipes (Hymenoptera: Formicidae), J. Foren.
Good f larval population density on rates of development and interactions between two species of Chrysomya (Diptera:
Grassberger, M. and C. Reiter. 2001. Effect of temperature on Lucilia sericata (Diptera:
Goff, M. L. 1993. Estimation of postmortem interval using arthropod developmentsuccessional patterns, Foren. Sci. Rev., 5:82-94.
M. L., W. A. Brown, K. A. Hewadikaram, and A. I. Omori. 1991. Effect ofin decomposing
postmortem intervals using arthropod development, J. Foren. Sci., 36:537-542.
investigation, Am. J. Foren. Med. Pathol., 15:51-57.
Effects of 3,4-Methylenedioxymethamphetamine in decomposing tissues on the development of Parasarcophaga ruficornis (Diptera: Sar
42:276-280.
M. L., A. I. Omori, and J. R. Goodbrod. 1989. Effect of cocaine in tissues on
Entomol., 26:91-93.
M. L., A. I. Omori, and K. Gunatilake. 1988. Esti
M. L. and B. H. Win. 1997. Estimation of postmortem interval based on co
Sci., 42:1176-1179.
brod, J.R. and M. L. Goff. 1990. Effects o
Calliphoridae) in laboratory culture, J. Med. Entomol., 27:338-343.
Calliphoridae) development with special reference to the isomegalen- and isomorphen-diagram, Foren. Sci. Intern., 120: 32-36.

90
Greenberg, B. 1990. Nocturnal oviposition behavior of blow flies(Diptera: Calliphoridae), J. Med. Entomo., 27:807-810.
Greenberg, B. 1991. Flies as Forensic Indicators, J. Med. Entomol., 28:565-577.
Green Indicators, Cambridge University Press, Cambridge, UK.
Green n of Calliphorid (Diptera) eggs, J. Med. Entomol., 32:21-26.
Gunatilake, K. and M. L. Goff. 1989. Detection of organophosphate poisoning in a
Hall, - a
Clemson, SC.
Hall, nsic entomology (1-15), in Forensic Entomology: The Utility of Arthropods in Legal Investigations, J. H Byrd
Hall,
ptera: Sarcophagidae) of medicolegal importance in Missouri, Ann. Entomol. Soc. Am., 86:589-593.
Hewadikaram, K. A. and Goff, M. L. 1991. Effect of carcass size on rate of decomposition and arthropod succession patterns, J. Foren. Med. Pathol., 12:235-
James es that Cause Myiasis in Man, Government Printing Office, Washington, US.
Koma ic perimortem sexual assault clothing patterns, J. Foren. Sci., 43:792-796.
Lewism/yr2001/sep/lewis_p10_010903.html. March 2002.
39:215-222.
berg, B. and J. C. Kunich. 2002. Entomology and Law: Flies as Forensic
berg, B. and D. Singh. 1995. Species identificatio
putrefying body by analyzing arthropod larvae, J. Foren. Sci., 34:714-716.
R. D. 1990. Medicocriminal entomology (1-8), in Entomology and Death procedural guide, E. P. Catts and N. H. Haskell, Eds., Joyce’s Print Shop,
R. D. 2001. Introduction: perceptions and status of fore
and J. L. Castner, Eds., CRC Press, Boca Raton, FL.
R. D. and K. E. Doisy. 1993. Length of time after death: Effect on attraction and oviposition or larviposition of midsummer blow flies (Diptera: Calliphoridae) andflesh flies (Di
240.
, M. T. 1947. The Fli
r, D. and O. Beattie. 1998. Postmortem insect activity may mim
, Ricki. 2001.Where the bugs are: Forensic entomology. The Scientist. www.thescientist.coo
Lord, W.D., M. L. Goff, T. R. Adkins, and N. H. Haskell. 1994. The black soldier flyHermetia illucens (Diptera: Stratiomyidae) as a potential measure of humanpostmortem interval: Observations and case histories, J. Foren. Sci.,
Lui, D. and B. Greenberg. 1989. Immature stages of some flies of forensic importance, Ann. Entomol. Soc. Am., 82:80-93.

91
Mann, R. W., W. M. Bass, and L. Meadows. 1990. Time since death and deof the human body: Variables and observations
composition in case and experimental field
studies, J. Foren. Sci., 35:103-111.
Mullen, G. and L. Durden. 2002. Medical and Veterinary Entomology, Elsevier Science,
Rodriguez, W. C. and W. M. Bass. 1983. Insect activity and its relationship to decay rates
Roehrdanz, R. L. and D. A. Johnson. 1996. Mitochondrial DNA restriction site map of 5.
Schoenly, K., M. L. Goff, J. D. Wells and W. D. Lord. 1996. Quantifying statistical terval
06-112.
Shean, B. S., L. Messinger, and M. Papworth. 1993. Observations of differential .
Smith, K. G. V. 1986. A Manual of Forensic Entomology, Cornell University Press,
Sperl s use for postmortem interval estimation, J. Foren.
Sci., 39:418-427.
Stojans of public health importance, U.S. Department of Health, Education, and
Welfare, Public Health Service, Communicable Disease Center, Training Branch,
Tantawi, T. I. And B. Greenberg. 1993. The effects of killing and preservative solutions
Watson, E. J. and C. E. Carlton. 2003. Spring succession of necrophilus insects on
Wells, J. D., J. H. Byrd, and T. I. Tantawi. 1999. Key to third-instar Chrysomyinae
Wells, J. D. and B. Greenberg. 1992. Laboratory interaction between introduced
San Diego, CA.
of human cadavers in east Tennessee, J. Foren. Sci., 28:423-432, 2.
Cochliomyia macellaria (Diptera: Calliphoridae), J. Med. Entomol., 33:863-86
uncertainty in succession-based entomological estimates of the postmortem inin death scene investigations: A simulation study, Am. Entomol., Summer:1
decomposition on sun exposed v. shaded pig carrion in coastal Washington state, JForen. Sci., 38:938-949.
Ithaca, NY.
ing, F. A. H., G. A. Anderson, and D. A. Hickey. 1994. A DNA-based approach tothe identification of insect specie
ovich, C. J., H. D. Pratt, and E. E. Bennington. 1962. Fly larvae: Key to some specie
Atlanta, GA.
on estimates of maggot age in forensic cases, J. Foren. Sci., 38:702-707.
wildlife carcasses in Louisiana, J. Med. Entomol., 40:338-347.
(Diptera: Calliphoridae) from carrion in the continental United States, J. Med. Entomol., 36:638-641.
Chrysomya rufifacies and native Cochliomyia macellaria (Diptera: Calliphoridae), Environ. Entomol., 21:640-645.

92
Wells, J. D. and H. Kurahashi. 1994. Chrysomya megacephala (Fabricius) (Diptera: Calliphoridae) development: Rate, variation and the implications for forensic entomology, Jpn. J. Sanit. Zool., 45:303-309.
en. Sci., 40:585-590.
Wells, J. D. and L. R. LaMotte. 1995. Estimating maggot age from weight using inverse prediction, J. For
Wells, J. D. and F. A. Sperling. 1999. Molecular phylogeny of Chrysomya albiceps and C. rufifacies (Diptera: Calliphoridae), J. Med. Entomol., 36:222-226.

BIOGRAPHICAL SKETCH
hwest
lorida. She graduated second in her class from Lehigh Senior. High School in 1997 and
eaded to college. Aspiring to be a pediatrician, Sonja was soon introduced to the world
f six legged creatures at Bethany College. Her infatuation with insects grew during her
econd year, when she learned about forensic uses of arthropods. Sonja graduated with a
achelor of Science degree in biology in 2001; and started at the University of Florida
ntomology and Nematology department in the fall. She never looked back to medicine
after finding her place in forensic entomology.
Sonja Lise Peters was born and raised in Lehigh Acres, located in sout
F
h
o
s
B
E
93