TEMPERATURE STRUCTURE OF GASEOUS NEBULAE AND CHEMICAL ABUNDANCES M. Peimbert C.R. O’Dell A....
42
TEMPERATURE STRUCTURE OF GASEOUS NEBULAE AND CHEMICAL ABUNDANCES M. Peimbert C.R. O’Dell A. Peimbert V. Luridiana C. Esteban J. García-Rojas L. Carigi F. Bresolin M.T. Ruiz A.R. López-Sánchez Lake Geneva, Wisconsin, April 2007 Microstructures in the ISM: Bob O’Dell 70th birthday
-
date post
21-Dec-2015 -
Category
Documents
-
view
214 -
download
1
Transcript of TEMPERATURE STRUCTURE OF GASEOUS NEBULAE AND CHEMICAL ABUNDANCES M. Peimbert C.R. O’Dell A....

TEMPERATURE STRUCTURE OF GASEOUS NEBULAE AND CHEMICAL
ABUNDANCES
M. Peimbert
C.R. O’Dell A. Peimbert V. Luridiana C. Esteban J. García-Rojas L. Carigi F. Bresolin M.T. Ruiz A.R. López-Sánchez
Lake Geneva, Wisconsin, April 2007 Microstructures in the ISM: Bob O’Dell 70th birthday
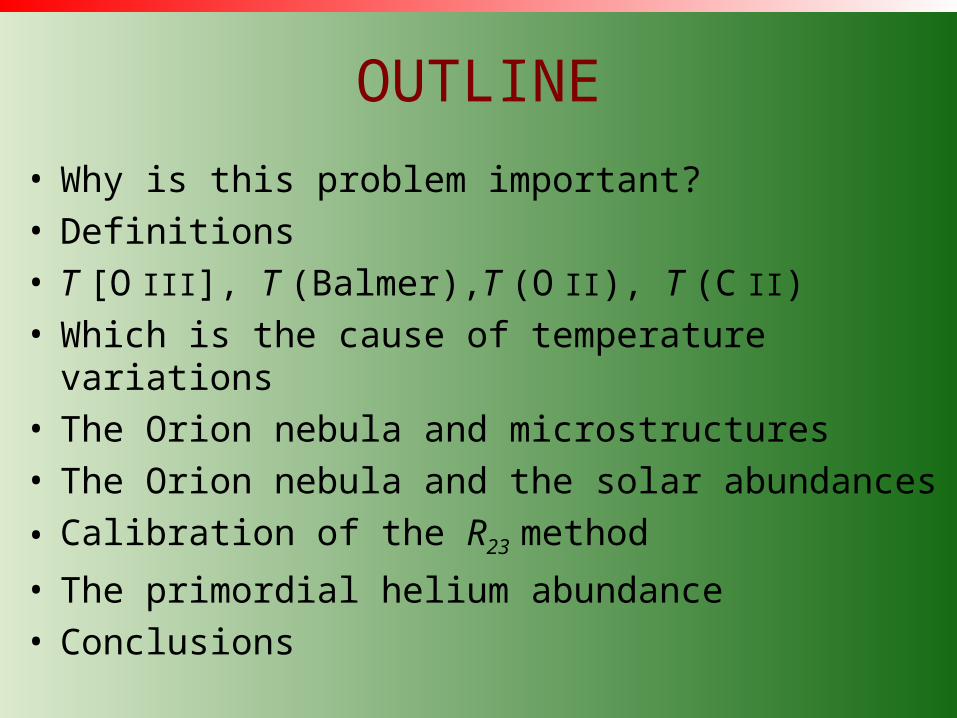
OUTLINE
• Why is this problem important?• Definitions• T [O III], T (Balmer),T (O II), T (C II)• Which is the cause of temperature variations• The Orion nebula and microstructures• The Orion nebula and the solar abundances
• Calibration of the R23 method
• The primordial helium abundance• Conclusions

Why is the problem of temperaturevariations important?
• Physical conditions of gaseous nebulae• Abundances in H II regions and PNe• Solar abundances• Galactic chemical evolution• Primordial helium abundance, YP
• Metal content and chemical evolution of the universe

Temperature Structure
Te(4363/5007) = T0 [1 + (90800/T0 -3) t 2/2]Te(Bac/H) = T0 (1 – 1.70 t 2)
Te(4649/5007) = f1 (T0 , t 2)
T0 =
t 2 =
Te Ne Ni dV
Ne Ni dV
(Te - T0)2 Ne Ni dV
T02
Ne Ni dV
Te(He lines) = T0 (1 – k t 2) k~1.8
Te(4267/1909) = f2(T0 , t2)

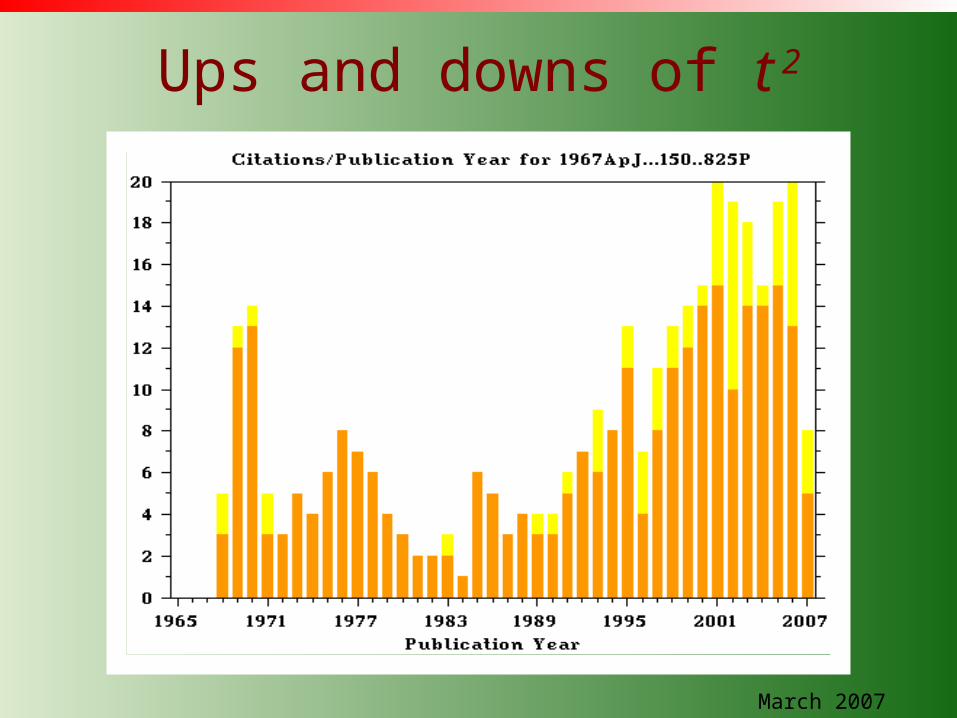
Ups and downs of t 2
March 2007
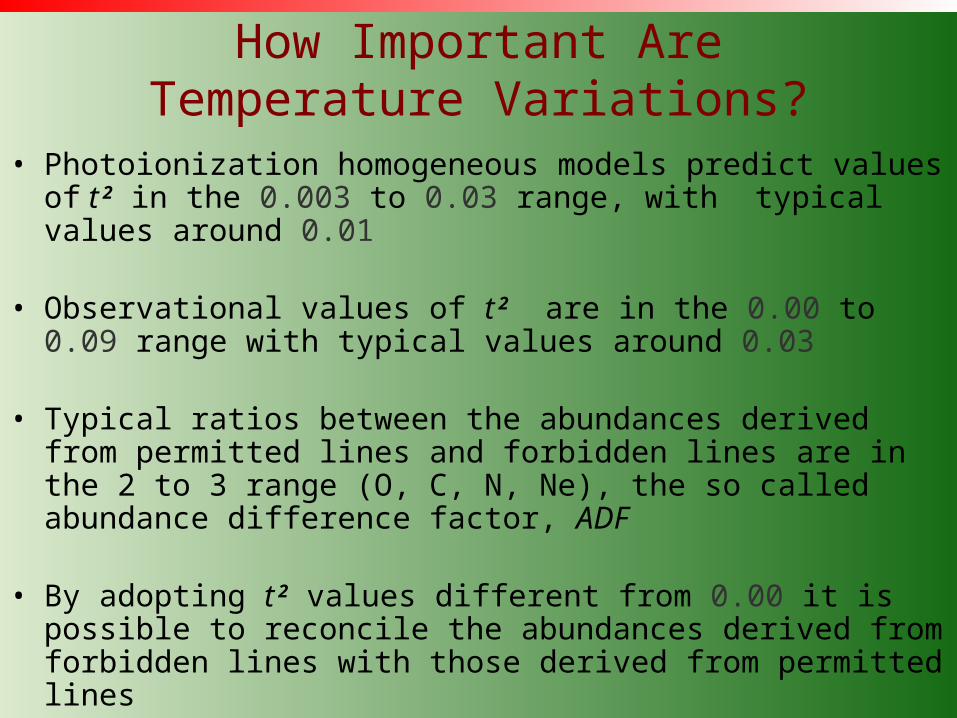
How Important Are Temperature Variations?
• Photoionization homogeneous models predict values of t
2 in the 0.003 to 0.03 range, with typical values around 0.01
• Observational values of t 2 are in the 0.00 to 0.09 range
with typical values around 0.03
• Typical ratios between the abundances derived from permitted lines and forbidden lines are in the 2 to 3 range (O, C, N, Ne), the so called abundance difference factor, ADF
• By adopting t 2 values different from 0.00 it is possible
to reconcile the abundances derived from forbidden lines with those derived from permitted lines

Presence of Temperature Variations
• There are temperature variations that can not be explained by chemically homogeneous photoionization models
• The sources of these variations can be many and a specific model has to be made for each nebula
• The abundances derived from recombination lines are almost unaffected by temperature variations
• The abundances derived from collisionally excited lines, under the assumption of constant temperature, typically underestimate the abundances relative to hydrogen by a factor of 2 to 3
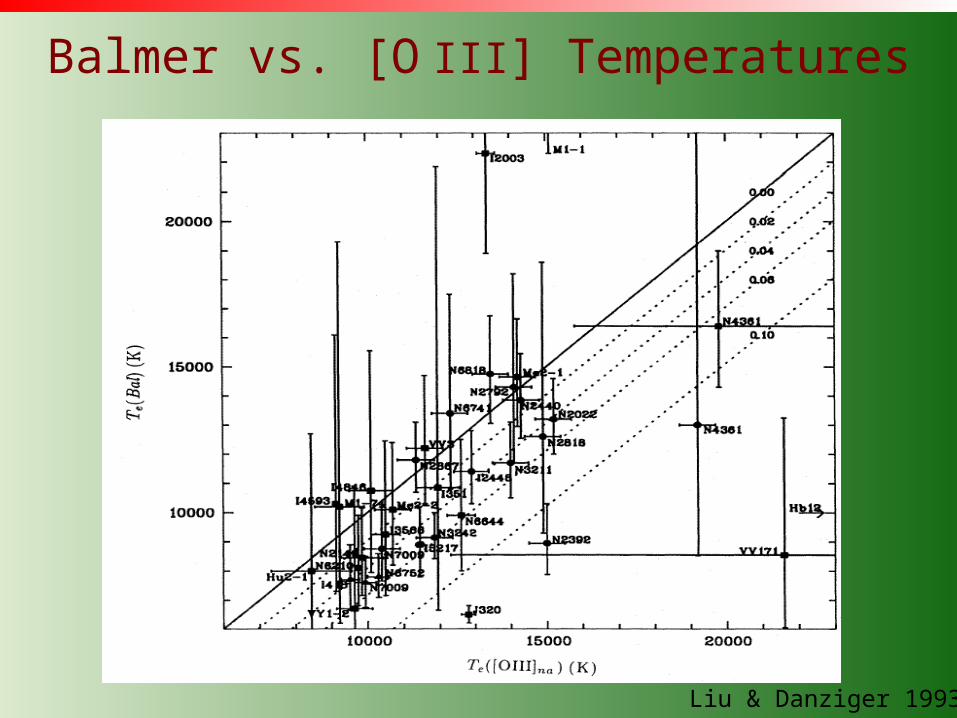
Liu & Danziger 1993
Balmer vs. [O III] Temperatures

N(C++) from Recombination Lines vs. N(C++) from Forbidden Lines
Peimbert, Luridiana, & Torres-Peimbert 1995
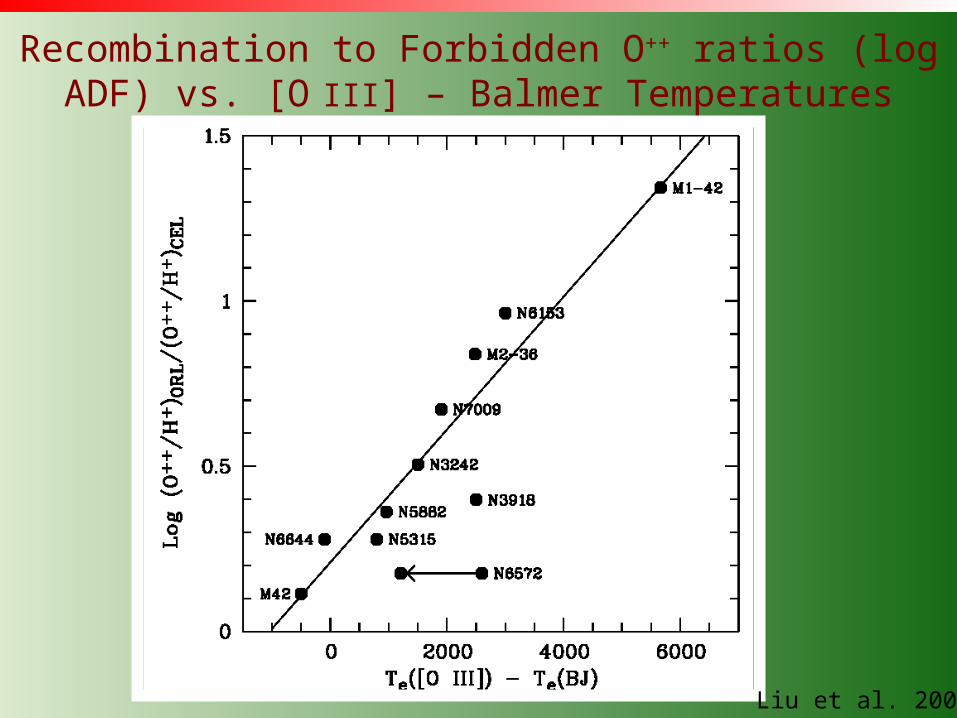
Recombination to Forbidden O++ ratios (log ADF) vs. [O III] – Balmer Temperatures
Liu et al. 2001
What causes Temperature Variations?
• Deposition of mechanical energy
• Chemical inhomogeneities
• Presence of WR Stars
• Dust heating
• Time dependent ionization
• Density variations
• Deposition of magnetic energy
• Shadowed regions

Microstructures and t 2 in the Orion
Nebula
O´Dell et al. 2003
[O III] 5007 image
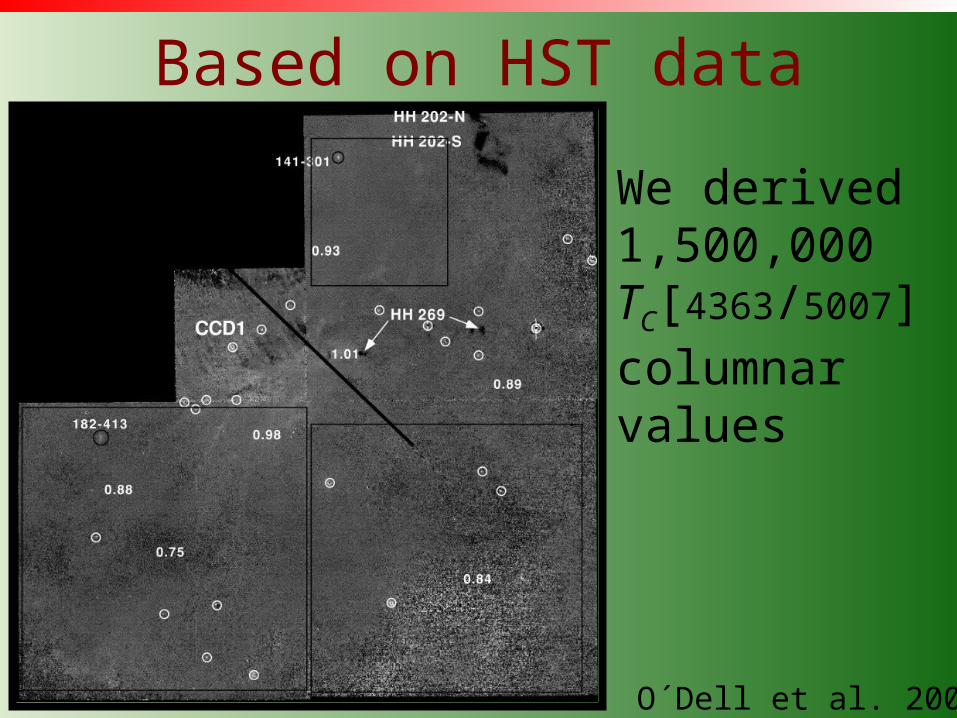
Based on HST data
O´Dell et al. 2003
We derived 1,500,000TC[4363/5007] columnar values

Noise vs. True Temperature Variations
O´Dell et al. 2003
The face of the nebula is mottled with small scale variations in TC with angular dimensions of about 10” (~0.02 pc) and amplitudes of 400 K
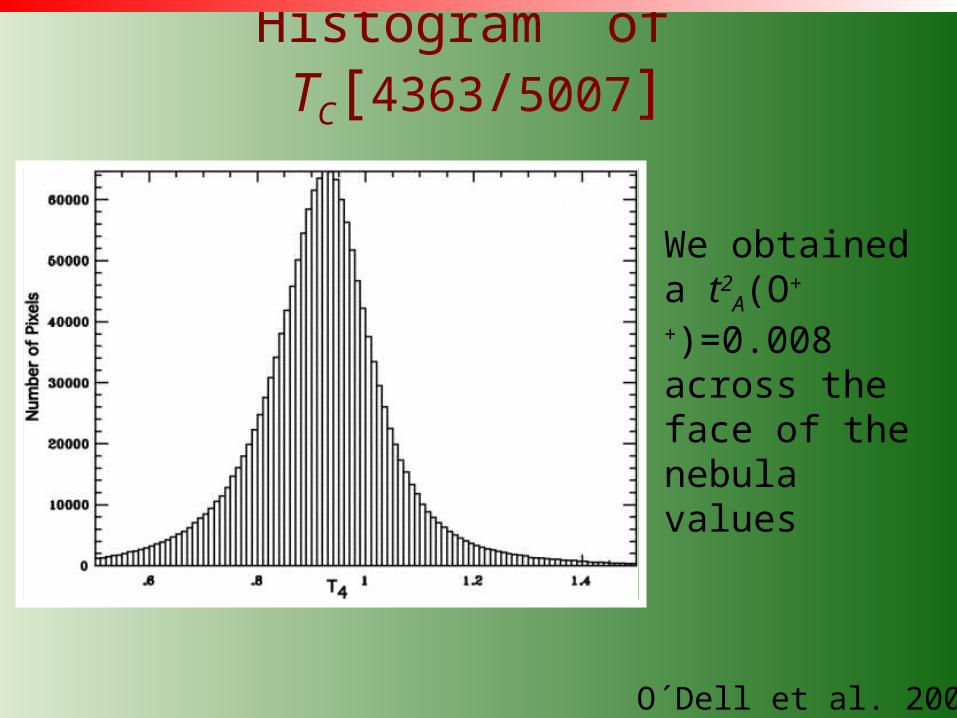
Histogram of TC[4363/5007]
O´Dell et al. 2003
We obtained a t2
A(O++)=0.008 across the face of the nebula values

Small Scale Ionization Structure
O´Dell et al. 2003
[N II] / H I [O III] / H I

t 2 in the Orion Nebula
• From HST narrow filter images:– t2
A (O++)=0.008
• From a very small region of Orion Esteban et al. (2004) estimated:– t2
sr(O++)=0.020±0.002 from O II and [O III]
– t2sr
(H+)=0.022±0.002 from T(He I) vs. T([O II]+[O III])
• O´Dell et al. estimated: t2
Whole Object(H+)=0.028±0.006
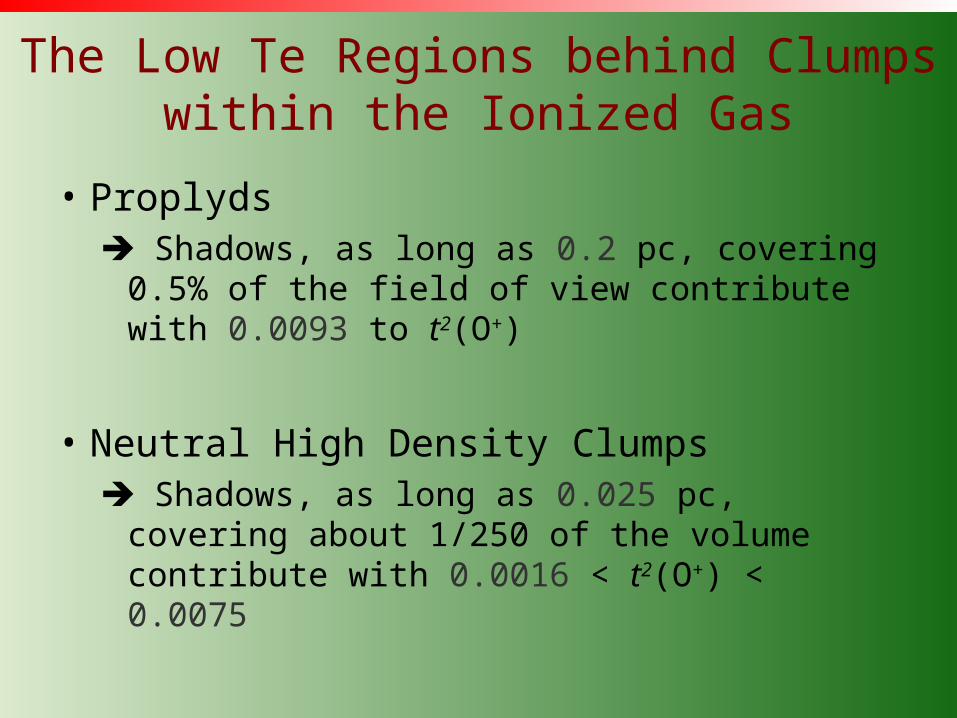
The Low Te Regions behind Clumps within the Ionized Gas
• Proplyds Shadows, as long as 0.2 pc, covering
0.5% of the field of view contribute with 0.0093 to t2(O+)
• Neutral High Density Clumps Shadows, as long as 0.025 pc, covering
about 1/250 of the volume contribute with 0.0016 < t2(O+) < 0.0075

Neutral High Density Clumps
O´Dell et al. 2003
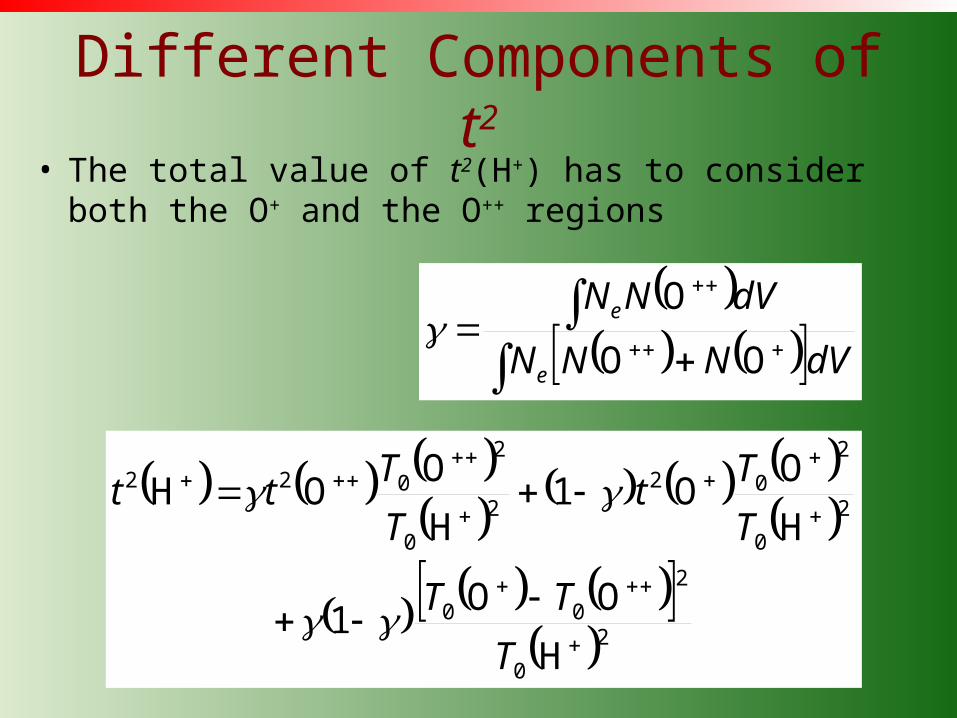
Different Components of t2
• The total value of t2(H+) has to consider both the O+ and the O++ regions
20
2
00
2
0
2
022
0
2
022
H
OO1
H
OO1
H
OOH
T
TT
T
Tt
T
Ttt
dVNNN
dVNN
e
e
OO
O
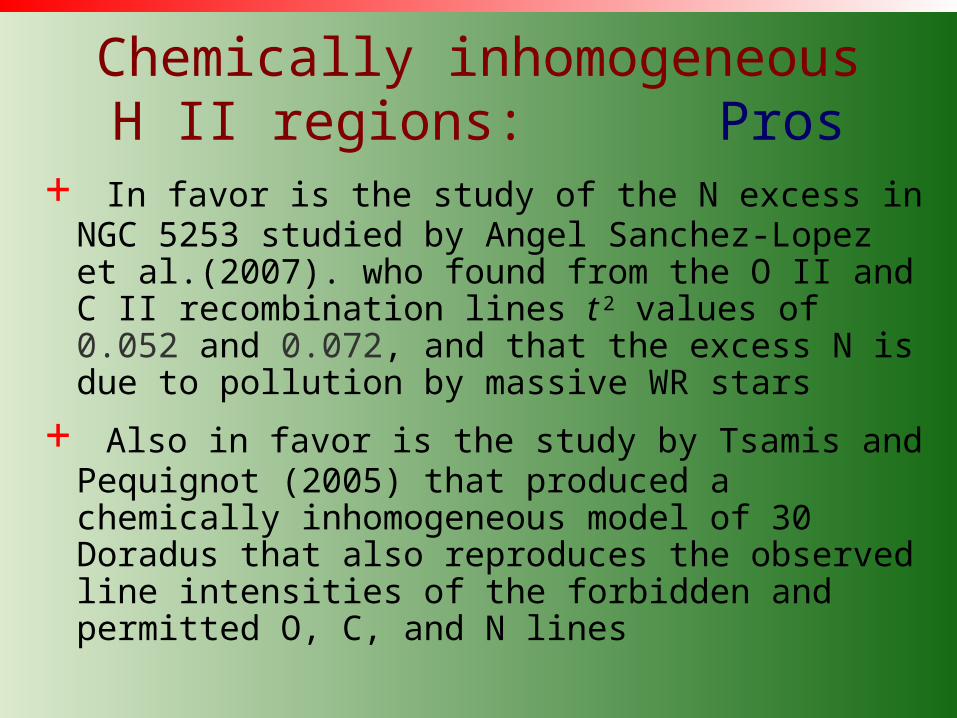
Chemically inhomogeneous H II regions: Pros
+ In favor is the study of the N excess in NGC 5253 studied by Angel Sanchez-Lopez et al.(2007). who found from the O II and C II recombination lines t
2 values of 0.052 and 0.072, and that the excess N is due to pollution by massive WR stars
+ Also in favor is the study by Tsamis and Pequignot (2005) that produced a chemically inhomogeneous model of 30 Doradus that also reproduces the observed line intensities of the forbidden and permitted O, C, and N lines

Chemically inhomogeneous H II regions : Objections
– One of the problems with the model of TP is that the excess abundance of O in the clumps is of a factor of 8, and that it requires an excess of 14 for C. Models of chemical evolution of irregular galaxies by Carigi, Colin, and Peimbert predict that 64% of the C is due to IMS and 36% to massive stars. Therefore for an excess of a factor of 8 in O the TP model should predict an excess of only a factor of 3 for C
– An even larger discrepancy between the model by TP is present in the case of N for which ~80% is due to IMS
– The small dispersion in abundances of H II regions in irregular galaxies and in the abundance gradient in our galaxy are against this idea

Chemically inhomogeneous H II regions: Implications
• The two phases chemically inhomogeneous model by Tsamis and Pequignot and the observations of 30 Doradus of A. Peimbert give: 12 + log O/H = 8.45, while the chemically homogeneous model gives 8.33 for t2 = 0.000 and 8.54 for t2 = 0.033
• Therefore the TP model is closer to the abundances given by the O II lines than to those given by the [O III] lines and the T[O III] temperature
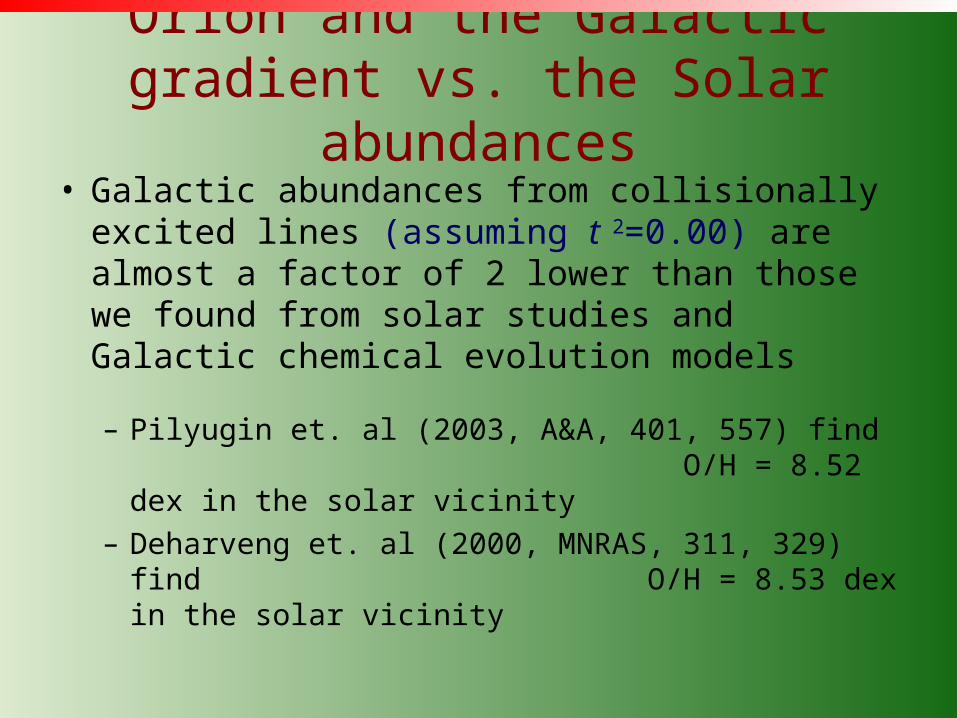
Orion and the Galactic gradient vs. the Solar abundances
• Galactic abundances from collisionally excited lines (assuming t 2=0.00) are almost a factor of 2 lower than those we found from solar studies and Galactic chemical evolution models
– Pilyugin et. al (2003, A&A, 401, 557) find O/H = 8.52 dex in the solar vicinity
– Deharveng et. al (2000, MNRAS, 311, 329) find O/H = 8.53 dex in the solar vicinity
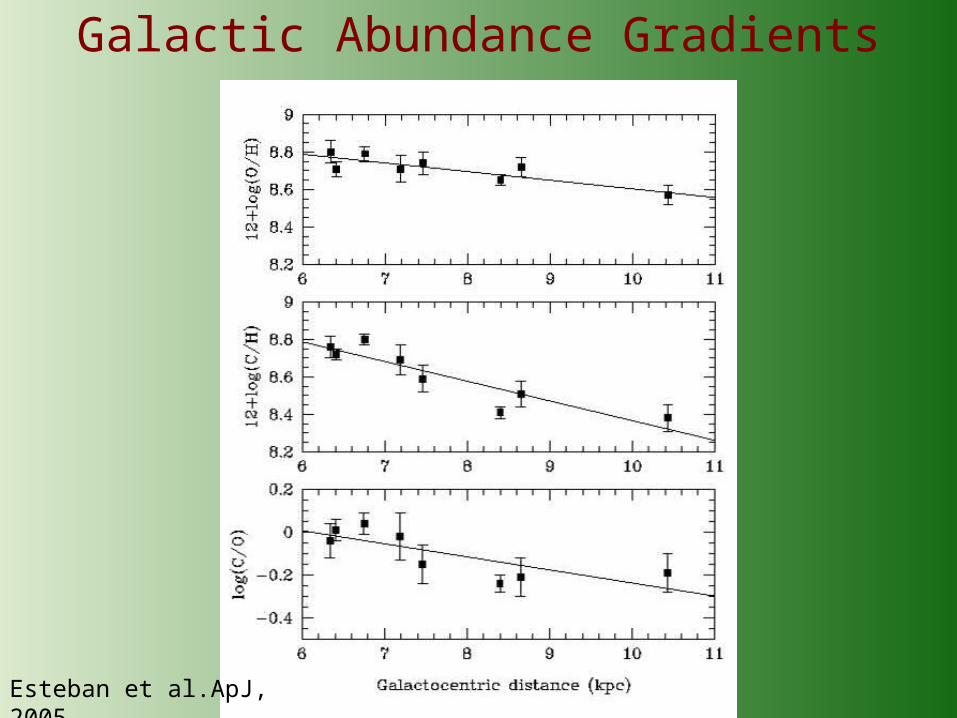
Galactic Abundance Gradients
Esteban et al.ApJ, 2005

Determinations from Recombination Lines (Equivalent to t 2≠0.00)
• We have found the O/H abundance as a function of Galactocentric distance. From observations of H II Regions we found a solar vicinity abundance of 8.79 dex with a gradient of -0.044 dex kpc-1 (Esteban et. al, 2005, ApJ, 618, 95)– The slope of this gradient is similar to those derived from
[O III] and t 2=0.00
• This value is consistent with the O/H = 8.66 dex Solar value derived by Asplund et al. (2005), and with Galactic chemical evolution models that estimate that, in the 4.6 Gy since the Sun was formed, there has been an 0.13 dex increase in oxygen abundance of the ISM (Carigi et al. 2005, ApJ, 623, 213)

Additional Support for a Higher O/H Initial Solar Value
There are two results that indicate that the initial solar abundance was higher than the one adopted by Carigi et al., and that correspondingly the ISM t
2 values are even higher than those derived by Esteban et al. 2005
1) Estimates of the gravitational settling indicate that the original oxygen solar abundance was higher by about 0.05 dex than the present photospheric one, e. g. Piersanti et al. (2007), Bahcall et al. (2006), Basu & Antia (2004)…
2) There is a strong discrepancy between the Asplund et al. 2005 photospheric abundances and the solar interior ones determined from helioseismic measurements that amounts to ~ 0.1 dex
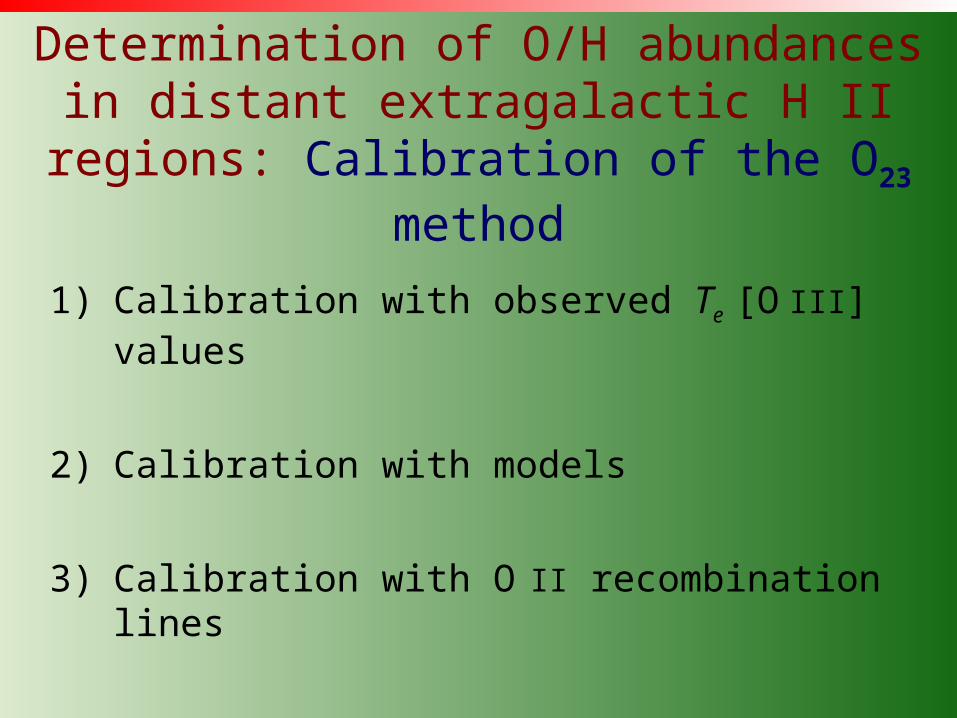
Determination of O/H abundances in distant extragalactic H II regions:
Calibration of the O23 method
1) Calibration with observed Te [O III] values
2) Calibration with models
3) Calibration with O II recombination lines
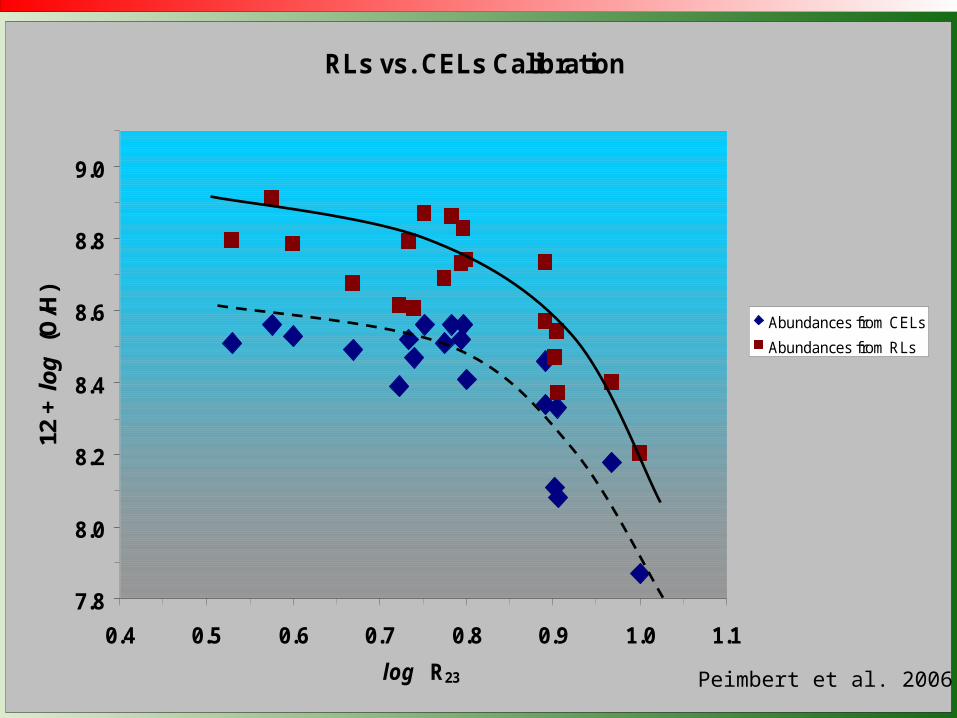
RLs vs. CELs Calibration
7.8
8.0
8.2
8.4
8.6
8.8
9.0
0.4 0.5 0.6 0.7 0.8 0.9 1.0 1.1
log R23
12 +
log
(O/H
)
Abundances from CELs
Abundances from RLs
Peimbert et al. 2006


Which Calibration for O23 ?• The best way to calibrate the O23 method is to use O II
recombination lines to obtain the O/H values
• The O II recombination lines provide abundances that are about 0.2 to 0.3 dex higher than those given by the observed T(4363/5007) values
• The use of the observed T(4363/5007) values provides a lower limit to the O/H values
• Since nebular lines are less sensitive to temperature variations than auroral lines, model calibrations (that adjust the nebular lines) are closer to our calibration than those derived using the observed T(4363/5007) values

Implications of the O23 Calibration
• Our new calibration has implications on the metal production in the Universe and therefore on the star formation rate
• With this calibration and observations at different z values of strong nebular lines it will be possible to study the chemical evolution of the Universe as a whole
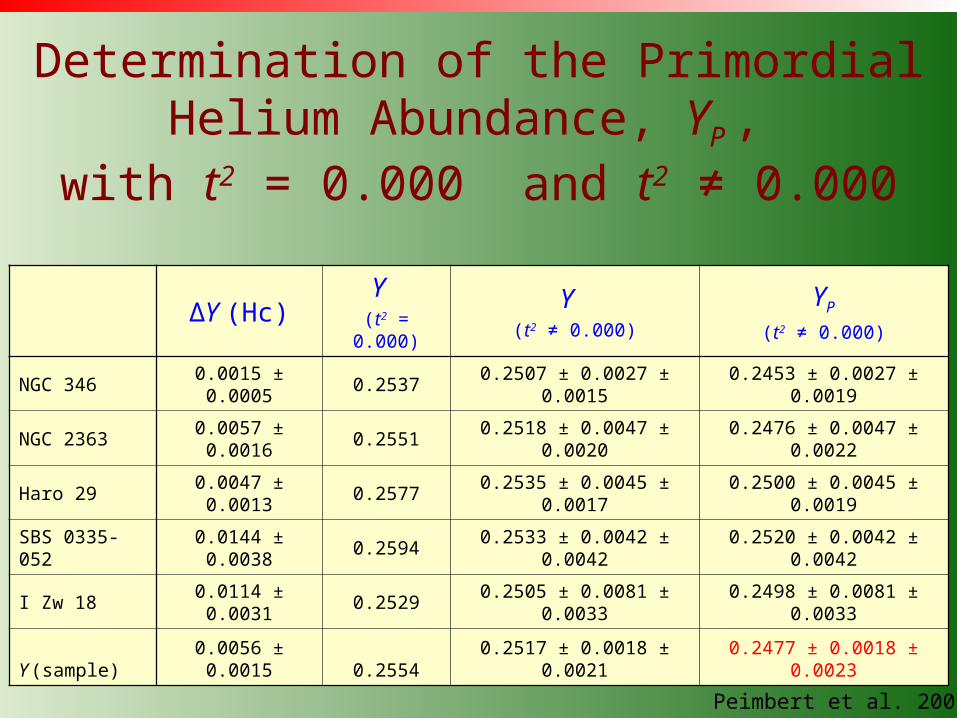
Determination of the Primordial Helium Abundance, YP ,
with t2 = 0.000 and t2 ≠ 0.000
∆Y (Hc)Y
(t2 = 0.000)
Y (t2 ≠ 0.000)
YP
(t2 ≠ 0.000)
NGC 3460.0015 ± 0.0005
0.25370.2507 ± 0.0027 ±
0.00150.2453 ± 0.0027 ±
0.0019
NGC 23630.0057 ± 0.0016
0.25510.2518 ± 0.0047 ±
0.00200.2476 ± 0.0047 ±
0.0022
Haro 290.0047 ± 0.0013
0.25770.2535 ± 0.0045 ±
0.00170.2500 ± 0.0045 ±
0.0019
SBS 0335-052
0.0144 ± 0.0038
0.25940.2533 ± 0.0042 ±
0.00420.2520 ± 0.0042 ±
0.0042
I Zw 180.0114 ± 0.0031
0.25290.2505 ± 0.0081 ±
0.00330.2498 ± 0.0081 ±
0.0033
Y (sample)0.0056 ± 0.0015 0.2554
0.2517 ± 0.0018 ± 0.0021
0.2477 ± 0.0018 ± 0.0023
Peimbert et al. 2007
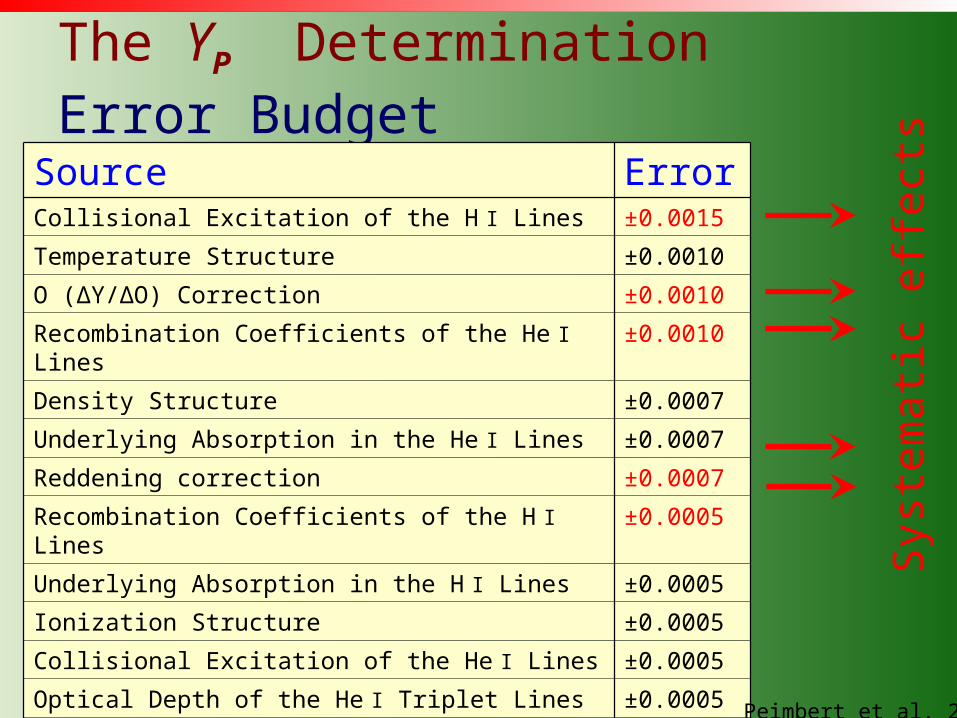
The YP DeterminationError Budget
Source ErrorCollisional Excitation of the H I Lines ±0.0015
Temperature Structure ±0.0010
O (∆Y/∆O) Correction ±0.0010
Recombination Coefficients of the He I Lines ±0.0010
Density Structure ±0.0007
Underlying Absorption in the He I Lines ±0.0007
Reddening correction ±0.0007
Recombination Coefficients of the H I Lines ±0.0005
Underlying Absorption in the H I Lines ±0.0005
Ionization Structure ±0.0005
Collisional Excitation of the He I Lines ±0.0005
Optical Depth of the He I Triplet Lines ±0.0005
He I and H I Line Intensities ±0.0005
Syst
em
ati
c eff
ect
s
Peimbert et al. 2007
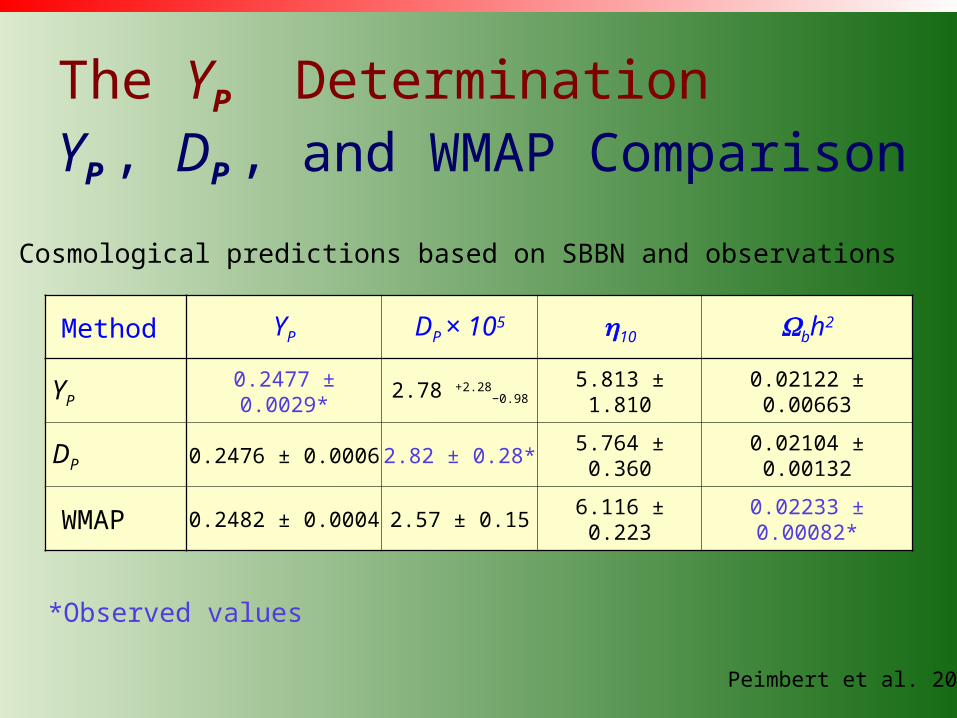
The YP DeterminationYP , DP , and WMAP Comparison
Method YP DP × 105 10 bh2
YP 0.2477 ± 0.0029* 2.78 +2.28−0.98 5.813 ± 1.810 0.02122 ± 0.00663
DP 0.2476 ± 0.0006 2.82 ± 0.28* 5.764 ± 0.360 0.02104 ± 0.00132
WMAP 0.2482 ± 0.0004 2.57 ± 0.15 6.116 ± 0.2230.02233 ± 0.00082*
*Observed values
Cosmological predictions based on SBBN and observations
Peimbert et al. 2007

1/5 Oxygen Abundance of: 30 Doradus
Observational “Direct Method”
(T (4363/5007); t 2=0.00)
A. Peimbert 2003 8.33 -0.21
Chemically Inhomogeneous
Photoionization Model Tsamis & Pequignot 2005 8.45 -0.09
Observational t 2 Method
(Oxygen Recombination Lines)A. Peimbert 2003 8.54 ---

2/5 Oxygen Abundance of: Orion Nebula
Observational “Direct Method”
(T (4363/5007); t 2=0.00)
Osterbrock et al. 1992Pilyugin et al. 2003
Deharveng et al. 2000
8.498.508.51
-0.16-0.15-0.14
Chemically Homogeneous Photoionization
Models Baldwin et al. 1991
Rubin et al. 19918.588.60
-0.07-0.05
Observational t 2 Method
(Oxygen Recombination Lines)Esteban et al. 2004 8.65 ---

3/5 Oxygen Abundance of: Solar Vicinity
Photospheric Solar ValueAsplund et al. 2005 8.65
Present Day ISM based on the Solar Value and Galactic Chemical Evolution Models
Carigi et al. 2005 8.79 +0.02
Present Day ISM based on the Solar Value and Young G Dwarf Stars
Bensby & Feltzing 2005 8.80 +0.03
Present Day ISM based on H II Regions + Dust Content (Mainly Orion)
Esteban et al. 2005 8.77 ---
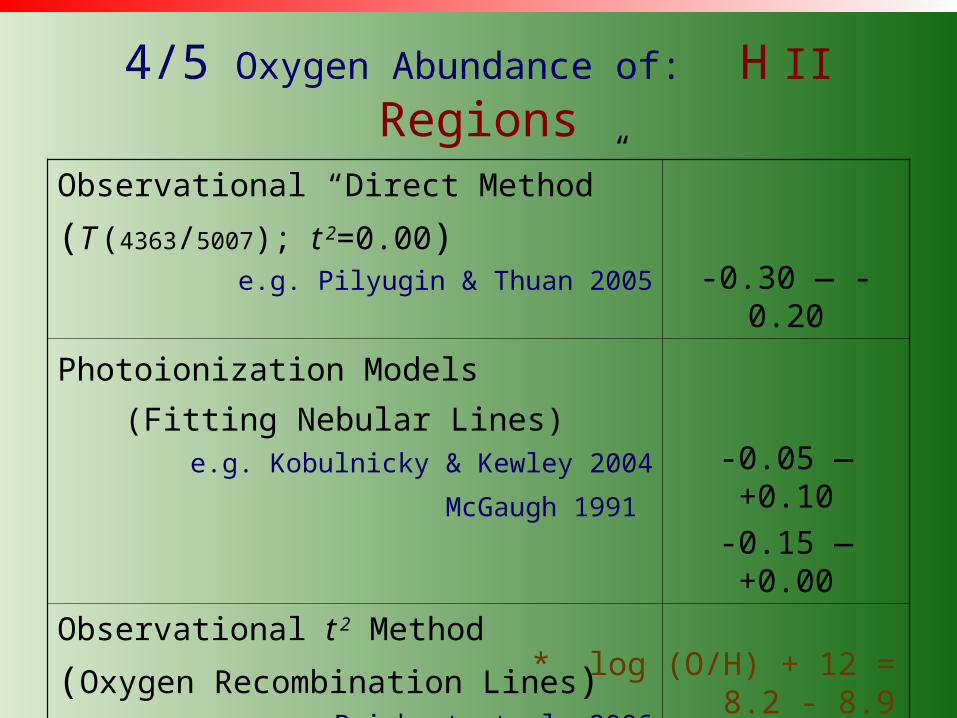
4/5 Oxygen Abundance of: H II Regions
Observational “Direct Method”
(T (4363/5007); t 2=0.00)e.g. Pilyugin & Thuan 2005 -0.30 — -0.20
Photoionization Models (Fitting Nebular Lines)
e.g. Kobulnicky & Kewley 2004
McGaugh 1991
-0.05 — +0.10
-0.15 — +0.00
Observational t 2 Method
(Oxygen Recombination Lines)e.g. Peimbert et al. 2006 ---
* log (O/H) + 12 = 8.2 - 8.9

5/5 Primordial Helium Abundance: H II RegionsObservational “Direct Method”
(T (4363/5007); t2=0.0; Incomplete Error Estimate)Izotov et al. 2007 0.2516 ± 0.0011
Observational “Direct Method”
(T (5007/4363); t2=0.0; Full Error Estimate)Peimbert et al. 2007 0.2523 ± 0.0027
Observational t2 Method
(Balmer continuum and He I lines with MLM) Peimbert et al. 2007 0.2477 ± 0.0029
Primordial Deuterium + SBBNO´Meara et al. 2006 0.2476 ± 0.0006
Wilkinson Microwave Anisotropy Probe + SBBNSpergel et al. 2006 0.2482 ± 0.0004

The EndThe End