Temperature dependent polarization reversal …orbit.dtu.dk/files/119701755/1.4937586.pdfTemperature...
7
General rights Copyright and moral rights for the publications made accessible in the public portal are retained by the authors and/or other copyright owners and it is a condition of accessing publications that users recognise and abide by the legal requirements associated with these rights. • Users may download and print one copy of any publication from the public portal for the purpose of private study or research. • You may not further distribute the material or use it for any profit-making activity or commercial gain • You may freely distribute the URL identifying the publication in the public portal If you believe that this document breaches copyright please contact us providing details, and we will remove access to the work immediately and investigate your claim. Downloaded from orbit.dtu.dk on: Jun 14, 2018 Temperature dependent polarization reversal mechanism in 0.94(Bi1/2Na1/2) TiO3- 0.06Ba(Zr0.02Ti0.98)O3 relaxor ceramics Glaum, Julia; Simons, Hugh; Hudspeth, Jessica; Acosta, Matias; Daniels, John E. Published in: Applied Physics Letters Link to article, DOI: 10.1063/1.4937586 Publication date: 2015 Document Version Publisher's PDF, also known as Version of record Link back to DTU Orbit Citation (APA): Glaum, J., Simons, H., Hudspeth, J., Acosta, M., & Daniels, J. E. (2015). Temperature dependent polarization reversal mechanism in 0.94(Bi1/2Na1/2) TiO3-0.06Ba(Zr0.02Ti0.98)O3 relaxor ceramics. Applied Physics Letters, 107(23), [232906]. DOI: 10.1063/1.4937586
-
Upload
truongxuyen -
Category
Documents
-
view
225 -
download
2
Transcript of Temperature dependent polarization reversal …orbit.dtu.dk/files/119701755/1.4937586.pdfTemperature...

General rights Copyright and moral rights for the publications made accessible in the public portal are retained by the authors and/or other copyright owners and it is a condition of accessing publications that users recognise and abide by the legal requirements associated with these rights.
• Users may download and print one copy of any publication from the public portal for the purpose of private study or research. • You may not further distribute the material or use it for any profit-making activity or commercial gain • You may freely distribute the URL identifying the publication in the public portal
If you believe that this document breaches copyright please contact us providing details, and we will remove access to the work immediately and investigate your claim.
Downloaded from orbit.dtu.dk on: Jun 14, 2018
Temperature dependent polarization reversal mechanism in 0.94(Bi1/2Na1/2) TiO3-0.06Ba(Zr0.02Ti0.98)O3 relaxor ceramics
Glaum, Julia; Simons, Hugh; Hudspeth, Jessica; Acosta, Matias; Daniels, John E.
Published in:Applied Physics Letters
Link to article, DOI:10.1063/1.4937586
Publication date:2015
Document VersionPublisher's PDF, also known as Version of record
Link back to DTU Orbit
Citation (APA):Glaum, J., Simons, H., Hudspeth, J., Acosta, M., & Daniels, J. E. (2015). Temperature dependent polarizationreversal mechanism in 0.94(Bi1/2Na1/2) TiO3-0.06Ba(Zr0.02Ti0.98)O3 relaxor ceramics. Applied PhysicsLetters, 107(23), [232906]. DOI: 10.1063/1.4937586

Temperature dependent polarization reversal mechanism in 0.94(Bi1/2Na1/2)TiO3-0.06Ba(Zr0.02Ti0.98)O3 relaxor ceramicsJulia Glaum, Hugh Simons, Jessica Hudspeth, Matias Acosta, and John E. Daniels Citation: Applied Physics Letters 107, 232906 (2015); doi: 10.1063/1.4937586 View online: http://dx.doi.org/10.1063/1.4937586 View Table of Contents: http://scitation.aip.org/content/aip/journal/apl/107/23?ver=pdfcov Published by the AIP Publishing Articles you may be interested in Electric-field–temperature phase diagram of the ferroelectric relaxor system (1 − x)Bi1/2Na1/2TiO3 − xBaTiO3doped with manganese J. Appl. Phys. 115, 194104 (2014); 10.1063/1.4876746 Role of point defects in bipolar fatigue behavior of Bi(Mg1/2Ti1/2)O3 modified (Bi1/2K1/2)TiO3-(Bi1/2Na1/2)TiO3relaxor ceramics J. Appl. Phys. 115, 154104 (2014); 10.1063/1.4871671 Electromechanical strain and bipolar fatigue in Bi(Mg1/2Ti1/2)O3-(Bi1/2K1/2)TiO3-(Bi1/2Na1/2)TiO3 ceramics J. Appl. Phys. 114, 054102 (2013); 10.1063/1.4817524 Two-stage processes of electrically induced-ferroelectric to relaxor transition in 0.94(Bi1/2Na1/2)TiO3-0.06BaTiO3 Appl. Phys. Lett. 102, 192903 (2013); 10.1063/1.4805360 Incipient piezoelectrics and electrostriction behavior in Sn-doped Bi1/2(Na0.82K0.18)1/2TiO3 lead-free ceramics J. Appl. Phys. 113, 154102 (2013); 10.1063/1.4801893
This article is copyrighted as indicated in the article. Reuse of AIP content is subject to the terms at: http://scitation.aip.org/termsconditions. Downloaded to IP:
192.38.67.115 On: Tue, 12 Jan 2016 19:09:02
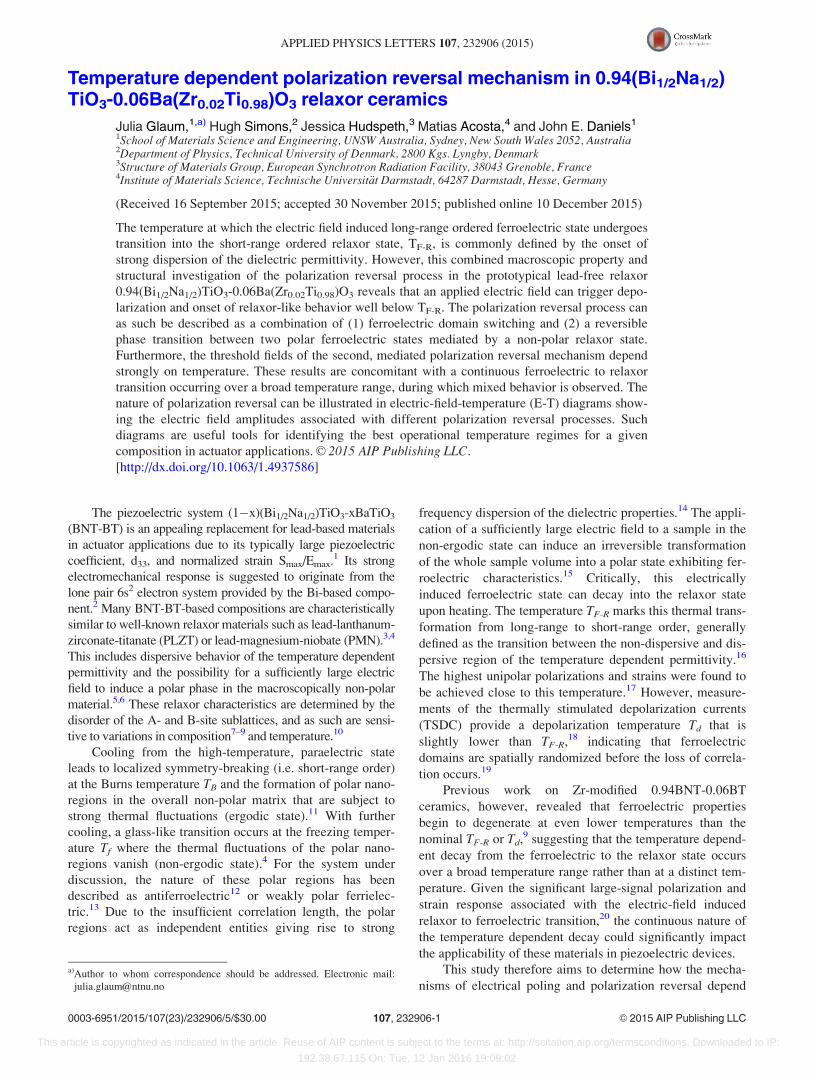
Temperature dependent polarization reversal mechanism in 0.94(Bi1/2Na1/2)TiO3-0.06Ba(Zr0.02Ti0.98)O3 relaxor ceramics
Julia Glaum,1,a) Hugh Simons,2 Jessica Hudspeth,3 Matias Acosta,4 and John E. Daniels1
1School of Materials Science and Engineering, UNSW Australia, Sydney, New South Wales 2052, Australia2Department of Physics, Technical University of Denmark, 2800 Kgs. Lyngby, Denmark3Structure of Materials Group, European Synchrotron Radiation Facility, 38043 Grenoble, France4Institute of Materials Science, Technische Universit€at Darmstadt, 64287 Darmstadt, Hesse, Germany
(Received 16 September 2015; accepted 30 November 2015; published online 10 December 2015)
The temperature at which the electric field induced long-range ordered ferroelectric state undergoes
transition into the short-range ordered relaxor state, TF-R, is commonly defined by the onset of
strong dispersion of the dielectric permittivity. However, this combined macroscopic property and
structural investigation of the polarization reversal process in the prototypical lead-free relaxor
0.94(Bi1/2Na1/2)TiO3-0.06Ba(Zr0.02Ti0.98)O3 reveals that an applied electric field can trigger depo-
larization and onset of relaxor-like behavior well below TF-R. The polarization reversal process can
as such be described as a combination of (1) ferroelectric domain switching and (2) a reversible
phase transition between two polar ferroelectric states mediated by a non-polar relaxor state.
Furthermore, the threshold fields of the second, mediated polarization reversal mechanism depend
strongly on temperature. These results are concomitant with a continuous ferroelectric to relaxor
transition occurring over a broad temperature range, during which mixed behavior is observed. The
nature of polarization reversal can be illustrated in electric-field-temperature (E-T) diagrams show-
ing the electric field amplitudes associated with different polarization reversal processes. Such
diagrams are useful tools for identifying the best operational temperature regimes for a given
composition in actuator applications. VC 2015 AIP Publishing LLC.
[http://dx.doi.org/10.1063/1.4937586]
The piezoelectric system (1�x)(Bi1/2Na1/2)TiO3-xBaTiO3
(BNT-BT) is an appealing replacement for lead-based materials
in actuator applications due to its typically large piezoelectric
coefficient, d33, and normalized strain Smax/Emax.1 Its strong
electromechanical response is suggested to originate from the
lone pair 6s2 electron system provided by the Bi-based compo-
nent.2 Many BNT-BT-based compositions are characteristically
similar to well-known relaxor materials such as lead-lanthanum-
zirconate-titanate (PLZT) or lead-magnesium-niobate (PMN).3,4
This includes dispersive behavior of the temperature dependent
permittivity and the possibility for a sufficiently large electric
field to induce a polar phase in the macroscopically non-polar
material.5,6 These relaxor characteristics are determined by the
disorder of the A- and B-site sublattices, and as such are sensi-
tive to variations in composition7–9 and temperature.10
Cooling from the high-temperature, paraelectric state
leads to localized symmetry-breaking (i.e. short-range order)
at the Burns temperature TB and the formation of polar nano-
regions in the overall non-polar matrix that are subject to
strong thermal fluctuations (ergodic state).11 With further
cooling, a glass-like transition occurs at the freezing temper-
ature Tf where the thermal fluctuations of the polar nano-
regions vanish (non-ergodic state).4 For the system under
discussion, the nature of these polar regions has been
described as antiferroelectric12 or weakly polar ferrielec-
tric.13 Due to the insufficient correlation length, the polar
regions act as independent entities giving rise to strong
frequency dispersion of the dielectric properties.14 The appli-
cation of a sufficiently large electric field to a sample in the
non-ergodic state can induce an irreversible transformation
of the whole sample volume into a polar state exhibiting fer-
roelectric characteristics.15 Critically, this electrically
induced ferroelectric state can decay into the relaxor state
upon heating. The temperature TF-R marks this thermal trans-
formation from long-range to short-range order, generally
defined as the transition between the non-dispersive and dis-
persive region of the temperature dependent permittivity.16
The highest unipolar polarizations and strains were found to
be achieved close to this temperature.17 However, measure-
ments of the thermally stimulated depolarization currents
(TSDC) provide a depolarization temperature Td that is
slightly lower than TF-R,18 indicating that ferroelectric
domains are spatially randomized before the loss of correla-
tion occurs.19
Previous work on Zr-modified 0.94BNT-0.06BT
ceramics, however, revealed that ferroelectric properties
begin to degenerate at even lower temperatures than the
nominal TF-R or Td,9 suggesting that the temperature depend-
ent decay from the ferroelectric to the relaxor state occurs
over a broad temperature range rather than at a distinct tem-
perature. Given the significant large-signal polarization and
strain response associated with the electric-field induced
relaxor to ferroelectric transition,20 the continuous nature of
the temperature dependent decay could significantly impact
the applicability of these materials in piezoelectric devices.
This study therefore aims to determine how the mecha-
nisms of electrical poling and polarization reversal depend
a)Author to whom correspondence should be addressed. Electronic mail:
0003-6951/2015/107(23)/232906/5/$30.00 VC 2015 AIP Publishing LLC107, 232906-1
APPLIED PHYSICS LETTERS 107, 232906 (2015)
This article is copyrighted as indicated in the article. Reuse of AIP content is subject to the terms at: http://scitation.aip.org/termsconditions. Downloaded to IP:
192.38.67.115 On: Tue, 12 Jan 2016 19:09:02

on the temperature-dependent ferroelectric to relaxor transi-
tion. We use a combination of large-signal macroscopic
measurements and in-situ synchrotron x-ray diffraction to
correlate the electric-field-dependent switching and depolari-
zation currents to the changes of the average crystal structure
during electric field induced polarization reversal as a func-
tion of temperature.
Disk shaped ceramic samples of composition 0.94(Bi1/2
Na1/2)TiO3-0.06Ba(Zr0.02Ti0.98)O3 were prepared by conven-
tional solid-state processing.21 The disks were polished to
1200 grit and annealed at 400 �C for 2 h to minimize internal
stresses. Electrodes of silver paste (RS Components,
Smithfield, Australia) were applied and dried at 50 �C.
Temperature dependent polarization, corresponding cur-
rent density, and mechanical strain were measured using an
aixACCT TFAnalyzer2000 system equipped with a Trek
20/20 high voltage amplifier, a SIOS laser interferometer
(SP-S 120/500), and a Eurotherm 2416 PID temperature con-
troller. The measurements were conducted at f¼ 0.1 Hz
using a triangular, bipolar signal at a maximum electric field
of E¼ 4 kV/mm. The measured sample used for macro-
scopic electromechanical measurements was depolarized at
350 �C for 5 min between measurements. To capture the
broad temperature range, where the non-ergodic to ergodic
transition occurs, measurements were taken from room tem-
perature up to 100 �C (TF-R¼ 87 �C for this composition).
The temperature dependent permittivity of an electri-
cally poled sample was measured upon heating with 2 K/min
from room temperature to 450 �C (Fig. 1(d)) using an
Agilent HP4284A impedance analyzer. The excitation volt-
age was 1 V. It is from this data that the transition tempera-
ture TF-R of the given composition was extracted.
High-energy synchrotron XRD was carried out at beam-
line ID15B of the European Synchrotron Radiation Facility.
A beam energy of 87.02 keV was used in conjunction with a
large area detector (Pixium 4700)22 to collect the full diffrac-
tion rings. Samples of the same processing batch and dimen-
sions as used for the electromechanical measurements were
placed in a specifically designed electric field cell.23 Bipolar
triangular electric field waveforms of frequency 0.1 Hz and
electric field amplitude of�4.5 kV/mm were applied to the
samples at various temperatures, while XRD patterns were
collected at a frequency of 2 Hz. The data were radially inte-
grated into 10� azimuthal sections. Further details of the
analysis of electric-field-induced strain using this setup are
provided by Daniels et al.23,24
Figure 1(a) depicts the temperature dependent bipolar
polarization loops measured upon initial electric field applica-
tion from the unpoled state. At room temperature, saturated
loops with a maximum polarization Pmax of �40 lC/cm2 and
a coercive field Ec of �2.7 kV/mm are achieved. While Pmax
reduces only slightly at elevated temperatures up to 100 �C,
both Ec and the remanent polarization Prem reduce consider-
ably. The “pinching” of the polarization loop at elevated tem-
peratures indicates a change to the polarization reversal
mechanism.
Figure 1(b) shows the strain hysteresis loops measured
simultaneously with the polarization. Similar behavior in
terms of maximum strain and Ec is observed with increasing
temperature. The reduced remanent strain leads to a distinct
change in the shape of the strain hysteresis loop and a continu-
ous increase of the unipolar strain up to about 0.3% at 100 �C.
Figure 1(c) depicts the current density corresponding to
the bipolar polarization measurement in Figure 1(a). During
the positive half-cycle, the current density increases slightly
with electric field amplitude up to �2 kV/mm. Beyond this,
a sharp peak (labeled with “I.”) occurs that corresponds to
the strong increase in polarization and strain upon poling.
The average crystallographic structure of unpoled
ceramics with compositions close to BNT-6BT is reportedly
pseudo-cubic with no long-range polar order. However, polar
regions with presumably antiferroelectric ordering may exist
on the local scale embedded in the non-polar matrix.12 Upon
electrical poling, a long-range order and strong crystallo-
graphic texture is established if a sufficiently high electric
FIG. 1. (a) Polarization, (b) strain, and (c) current density hysteresis loops
upon first application of a bipolar electric field starting with positive polarity
(indicated by the arrows in (a)) and measured at three different temperatures
as well as (d) temperature dependent permittivity measured on an electri-
cally poled sample upon heating at four different frequencies.
232906-2 Glaum et al. Appl. Phys. Lett. 107, 232906 (2015)
This article is copyrighted as indicated in the article. Reuse of AIP content is subject to the terms at: http://scitation.aip.org/termsconditions. Downloaded to IP:
192.38.67.115 On: Tue, 12 Jan 2016 19:09:02

field is applied.5,25 This simultaneous structural phase transi-
tion and domain texturing give rise to the poling peak in the
current density hysteresis observed in the first positive half-
cycle in Fig. 1(c). The electric field at which peak I. occurs
shifts only slightly with increasing temperature, whereas its
amplitude decreases.
The polarization reversal process is revealed during the
negative half cycle of the current density loops. At room
temperature, only one, broad current density peak is
observed at �2.8 kV/mm (labelled “II./III.”), in a manner
resembling soft lead-zirconate-titanate (PZT).26 As the tem-
perature is increased to 50 �C, this current density peak
occurs at progressively lower electric field magnitudes, sug-
gesting energetically easier polarization reversal. Between
50 �C and 70 �C, the single peak starts to split in two
(labelled “II.” and “III.”). While peak II. continues to move
to lower electric field offsets, peak III. shifts to higher fields,
reflecting the onset of the “pinching” of the polarization hys-
teresis (Fig. 1(a)). The characteristics of these two current
density peaks have different temperature dependences. The
high-field peak III. maintains a broad shape albeit with
diminished current amplitude and shifts to higher fields with
increased temperature. In contrast, the low-field peak II.
sharpens and shifts to lower fields with increased tempera-
ture. For the highest temperature of 100 �C, peak II. crosses
the 0 kV/mm offset field, occurring under a positive electric
field polarity.
The results indicate that with increasing temperature the
polarization reversal mechanism changes from a one-step to
a two-step process. For ferroelectric ceramics, the polariza-
tion reversal process occurs over a broad distribution of local
electric fields.27,28 This is evidenced in our results by the
broad single current density peak II./III. observed close to
room temperature. Comparing the evolution of the polariza-
tion and strain responses upon electric field reversal, it
becomes clear that the emergence of peak II. in the current
density upon increased temperature is associated with the
loss of remanent polarization and strain, i.e., a de-poling pro-
cess. “Pinching” of the polarization loop can originate from
different mechanisms: (1) time dependent aging,29 (2) a
reversible phase transformation between an antiferroelectric
and a ferroelectric phase affecting the whole sample,30 and
(3) the decay of a long-range ordered ferroelectric state into
a short-range ordered relaxor state.17 Aging as origin of the
observed pinching feature can be ruled out immediately, as
no time dependent changes to the hysteresis loops have been
observed.
In-situ synchrotron diffraction experiments clarify the
structural dynamics of the temperature dependent polariza-
tion reversal process. The electric field dependent profiles of
the (111) and (200) reflections parallel to the electric field
direction are shown in Figure 2 for 25 �C (a), 70 �C (b) and
100 �C (c). At all temperatures, the profiles of both reflec-
tions prior to field application are single peaks consistent
with the expected non-polar, pseudo-cubic average structure.
At 25 �C, the strongest structural changes occurred upon
the initial field application. At low field amplitudes, the pro-
files shift to lower 2h. At a critical threshold field, the (200)
reflection then splits into two components. This response is
captured in the macroscopic data by the sharp current density
peak I. in the first positive half-cycle. Upon electric field re-
versal, the (111) reflection broadens, while the induced low-
angle peak in the (200) reflections progressively reduces in
intensity as the field reaches its minima. The remaining high
angle peak of the (200) reflections increases in intensity con-
tinuously over the same period. Only minor changes to the
profile position and intensity are observed with further cy-
cling. These observations are consistent with an initial
pseudo-cubic to tetragonal transformation, however, on
polarization reversal and subsequent cycling, the sample
appears to be mixed phase rhombohedral and tetrago-
nal.6,31,32 Detailed scans of the (111) and (200) reflections in
the virgin state and during high field application are given in
supplementary Figure S1.33
At 70 �C, the initial field-induced transformation results
in a lowering of the intensity, increases in width, and shifts
in both the (111) and (200) peaks. This behavior is consistent
with an induced mixed tetragonal and rhombohedral symme-
try with strong domain texturing. The broad, low-intensity
profiles associated with the field-induced structure remain
FIG. 2. In-situ diffraction measure-
ments taken during application of a
bipolar electric field, (a) schematic of
the applied electric field signal over
time, (111) and (200) reflections
recorded at (a) 25 �C, (b) 70 �C, and
(c) 100 �C.
232906-3 Glaum et al. Appl. Phys. Lett. 107, 232906 (2015)
This article is copyrighted as indicated in the article. Reuse of AIP content is subject to the terms at: http://scitation.aip.org/termsconditions. Downloaded to IP:
192.38.67.115 On: Tue, 12 Jan 2016 19:09:02

until the electric field is reversed. At small negative fields,
the structure briefly returns to the initial pseudo-cubic state
(i.e., non-polar average structure) before being re-
transformed into the strongly textured mixed phase polar
structure. This process appears to be reversible and is corre-
lated to the onset of the peak splitting in the current density
and the pinching of the polarization hysteresis around 70 �C.
Similar features have been observed for an antiferroelec-
tric ceramic and were related to an electric field induced
transition from a ferroelectric to an antiferroelectric state
triggered by the volume contraction occurring at the applica-
tion of the coercive field with reverse polarity.34 However,
the association of the polarization hysteresis pinching with
the transformation between a polar average structure and a
non-polar average structure highlights that the underlying
mechanism is not based on a ferroelectric-antiferroelectric
transformation (which is a transformation that involves split-
ting of the diffraction peaks due to distortions from the aver-
age cubic structure), but rather related to the relaxor
characteristics of the material.
At 100 �C, the stability of the induced polar phases
reduces further (Figure 2(d)). The electric field range where
the (111) and (200) reflection profiles show broadening char-
acteristics of an induced mixed-phase structure shrinks con-
siderably, and the degradation into the non-polar state occurs
before the field magnitude reaches 0 kV/mm for both the
positive and negative half-cycles. This is consistent with the
loss of remanent polarization and strain, and the emergence
of a current density peak upon reduction of the electric field
strength but before the field polarity is reversed.
In Figure 3, the temperature dependent electric field val-
ues associated with the three current density peaks (Fig.
1(c)) are summarized in an electric field-temperature (E-T)
diagram.15 The transition temperature TF-R determined from
temperature dependent permittivity measurements is marked
for reference. The diagram shows that the temperature at
which the ferroelectric-to-relaxor decay occurs spontane-
ously (i.e., the electric field associated with the de-poling
peak II. switches from negative to positive polarity) is simi-
lar to TF-R extracted from the permittivity measurements.
This is expected as the permittivity measurement was con-
ducted without the application of a large offset field and
reflects the pure temperature dependent behavior. However,
the temperature at which the current density peaks start to
split is found to be about 25 �C lower than TF-R, highlighting
the impact of an electric bias field on the characteristics of
the ferroelectric-to-relaxor transition.
It is important to note that the processes probed by
polarization and current density measurements occur on a
macroscopic scale and do not allow quantitative conclusions
about structural changes. In contrast, the temperature TF-R
extracted from temperature dependent permittivity measure-
ments is associated with the transition from a polar long-
range order to a non-polar relaxor structure and is thus corre-
lated to structural change. The depolarization temperature Td
at which the ferroelectric polarization vanishes is usually
found to be just slightly lower than TF-R,18 indicating a close
relation between macroscopic depolarization and transition
into the relaxor state. However, in the current study, the
observed difference between TF-R and the temperature
related to the appearance of the double peaks in the current
density (Figure 1(c)) suggests that the depolarization process
can be triggered by an electric field of reverse polarity al-
ready at temperatures well below the structural transition
temperature TF-R.
It is reported that the polarization reversal process in
lead-based relaxors can be described as a transition from one
long-range order state to another upon electric field reversal,
occurring through a nano-domain state without long-range
order triggered by low electric fields. The occurrence of
depolarization fields developing at the phase boundaries has
been suggested as a trigger for “backswitching” into the
nano-domain state.35 Most interestingly, this phenomenon
was also found to exist well below the transition temperature
TF-R.36
The temperature independence of the poling peak I.
hints at the transitional changes occurring in the polarization
reversal process upon temperature increase. The critical elec-
tric field required to trigger the transformation from the
relaxor into the ferroelectric state appears to be only slightly
dependent on temperature (Figure 3). If we assume that the
entire sample is transformed into a relaxor-like state upon
electric field reversal, we would expect to see the same tem-
perature independent behavior of the re-poling peak position
(peak III.). Instead, a continuous shift to higher electric fields
with increasing temperature is observed, reaching similar
absolute values to the electric field amplitude associated
with poling peak I. for temperatures above 85 �C. This
behavior, as observed in the medium temperature regime
(�50–80 �C), can be rationalized as a combination of both
(1) a conventional ferroelectric domain reversal processes
that may involve a combination of 180� and non-180�
switching steps and (2) polarization reversal through an in-
termediate relaxor phase. For temperatures higher than TF-R,
the reversal mechanism becomes dominated by the phase
transformation-based process. The de-polarization behavior
and as such the ferroelectric-to-relaxor transformation appear
to be strongly dependent on both temperature and electric
field, making it a kinetically controlled process that presum-
ably shows strong dispersive behavior. In the present study,
FIG. 3. Electric field-temperature (E-T) diagram showing the electric field
corresponding to the peak positions of the current density for several temper-
atures. TF-R¼ 87 �C as determined from a temperature dependent permittiv-
ity measurement is marked with “X.”
232906-4 Glaum et al. Appl. Phys. Lett. 107, 232906 (2015)
This article is copyrighted as indicated in the article. Reuse of AIP content is subject to the terms at: http://scitation.aip.org/termsconditions. Downloaded to IP:
192.38.67.115 On: Tue, 12 Jan 2016 19:09:02
both phase transformation and domain switching processes
related to the depolarization occur simultaneously such that
the kinetics of each process cannot be resolved explicitly. It
is known that polarization switching is a rather slow pro-
cess.28 In contrast, the abrupt changes in current density and
crystallographic structure observed in the present study indi-
cate that the phase transition into the relaxor state occurs
quite rapid suggesting faster kinetics compared to the do-
main switching mechanism. This speculation is supported by
the finding that the phase transformation in BNT-based
relaxor materials gets suppressed if the frequency of the
applied electric field is too low,37 indicating vice versa that
the phase transformation can still occur at higher frequencies
for which domain switching already gets delayed.
In contrast, the poling process starting from a pure
relaxor phase lacks this kind of dependency in the observed
temperature range and occurs as soon as a threshold field is
exceeded. This conclusion is further supported by the dif-
fraction data, where the electric field at which the initial
structural change (i.e., the splitting of the (200) reflection)
occurs remains approximately constant across the measured
temperature range.
The mechanism of polarization reversal depends signifi-
cantly on the stability of the electric-field-induced ferroelec-
tric phase. At low temperatures, the polarization reversal
process is governed by ferroelectric domain switching. With
increasing temperature, the ferroelectric phase destabilizes
and polarization reversal starts to occur through a double
phase transition through a non-polar relaxor state. The decay
into the relaxor state is not an instantaneous process but
occurs already at temperatures approximately 25 �C lower
than TF-R. Below TF-R, small electric fields of reverse polar-
ity are needed to trigger the transition into the non-polar
relaxor state, which might be associated to the presence of
depolarization fields reducing the stability of the ferroelectric
phase. Even though the commonly reported TF-R and Td, as
extracted from small signal permittivity and piezoelectric
coefficient measurements, give a good indication of the
working temperature regime of a certain composition, the
dynamics of the depolarization process makes it necessary to
create E-T diagrams from large signal measurements to iden-
tify the best temperature regimes for actuator applications.
We are grateful to the European Synchrotron Radiation
Facility for the provision of experimental beamtime. This
work was supported through the Australian Research
Council Project Nos. DE120102644 and DP120103968. H.S.
acknowledges support from an individual postdoctoral grant
from the Danish Council of Independent Research, DFF-
FTP.
1J. R€odel, W. Jo, K. T. P. Seifert, E.-M. Anton, T. Granzow, and D. Damjanovic,
J. Am. Ceram. Soc. 92, 1153 (2009).
2D. Sch€utz, M. Deluca, W. Krauss, A. Feteira, T. Jackson, and K. Reichmann,
Adv. Funct. Mater. 22, 2285 (2012).3P. M. Gehring, J. Adv. Dielectr. 02, 1241005 (2012).4A. A. Bokov and Z.-G. Ye, J. Mater. Sci. 41, 31 (2006).5J. E. Daniels, W. Jo, J. R€odel, and J. L. Jones, Appl. Phys. Lett. 95, 32904
(2009).6H. Simons, J. Daniels, W. Jo, R. Dittmer, A. Studer, M. Avdeev, J. R€odel,
and M. Hoffman, Appl. Phys. Lett. 98, 082901 (2011).7S.-T. Zhang, A. B. Kounga, E. Aulbach, T. Granzow, W. Jo, H.-J. Kleebe,
and J. R€odel, J. Appl. Phys. 103, 034107 (2008).8E. A. Patterson and D. P. Cann, J. Am. Ceram. Soc. 95, 3509 (2012).9J. Glaum, H. Simons, M. Acosta, and M. Hoffman, J. Am. Ceram. Soc. 96,
2881 (2013).10W. Jo, S. Schaab, E. Sapper, L. A. Schmitt, H.-J. Kleebe, A. J. Bell, and J.
R€odel, J. Appl. Phys. 110, 074106 (2011).11G. Burns and F. H. Dacol, Phys. Rev. B 28, 2527 (1983).12C. Ma, X. Tan, E. Dul’kin, and M. Roth, J. Appl. Phys. 108, 104105
(2010).13X. Tan, C. Ma, J. Frederick, S. Beckman, and K. G. Webber, J. Am.
Ceram. Soc. 94, 4091 (2011).14A. A. Bokov and Z. Ye, Solid State Commun. 116, 105 (2000).15V. Bobnar, Z. Kutnjak, R. Pirc, and A. Levstik, Phys. Rev. B 60, 6420
(1999).16Z.-G. Ye and H. Schmid, Ferroelectrics 145, 83 (1993).17W. Jo, R. Dittmer, M. Acosta, J. Zang, C. Groh, E. Sapper, K. Wang, and
J. R€odel, J. Electroceram. 29, 71 (2012).18E. Sapper, S. Schaab, W. Jo, T. Granzow, and J. R€odel, J. Appl. Phys. 111,
014105 (2012).19W. Jo, J. Daniels, D. Damjanovic, W. Kleemann, and J. R€odel, Appl.
Phys. Lett. 102, 192903 (2013).20S.-T. Zhang, A. B. Kounga, E. Aulbach, W. Jo, T. Granzow, H.
Ehrenberg, and J. R€odel, J. Appl. Phys. 103, 034108 (2008).21M. Acosta, J. Zang, W. Jo, and J. R€odel, J. Eur. Ceram. Soc. 32, 4327
(2012).22J. E. Daniels and M. Drakopoulos, J. Synchrotron Radiat. 16, 463 (2009).23J. E. Daniels, A. Pramanick, and J. L. Jones, IEEE Trans. Ultrason.,
Ferroelectr., Freq. Control 56, 1539 (2009).24J. E. Daniels, W. Jo, J. R€odel, V. Honkim€aki, and J. L. Jones, Acta Mater.
58, 2103 (2010).25C. Ma, H. Guo, S. P. Beckman, and X. Tan, Phys. Rev. Lett. 109, 107602
(2012).26K. B. Chong, F. Guiu, and M. J. Reece, J. Appl. Phys. 103, 014101
(2008).27S. Zhukov, Y. A. Genenko, and H. von Seggern, J. Appl. Phys. 108,
014106 (2010).28Y. A. Genenko, S. Zhukov, S. V. Yampolskii, J. Sch€utrumpf, R. Dittmer,
W. Jo, H. Kungl, M. J. Hoffmann, and H. von Seggern, Adv. Funct. Mater.
22, 2058 (2012).29Y. A. Genenko, J. Glaum, M. J. Hoffmann, and K. Albe, Mater. Sci. Eng.,
B 192, 52 (2015).30W.-H. Chan, H. Chen, and E. V. Colla, Appl. Phys. Lett. 82, 2314
(2003).31H. Simons, J. Glaum, J. E. Daniels, A. J. Studer, A. Liess, J. R€odel, and M.
Hoffman, J. Appl. Phys. 112, 044101 (2012).32W. Jo, J. E. Daniels, J. L. Jones, X. Tan, P. A. Thomas, D. Damjanovic,
and J. R€odel, J. Appl. Phys. 109, 014110 (2011).33See supplementary material at http://dx.doi.org/10.1063/1.4937586 for dif-
fraction peak profiles around the pseudo-cubic (111) and (200) in the ini-
tial and first high field states for (a) 70 �C and (b) 100 �C.34X. Tan, J. Frederick, C. Ma, W. Jo, and J. R€odel, Phys. Rev. Lett. 105,
255702 (2010).35V. Y. Shur, E. L. Rumyantsev, G. G. Lomakin, O. V. Yakutova, D. V.
Pelegov, A. Sternberg, and M. Kosec, Ferroelectrics 314, 245 (2005).36S. Schaab and T. Granzow, Appl. Phys. Lett. 97, 132902 (2010).37A. J. Royles, A. J. Bell, J. E. Daniels, S. J. Milne, and T. P. Comyn, Appl.
Phys. Lett. 98, 182904 (2011).
232906-5 Glaum et al. Appl. Phys. Lett. 107, 232906 (2015)
This article is copyrighted as indicated in the article. Reuse of AIP content is subject to the terms at: http://scitation.aip.org/termsconditions. Downloaded to IP:
192.38.67.115 On: Tue, 12 Jan 2016 19:09:02