Temperature Dependent Equilibrium Native to Unfolded ... · Temperature Dependent Equilibrium...
11
rXXXX American Chemical Society A dx.doi.org/10.1021/ja111009s | J. Am. Chem. Soc. XXXX, XXX, 000–000 ARTICLE pubs.acs.org/JACS Temperature Dependent Equilibrium Native to Unfolded Protein Dynamics and Properties Observed with IR Absorption and 2D IR Vibrational Echo Experiments Jean K. Chung, † Megan C. Thielges, † Sarah E. J. Bowman, ‡ Kara L. Bren, ‡ and M. D. Fayer* ,† † Department of Chemistry, Stanford University, Stanford, California 94305, United States ‡ Department of Chemistry, University of Rochester, Rochester, New York 14627, United States b S Supporting Information I. INTRODUCTION Understanding protein folding has been recognized as one of the most important problems in biology and biochemistry. Many experiments and theoretical studies on the structure and folding of proteins have been focused on the native structure rather than the unfolded state. This is not only due to the obvious relevance of the native state protein to its biological functions but also because of difficulties associated with characterizing proteins under unfolding conditions, where they can exist in heteroge- neous distributions of many conformations. 1,2 The properties of unfolded proteins play crucial roles in folding and stability, transport across membranes, and proteolysis and protein turnover. 1 With advances in analytical techniques such as multidimen- sional nuclear magnetic resonance, 3,4 hydrogendeuterium exchange, 5 small-angle X-ray scattering, 6,7 fluorescence, 8 single molecule spectroscopy, 9 and time-resolved visible photon echo spectroscopy, 10 light has been shed on the characteristics of the unfolded state. Although it was once thought that when a protein denatures it becomes a random coil, 11 data using these new techniques, and theories developed along with them, have shown that in many cases proteins retain residual secondary and tertiary structure even under severely denaturing conditions. 1,7,12 Furthermore, studies have shown that mutations as well as varying denaturing conditions influence the nature of unfolded proteins. Because of its inherent heterogeneity, the ensemble of protein structures that exist in the unfolded state are described in terms of statistics. 13 The concept and language of energy land- scapes, the notion that the protein can assume a large number of nearly isoenergetic conformations around local energy minima, are useful for describing the unfolded states and their dynamics. 14 Owing to its availability, simplicity, robustness, and biological importance, the monomeric, globular, and water-soluble cyto- chrome c (cyt c) has been employed in many protein folding studies, both experimental 10,15,16 and theoretical. 17,18 In this study, we have used a mutated cyt c 552 from thermophilic bacteria, Hydrogenobacter thermophilus (cyt c Ht-M61A). The crystal structure of wild-type cyt c Ht is depicted in Figure 1. 19 Received: December 18, 2010 ABSTRACT: Dynamic and structural properties of carbonmonoxy (CO)-coordinated cytochrome c 552 from Hydrogenobacter thermophilus (Ht-M61A) at different temperatures under thermal equilibrium con- ditions were studied with infrared absorption spectroscopy and ultrafast two-dimensional infrared (2D IR) vibrational echo experiments using the heme-bound CO as the vibrational probe. Depending on the temperature, the stretching mode of CO shows two distinct bands corresponding to the native and unfolded proteins. As the temperature is increased from low temperature, a new absorption band for the unfolded protein grows in and the native band decreases in amplitude. Both the temperature-dependent circular dichroism and the IR absorption area ratio R A (T), defined as the ratio of the area under the unfolded band to the sum of the areas of the native and unfolded bands, suggest a two-state transition from the native to the unfolded protein. However, it is found that the absorption spectrum of the unfolded protein increases its inhomogeneous line width and the center frequency shifts as the temperature is increased. The changes in line width and center frequency demonstrate that the unfolding does not follow simple two-state behavior. The temperature-dependent 2D IR vibrational echo experiments show that the fast dynamics of the native protein are virtually temperature independent. In contrast, the fast dynamics of the unfolded protein are slower than those of the native protein, and the unfolded protein fast dynamics and at least a portion of the slower dynamics of the unfolded protein change significantly, becoming faster as the temperature is raised. The temperature dependence of the absorption spectrum and the changes in dynamics measured with the 2D IR experiments confirm that the unfolded ensemble of conformers continuously changes its nature as unfolding proceeds, in contrast to the native state, which displays a temperature-independent distribution of structures.
Transcript of Temperature Dependent Equilibrium Native to Unfolded ... · Temperature Dependent Equilibrium...

rXXXX American Chemical Society A dx.doi.org/10.1021/ja111009s | J. Am. Chem. Soc. XXXX, XXX, 000–000
ARTICLE
pubs.acs.org/JACS
Temperature Dependent Equilibrium Native to Unfolded ProteinDynamics and Properties Observed with IR Absorption and 2D IRVibrational Echo ExperimentsJean K. Chung,† Megan C. Thielges,† Sarah E. J. Bowman,‡ Kara L. Bren,‡ and M. D. Fayer*,†
†Department of Chemistry, Stanford University, Stanford, California 94305, United States‡Department of Chemistry, University of Rochester, Rochester, New York 14627, United States
bS Supporting Information
I. INTRODUCTION
Understanding protein folding has been recognized as one ofthe most important problems in biology and biochemistry. Manyexperiments and theoretical studies on the structure and foldingof proteins have been focused on the native structure rather thanthe unfolded state. This is not only due to the obvious relevanceof the native state protein to its biological functions but alsobecause of difficulties associated with characterizing proteinsunder unfolding conditions, where they can exist in heteroge-neous distributions of many conformations.1,2 The properties ofunfolded proteins play crucial roles in folding and stability,transport across membranes, and proteolysis and proteinturnover.1
With advances in analytical techniques such as multidimen-sional nuclear magnetic resonance,3,4 hydrogen�deuteriumexchange,5 small-angle X-ray scattering,6,7 fluorescence,8 singlemolecule spectroscopy,9 and time-resolved visible photon echospectroscopy,10 light has been shed on the characteristics of theunfolded state. Although it was once thought that when a proteindenatures it becomes a random coil,11 data using these newtechniques, and theories developed along with them, have shown
that in many cases proteins retain residual secondary and tertiarystructure even under severely denaturing conditions.1,7,12
Furthermore, studies have shown that mutations as well asvarying denaturing conditions influence the nature of unfoldedproteins. Because of its inherent heterogeneity, the ensemble ofprotein structures that exist in the unfolded state are described interms of statistics.13 The concept and language of energy land-scapes, the notion that the protein can assume a large numberof nearly isoenergetic conformations around local energyminima, are useful for describing the unfolded states and theirdynamics.14
Owing to its availability, simplicity, robustness, and biologicalimportance, the monomeric, globular, and water-soluble cyto-chrome c (cyt c) has been employed in many protein foldingstudies, both experimental10,15,16 and theoretical.17,18 In thisstudy, we have used a mutated cyt c552 from thermophilicbacteria, Hydrogenobacter thermophilus (cyt c Ht-M61A). Thecrystal structure of wild-type cyt c Ht is depicted in Figure 1.19
Received: December 18, 2010
ABSTRACT: Dynamic and structural properties of carbonmonoxy(CO)-coordinated cytochrome c552 fromHydrogenobacter thermophilus(Ht-M61A) at different temperatures under thermal equilibrium con-ditions were studied with infrared absorption spectroscopy and ultrafasttwo-dimensional infrared (2D IR) vibrational echo experiments usingthe heme-bound CO as the vibrational probe. Depending on thetemperature, the stretching mode of CO shows two distinct bandscorresponding to the native and unfolded proteins. As the temperatureis increased from low temperature, a new absorption band for theunfolded protein grows in and the native band decreases in amplitude. Both the temperature-dependent circular dichroism and theIR absorption area ratio RA(T), defined as the ratio of the area under the unfolded band to the sum of the areas of the native andunfolded bands, suggest a two-state transition from the native to the unfolded protein. However, it is found that the absorptionspectrum of the unfolded protein increases its inhomogeneous line width and the center frequency shifts as the temperature isincreased. The changes in line width and center frequency demonstrate that the unfolding does not follow simple two-state behavior.The temperature-dependent 2D IR vibrational echo experiments show that the fast dynamics of the native protein are virtuallytemperature independent. In contrast, the fast dynamics of the unfolded protein are slower than those of the native protein, and theunfolded protein fast dynamics and at least a portion of the slower dynamics of the unfolded protein change significantly, becomingfaster as the temperature is raised. The temperature dependence of the absorption spectrum and the changes in dynamics measuredwith the 2D IR experiments confirm that the unfolded ensemble of conformers continuously changes its nature as unfoldingproceeds, in contrast to the native state, which displays a temperature-independent distribution of structures.

B dx.doi.org/10.1021/ja111009s |J. Am. Chem. Soc. XXXX, XXX, 000–000
Journal of the American Chemical Society ARTICLE
The replacement of the axial methionine M61 by alanineallows the ligation of carbon monoxide (CO) to the heme-centeriron.20,21 TheCO serves as the vibrational reporter in the infrared(IR) studies described here.Ht-M61A cyt c is very well suited forthermal unfolding experiments as it shows remarkable stabilityand reversibility under severe thermal denaturing conditions.22�25
Also important is the fact that the prosthetic heme group, the siteof the protein’s functional activities and the location of thevibrational probe, is covalently bound to the protein via twothioether linkages (Figure 1). This ensures that the hemecontaining the vibrational probe does not dissociate from theprotein upon denaturation. The stretching mode of the COprobe has been used in numerous IR studies in various hemeproteins such asmyoglobin, hemoglobin, horseradish peroxidase,and cytochrome P450, due to its exquisite sensitivity to the localenvironment and the strong vibrational signal it produces in aspectroscopic region in aqueous solution that has a relatively lowwater background absorption.26
In this paper, we describe experiments that examine the nativeprotein and its unfolded states under equilibrium conditions atvarious temperatures using IR experiments. Time-independentlinear IR absorption, as well as time-dependent ultrafast two-dimensional infrared (2D IR) vibrational echo spectroscopy,were employed to investigate the steady-state and ultrafasttime scale behavior of the protein under increasingly severethermal denaturing conditions. These IR methods have beenestablished as sensitive tools for probing fast protein dynamicson time scales that are inaccessible by other techniques.27,28
Previous studies using 2D IR vibrational echoes on heme proteinsinvestigated the dynamics of native proteins,28�30 enzyme�sub-strate interactions,31,32 dynamic changes associated with variousmutations,33,34 switching between protein substates,35 and chemicaldenaturation.21
The CO absorption spectrum of the native protein shows asingle peak at room temperature. At the onset temperature forunfolding, a new band at lower frequency appears and grows in asthe temperature is further increased. As the unfolded band grows
in, the native band decreases in amplitude. The ratio, RA(T),area of the unfolded band divided by the sum of the areas of thenative and unfolded bands plotted against temperature has an Sshape that closely resembles the temperature dependentplot of the circular dichroism (CD) data. Both the IR area andthe CD data can be fit to the standard two-state thermodynamicmodel.36 However, the unfolded IR absorption band providesadditional information. As the temperature is increased, theunfolded line width increases and the peak position shifts tolower frequency, but there are no changes in the width orposition of the native band. The increase in line width of theunfolded peak is caused by increased inhomogeneous broad-ening as verified by the 2D IR spectroscopy. The increase ininhomogeneous line width demonstrates that the number ofprotein conformational structures grows as the temperatureis elevated. This behavior is clearly not simple two-stateunfolding.
2D IR vibrational echo spectroscopy measures spectral diffu-sion, that is, the time-dependent changes in the frequencies of theIR chromophores, whichmanifests as time-dependent changes inthe shape of the 2D IR spectrum. Spectral diffusion is directlyrelated to the time dependence of protein structural changes.These line shape changes are directly related to the frequency-frequency correlation function (FFCF), which yields informa-tion about the rate at which the protein samples differentstructural configurations. The FFCF separates the ultrafastdynamics into three regimes:motionally narrowed homogeneousdynamics, intermediate structural evolution (0.3 to ∼100 ps),and structural changes that are so slow that they are outside ofthe experimental time window (>100 ps). It was found that thehomogeneous component is sensitive only to the temperaturechange and is independent of whether the protein is folded orunfolded. The longer time scale dynamics show distinct trendsfor the native versus unfolded configurations. The unfoldedprotein displays dynamics that become increasingly fast as thetemperature increases. In contrast, the dynamics of the nativestate show no changes with temperature. Like the increase in theinhomogeneous line width of the unfolded absorption band, theincrease in the rate of structural dynamics as the temperatureincreases demonstrates that the unfolded protein undergoes acontinuous unfolding process. These findings are consistent withthe concept of variable denatured states, which have beendescribed theoretically and investigated experimentally.1,37,38 Theobserved temperature dependence of the unfolded proteindynamics is not consistent with a simple two-state model.
II. METHODS
A. Sample Preparation.Ht-M61A cyt c552 was expressed in E. colifollowing procedures that have been described previously.39 2 mg ofprotein was dissolved in 3 M guanidine hydrochloride (GuHCl),100 mM sodium phosphate (pD 7) in deuterium oxide (D2O) to obtaina protein concentration of approximately 10 mM. GuHCl is necessary toprevent aggregation of the sample at higher temperatures and to give afully denatured protein in the accessible temperature range. To ligateCO to the protein heme, 5 equiv of sodium dithionite were added to theprotein solution to reduce the iron from Fe(III) to Fe(II), and thesolution was stirred in a CO atmosphere for 20 min. The solution wasleft in the CO atmosphere for another 20 min to ensure the completionof the CO ligation. 30 μL of the sample was then pipetted onto a 3 mmthick calcium fluoride (CaF2) window, and sandwiched by anotherwindow with a 50 μm thick Teflon spacer in between in a custom-built
Figure 1. The crystal structure of wild-type cytochrome c552 fromHydrogenobacter thermophilus (PDB 1YNR). The sulfur atom of Met61occupies the sixth coordination site of the heme iron in the wild type. Inthe experiments, a Met61Ala mutation allowed the coordination ofcarbon monoxide in its place. The heme is covalently bound to theprotein by two thioether linkages, tethering the vibrational probe to theprotein even when it is unfolded.

C dx.doi.org/10.1021/ja111009s |J. Am. Chem. Soc. XXXX, XXX, 000–000
Journal of the American Chemical Society ARTICLE
copper sample cell. The optical density of the CO stretching band at1973 cm�1 was approximately 0.07.
Detailed tests were performed to demonstrate that aggregation of theprotein did not occur at the experimental sample concentration of10 mM over the full range of temperatures studied. The temperature-dependent IR absorption spectrum of the amide I band of the samplewas monitored at 10 mM and at a lower concentration, 3 mM. The twosamples were prepared identically as described above. Because of thestrong amide I absorption, a sample path length of 6 μm was used. Theaggregation of cyt c is known to cause peaks to grow at 1616 and1685 cm�1 due to the formation of intermolecular β-sheets.40,41 Nosuch peaks were detected in either the 3 or 10 mM samples over the fulltemperature range. Furthermore, there was no detectable differencebetween the small temperature-dependent spectral changes of the twosamples. Therefore, protein aggregation does not occur. The tempera-ture dependent spectra are shown in the Supporting Information.B. Infrared Absorption and Circular Dichroism Experi-
ments. For the temperature-dependent FT-IR and 2D IR experiments,a programmable resistive heater and silicon diode temperature sensor(Lakeshore D470) attached to the copper sample cell were used tocontrol the temperature of the sample. To ensure the minimal thermalgradient across the sample, thermally conductive washers were placedbetween the cell and the calcium fluoride windows, which are alsoexcellent heat conductors. The temperature of the sample reachedequilibrium at a set point with fluctuations less than 0.2 �C. A seriesof FT-IR spectra were taken with Bruker Vertex 70 FT-IR spectrometerfrom 4 to 80 �C in 4 �C increments with 1 cm�1 resolution. Prior toanalysis, each spectrumwas background-subtracted by fitting the solventbaseline. The resulting spectra usually showed a gentle sloping back-ground due to the minute differences in water spectra. These back-grounds were removed with cubic spline fits. At the end of eachexperiment, the sample was brought down to room temperature andFT-IR spectra were taken that confirmed the reversibility of thermalunfolding.
Temperature-dependent CD measurements required a careful sam-ple preparation. Because sodium dithionite absorbs strongly at 222 nmresulting in saturation of the signal, dithiothreitol (DTT) was used as thereducing agent instead. To avoid the oxidation of cyt c during experi-ment, the solvent was degassed in inert gas to remove oxygen and CO-bound cyt c (20 μM in 100 mM sodium phosphate, pD 7.0, 3.0 MGuHCl) was prepared in a wet glovebox. The sample was loaded into agastight 2-mm path length quartz cell. UV�vis spectra of the CO-boundheme absorption were checked before and after the experiment to makesure no oxidation had occurred. The CD (Jasco J810) signal at 222 nmwas recorded at every 5 �C from 25 to 80 �C.C. Two Dimensional Infrared (2D IR) Vibrational Echo
Spectroscopy. The experimental methods for heterodyned 2D IRspectroscopy are described in full detail elsewhere.27,42,43 The output ofa Ti:Sapphire oscillator is regeneratively amplified in a Ti:Sapphireregenerative amplifier. The resulting 1 kHz, 800 nm, 100 fs pulses aresubsequently converted intomid-infrared pulses in an optical parametricamplifier. This conversion process produces 120 fs, 5μJ pulses at a 1 kHzrepetition rate at the experimental wavelength of ∼1960 cm�1. Thebandwidth of the pulse is sufficiently broad, ∼120 cm�1, to cover the0�1 vibrational transitions of the native and unfolded bands as well astheir 1�2 transitions.
Briefly, the 2D IR vibrational echo experiments involve application ofthree mid-IR light pulses with wave vectors k1, k2, and k3 to the sample ina boxcar geometry, with the times between the first and second pulse andthe second and third pulse referred to as τ and Tw, respectively.
42 At atimee τ after the third pulse, a vibrational echo is emitted by the samplein the phase-matching (�k1 þ k2 þ k3) direction. The vibrational echopulse is overlapped with another IR pulse, called the local oscillator,which provides a phase reference for the vibrational echo signal. The
combined vibrational echo/local oscillator pulse is passed through amonochromator onto an IR array detector, which records a spectrumthat yields the ωm frequency axis (vertical axis), the axis of vibrationalecho emission. Scanning τ produces an interferogram at eachωm. Theseinterferograms are Fourier transformed to produce the second, ωτ axis(horizontal axis), of the 2D IR spectrum.
In the experiments, τ is scanned for fixed Tw (time between pulses 2and 3) to produce a 2D IR spectrum. Tw is then changed, and τ is againscanned to produce another 2D IR spectrum. The change in the spectrawith Tw provides the dynamical information about the system.
III. RESULTS
A. Time-Independent Spectroscopy. A series of FT-IRspectra of the stretching mode of CO bound to cyt c in 3 MGuHCl were taken between 4 and 85 �C. Figure 2 displays FT-IRspectra at three temperatures. In the lower temperature range(4 to 30 �C), the spectrum is a single Gaussian band at1973 cm�1 with a full width at half-maximum (fwhm) of15 cm�1. This is the spectrum of CO when the protein is knownto have the native structure,3,21 so we designate this band the
Figure 2. FT-IR spectra of CO-bound cyt c Ht-M61A at 25 �C (nativeprotein), at 57 �C (overlapping bands of the native and unfoldedprotein), and 87 �C (unfolded protein) in 3MGuHCl, 100 mM sodiumphosphate, D2O, pD 7. The black curves are the data. The dashed redcurves are Gaussian fits to the data. In the middle panel, the spectrumwas fit to the sum of two Gaussian bands. The blue (native) and green(unfolded) curves are the two Gaussians that result from the fit.

D dx.doi.org/10.1021/ja111009s |J. Am. Chem. Soc. XXXX, XXX, 000–000
Journal of the American Chemical Society ARTICLE
“native band.” When the temperature is raised further, anotherGaussian band appears at a lower frequency. As cyt c is known tobe unfolded at higher temperatures,44 the lower frequency bandis assigned as the spectrum of CO when cyt c is no longer in thenative configuration but has assumed an unfolded conformation.This band is referred to as the “unfolded band,” although asdiscussed below, this band changes as the temperature isincreased. The middle panel of Figure 2 shows the spectrumwhen both the native and unfolded bands are present. The native(blue) and unfolded (green) curves are the two Gaussians thatcomprise the fit. The bottom panel of Figure 2 shows the hightemperature spectrum, where the native band has been reducedto essentially zero amplitude and the single band is the spectrumof the unfolded protein.Figure 3 shows the progression of the change in the spectrum
with temperature. At 25 �C, the spectrum is the single Gaussiannative band. At 47 �C, a shoulder appears on the low frequencyside of the predominately native band. By 57 �C, there issignificant amplitude in the unfolded band as evidenced by thelarge tail to lower frequency. At 67 �C, the spectrum is dominated
by the unfolded band with a high frequency shoulder due to theremaining native band. At 77 �C, the spectrum is essentiallycomposed only of the unfolded band centered at 1958 cm�1 withfwhm of 32 cm�1.The ratio RA(T) of the population of the unfolded state to the
sum of the populations of the native and unfolded states at eachtemperature can be obtained from the temperature dependenceof the areas of the IR absorption two bands.
RAðTÞ ¼ Auf ðTÞAnðTÞ þ Auf ðTÞ ð1Þ
where Auf is the area of the unfolded band, and An is the area ofthe native band. As displayed in Figure 3, as the temperatureis increased, Auf increases and An decreases. At low temperaturethe ratio is 0 and at high temperature it is 1. It was found thatsum of the areas, An(T)þAuf(T), is constant over the fulltemperature range within experimental error, demonstratingthat the oscillator strength is conserved, and the ratio is the trueratio of the unfolded population to the total population. WhenRA(T) = 0.5, the populations of the native and unfoldedensembles are equal.Figure 4 displays the RA(T) data and temperature dependent
CD data. The CD data has been normalized for comparison tothe RA(T) data. The two curves are almost the same. Thetransition temperatures (Tm) are 56 ( 2 �C and 60 ( 4 �Cfor RA and CD, respectively. (The difference in the two curvesmight be caused by a small systematic error. The volume of thesample used for the vibrational spectra measurements is verysmall. A slight loss of water during the sample preparation wouldincrease the GuHCl concentration, moving the RA curve to lowertemperature.)The results displayed in Figure 4 are important for a number of
reasons. The similarity between the CD data and the area ratiodata shows that the IR absorption spectrum is sensitive to theprotein unfolding in essentially the same manner as CD. It isassumed, in interpreting a CD curve such as the one shown inFigure 4, that the midpoint of the change corresponds to thepoint at which the native and unfolded protein ensembles areequally populated. The area ratio data gives an absolute measureof the populations.The S-shaped curve (Figure 4) and the presence of an
isosbestic point (Figure 3) are signatures of a cooperative 2-statetransition.36,45,46 However, this does not necessarily indicate awell-defined transition over a single free energy barrier, as manydifferent types of more complicated transitions may showsigmoidal transition profiles that are indistinguishable withoutadditional thermodynamic measurements.1
The CO stretching mode spectrum of the protein in the nativestate is a Gaussian band with peak frequency of 1973 cm�1 andfwhm of 15 cm�1. As shown in Figures 5A and C, when thetemperature is raised, neither the center frequency nor the widthchanges; only the native band’s amplitude decreases as thepopulation in the native state moves to the unfolded state. Theinhomogeneously broadened native band reflects a large distri-bution of structures that give rise to a range of CO stretchingfrequencies. The lack of a temperature dependence of the nativeabsorption band and the results of the 2D IR studies discussedbelow demonstrate that native cyt c does not undergo structuralchanges as the temperature is increased. Its secondary and tertiarystructures are maintained and the distribution of structures thatgive rise to the inhomogeneous absorption line is either
Figure 3. FT-IR spectra at different temperatures showing the progres-sion of the absorption spectrum from low temperature (native protein)to high (unfolded protein) and the isosbestic point.
Figure 4. Comparison between temperature dependent CD signal at222 nm (normalized) and the FT-IR band area ratio,RA.RA is the ratio ofthe area of the unfolded band to the sum of the areas of the native andunfolded bands. Both types of data give the appearance of two-stateprotein unfolding. The transition temperatures (Tm) are 56( 2 and 60( 4 �C for RA and CD, respectively.

E dx.doi.org/10.1021/ja111009s |J. Am. Chem. Soc. XXXX, XXX, 000–000
Journal of the American Chemical Society ARTICLE
unchanged or changes very little as long as the protein does notunfold. The lack of temperature dependence is consistent withthe idea that the distribution of native protein conformationsoccurs on an energy landscape that is relatively narrow around adeep local minimum. An increase in temperature does not enablethe protein to access significantly different conformations of thefolded protein.The unfolded band displays a fundamentally different tem-
perature-dependent behavior. The unfolded band can first beobserved at 37 �C, at which temperature it has become largeenough to be discernible at a lower frequency than the muchlarger native band. At this temperature, the unfolded band iscentered at∼1961 cm�1 and has a 22 cm�1 fwhm. In contrast tothe native band, both the line width and line center of theunfolded band are temperature dependent. As the temperature isincreased, the unfolded band broadens and shifts to lowerfrequency; at 77 �C, the band is located at 1958 cm�1 and hasa fwhm of 32 cm�1. The temperature dependence of theunfolded band line width is shown in Figure 5B and its centerfrequency is shown in Figure 5D. The change in the unfoldedline width with increasing temperature is substantial. Comparingthe native and unfolded forms at the lowest temperaturewhere the unfolded line width can be measured, the differencein width is 7 cm�1. As the temperature is increased, the unfoldedline broadens another 10 cm�1. Thus the increase in line widthof the unfolded state with increasing temperature is greaterthan the initial increase in going from native to unfolded.The change in the center frequency is not as great, but clearlydiscernible.The increase in the line width and the shift in the center
frequency with increasing temperature demonstrate that
unfolding is not a strict two-state process. The fact that theinhomogeneous line width of the unfolded band increasesdemonstrates that the number of conformations that are ther-mally accessible is increasing as the temperature increases. Theaverage structure and distribution of structures are dependent onunfolding conditions (temperature), resulting in the band’s redshift and line broadening. The line broadening and frequencyshift also imply that the lower temperature unfolded states arenot the random coils but have structures that change withincreasing temperature. It is known that cyt c can adopt fairlycompact conformations, smaller than expected for random coilsunder thermally denaturing conditions.1,37 Thus, at a giventemperature the unfolded state of cyt c consists of an ensembleof many protein conformations with a certain average structureand variance from the average. When the temperature is in-creased, the variance increases as shown by the increase in theinhomogeneous line width. The average structure also changes,which results in the band’s red shift.The CD data and the FT-IR area ratio data shown in Figure 3
suggest that both techniques report on the same particularchange in structure that we will refer to as the primary unfoldingevent. The near coincidence of the transitions indicates that thegrowth of the unfolded band in the IR spectrum is associated withthe same change in cyt c that leads to loss of helical structure. TheIR spectra also provide information that cannot be obtained fromthe CD curve. The native and unfolded states manifest them-selves as distinct peaks in the IR spectrum, and the unfolding canbe monitored by the transfer of area between the two bands.Unlike the CD spectra, the IR spectra enable this scenario to bedifferentiated from another possibility that the protein changes ina continuous manner from native to unfolded. Had this occurred,
Figure 5. Temperature dependence of the line width of (A) the native peak and (B) the unfolded peak of the protein CO spectrum. The increase inwidth of the unfolded spectra with increasing temperature is caused by an increase in the inhomogeneous contribution, which results from an increase inthe number of protein structures. The change in width with temperature demonstrates that the temperature dependent unfolding is not a two stateprocess. Temperature dependence of the center frequency for the (C) native and (D) unfolded peaks, respectively. As with the fwhm, the native peakfrequency shows little change, but the unfolded peak displays a discernible dependence on temperature. The error bars are from the errors in fitting thespectra at each temperature. Because there is only a small population of the native protein (blue points) at higher temperatures, the error bars are larger.Conversely, data for the unfolded protein (red points) have larger error bars at lower temperatures.
F dx.doi.org/10.1021/ja111009s |J. Am. Chem. Soc. XXXX, XXX, 000–000
Journal of the American Chemical Society ARTICLE
the native band might continuously shift to the red and broadenas temperature is increased. This behavior would suggest con-tinuous small changes in structure that influence the COabsorption frequency. The fact that a new, distinct band growsin indicates that the primary unfolding event is associated withsignificant structural changes that expose the CO to an environ-ment dramatically different from the native state, leading to theabrupt change in the frequency of the CO absorption.Extensive point mutation and other studies have shown that
the interaction of heme iron-bound CO with a polar group shiftsthe center frequency of CO to lower frequency.26,47 Considermyoglobin-CO (MbCO) which has three distinct CO absorp-tion bands called A0, A1, and A3.
48 These bands have frequenciesof 1965, 1944, and 1939 cm�1, respectively, for bovine heartMbCO. The difference in the frequencies is determined by theconformation of the imidazole side group of the distal histidine(H64). The A0 band has the imidazole swung out of the pocket,28
whereas both A1 and A3 have the imidazole in the pocket. A1 hasthe imidazole protonated epsilon nitrogen (NεH) pointed awayfrom the CO, while A3 has the NεH point more toward theCO.28,29 The three bands are caused by well-defined structuraldifferences that have a strong influence on the CO. The A0 band,which has the highest frequency, does not have the imidazole inthe pocket, so there is no interaction between the CO and theNεH. The A1 band is shifted to lower frequency by the interac-tion between the NεH and the CO, and the A3 band is shiftedeven further to the red by a stronger interaction CO-NεHinteraction. The broad distribution of protein structures givesrise to the inhomogeneous broadening of each band, but it is aspecific interaction that produces distinct bands. A shift in theCO absorption frequency through direct interaction with the COis also known to occur for Ht-M61A. The mutation in whichGln64 is replaced with Asn (Q64N) induces CO to interact withthe polar side group of Asn, resulting in a 9 cm�1 frequency shiftto the red.20
In analogy with the three bands of MbCO, it seems reasonableto view the 12 cm�1 red-shift of the unfolded band relative to thenative band as being caused by the primary unfolding event that
produces a structural change that has direct impact on the CO. Itis also reasonable to postulate that such a change is caused by CObeing exposed to a polar group of an amino acid or possiblywater. The significant increase in inhomogeneous broadening ofthe unfolded line relative to the native band indicates a consider-able increase in the number of protein conformations. The red-shift and broadening of the CO band bound to cyt c has beenobserved previously via chemical denaturation.21
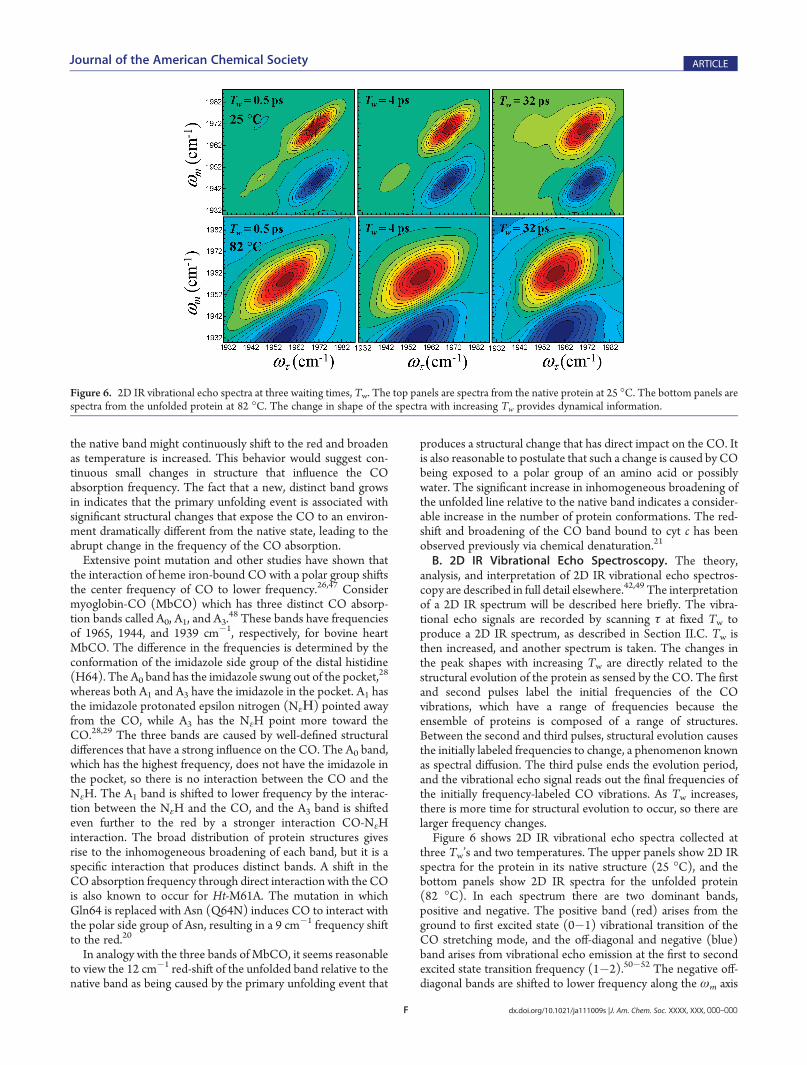
B. 2D IR Vibrational Echo Spectroscopy. The theory,analysis, and interpretation of 2D IR vibrational echo spectros-copy are described in full detail elsewhere.42,49 The interpretationof a 2D IR spectrum will be described here briefly. The vibra-tional echo signals are recorded by scanning τ at fixed Tw toproduce a 2D IR spectrum, as described in Section II.C. Tw isthen increased, and another spectrum is taken. The changes inthe peak shapes with increasing Tw are directly related to thestructural evolution of the protein as sensed by the CO. The firstand second pulses label the initial frequencies of the COvibrations, which have a range of frequencies because theensemble of proteins is composed of a range of structures.Between the second and third pulses, structural evolution causesthe initially labeled frequencies to change, a phenomenon knownas spectral diffusion. The third pulse ends the evolution period,and the vibrational echo signal reads out the final frequencies ofthe initially frequency-labeled CO vibrations. As Tw increases,there is more time for structural evolution to occur, so there arelarger frequency changes.Figure 6 shows 2D IR vibrational echo spectra collected at
three Tw’s and two temperatures. The upper panels show 2D IRspectra for the protein in its native structure (25 �C), and thebottom panels show 2D IR spectra for the unfolded protein(82 �C). In each spectrum there are two dominant bands,positive and negative. The positive band (red) arises from theground to first excited state (0�1) vibrational transition of theCO stretching mode, and the off-diagonal and negative (blue)band arises from vibrational echo emission at the first to secondexcited state transition frequency (1�2).50�52 The negative off-diagonal bands are shifted to lower frequency along the ωm axis
Figure 6. 2D IR vibrational echo spectra at three waiting times, Tw. The top panels are spectra from the native protein at 25 �C. The bottom panels arespectra from the unfolded protein at 82 �C. The change in shape of the spectra with increasing Tw provides dynamical information.

G dx.doi.org/10.1021/ja111009s |J. Am. Chem. Soc. XXXX, XXX, 000–000
Journal of the American Chemical Society ARTICLE
by the anharmonicity of the vibrational potential. Since the0�1 and 1�2 bands provide the same information, only the0�1 band was analyzed. In the first upper panel there are alsotwo small bands, one on the diagonal at (ωτ = 1948 cm
�1,ωm =1948 cm�1) that is positive, and one off-diagonal at (1948 cm�1,1972 cm�1) that is negative. These arise from fifth orderinteractions, and do not influence the interpretation of thediagonal 0�1 bands.53
At short Tw (0.5 ps), the bands in the 2D IR spectra show astrong elongation along the diagonal, a signature of inhomoge-neous broadening. At short Tw, there are many structuralconfigurations of the protein that have not yet been sampledby structural evolution. As time increases, structural evolutioncauses spectral diffusion, resulting in the change in shape of the2D spectrum. The longest time for the measurements is limitedby the vibrational lifetime of the CO stretching mode. In theseexperiments data could be collected to a maximum of 80 ps. Thespectrum is sensitive to structural fluctuations that occur on atime scale up to a few times the longest Tw measured becausesome portion of slower fluctuations will occur in the experi-mental window if their time scale is not too slow.54 Looking atFigure 6, it is clear that at each Tw the spectrum of the nativeprotein is very different from that of the unfolded protein.The frequency-frequency correlation function (FFCF) con-
nects theTw dependent changes in the 2D band shapes caused byspectral diffusion to the time dependence of the structuralchanges of the proteins. The center line slope (CLS) methodis used here to determine the FFCF from 2D and linearspectra.49,55 This method provides an accurate way to extractthe FFCF and also provides a useful quantity to plot forvisualizing differences in the protein dynamics for differentprotein conformational states.49,55 At a particular ωτ, a slicethrough the 2D spectrum, projected onto the ωm axis, is a one-dimensional spectrum with a peak at a particularωm value. Manysuch slices taken over a range of ωτ values produce a set of peakfrequency points. Connecting the resulting points yields thecenter line. In the absence of a homogeneous contribution, atTw = 0, the 2D line shape is a line along the diagonal and the slopeof the center line would be 1. At sufficiently long time, whenspectral diffusion has sampled all frequencies, the 2D band issymmetric; the center line is horizontal with the slope of zero.It has been shown theoretically that the Tw-dependent part ofthe normalized FFCF is directly related to the Tw dependenceof the slope of the center line.49,55 Thus the slope of the centerline, the CLS, will vary between a maximum of 1 at Tw = 0 and 0in the limit of long waiting time. The Tw = 0 slope will only beunity if there is no homogeneous contribution to the spectrum.The homogeneous contribution to the line shapes in the linearabsorption and 2D spectra mainly comes from the motionallynarrowed component produced by very fast structuralfluctuations,27,56,57 such that Δτ < 1, where τ and Δ are the timeconstant and range (amplitude) of the frequency fluctuations.Other homogeneous contributions arise either from vibrationallifetime T1, which is measured independently by IR pump�probe experiments, or from orientational relaxation, which canbe neglected due to the large size, and therefore, very sloworientational relaxation of the protein. The homogeneous com-ponent of the spectrum causes the initial value of the slope to beless than 1 at Tw = 0. The difference from 1 at Tw = 0 combinedwith the Tw dependent CLS and the linear absorption spectrumyields the full FFCF, including the Tw independent homoge-neous component.49,55
The multiple time scale dynamics were modeled by a multi-exponential form of the FFCF, C(t).
CðtÞ ¼ ∑n
i¼ 1Δ2
i e�t=τi þΔ2
s ð1Þ
The Δi and τi terms are amplitudes and correlation times,respectively, of the vibrational frequency fluctuations induced byprotein structural dynamics. For the ith dynamical process, Δi isthe range of CO frequencies sampled due to protein structuralfluctuations, and τi is the time constant of these fluctuations. Thisform of the FFCF has been widely used and in particular foundapplicable in studies of the structural dynamics of heme-COproteins.21,27,28,30,31,33,34,58,59 Very slow structural fluctuationson time scales longer than the experimental time window arecontained in the static term Δs
2 in the FFCF. However for amotionally narrowed term with Δiτi < 1, these quantities cannotbe evaluated separately; only the product Δ2τ = 1/T2*, can bedetermined, where T2* is the pure dephasing time. The homo-geneous dephasing, which is determined from the analysis of the2D IR spectra has a contribution from the vibrational lifetime,T1,and the pure dephasing, T2*. The pure dephasing time is obtainedby using 1/T2 = 1/T2* þ 1/2T1. T1 is obtained from IRpump�probe experiments. The contribution to T2 from thelifetime, ∼0.25 cm�1, is negligible at all but the lowest tempera-tures. The pure dephasing line width is Γ = 1/πT2* = Δ2τ. In thedata analysis presented below, the FFCF contains three terms, ahomogeneous dephasing term given as Γ, a single exponentialdecay term Δ1
2e�t/τ1, and a static term, Δs2. Γ, Δ1, and Δs have a
well-defined relationship to the absorption spectrum. Δ1 and Δs
Figure 7. Center line slope (CLS) data (points) and fits (solid curves)for the native protein (top panel) and the unfolded protein (bottompanel) for several temperatures. The fits are to an exponential functionwith an offset.

H dx.doi.org/10.1021/ja111009s |J. Am. Chem. Soc. XXXX, XXX, 000–000
Journal of the American Chemical Society ARTICLE
are the standard deviations of Gaussian contributions to theabsorption line. The total Gaussian component is the convolu-tion of the two Gaussian which has a standard deviation (Δ1
2 þΔs2)1/2. The total line shape is Voigt given by the convolution of a
Lorentzian with width Γ and the total Gaussian component.The full procedure for calculating the FFCF from CLS and
linear spectrum is discussed in detail elsewhere.49,55 Briefly, thetime constants obtained from the exponential fits of CLS give theτ1 directly as well as Δs. The CLS analysis also provides a lowerbound onΔ1, which is at most 15% low.Γ andΔ1 are obtained bysimultaneously fitting the linear absorption spectrum and theCLS using the linear and third order response functions. Themethod has been shown to be robust. For example, the CLSdetermined FFCF is insensitive to the pulse duration, slopingbackground absorption, and other factors that can distort the 2Dspectra.Figure 7 displays some of the CLS data. The points are the
center line slopes at several temperatures, and the curves are fitsto the data with an exponential decay plus an offset. The upperpanel contains data taken on the native band, and the lower panelcontains data for the unfolded band. The temperature ranges forthe native and unfolded data are limited by the difficulty inseparating out the CLS for the two bands at temperatures wherethe bands obscure one another.As discussed further below, the native 2D data show only a
change in the homogeneous component of the dynamic lineshape with temperature. This change is manifested by anincreasingly large difference from 1 at Tw = 0. The Tw dependentportions of the curves are essentially unchanged with tempera-ture. The unfolded 2D spectra also show a change in thehomogeneous component of the FFCF with changing tempera-ture. In addition, the shapes of the CLS decay curves are quitedifferent from those obtained from the native 2D spectra, and theunfolded CLS decay curves change shape with temperature.Figure 8 displays the components of the FFCF obtained from
the CLS analysis as a function of temperature. The blue data
points are for the native protein, and the red data points are forthe unfolded protein. The upper left panel of Figure 8 shows thepure dephasing linewidths vs temperature. This motionallynarrowed contribution to the absorption line shape is producedby extremely fast structural fluctuations.27,56,57 Such structuralfluctuations will arise from the motions of small groups on theprotein as well as the surrounding water. As the temperature isincreased, the pure dephasing line width Γ increases linearly.Since Γ = Δ2τ and one would expect τ to become shorter astemperature increases, one way to obtain the observed lineardependence on temperature is for τ to decrease linearly withtemperature while Δ increases linearly with temperature. Theimportant aspect of the Γ vs temperature plot is that the nativeand unfolded data points fall on the same line. The implication isthat the pure dephasing is independent of the state of the protein.This is reasonable if the pure dephasing has major contributionsfrom the water and the motions of small protein moleculargroups.The other components of the FFCF display quite different
behavior for the native and unfolded proteins. First consider thenative protein data (blue points in Figure 8). The dashed linesthrough the data points in the τ1,Δ1, andΔs plots are horizontal.The plots in Figure 8 show that neither the FFCF decay time andits associated amplitude, τ1 and Δ1, nor the static amplitude, Δs
have significant temperature dependences. These FFCF param-eters are consistent with the lack of a temperature dependence ofthe native absorptions spectrum’s line width and line shapewithin experimental error. It is possible to draw a slightlyincreasing line through the Δ1 data and a slightly decreasing linethrough the Δs data. However, given the experimental uncer-tainty, it is not clear that such small temperature dependences aremeaningful. If there are such small changes with temperature, itmeans that some of the dynamics that fall outside of theexperimental time window have moved into the experimentaltime window as the temperature is increased. This behaviorwould decreaseΔs and increaseΔ1. However, the main feature ofthe native protein FFCF parameters is that they are essentiallytemperature independent except for the ultrafast fluctuationsthat give rise to the motionally narrowed pure dephasing.In contrast to the native protein parameters, τ1,Δ1, andΔs for
the unfolded protein all display significant temperature depend-ences (see Figure 8). Unlike the pure dephasing line width Γ, theunfolded protein’s τ1, Δ1, and Δs are discontinuous from thevalues for the folded protein, which are essentially temperatureindependent. The unfolded protein FFCF decay time, τ1,decreases with increasing temperature. The corresponding am-plitude, Δ1, increases, while the static component, Δs, decreaseswith increasing temperature.The results for the unfolded protein have a clear meaning in
terms of dynamical time scales.Δs reflects the portion of all of theprotein structures that give rise to the inhomogeneous line widthand have dynamics that are so slow that they are outside of theexperimental time window of∼100 ps. The decrease ofΔsmeansthat a portion of the slow dynamics has moved into theexperimental time window. Therefore, the very slow structuralfluctuations of the protein are becoming faster as the temperatureis increased. This change is also reflected by the increase in thevalue of Δ1 with increasing temperature. As the temperature isincreased, more of the protein’s structural fluctuations fall withinthe ∼100 ps experimental time window. The fact that thestructural fluctuations of the unfolded protein are becomingfaster as the temperature is increased is also shown by the
Figure 8. Frequency-frequency correlation function parameters plottedagainst temperature for the native protein (blue data points) and theunfolded protein (red data points). The parameters are the homoge-neous line width Γ, the intermediate time scale decay time constant τ1,the intermediate time scale amplitude Δ1, and static componentamplitude Δs. The dashed lines are aids to the eye. See text for detaileddiscussion of the parameters. The error bars shown are calculated fromerror in the fits to the 2D data at each temperature.

I dx.doi.org/10.1021/ja111009s |J. Am. Chem. Soc. XXXX, XXX, 000–000
Journal of the American Chemical Society ARTICLE
decrease in τ1. τ1 is time constant for the decay of the FFCF, andthe time scale for structural fluctuations in the experimental timewindow that are not so fast that they are motionally narrowed.Therefore, the temperature dependences of τ1, Δ1, and Δs alldemonstrate that as the temperature increases the structuraldynamics of the unfolded protein become faster.One possibility that would explain the increased rate of
structural fluctuations with increasing temperature is that theviscosity of the solvent decreases. Detailed studies have shownthat the viscosity dependence of the structural fluctuations offolded proteins as measured by vibrational echo experiments isvery mild.60,61 The vibrational dephasing of CO bound at theactive sites of heme proteins increases with decreasing viscosityapproximately as η1/3, where η is the viscosity of the solution.Given the small change in viscosity in these experiments withtemperature, one would not expect to see a viscosity depen-dence.60,61 This is demonstrated by the lack of a temperaturedependence, and therefore a viscosity dependence, of the nativeprotein’s τ1, Δ1, and Δs. However, it is possible that an unfoldedprotein has structural fluctuations that are influenced to a muchgreater extent by the change in viscosity.To test for viscosity dependence, the solution viscosities were
measured at 62 and 82 �C. The viscosities of the 10 mM cyt csolutions are 1.6 cP at 62 �C and 1.3 cP at 82 �C. A small amountof glycerol was added to a protein solution such that at 82 �C ithad the same viscosity as the solution without glycerol at 62 �C.The 2D IR vibrational echo experiments were then performed onthe 82 �C glycerol-augmented solution. The CLS decay wasunchanged by the addition of glycerol to the 82 �C sample.Therefore, a decrease in viscosity with increasing temperatureis not responsible for the observed changes in the dynamics ofthe unfolded protein. Furthermore, the change in temperatureitself is not responsible for the change in FFCF parameters forthe unfolded state. The homogeneous pure dephasing, Γ (see
Figure 8) is temperature dependent regardless of the state ofthe protein, that is, native or unfolded. However, for the otherFFCF parameters, the native protein does not show tempera-ture dependence. The data for the native protein covers achange of kBT, where kB is Boltzmann’s constant, of 17%. Thedata for the unfolded protein spans the range of 62 to 82 �C,which is a change of kBT of only 6%.Since the viscosity and the temperature are not responsible
for the observed changes going from native to unfolded, theobservations must be associated with changes in the structure ofthe unfolded protein as the temperature is increased. Theunfolded protein has a broader range of structures than thenative protein as shown by the increased inhomogeneousabsorption line width as discussed in Section III.A. This broaderrange is centered about a different average structure as demon-strated by the shift to a lower frequency of the center of theunfolded absorption band relative to the native band. At thelowest temperature at which the FFCF parameters can bedetermined for the unfolded protein (62 �C), the unfoldedprotein τ1 is slower than it is for the native protein. Thus, inthe 100 ps experimental time window, the structural fluctuationsof the unfolded protein are slower than those of the nativeprotein. The unfolded protein has a broader range of structures,but the slower interconversions among these structures indicatesthat there are higher barriers separating distinct structuresrelative to the ensemble of native structures. A schematicillustration of this difference is given in Figure 9. The unfoldedprotein is expected to be less ordered and rigid than the nativeprotein. Dynamics of the unfolded protein within the experi-mental windowmay involve fluctuations of much larger groups ofresidues than in the native state. Interconversions among suchstructures evidently involve higher barriers and slower dynamics.The slowing down of the dynamics is consistent with the ideathat the energy landscape becomesmore rugged and varied in theunfolded state,14,62 which corresponds to an increase in thebarrier heights separating conformational structures.
IV. CONCLUDING REMARKS
In this paper, the equilibrium structures and dynamics of thenative and thermally unfolded cyt c have been examined atvarious temperatures by linear IR absorption and 2D IR vibra-tional echo spectroscopic techniques using the heme-ligated COas the vibrational probe. The temperature dependent absorptionarea ratio RA(T) was defined as the ratio of the area under theunfolded band to the sum of the areas of the native and unfoldedbands. The temperature dependence of RA is very similar to thetemperature dependent CD data (see Figure 4). The area ratiodata display temperature dependent behavior that, by itself, isconsistent with two-state unfolding. However, as the tempera-ture is further increased, the unfolded absorption band broadenssubstantially, and its band center shifts to lower frequency (seeFigure 5). The broadening is caused by increased inhomoge-neous contributions to the line width that are caused by anexpansion in the range of unfolded structures that comprise theunfolded ensemble.
The results of the 2D IR vibrational echo experiments, whichyield the FFCF parameters (see Figure 8), show that the nativeand unfolded proteins have very different dynamics. Both show atemperature dependent increase in the homogeneous compo-nent, Γ, that arises from ultrafast motions that produce amotionally narrowed Lorentzian contribution to the absorption
Figure 9. Schematic energy landscape diagrams of the native andunfolded structures consistent with the results of the IR experiments.The native protein occupies a narrow energy well with a smaller numberof microstates separated by relatively low energy barriers. The thermallyunfolded protein has a much broader ensemble of conformational statesseparated by higher energy barriers.

J dx.doi.org/10.1021/ja111009s |J. Am. Chem. Soc. XXXX, XXX, 000–000
Journal of the American Chemical Society ARTICLE
line. Γ is so narrow at all temperatures that it has almost noinfluence on the absorption line shape. However, it can bemeasured with the 2D IR experiments. Starting at low tem-perature in the native state, Γ increases linearly, and continuesto increase in the unfolded state, with the data points falling onthe same line. These very fast fluctuations, which have con-tributions from small groups of the protein and the solvent, areindependent of whether the protein is in its native state orunfolded.
In contrast to the homogeneous component, the other FFCFparameters, τ1, Δ1, and Δs, are very different for the native andunfolded ensembles. τ1 is the decay time for the FFCFcomponent that falls within the experimental window thatextends to ∼100 ps. τ1 can be thought of as the characteristictime scale for protein structural fluctuations on the moderatelyfast time scale. Δ1 is the corresponding amplitude (range offrequencies) associated with the intermediate time scale fluc-tuations andΔs is the amplitude of fluctuations that are so slow(>100 ps) that they fall outside of the experimental timewindow. The parameters, τ1, Δ1, and Δs for the native proteinare essentially temperature independent. The lack of tempera-ture dependence of these parameters along with the fact that thenative line shape and center frequency do not change withtemperature shows that the native protein structure and dy-namics are basically independent of temperature over the rangestudied.
In contrast, τ1, Δ1, and Δs for the unfolded protein are alltemperature dependent. As the temperature is increased, τ1decreases (the dynamics become faster), Δ1 increases, and Δs
decreases. The decrease in Δs and the increase in Δ1 shows thatvery slow structural fluctuations are becoming faster and movinginto the experimental time window. These changes are caused bychanges in the ensemble of protein structures and the barriersthat determine the rates of interconversions among structures.The results suggest that the ensemble of the unfolded structuresbecomes more heterogeneous as unfolding proceeds, and theunfolded ensemble has a very rugged and more varied energylandscape than the native protein as schematically illustrated inFigure 9. These results are consistent with the growing under-standing of the unfolded structures of proteins, that is, as anensemble of more diverse structures compared to the nativeprotein.1,9,38 In particular, Jimenez et al. have found similarresults in horse heart ferricytochrome c, a closely related protein,using 3-pulse photon echo peak shift spectroscopy.10
Molecular dynamics simulations of these results would be veryuseful. The experiments presented here can be calculated usingMD simulations. Comparison between simulations and thesedata would provide an important test for the ability of simulationsto describe structure and dynamics of proteins that are unfoldedto various extents. If the simulations can come reasonably closeto reproducing the observed data, then they would providedetailed molecular level insights into the nature of proteins asthey become increasingly unfolded.
’ASSOCIATED CONTENT
bS Supporting Information. The Supporting Informationcontains temperature dependent spectra of the amide region for10 mM and 3 mM protein samples that demonstrate the absenceof protein aggregation. This material is available free of charge viathe Internet at http://pubs.acs.org.
’AUTHOR INFORMATION
Corresponding [email protected]
’ACKNOWLEDGMENT
J.K.C., M.C.T., and M.D.F. thank the National Institutes ofHealth (2-R01-GM061137-09) for support of this research. Weare grateful to Yeonju Kwak for the help with anaerobic samplepreparations. M.C.T. also thanks the National Institutes ofHealth for a post doctoral fellowship. S.E.J.B. and K.L.B. thankthe National Institutes of Health (R01-GM63170) for financialsupport.
’REFERENCES
(1) Dill, K. A.; Shortle, D. Annu. Rev. Biochem. 1991, 60, 795.(2) Cho, J. H.; Raleigh, D. P. Methods Mol. Biol. 2009, 490, 339.(3) Bren, K. L.; Kellogg, J. A.; Kaur, R.; Wen, X. Inorg. Chem. 2004,
43, 7934.(4) Wilkins, D. K.; Grimshaw, S. B.; Receveur, V.; Dobson, C. M.;
Jones, J. A.; Smith, L. J. Biochemistry 1999, 38, 16424.(5) Jeng,M. F.; Englander, S.W.; Elove, G. A.;Wand, A. J.; Roder, H.
Biochemistry 1990, 29, 10433.(6) Segel, D. J.; Fink, A. L.; Hodgson, K. O.; Doniach, S. Biochemistry
1998, 37, 12443.(7) Hagihara, Y.; Hoshino, M.; Hamada, D.; Kataoka, M.; Goto, Y.
Fold. Des. 1998, 3, 195.(8) Chattopadhyay, K.; Elson, E. L.; Frieden, C. Proc. Natl. Acad. Sci.
U.S.A. 2005, 102, 2385.(9) Nettels, D.; Muller-Spath, S.; Kuster, F.; Hofmann, H.; Haenni,
D.; Ruegger, S.; Reymond, L.; Hoffmann, A.; Kubelka, J.; Heinz, B.; Gast,K.; Best, R. B.; Schuler, B. Proc. Natl. Acad. Sci. U.S. A. 2009, 106, 20740.
(10) Jimenez, R.; Romesberg, F. E. J. Phys. Chem. B. 2002, 106, 9172.(11) Pace, N. C.; Tanford, C. Biochemistry 1968, 7, 198.(12) Chan, H. S.; Dill, K. A. Annu. Rev. Biophys. Biophys. Chem. 1991,
20, 447.(13) Chan, H. S.; Dill, K. A. Proteins: Struct., Funct., Bioinf. 1998,
30, 2.(14) Frauenfelder, H.; Sligar, S. G.; Wolynes, P. G. Science 1991,
254, 1598.(15) Elove, G. A.; Bhuyan, A. K.; Roder, H. Biochemistry 1994,
33, 6925.(16) Wain, R.; Redfield, C.; Ferguson, S. J.; Smith, L. J. J. Biol. Chem.
2004, 279, 15177.(17) Sasai, M.; Wolynes, P. G. Phys. Rev. Lett. 1990, 65, 2740.(18) Weinkam, P.; Zong, C. H.; Wolynes, P. G. Proc. Nat. Acad. Sci.
U.S.A. 2005, 102, 12401.(19) Travaglini-Allocatelli, C. G., S.; Dubey, V. K.; Borgia, A.; Di
Matteo, A.; Bonivento, D.; Cutruzzol�a, F.; Bren, K. L.; Brunori, M. J. Biol.Chem. 2005, 280, 25729.
(20) Massari, A. M.; McClain, B. L.; Finkelstein, I. J.; Lee, A. P.;Reynolds, H. L.; Bren, K. L.; Fayer, M. D. J. Phys. Chem. B 2006,110, 18803.
(21) Kim, S.; Chung, J. K.; Kwak, K.; Bowman, S. E.; Bren, K. L.;Bagchi, B.; Fayer, M. D. J. Phys. Chem. B 2008, 112, 10054.
(22) Filosa, A.; Ismail, A. A.; English, A. M. J. Biol. Inorg. Chem. 1999,4, 717.
(23) Filosa, A.; English, A. M. J. Biol. Inorg. Chem. 2000, 5, 448.(24) Varhac, R.; Antalik, M.; Bano, M. J. Biol. Inorg. Chem. 2004,
9, 12.(25) Latypov, R. F.; Maki, K.; Cheng, H.; Luck, S. D.; Roder, H.
J. Mol. Biol. 2008, 383, 437.(26) Spiro, T. G.; Wasbotten, I. H. J. Inorg. Biochem. 2005, 99, 34.(27) Finkelstein, I. J.; Zheng, J.; Ishikawa, H.; Kim, S.; Kwak, K.;
Fayer, M. D. Phys. Chem. Chem. Phys. 2007, 9, 1533.

K dx.doi.org/10.1021/ja111009s |J. Am. Chem. Soc. XXXX, XXX, 000–000
Journal of the American Chemical Society ARTICLE
(28) Merchant, K. A.; Noid, W. G.; Akiyama, R.; Finkelstein, I.;Goun, A.; McClain, B. L.; Loring, R. F.; Fayer, M. D. J. Am. Chem. Soc.2003, 125, 13804.(29) Merchant, K. A.; Noid, W. G.; Thompson, D. E.; Akiyama, R.;
Loring, R. F.; Fayer, M. D. J. Phys. Chem. B 2003, 107, 4.(30) Ishikawa, H.; Finkelstein, I. J.; Kim, S.; Kwak, K.; Chung, J. K.;
Wakasugi, K.; Massari, A. M.; Fayer, M. D. Proc. Nat. Acad. Sci. U.S.A.2007, 104, 16116.(31) Finkelstein, I. J.; Ishikawa, H.; Kim, S.; Massari, A. M.; Fayer,
M. D. Proc. Natl. Acad. Sci. U.S.A. 2007, 104, 2637.(32) Thielges, M. C.; Chung, J. K.; Fayer, M. D. J. Am. Chem. Soc.
2011, 133, 3995.(33) Finkelstein, I. J.; Goj, A.; McClain, B. L.; Massari, A. M.;
Merchant, K. A.; Loring, R. F.; Fayer, M. D. J. Phys. Chem. B 2005,109, 16959.(34) Ishikawa, H.; Kim, S.; Kwak, K.; Wakasugi, K.; Fayer, M. D.
Proc. Nat. Acad. Sci. U.S.A. 2007, 104, 19309.(35) Ishikawa, H.; Kwak, K.; Chung, J. K.; Kim, S.; Fayer, M. D. Proc.
Nat. Acad. Sci. U.S.A. 2008, 105, 8619.(36) Pace, C. N.; Scholtz, J. M. In Protein Structure: A Practical
Approach; Creighton, T. E., Ed.; Oxford: New York, 1997; p 299.(37) Shortle, D. Curr. Opin. Struct. Biol. 1993, 3, 66.(38) Shortle, D.; Meeker, A. K. Proteins 1986, 1, 81.(39) Wen, X.; Bren, K. L. Biochemistry 2005, 44, 5225.(40) Muga, A.; Mantsch, H. H.; Surewicz, W. K. Biochemistry 1991,
30, 7219.(41) Holzbaur, I. E.; English, A. M.; Ismail, A. A. Biochemistry 1996,
35, 5488.(42) Park, S.; Kwak, K.; Fayer, M. D. Laser Phys. Lett. 2007, 4, 704.(43) Zheng, J.; Kwak, K.; Fayer, M. D. Acc. Chem. Res. 2007, 40, 75.(44) Sanbongi, Y.; Igarashi, Y.; Kodama, T. Biochemistry 1989,
28, 9574.(45) Senior, W. A.; Verrall, R. E. J. Phys. Chem. 1969, 73, 4242.(46) Walrafen, G. E.; Hokmabadi, M. S.; Yang, W. H. J. Chem. Phys.
1986, 85, 6964.(47) Phillips, G. N., Jr.; Teodoro, M. N.; Li, T.; Smith, B.; Olson, J. S.
J. Phys. Chem. B 1999, 103, 8817.(48) Johnson, J. B.; Lamb, D. C.; Frauenfelder, H.; M€uller, J. D.;
McMahon, B.; Nienhaus, G. U.; Young, R. D. Biophys. J. 1996, 71, 1563.(49) Kwak, K.; Park, S.; Finkelstein, I. J.; Fayer, M. D. J. Chem. Phys.
2007, 127, 124503.(50) Tokmakoff, A.; Kwok, A. S.; Urdahl, R. S.; Francis, R. S.; Fayer,
M. D. Chem. Phys. Lett. 1995, 234, 289.(51) Rector, K. D.; Kwok, A. S.; Ferrante, C.; Tokmakoff, A.; Rella,
C. W.; Fayer, M. D. J. Chem. Phys. 1997, 106, 10027.(52) Golonzka, O.; Khalil, M.; Demirdoven, N.; Tokmakoff, A. Phys.
Rev. Lett. 2001, 86, 2154.(53) Finkelstein, I. J.; McClain, B. L.; Fayer, M. D. J. Chem. Phys.
2004, 121, 877.(54) Bai, Y. S.; Fayer, M. D. Phys. Rev. B. 1989, 39, 11066.(55) Kwak, K.; Rosenfeld, D. E.; Fayer, M. D. J. Chem. Phys. 2008,
128, 204505.(56) Asbury, J. B.; Steinel, T.; Kwak, K.; Corcelli, S. A.; Lawrence,
C. P.; Skinner, J. L.; Fayer, M. D. J. Chem. Phys. 2004, 121, 12431.(57) Woutersen, S.; Pfister, R.; Hamm, P.; Mu, Y.; Kosov, D. S.;
Stock, G. J. Chem. Phys. 2002, 117, 6833.(58) Massari, A. M.; Finkelstein, I. J.; Fayer, M. D. J. Am. Chem. Soc.
2006, 128, 3990.(59) Merchant, K. A.; Thompson, D. E.; Xu, Q.-H.; Williams, R. B.;
Loring, R. F.; Fayer, M. D. Biophys. J. 2002, 82, 3277.(60) Finkelstein, I. J.; Massari, A. M.; Fayer, M. D. Biophys. J. 2007,
92, 3652.(61) Rector, K. D.; Jiang, J.; Berg, M.; Fayer, M. D. J. Phys. Chem. B
2001, 105, 1081.(62) Onuchic, J. N.; LutheySchulten, Z.; Wolynes, P. G. Annu. Rev.
Phys. Chem. 1997, 48, 545.