Temperature Dependence of Cell Division Timing Accounts ...
8
Report Temperature Dependence of Cell Division Timing Accounts for a Shift in the Thermal Limits of C. elegans and C. briggsae Graphical Abstract Highlights d Timing of the first embryonic cell division follows the Arrhenius equation d The coordination of cell division is impaired outside the Arrhenius range d C. elegans and C. briggsae become sterile outside the Arrhenius range d The Arrhenius range of C. briggsae is shifted to higher temperature by 2 C Authors Maria L. Begasse, Mark Leaver, ..., Stephan W. Grill, Anthony A. Hyman Correspondence [email protected] In Brief With climate change, it is important to understand how temperature affects the fitness of cold-blooded organisms. Begasse et al. show that the temperature dependence of cell division differs in two closely related nematodes. This shift in the temperature response has corresponding effects on development and reproductive output. Begasse et al., 2015, Cell Reports 10, 647–653 February 10, 2015 ª2015 The Authors http://dx.doi.org/10.1016/j.celrep.2015.01.006
Transcript of Temperature Dependence of Cell Division Timing Accounts ...

Report
Temperature Dependence
of Cell Division TimingAccounts for a Shift in the Thermal Limits ofC. elegans and C. briggsaeGraphical Abstract
Highlights
d Timing of the first embryonic cell division follows the
Arrhenius equation
d The coordination of cell division is impaired outside the
Arrhenius range
d C. elegans and C. briggsae become sterile outside the
Arrhenius range
d The Arrhenius range of C. briggsae is shifted to higher
temperature by 2�C
Begasse et al., 2015, Cell Reports 10, 647–653February 10, 2015 ª2015 The Authorshttp://dx.doi.org/10.1016/j.celrep.2015.01.006
Authors
Maria L. Begasse, Mark Leaver, ...,
Stephan W. Grill, Anthony A. Hyman
In Brief
With climate change, it is important to
understand how temperature affects the
fitness of cold-blooded organisms.
Begasse et al. show that the temperature
dependence of cell division differs in two
closely related nematodes. This shift in
the temperature response has
corresponding effects on development
and reproductive output.

Cell Reports
Report
Temperature Dependence of Cell Division TimingAccounts for a Shift in the Thermal Limitsof C. elegans and C. briggsaeMaria L. Begasse,1,2,3 Mark Leaver,1 Federico Vazquez,2,4 Stephan W. Grill,1,2,3 and Anthony A. Hyman1,*1Max Planck Institute of Molecular Cell Biology and Genetics, 01307 Dresden, Germany2Max Planck Institute for the Physics of Complex Systems, 01187 Dresden, Germany3TU Dresden, BIOTEC, Tatzberg 47/49, 01307 Dresden, Germany4Present address: Instituto de Fısica de Lıquidos y Sistemas Biologicos, CCT-CONICET-La Plata, UNLP, 1900 La Plata, Argentina
*Correspondence: [email protected]://dx.doi.org/10.1016/j.celrep.2015.01.006
This is an open access article under the CC BY-NC-ND license (http://creativecommons.org/licenses/by-nc-nd/3.0/).
SUMMARY
Cold-blooded animals, which cannot directly controltheir body temperatures, have adapted to functionwithin specific temperature ranges that vary betweenspecies. However, little is known about what sets thelimits of the viable temperature range. Here we showthat the speed of the first cell division in C. elegansN2 varies with temperature according to the Arrhe-nius equation. However, it does so only within certainlimits. Outside these limits we observe alterationsin the cell cycle. Interestingly, these temperaturelimits also correspond to the animal’s fertile range.In C. briggsae AF16, isolated from a warmer climaticregion, both the fertile range and the temperaturerange over which the speed of cell division followsthe Arrhenius equation, are shifted toward highertemperatures. Our findings suggest that the viablerange of an organism can be adapted in part to adifferent thermal range by adjusting the temperaturetolerance of cell division.
INTRODUCTION
The body temperature of cold-blooded animals is largely
determined by the ambient temperature. Therefore, they have
adapted to develop and function within temperature ranges
that are typical for their habitat. However, little is known about
what sets the limits of the viable temperature range of species
or how they adapt to a different thermal range. The early devel-
opment of embryos is thought to be particularly sensitive to
changes in temperature. Cold-blooded animals go to inordinate
lengths to keep their developing offspring under constant tem-
perature: bees actively regulate the temperature of their hives
(Stabentheiner et al., 2010; Bujok et al., 2002; Bonoan et al.,
2014), turtles return thousands of miles to the same location to
lay their eggs (Bowen et al., 1993;Weber et al., 2012), and lizards
take high risks to find thermally beneficial nesting sites (Angilletta
et al., 2009). One of the key features of early development is rapid
Ce
cell division. However, we lack understanding of how cell divi-
sions are affected by changes in temperature. The temperature
dependence of growth rates has been addressed in bacteria
(Johnson and Lewin, 1946) and plants (Parent et al., 2010), but
data on animals are sparse.
Caenorhabditis are ideal animals to address such questions. In
their natural habitat, free-livingnematodesaresubject todailyand
seasonal fluctuations in temperature (Felix and Braendle, 2010)
and have evolved to be viable over different ranges of
temperatures (Lyonset al., 1975).However, althoughadultworms
canwithstand short periods of heat shock (Lithgow et al., 1995), it
affects their fertility (AprisonandRuvinsky,2014).Growth temper-
atures above 25�Care stressful forC. elegans and lead to sterility;
this is true for natural isolates aswell as the lab strainN2 (Matsuba
et al., 2013; Hirsh et al., 1976; Anderson et al., 2011; Petrella,
2014). To date, five distinct clades of C. briggsae natural isolates
havebeen identified. The three tested clades (Temperature, Trop-
ical, and Nairobi) are fertile in temperatures up to 27�C or 30�C(Prasadet al., 2010;Cutter et al., 2010).C.briggsaeAF16, isolated
from India, belongs to the high-temperature-tolerant Tropical
clade (Prasad et al., 2010). Despite having diverged at least 18
million years ago (Hillier et al., 2007; Cutter, 2008), C. elegans
N2 and C. briggsae AF16 are almost morphologically identical
with the same mode of reproduction and similar numbers of
offspring. In both species, the early cell divisions are rapid,mean-
ing that the rate of cell division is generally faster than at later
stages of development (Deppe et al., 1978; Sulston and Horvitz,
1977; Sulston et al., 1983). Here, we characterize the effect of
temperature on the rate of the first cell division in two nematodes
adapted to different temperature niches.
RESULTS
Cell Division Time in C. elegans DecreasesExponentially with TemperatureWecharacterized the temperature dependenceof the first embry-
onic cell division of C. elegans between 4.5 and 30�C (Experi-
mental Procedures). Early one-cell embryos were shifted from
20�C to the test temperature and observed by time-lapse micro-
scopy. The length of the interval between pronuclear meeting
and cytokinesis onset (Figure 1A) is temperature dependent and
ll Reports 10, 647–653, February 10, 2015 ª2015 The Authors 647

A
B C
Figure 1. The Cell Cycle Interval Pronuclear
Meeting to Cytokinesis Onset Is Exponen-
tially Dependent on Temperature
(A) The events to determine cell division intervals
are indicated: DNA, blue; microtubules, green. AB
cell gives rise to somatic tissue. P1 is the germline
precursor cell. The anterior of the embryo is at the
left; posterior is at the right.
(B) Interval length for pronuclear meeting to cyto-
kinesis onset decreases with temperature for
C. elegans N2 (blue) and C. briggsae AF16 (red).
Inset: individual data points (n = 5–14) and means.
Main panel: means and SDs of the original data in
an Arrhenius plot: interval length on a log scale
(y axis) versus inverse of temperature in kelvins
(x axis). Secondary x axis: temperature in degrees
Celsius. Solid line: fit with an extension of the
Arrhenius equation; dashed line: Arrhenius fit.
(C) The mean fits for the bootstrapped data are
shown as a magnification of the region highlighted
in (B) (dashed box). T* and Tmin including the SD
for T*, Tmin and Timemin are shown. The difference
in T*, Tmin and Timemin between C. elegans and
C. briggsae was statistically significant (p < 0.001).
See also Supplemental Experimental Procedures,
Figures S1–S4 and Table S2.
decreases from 50min at 5�C to almost 5 min at 25�C (Figure 1B,
inset, inblue).Within this temperature range, interval times fell ona
straight line after logarithmic transformation of the time axis. It is
interesting that this resembles the empirical Arrhenius equation,
which describes the temperature-rate relationship of first-order
chemical reactions. Therefore, we chose to analyze our data by
fitting the Arrhenius equation
Timeðevent2�event1Þ =A expðEa=RTÞ�Figure 1B; main plot; dashed blue line;
Experimental ProceduresÞ:
An Arrhenius fit confirms that a process is exponentially depen-
dent on temperature if the data fall on a straight line when rates
are plotted on a log scale against the inverse of absolute temper-
ature. As shown in Figure 1B, cell division timing of theC. elegans
embryo decreases exponentially with temperature across
approximately 18�C.
The Rate of Cell Division Slows Down at HighTemperatureThe first embryonic cell division of C. elegans is sensitive to high
temperature stress and fails at 30�C (Movie S1). At 28�C, cellsdivide, but 19.4% (7/36) of embryos failed to establish proper
asymmetry in the second cell division. However, already above
25�C, cells show signs of heat stress, as cell division no longer
increases exponentially as predicted by the Arrhenius equation
(Figure 1B; Figure 2).
To improve the analysis of biological temperature-rate data
to include data points at high temperatures, which cannot be
fit by one exponential, Johnson et al. fit the growth rate of
E. coli with a four-parameter fit based on the transition state
theory of Eyring (1935), which includes a term accounting for
reversible protein denaturation at high temperature (Johnson
648 Cell Reports 10, 647–653, February 10, 2015 ª2015 The Authors
et al., 1942; Johnson and Lewin, 1946). Similarly, we developed
a four-parameter equation based on the Arrhenius equation
that contains an additional term to include the high temperature
data:
Timeðevent2�event1Þ =A1 expðE1=RTÞ+A2 expð�E2=RTÞðExperimental Procedures; Supplemental InformationÞ:
With this empirical fitting method, we can characterize the
temperature dependence of cell division in an unbiased way
without making assumptions about what limits cell division
timing at high temperatures. This also allows us to define the
temperature range over which cell division follows Arrhenius
kinetics by defining the characteristic temperature T*, which
is the temperature where the interval length no longer follows
an exponential decrease, and the temperature Tmin, where
cell division is fastest (Figure 1C). To estimate the error associ-
ated with these parameters, the fitting was conducted on 1,000
bootstrap replicates of the data for the interval pronuclear
meeting to cytokinesis onset (Figures 1C and S4; Supplemental
Experimental Procedures; Table S2). The mean and SD calcu-
lated from the fits of the bootstrapped data are hereinafter
given in parentheses after the values obtained from the original
data set.
The interval between pronuclear meeting and cytokinesis
onset decreased exponentially with increasing temperature up
to a T* of 23.6�C (23.0 ± 0.9), followed by a nonexponential
decrease to a minimum interval length at Tmin 26.4�C (26.4 ±
0.2), after which the interval length increases between 27 and
29�C (Figures 1B and 1C, in blue). It is interesting that
C. elegans becomes sterile beyond the temperature at which
the embryo reaches the maximum rate of cell division, 26.4�C(Figure 3B). This finding emphasizes that deviation from Arrhe-
nius, which ultimately leads to a slowing down of cell division,
2
4
8
16
32
64
128
Temperature [°C]
0
5
10
15
20
Tim
e [m
in]
105 15 20 25 30Temperature [°C]
0
20
40
60
Tim
e [m
in]
105 15 20 25 30
3.30 3.35 3.40 3.45 3.50 3.55 3.60 3.30 3.35 3.40 3.45 3.50 3.55 3.60 3.30 3.35 3.40 3.45 3.50 3.55 3.60
Tim
e (m
in)
Temperature (°C)
Temperature [°C]
0
5
10
15
20
Tim
e [m
in]
105 15 20 25 30
A CB
1
51015202530 51015202530 51015202530
Temperature-1 (1000/K)
AF16N2
AF16N2
AF16N2
Figure 2. Temperature Dependence of Three Consecutive Intervals Follows Different Slopes
(A) The interval from pronuclear meeting to nuclear envelope breakdown.
(B) The interval from nuclear envelope breakdown to cytokinesis onset.
(C) The interval from the cytokinesis onset to the end of cytokinesis.
Insets: individual data points (n = 5–14) andmeans. Main panels: means and SDs of the original data in an Arrhenius plot (axes are as for Figure 1).C. elegansN2 is
in blue; C. briggsae AF16 is in red. Solid line: fit with an extension of the Arrhenius equation; dashed line: Arrhenius fit.
See also Supplemental Experimental Procedures, Figures S2 and S3, and Table S2.
is an indicator of cellular stress and affects the development of
the organism.
The Reproductive Temperature Range Is Shifted toHigher Temperatures in C. briggsae
We next asked if the correlation between the Arrhenius range
of cell division and the fertile range holds true in nematodes
that survive higher temperatures. Variation in fitness between
C. elegans isolates at 25�C has previously been reported (Har-
vey and Viney, 2007), but none of the 12 natural isolates of
C. elegans we tested (Table S1) were fertile at 27�C. Therefore,we compared the survival of another well characterized Caeno-
rhabditis strain: C. briggsae AF16, which was reported to be
fertile up to 30�C (Prasad et al., 2010). A single C. briggsae
AF16 hermaphrodite could form a population after a 5�C in-
crease in temperature from 25 to 30�C, but C. elegans N2 could
not (Figure 3A). This experiment for C. elegans simulates a local
extinction of a nematode not adapted to survive at high temper-
atures (Felix and Duveau, 2012). To assess the fitness across
their full fertile temperature range, we compared the lifetime
fecundity ofC. elegans andC. briggsae hermaphrodites by mov-
ing individual eggs to the test temperature and counting their
progeny (Experimental Procedures). In our hands, both species
were viable for several generations over a span of 15�C:C. elegans between 10 and 25�C and C. briggsae between 14
and 29�C. C. elegans becomes sterile in the second generation
at 27�C, and C. briggsae does so at 30�C. Lifetime fecundity is
highly temperature dependent, with low numbers of offspring
at cold and hot temperatures and over 300 offspring at the
optimal temperature. The temperature at which single
C. elegans and C. briggsae hermaphrodites gave rise to
the highest number of offspring was determined by fitting a
Ce
parabola to the data (Figure 3B). The optimal temperature
was significantly shifted between both species: 18.2�C for
C. elegans and 21.5�C for C. briggsae. Considering the shift in
the fertile range and the optimal temperatures, we estimated a
shift of 3–4�C in reproductive fitness between C. elegans and
C. briggsae.
The Temperature Dependence of Cell Division Is Shiftedto Higher Temperatures in C. briggsae
These observations prompted us to ask how the cell cycle
length of C. briggsae responds to different temperatures. If there
were a link between the fertile range and the temperature
dependence of cell division, then we would expect the rate of
C. briggsae cell division to continue to increase exponentially
up to a higher temperature; alternatively, the temperature
response should be the same as it is for C. elegans. Analysis
of C. briggsae one-cell embryos revealed that the interval from
pronuclear meeting to cytokinesis onset again showed an expo-
nential decrease over a range of 18�C. However, the exponential
range extends toward warmer temperatures. The breakpoint
temperature T* of C. briggsae is at 26.6�C (26.9 ± 1.2; Figures
1B and 1C), 3.0�C higher than in C. elegans. The minimal interval
length Tmin is at 28.3�C (28.3 ± 0.3), 1.9�C higher than in
C. elegans (Figure 1C, in red; Table S2). The minimal interval
length was similar in C. elegans, 312 s (320 ± 6), and
C. briggsae, 300 s (294 ± 10). It is striking that data from both
species could be fit with the same slope across the Arrhenius
range (Figure 1B; Table S2; Supplemental Experimental Proce-
dures). At each temperature in this 9–25�C range, cell division
was slower inC. briggsae compared to that ofC. elegans. There-
fore, we tested if the C. briggsae data could be shifted along the
temperature or time axis to match the C. elegans data. Indeed, a
ll Reports 10, 647–653, February 10, 2015 ª2015 The Authors 649

10 15 20 25 30
Life
time
Fecu
ndity
0
100
200
300
400
500
A B
Temperature (°C)20 - 25 C 25 - 30 C
C. e
lega
ns N
2C
. brig
gsae
AF
16
AF16N2
21.518.2
Figure 3. The Fertile Range of C. briggsae
AF16 Is Shifted to a Higher Temperature
(A) Single hermaphrodites of C. elegans N2 (top) or
C. briggsae AF16 (bottom) were raised from eggs
at 20 or 25�C and shifted up by 5�C as adults.
Three days later, the plates were scored for the
ability to form a population. Scale bar, 2 mm.
(B) Total lifetime fecundity of individual hermaph-
rodites (n = 9–18) of C. elegans N2 (blue) and
C. briggsae AF16 (orange). Data were fit by a sec-
ond-order polynomial. Optimal temperatures are
indicated. Gray shading: the 95% confidence re-
gion of the respective fit. Comparison of the para-
bolic models by ANOVA confirmed a significant
shift between the two species (p < 0.001). Colored
shading on the top: temperature ranges where the
worms were fertile for several generations.
shift by 1.9�C toward lower temperatures resulted in a good
overlay (Figure S1). Thus, the Arrhenius range of C. briggsae
cell division is shifted by about 2�C toward higher temperatures,
compared to that of C. elegans. This confirms the connection
between the fertile range and the temperature dependence of
cell division.
Different Intervals of the Cell Cycle Show a DifferentResponse to Temperature that Is Conserved betweenC. elegans and C. briggsae
To test if different aspects of cell division are affected to the
same extent by temperature or if one process is rate limiting at
temperature extremes, we analyzed shorter intervals in both
species with our modified Arrhenius equation (Figure 2). Fitting
of the intervals from pronuclear meeting to nuclear envelope
breakdown and fromnuclear envelope breakdown to cytokinesis
onset (Figures 2A and 2B; these two intervals together make up
the interval pronuclear meeting to cytokinesis onset, which we
have already presented), as well as from cytokinesis onset to
end of cytokinesis (Figure 2C), revealed that the timing of all
analyzed aspects of cell division change with temperature.
However, not all intervals of the same species (C. elegans or
C. briggsae) could be fit with the same slope (Figure 2; Figure S2).
In chemistry, this would indicate that the timing of the intervals is
determined by different reactions. Analysis of these intervals
confirmed our previous observations in two ways: first, the
Arrhenius range for the same intervals of C. elegans and
C. briggsae could be fit with the same slope; and second, the
breakpoint temperature T* is always at a higher temperature by
2–3�C in C. briggsae than in C. elegans (Figure 2; Table S2).
It also revealed that not all rates follow Arrhenius at cold tem-
peratures. In C. elegans, the interval from pronuclear meeting to
nuclear envelope breakdown is shorter than predicted for an
exponential increase at temperatures below 10�C (Figure 2A,
blue dotted line). However, for the interval from nuclear envelope
breakdown to cytokinesis onset, the cell cycle interval is longer
than expected (Figure 2B, blue dotted line). In fact, it seems
that the timing of nuclear envelope breakdown is sensitive to
cold temperatures and occurs earlier than predicted by Arrhe-
nius kinetics when cells from C. elegans are placed below
10�C and cells from C. briggsae are placed below 14�C. Taking
650 Cell Reports 10, 647–653, February 10, 2015 ª2015 The Authors
all analyzed intervals into account, this results in a 15�C range,
where all aspects of cell division timing follow Arrhenius. Intrigu-
ingly, the temperatures at which tight coordination of different
aspects of cell division is lost correspond to the lower limits of
fertility in both species.
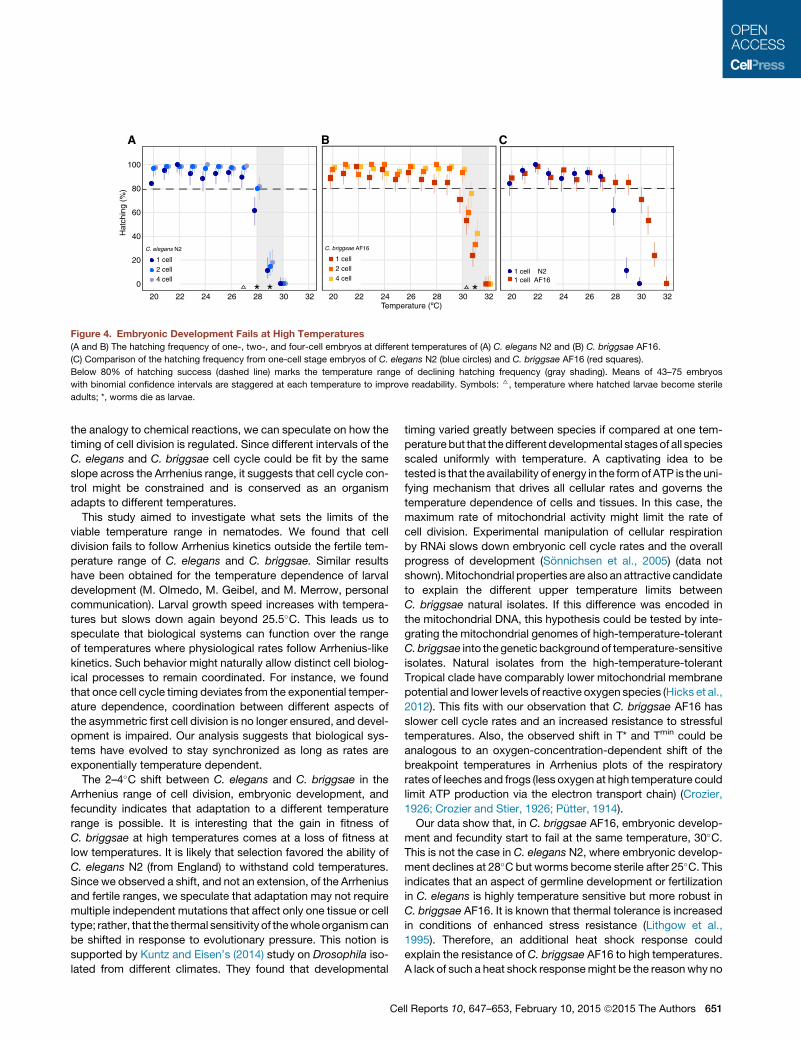
The Upper Temperature of Successful EmbryonicDevelopment Is Shifted between C. elegans andC. briggsae
We next asked if the observed shift in the Arrhenius range of cell
division between C. elegans and the high-temperature-tolerant
C. briggsae is relevant for the development of the organism.
We monitored the rate of hatching success from one-cell, two-
cell, or four-cell embryos to determine the thermal sensitivity of
embryonic development (Figure 4; Experimental Procedures).
In general, the hatching success of one-cell embryos was lower
than for later embryos.We speculate that they aremore sensitive
to manipulation as the eggshell in early one-cell embryos is not
yet fully formed (Olson et al., 2012). Hatching success declined
below 80% for one-cell embryos at 28�C for C. elegans and
30�C for C. briggsae. Embryonic development fails at 30�C for
C. elegans and at 32�C for C. briggsae (Figure 4B). These data
show that the upper temperature limit of successful embryonic
development is shifted by 2�C between C. elegans and
C. briggsae—the same temperature shift we found for the Arrhe-
nius range of cell division.
DISCUSSION
Our most important finding is that the first cell divisions of
C. elegans and C. briggsae embryos show the same kinetics
as first-order chemical reactions across their fertile temperature
range: they follow the Arrhenius equation. The rates of many
other complex biological processes also have Arrhenius-like
kinetics (Crozier and Stier, 1926; Putter, 1914; Vanoni et al.,
1984), including the flashing of fireflies and the speed of ants
(Laidler, 1972). In chemistry, the rate-limiting reaction can often
be deduced from the Arrhenius fit. In complex biological sys-
tems, such an approach is not feasible. Nevertheless, the ob-
tained parameters can be used to compare the temperature
dependence of cell division between the two species. Bymaking
0
20
40
60
80
100
Hat
chin
g (%
)
A
20 22 24 26 28 30 3220 22 24 26 28 30 32 20 22 24 26 28 30 32
Temperature (ºC)Temperature (ºC)
Hat
chin
g (%
)
C
1 cell N2 1 cell AF16
B
1 cell2 cell4 cell
Temper
C. elegans N2
* * *
1 cell2 cell4 cell
C. briggsae AF16
Figure 4. Embryonic Development Fails at High Temperatures
(A and B) The hatching frequency of one-, two-, and four-cell embryos at different temperatures of (A) C. elegans N2 and (B) C. briggsae AF16.
(C) Comparison of the hatching frequency from one-cell stage embryos of C. elegans N2 (blue circles) and C. briggsae AF16 (red squares).
Below 80% of hatching success (dashed line) marks the temperature range of declining hatching frequency (gray shading). Means of 43–75 embryos
with binomial confidence intervals are staggered at each temperature to improve readability. Symbols: 6, temperature where hatched larvae become sterile
adults; *, worms die as larvae.
the analogy to chemical reactions, we can speculate on how the
timing of cell division is regulated. Since different intervals of the
C. elegans and C. briggsae cell cycle could be fit by the same
slope across the Arrhenius range, it suggests that cell cycle con-
trol might be constrained and is conserved as an organism
adapts to different temperatures.
This study aimed to investigate what sets the limits of the
viable temperature range in nematodes. We found that cell
division fails to follow Arrhenius kinetics outside the fertile tem-
perature range of C. elegans and C. briggsae. Similar results
have been obtained for the temperature dependence of larval
development (M. Olmedo, M. Geibel, and M. Merrow, personal
communication). Larval growth speed increases with tempera-
tures but slows down again beyond 25.5�C. This leads us to
speculate that biological systems can function over the range
of temperatures where physiological rates follow Arrhenius-like
kinetics. Such behavior might naturally allow distinct cell biolog-
ical processes to remain coordinated. For instance, we found
that once cell cycle timing deviates from the exponential temper-
ature dependence, coordination between different aspects of
the asymmetric first cell division is no longer ensured, and devel-
opment is impaired. Our analysis suggests that biological sys-
tems have evolved to stay synchronized as long as rates are
exponentially temperature dependent.
The 2–4�C shift between C. elegans and C. briggsae in the
Arrhenius range of cell division, embryonic development, and
fecundity indicates that adaptation to a different temperature
range is possible. It is interesting that the gain in fitness of
C. briggsae at high temperatures comes at a loss of fitness at
low temperatures. It is likely that selection favored the ability of
C. elegans N2 (from England) to withstand cold temperatures.
Since we observed a shift, and not an extension, of the Arrhenius
and fertile ranges, we speculate that adaptation may not require
multiple independent mutations that affect only one tissue or cell
type; rather, that the thermal sensitivity of thewholeorganismcan
be shifted in response to evolutionary pressure. This notion is
supported by Kuntz and Eisen’s (2014) study on Drosophila iso-
lated from different climates. They found that developmental
Ce
timing varied greatly between species if compared at one tem-
peraturebut that thedifferent developmental stagesof all species
scaled uniformly with temperature. A captivating idea to be
tested is that the availability of energy in the formofATP is the uni-
fying mechanism that drives all cellular rates and governs the
temperature dependence of cells and tissues. In this case, the
maximum rate of mitochondrial activity might limit the rate of
cell division. Experimental manipulation of cellular respiration
by RNAi slows down embryonic cell cycle rates and the overall
progress of development (Sonnichsen et al., 2005) (data not
shown).Mitochondrial properties are also an attractive candidate
to explain the different upper temperature limits between
C. briggsae natural isolates. If this difference was encoded in
the mitochondrial DNA, this hypothesis could be tested by inte-
grating the mitochondrial genomes of high-temperature-tolerant
C.briggsae into thegenetic backgroundof temperature-sensitive
isolates. Natural isolates from the high-temperature-tolerant
Tropical clade have comparably lower mitochondrial membrane
potential and lower levels of reactive oxygen species (Hicks et al.,
2012). This fits with our observation that C. briggsae AF16 has
slower cell cycle rates and an increased resistance to stressful
temperatures. Also, the observed shift in T* and Tmin could be
analogous to an oxygen-concentration-dependent shift of the
breakpoint temperatures in Arrhenius plots of the respiratory
rates of leeches and frogs (less oxygen at high temperature could
limit ATP production via the electron transport chain) (Crozier,
1926; Crozier and Stier, 1926; Putter, 1914).
Our data show that, in C. briggsae AF16, embryonic develop-
ment and fecundity start to fail at the same temperature, 30�C.This is not the case in C. elegans N2, where embryonic develop-
ment declines at 28�C but worms become sterile after 25�C. Thisindicates that an aspect of germline development or fertilization
in C. elegans is highly temperature sensitive but more robust in
C. briggsae AF16. It is known that thermal tolerance is increased
in conditions of enhanced stress resistance (Lithgow et al.,
1995). Therefore, an additional heat shock response could
explain the resistance of C. briggsae AF16 to high temperatures.
A lack of such a heat shock responsemight be the reasonwhy no
ll Reports 10, 647–653, February 10, 2015 ª2015 The Authors 651

C. elegans isolate has been found that can be cultivated beyond
25�C (Anderson et al., 2011; Hirsh et al., 1976) (Table S1). Alter-
natively, it is also possible that C. elegans has experienced less
selective pressure during evolution to adapt to high temperature,
perhaps because temperatures above 26�C induce the resistant
dauer stage that can survive harsh conditions (Ailion and
Thomas, 2000). Dauer formation is not induced in C. briggsae
AF16 at high temperatures (Inoue et al., 2007).
The fact that a 2�C shift in temperature can be so deleterious
to early cell divisions suggests why ectothermic and egg-laying
species are vulnerable to climate change. Our data show that
there are likely to be adaptive mechanisms to ensure successful
cell division at varying temperatures, at least in the diverse
phylum of nematodes. So far, we have only looked at two
different species, so we cannot say whether this indeed repre-
sents an adaptive mechanism. Further analysis in different spe-
cies and a molecular understanding of these mechanisms will be
essential steps in assessing how rapidly organisms can adapt to
changing temperature.
EXPERIMENTAL PROCEDURES
Worm Handling
C. elegans N2 and C. briggsae AF16 were maintained as described elsewhere
(Brenner, 1974). The temperature 20�C was chosen for cultivation, as it is the
temperature with which both species seemed equally fit, based on fertility.
Strains were supplied by the Caenorhabditis Genetics Center (University of
Minnesota), which is funded by the NIH Office of Research Infrastructure
Programs (P40 OD010440).
Temperature-Controlled Imaging
One-cell embryosweredissected fromhermaphrodites inM9buffer at 20�Cand
mounted on agarose pads. Temperature-controlled differential interference
contrast (DIC) microscopy was achieved using a custom-made jacket, fitting
the oil-immersion objective, which was temperature regulated by a water
bath. Room temperature was at 20�C for imaging at 15�C and higher and at
4�C for experiments below 15�C. The 12�C data point for C. elegans is omitted,
aswe could not keep this temperature stable after a change of seasons. Images
were acquired every 6–20 s, depending on acquisition temperature. Our data
were obtained after shifting the early embryo from 20�C to the test temperature.
Cellular rates responded to theshift in temperaturewithinseconds.Alternatively,
one could have cultivated worms across a temperature range to let them adjust
to the test temperatures. However, this approach would not have allowed us to
gather data for the stressful temperatures, at which worms become sterile.
Analysis of Cell Cycle Intervals
The events to determine cell division intervals were tracked manually from
DIC time-lapse images in ImageJ (http://rsbweb.nih.gov/ij/index.html). The
exponential range of the data was fit by the Arrhenius equation, using time
instead of rates: Time(event2 � event1) = A exp(Ea/RT), where time (in minutes)
is the interval between two events, Ea (in kilojoules per mole) is the activation
energy, A (in minutes) is the frequency factor, R (in joules per mole kelvin) is
the gas constant, and T is the temperature in kelvins. To include the high tem-
perature points, a two-exponential expression was used:
Timeðevent2�event1Þ =A1 expðE1=RTÞ+A2 expð�E2=RTÞ; E1>0; E2>0
ðSupplemental Experimental Procedures; Table S2Þ:
T* was defined by a 5%deviation from the Arrhenius fit. Tmin is the temperature
at which the shortest interval time is reached. Onlymovies inwhich cell division
was completed successfully were analyzed. The mean and SD of T*, Tmin, and
Timemin were estimated from fits after bootstrapping with 1,000 random
resamples (Supplemental Experimental Procedures; Figure S4; Table S2).
These parameters were then compared between C. elegans and C. briggsae
652 Cell Reports 10, 647–653, February 10, 2015 ª2015 The Authors
by t test using the estimated mean and SD. For all tests, the significance level
(type 1 error) was set to a = 0.001.
Lifetime Fecundity
The total number of offspring was counted for individual hermaphrodites. Her-
maphrodites were raised at the test temperature from eggs laid at 20�C and
moved to new prewarmedOP50 plates at regular intervals to avoid overcrowd-
ing. Worms that did not survive until egg laying ceased were excluded from
analysis. Their progeny developed at the test temperature and were counted
at the L4 larval stage. The optimal temperature for fecundity was determined
by fitting a parabola to fecundity versus temperature data for C. elegans and
C. briggsae separately. These parabolic models were then compared against
each other in an ANOVA using R. For all tests, the significance level (type 1
error) was set to a = 0.001.
Hatching Success
Embryos were dissected in M9 buffer from adults at 20�C and mouth pipetted
at the one-cell, two-cell, or four-cell stage onto prewarmed E. coli OP50
spotted agar plates at the test temperature. Plates were kept at the test tem-
perature until dead eggs and hatched larvae were counted. Worms were
tested for larval arrest and fertility for two generations. Binomial confidence
intervals were calculated with Binconf, Exact Method in R.
SUPPLEMENTAL INFORMATION
Supplemental Information includes Supplemental Experimental Procedures,
four figures, two tables, and onemovie and can be foundwith this article online
at http://dx.doi.org/10.1016/j.celrep.2015.01.006.
AUTHOR CONTRIBUTIONS
M.L.B., M.L., S.W.G., and A.A.H. designed the study; M.L.B. performed the
experiments with support from M.L.; M.L.B. and F.V. analyzed the data; F.V.
developed the fitting of the temperature dependence of cell division; M.L.B.,
M.L., and A.A.H. wrote the manuscript, with support from F.V. and S.W.G.
ACKNOWLEDGMENTS
We acknowledge A. Zinke and M. Kayhan for technical assistance with exper-
iments; A. Klopper, J. Gharakhani, and M. Jahnel for helpful discussions; and
N. Goehring, C. Brangwynne, and C. Hoege for critical reading of an earlier
version of the manuscript. M.L.B. was supported by grant 031A099 from the
German Federal Ministry of Education and Research (BMBF). M.L. was sup-
ported by an EMBO long-term fellowship, and S.W.G. was supported by grant
281903 from the European Research Council.
Received: September 11, 2014
Revised: December 1, 2014
Accepted: December 29, 2014
Published: February 5, 2015
REFERENCES
Ailion, M., and Thomas, J.H. (2000). Dauer formation induced by high temper-
atures in Caenorhabditis elegans. Genetics 156, 1047–1067.
Anderson, J.L., Albergotti, L., Ellebracht, B., Huey, R.B., and Phillips, P.C.
(2011). Does thermoregulatory behavior maximize reproductive fitness of
natural isolates of Caenorhabditis elegans? BMC Evol. Biol. 11, 157.
Angilletta, M.J., Jr., Sears, M.W., and Pringle, R.M. (2009). Spatial dynamics of
nesting behavior: lizards shift microhabitats to construct nests with beneficial
thermal properties. Ecology 90, 2933–2939.
Aprison, E.Z., and Ruvinsky, I. (2014). Balanced trade-offs between alternative
strategies shape the response of C. elegans reproduction to chronic heat
stress. PLoS ONE 9, e105513.

Bonoan, R.E., Goldman, R.R.,Wong, P.Y., and Starks, P.T. (2014). Vasculature
of the hive: heat dissipation in the honey bee (Apismellifera) hive. Naturwissen-
schaften 101, 459–465.
Bowen, B., Avise, J.C., Richardson, J.I., Meylan, A.B., Margaritoulis, D., and
Hopkins Murphy, S.R. (1993). Population structure of loggerhead turtles
(Caretta caretta) in the northwestern Atlantic Ocean and Mediterranean Sea.
Conservation Biology 7, 834–844.
Brenner, S. (1974). The genetics of Caenorhabditis elegans. Genetics 77,
71–94.
Bujok, B., Kleinhenz, M., Fuchs, S., and Tautz, J. (2002). Hot spots in the bee
hive. Naturwissenschaften 89, 299–301.
Crozier, W.J. (1926). On curves of growth, especially in relation to temperature.
The Journal of General Physiology 10, 1–21.
Crozier, W.J., and Stier, T.J. (1926). On the modification of temperature char-
acteristics. J. Gen. Physiol. 9, 547–559.
Cutter, A.D. (2008). Divergence times in Caenorhabditis and Drosophila
inferred from direct estimates of the neutral mutation rate. Mol. Biol. Evol.
25, 778–786.
Cutter, A.D., Yan,W., Tsvetkov, N., Sunil, S., and Felix, M.-A. (2010). Molecular
population genetics and phenotypic sensitivity to ethanol for a globally diverse
sample of the nematode Caenorhabditis briggsae. Mol. Ecol. 19, 798–809.
Deppe, U., Schierenberg, E., Cole, T., Krieg, C., Schmitt, D., Yoder, B., and von
Ehrenstein, G. (1978). Cell lineages of the embryo of the nematode Caenorhab-
ditis elegans. Proc. Natl. Acad. Sci. USA 75, 376–380.
Eyring, H. (1935). The activated complex in chemical reactions. J. Chem. Phys.
3, 107.
Felix, M.-A., and Braendle, C. (2010). The natural history of Caenorhabditis
elegans. Curr. Biol. 20, R965–R969.
Felix, M.-A., and Duveau, F. (2012). Population dynamics and habitat sharing
of natural populations of Caenorhabditis elegans and C. briggsae. BMC Biol.
10, 59.
Harvey, S.C., and Viney, M.E. (2007). Thermal variation reveals natural
variation between isolates of Caenorhabditis elegans. J. Exp. Zoolog. B Mol.
Dev. Evol. 308, 409–416.
Hicks, K.A., Howe, D.K., Leung, A., Denver, D.R., and Estes, S. (2012). In vivo
quantification reveals extensive natural variation in mitochondrial form and
function in Caenorhabditis briggsae. PLoS One 7, e43837.
Hillier, L.W., Miller, R.D., Baird, S.E., Chinwalla, A., Fulton, L.A., Koboldt, D.C.,
and Waterston, R.H. (2007). Comparison of C. elegans and C. briggsae
genome sequences reveals extensive conservation of chromosome organi-
zation and synteny. PLoS Biol. 5, e167.
Hirsh, D., Oppenheim, D., and Klass, M. (1976). Development of the reproduc-
tive system of Caenorhabditis elegans. Dev. Biol. 49, 200–219.
Inoue, T., Ailion, M., Poon, S., Kim, H.K., Thomas, J.H., and Sternberg, P.W.
(2007). Genetic analysis of dauer formation in Caenorhabditis briggsae.
Genetics 177, 809–818.
Johnson, F.H., and Lewin, I. (1946). The growth rate of E. coli in relation to
temperature, quinine and coenzyme. J. Cell. Physiol. 28, 47–75.
Ce
Johnson, F., Eyring, H., and Williams, R. (1942). The nature of enzyme inhibi-
tions in bacterial luminescence: sulfanilamide, urethane, temperature and
pressure. J. Cell. Comp. Physiol. 20, 247–268.
Kuntz, S.G., and Eisen, M.B. (2014). Drosophila embryogenesis scales uni-
formly across temperature in developmentally diverse species. PLoS Genet.
10, e1004293.
Laidler, K. (1972). Unconventional applications of the Arrhenius law. J. Chem.
Educ. 49, 343–344.
Lithgow, G.J., White, T.M., Melov, S., and Johnson, T.E. (1995). Thermotoler-
ance and extended life-span conferred by single-gene mutations and induced
by thermal stress. Proc. Natl. Acad. Sci. USA 92, 7540–7544.
Lyons, J.M., Keith, A.D., and Thomason, I.J. (1975). Temperature-induced
phase transitions in nematode lipids and their influence on respiration.
J. Nematol. 7, 98–104.
Matsuba, C., Ostrow, D.G., Salomon, M.P., Tolani, A., and Baer, C.F. (2013).
Temperature, stress and spontaneous mutation in Caenorhabditis briggsae
and Caenorhabditis elegans. Biol. Lett. 9, 20120334.
Olson, S.K., Greenan, G., Desai, A., Muller-Reichert, T., and Oegema, K.
(2012). Hierarchical assembly of the eggshell and permeability barrier in
C. elegans. J. Cell Biol. 198, 731–748.
Parent, B., Turc, O., Gibon, Y., Stitt, M., and Tardieu, F. (2010). Modelling
temperature-compensated physiological rates, based on the co-ordination
of responses to temperature of developmental processes. J. Exp. Bot. 61,
2057–2069.
Petrella, L.N. (2014). Natural variants of C. elegans demonstrate defects in
both sperm function and oogenesis at elevated temperatures. PLoS ONE 9,
e112377.
Prasad, A., Croydon-Sugarman, M.J.F., Murray, R.L., and Cutter, A.D. (2010).
Temperature-dependent fecundity associates with latitude in Caenorhabditis
briggsae. Evolution 65, 52–63.
Putter, A. (1914). Temperaturkoeffizienten [Temperature coefficient]. Allge-
meine Physiologie 16, 1–55.
Sonnichsen, B., Koski, L.B., Walsh, A., Marschall, P., Neumann, B., Brehm,M.,
Alleaume, A.-M., Artelt, J., Bettencourt, P., Cassin, E., et al. (2005).
Full-genome RNAi profiling of early embryogenesis in Caenorhabditis elegans.
Nature 434, 462–469.
Stabentheiner, A., Kovac, H., and Brodschneider, R. (2010). Honeybee colony
thermoregulation—regulatory mechanisms and contribution of individuals in
dependence on age, location and thermal stress. PLoS ONE 5, e8967.
Sulston, J.E., and Horvitz, H.R. (1977). Post-embryonic cell lineages of the
nematode, Caenorhabditis elegans. Dev. Biol. 56, 110–156.
Sulston, J.E., Schierenberg, E., White, J.G., and Thomson, J.N. (1983). The
embryonic cell lineage of the nematode Caenorhabditis elegans. Dev. Biol.
100, 64–119.
Vanoni, M., Vai, M., and Frascotti, G. (1984). Effects of temperature on the
yeast cell cycle analyzed by flow cytometry. Cytometry 5, 530–533.
Weber, S.B., Broderick, A.C., Groothuis, T.G.G., Ellick, J., Godley, B.J., and
Blount, J.D. (2012). Fine-scale thermal adaptation in a green turtle nesting
population. Proc. Biol. Sci. 279, 1077–1084.
ll Reports 10, 647–653, February 10, 2015 ª2015 The Authors 653