TEM Imaging of Dislocation Kinks, their Motion and Pinning
15
HAL Id: jpa-00249722 https://hal.archives-ouvertes.fr/jpa-00249722 Submitted on 1 Jan 1997 HAL is a multi-disciplinary open access archive for the deposit and dissemination of sci- entific research documents, whether they are pub- lished or not. The documents may come from teaching and research institutions in France or abroad, or from public or private research centers. L’archive ouverte pluridisciplinaire HAL, est destinée au dépôt et à la diffusion de documents scientifiques de niveau recherche, publiés ou non, émanant des établissements d’enseignement et de recherche français ou étrangers, des laboratoires publics ou privés. TEM Imaging of Dislocation Kinks, their Motion and Pinning J. Spence, H. Kolar, H. Alexander To cite this version: J. Spence, H. Kolar, H. Alexander. TEM Imaging of Dislocation Kinks, their Motion and Pinning. Journal de Physique III, EDP Sciences, 1997, 7 (12), pp.2325-2338. 10.1051/jp3:1997262. jpa- 00249722
Transcript of TEM Imaging of Dislocation Kinks, their Motion and Pinning

HAL Id: jpa-00249722https://hal.archives-ouvertes.fr/jpa-00249722
Submitted on 1 Jan 1997
HAL is a multi-disciplinary open accessarchive for the deposit and dissemination of sci-entific research documents, whether they are pub-lished or not. The documents may come fromteaching and research institutions in France orabroad, or from public or private research centers.
L’archive ouverte pluridisciplinaire HAL, estdestinée au dépôt et à la diffusion de documentsscientifiques de niveau recherche, publiés ou non,émanant des établissements d’enseignement et derecherche français ou étrangers, des laboratoirespublics ou privés.
TEM Imaging of Dislocation Kinks, their Motion andPinning
J. Spence, H. Kolar, H. Alexander
To cite this version:J. Spence, H. Kolar, H. Alexander. TEM Imaging of Dislocation Kinks, their Motion and Pinning.Journal de Physique III, EDP Sciences, 1997, 7 (12), pp.2325-2338. �10.1051/jp3:1997262�. �jpa-00249722�

J, Phys. III Ffance 7 (1997) 2325-2338 DECEMBER 1997, PAGE 2325
TEM Imaging of Dislocation Kinks, their Motion and Pinning
J.C.H. Spence (~,*), H.R. Kolar (~) and H. Alexander (~)
(~) Department of Physics and SEM, Arizona State University, Tempe, AZ. 85287, U S.A
(~) Universitht zu K61n, Abteilung fur Metallphysikim II Physikalishen Institut,
Ziilpicher Str 77, 50937, K61n, Germany
(lleceived 3 OCtober1996, revised 10 June 1997, accepted 21 August 1997)
PACS 61 72.-y Defects and impurities in crystals
PACS 73 61-r Electrical properties of specific thin films and layer structures
PACS 62 20.Fe Deformation and plasticity
Abstract. HREM lattice images have been obtained using '~forbidden" reflections generatedby (ill) stacking faults
m silicon lying normal to the beam at temperatures up to 600 °C.
Stationary and video images of 30°/90° partial dislocations relaxing toward equilibrium are
studied. The lattice images formed from these forbidden reflections show directional fluctuations
which are believed to be kinks, since, as expected from mobility measurements, a higher density
isobserved on 90° partials than on
30° partials, whereas artifacts contribute equally. Video
difference images are used to obtain direct estimates of kink velocity Observations of kink delay
at obstacles, thought to be oxygen atoms at the dislocation core, yield unpinning energies and
the parameters of the obstacle theory of kink motion. The kink formation energy is obtained
from the distribution of kink pair separations in low-dose images The kink migration rather
than formation energy barrier is thus found to control the velocity of unobstructed dislocations
in silicon under these experimental conditions.
1. Introduction
The oldest question in semiconductor dislocation theory remains to be answered what limits
dislocation velocity for given conditions of stress and temperature. Candidates for the rate-
limiting process include the double kink formation energy 2Fk, the migration energy Wm, and
kink obstacles, possibly on an atomic scale. In an earlier paper ill,we showed that TEM
images formed using certain space-group-forbidden Bragg reflections in silicon maybe used to
directly reveal dislocation cores running normal to the electron beam at a resolution of about
0.3 nm. The aim of this work is to address this old question using new lattice images of movingand stationary kinks, obtained by the "forbidden reflection" method [2j.The images reveal the
position of kinks (withsome uncertainty), not their structure. Kink movement was induced by
warming in the TEM samples containing quenched-in stacking faults (SF) of non-equilibriumspacing.
It is worth considering first the information which could in principle be obtained from im-
ages of kinks, stationary and in motion, at the 0.3 nm resolution level. FIom recordings of
(*) Author for correspondence (e-mail. [email protected])
@ Les #ditions de Physique 1997

2326 JOURNAL DE PHYSIQUE III N°12
kink velocity at known temperature and stress (as discussed more quantitatively below)an
Arhenius plot might yield kink migration activation energies (different for left and right kinks
[3j and, from the pre-factor given by the intercept, the entropy term might also be obtained.
Very little is known about this term [4j. These results could be obtained for both partials
on dissociated dislocations, comparisons made and the stress dependence of the kink velocitydetermined. Measurements of kink density at low stress would yield directly the double kink
formation energy. But perhaps more importantly, "movies" of kink motion would answer the
question "Are kinks colliding" [5j, and so provide a direct test of the Hirth-Lothe theory and
its two regimes. In addition, the observation of kink delay at obstacles and the measurement
of waiting times would yield unpinning energies and provide a test of the obstacle theory of
dislocation motion [6j The proposed correlation between kink nucleation events on different
partials could be sought [7j. Finally, the possibility of entirely new phenomena and mecha-
nisms might be observed. All this information could be provided by an imaging method which
allows the position of a kink to be locahsed to within about 0.5 nm, and does not require an
image interpretable at the atomic resolution level. Earlier dynamical simulations of HREM
images of kinks [8j have shown that obstacles, such as foreign atoms, could not be identified
in such images, and many processes (suchas kink nucleation at impurities or
solitons) would
require much higher spatial resolution for st.ructural analysis. The distinction between hetero-
geneous and homogeneous kink nucleation could, however, probably be made using our 0.3 nm
resolution video images under ideal conditions. In fact our original aim was to make a direct
measurement of the nucleation energy barrier (Eq. (5) below) for comparison with the Seeger-Schiller model, from the measured kink pair distribution function, however this has proven an
overly ambitious aim!
Two major experimental difficulties must at once be confronted: the difficulty of distin-
guishing the effects of atomic-scale surface roughness from kinks in HREM images, which are
projections through thin samples, and the effects of electron-beam induced damage or enhance-
ment of glide [9,10j. Our approaches to these two problems has beenas follows. By subtracting
successive images which are identical apart from the effects of kink motion we hoped to elim-
inate the effects of surface roughness. By working below the knock-on threshold for damage,using low-dose techniques and the new Fuji image plates and a CCD camera as detectors,
and by turning off the beam during kink motion in certain experiments we planned also to
make beam-induced effects negligible. A final difficulty is the accurate control of temperatureneeded to obtain a kink velocity for given stress which is measurable using video-rate imaging.Thickness variations in the sample mean that only a very limited field of view can be obtained.
Experimental work on kink nucleation and growth in semiconductors is summarized else-
where ill]a recent paper proposes several new low energy mechanisms for kink motion [3j.
2. "Forbidden" Bragg Reflections and their Uses
We commence with a review of the forbidden reflection lattice image method. In 1971, Lynchperformed three-dimensional multiple scattering calculations for gold [lllj zone-axis electron
diffraction patterns, and noted the occurrence of additional reflections at the (212) /3 positions
in computed and experimental patterns if the crystal contained p # 3m layers of atoms (man
integer) [12j. Figure I indicates the location of these reflections. Such reflections are forbidden
by the symmetry elements of the space group for a crystal of infinite dimensions. Calculations
for similar "termination" reflections in MgO were subsequently reported [13j. TEM dark-field
images were first formed with these reflections by Cherns in 1974, who used them to image
monatomic surface steps on(ill) gold films [14j. Dynamical calculations [lsj showed the
optimum orientation and thickness to be used. Although there are no termination reflections

N°12 TEM KINK MOVIES 2327
,
Fig I Experimental CBED pattern from an intrinsic stacking faulton
(I I I)m silicon lying
normal to the beam. The ~'termination" (i14) /3 type forbidden reflections can be clearlyseen
inside
the bulk allowed (220) reflections. Circle shows aperture used for imaging (Philips FEG 400 ST, 120
kV Probe size about 2 nm) The (I -I I) reciprocal lattice point lies directly above (212)/3.
in the wurtzite structure (because the (212) /3 reflections are then the fundamental reflections
of the three-dimensional hexagonal structure), similar contrast effects have been analyzed at
SF's in this structure [16j. With the development of ultra-high vacuum transmission electron
microscopy, these same termination reflections could be identified in transmission patterns from
thin (ill) silicon crystals with (7 x 7) reconstructed surfaces [17j and analyzed [18j. These
reflections can also occur in f.c.c. and diamond structure materials due to twinning, or to
SF's parallel to the surface. They were first observed as additional spots in microdiffraction
patterns from stacking faults in 1986, using a field-emission STEM probe narrower than the
ribbon of SF separating two partial dislocations [19j. Figure I shows such a pattern, obtained
using convergent-beam electron diffraction (CBED). Since the edges of the SF ribbon define
partial dislocation cores, an image formed with the inner six of these ~'termination" or forbidden
reflections in the (ill)zone provides a lattice image of the SF alone, and its boundary at the
dislocation core. The d-spacing for the "forbidden" planes is d422"
h=
0 33 nm, or one
Peierls valley wide. These valleys run along the < 011 > tunnels in the diamond structure,
orthogonal to (212) /3. Additional studies based on the use of termination reflections can be
found elsewhere [20, 21j.
Termination reflections may be understood in several ways. A single ill I) double layer of
silicon atoms produces a much denser reciprocal lattice (which includes (212) /3 reflections) than
does an infinite crystal. This occurs because atoms in a single double layer are more sparselypacked that those in a
[lllj projection of three double layers, which overlap in projection.leading to a less dense reciprocal lattice without g =
(212)/3 type reflections. Dark field
images formed with them show single atomic-height surface steps on thin foils. This can be
understood as follows. Firstly we note that, if the j-I, -I, -lj beam direction is taken into the
foil, then a (I -I I) reflection lies in the first order Laue zone(FOLZ) directly above the (212) /3
ZOLZ termination reflection shown in Figure I We can thus consider the (212) /3 ZOLZ spot
2328 JOURNAL DE PHYSIQUE III N°12
C~ B
c
o
Fig. 2. Argand diagram for a(§§4/3 reflection in silicon Real part of structure factor F plotted
vertically, imaginary part horizontal. The kinematic amplitude of Bragg scattering is proportional to
a vector from the origin to one corner of the figure. A crystal with stacking sequence ABCAB/ABCAproduces the amplitude v3 F shown.
to be the tail of the crystal shape-transform (or rocking curve) laid down around the (I -I I)HOLZ spot, and extending down into the ZOLZ. Since the (I, -I, I) reflection is weak in the
ZOLZ, kinematic theory can be used to give the intensity of the (I, -I, I) beam as
4glz) l~= z2a2v/ ~~~~l~rzsg)_l7rzSg)~
ii)
The period of this function in z(giving rise to thickness fringes) is L
=Sp~. The excitation
error Sg of the (1 -1 1) FOLZ reflection evaluated in the ZOLZ (i.e. at the (212)/3 posi-tion) is just equal to the height of the FOLZ, or g(111) j/3
=
(vita)/3=
1/(3diii)~
Siii,where a is the silicon conventional cubic cell constant. Thus the period of thickness fringes is
to=
3diii"
0.94 nm, and we expect a sinusoidal intensity variation with thickness, with a
period of three atomic double-layers- Termination reflections thus give ~'weak beam" thickness
fringes with the period of the lattice in the beam direction.
This approximate treatment assumes that the (212)/3 reflection is at the Bragg condition
(rather than the ill ljzone axis orientation used in these experiments), and it ignores atomic
structure within the 0.94 nm spacing along the beam path. Alternatively, we may explicitlyevaluate the (212) /3 structure factor for silicon. If we choose an unconventional hexagonal unit
cell for silicon with the c axis along the cubic ill lj direction so that atoms have coordinates
such as(1/3, 1/3, 1/3) etc., then a "forbidden" reflection g has hexagonal indices such as
(11.0), and its structure factor becomes
Vg = ~~(~~ ~j f)(g)exp(-2~rg rj)= ~~(~~2 f~(g) ~j exp(-4n~ri13) (2)
j
o
for a crystal of N double layers, again at the Bragg condition for (212)/3 (cubic indices).Here Vg is in volts, Q is the cell volume and f~(g) the electron structure factor. Each term
m the final sum is proportional to the scattering from one double layer, and these terms
may be represented on an Argand diagram, as shown in Figure 2. The imaginary part of
I§ has been plotted horizontally and real part vertical. One side of the triangle represents
the scattering from a single (ill) double layer of atoms in silicon to analyze the effects of

N°12 TEM KINK MOVIES 2329
Intensity
5
4~
B
3
2
A B c
~C ~
B thickness
snm
Fig. 3 Multiple scattering calculations (using 1000 beams) giving the thickness dependence of the
termination reflection (§14/3 in silicon at 100 kV, with beam along )ill] Each letter represents the
addition of one atomic layer. A stacking fault occurs at ABA Three of the six beams are equivalent.
shuffle or glide termination, half the lengths of the sides should be used. ("Shuffle" describes
termination between the widely spaced planes of the (ill) surface, while "glide" termination
occurs between the narrowly spaced planes). The lateral shear of each double layer in the
diamond structure introduces a 120° phase shift, making a closed triangle ABC every three
layers with zero resultant scattering. A thin crystal containing 3m double layers above an
intrinsic SF and 3n below it has stacking sequence (3m) AB/ABC (3n),as shown. Below the
SF the total scattering vector runs from the origin to each of the corners on the upper trianglein turn, and the intensity is never zero. If the scattering amplitude from one double layer is F
(with intensity F~), then the change in intensity due to the addition of a single double layer in
an unfaulted crystal is either zero (on adding a B layer to anA layer)
orF~ (for addition of an
A or C layer). For a faulted crystal the results depend on the depth of the fault, however all
the possible cases may be obtained by starting at one corner of the lower triangle and ending at
one on the upper. In particular, for the kink images, we may compare the diffracted intensityproduced by a column of crystal within a ribbon of SF with that generated outside it. In the
most favorable case, anunfaulted region ABCABCABC produces zero intensity
,
but a faulted
crystal ABCAB/ABCA of the same thickness generates intensity 3F~. Multiple scatteringcalculations [19j confirm these kinematic estimates. Figure 3 shows multislice calculations for
the intensity of the (i14)/3 reflection as a function of thickness, and we see that the addition
of a C layer (shown primed in Figs 2 and 3) after the fault changes the intensity by about
4F~, in agreement with Figure 2. These calculations (unlike Fig. 2) correctly take account of
the excitation errors for the termination reflections, and when this is done wefind that the six
(I§4)/3 reflections are not equivalent there are two groups of three, reflecting the three-fold
(not six-fold) symmetry of a(ill) slab consisting of p # 3m layers. At the [lllj
zone axis
orientation the forbidden reflection intensity nevertheless still falls to zero every three double
layers.
Real crystals have atomically rough surfaces, and these effects must also be considered, in
addition to other sources of background in the images, which limit contrast. A full analysishas been given, [19j, but the main points are as follows. TEM cross section lattice images of
SilSi02 interfaces suggest that the roughness will be one or two double-layers, and no images
were recorded if contamination could be seen growing at the edges of our samples. Largeatomically flat surface islands produce sharp forbidden reflections unless p =
3m. As the island
2330 JOURNAL DE PHYSIQUE III N°12
size becomes small compared with the coherence width of the electron beam these forbidden
reflections broaden out into diffuse elastic scattering peaks. Islands of atomic dimensions are
equivalent to a random distribution of surface vacancies, for which there are no termination
reflections. The width of the diffuse peaks increases with the depth of the surface roughnessWe can understand this by recalling that the projected potential for a
thin '~perfect" crystalwith atomically rough surfaces is not a periodic function, hence its diffraction pattern contains
elastic diffuse scattering. Because we do not see surface islands in forbidden reflection lattice
images from unfaulted crystal, we assume that the roughness can be modeled as random
vacancies in the surface layer Depending on the crystal thickness, these vacancies may or may
not lie within the atomic column which contains a kink, thereby altering its contrast. The still
images of dislocation cores, however, showa
much higher density of kinks on the 90° partialdislocation than on the 30° partial, suggesting that surface roughness is not the dominant
contrast effect. In addition, by digital subtraction of successive video frames we can isolate
the moving kinks from the stationary surface noise. Figure 3 shows that the average imageintensity from by a rough, faulted crystal is higher than that of a rough, unfaulted crystal,and kinks form the boundary between these regions. (The average scattering, rather than the
image intensity, from a crystal with a uniform distribution of terminations is represented by
a point in the center of each triangle). Nevertheless, in still images this surface roughnesscontributes a large error to our estimates of kink concentration. (The error is calculated by
tracing every reasonable boundary to the SF). The ability to introduce dislocations m situ
into a sample whose surfaces have been cleaned by heating m situ would improve the qualityof our images, but would also superimpose the silicon (7X7) reconstruction onto the images.Experimentally, we find different SF lattice images to vary greatly in contrast, probably due
to thickness effects. It is likely that in these experiments the experimentalist has therefore
selected cases where the mean thickness is most favorable, so that the very high contrast of
Figures 6 and 7 may correspond, on Figure 2, to the scattering vector 3~/~ F within the SF,and to variation between shuffle and glide termination outside (F/2). This would lead to an
intensity ratio at the center of atoms within and outside the SF of about 12:1.
3. Dynamic Observations and Pinning
Our first experiments consisted of TEM video recording of partials relaxing toward their equi-librium spacing at 600 °C. In this section we study a
90°/30° dislocation which expandedduring the initial ez situ deformation ill], and will contract during heating in the TEM. In
section 4 a30°/90° dislocation is studied, which contracted ex situ, and expands m situ. Our
silicon samples were formed by a two stage deformation process, ending with cooling under
high stress [22j. This produces stacking faults on (ill) of non-equilibrium width d, which relax
back to equilibrium if the sample is warmed in the microscope TEM samples were prepared bychemical etching at room temperature (no hot glues). In equilibrium, the elastic repulsive force
between the partials is just balanced by the attractive force resulting from the work needed to
create SF, and the SF width is d=
5.8 nm. Otherwise the shear stress a in the direction of the
partial Burgers vector b can be determined if d is kno~N.n using a = (~t (A Id) )16, where the SF
energy ~t =0.058 J m~~ for Si, and A
=3.36 x10~~°N Video recordings were obtained during
this relaxation on the Akashi 0028 TEM using the Gatan heating stage, at 0.33 nm resolution
and a temperature of 600 °C, sufficient for kink nucleation. The objective aperture shown in
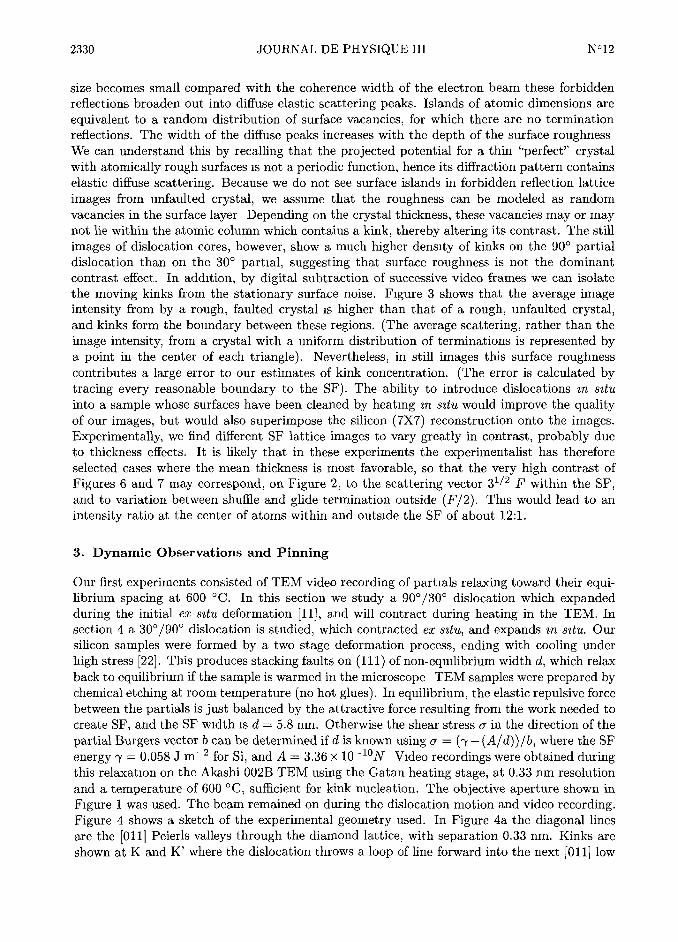
Figure I was used. The beam remained on during the dislocation motion and video recording.Figure 4 shows a sketch of the experimental geometry used. In Figure 4a the diagonal lines
are the [011j Peierls valleys through the diamond lattice, with separation 0.33 nm. Kinks are
shown at K and K' where the dislocation throws a loop of line forward into the next [011j low
N°12 TEM KINK MOVIES 2331
30
V~SF e
[42-2]220 (42-2)/3
~§'~~~0 33nm j42-2] +x
a) b) j01 1j
Fig. 4. a). Stacking fault SF on (ill) plane (parallel to page) separating 30° and 90° partialdislocation lines, with low-energy Peierls valleys along )011] and kink pair K, K' shown. By running
together these kinks advance the dislocation linem
direction V. b) shows side view, along [011],indicating "forbidden" (42d)/3 Bragg reflections generated by SF, and bulk (220) beams.
energy valley by nucleating a kink pair. The line advances in direction V if the kinks move
together and annihilate. Figure 4b shows a side view. The SF plane generates six (42§) /3Bragg beams within the SF ribbon and not elsewhere, and only these are used to form the
images. The d-spacing for the planes is d422=
h=
0.33 nm, or one Peierls valley wide. These
valleys run along the < 011 > tunnels in the diamond structure, orthogonal to (42§) /3.
Video rate images of several 60° dislocation segments dissociated into 30° and 90° partials
were recorded at 600 °C. Consistent with the earlier finding ill] that 90° partials are more
mobile than 30° partials, motion (on the atomic scale) was confined to the 90° partial. (Mobilityalso depends on which partial is leading or trailing ill] ). The 30° partial remained stationaryrelative to reference defects seen in individual video frames, and, unlike the 90° partial, did not
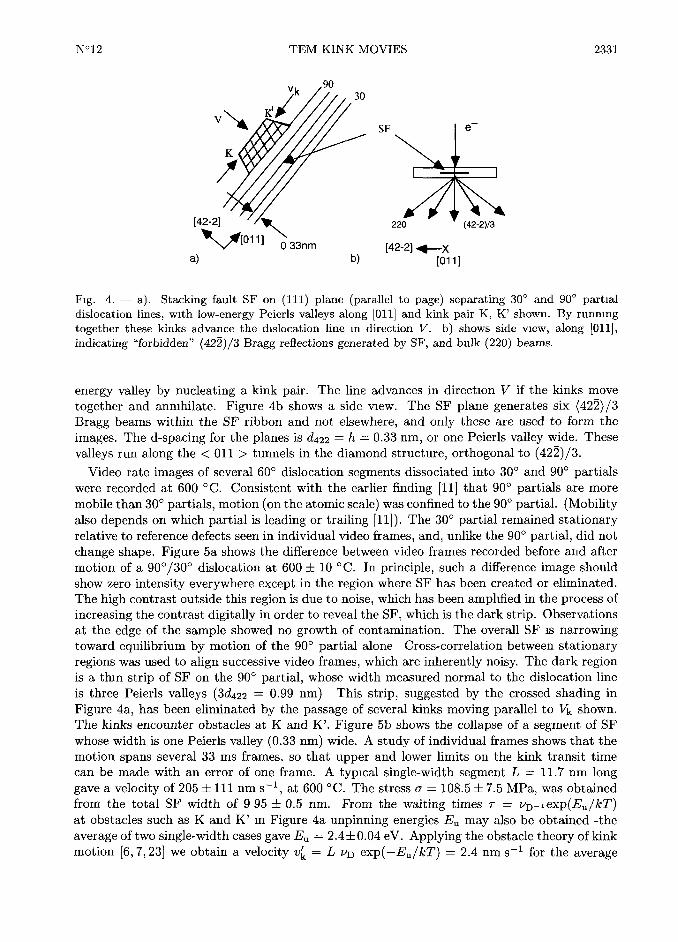
change shape. Figure 5a shows the difference between video frames recorded before and after
motion of a90°/30° dislocation at 600 +10 °C. In principle, such a difference image should
show zero intensity everywhere except in the region where SF has been created or eliminated.
The high contrast outside this region is due to noise, which has been amplified in the process of
increasing the contrast digitally in order to reveal the SF, which is the dark strip. Observations
at the edge of the sample showed no growth of contamination. The overall SF is narrowingtoward equilibrium by motion of the 90° partial alone Cross-correlation between stationary
regions was used to align successive video frames, which are inherently noisy. The dark regionis a thin strip of SF on the 90° partial, whose width measured normal to the dislocation line
is three Peierls valleys (3d422"
0.99 nm) This strip, suggested by the crossed shading in
Figure 4a, has been eliminated by the passage of several kinks moving parallel to Vk shown.
The kinks encounter obstacles at K and K'. Figure 5b shows the collapse of a segment of SF
whose width is one Peierls valley (0.33 nm) wide. A study of individual frames shows that the
motion spans several 33 ms frames, so that upper and lower limits on the kink transit time
can be made with an errorof one frame. A typical single-width segment L
=11.7 nm long
gave a velocity of 205 + ill nms~~, at 600 °C. The stress a =
108.5 + 7.5 MPa, was obtained
from the total SF width of 9 95 + 0.5 nm. FIom the waiting times T =
vD-iexp(Eu/kT)at obstacles such as K and K' m Figure 4a unpinning energies Eu may also be obtained -the
average of two single-width cases gave Eu=
2.4+ 0.04 eV. Applying the obstacle theory of kink
motion [6, 7, 23j we obtain a velocity u[=
L vD exp(-Eu/kT)=
2.4 nms~~ for the average

2332 JOURNAL DE PHYSIQUE III N°12
.'~~~
~
Fig. 5. a). Difference between filtered video images ofa moving 90° partial dislocation
msilicon
at 600 °C, viewed along [ill]. Dark strip isSF three Peierls valleys wide (0 99 nm), eliminated by
passage of several kinks. Inset shows experimental SF image for scale The dark patch is a portion of
the shaded region in Figure 4a. b). Similar for 90° partial segment. one Peierls valley wide
velocity of kinks encountering many obstacles. A comparison with the instantaneous kink
velocity of 205 nms~~ shows that the transit time is short compared with the waiting time, as
assumed in obstacle theories. Several experimentally indistinguishable kink mechanisms may
be responsible for these observations in particular we cannot distinguish single kink unpinning
at one end of the segment K from homogeneous double kink nucleation at mid-segment followed
by outward propagation to obstacles K, K' at the ends of the segment Since extended defects
are not seen at cores in still images at atomic resolution, the obstacles are most likely to be
dragging points which move forward with the line. We now consider the likely origin of the
obstacles.
During the 800 °C first stage of deformation, dislocations getter the P(2 x10~~ cm~~),
O(< 10~~) and C(< 10~~) impurities in our FZ sample. Carbon'is known to be ineffective
in dislocation pinning [24j. Vacancies and interstitials have much larger values of L, as does
P (although strongly pinning) due to its low diffusion rate [25j. We find no evidence (at0 27 nm
resolution) for the Oor P complexes previously proposed as pinning centers [26, 27j,
which, if larger than the resolution of 0 3 nm, would be directly visible in our lattice images.

N°12 TEM KINK MOVIES 2333
We see no evidence of climb-induced pinning. The impurity with highest concentration is
oxygen, whose pinning effect has been studied extensively by X-ray topography in sampleswith controlled impurity concentrations This work suggests [28], at high temperature, an
oxygen pinning center with L m 14.0 nm and an unpinning energy of about 3 eV. Ab-initio
electronic structure cluster calculations for a variety of likely structures suggest [29j that a single
oxygen atom on the most stretched bond around the anti-phase (soliton) defect can explainthis X-ray imaging result. The concentration and unpinning energy (release rate) of this defect
are in rough agreement with our observations, however beam induced pinning effects must
be considered. Previous work [30-32j suggests that the beam has two effects a) At energiesabove the threshold for ballistic knock- on damage (about 140 kV) strong pinning centers
are introduced, and b) Enhanced diffusion of kinks (REDG) and impurities by beam-induced
electron-hole pair recombination at these defects occurs [33j. The first effect was minimized
by conducting a series of experiments in which the beam energy was reduced until, at 130
kV (where all this work wasdone), the concentration of resolvable beam-induced defects was
found to be negligible. (Knock-on damage is easily visible in lattice images at higher voltages).The second effect depends on the intensity and duration of the exposure. The spacing of these
obstacles is consistent with the "garland" and cusp features seen on 90° partials in previouswork, thought to be due to recombination enhanced diffusion of impurities from the thin foil
surfaces to dislocations [34j, and which are not seen in unirradiated samples. The ability of
impurities to create a soliton-antisoliton pair on arrival at a reconstructed core, and for these
sites subsequently to nucleate oxide precipitates, has been noted [35j. In summary, we speculate
that the 2.4 eV unpinning energy we observe is due to oxygen at anti- phase defects, affected
in some way by irradiation. Self interstitials may also be involved.
4. Kink Migration Energy
By analyzing the motion of a partial at a temperature low enough to ensure that no new kinks
are created during the motion, the kink migration energy can be determined if the kink density
is known. The velocity of a kink of height h, for a dislocation with Burgers vector b and core
period a is
~
~~i~~~~~~~~~~~~~ ~~~~~ ~~~
where vD is the Debye frequency (1.3 x10~~ s~~
more strictly the phonon frequency in the
direction of motion should be used), Dp the double kink diffusion coefficient and Wm=
Um
TSm is the free energy (strictly enthalpy) of kink migration, Um an enthalpy (experiments are
performed at constant pressure). (Similarly Fk"
Uk TSk). Theoreticians compute internal
energies Ujj (the sum of elastic and core energies, usually computed at constant volume);experiments measure either Wm or Um (depending
on data analysis). Our Um values assume [4jSk(90°)
=0.5 k and Sm(90°)
=5 k)
Stationary images were therefore recorded on video and film of a 30° /90° dislocation under
low dose conditions (to avoid the introduction of pinning centers), both before and after an-
nealing at 130 °C for 15 min. At this temperature the density of thermally nucleated kinks is
negligible. The electron beam was switched off during the dislocation motion. Figure 6 shows
a typical lattice image formed from the inner six "forbidden" reflections in Figure I. The
partials have moved apart in the TEM toward their equilibrium separation of 5.8 nm.(Unlike
90 /30 dislocations and screws, the 30/90 contracts during the initial ex situ deformation due
to lattice friction Ill] ). Image calculations [8j show that the bright diagonal band of regularlyspaced dots is a lattice image of the double layer of atoms (spaced 0.33 nm apart) which form
the SF plane. (Extrinsic and intrinsic faults produce similar images). Pairs of atoms appear

2334 JOURNAL DE PHYSIQUE III N°12
Fig. 6 TEM image of dissociated 60° dislocation in silicon after relaxation. The bright diagonalband of regular dots are six-membered rings in the ribbon of SF separating 30° and 90° partialdislocation lines. Black lines
run along cores of the two partial dislocations. Fine white line shows
typical alternative boundary used to estimate error in counting kinks.
as a single dark spot, bright spots are centered on the six-fold rings of a single double-layer.The borders of this band of regular dots forms the partial dislocation cores, as shown. The
white scale lines indicate one Peierls valley, 0.33 nm wide. The average SF width corresponds
to a stress on the partials of 275 MPa. We note that the density of kinks is greater on the 90°
partial than on the 30° partial (see also Fig 7). An accurate determination of kink densityis complicated by the effects of surface roughness, however the higher density on one partial(seen also in larger fields of view such as Figure 7 and in many different cases [19j) suggeststhat surface effects are not dominant. In addition, monatomic surface islands are not seen
outside the SF these would produce similar (but lower) contrast to the SF. Apparent "Kink
pairs" smaller than the critical separation z*=
0.81nm (defined below) are evidently due to
surface roughness. Figure 6 shows how the error in kink density was estimated These images
may be used to estimate Wm from the kink density c and distanci As the partial dislocation
moves(with beam off), using Vdis
"2c h Vk
"As/At, where h
=0.33 nm, the kink height.
Now ukAt=
by, hence As=
2chAy, where by is the mean distance a kink moves m time
At. Using by fat= vk m equation 3 yields Wm
=1.24+ 0.07 eV(Um
=1.55 eV). (Within
our
limited field of view, less than the kink mean free path, obstacles are unimportant if present in
unirradiated material). Figure 7 shows a still from a low- dose videq frame for adifferent dislo-
cation, in this case an unrelaxed pair of partials more narrowly spaced than their equilibrium
separation.

N°12 TEM KINK MOVIES 2335
Fig. 7 Similar to Figure 6, but for an unrelaxed pair of partials spacedmore
closely than the
equilibrium separation.
5. Kink Nucleation Energy
By measuring the distribution of kink-pair separations in these images, the kink formation
free energy Fk may be estimated. This could be most easily done under conditions of low
stress, when the concentration of kinks is close to thermal equilibrium, and simply related
to Fk by a Bolt2mann factor. Our annealing experiments were unsuccessful in providing a
sufficiently large field of view of fully relaxed partials within the acceptable range of samplethickness for good imaging. In all cases, the partial separations corresponded to a stress
greater than (2kT/bah)exp(-Fk/kT), the upper limit of the low-stress theory [36j. It was
therefore necessary to use the high stress theory of dislocation motion to analyze our images.The most successful theory of dislocation motion [36j (but
see [5j) considers the nucleation
of double kinks (with separation x), their diffusion and drift under an external stress aby
one-dimensional analogy with classical steady-state nucleation theory for particles of size z.
Then the distribution of kink separations (constrained to zero kink current) per unit length of
line is
cc(x)=
~exp(-F(z)/kT) (4)a
with dimensions L~~ Here the free energy of kink-pair formation in the presence of the large
stresses used in our experiments is [37j
F(x)=
2Fk~
abhx (5)
where ~ is the shear modulus. The second term represents the attractive kink-kink strain
interaction (tending to annihilate by recombination kink pair embryos less then the critical
separation x*) while the last term describes the external stress, driving kinks apart. The net
double kink nucleation rate is J=
Dpco(x* /2x', and the dislocation velocity V=
2h(Juk)~/~if the dislocation segment length is larger than the kink mean free path ~. Then V depends
2336 JOURNAL DE PHYSIQUE III N°12
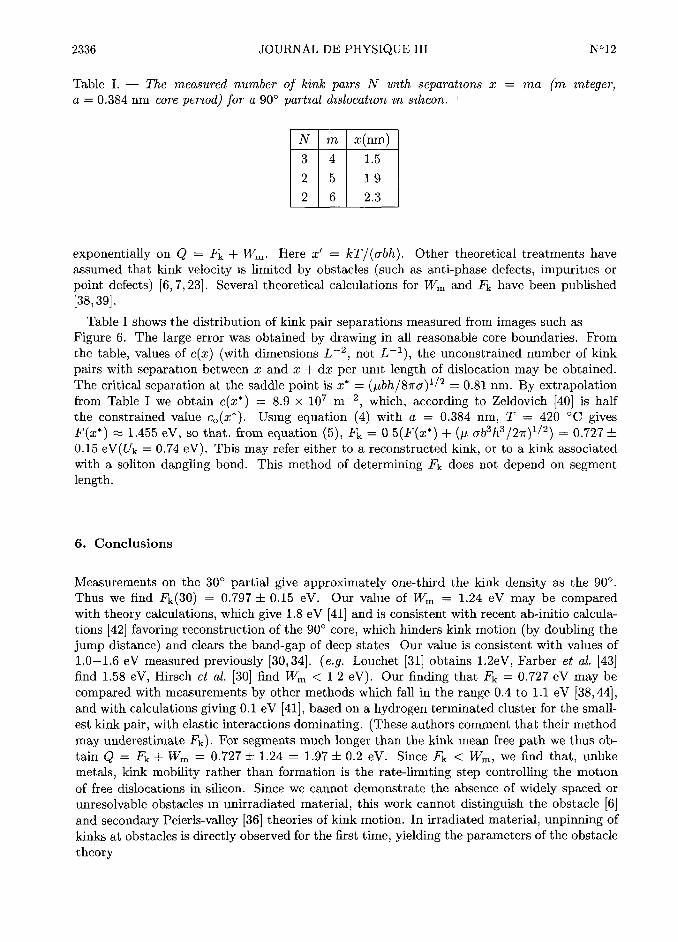
Table I. The measured number of kink pairs N with separations x = ma(m integer,
a =0.384 nm core period) for a 90° partial dislocation m silicon.
N mx(nm)
3 4 1.5
2 5 19
2 6 2.3
exponentially on Q"
Fk + ~7m. Here x'=
kT/(abh). Other theoretical treatments have
assumed that kink velocity is limited by obstacles (suchas anti-phase defects, impurities or
point defects) [6, 7, 23j. Several theoretical calculations for Wm and Fk have been published
[38, 39j.
Table I shows the distribution of kink pair separations measured from images such as
Figure 6. The large error was obtained by drawing in all reasonable core boundaries. FIom
the table, values of c(z) (with dimensions L~~, not L~~), the unconstrained number of kink
pairs with separation between z and z + dz per unit length of dislocation may be obtained.
The critical separation at the saddle point is z*=
(~bh/8~ra)~/~=
0.81nm. By extrapolationfrom Table I we obtain c(z*)
=8.9 x
10~ m~~, which, according to Zeldovich [40j is half
the constrained value co(z*). Using equation (4) with a =0.384 nm, T
=420 °C gives
F(z*)m 1.455 eV, so that, from equation (5), Fk
#0 5(F(z*) + (~ ab~h~ /2~r)~/~)
=0.727 +
0.15 eV(Uk=
0.74 eV). This may refer either to a reconstructed kink, or to a kink associated
with a soliton dangling bond. This method of determining Fk does not depend on segmentlength.
6. Conclusions
Measurements on the 30° partial give approximately one-third the kink density as the 90°.
Thus we find Fk(30)=
0.797 + 0.15 eV. Our value of Wm=
1.24 eV may be comparedwith theory calculations, which give 1.8 eV [41j and is consistent with recent ab-initio calcula-
tions [42j favoring reconstruction of the 90° core, which hinders kink motion (by doubling the
jump distance) and clears the band-gap of deep states Our value is consistent with values of
1.0-1.6 eV measured previously [30, 34j. (e.g. Louchet [31j obtains 1.2eV, Farber et al. [43jfind 1.58 eV, Hirsch et al. [30j find Wm < 12 eV). Our finding that Fk
"0.727 eV may be
compared with measurements by other methods which fall in the range 0.4 to I.I eV [38, 44j,and with calculations giving 0.I eV [41j, based on a hydrogen terminated cluster for the small-
est kink pair, with elastic interactions dominating. (These authors comment that their method
may underestimate Fk). For segments much longer than the kink mean free path we thus ob-
tain Q=
Fk + lvm=
0.727 +1.24=
1.97 + 0.2 eV. Since Fk < Wm, we find that, unlike
metals, kink mobility rather than formation is the rate-limiting step controlling the motion
of free dislocations in silicon. Since we cannot demonstrate the absence of widely spaced or
unresolvable obstaclesm
unirradiated material, this work cannot distinguish the obstacle [6j
and secondary Peierls-valley [36j theories of kink motion. In irradiated material, unpinning of
kinks at obstacles is directly observed for the first time, yielding the parameters of the obstacle
theory
N°12 TEM KINK MOVIES 2337
Acknowledgments
Supported by N-S F. award DMR9526100. We are grateful to Drs. R Jones, P. Pirouz and
W. Schrbter for useful discussions.
References
ill Alexander H.. Spence J., Shindo D., Gottschalk H. and Long N., Phil. Mag. A53 (1986)627.
[2j Kolar H., Spence J. and H. Alexander, Phys Rev. Lett. 77 (1996) 4031.
[3j Bulatov V.V., Yip S. and Argon A.S., Phdos. Mag. A72 (1995) 453.
[4j Marklund S., Solid State Communications 54 (1985) 555.
[5j Maeda K. and Yamashita Y., Phys. Stat. Sol. (a)138 (1993) 523.
[6] Celli V.. Kabler M., Ninomiya T. and Thomson R., Phys. Rev. 131 (1963) 58.
[7] Moller H.J., Acta Met 26 (1978) 963.
[8] Spence J., Proc 39th Ann Mtng. Electr. Micros. Soc. Am. G. Bailey, Ed. (Claitors, Baton
Rouge 1981) 120.
[9] Werner M., Weber E., Bartsch M. and Messerschmidt U., Phys. Stat. Sol. (a) lso (1995337.
[10] Kusters K and Alexander H., Physica l16B (1983) 594.
[ll] Alexander H. and Teichler H., Dislocations (VCH, Weinheim, 1991).[12] Lynch D.F., Acta Cryst., A27 (1971) 399.
[13] Goodman P. and Moodie A.F., Acta Cryst. A30 (1974) 2§0.[14] Cherns D., Phil. Mag. 30 (1974) 549.
[15] Spence J., Plrqc.,EMAG ~1975. Inst. o( Phys. (1975) p. 2§/.z
'
[16] Glaisher R.,~Kii47ibar'a'ifl," Spedci J'.'and .Mckilvy>M.~, IiiitiPliys'©onf. Ser. 87 (1987)349.
[17j Tanishiro Y Takayanagi K. and Yagi K., J. Micros. 142 (1986) 211.
[18] Spence J.C.H., Ultramicrosc. ll (1983) l17.
[19] Alexander H., Spence J., Shindo D., Gottschalk H. and Long N., Phil. Mag. 53 (1986)627
[20] Iijima S.. Ultramic 6 (1981) 41. See also Suzuki K., Maeda N. and Takeuchi S., Phdos.
Mag. A73 (1996) 431.
[21j Ourmazd A., Anstis G. and Hirsch P., Phil. Mag. A48 (1983) 139.
[22j Wessel K. and Alexander H., Phil. Mag. 35 (1977) 1523.
[23j Rybin V. and Orlov A., Sou. Phys. Solid State 11 (1970) 2635.
[24j Sumino K., J. Phys. 44 (1983) C4
[25j Sumino-K.-and.Imai M., Phil. Mag. A4_7 (1983) 753.
[26j Sumino K., Inst. Phys. Conf. Ser. lo4 (1989) 245.
[27] Sumino K., Mat. Res. Soc. Symp. Proc. 14 (19831'307.[28] Sato M. and Sumino K., University of Tokyo Press (1985) p. 391.
[29] Umerski A. and Jones R., Phil. Mag. A67 (1993) 905.
[30j Hirsch P.B., Ourmazd A. and Pirouz P., Inst. Phys. Conf. Ser. 60 (1981) 29.
[31j Louchet A., Phil. Mag. 43 (1981) 1289; also Inst. Phys Conf. Ser. 60 (1981) 35.
[32j Gottschalk H., Electron Microscopy 2 (1982) 527.
[33j Maeda N. and Takeuchi S., Inst. Phys. Conf. Ser. lo4 (1989) 303.

2338 JOURNAL DE PHYSIQUE III N°12
[34j Gottschalk H., Alexander H. and Dietz V., Inst. Phys. Conf. Ser. 87 (1987) 339.
[35j Heggie M., Jones R. and Umerski A., Phys. Stat. Sol. (a)138 (1993) 383.
[36j Hirth J.P and Lothe J., Theory of dislocations (Wiley, New York, 1982).[37j Seeger A. and Schiller P., Acta Met lo (1962) 348.
[38j Gottschalk H., Sauerland N., Specht S. and Alexander H., Phys. Stat. Sol. (a) 138 (1993)547.
[39j Huang Y., Spence J and Sankey O., Phys. Rev. Lett. 74 (1995) 3392.
[40j Zeldovich J.B., Acta Physiochem USSR18 (1943) 1.
[41j Oberg S., Sitch P., Jones R. and Heggie M., Phys. Rev. B51 (1995) 13138. See also R.
Jones, Phil. Mag. 842 (1980) 213
[42] Bigger J., McInnes D., Sutton A., Payne M., Stich I., King-Smith R., Bird D. and Clarke
L., Phys. Rev. Lett. 69 (1992) 2224
[43] Farber B.Y., Iunin Y.L. and Nikitenko V.I., Phys. Stat. Sol. (a) 97 (1986) 469.
[44] Hull R. and Bean J.C., Phys. Stat Sol. A138 (1993) 533