Telkom SA SOC Limited Group Annual Results
48
Group Annual Results 2018 | 1 Telkom SA SOC Limited Group Annual Results for the year ended 31 March 2018
Transcript of Telkom SA SOC Limited Group Annual Results

Group Annual Results 2018 | 1
Telkom SA SOC Limited
GroupAnnual Resultsfor the year ended 31 March 2018

Group Annual Results 2018 | 2| Business Performance01
Tough trading environment
Low GDP growth
Low business confidence
Consumers under pressure
Macro-economic conditions
Enquiries in market structure
Consolidation in the market
Capital intensity
Competitive environment
Cost to communicate
ICT policy & spectrum
Deferred Investments
Political & Policy Uncertainty

Group Annual Results 2018 | 3Group Annual Results 2018 | 3
01
Business Performance

Group Annual Results 2018 | 4| Business Performance01
Solid performance
Operating revenue
R41.0 bn
EBITDA margin
25.7%
Capex to revenue
19.3%
Annualdividend of
355.0 cents
Headline earnings per share
597.0c

Group Annual Results 2018 | 5| Business Performance01
Investment strategy bearing fruit
Aggressive growth in the mobile
business
Strong growth in fibre and
data ecosystems
Leadership renewed
Strong balance sheet
Growth in future revenue streams
albeit from a lower base

Group Annual Results 2018 | 6|
Sharpening our focus
Business Performance01
GROUP

Key focus areas
> Mobile growth
> High speed broadband growth
> Content and VAS

Group Annual Results 2018 | 8|
Driving growth through mobile
Business Performance01
1 912 2 7723 730794
1 2271 478
FY2016 FY2017 FY2018
‘00
0
Pre-paid Post-paid
2 707
3 999
5 208
Subscriber growth
30.2%
2 663 2 9863 974
FY2016 FY2017 FY2018
Site
s
Mobile sites integrated
33.1%
530 724 874
1 3611 605
2 753
FY2016 FY2017 FY2018
‘00
0
Data only Smartphone users
Mobile broadband subscribers
Mobile broadband traffic
123.6%
55.7%
1 891
2 329
3 627
3786
192
FY2016 FY2017 FY2018Pe
tab
ytes

Group Annual Results 2018 | 9|
High speed broadband customers
1 173
Migration to new technologies
03 Financial overview
860
Speeds
468 532 454
72125
13977
176518
3
27
62
FY2016 FY2017 FY2018
ADSL VDSL LTE Fibre
620
36.4%
0 20 40 60 80 100 120
Fibre
LTE
VDSL
ADSL

Group Annual Results 2018 | 10| Business Performance01
Next Generation Products
• 30% of postpaid customer on FreeMe
• ARPU uplift from migration to FreeMe
• 2.8 million FreeMe bundles sold
• LTE postpaid customers grew 54.9%
• Expansion of our fixed wireless LTE smart offeringsto the pre-paid base
• Attracted 255k LTE prepaid customers in the 2nd half of the year
• 10Mbps base up 25%
• Fixed broadband ARPU up 20.5%
• 54.5% growth in the uncapped product
• 62% growth in data due to increased video usage & uncapped usage

Group Annual Results 2018 | 11| Business Performance01
Content is king
• LIT Video and LIT Music unique users grown substantially since inception in Sep 2017
► >200k LIT Music unique users
► >160k LIT Video unique users
• LIT TV – video capable broadband services
► Approximately 20 000 LIT TV boxes in market

Group Annual Results 2018 | 12
Key focus areas
> Modernise the network
> Commercialise the network
> Transforming service delivery

Group Annual Results 2018 | 13|
LTE/LTE-A/5G
VDSL/FTTH
Fibre/ME
POTNMetro L2/L3
Access SDN DC SDN L2/L3 SDN DC SDN
POTN Core
Satellite Microwave
High speed and reliability | Unlimited bandwidth| Near-real-time latency | World class security
Source: Openserve Technology and Business Strategy
Investing in data & broadband ecosystem
ME
Core Cloud
ME
ME ME
Edge Cloud
01 Business Performance

Group Annual Results 2018 | 14| 01 Business Performance
The Fibre Footprint Passed over 2.5 million premises
Fibre to the home
356 684Fibre to the cabinet
2 237 057
62.3% 12.3%
Fibre network of
> 157 400 kmdeployed to date

Group Annual Results 2018 | 15| 01 Business Performance
Gaining tractionFixed line broadband data consumption1
1. Access links
Fibre to the business
89 818end points terminating
Fibre to the base stations
6 791base stations
461617
828
FY2016 FY2017 FY2018
Peta
byt
es
Homes connected
109 336 connectivity rate of
30.7%
34.3%
70.3% 14.6%

Group Annual Results 2018 | 16| 01 Business Performance
Broadband evolutionData solutions Evolution
145 186 132 340 115 900
FY2016 FY2017 FY2018
Serv
ices
Traditional technology
23 517 27 336 34 938
FY2016 FY2017 FY2018
Serv
ices
Next generation Ethernet Technology
577 279417 519
288 243
FY2016 FY2017 FY2018
Co
nn
ecti
on
s
Traditional Broadband
450 228586 002 690 163
FY2016 FY2017 FY2018
Co
nn
ecti
on
s
Next Generation Broadband
Broadband connection evolution
12.4%
31.0%
27.8%
17.8%

Group Annual Results 2018 | 17| 01 Business Performance
Ramping up service
24%reduction
Re-dispatchrate
16%Increase in Interaction
NPS
Frontline customer interactions every day
~3 000

Group Annual Results 2018 | 18
Key focus areas
> Unified communications
> Cloud computing
> Big data analytics
> Industrial IoT (IIoT)
> Cyber Security

Group Annual Results 2018 | 19| 01 Business Performance
The migration journey
August
– Telkom Group acquires BCX
2015
November– Telkom Enterprise integrated into BCX
2016
April– Telkom Group IT integrated into BCX
2017
•Merged 6 entities to form “One BCX”
•Disposed 4 small BCX subsidiaries
• Identified non-current assets held for sale – action underway
2018

Group Annual Results 2018 | 20|
Less public sector sales
Business Performance01
Large Enterprise
Medium Enterprise
International
Public Sector
Large Enterprise
Medium Enterprise
International
Public Sector
FY2017
FY2018
9.0
7.5
5.5
0.6
7.4
7.9
5.6
0.6
+0.4
-
+0.2
-1.6
-R1bn
Public sector
> 35% of BCX revenue is from public
sector
> R1.6 billion decline mainly from
voice revenue
• general reduction of public
sector expenditure
• decline in traditional voice
revenue
• the inclusion of a number of one-
off hardware deals in the prior
year
> Management of reputational risk in
new customer acquisition
Large & Medium size Enterprise
> Large & Medium size entities
represents 37% and 26% of BCX
revenue respectively
• Large Enterprise revenue grew
by R400 million, as cross
synergies between BCX and
Telkom customers were realised
• Medium size entities grew by
R200 million with good growth
in data volumes
BCX Elims
BCX Elims -0.4
-0.3

Group Annual Results 2018 | 21| 01 Business Performance
Driving Efficiencies
Process optimisation
> Business process
re-engineering to
simplify the business
model
> Simplified corporate
structures
People Procurement
> Talent management –
appropriate capability to
deliver on strategy
> Improved our BBBEE
rating – Level 3
> Centralised procurement
function to take advantage of the
Group scale
> Restructure our cost base to shift
from hard IT-led assets and
towards talent-led ICT integration
capabilities
Group Annual Results 2018 | 22| 01 Business Performance
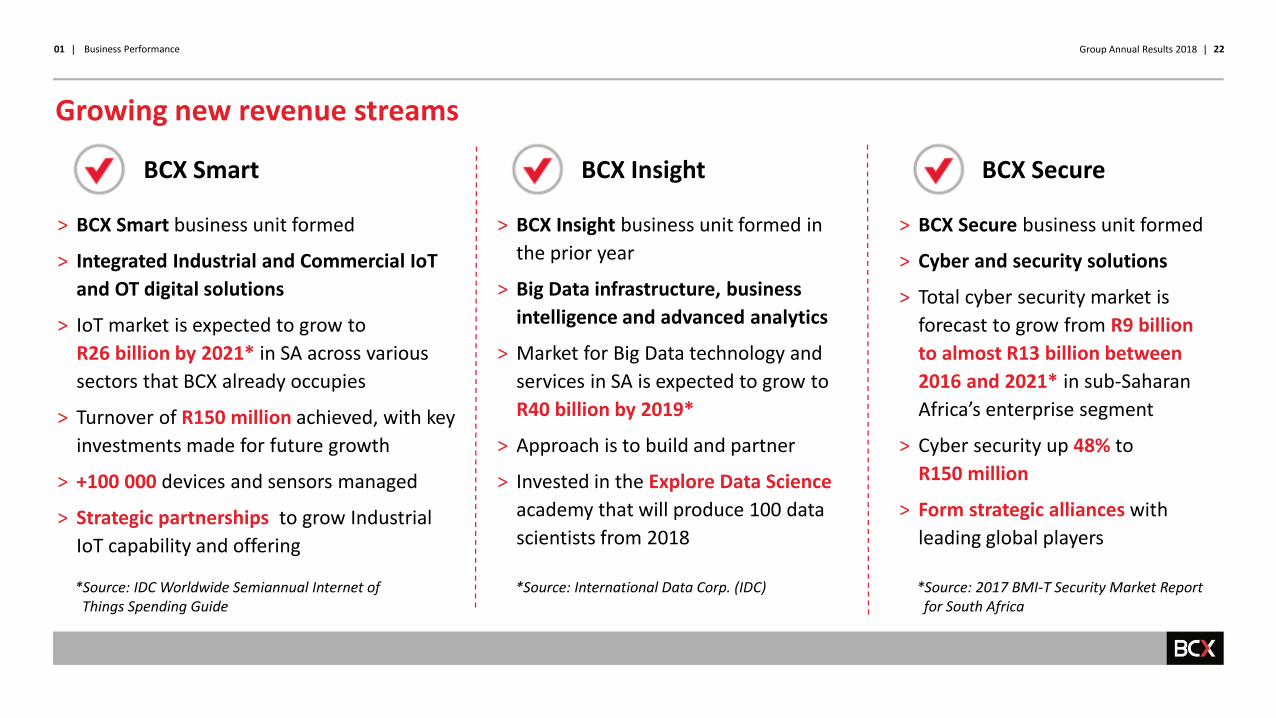
Growing new revenue streamsSocial impact
BCX Smart BCX Insight BCX Secure
> BCX Smart business unit formed
> Integrated Industrial and Commercial IoT
and OT digital solutions
> IoT market is expected to grow to
R26 billion by 2021* in SA across various
sectors that BCX already occupies
> Turnover of R150 million achieved, with key
investments made for future growth
> +100 000 devices and sensors managed
> Strategic partnerships to grow Industrial
IoT capability and offering
> BCX Insight business unit formed in
the prior year
> Big Data infrastructure, business
intelligence and advanced analytics
> Market for Big Data technology and
services in SA is expected to grow to
R40 billion by 2019*
> Approach is to build and partner
> Invested in the Explore Data Science
academy that will produce 100 data
scientists from 2018
> BCX Secure business unit formed
> Cyber and security solutions
> Total cyber security market is
forecast to grow from R9 billion
to almost R13 billion between
2016 and 2021* in sub-Saharan
Africa’s enterprise segment
> Cyber security up 48% to
R150 million
> Form strategic alliances with
leading global players
*Source: International Data Corp. (IDC)*Source: IDC Worldwide Semiannual Internet of Things Spending Guide
*Source: 2017 BMI-T Security Market Report for South Africa

Group Annual Results 2018 | 23
Key focus areas> Commercialise the
property portfolio
> Optimise and grow the Mast & Tower portfolio
> Enhance building operation efficiencies

Group Annual Results 2018 | 24| 01 Business Performance
Unlocking value
Optimising M&T Portfolio
Commercialising Property Portfolio
Optimising Building Operations
• 40 properties selected for Phase
1 development pipeline
• Commenced with town planning
and development planning
• Exploring project development
funding options
• Exploring strategic partnership
opportunities
• Focus on meaningful social
responsibility
• >1 400 properties under
management
• Utilities management, space
utilisation efficiencies as
focus areas
• Energy and water
consumption reduction
focus
• Office consolidation to
optimise occupancy costs
• 6 500 towers across
South Africa
• 1 300 co-located towers
• 1 000 towers prime for additional
co-location
• Intensified and targeted tenant
recruitment
• New build program and acquisition
to grow the portfolio

Group Annual Results 2018 | 25| 01 Business Performance
M&T Commercialisation
External Revenue Growth(R’ million)
496 539
FY2017 FY2018
External Co-Location Tenancy Growth(# of tenants)
2 362 2 581
FY2017 FY2018
9.0%
9.0%

Group Annual Results 2018 | 26
Key focus areas
> Stabilise the Business
> Optimise and rationalise traditional costs
> Rebuild iYP to create an eMarketplace
> Reposition, refresh and evolve the brand

Group Annual Results 2018 | 27| 01 Business performance
Organisational recovery
• Strengthened the Risk, Governance and
Control environment
• Established a Special Task Team to recovery of
funds from the fraudulent entities
• New leadership team – CEO and CFO
• Trudon rebranded to Yellow Pages
> Yellow Pages remains a trusted brand with
heritage of servicing SME’s for the past 58 years
> Significant investment required to achieve the
same brand equity of the Yellow Pages
> Yellow Pages App achieved over 16 000 downloads
since launch in February 2017
Rebranding

Group Annual Results 2018 | 28| 01 Business performance
Market context
• Flat economic growth.• Changing structure of the GDP key contributors
with financial services contributing 20%.• Economic downgrade
• The voice of the client is becoming stronger.• Print business revenue dropping.• Revenue from Digital not growing fast enough• Technology is becoming a key enabler and data a source
of future competitive advantage.• Digital platform business is becoming stronger.
• Regulation lagging Digital and eCommerce.• Digital Skills scarcity / transformation challenge.• eCommerce is growing at 20% yoy• Mobile spent is forecast to grow by 65%.
Source: various public stats and internal research
Broader context
Market
Yellow Pages

Group Annual Results 2018 | 29| 01 Business performance
The Transformation Journey
Source: Idea group strategic presentation
MEDIA eCommerce
pYP iYP aYP WebCard WebSite Location MediatYP
OTT Products
Owned Platforms
Simplified Consolidated Experience Design
• Improve Quality of Service
Leads and Data
Print Desktop Mobile
• Strong play in digital
verticals such as Home
services, Automotive
Medical and Food
• Simplified platform to
reflect an experience
that meets customer
needs
• Increase Sales Channels

Group Annual Results 2018 | 30| 01 Business performance
The future – Yellow Marketplaces
Yellowpages.co.za
Mobile site Mobile App
Directory ServicesSearch
IntelligentSearch
DataCRM
FinancialSystems
eCommerce Platform
B2B
Corporate Partners
Financial & Professional Services
Payment Processing
Engine
Engage, Connect, Experience design
Consumer
SME
Security/Credentials/Integration Layer

Group Annual Results 2018 | 31Group Annual Results 2018 | 31
02
Human and Social Capital

Group Annual Results 2018 | 32|
Investing in our talent
Effective talent management
• Succession plans for 94% of all senior managers
• 58% of permanent placement from internal talent
• Migrating skills for future competitiveness
Training & Development
• Training & development spend grew 47% of R342 million
• Average of 17 hours per employee on training
Significant safety improvements
• 29% improvement in total recordable injuries
• 26% improvement in lost time/ days away from work
• Safety partnership with contractors
02 Human and social capital

Group Annual Results 2018 | 33|
Skills - To address the skills shortage in the ICT sector FutureMakers - Enterprise and Supplier Development Fund
WeThinkCodeAdditional 133 students to gain software engineering related workplace experience
Data Science AcademyFunded 100 learnerships for SETA- accredited one year data science programme
Training of teachersICT integration training provided to 4 269 teachers
R381 millioninvested into FutureMakers
+2500 small businesses benefitted from non-
financial support and 1 600 direct jobs created
Innovation programme &
incubation
Growing skills, enabling ICT entrepreneur
02 Human and social capital

Group Annual Results 2018 | 34Group Annual Results 2018 | 34
Financialoverview
03
Financial Overview

Group Annual Results 2018 | 35| 03 Financial overview
Overview
Impressive growth in our new revenue streams while managing traditional voice revenues
Revenue growth
Working capital and free cash flowContinued focus on our working capital management has positively impacted our free cash flow
Efficient capex deployment We continue to invest in our network for future growth. We were cognisant of the revenue pressures and focused on maximising long term capital returns
Cost management
Continued focus on cost containment. In real terms cost is down by 1.2%
Overview

Group Annual Results 2018 | 36|
Solid performance in a challenging environment
03 Financial overview
FY2018 FY2017 %
Operating Revenue 41 018 40 970 0.1
Net revenue 32 156 31 854 0.9
Operating expenses (excl. depreciation) 22 219 21 647 (2.6)
EBITDA 10 544 10 941 (3.6)
Taxation 1 133 704 (60.9)
Capital investments 7 909 8 654 (8.6)
Adjusted free cash flow 501 (137) 465.7
Headline earnings per share (cents) 597.0 731.4 (18.4)

Group Annual Results 2018 | 37|
2 5283 498
5 150
FY2016 FY2017 FY2018
Rm
3786
192
FY2016
Peta
byt
es
EBITDA (excluding internal costs)
Mobile data broadband trafficMobile service revenue
89 89 98
FY2016 FY2017 FY2018
Blended mobile ARPU
10.2%
123.6%47.2%
163.9%
Impressive performance from mobile
-43660
1 742
FY2016 FY2017 FY2018
03 Financial overview
FY2018
Ran
d
Rm
FY2017

Group Annual Results 2018 | 38|
25 515 24 337 23 191
FY2016 FY2017 FY2018
Rm
472
632848
FY2016
Peta
byt
es
Fixed voice ARPU
Fixed broadband
traffic volumes
Fixed service revenue
34.3%4.7%
1.9%
Managing decline in fixed revenue streams
367 368 361
FY2016 FY2017 FY2018
03 Financial overview
FY2018
Ran
d
FY2017

Group Annual Results 2018 | 39|
116 762 107 612 94 236
FY2016 FY2017 FY2018
Serv
ices
12 745 16 338 24 088
FY2016 FY2017 FY2018
Cir
cuit
s
8 129 39 640
109 336
FY2016 FY2017 FY2018
Cu
sto
mer
lin
es
Sub-rate services
FibreMetro-Ethernet
35 02432 460
30 036
FY2016 FY2017 FY2018Se
rvic
es
7.5%
175.8%
47.4%
12.4%
Managing decline in fixed revenue streams (continued)
03 Financial overview
Diginet

Group Annual Results 2018 | 40|
3 498
14 546
5 620
1 052 3 119
5 150
13 245
5 326
1 574 3 046
Mobile service revenue Fixed voice Traditional data products New data products Other data products
2017 2018
Fixed data
Fixed service revenue
4.7%
47.2%
8.9%
5.2%
49.6%2.3%
1.6%
Managing decline in fixed revenue streams (continued)
Rm
03 Financial overview

Group Annual Results 2018 | 41|
31 854 32 156
1 746(1 176)
155 242(528)
(137)
FY2017 Netrevenue
Mobile Voice Fixed data Cost of sales Informationtechnology
Other FY2018 Netrevenue
New revenue streams offset pressures in voice
Net revenue movement
0.9%
R302m
03 Financial overview

Group Annual Results 2018 | 42|
10 941 10 544
302 105 (71) (127)(185) (421)
FY2017EBITDA
Netrevenue
S,G&A Operatingleases
Otherincome
Servicefees
Employeeexpenses
FY2018EBITDA
EBITDA
EBITDA movement
3.6%
R397m
03 Financial overview

Group Annual Results 2018 | 43|
FY2018 FY2017 %
Mobile 2 319 1 936 19.8
Fibre 2 112 2 392 11.7
OSS/BSS programme 294 741 60.3
Network rehabilitation/sustainment 303 567 46.6
Service on demand 1 292 1 251 3.3
Core network 902 962 6.2
Investing for growth
03 Financial overview

Group Annual Results 2018 | 44|
FY2018 FY2017 %
Cash sources
Opening cash balance 1 519 2 542 (40.2)
Cash flow from operating activities 8 274 7 713 7.3
Net loans raised 2 995 892 235.6
Significant cash applications
Cash paid on capital expenditure (7 773) (8 479) 8.3
Dividend paid (2 190) (2 171) (0.9)
Cash at the end of the period 2 698 1 519 77.6
Adjusted free cash flow 501 (137) 465.7
Discretionary investments 1 672 2 514 (33.5)
Cash position to support growth
03 Financial overview

Group Annual Results 2018 | 45|
FY2018 guidance
FY2018 Actual
FY2019 – FY2021 guidance
Operating revenue Flat 0.1 Mid-single digits
EBITDA margin 23% - 25% 25.7% 24% - 27%
Capex to revenue 17% - 20% 19.3% 16% - 20%
Net debt to EBITDA ≤ 1 0.6 ≤ 1
Guidance
Annual dividend of 355 cents per share
03 Financial overview
* Excluding corporate action

Group Annual Results 2018 | 46Group Annual Results 2018 | 46
04
Outlook

Group Annual Results 2018 | 47|
Strategic focus areas for each business unit
04 Outlook
• Modernise the
network
• Commercialise the
network
• Transforming
service delivery
• Unified
communications
• Cloud computing
• Big data analytics
• Industrial IOT
• Cyber Security
• Mobile growth
through data-led
propositions
• High speed
broadband
• Content and VAS
• Stabilise the Business
• Optimise and
rationalise traditional
costs
• Rebuild iYP to create
an eMarketplace
• Reposition, refresh
and evolve the brand
• Commercialise the
property portfolio
• Optimise and grow
the Mast & Tower
portfolio
• Enhance building
operation
efficiencies