
Television Viewing - ERIC - Education Resources … Alexander Associate Superintendent California...
146
DOCUMENT RESUME ED 330 574 SE 052 084 TITLE The State of Mathematics Achievement in North Dakota: The Trial State Assessment at Grade Eight. INSTITUTION Educational Testing Service, Princeton, N.J.; National Assessment of Educational Progress, Princeton, NJ. SPONS AGENCY National Center for Education Statistics (ED), Washington, DC. REPORT NO ETS-21-ST-02; ISBN-0-88685-14-9 PUB DATE Jun 91 NOTE 146p.; The entire Report consists of a composite report, an executive summary, ard 40 separate reports for 37 states, DC, Guam, and t4e Virgin Islands, respectively; see SE 052 055-096. AVAILABLE FROM Individual state reports are available directly from the assessment division of the appropriate State Department of Education. PUB TYPE Statistical Data (110) -- Reports - Research/Technical (143) EDRS PRICE MF01/PC05 Plus Postage. DESCRIPTORS Academic Achievement; Calculators; *Educational Assessment; Family Environment; *Grade 8; Homework; Ziunior High Schools; *Mathematics Achievement; Mathe atics Instruction; Mathematics Skills; Mathematics Tests; National Programs; Problem Solving; Public Schools; *State Programs; Student Attitudes; Teacher Attitudes; Teacher Qualifications; Television Viewing IDENTIFIERS National Assessment of Educational Progress; *North Dakota; *Numeracy; State Mathematics Assessments; Trial State Assessment (NAEP) ABSTRACT In 1990, the National Assessment of Educational Progress (NAEP) included a Trial State Assessment (TSA); for the first time in the NAEP's history, voluntary state-by-state assessments (37 states, the District of Columbia, Guam, and the Virgin Islands) were made. The sample was designed to represent the 8th grade public school population in a state or territory. The 1990 TSA covered five mathematics content areas (numbers and operations; measurement; geometry; data analysis, statistics, and probability; and algebra and functions). In North Dakota, 2,485 students in 106 public schools were assessed. This report describes the mathematics proficiency of North Dakota eighth-graders, compares their overall performance to students in the Central region of the United States and the nation (using data from the NAEP national assessments), presents the average proficiency separately for the five content areas, and summarizes the performance of subpopulations (race/ethnicity, type of commmity, parents' educational level, and gender). To provide a context for the assessment data, participating students, their mathematics teachers, and principals completed questionnaires which focused on: instructional content (curriculum coverage, amount of homework); delivery of math instruction (availability of resources, type); use of calculators; educational background of teachers; and conditions facilitating math learning (e.g., hours of television watched, absenteeism). On the NAEP math scale, North Dakota students had an average proficiency of 281 compared to 261 nationwide. Many fewer students (North Dakota-24%; U.S.-12%) appear to have acquired reasoning and problem solving skills. (JJ(/CRW)
Transcript of Television Viewing - ERIC - Education Resources … Alexander Associate Superintendent California...

DOCUMENT RESUME
ED 330 574 SE 052 084
TITLE The State of Mathematics Achievement in North Dakota:The Trial State Assessment at Grade Eight.
INSTITUTION Educational Testing Service, Princeton, N.J.;National Assessment of Educational Progress,Princeton, NJ.
SPONS AGENCY National Center for Education Statistics (ED),Washington, DC.
REPORT NO ETS-21-ST-02; ISBN-0-88685-14-9PUB DATE Jun 91
NOTE 146p.; The entire Report consists of a compositereport, an executive summary, ard 40 separate reportsfor 37 states, DC, Guam, and t4e Virgin Islands,respectively; see SE 052 055-096.
AVAILABLE FROM Individual state reports are available directly fromthe assessment division of the appropriate StateDepartment of Education.
PUB TYPE Statistical Data (110) -- Reports -Research/Technical (143)
EDRS PRICE MF01/PC05 Plus Postage.DESCRIPTORS Academic Achievement; Calculators; *Educational
Assessment; Family Environment; *Grade 8; Homework;Ziunior High Schools; *Mathematics Achievement;Mathe atics Instruction; Mathematics Skills;Mathematics Tests; National Programs; ProblemSolving; Public Schools; *State Programs; StudentAttitudes; Teacher Attitudes; Teacher Qualifications;Television Viewing
IDENTIFIERS National Assessment of Educational Progress; *NorthDakota; *Numeracy; State Mathematics Assessments;Trial State Assessment (NAEP)
ABSTRACTIn 1990, the National Assessment of Educational
Progress (NAEP) included a Trial State Assessment (TSA); for thefirst time in the NAEP's history, voluntary state-by-stateassessments (37 states, the District of Columbia, Guam, and theVirgin Islands) were made. The sample was designed to represent the8th grade public school population in a state or territory. The 1990TSA covered five mathematics content areas (numbers and operations;measurement; geometry; data analysis, statistics, and probability;and algebra and functions). In North Dakota, 2,485 students in 106public schools were assessed. This report describes the mathematicsproficiency of North Dakota eighth-graders, compares their overallperformance to students in the Central region of the United Statesand the nation (using data from the NAEP national assessments),presents the average proficiency separately for the five contentareas, and summarizes the performance of subpopulations(race/ethnicity, type of commmity, parents' educational level, andgender). To provide a context for the assessment data, participatingstudents, their mathematics teachers, and principals completedquestionnaires which focused on: instructional content (curriculumcoverage, amount of homework); delivery of math instruction(availability of resources, type); use of calculators; educationalbackground of teachers; and conditions facilitating math learning(e.g., hours of television watched, absenteeism). On the NAEP mathscale, North Dakota students had an average proficiency of 281compared to 261 nationwide. Many fewer students (North Dakota-24%;U.S.-12%) appear to have acquired reasoning and problem solvingskills. (JJ(/CRW)

NATIONAL CENTER FOR EDUCATION STATISTICS
The STATE ofMathematicsA It! e t
in NORTHDAKOTA
The Trial State Assessment at Grade Eight
THE NATION'SREPORT
CARD
1114Fc p,v,15, r:,../ti."..Lh.
U S OEPARTIAENT Of EDUCATIONOthIe I ahona, Researrn anti trnpro.ement
PU TIONAL RESOURCES INFORMATIONCENTER (ERIC'
r1 .f. clot ument nes Peen reproduce(' asre(0,,,rpcf from the person or oroanastronorky,nat,oc
Mno, chenge5 nave Deer, made to "prove,rproducIron quairty
PortIS of .reor opin.oris stared, f1t3 cfoe,jMera tlo not ne,. etssa,,ir ,ecvesent ort.catOE RI 04.444.,f, (V
Prepared by Educational Testing Service under Contract wb the National Center for Education StatisticsOffice of Educational Research and Improvement U.S. Department of Education

What is The Nation's Report Card?
THE NATION'S REPORT CARD. the National Assessment of Educational Progress OsIAEll. is the only nationally representative and
continuing assessment of what America's students know and can do in various subject areas. Since 1%9, assessments have been conducted
periodically in reading. mathematics. science, writing. history/geography. and other fields. By making objective information on student
performance available to policymakers at the national, state, and local levels. NAEP is an integral part of our nation's evaluation of the
condition aid progress of education. Only information related to academie achievement is collected under this program. NAEP guarantivs
the privacy of individual students and their families.
NAEP is a congressionally mandated project of the National Center for Education Statistics. the U.S. Department of Education, The
Commissioner of Education Statistics is responsible. by law, for carrying out the NAEP project through competitive awards to qualified
organizations. NAEP reports directly to the Commissioner, who is also responsibie for providing continuing reviews, including validation
studies and solicitation of public comment. on NAEP's conduct and usefulness.
In 1988. Congress ,reated the Natio.ial Assessment Governing Board (NAGB) to formulate policy guidelines for NAEP. The board is
responsible for selecting the subject areas to be assessed, which may include adding to thosespecified by Congress; identifying appropriate
achievement goals for each age and grade; developing assessment objectives; developing test specifications; designing the assessment
methodology; developing guidelines and standards for data analysis and for reporting and disseminating results: developing standards and
procedures for interstate, regional. and national comparisons; improving the form and use of the Nat'mal Assessment; and ensuring that all
items selected for use in the National Assessment are free from racial, cultural, gender. or regional bias.
The National Assessment Governing Board
Richard A. Boyd, ChairmanExecutive DirectorMartha Holden Jennings FoundationCleveland. Ohio
Phyllis Williamson AldrichCurriculum CoordinaterSaratoga-Warren B.O.C.E.S.Saratoga Springs. New York
Franck AlexanderAssociate SuperintendentCalifornia Department of EducationSacramento. California
David P. BattiniHigh Sc 'soot History TeacherCairo-Durham High SchoolCaiio. New York
Parris C. BattleTeacherHorace Mann Elementary SchoolMiami, Florida
Mary R. BlantonAttorneyCromwell. Porter. Blanton & BlantonSalisbury. North Carolina
Boyd W. Boeh ljeAttorneyGauss. Klyn. & BoehljePella, Iowa
Linda R. BryantTeacherGreenway Middle School Teaher CenterPiushurgh. Pennsylvania
Honorabk Michael N. CastleGovernor of DelawareCarvel State Office BuildingWilmington. Delaware
Honorable Naomi K. CohenState of ConnecticutHouse of RepresentativesLegislative Office BuildingHart ford. Connecticut
Chester E. Finn. Jr.Professor of Education and Public PolicyVanderbilt UniversityWashington. D.C.
Michael S. GlodeWyoming State Board or EducationSaratoga. Wyoming
Christine JohnsonPrincipalAbraham Lincoln High SchoolDenver, Colorado
John LindleyPrincipalSouth Colby Liementary SchoolPort Orchak . Washington
Carl J. MoserDirector of SchoolsThe Lutheran Church Missouri SynodInternational CenterSt. Louis, Missouri
Mark D. MusickPresidentSouthern Regional Education BoardAtlanta, Georgia
Honorable Carolyn PollanArkansas House of RepresentativesFort Smith, Arkansas
Matthew W. Prophet, Jr.SuperintendentPortland Oregon School DistrictPortland, Oregon
Honorable William T. RandallCommissioner of EducationState Department of EducationDenver. Colorado
Dorothy K. RichPresidentHome and School InstituteSpecial Projects OfficeWashington, D.C.
Honorable Richard W. RileyAttorneyNelson, Mullins. Riley and
ScarboroughColumbia. South Carolin..
Thomas TopuzesAttorneyLaw Offices of Frank RogozienskiCoronado, California
Herbert J. WalbergProfessor ot EducationUniversity of IllinoisChicago. Illinois
Assistant Secretary forEducational Research and
Improvement (Ex-Officio)U.S. Department of EducationWashington. D.C.
Roy TrubyExecutive Director. NAGBWashington. D.C.

NATIONAL CENTER FOR EDUCATION STATISTICS
The SIM ofMathemadesAchievement
in NORTHDAKOTA
The Trial State Assessment at Grade Fight
Report No: 21-ST.02 June 1991
Prepared by Educational Testing Service under Contract with the National Center for Education StatisticsOffice of Educational Research and Improvement U.S. Department of Education
4

U.S. Department of EducationLamar Alexander&crusty
Office of Educational Researcb and ImprovementBruno V. MannoActing Assistant Secretary
National Center for Education StatisticsEmerson 1. ElliottActing Commissioner
FOR MORE INFORMATION:
Copies of the 1990 NAEP Trial State Assessment's individual State reports are available directly from the participatingStates. Far ordering information, please contact the assessment division of your State Department of Education. Forordering information on the composite report of results for the Nation and all State participants, or for single copies
of the Executive Summary while supplies last, write:
Education Information BmnchOffice of Educational Research and ImprovementU.S. Department of Education555 New Jersey Avenue, NWWashington, D.C. 20208-5641
or call 1-800424-1616 (in the Washington, D.C. metropolitan area call 202-219-1651).
Meaty of Cowen, Catalog Card Number 91-61478
ISBN: 048685-14-9
The work upon which this publication is based was performed for the National Center for Education Statistics,
Office of Educatiotul Research aad Improvement, by Educational Testing Service.
Education' Toting Service is sa equal opponunity/affinnative scrim employer
Edmeetional Tessin" Service, EFS, and (P) are registered tradentarks of Educational Thsting

Table of Contents
EXECUTIVE SUMMARY 1
INTRODUCTION 7
Overview of the 1990 Trial State Assessment 8
This Report 9
Guidelines for Analysis 12
Profile of North Dakota 14
Eighth-Grade School and Student Characteristics 14
Schools and Students Assessed 15
PART ONEHow Proficient in Mathematics Are Eighth-Grade Students
in North Dakota Public Schools? 17
Chapter 1. Students' Mathematics Performance 18
Levels of Mathematics Proficiency 19
Content Area Performance 19
Chapter 2. Mathematics Performance by Subpopulations 24
Race/Ethnicity 24
Type of Community 27
Parents' Education Level 29
Gender 31
Content Area Performance 33
6THE 1990 NAEP TRIAL STATE ASSESSMENT in

PART TWOFinding a Context for UnderstandingStudents' Mathematics Proficiency 37
Chapter 3. What Are Students Taught in Mathematics? 39
Curriculum Coverage 41
Mathematics Homework 42
Instructional Emphasis 45
Slim/nary 48
Chapter 4. How Is Mathematics Instruction Delivered? 49
Availability of Resources 49
Patterns in Classroom Instruction 51
Collaborating in Small Groups 54
Using Mathematical Objects 55
Materials for Mathematics Instruction 56
Summary 59
Chapter 5. How Are Calculators Used? 60
The Availability of Calculators 62
The Use of Calculators 63
When To Use a Calculator 64
Summary 66
Chapter 6. Who Is Teaching Eighth-Grade Mathematics' 67
Educational Background 68
Summary 71
Chapter 7. The Conditions Beyond School that Facilitate Mathematics Learning and Teaching 73
Amount of Reading Materials in the Home 74
Hours of Television Watched per Day 75
Student Absenteeism .76
Students' Perceptions of Mathematics 78
Summary 79
PROCEDURAL APPENDIX 81
DATA APPENDIX 97
7
iv THE 1990 NAEP TRIAL STATE ASSESSMENT

North Dakota
THE NATION'SREPORT
CARD
EXECUTIVE SUMMARY
In 1988, Congress passed new legislation for the National Assessment of EducationalProgress (NAEP), which included -- for the first time in the project's history -- a provisionauthorizing voluntary state-by-state assessments on a trial basis, in addition to continuingits primary mission, the national av..e,,srnents that NAEP has conducted since its inception.
As a result of the legislation, the 1990 NAEP program included a Trial State Assessment
Progyam in eighth-grade mathematics. National assessments in mathematics, reading,
writing, and science were conducted simultaneously in 1990 at grades four, eight, andtwelve.
For the Trial State Assessment, eighth-grade public-school students were assessed in eachof 37 states, the District of Columbia, and two territories in February 1990. The samplewas carefully designed to represent the eighth-grade public-school population in a state orterritory. Within each selected school, students were randomly chosen to participate in theprogram. Local school district personnel administered all assessment sessions, and the
contractor's staff monitored SO percer of the sessions as part of the quality assuranceprogram designed to ensure that the sessions were being conducted uniformly. The resultsof the monitoring indicated a high degree of quality and uniformity across sessions.
THE 1990 NAEP TRIAL STATE ASSESSMENT 1

North Dakota41111.1.11M. 0.1,
In North Dakota, 106 public schools participated in the assessment. The weighted school
participation rate was 100 percent, which means that all of the eighth-grade students in this
saelple of schools were representative of 103 percent of the eighth-grade rublic-school
students in North Dakcta.
In each school, a random sample of students was selected to participate in the assessment.As estimated by the sample, 1 percent of the eighth-grade public-school population wasclassified as limited English Proficient (LEP), while 8 percent had an Individualized2ducation Plan (IEP). An 1EP is a plan, mitten for a student who has lseen detenninedto be eligible for special education, that typically sets forth goals and objectives for the
student and describes a program of activities and/or related services necessary to achieve the
goals and objectives.
Schools were permitted to exclude certain students from the assessment. To be exe-ided
from the assessment, a student had to be categorized as Limited English Proficient or had
to have an Individualized Education Plan and (in either case) be judgeli incapable of
partici, ating in the assessment. The students who were excluded from the assessment
because they were categorized as LEP or had an IEP represented 0 percent and 3 percentof the population, respectively. In tctal, 2,485 eighth-grade North Dakota public-schooistudents were assessed. The weighted student participation rate was 96 percent. This
means that the sample of students who took part in the assessment was representative of
96 percent of the eligible eighth-grade public-school student population in North Dakota.
Students' Mathematics Performance
The average proficiency of eighth-grade public-school students from North Dakota on the
NA113 mathematics scale is 281. This proficieney is higher than that of students across the
nation (261).
Average proficiency on the NAEP scale provides a global view of eighth graders'
mathematics achievement; however, it does not reveal specifically what the students know
and can do in the subject. To describe the nature of students' proficiency in greater detail,
NAEP used the results from the 1990 national assessments of fourth-, eighth-, and
twelfth-grade students to define the skills, knowledge, and understandings that characterize
four levels of mathematics performance -- levels 200, 250, 300, and 350 -- on the NAFP
scale.
9
2 THE 1990 NAEP TRIAL STATE ASSESSMENT

North Dakota
In North Dakota, 100 percent of the eighth graders, compered to 97 percent in the nation,appear to have &Nuked skills involv:ng simple additive reasoning and problem solving withwhole numbers (level 200). However, many fewer students in North Dakota (24 percent)and '2 percent in the nation appear to have acquired reaaoning and problemTaolving skillsinvolving fractions, decimals, percents, elementary geometric properties, and simplealgebraic manipulations (level 300).
The Trial State Assessment included five content areas -- Numbers and Operations;Measurement; Geometry; Data Analysis, Statistics, and Probability; ard Algebra andFunctions. Students in North Dakota performed higher than students in the nation in allof these five content areas.
Subpopulation Performance
In addition to the overall results, the 1990 Trial State Assessment permits reporting on theperformance of various subpopulations of the North Dakota eighth-grade studentpopulation defined by race/ethnicity, type of community, parents' education level, andgender. In North Dakota:
White students had higher average mathematics proficiency than didHispanic or American Indian students.
Further, a greater percentage of White students than Hispanic or AmericanIndian students attained level 300.
The resuits by type of community indicate that the average mathematicsperformance of the North Dakota students attending schools in advantagedurban areas was about the same as that of students attending schools inextreme rural arras and areas classified as "other".
In Noah Dakota, the average mathematics proficiency of eighth-gradepublic-school students having at least one parent who graduated fromcollege was approximately 33 points higher than that of students whoseparents did not graduate from high school.
The results by gender show that eighth-grade males in North Dakota hada higher average mathematics proficiency than did eighth-grade females inNorth Dakota. In addition, a greater percentage of males than females inNorth Dakota attained level 300. Compared to the national results, femalesin North Dakota performed higher than females across the country; malesin North Dakota performed higher than males across the country.
THE 1990 NAEP TRIAL STATE ASSESSMENT 3

North Dakota
A Context for Understanding Students' Mathematics Proficiency
Information on students' mathematics proficiency is valuable in and of itself, but it
becomes more useful for improving instruction and setting policy when supplemented with
contextual information about schools, teachers, and students.
To gather such information, the students participating in the 1990 Trial State Assessment,their mathematics teachers, and the principals or other administrators in their schools wereasked to complete questionnaires on policies, instruction, and programs. Taken together,the student, teacher, and school data help to describe some of the current practices andemphases in mathematics education, illuminate some of the factors that appear to berelated to eighth-grade public-school students' proficiency in the subject, and provide an
educational context for understanding information about student achievement.
Some of the salient results for the public-school students in North Dakota are as follows:
Less than half of the students in North Dakota (43 percent) were inschools where mathematics was identified as a special priority. This is asmaller percentage than that for the nation (63 percent).
In North Dakota, 48 percent of the students could take an algebra coursein eighth grade for high-school course placement or credit.
A greater percentage of students in North Dakota were taking eighth-grademathematics (73 percent) than were taking a course in pre-algebra oralgebra (25 percent). Across the nation, 62 percent were takingeighth-grade mathematics and 34 percent were taking a course inpre-algebra or algebra.
According to their teachers, the greatest percentage of eighth-grade studentsin public schools in North Dakota spent 30 minutes doing mathematicshomework each day; according to the students, most of them spent either15 or 30 minutes doing mathematics homework each day. Across thenation, teachers reported that the largest percentage of students spent either15 or 30 minutes doing mathematics homework each day, while studentsreported either 15 or 30 minutes daily.
Students whose teachers placed heavy instructional emphasis on Algebraand Functions had higher proficiency in this content area than studentswhose teachers placed little or no emphasis on Algebra and Functions.Students whose teachers placed heavy instructional emphasis on Numbersand Operations had lower proficiency in this content area than studentswhose teachers placed little or no emphasis on Numbers and Operations
1 1
4 THE 1990 NAEP TRIAL STATE ASSESSMENT

North Dakota
In North Dakota, 18 percent of the eighth-grade students had mathematicsteachers who reported getting all of the resources they needed, while35 percent of the students were taught by teachers who got only some orowe of the resources they needed. Across the nation, these figures were13 percent and 31 percent, respectively.
In North Dakota, 23 percent of the students never used a calculator towork problems in class, while 46 percent almost always did.
In North Dakota, 19 percent of the students were being taught bymathematics teachers who reported having at least a master's or educationspecialist's degree. This compares to 44 percent for students across thenation.
More than half of the students (69 percent) had teachers who had thehighest level of teaching certification available. This is similar to the figurefor the-, nation, where 66 percent of students were taught by teachers whowere certified at the highest level available in their states.
Students in North Dakota who had four types of reading materials (anencyclopedia, newspapers, magazines, and more than 25 books) at homeshowed higher mathematics proficiency than did students with zero to twotypes of these materials. This is similar to the results for the nation, wherestudents who had all four types of materials showed higher mathematicsproficiency than did students who had zero to two types.
Some of the eighth-grade public-school students in North Dakota(14 percent) watched one hour or less of television each day; 6 percentwatched six hours or more. Average mathematics proficiency was lowestfor students who spent six hours or more watching television each day.
2
THE 1990 NAEP TRIAL STATE ASSESSMENT 5

North Dakota
THE NATION'SREPORT
CARD
INTRODUCTION
As a result of legislation enacted in 1988, the 1990 National Assessment of EducationalProgress (NAEP) included a Trial State Assessment Program in eighth-wade mathematics.
The Trial State Assessment was conducted in February 1990 with the following
participants:
Alabama Iowa OhioArizona Kentucky Oklahoma
Arkansas Louisiana OregonCalifornia Maryland PennsylvaniaColorado Michigan Rhode Island
Connecticut Minnesota TexasDelaware Montana Virginia
District of Columbia Nebraska West VirginiaFlorida New Hampshire WisconsinGeorgia New Jersey WyomingHawaii New MexicoIdaho New YorkIllinois North Carolina GuamIndiana North Dakota Virgin Islands
i 3ME 1990 NAEP TRIAL STATE ASSESSMENT
4
7

North Dakota
This report describes the performance of the eighth-grade public-school students in NorthDakota and consists of three sections:
This Introduction provides background information about the Trial StateAssessment and this report. It also provides a profile of the eighth-gradepublic-school students in North Dakota.
Part One describes the mathematics performance of the eighth-gradepublic-school students in North Dakota, the Central region, and the nation.
Part Two relates students' mathematics performance to contextualinformation about the mathematics policies and instruction in schools inNorth Dakota, the Central region, and the nation.
Overview of the 1990 Trial State Assessment
In 1988, Congress passed new legislation for the National Assessment of Ed-;cationalProgress (NAEP), which included -- for the first time in the project's history -- a provisionauthorizing voluntary state-by-state assessments on a trial basis, in addition to continuingits primary mission, the national assessments that NAEP has conducted since its inception:
The National Assessment shall develop a trial mathematics assessment surveyinstrument for the eighth grade and shall conduct a demonstration of theinstrument in 1990 in States which wish to participate, with the purpose ofdetermining whether such an assessment yields valid, reliable State representativedata. (Section 406 (1)(2)(C)(1) of the General Education Provisions Act, asamended by Pub. L. 100-297 (20 U.S.C. 1221e-1(i)(2)(C)(1)))
As a result of the legislation, the 1990 NAEP piogram included a Trial State AssessmentProgram in eighth-grade mathematics. National assessmenti in mathematics, reading,writing, and science were conducted simultaneously in 1990 at grades four, eight, and
twelve.
For the Trial State Assessment, eighth-grade public-school students were assessed in eachstate or territory. The sample was carefully designed to represent the eighth-gradepublic-school population in the state or territory. Within each selected school, studentswere randomly chosen to participate in the program. Local .ichool district personneladministered all assessment sessions, and the contractor's staff monitored 50 percent of thesessions as part of the quality assurance program designed to ensure that the sessions were
being conducted uniformly. The results of the monitoring indicated a high degree of quality
and uniformity across sessions.
1 4
8 THE 1990 NAEP TRIAL STATE ASSESSMENT

North Dakota
The Trial State Assessment was based on a set of mathematics objectives newly developedfor the prop.= and patterned after the consensus process described in Public Law 98-511,Section 405 (E), which authorized NAEP through June 30, 1988. Anticipating the 1988legislation that authorized the Trial State Assessment, the federal government arranged forthe National Science Foundation and the U.S. Department of Education to issue a specialgrant to the Council of Chief State School Officers in mid-1987 to develop the objectives.The development process included careful attention to the standards developed by theNational Council of Teachers of Mathematics, the formal mathematics objectives of
states and of a sampling of local districts, and the opinions of practitioners at the state andlocal levels as to what content should be assessed.
There was an extensive review by mathematics educators, scholars, states' mathematics
supervisors, the National Center for Education Statistics (NCES), and the AssessmentPolicy Committee (APC), a panel that advised on NAEP policy at that time. Theobjectives were further refined by NAEP's Item Development Panel, reviewed by the TaskForce on State Comparisons, and resubmitted to NCES for pees review. Because theobjectives needed to be coordinated across all the grades for the national program, the finalobjectives provided specifications for the 1990 mathematics assessment at the fourth,eighth, and twelfth grades rather than solely for the Trial State Assessment in grade eight.An overview of the mathematics objectives is provided in the Procedural Appendix.
This Report
This is a computer-generated report that describes the performance of eighth-gradepublic-school students in North Dakota, in the Central region, and for the nation. Resultsalso are provided for groups of students defined by shared characteristics -- race/ethnicity,type of community, parents' education level, and gender. Definitions of the subpopulationsreferred to in this report are presented below. The results for North Dakota are based only
on the students included in the Trial State Assessment Program. However, the results forthe nation and the region of the country are based on the nationally and regionallyrepresentative samples of public-school students who were assessed in January or February
as part of the 1990 national NAEP program. Use of the regional and national results from
the 1990 national NAEP program was necessary because the voluntary nature of the TrialState Assessment Program did not guarantee representative nat'^nal or regional results,
since not every state participated in the program.
National Council of Teachers of Mathematics. Curriculum and Evaluation Standards for School Mathematics(Reston, VA: National Cour,cil of Teachers of Mathematics, 1989).
rs'tiTHE 1990 NAEP TRIAL STATE ASSESSMENT

North Dakota
RACE/ETHNICITY
Results are presented for students of different racial/ethnic groups based on the students'self-identification of their race/ethnicity according to the following mutually exclusive
categories: White, Black, Hispanic, Asian (including Pacific Islander), and American
Indian (including Alaskan Native). Based on criteria described in the Procedural Appendix,there must be at least 62 students in a particular subpopulation in order for the results forthat subpopulation to be considered reliable. Thus, results for racial/ethnic groups withfewer than 62 students are not reported. However, the data for all students, regardless ofwhether their racial/ethnic group was reported separately, were included in computingoverall results for North Dakota.
TYPE OF COMMUNITYResults are provided for four mutually exclusive community types -- advantaged urban,disadvantaged urban, extreme rural, and other -- as defined below:
Advantaged Urban: Students in this group live in metropolitan statistical areasand attend schools where a high proportion of the students' parents are inprofessional or managerial positions.
Disadvantaged Urban: Students in this group live in metropolitan statisticalareas and attend schools where a high proportion of the students' parents areon welfare or are not regularly employed.
Extreme Rural: Students in this group live outside metropolitan statisticalareas, live in areas with a population below 10,000, and vend schools wheremany of the students' parents are farmers or farm workers.
Other: Students in this category attend schools in areas other than those defmedas advantaged urban, disadvantaged urban, or extreme rural.
The reporting of results by each type of community was also subject to a minimum student
sample size of 62.
PARENTS' EDUCATION LEVELStudents were asked to indicate the eMent of schooling for each of their parents -- did notfinish high school, graduated high school, some education after high school, or graduatedcollege. The response indicating the higher level of education was selected for repotting.
6
10 THE 1990 NAEP TRIAL STATE ASSESSMENT

North Dakota
GENDERResults are reported separately for males and females.
REGIONThe United States has been divided into four regions: Northeast, Southeast, Central, andWest. States included in each region are shown in Figure 1. All 50 states and the Districtof Columbia are listed, with the participants in the Trial State Assessment highlighted inboldface type. Territories were not assigned to a region. Further, the part of Virginia thatis included in the Washington, DC, metropolitan statistical area is included in theNortheast region; the remainder of the state is included in the Southeast region. Becausemost of the students are in the Southeast region, regional comparisons for Vvginia will beto the Southeast.
FIGURE 1 I Regions of the Country
NORTHEAST SOUTHEAST CENTRAL WEST
Connecticut Mabama AlaskaDelaware Arkansas indiana Arizona
District of Columbia Florida Iowa CaliforniaMaine Georgia Kansas Colors**
illarybind Kentucky Michigan HawaiiMassachusetts Louisiana Minnesota IdahoNew Hampshire Mississippi Missouri Montana
New Jersey North Carolina Nebraska NevadaNew York South Carolina Noah Dakota New Mexico
Pennsytvania Tennessee Ohio OklahomaRhode island Virginia South Dakota Oregon
Vermont West Vit Ifni& Wisconsin Texas
Vnia UtahWashington
Wyoming
THE 1990 NAEP TRIAL STATE ASSESSMENT

North Dakota
Guide Lies for Analysis
This report describes and compares the mathematics profkiency of various subpopulationsof students -- for example, those who have certain demographic characteristics or whoresponded to a specific background question in a particular way. The report examines the
results for individual subpopulations and individual background questions. It does not
include an analysis of the relationships among combinations of these subpopulations or
background questions.
Because the proportions of students in these subpopulations and their average proficiencyare based on samples -- rather than the entire population of eighth graders in public schoolsin the state or territory -- the numbers reported are necessarily estimates. As such, they aresubject to a measure of uncertainty, reflected in tbe standard error of the estimate. Whenthe proportions or average proficiency of certain subpopulations are compared, it isessential that the standard error be taken into account, rather than relying solely onobserved similarities or differences. Therefore, the comparisons discussed in this report arebased on statistical tests that consider both the magni*ude of the difference between the
means or proportions and the standard errors of those statistics.
The statistical tests determine whether the evidence -- based on the data from the groups
in the sample is strong enough to conclude that the means or proportions are reallydifferent for those groups in the population. If the evidence is strong (i.e., the difference is
statistically significant), the report describes the group means or proportions as beingdifferent (e.g., one group performed higher than or lower than another group) -- regardlessof whether the sample means or sample proportions appear to be about the same or not.If the evidence is not sufficiently strong (i.e., the difference is not statistically significant),
the means or proportions are described as being about the same -- again, regardless ofwhether the sample means or sample proportions appear to be about the same or widely
discrepant.
The reader is cautioned to rely on the results of the statistical tests -- rather than on theapparent magnitude of the difference between sample means or proportions -- to determine
whether those sample differences are likely to represent actual differences between the
groups in the population. If a statement appears in the report indicating that a particular
group had higher (or lower) average proficiency than a second group, the 95 percent
confidence interval for the difference between groups did not contain the value zero. When
a statement indicates that the average proficiency or proportion of some attribute was about
the same for two groups, the confidence interval included zero, and thus no difference could
be assumed between the groups. When three or more gyoups are being compared, aBonferroni procedure is also used. The statistical tests and Bonferroni procedure are
discussed in greater detail in the Procedural Appendix.
1 8
12 THE 1990 NAEP TRIAL STATE ASSESSMENT

It is aho important to note that the confidence intervals pictured in the figures in Part Oneof this report are approximate 95 percent confidence intrvals about the mean of aparticular population of interest. Comparing such confidence intervals for two populationsis not equivalent to examining the 95 percent confidence interval for the difference betweenthe means of the populations. If the individual confidence intervals for two populationsdo not overlap, it is true that there is a statistically significant difference between the
populations. However, if the confidence intervals overlap, it is not always true that thereis not a statistically significant difference between the populations.
Finally, in several places in this report, results (mean proficiencies and proportions) arereported in the text for combined groups of students. For example, in the text, thepacentage of students in the combined group taking either algebra or pre-algebra is givenand compared to the percentage of students enrolled in eighth-grade mathematics.However, the tables that accompany that text report percentages and proficienciesseparately for the three groups (algebra, pre-algebra, and eighth-grade mathematics). Thecombined-group percentages reported in the text and used in all statistical tests are basedon unrounded estimates (i.e., estimates calculated to several decimal places) of the
percentages in each group. The percentages shown in the tables are rounded to integers.Hence, the percentage for a combined group (reported in the text) may differ slightly fromthe sum of the separate percentages (presented in the tables) for each of the groups thatwere combined. Similarly, if statistical tests were to be conducted based on the roundednumbers in the tables, the results might not be consonant with the results of the siatisticaltests that are reported in the text (based on unrounded numbers).
;.4
THE 1990 NAEP TRIAL STATE ASSESSMENT 13

North Dakota
Profile of North Dakota
EIGHTH-GRADE SCHOOL AND STUDENT CHARACTERISTICS
Table 1 provides a profile of the demographic characteristics of the eighth-gradepublic-school students in North Dakota, the Central region, and the nation. This profile
is based on data collected from the students and schools participating in the Trial State
Assessment.
TABLE 1 I Profile of North Dakota Eighth-GradeI Public-School Students
PERCENTAGE OF STUDZNTS
1990 NAEP TRIM. STATE ASSESSMENT North Dakota Central Nation
DEMOGRAPHIC SUBGROUPS Porcentaga Percentage Percentage
Rac&Ethnlclty
White Of ( 1.4) 79 ( 2.6) 70 ( 0.5)Slack ( 0.3) 13 ( 3.2) 18 ( 0.3)Hispanic 3 ( 0.4) 5 ( 1.0) 10 ( 0.4)Asian 1 ( 0.4) ( 0.4) 2 ( 0.5)American Indian 5 ( 12) ( 0.4) 2 ( 0.7)
Type of Community
Advantaged urban 9 ( 0.4) 3 ( 3.1) 10 ( 3.3)Disadvantaged urban 3 ( 0.4) 10 ( 4.3) 10 ( 2.8)Extreme rural 37 ( 2.5) ( 6.0) 10 ( 3.0)Other 50 ( 2.3) 79 ( 7.7) 70 ( 4.4)
Parents EducationDid not finish high school 4 ( 0.7) ( 0.9) 10 ( 0.8)Graduated high school 24 ( 1.3) 33 ( 2.1) 2S ( 1.2)Some education after high school 19 ( 0.8) 19 ( 0.9) 17 ( 0.9)Graduated college 49 ( 1.3) 35 ( 1.8) 39 ( 1.9)
(WiderMale 51 ( 1.8) SO ( 1.4) 51 ( 1.1)Female 49 ( 1.8) 50 ( 1.4) 49 ( 1.1)
The standard errors of the estimated statistics appear in parentheses. It can be said with about 95 percentcertainty that, for each population of interest, the value for the entire population is within ± 2 standard errorsof the estimate for the sample. The percentages for RaceiEthnicity may not add to 100 percent because somestudents categorized themselves as "Other." This may also be true of Parents' Education, for which somestudents responded "I don't know." Throughout this report, percentages less than 0.5 percent are reported as0 percent.
14
2 0
THE 1990 NAEP TRIAL STATE ASSESSMENT

North Dakota
SCHOOLS AND STUDENTS ASSESSED
Table 2 provides a profile summarizing participation data for North Dakota schools andstudents sampled for the 1990 Trial State Assessment. In North Dakota, 106 publicschools participated in the assessment. The weighted school participation rate was100 percent, which means that au of the eighth-grade students in this sample of schoolswere representaive of 100 perotnt of the eighth-grade public-school students in NorthDakota.
TABLE 2 I Profile of the Population Assessed inI North Dakota
EIORTN-ORADE PUBLIC soma.PARTICIPATION
Weighted school participationrate before substitution 018%
Weighted school participationrate after substitution 100%
Number of schools originallysampled
Number of schools not eligible
Number of schools in originalsample participating
Number of substitute schoolsprovided
Number of suostitute schoolsparticipating
Total number of participatingschools
111
5
8
106
THE 1990 NAEP TRIAL STATE ASSESSMENT
EIONTH-ORADE PUBL/C-SCHOOL STUDENTPARTICIPATION
Weighted student participationrate after make-ups WI%
Number of students selected toparticipate In the assessment 2,727
Number of students withdrawnfrom the assessment 58
Percentage of students who wereof Limited English Proficiency 1%
Percentage of students excludedfrom the assessment due toLimited English Proficiency 0%
Percentage of students who hadan individualized Education Plan 8%
Percentage of students excludedfrom the assessment due toindividualiTed Education Plan status 3%
Number ot Students to be assessed 2,578
Number of students assessed 2,485
IS

North Dakota
In each school, a random sample of students was selected to participate in the assessment.As estimated by the sample, 1 percent of the eighth-grade public-school population wasclassified as Limited English Proficient (LEP), while 8 percent had an IndividualizedEducation Plan (IEP). An IEP is a plan, written for a student who has been determinedto be eligible for special education, that typically sets forth goals and objectives for the.student and descaes a program of activities and/or =Wed services necessary to achieve the
goals and objectives.
Schools were permitted to exclude certain students from the assessment. To be excludedfrom the assessment, a student had to be categorized as Limited English Proficient or hadto have an Individualized &Ideation Plan and (in either, ease) be judged incapable ofparticipating in the assessment. The students who were excluded from the assessment
because they were categorized as LEP or had an IEP represented 0 percent and 3 percent
of the population, respectively.
In total, 2,485 eighth-grade North Dakota public-school students were assessed. Theweighted student participation rate was 96 pexcent. This means that the sample of students
who took part in the assessment was representative of 96 percent of the eligibleeighth-grade public-school student population in North Dakota.
22
16 THE 1990 NAEP TRIAL STATE ASSESSMENT

North Dakota
THE NATION'SREPORT
CARD
PART ONE
How Proficient in Mathematics Are Eighth-GradeStudents in North Dakota Public Schools?
The 1990 Trial State Assessment covered five mathematics content areas -- Numbers andOperations; Measurement; Geometr2; Data Analysis, Statistics, and Probability; andAlgebra and Functions. Students' overall performance in these content areas wassummarized on the NAEP mathematics scale, which ranges from 0 to 500.
This part of the report contains two chapters that describe the mathematics proficiency ofeighth-wade public-school students in North Dakota. Chapter 1 compares the overallmathematics performance of the 'students in North Dakota to students the Central regionand the nation. It also presents the students' average proficiency separately for the fivemathematics content areas. Chapter 2 sumniarizes the students' overall mathematicsperformance for subpopulations defined by race/ethnicity, type of community, parents'education level, and gender, as well as their mathematics performance in the five contentareas.
11 3
THE 1990 NAEP TRIAL STATE ASSESSMENT 17

0101441.
CHAPTER 1
North Dakota.Ir semwemeoerre
Students' Mathematics Performance
As shown in Figure 2, the average proficiency of eighth-grade public-school students from
North Dakota on the NAEP mathematics scale is 281. This proficiency is higher than that
of students across the nation (261).2
FIGURE 2 Average Eighth-Grade Public-SchoolI Mathematics Proficiency
NAEP Mathematics Scale
200 225 250 275 300 500
Averags
Proficiency
N.
PPol
N.
North Dakota
Central
Nation
The standard errors are presented in parenthebes. With about 95 percent certainty, the average mathematicsproficiency for each population of interest is within ± 2 standard errors of the estimated mean (95 percentconfidence interval, denoted by I-H). If the confidence intervals for the populations do not overlap, there is a
statistically significant difference between the populations.
Differences reported are statistically different at about the 95 percent certainty level. This means that with
about 95 percent certairity there is a real difTerence in the average mathematics proficiency between the two
populations of interest
2- 4
18 THE 1990 NAEP TRIAL STATE ASSESSMENT

North Dakota
LEVELS OF MATHEMATICS PROFICIENCY
Average proficiency on the NAEP scale provides a global view of eighth graders'mathematics achievement; however, it does not reveal the specifics of what the studentsknow and can do in the subject. To desclibe the nature of students' proficiency in waterdetail, NAEP used the results from the 1990 national assessments of fourth-, eighth-, andtwelfth-grade students to define the skills, knowledge, and understandings that characterizefour levels of mathematics performance -- levels 200, 250, 300, and 350 -- on the NAEPscale.
To defme the skills, knowledge, and understandings that characterize each proficiency level,mathematics specialists studied the questions that were typically answered correctly bymost students at a particular level but answered incorrectly by a majority of students at thenext lower level. They then summarized the kinds of abilities needed to answer each setof questions. While derming proficiency levels below 200 and above 350 is theoreticallypossible, so few students performed at the extreme ends of the scale that it was impracticalto define meaningful levels of mathematics proficiency beyond the four presented here.
Definitions of the four levels of mathematics proficiency are given in Figure 3. lt isimportant to note that the definitions of these levels are based solely on studentperfonnance on the 1990 mathematics assessment. The levels are not judgmental standardsof what ought to be achieved at a particular grade. Figure 4 provides the percentages ofstudents at or above each of these proficiency levels. In North Dakota, 100 percent of theeighth graders, compared to 97 percent in the nation, appear to have acquired skillsinvolving simple additive reasoning and problem solving with whole numbers (level 200).However, many fewer students in North Dakota (24 percent) and 12 percent in the nationappear to have acquired reasoning and problem-solving skills involving fractions, decimals,
percents, elementary geometric properties, and simple algebraic manipulations (level 300).
CONTENT AREA PERFORMANCE
As previously indicated, the questions comprising the Trial State Assessment covered fivecontent areas -- Numbers and Operations; Measurement; Geometry; Data Analysis,
Statistics, and Probability; and Algebra and Functions. Figure 5 provides the NorthDakota, Central region, and national results for each content area. Students in NorthDakota performed higher than students in the nation in all of these five content areas.
THE 1990 NAEP TRIAL STATE ASSESSMENT 19

North Dakota
FIGURE 3 Levels of Mathematics Proficiency
LEVEL 200
111Simple Addftive Reasoning and Problem Solving with WholeNumbers
Students at this level have some degree of understanding of simple quantitative relationships involving
whole numbers. They can solve simple addition and subtraction problems with and without regrouping.
Using a calculator, they can extend these abilities to multiplication and division problems. These students
can identify solutions to one-step word probleMs and select the greatest four-digit number in a list.
In measurement, these students can read a ruler as well as common weight and graduated scales. They
also can make volume comparisons based on visualization and determine the value of coins. In geometry,
these students can recognize simpie figures. In data analysis, they are able to read simple bar graphs. In
the algebra dimension, these students can recognize translations of word problems to numerical sentences
and eudend simple pattern sequences.
LEVEL 250 Simple Multiplicative Reasoning and Two-Step Problem Solving
Students at this levet have extended their understanding of quantitative reasoning with whole numbers from
additive to multiplicative settings.. They can solve routine one-step multiplication and division problems
involving remainders and two-step addition and subtraction problems involving money. Using a calculator,
they can identify solutions to other elementary two-step word problems. In these basic problem-solving
situations, they can identify missing or extraneous information and have some knowledge of when to use
computational estimation. They have a rudimentary understanding of such concepts es whole number place
value, "even," "factor," and "multiple."
In measurement, these students can use a ruler to measure objects, convert units within a system when the
conversions require multiplication, arid recognize a numerical expression solving a measurement word
problem. In geometry, they demonstrate an initial understanding of basic terms and propertios, such as
parallelism and symmetry. In data analysis, they can complete a bar graph, sketch a circle graph, and use
information from graphs to solve simple problems. They are beginning to understand the relationship
between proportion and probability. In algebra, they are beginning to deal informally with a variable
through numerical substitution in the evaluation of simple expressions.
2 6
20 THE 1990 NAEP TRIAL STATE ASSESSMENT

North Dakota
FIGURE 3 I Levels of Mathematics Proficiency(continued) 1
LEVEL 300 Reasoning and Problem Solving involving Fractions, Decimals,Percents, Elementary Geometric Properties, and Simple AlgebraicManipulations
Students at this level are able to represent, Interpret, and perform simple operatiOnS with fractions anddecimal numbers. They are able to locate fractions and decimals on number lines, simplify fractions, andrecognize the equivalence between cornmOn fractions and decimals, Including p4ctorial representations.They can Interpret the meaning of percentr less than and greater than 100 and apply the concerts ofpercentages to solve simple problems. These students demonstrate some evidenca of using mathematicalnotation to interpret expressions, Including those with exponents and negative Integers.
In measurement, these students can find the perimeters and areas of rectangles, recognize relationshipsamong common units of measure, and use proportional relationships to solve routine problems involvingsimilar triangles and scale drawings. In geometry, they have some mastery of the definitions andproperties of geometric figures and solids.
In data analysis, these students can aculate averages, select and interpret data from tabular displays,pictographs, and line graphs, compute relative frequency distributions, and have a beginning understandingof sample bias. in algebra, they can graph points in the Cartesian plane and perform simple algebraicmanipulations such as simplifying an expression by collecting like terms, identifying the solution to openlinear sentences and inequalities by substitution, and checking and graphing an Interval representing acompound inequality when it is described In words. They can determine and apply a rule for simplefunctional relations and extend a numerical pattern.
LEVEL 350 Reasoning and Problem Solving Involving Geometric Relationships,
Algebraic Equations, and Beginning Statistics and Probability
Students at this level have extended their knowledge of number and algebraic understanding to includesome properties of exponents. They can recognize scientific notation on a calculator and make the*ransition between scientific notation and decimal notation. In measurement, they can apply theirknowledge of area and perimeter of rectangles and triangles to solve problems. They can find thecircumferences of circles and the surface areas of solid figures. In geometry, they can apply thePythagorean theorem to solve problems involving indirect measurement. These students also can applytheir knowledge ot the properties of geometric figures t 've problems, suth as determining the slope ofa line.
In data analysis, these students can compute means from frequency tables and determine the probabilityof a simple event. In algebra, they can identify an equation describing a linear relator% provided in a tableand solve literal equations and a system of two linear equations. They are developing an understandingof linear functions and their graphs, as well as functional notation, including the composition of functions.They can determine the nth term of a sequence and give counterexamples to disprove an algebraicgeneralization.
r, **,4. I
THE 2990 NAEP TRiAL STATE ASSESSMENT 21

North Dakota
FIGURE 4 I Levels of Eighth-Grade Public-SchoolMathematics Proficiency
LEVEL 350
StateRegionNation
LEVEL 300
StateRegionNation
LEVEL 250
StateRegionNation
LEVEL 200
StateRegionNation
0 20 40 eo 80
o ( 0.4)0 ( 0.2)0 ( 0.2)
24 ( 1.7)12 ( 2.5)12 ( 1.2)
( 1.4)70 ( 3.2)64 ( 1.6)
100 ( 0.2)98 ( 0.9)97 ( 0.7)
/ 100
Percentage at or Above Proficiency LevelsThe standard errors are presented in parentheses. With about 9 5 percent certainty, the valuefor each population of interest is within ± 2 standard errors of the estimated percentage (95percent confidence interval, denoted by 1-4.4). If the confidence intervals for the populationsdo not overlap, there is a statistically significant difference between the populations.
26
22 THE 1990 NAEP TRIAL STATE ASSESSMENT
North Dakota
FIGURE 5 I Eighth-Grade Public-School MathematicsContent Area Performance
StateRegionNation
StateRegionNation
StateRegionNation
StateRegionNation
StateRegionNation
4111411161"1.,
0 200 225 250 275
AverageProfkimicy
296 ( 1.1)270 ( 2.7)266 ( 1.4)
260 ( 1.9)293 ( 3.4)258 ( 1.7)
276 ( 1.3)262 ( 3.1)259 ( 1.4)
2136 ( 1.5)265 ( 3.2)262 ( 1.8)
275 ( 1.1)283 ( 2.1)260 ( 1.3)
300 500
Mathematics Subscale ProficiencyThe standard errors are presented in parentheses. With about 95 percent certainty, theaverage mathematics proficiency for each population of interest is within ± 2 standarderrors of the estimated mean (95 percen confidence interval, denoted by I-0-9. If theconfidence intervals for the populations not overlap, there is a statistically significantdifference between the populations.
rs (3A. 4 7
THE 1990 NAEP TRIAL STATE ASSESSMENT 23

North Dakota
CHAPTER 2
Mathematics Performance by Subpopulations
In addition to the overall state results, the 1990 Trial State Assessment included reportingon the performance of various subgroups of the student population defined byrace/ethnicity, type of community, parents' education level, and gender.
RACE/ETHNICITY
The Trial State Assessment results can be compared according to the different racial/ethnic
groups when the number of students in a racial/ethnic group is sufficient in size to bereliably reported (at least 62 students). Average mathematics performance results forWhite, Hispanic, and American Indian students from North Dakota are presented in Figure
6.
As shown in Figure 6, White students demonstrated higher average mathematicsproficiency than did Hispanic or American Indian students.
Figure 7 presents mathematics performance by proficiency levels. The figure shows that agreater percentage of White students than Hispanic or American Indian students attained
level 300.
3 0
24 THE 1990 NAEP TRIAL STATE ASSESSMENT

North Dakota
FIGURE 6 I Average Eighth-Grade Public-School1 Mathematics Proficiency by Race/Ethnicity
NAEP ilathensalitts Scala
0 200 225 250 275 300 500
-% : \\
sPw!'s
Average
Prong/way
1.4001
1-4Nowe
North DakotaWhite
HispanicAmerican Indian
CentralWhite
HispanicAmerican Indian
NationWhite
HispanicAmerican Indian 4101.'50
The standard errors are presented in parentheses. With about 95 percent certainty, the average mathematicsproficiency for each population of interest is within 2 standard errors of the estimated mean (95 percentconfidence interval, denoted by P.4-1). If the confidence intervals for the populations do not overlap, there is astatistically significant difference between the populations. ! Interpret with caution the nature of the sampledoes not allow accurate determination of the variability of this estimated mean proficiency. *** Sample size isinsufficient to permit a reliable estimate (fewer than 62 students).
31
THE 1990 NAEP TRIAL STATE ASSESSMENT 2$

North Dakota
ME WOWSREPORT
FIGURE 7 I Levels of Eighth-Grade Public-School CARD
1 Mathematics Proficiency by Race/Ethnicity
LEVEL 300
stateWhiteHispanicAmer. Indian
RaglanWhiteHispanicAmer. Indian
MOMWhiteHispanicAmer. Indian
LEVEL 250
StateWhiteHispanicAmer. Indian
RefPlenWhiteHispanicAmer. Indian
NationWhiteHispanicAmer. Indian
LEVEL 200
StateWhiteHispanicAmer. Indian
Re9ionWhiteHispanicAmer. Indian
NationWhiteHispanicAmer. Indian
Porcantago
20 ( 1.8)5 ( 4.4)0 ( 0.7)1
14 ( 2.8)
.)
15 ( 1.5)3 ( 1.1)1 ( 2.3)1
92 ( 0.7)52 ( 9.0)39 ( 7.1)1
7$ ( 3.1)( "-I )
(
74 ( 1.8)41 ( 4.5)45 (16.0)1
20 40 60 80
Percentage at or Above Proficiency LevelsThe standard errors are presented in parentheses. With about 95 percent certainty, the valuefor each population of interest is within ± 2 standard errors of the estimated percentage (95
percent confidence interval, denoted by 144). If the confidence intervals for the populationsdo not overlap, there is a statistically significant difference between the populations.Proficiency level 350 is not presented in this figure because so few students attained that level.! Interpret with caution the nature of the sample does not allow accurate determinationof the variability of this estimated mean proficiency. *** Sample size is insufficient topermita reliable estimate (fewer than 62 students).
3 2
26 THE 1990 NAEP TRIAL STATE ASSESSMENT

North Dakota
TYPE OF COMMUMTY
Figure 8 and Figure 9 present the mathematics proficiency results for eighth-grade studentsattending public schools in advantaged urban areas, extreme rural arras, and areasclassified as "other". (These are the "type of community" goups in North Dakota withstudent samples large enough to be reliably reported.) The results indicate that the averagemathematics performance of the North Dakota students attending schools in advantagedurban areas wu about the same as that of students attending schools in extreme rural areasand areas classified as "other".
FIGURE 8 Average Eighth-Grade Public-SchoolMathematics Proficiency by Type ofCommunity
NAEP Mathematics $cale
0 200 225 250 275 300 500
Average
Proficiency
North DakotaAdvantaged urban
Extreme rural
Other
CentralAdvantaged urban
Extreme rural
Other
Nation
IA),s( 24)
an 104
low (
tisi .( SA)
il40041 Advantaged urban
Extreme rural
Other
$11
211111
((
3.8)1
4.1)I
1-0)
The standard errors are presented in parentheses. With about 95 percent certainty, the average mathematicsproficiency for each population of interest is within ± 2 standard errors of the estimated mean (95 percentconfidence interval, denoted by 14-1). If the confidence intervals for the populations do not overlap, there is astatistically significant difference between the populations. ! Interpret with caution -- the nature of the sampledoes not allow accurate determination of the variability of this estimated mean proficiency. *** Sample size isinsufficient to permit a reliable estimate (fewer than 62 students).
33THE 1990 NAEP TRIAL STATE ASSESSMENT 27
North Dakota
FIGURE 9
LEVEL 300
Stat.Adv. urbanExt. ruralOther
RegionAdv. urbanExt. ruralOther
NationAdv. urbanExt. ruralOther
LEVEL 250
atmAdv. urbanExt. ruralOther
RoirionAdv. urbanExt. ruralOther
NationMv. urbanExt. ruralOther
LEVEL 200
StateAdv. urbanExt. ruralOther
RegionAdv. urbanExt. ruralOther
NationMv. urbanExt. ruralOther
Levels of Eighth-Grade Public-SchoolMathematics Proficiency by Type ofCommunity
0 20 40 60 80
Percentage at or Above Proficiency LevelsThe standard errors are presented in parentheses. With about 95 percent certainty, the valuefor each population of interest is within ± 2 standard errors of the estimated percentage (95percent confidence interval, denoted by 1-4-I). If the confidence intervals for the populationsdo not overlap, there is a stafistically significant difference between the populations.Proficiency level 350 is not presented in this figure because so few students attained that level.
Interpret with caution the nature of the sample does not allow accurate determinationof the variability of this estimated mean proficiency. *** Sample size is insufficient to permita reliable estimate (fewer than 152 students).
100
3 4
28 THE 1990 NAEP TRIAL STATE ASSESSMENT
3D ( 5.6)24 ( 3.0)24 ( 2.3)
min (
13 ( 2.9)
28 ( 4.8)t8 ( 2.3)1
12 ( 1.2)
93 ( 32)( 3.2)( 1.5)
(
***)73 ( 4.2)
93 ( 4.6)158 ( 8.2)184 ( 2.3)
100 ( 0.0)90 ( OS)
100 ( 0.2)
( ***/mix ( )Oil ( 0.9)
100 ( 0,0)97 ( 2.8)197 ( 1.0)

North Dakota
PARENTS' EDUCATION LEVEL
Previous NAEP findings have shown that students whose parents are better educated tend
to have higher mathematics proficiency (see Figures 10 and 11). In North Dakota, the
average mathematics proficiency of eighth-grade public-school students having at least one
parent who graduated from college was approximately 33 points higher than that of
students who reported that neither parent waduated from high school.. As shown in Table
1 in the Introduction, a larger percentage of students in North Dakota (49 percent) than
in the nation (39 percent) had at least one parent who gaduated from college. Incomparison, the percentage of students who reported that neither parent graduated from
high school was 4 percent for North Dakota and 10 percent for the nation.
FIGURE 10 I Average Eighth-Grade Public-SchoolMathematics Proficiency by Parents' Education
NAEP Mathornotico Seal*
200 225 250 275 300 500
AVrage
Proficiency
NI
North DakotaHS non-graduate
HS graduate
Some college
College graduate
CentralS non-gradllateHS graduate
Some college
College graduate
Nation141$ HS non-graduate
Fro HS graduate
/44 Some college
HI College graduate
The standard errors are presented in parentheses. With about 95 percent certainty, the average mathematicsproficiency for each population of interest is within ± 2 standard errors of the estimated mean (95 percentconfide= interval, denoted by 1-1-1). If the confidence intervals for the populations do not overlap, there is astatistically significant difference between the populations. *** Sample size is insufficient to permit a reliableestimate (fewer than 62 students).
:3 5
THE 1990 NAEP TRIAL STATE ASSESSMENT 29

North Dakota
11410111REPOK
FIGURE II I Levels of Eighth-Grade Public-School CARO
1 Mathematics Proficiewy by Parents' Education
LEVEL 300
StateHS non-grad.HS graduateSome collegeCollege grad.
Ploclk InHS non-grad.HS graduateSOMe C011egaCollege grad.
NationHS non-grad.HS graduateSome collegeCollege grad.
LEVEL 250
StateHS non-grad.HS graduateSome collegeCollege grad.
RegionHS non-grad.HS graduateSome collegeCollege grad.
NationHS non-grad.HS graduateSome collegeCollege grad.
LEVEL 200
MitaHS non-grad.HS graduateSome collegeCollege grad.
RegionHS non-grad.HS graduateSome collegeCollege grad.
NationHS nongrad.HS graduateSome collegeCollege grad.
20 40 00 80
Percentage at or Above Proficiency LevelsThe standard errors are presented in parentheses. With about 95 percent certainty, the valuefor each population of interest is within ± 2 standard errors of the estimated percentage (95percent confidence interval, denoted by H-i). If the confidence intervals for the populationsdo not overlap, there is a statistically significant difference between the populations.Proficiency level 350 is not presented in this figure because so few students attained that level.0" Sample size is insufficient to permit a reliable estimate (fewer then 62 students).
2 ( 3.5)14 ( 3.2)25 ( 3,5)32 ( 2.4)
(( 3.9)
14 ( 3.4)17 (
1 ( 0.9)5 ( 1.5)
12 ( 1.4)21 ( 1.9)
00 ( 7.5)03 ( 2.9)
114 ( 1.1)
( "4)$5 ( 4.1)76 ( 5,1)79 ( 3.9)
37 ( 4.6)1541 ( 2.7)71 ( 2.6)7S ( 2.0)
09 ( 0.9)SS ( 0.8)
100 ( 0.1)100 ( 0.0)
61(1.2)100 ( 0.0)09 ( 0.9)
100
:4;
30 THE 1990 NALP TRIAL STATE ASSESSMENT
( 1.9)07 ( 0.8)SO ( 0.7)90 ( 0.7)

North Dakota
GENDER
As shown in Figure 12, eighth-grade males in North Dakota had a higher average
mathematics proficiency than did eighth-grade females in North Dakota. Compared to thenational results, females in North Dakota performed higher than females across thecountry; males in North Dakota performed higher than males across the country.
FIGURE 12 I Average Eighth-Grade Public-School1 Mathematics Proficiency by Gender
NAEP Mathematics Scat.
200 225 250 275 300 500
AlamoProbe Nosy
North Dakotamale 101 ( 14)
Female 170
ClehtfalI-404 . Maile Sr, 363),
Female 24):
Nation/44 Male Sit 14)
Pt4 Female 150 ( 14)
The standard errors are presented m parentheses. With about 95 percent certainty, the average mathematicsproficiency for each population of interest is within 1 2 standard errors of the estimated mean (95 percentconfidence interval, denoted by 14-4). If the confidence intervals for the populations do not overlap, there is astatistically significant difference between the populations.
As shown in Figure 13, there was no difference between the percentages of males and
females in North Dakota who attained level 200. The percentage of females in NorthDakota who attained level 200 was greater than the percentage of females in the nation who
attained level 200. Also, the percentage of males in North Dakota who attained level 200was greater than the percentage of males in the nation who attained level 200.
37
THE 1990 NAEP TRIAL STATE ASSESSMENT 31

North Dakota
FIGURE 13 I Levels of Eighth-Grade Public-SchoolMathematics Proficiency by Gender
LEVEL 300
State MaleFemale
Region MaleFemale
Nation Male
Female
LEVEL 250
State MaleFemale
Region MaleFemale
Nation Male
Female
LEVEL 200
State Male
FemaleRegion Male
FemaleNation Male
Female
0 20 40 60 80 100
Percentage at or Above Proficiency LevelsThe standard errors are presented in parentheses. With about 95 percent certainty, the valuefor each population of interest is within ± 2 standard errors of the estimated percentage (95percent confidence interval, denoted by 1-4-1). If the confidence intervals for the populationsdo not overlap, there is a statistically significant difference between the populations.Proficiency level 350 is not presented in this figure because so few students attained th level.
32 ME 1990 NAEP TRIAL STATE ASSESSMENT
27 ( 2.3)21 ( 2.0)14 ( 4.8)9 ( 2.3)
14 ( 1.7)
10 ( 1.3)
90 ( 1.5)
87 ( 2.2)SS ( 3.3)
71 ( 4.0)14 ( 2.0)64 ( 1.8)
100 ( 0.3)
90 ( 0.3)
00 ( 0.8)
se ( 1.2)
97 ( 0.9)
97 ( 0.8)

North Dakota
In addition, a greater percentage of males than females in North Dakota attained level 300.The percentage of females in North Dakota who attained level 300 was water than thepercentage of females in the nation who attained level 300. Also, the percentage of malesin North Dakota who attained level 300 was greater than the percentage of males in thenation who attained level 300.
CONTENT AREA PERFORMANCE
Table 3 provides a summar5r of contentarea peiformance by race/ethnicity, type ofcommunity, parents' education level, and gender.
THE 1990 NAEP TRIAL STATE ASSESSMENT 33

North Dakota
TABLE 3 I Eighth-Grade Public-School Mathematicsi Content Area Performance by Subpopulations
AVERAGE MATHEMATICS PROFICIENCY OF STUDENTS
1980 NAEP TRIALSTATE ASSESSMENT
Numbers andOperations M easuremaft
_
Geome tryData Analysis'Statistics. and
Probability
-Algebra andFunctions
_
TOTAL
Proficiency Proficienzy Proficiency issoficiency Padiclioney
State 28e ( 1.1) 200 ( 1.9) 278 ( 1.3) 286 f 1.5) 275 ( 1.1)Region 270 ( 2.7) 203 ( 3.4) 252 ( 3.1) 265 ( 3.2) 253 ( 2.1)Nation 200 ( 14) 258 ( 1.7) 25a ( 1.4) 262 ( 1.8) 260 ( 1.3)
RA44/ETBNICITY
WhiteState 289( 1.1) 284 ( 1.5) 280 ( 1.3) 289 ( 1.1) 2/8 ( 0.9)Region 270 ( 2.9) 271 ( 3.7) 268 ( 3.0) 273 ( 3.1) 259 ( 2.3)Nation 273 ( 1.0) 267 ( 2.0) 267 ( 1.5) 272 ( 1.8) 208 ( 1.4)
HispankStateRegion
258 (*low (
4.9) 239 ((
7.1)114)
248 ((
6.0 253 ((
7.0)4+1
243 (*44
5.7)
Nation 243 ( 2.7) 238 ( 3.4) 243 ( 34) 239 ( 3.4) 243 ( 3.1)American Wien
StateRegion
248 ( 3.2)1*.p.)
234 ( 5.3)1 248 ((
3.4)144,)
242 (***
5.5)1 234 (***
4.7)1
Nation 249 ( 7.8)1 247 ( 0.8)1 248 ( 8.0)! 242 ( 5.2)1 242 ( 4.9)s
TYPE OF CO4IMUNITY
Advantaged urbanState 284 ( 2.4) 293 ( 3.2) 279 ( 2.4)Region 1144 ( *MR) *V* ( (
Nation 283 ( 3.2)1 281 ( 3.2)1 277 ( 5.2)1 285 ( 4.8)1 277 ( 4.8)1
Extreme ruralStateRegion
285 (*414 (
2.3)***)
279 ((
3.7) 277 ( 2.5) 283 ((
3.3)*41
273 ( 2.4)*gm.)
Nation 258 ( 4.3)1 254 ( 4.2)! 253 ( 44)1 257 ( 5.0)1 258 ( 4.8)1
OtherState 288 ( 1.2) 280 ( 2.4) 278 ( 1.8) 287 ( 1.7) 277 ( 1.4)
Region 273 ( 3.5) 268 ( 4.3) 254 ( 3.7) 267 ( 4.1) 285 ( 2.5)Nation 266 ( 1.9) 257 ( 2.4) 259 ( 1.7) 281 ( 2.2) 261 ( 1.7)
The standard errors of the estimated statistics appear in parentheses. It can be said with about 95 percentcertainty that, for each population of interest, the value for the entire population is within * 2 standard errorsof the estimate for the sample. ! Interpret with caution -- the nature of the .sample does not allow accuratedetermination of the variability of this estimated mean proficiency. *** Sample size is insufficient to permit areliable estimate (fewer than 62 students).
4 0
34 THE 1990 NAEP TRIAL STATE ASSESSMENT

North Dakota
TABLE 3 I Eighth-Grade Public-School Mathematics(continued) i Content Area Performance by Subpopulations
AVERAGE MATHEMATICS PROFICIENCY OF STUDENTS
1000 NAEP TRIALS T A T E ASSESSMENT
Numbers andO p e r a t i o n s 1 1 . 2 1 1 1 1 " 1 " " " a n s "
Data Ariatysk,l i b a s t k t andProbability Al"lbrRatotiansaand
TOTAL
StateRegionNation
PARENTS' EDUCATION
ItS non-waduateStateRegionNation
NS graduatStateRegionNation
Som collegeStateRegionNation
College graduateStateRegionNation
(WNW'Male
StateRegionNation
FemaleStateRegionNation
PrOckincy Praildancy PrOckstry Proldency Prvaltalmay
280 ( 1.1) 260270 ( 2.7) 2133 3.4206 ( 1.4) 258 1.7
270 13) 295 (262 3.1) 205( 3.2259 1.4) 262 ( 141
275 1.12113 2.1200 13
263 1 4.7) 24f ( 5.8) 253 i 3.2) 40 ( $.5) 22 i LI... ...) ... ( .4.) ...) *MO On247 ( 2.4) 237 ( 3.6) 242 ( 2.2) 240 ( 3.1) 242 ( 3.01
278 ( 2.3) 274 ( 3.8) 268 ( 2.1) 278 ( 3.0)289 ( 2.5) 2518 ( 3.8) 251 ( 3.4) 260 ( 3.21 leg 1 24259 ( LS) 241 ( 2.1) 252 ( 1.9) 253 ( 22 253 2.0)
289 ( 2.4) 200 ( 2.6) 279 ( 2.4) 2011 ( 22 276 ( 22)275 ( 3.2) 270 ( 5.7) 264 ( 4.9) 273 ( 4.7 NO i Ei270 ( 1.5) 264 ( 2.7) 202 ( 2.0) 289 ( 2.4
292 ( 1.5) 2137 ( 2.4) 285 ( 1.5) 21;0 ( 1.7) 263 1.5)277 ( 42) 270 ( 4.4) 270 ( 4.3) 273 ( 4.5) 271 3.1)27$ ( 13) 272 ( 2.0) 270 ( 1.6) 276 ( 2.2) 273 1.7)
289 ( 1.7)271 ( 3.9)206 ( 2.0)
283 ( 1.8)270 ( 2.7)266'( 1.4)
288 ( 2.2)267 ( 4.8)262 ( 2.3)
274 ( 2.3)259 ( 3.4)253 ( 1.6)
279 ( 1.6)264 ( 3.7)200 ( 1.7)
276 ( 1.7)200 ( 3.1)25$ ( 1.5)
290 ( 1.6)265 ( 3.4)262 ( 2.1)
281 ( 1.8)265 ( 4.0)261 ( 1.9)
276 ( 1.3)263 ( 2.2)200 ( 1.6)
275 ( 1.7)262 ( 2.8)260 ( 14)
The standard errors of the estimated StatistiCS appear in parentheses, It can be said with about 95 percentcertainty that, for each population of interest, the value for the entire population is within ± 2 standard errorsof the estimate for the sample. *** Sample size is insufficient to permit a reliable estimate (fewer than 62students).
41THE 1990 NAEP TRIAL STATE ASSESSMENT 35

North Dakota
NE NATION'SREPORT
CARD
PART TWO
Finding a Context for Understanding Students'
Mathematics Proficiency
Information on students' mathematics proficiency is valuable in and of itself, but it
becomes more useful for improving instruction and setting policy when supplemented with
contextual information about schools, teachers, arl students.
To gather such information, the students participatAng in the 1990 Trial State Assessment,
their mathematics teachers, and the principals or other administrators in their schools wereasked to complete questionnaires on policies, instruction, and programs. Taken together,the student, teacher, and school data help to describe some of the current practices andemphases in mathematics education, illuminate some of the factors that appear to berelated to eighth-grade public-school students' proficiency in the subject, and provide aneducational context for understanding information on student achievement. It is important
to note that the NAEP data cannot establish cause-and-effect links between variouscontextual factors and students' mathematics proficiency. However, the results do provideinformation about important relationships between the contextual factors and proficiency.
The contextual information provided in Part Two of this report focuses on four major
areas: instructional content, instructional practices, teacher qualifications, and conditions
beyond school that facilitate learning and instruction -- fundamental aspects of the
educational process in the country.
4 2THE 1990 NAEP TRIAL STATE ASSESSMENT 37

North Dakota
Through the questionnaires administered to students, teachers, and principals, NAEP isable to provide a broad picture of educational practices prevalent in Amaican schools andclassrooms. In many instances, however, these findings contradict our perceptions of whatschool is like or educational researchers' suggestions about what strategies work bestto helpstudents learn.
For example, research has indicated new and more successful ways of teaching and learning,incorporating more hands-on activities and student-centered learning techniques; however,as described in Chapter 4, NAEP data indicate that classroom work is still dominated bytextbooks or worksheets. Also, it is widely recognized that home environment has anenormous impact on future academic achievement. Yet, as shown in Chapters 3 and 7,large proportions of students report having spent much more time each day watchingtelevixion than doing mathematics homework.
Part Two consists of five chapters. Chapter 3 discusses instructional content and itsrelationship to students' mathematics proficiency. Chapter 4 focuses on instructionalpractices -- how instruction is delivered. Chapter 5 is devoted to calculator use. Chapter6 provides information about teachers, and Chapter 7 examines students' home support forlearning.
4 3
38 THE 1990 NAEP TRIAL STATE ASSESSMENT

North Dakota
CHAPTER 3
What Are Students Taught in Mathematics?
In response to the continuing swell of information about the poor mathematicsachievement of American students, educators and poicymakers have recommendedwidespread reforms that are changing the direction of mathematics education. Recentreports have called for fundamental revisions in curriculum, a reexamination of trackingpractices, improved textbooks, better assessment, and an increase in the proportions ofstudents in high-school mathematics programs.' This chapter focuses on curricular andinstructional content issues in North Dakota public schools and their relationship to
students' proficiency.
Table 4 provides a profile of the eighth-grade public schools' policies and staffing. Some
of the salient results are as follows:
Less than half of the eighth-grade students in North Dakota (43 percent)were in public schools where mathematics was identified as a specialpriority. This compares to 63 percent for the nation.
3 Curtis McKnight, et al., The Underachieving Curriculum Assessing U.S. School Mathematics from anInternational Perspective, A National Report on the Second International Mathematics Study (Champaign,IL: Stipes Publishing Comp.,. , 1987).
Lynn Steen, Ed. Everybody Counts A Report to the Nation on the Future of Mathematics Education(Washington, DC: National Academy Press, 1989).
4 4THE 1990 NAEP TRIAL STATE ASSESSMENT 39

North Dakota
In North Dakota, 48 percent of the students could take an algebra coursein eighth grade for high school course placement or credit.
More than half of the students in North Dakota (65 percent) were taughtmathematics by teachers who teach only one subject.
About one-quarter (30 percent) of the students in North Dakota weretypically taught mathematics in a class that was grouped by mathematicsability. Ability grouping was more prevalent across the nation(63 percent).
TABLE 4 1 Mathematics Policies and Practices inNorth Dakota Eighth-Grade Public Schools
PERCENTAGE OF STUDENTS
1990 NAEP TRIAL STATE ASSESSMENT Ngsrdi DaicOa I Cerdrai Nation
Percentage of eighth-grade students in publicschools that Identified MathOrnatks asreceiving special emphasis in school-widegoals and objectives, Instruction, In-servicetraining, etc.
Percentage of eighth-grade public-school studentswho are offered a course in algebra forhigh school course placement or credit
Percentage of eighth-grade students in publicschools who are taught by teachers who teachonly mathematics
Percentage of eighth-grade students in publicschools who are assigned to a mathematicsclass by Risk ability in mathematics
Percentage of eighth-grade students in publicschools who receive four or more hours ofmathematics instruction per iveek
Percentage Peroantege Pimento.
43 ( 3.2) T2 (13.8) En ( 5.9)
4$ ( 2.0) 09 (18.4) 78 ( 42)
OS ( 2.9) 87 ( 7.8) 91 ( 3.3)
30 ( 2.0) 00 ( 5.7) 63 ( 4.0)
44 ( 2.3) 25 ( 8.8) 30 ( 4.4)
The standard errors of the estimated statistics appear in parentheses. It can be said with about 95 percentcertsbuy that, for each population of interest, the value for the entire population is within 2 standard errors
of the estimate for the sample.
5
40 THE 1990 NAEP TRIAL STATE ASSESSMENT

North Dakota
CURRICULUM COVERAGE
To place students' mathematics proficiency in a curriculum-related context, it is necessary
to examine the extent to which eighth graders in North Dakota are taking mathematicscourses. Based on their responses, shown in Table 5:
A greater percentage of students in North Dakota were taking eighth-grademathematics (73 percent) than were taking a course in pre-algebra oralgebra (25 percent). Across the nation, 62 percent were takingeighth-grade mathematics and 34 percent were taking a course inpre-atgebra or algebra.
Students in North Dakota who were enrolled in pre-algebra or algebracourses exhibited higher average mathematics proficiency than did thosewho were in eighth-grade mathematics courses. This result is notunexpected since it is assumed that students enrolled in pm-algebra andalgebra courses may be the more able students who have already masteredthe general eighth-grade mathematics curriculum.
TABLE 5 I Students' Reports on the Mathematics Classi They Are Taking
PERCENTAGE OF STUDENTS ANDAVERAGE MATHEMATICS PROFICIENCY
1990 NAEP TRIAL. STATE ASSESSMENT North Dakota Centre! Nation
What kind of mathematics class are youPercentage Percentage Percentage
and and andtaking this year? Proficiency Proficiency Proficiency
Eighth-grade mathematics 73 ( 2.0) 58 ( 4.8) 62 ( 2.1)
277 ( 1.4) 255 ( 3.1) 251 ( 1.4)
Pr...algebra 17 ( 1.9) 22 ( 4.3) 19 ( 1.9)
289 ( 2.4) 278 ( 3.1)1 272 ( 2.4)
Algobra 8 ( 1.0) 15 ( 2.8) 15 ( 1.2)307 ( 4.4) 289 ( 5.4) 296 ( 2.4)
The standard errors of the estimated statistics appear in parentheses. lt can be said with about 95 percentcertainty that, for each population of interest, the value for the entire population is within ± 2 standard errorsof the estimate for the sample. The percentages may not total 100 percent because a small number of studentsreported taking other mathematics courses. ¶ Interpret with caution the nature of the sample does not allowaccurate determination of the variability of this estimated mean proficiency.
4 6
THE 1990 1 s:AEP TRIAL STATE ASSESSMENT 41

North Dakota
Further, fivm Table AS in the Data Appendix:`
About the same percentage of females (26 percent) and males (24 percent)in North Dakota were enrolled in pre-algebra or algebra courses.
In North Dakota, 26 percent of White students, 10 percent of Hispanicstudents, and 20 percent of American Indian students west enrolled inpre-algebra or algebra courses.
Similarly, 21 percent of students attending schools in advantaged urbanareas, 24 percent in schools in extreme rural areas, and 27 percent inschools in areas classified as "other" were enrolled in pre-algebra or algebraCOMM.
MATHEMATICS HOMEWORK
To illuminate the relationship between homework and proficiency in mathematics, theassessed students and their teachers were asked to report the amount of time the studentsspent on mathematics homework each day. Tables 6 and 7 report the teachers' andstudents' responses, respectively.
According to their teachers, the greatest percentage of eighth-grade students in public
schools in North Dakota spent 30 minutes doing mathematics homework each day;according to the students, the greatest percentage spent either 15 or 30 minutes doingmathematics homework each day. Across the nation, according to their teachers, thelargest percentage of students spent either IS or 30 minutes doing mathematics homework
each day, while students reported spending either 15 or 30 minutes daily.
Further, as reported by their teachers (Table 6 and Table A6 in the Data Appendix):
In North Dakota, 1 percent of the students spent no time each day onmathematics homework, compared to 1 percent for the nation. Moreover,2 percent of the students in North Dakota and 4 percent of the studentsin the nation spent an hour or more on mathematics homework each day.
4 For every table in the body of the report that includes estimates of average proficiency, the Data Appendixprovides a corresponding table presenting the results for the four subpopulations race/ethnicity, type ofcommunity, parents* educauon level, and gender,
4 7
42 THE 1990 NAEP TRIAL STATE ASSESSMENT

North Dakota
The results by race/ethnicity show that 2 percent of White students,0 percent of Hispanic students, and 0 percent of American Indian studentsspent an hour or more on mathematics homework each day. Incomparison, I percent of White students, 0 percent of Hispanic students,and 0 percent of American Indian students spent no time doingmathematics homework.
In addition, 11 percent of students attending schools in advantaged urbanareas, 0 percent ixt schools in extreme rural areas, and 1 percent in schoolsin areas classified as "other" spent an hour or more on mathematicshomework daily. In comparison, 0 percent of students attending schoolsin advantaged urban areas, 3 percent in schools in extreme rural areas, and0 percent m schools in areas classified as "other" spent no time doingmathematics homework.
TABLE 6 Teachers' Reports on the Amount of TimeStudents Spent on Mathematics HomeworkEach Day
PERCENTAGE OF STUDENTS ANDAVERAGE MATHEMATICS PROFICIENCY
MO NAEP TRIAL STATE ASSESSMENT North Dakota Central Nation
Percentageand
Proficiency
1 ( 0.8)..**)
Percentageand
Proficiency
1 ( 0.8).44 ( ***
Percentagesnd
Proficiency
( 0.3)
About how much time do students spendon mathematics homework each day?
None
15 mimeos 37 ( 2.6) 34 ( 7.1) 43 ( 42)279 ( 2.2) 255 ( 4.7) 258 ( 2.3)
30 minutes 51 ( 3.7) 48 ( 9.6) 43 ( 4.3)283 ( 1.8) 272 ( 3.5) 286 ( 2.8)
43 minutes 10 ( 1.6) 13 ( 6.0) 10 ( 1.9)282 ( 3.7) 281 (12.5)I 272 ( 5.7)1
An hour or more 2 (*4*
0.3)*** )
6 ( 2,3)«.-*)
4 (278 (
0.9)5.1)1
The standard errors of the estimated statistics appear in parentheses. It can be said with about 95 percentcertainty that, for each population of interest, the value f r the entire population is within ± 2 standard errorsof the estimate for the sample. I. Interpret with caution the nature of the sample does not allow accuratedetermination of the variability of this estimated mean proficiency. *** Sample size is insufficient to permit areliable estimate (fewer than 62 students).
LIS
THE 1990 NAEP TRIAL STATE ASSESSMENT 43

Percentage Percentage Percentageand and and
Preiciamy Preddency Prat Wray
9 ( 0.6) 7 ( 1.4) 9 C 0.6)287 ( 2.8) «K. ( 44) 251 ( 2.5)
31 ( 1.4) 34 ( 4.8) 31 ( 2.0)284 ( 4.4) 269 ( 3.8) 264 ( 1.9)
33 ( 1.4) 32 ( 2.3) 32 ( 12)280 ( 1.5) 264 ( 3.6) 263 ( 1.9)
10 ( 1.1) 15 ( 1.2) 16 ( 1.0)27$ ( 2.3) 265 ( 4.0) 266 ( 1.9)
12 ( 0.7) 12 ( 3.4) 12 ( 1.1)279 ( 3.0) 262 ( 8.2)1 258 ( 3.1)
...............
North Dakota
TABLE 7 I Students' Reports on the Amount of Time Theyi Spent on Mathematics Homework Each Day
PERCENTAGE OF STUDENTS ANDAVERAGE MATHEMATICS PROFICIENCY
1090 MEP TRIAL STATE ASSESSMENT North Dakota Central Nation
About how much time do you usuallyspend each day on mathematicshomework?
None
16 minutes
30 mimdes
45 minutes
An how or more
The standard errors of the estimated statistics appear in parentheses. It can be said with about 95 percentcertainty that, for each population of interest, the value for the entire population is within ± 2 standard errorsof the estimate for the sample. ! Interpret with caution the nature of the sample does not allow accuratedetermination of the variability of this estimated mean proficiency. *** Sample size is insufficient to permit areliable estimate (fewer than 62 students).
And, according to the students (Table 7 and Table A7 in the Data Appendix):
In North Dakota, relatively few of the students (9 percent) reported thatthey spent no time each day on mathematics homework, compared to9 percent for the nation. Moreover, 12 percent of the students in NorthDakota and 12 percent of students in the nation spent an hour or moreeach day on mathematics homework.
The results by race/ethnicity show that 11 percent of White students,9 percent of Hispanic students, and 22 percent of American Indianstudents spent an hour or more on mathematics homework each day. Incomparison, 9 percent of White students, 9 percent of Hispanic students,and 6 percent of American Indian students spent no time doingmathematics homework.
44 THE 1990 NAEP TRIAL STATE ASSESSMENT

North Dakota
In addition, 13 percent of students attending schools in advantaged urbanareas, 12 percent in schools in extreme rural areas, and 10 percent inschools in areas classified as "other" spent an hour or more on mathematicshomework daily. In comparison, 7 percent of students attending schoolsin advantaged urban areas, 8 percent in schools in extreme rural areas, and10 percent in schools in areas classified as "other" spent no time doingmathematics homework.
INSTRUCTIONAL EMPHASIS
According to the approach of the National Council of Teachers of Mathematics (NCTM),students should be taught a broad range of mathematics topics, including number concepts,computation, estimation, functions, algebra, statistics, probability, geometry, andmeasurement.' Because the Trial State Assessment questions were designed to measurestudents' knowledge, skills, and understandings in these variouscontent areas -- regardlessof the type of mathematics class in which they were enrolled -- the teachers of the assessedstudents were asked a series of questions about the emphasis they planned to give specificmathematics topics during the school year. Their responses provide an indication of thestudents' opportunity to learn the various topics covered in the assessment.
For each of 10 topics, the teachers were asked whether they planned to place "heavy,""moderate," or "little or no" emphasis on the topic. Each of the topics corresponded toskills that were measured in one of the five mathematics contentareas included in the TrialState Assessment:
Numbers and Operations. Teachers were asked about emphasis placed onfive topics: whole number operations, common fractions, decimalfractions, ratio or proportion, and percent.
Measurement. Teachers were asked about emphasis placed on one ttpic:measurement.
Geometry. Teachers were asked about emphasis placed on one topic:geometry.
Data Analysis, Statistics, and Probability. Teachers were asked aboutemphasis placed on two topics: tables and graphs, and probability andstatistics.
Algebra and Functions. Teachers were asked about emphasis placed onone topic: algebra and functions,
National Council of Teachers of Mathematics, Curricuhon and Evaluation Standards for School Mathematics(Reston, VA: National Council of Teachers of Mathematics, 1989).
t
THE 1990 NAEP TRIAL ST/UT ASSESSMENT 45

North Dakota
The responses of the assessed students' teachers to the topic emphasis questions for eachcontent area were combined to create a new variable. For each question in a particular
content area, a value of 3 was given to "heavy emphasis" responses, 2 to "moderateemphasis" responses, and 1 to "little or no emphasis" responses. Each teacher's responseswere then averaged over all questions related to the particular content area.
Table 8 provides the results for the extreme categories -- "heavy emphasis" and "little or
no emphasis" -- and the average student proficiency in each content area. For the emphasis
questions about numbers and operations, for example, the proficiency reported is the
average student performance in the Numbers and Operations content area.
Students whose teachtrs placed heavy instructioral emphasis on Algebra and Functionshad higher proficiency in this content area than students whose teachers placed little or noemphasis on Algebra and Functions. Students whose teachers placed heavy instructional
emphasis on Numbers and Operations had lower proficiency in this content area than
students whose teachers placed little or no emphasis on Numbers and Operations.
46 THE 1990 NAEP TRIAL STATE ASSESSMENT

North Dakota
TABLE 8 I Teachers' Reports on the Emphasis Given toI Specific Mathematics Content Areas
PERCENTAGE OF STUDENTS ANDAVERAGE MATHEMATICS PROFICIENCY
1990 NAEP TRIAL STATE ASSESSMENT North Dakota Central Nation
Teacher "emphasis" categories byPerambee Panantage Parassiap
and andcontent areas PM Money Praticiany Praia Way
Numbers and Operations
Heavy emphasis 49 ( 1.2) 54 ( 1.2) 49 ( 3.11)283 ( 1.9) 264 ( 4.3) 260 ( 1.8)
Little or no emphasis 10 ( 0.8) 13 ( 4.5) 15 ( 2.1)295 ( 2.4) 285 ( 6.8)1 287 ( 3.4)
Measurement
Heavy emphasis 13 ( 29) 18 ( 5.7) 17 ( 3.0)277 ( 5.0)1 247 (125)1 250 ( 5.6)
Little or no emphasis 3$ ( 13) 42 ( 9.7) 33 ( 4.0)204 ( 3.1) 270 ( 7.7)1 272 ( 4.0)
Geometry
Heavy emphasis 23 ( 3.0) 26 ( 7.0) 28 ( 3.8)260 ( 1.8) 261 ( 7.9)1 260 ( 3.2)
Little or no emphasis 20 ( 1.8) 35 ( 7.2) 21 ( 3.3)279 ( 1.8) 261 ( 9.0)1 264 ( 5.4)
Data Analysis, Statistics. and Probability
Heavy emphasis 9 ( 2.6) 12 ( 2.5) 14 ( 2.2)286 ( 3.7)1 282 ( 75) 269 ( 4.3)
Little or no emphasis 74 ( 2.6) 57 ( 8.8) 53 ( 4.4)286 ( 1.4) 264 ( 5.6)1 261 ( 2.8)
Algebra and Functions
Heavy emphasis 56 ( 3,4) 50 ( 7.6) 46 ( 3.6)281 ( 1.2) 213 ( 3,6) 275 ( 2.5)
Little or no emphasis 9 ( 1.9) 19 ( 3.9) 20 ( 3.0)266 ( 4.6)1 242 ( 5.5)1 243 ( 3.0)
The standard errors of the estimated statistics appear in parentheses. It can be said with about 95 percentcertainty that, for each population of interest, the value for the entire population is within ± 2 standard errorsof the estimate for the sample. The percentages may not total 100 percent because the "Moderate emphasis"category is not included. ! Interpret with caution -- the nature of the sample does not allow accuratedetermination of the variability of this estimated mean proficiency.
THE 1990 NAB!' TRIAL STATE ASSESSMENT 47

North Dakota
SUMMARY
Although many types of mathematics learning can take place outside of the schoolenvironment, there are some topic areas that students are unlikely to study unless they arecovered in school. Thus, what students are taught in school becomes an important
determinant of their achievement.
The information on curriculum coverage, mathematics homework, and instructional
emphasis has revealed the following:
Less than half of the eighth-grade students in North Dakota (43 percent)were in public schools where mathematics was identified as a specialpriority. This compares to 63 percent for the nation.
In North Dakota, 48 t of the students could take an algebra coursein eighth grade for hi -school course placement or credit.
A greater percentage of students in North Dakota were taking eighth-grademathematics (73 percent) than were taking a course in pre-algebra oralgebra (25 percent). Across the nation, 62 percent were takingeighth-grade mathematics and 34 percent were taking a course inpre-algebra or algebra.
According to their teachers, the greatest percentage of eighth-grade studentsin public schools in North Dakota spent 30 minutes doing mathematicshomework each day, according to the students, most of them spent either15 or 30 minutes doing mathematics homework each day. Across thenation, teachers reported that the largest percentage of students spent either15 or 30 minutes doing mathematics homework each day, while studentsreported either 15 or 30 minutes daily.
In North Dakota, relatively few of the students (9 percent) reported thatthey spent no time each day on mathematics homework, compared to9 percent for the nation. Moreover, 12 percent of the students in NorthDakota and 12 percent of students in the nation spent an hour or moreeach day on mathematics homework.
Students whose teachers placed heavy instructional emphasis on Algebraand Functions had higher proficiency in this content area than studentswhose teachers placed little or no emphasis on Algebra and Functions.Students whose teachers placed heavy instructional emphasis on Numbersand Operations had lower proficiency in this content area than studentswhose teachers placed little or no emphasis on Numbers and Operations.
48 THE 1990 NA EP TRIAL STATE ASSESSMENT

North Dakota
CHAPTER 4
riX042:-4ORM BR BlUR INmumansalsorassss sr emir is111101111111111.111,1.1111111111111110111411111112111111111111111111111111811111 .,110111.11111.11'4711111111111111'011111111
-11111111,1rAmaiisimeamssAll aesess
How Is Mathematics Instruction Delivered?
Teachers facilitate learning through a variety of instructional practices. Because a particularteaching method may not be equally effective with all types of students, selecting andtailoring methods for students with different styles of learning or for those who come fromdifferent cultural backgrounds is an important aspect of teaching.'
An inspection of the availability and use of resources for mathematics education canprovide insight into how and what students are learning in mathematics. To provideinformation about how instruction is delivered, students and teachers participating in theTrial State Assessment were asked to report on the use of various teaching and learningactivities in their mathematics classrooms.
AVAILABILITY OF RESOURCES
Teachers' use of resources is obviously constrained by the availability of those resources.Thus, the assessed students' teachers were asked to what extent they were able to obtainall of the instructional materials and other resources they needed.
6 National Council of Teachers of Mathematics. Professional Standards /or the Teaching of Mathematics(Reston, VA: National Council of Teachers of Mathematics, 1991).
tPfTHE 1990 NAEP TRIAL STATE ASSESSMENT 49

North Dakota
From Table 9 and Table A9 in the Data Appendix:
In North Dakota, 18 percent of the eighth-grade students had mathematicsteachers who reported getting all of the resources they needed, while
35 percent of the students were taught by teachers who got only some or
norm of the resources they needed. Across the nation, these figures were13 percent and 31 percent, respectively.
In North Dakota, 23 percent of students attending schools in advantagedurban areas, 20 percent in schools in extreme rural areas, and 17 percentin schools in areas classified as "other" had mathematics teachers who got
all the resources they needed.
By comparison, in North Dakota, 40 percent of students attending schoolsin advantaged urban arms, 37 percent in schools in extreme rrral areas,
and 31 percent in schools in areas classified as "othes" were in classroomswhere only some or no resources weir available.
Students whose teachers got all the resources they needed had mathematicsachievement levels similar to those whose teachers got only some or noneof the resources they needed.
TABLE 9 I Teachers' Reports on the Availability ofI Resources
PERCENTAGE OF STUDENTS ANDAVERAGE MATHEMATICS PROFICIENCY
19110 NAEP TRIAL STATE ASSESSMENT North Dakota Central Nation
Which of the following statements is trueabout how well supple° you are by yourschool system with the instructional
Percentage Percentage Percentageand and and
materials and other resources you needto teach your class?
Pro Money Proficiency Proficiency
get all the resources I need. 18 ( 2.7) 8 ( 2.4) 13 ( 2.4)279 ( 3.2) ,.... ( 4411 285 ( 4.2)
I get most of the resources I need, 48 ( 2.9) 45 ( 7.8) 56 ( 4.0)282 ( 1.7) 271 ( 2.2)1 265 ( 2.0)
I get some or none of the resources I need. 35 ( 3.4) 47 ( 7.3) 31 ( 4.2)282 ( 1.8) 269 ( 3.5) 281 ( 2.0)
The standard errors of the estimated statistics appear in parentheses. It can be said with about 95 percentcertainty that, for each population of interest, the value for the entire population is within ± 2 standard errorsoi the estimate for the sample. ! Interpret with caution the nature of the sample does not allow accuratedetermination of the variability of this estimated mean proficiency. *** Sample size is insufricient to permit areliable estimate (fewer than 62 students).
rt)
50 THE 1990 NAEP TRIAL STATE ASSESSMENT

North Dakota
PATTERNS IN CLASSROOM INSTRUCTION
Research in education and cognitive psychology has yielded many insights into th c. types
of instructional activities that facilitate students' mathematics learning. Increasing the useof "hands-on" examples with concrete materials and placing problems in real-worldcontexts to help children construct useful meanings for mathematical concepts are amongthe recommended approaches.' Students' responses to a series of questions on theirmathematics instruction provide an indication of the extent to which teachers are makinguse of the types of student-centered activities suggested by researchers. Table 10 presentsdata on patterns of classroom practice and Table 11 provides information on materials used
for classroom instruction by the mathematics teachers of the assessed students.
According to their teachers:
Less than half of the students in North Dakota (38 percent) workedmathematics problems in small groups at least once a 'week; some neverworked mathematics problems in small groups (18 percent).
The largest percentage of the students (74 percent) used objects like rulers,counting blocks, or geometric shapes less than once a week; relatively fewnever used such objects (5 percent).
In North Dakota, 79 percent of the students were assigned problems froma mathematics textbook almost every day; 5 percent worked textbookproblems about once a week or less.
Less than half of the students (37 percent) did problems from worksheetsat least several times a week; about one-quarter did worksheet problemsless than weekly (29 percent).
7 Thomas Romberg, "A Common Curriculum for Mathematics," Individual Differences and the CommonCurrkulum: Eighty-second Yearbook of the National Society for the Study of Education (Chicago, IL:University of Chicago Press, 1983).
5 6THE 1990 NAEP TRIAL STATE ASSESSMENT 51

North Dakota
TABLE 10 I Teachers' Reports on Patterns of Mathematics1 Instruction
PERCENTAGE OF STUDENTS ANDAVERAGE MATHEMATICS PROFICIENCY
111150 NAEP TRIAL STATE ASSESSMENT North Dakota Centel Won
About flow often do students workproblems In smelt groups?
Al least once a week
Lm than once a week
Never
About how often do students use objectslike rulers, counting blocks, or geometricsolids?
At least once a week
Lass than one* a week
Never
Pmentage Parvartaga Paroanalsand and and
Pratidancy flesildencv .111181antY
38 ( 3.3) 50 ( 7.8) 50 ( 4.4)291 ( 2.5) 25$ ( 4.1) NO ( 2.2)
43 ( 3.7) 43 ( 5.6) 43 ( 4.1)254 ( 1.5) NB ( 4.0)1 264 ( 2.3)
1$ ( 2.1) 7 ( 4.3) 8 ( 2.0)279 ( 2.5) 14,4. ( *mil 277 ( 5.4)1
Percentage Percentage Percentageand and and
Proficiency Proficiency Proficiency
21 ( 2.7)279 ( 1.3)
15 ( 5.1)255 ( 4.9)1
22 ( 3.7)254 ( 3.2)
74 (281 (
5 (
2.9)1.5)
0.9)..**)
811264 (
4 ((
8.0)3.3)
2.3)
69 (263 (
9 (282 (
3.9)1.9)
2.8)5.9)1
The standard errors of the estimated statistics appear in parentheses. It can be said with about 95 percentcertainty that, for each population of interest, the value for the entire population is within ± 2 standard errorsof the estimate for the sample. 1 Interpret with caution -- the nature of the sample does not allow accuratedetermination of the variability of this estimated mean proficiency. *** Sample size is insufficient to permit areliable estimate (fewer than 62 students),
5 7
52 THE 1990 NAEP TRIAL STATE ASSESSMENT

North Dakota
TABLE 11 I Teachers' Reports on Materials forI Mathematics Instruction
PERCENTAGE OF STUDENTS ANDAVERAGE MATHEMATICS PROFICIENCY
1,00 NAEP TRIAL STATE ASSESSMENT North Dakota Central Nation
About how often do students dO problemsfrom textbooks?
Parcanta.and
Pislidenly
Percentageand
MadamPercentage
andProficiency
Almost every day 79 ( 3.3) 02 ( 5.13) 82 ( 3.4)282 ( 1.1) 2010 ( 32) 267 ( 1.8)
Several times a week 10 ( 3.4) 32 ( 42) 31 ( 3.1)200 ( 5.0)1 252 ( 5.3) 254 ( 2.9)
About once a week or less 5 ( 0.3) 0 ( 2.7) 7 ( 1.8)ORM ( OM) 200 ( 5.1)
About how often do stuaents do problems Percentage Percentageon worksheets? and and and
Proficiency Proddency Proldency
At least several times a week 37 ( 2.5)21e ( 2.1)
38 ( 8.3)252 ( 5.5)1
34 ( 3.8)258 ( 2.3)
About once a week 34 ( 3.3) 23 ( 43) 33 ( 3.4)281 ( 1.0) 201 ( 8.1) 200 ( 2.3)
Less than moldy 29 ( 2.7) 39 ( 7.0) 32 ( 3.0)280 ( 2.3) 270 ( 4.1) 274 ( 2.7)
The standard errors of the estimated statistics appear in parentheses. It can be said with about 95 percentcertainty that, for each population of interest, the value for the entire population is within ± 2 standard errorsof the estimate for the sample. Interpret with caution the nature of the sample does not allow accuratedetermination of the variability of thir estimated mean proficiency. *** Sample size is insufficient to permit areliable estimate (fewer than 62 students).
The next section presents the students responses to a corresponding set of questions, aswell as the relationship of their responses to their mathematics proficiency. It also
compares the responses of the students to those of their teachers.
THE 1990 NAEP TRIAL STATE ASSESSMENT 53

North Dakota
COLLABORATING IN SMALL GROUPS
In North Dakota, 50 percent of the students reported never working mathematicsproblems in small groups (see Table 12); 19 percent of the students worked mathematicsproblems in small groups at least once a week.
TABLE 12 I Students' Reports on the Frequency of SmallGroup Work
PERCENTAGE OF STUDENTS ANDAVERAGE MATHEMATICS PROFICIENCY
1990 NAEP TRIAL STATE ASSESSMENT north Dakota Central Ration
Patents.and
ProficiancY
Percentageand
Proficiency
Percentageand
ProficiencyHow often do you work in small groupsin your mathematics class?
At least once a week 19 ( 1.6) 23 ( 4.6) 28 ( 2.5)282 ( 1.7) 266 ( 6,S) 254 ( 2.7)
Less than once a week 31 ( 1.2) 32 ( 3.3) 28 ( 1.4)283 ( 1.8) 2811 ( 3.0) 267 ( 2.0)
Never 50 ( 2.0) 45 ( 6.3) 44 ( 2.9)250 ( 1.5) 264 ( 3.4) 261 ( 1.6)
The standard errors of the estimated statistics appear in parentheses. It can be said with about 95 percentcertainty that, for each population of interest, the value for the entire population is within ± 2 standard errorsof the estimate for the sample.
Examining the subripulations (Table A 12 in the Data Appendix):
In North Dakota, 10 percent of students attending schools in advantagedurban areas, 16 percent in schools in extreme rural areas, and 22 percentin schools in areas classified as "other" worked in small groups at least oncea week.
Further, 19 percent of White students, 27 percent of Hispanic students,and 24 percent of American Indian students worked mathematics problemsin small goups at least once a week.
Females were as likely as males to work mathematics problems in smallgroups at least once a week (18 percent and 20 percent, respectively).
54 THE 1990 NAEP TRIAL STATE ASSESSMENT

North Dakota
USING MATHEMATICAL OFJECTS
Students wexe asked to report on the frequency with which they used mathematical objectssuch as rulers, counting blocks, or geometric solids. Table 13 below and Table A13 in theData Appendix summarize these data;
About one-quarter of the students in Nvrth Dakota (30 percent) neverused mathematical objects; 24 percent used these objects at least once aweek.
Mathematical objects were used at least once a week by 16 percent ofstudents ;Mending schools in advantaged urban areas, 25 percent in schoolsin extreme rural areas, and 25 pexcent in schools in areas classified as"other".
Males were more likely than females to use mathematical objects in theirmathematics classes at least once a week (29 percent and 19 percent,respectively).
In addition, 24 percent of White students, 34 percent of Hispanic students,and 28 percent of American Indian students used mathematical objects atleast once a week.
TABLE 13 I Students' Reports on the Use of MathematicsI Objects
PERCENTAGE OF STUDENTS ANDAVERAGE MATH DAMS PROFICIENCY
1990 NAP TRIAL STATE ASSESSMENT North Dakota Nation
How often do you work with objects likerulers, counting blocks, or geometricsolids in your mathemaVcs class?
At least once a week
Less than once a mek
Percentage Percentageand and
Prelidency Prolidency
24 ( 1.4) 23 ( 2.9)278 ( 1.7) 280 ( 3.5)
Percentagemid
Proldency
28 ( 1.8)258 ( 2.8)
45 ( 1.5) 38 ( 2.5) 31 ( 12)284 ( 1.8) 272 ( 2.9) 289 ( 1.5)
30 ( 1.4) ei ( 4.0) 41 ( 2.2)280 ( 1.9) 282 ( 2.8) 259 ( 1.8)
The standard errors of the estimated statistics appear in parentheses. It can be said with about 95 percentcertainty that, for each population of interest, the value for the entire population is within ± 2 standard errorsof the estimate for the sample.
GOTHE 1990 NAEP TRIAL STATE ASSESSMENT 55

North Dakota
MATERIALS FOR MA THEMATICS INSTRUCTION
The percentages of eighth-grade public-school students in North Dakota who frequestlyworked mathematics problems from textbooks (Table 14) or worksheets (Table 15)indicate that these materials play a major role in mathematics teaching and learning.
Regarding the frequency of textbook usage (Table 14 and Table M4 in the DataAppendix):
Many of the students in North Dakota (80 percent) worked mathematicsproblems from textbooks almost every day, compared to 74 percent of thestudents in the nation.
Textbooks were used almost eves), day by 79 percent of students attendingschools in advantaged urban areas, 84 percent in schools in extreme ruralareas, and 76 percent in schools in areas classified as "other".
TABLE 14 I Students' Reports on the Frequency ofMathematics Textbook Use
PERCENTAGE OF STUDENTS ANDAVERAGE MATHEMATICS PROFICIENCY
1080 NAEP TRIAL STATE ASSESSMENT North Dakota
How often do you do mathematicsproblems from textbooks In your
Percentage Percentage Percontap
mathematics class?and
Proficiencyand
Proadencyand
Proficiency
Almost every day 80 ( 1.2) 74 ( 4.7) 74 ( 1.9)284 ( 1.1) 271 ( 22) 267 ( 1.2)
Several times a week 11 ( 0.9) 15 ( 1.8) 14 ( OA)268 ( 3.7) 2.50 ( 4.2) 252 ( 1.7)
About once a week or less 9 ( 0.8) 11 ( 4.3) 12 ( 1.8)275 ( 2.5) 250 ( 4.7)1 242 ( 4.5)
The standard errors of the estimated statistics appear in parentheses. It can be said with about 95 percentcertainty that, for each population of interest, the value for the entire population is within ± 2 standard errorsof the estimate for the sample. ! Interpret with caution the nature of the sample does not allow accuratedetermination of the variability of this estimated mean proficiency.
Cl
56 THE 19 $,J NAEP TRIAL STATE ASSESSMENT

North Dakota
And, for the frequency of worksheet usage (Table 15 and Table Al 5 in the DataAppendix):
Less than half of the students in North Dakota (36 percent) usedworksheets at least several times a week, compared to 38 percent in thenation.
Worksheets were used at least several times a week by 25 percent ofstudents attending schools in advantaged urban areas, 38 percent in schoolsin extreme rural areas, and 37 percent in schools in areas classified as"other".
TABLE I S I Students' Reports on the Frequency ofMathematics Worksheet Use
PERCENTAGE OF STUDENTS ANDAVERAGE MATHEMATICS PROFICIENCY
IMO NAEP TRIAL STATE ASSESSMENT Noels Dakota Central Nation
How often do you do mathematicsproblems on worksheets in your
vor.
Parcentage Percentage Porcantagemathematics class? and
ProNciencyand
Proficiencyand
ProficiencY
AI least several Untes a tweet 36 ( 1.0) 36 ( 80) 38 ( 2.4)278 ( 2.0) 257 ( 4.9) 253 ( 22)
About once a week 24 ( 1.8) 23 ( 2.3) 25 ( 12)280 ( 1.8) 264 ( 2.6) 281 ( 1.4)
Less than woo* 40 ( 2.4) 40 ( 5.6) 37 ( 2.5)284 ( 1.5) 273 , 4.0) 272 ( 1.9)
The standard errors of the estimated statistics appear in parentheses. It can be said with about 94 percentcertainty that, for each population of interest, the value for the entire population is within ± 2 standaisi errorsof the estimate for the sample.
Table 16 compares students' and teachers' responses to questions about the patterns ofclassroom instruction and materials for mathematics instruction.
62THE 1990 NAEP TRIAL STATE ASSESSMENT 57

North Dakota
TABLE 16 Comparison of Students' aad Teachers' Reportson Patterns of and Materials for MathematicsInstruction
PERCENTAGE OF STUDENTS
-
11190 'MEP TRIAL STATEASSESSMENT
-
North Dakota Centra l
1
Nation
Patterns of classroomInstruction
Percentage of students atmwork mathematics problems k?small Imps
At least once a weekLess than once a weekNever
Percentage of students Whouse objects OM Men, countingblocks, or geometric solids
At least once a weekLees than once a weekNever
1
Materials for mathematicsinstruction
i
Percentage of students Mause a mathematics textbook
Almost every daySeveral times a weekAbout once a week or less
Percentage of students whowe a mathematics wolitshset
At least several tunes a weekAbout once a weekLess than weekly 411.
The standard errors or the estimated 1-....tistics appear in parentheses. It can bc said with about 95 percentcertainty that, for each population of interest, the value for the entire population is within ± 2 standard errorsof the estimate for the sample.
Peremenee Pereertago Iteneente.Siletents Toad** Sludents Umbers Students Towhees
19 ( 1.0) 38 ( 3.3) 23 ( 42) 50 ( 72) 28 ( 2.5) 50 ( 4.4)31 ( 12) 43 ( 3.7) 32 ( 3.3) 43 ( 8.8) 28 ( 1.4) 43 ( 4.1)60 ( 2.0) 18 ( 2.1) 45 ( 0.3) 7 ( 4.3) 44 ( 2.9) 0 ( 2.0)
24 ( 1.4) 21 ( 2.7) 23 ( 2.9) 15 ( 5.1) 28 ( 1.8) 22 ( 3.7)45 ( 1.5) 74 ( 2.9) 3$ ( 2.5) 81 ( 6.0) 31 ( 1.2) 09 ( 3.9)30 ( t.4) 5 ( 0.9) 41 ( 4.8) 4 ( 2.3) 41 ( 2.2) 9 ( 22)
Percentage Percentage PercentageStudents Teachers Students Teachers Students Teachers
80 ( 1.2) 7 ( 3.3) 74 ( 4.7) 02 ( 5.6) 74 ( 1.9) 62 ( 3.4)11 ( 0.0) 16 ( 3.4) 15 ( 1.6) 32 ( 4.2) 14 ( 0.8) 31 ( 3.1)9 ( 0.8) 5 ( 0.3) 1.1 ( 4.3) 6 ( 2.7) 12 ( 12) 7 ( 1.8)
36 ( 1.9) 37 ( 2.5) 36 ( 6.0) 38 ( 8.3) 36 ( 2.4) 34 ( 3.8)24 ( 1.8) 34 ( 3.3) 23 ( 2.3) 23 ( 4.8) 25 ( 1.2) 33 ( 3.4)404 2.4) 29 ( 2.71 40 ( 5.6) 39 ( 7.0) 37 ( 24) 32 (
58 THE 1990 NAEP TRIAL STATE ASSESSMENT

North Dakota
SUMMARY
Because classroom instructional time is typically limited, teachers need to make the bestpossible use of what is known about effective instructional delivery practices and resources.
^noears that mathematics textbooks and worksheets continue to play a major role inmathematics teaching. Although there is some evidence that other instructional resourcesand practices are emerging, they are not yet commonplace.
According to the students' mathematics teachers:
Less than half of the students in North Dakota (38 percent) workedmathematics problems in small groups at least once a week; some neverworked in small groups (18 percent).
The largest percentage of the students (74 percent) used objects like rulers,counting blocks, or geometric shapes less than once a week, and relativelyfew never used such objects (5 percent).
In North Dakota, 79 percent of the students were assigned problems froma mathematics textbook almost every day; 5 percent worked textbookproblems about once a week or less.
Less than half of the students (37 percent) did problems from worksheetsat least several times a week; about one-quarter did worksheet problemsless than weekly (29 percent).
And, according to the students:
In North Dakota, 50 percent of the students never worked mathematicsproblems in small groups; 19 percent of the students worked mathematicsproblems in small groups at least once a week.
About one-quarter of the students in North Dakota (30 perrent) neverused mathematical objects; 24 percent used these objects at least once aweek.
Many of the students in North Dakota (80 percent) worked mathematicsproblems from textbooks almost every day, compared to 74 percent ofstudents in the nation.
Less than half of the students in North Dakota (36 percent) usedworksheets at least several times a week, compared to 38 percent in thenation.
THE 1990 NAEP TRIAL STATE ASSESSMENT 59

North Dakota
CHAPTER 5
How Are Calculators Used?
Although computation skills are vital, calculators -- and, to a lesser extent, computers --
have drastically changed the methods that can be used to perform calculations. Calculators
are important tools for mathematics and students need to be able to we them wisely. The
National Council of Teachers of Mathematics and many other educators believe thatmathematics teachers should help students become proficient in the use of calculators tofree them from time-consuming computations and to permit them to focus on morechallenging tasks.' The increasing availability of affordable calculators should make it
more likely and attractive for students and schools to acquire and use these devices.
Given the prevalence and potential importance of calculators, part of the Trial State
Assessment focused on attitudes toward and uses of calculators. Teachers were asked toreport the extent to which they encouraged or permitted calculator use for various activities
in mathematics class and students were asked about the availability and use of calculators.
National Assessment of Educational Progress, Mathematics Objectives. 1990 Assessment (Princeton, NJ:Educational Testing Service, 1988).
National Council of Teachers of Mathematics, Curriculum and Evaluation Standards for School Mathematics(Reston, VA: National Council of Teachers of Mathematics, 1989).
lid
60 THE 1990 NAEP TRIAL STATE ASSESSMENT

North Dakota
Table 17 provides a profile of North Dakota eighth-grade public schools' policies withregard to calculator use:
In comparison to 33 percent across the nation, 39 percent of the studentsin North Dakota had teachers who allowed calculators to be used for tests.
About the same percentage of students in North Dakota and in the nationhad teachers who permitted unrestricted use of calculators (24 percent and18 percent, respectively).
TABLE 17 I Teachers' Reports of North Dakota Policies onCalculator Use
PERCENTAGE OF STUDENTS_
1000 MEP TRIAL STATE ASSESSMENT North Dakota Control Nation
Percentage of eighth-grade students in publicschools whose teachers permit the unrestricteduse of calculators
Percentage of eighth-grade students in publicschools whose teachers permit the use ofcalculators for tests
Percentage of eighth-grade students in publicschools whose teachers report that studentshave access to calculators owned by the school
Peratittop Percentage Percentile
24 ( 3.3) 27 ( 8.1) 16 ( 3.4)
39 ( 3.4) 44 ( 7.9) 33 ( 4.5)
37 ( 2.6) SS ( 6.2) 56 ( 4.6)
The standard errors of the estimated statistics appear in parentheses. It can be said with about 95 percentcertainty that, for each population of interest, the value for the entire population is within ± 2 standard errorsof the estimate for the sample.
THZ 1990 NAV' TRIAL STATE ASSESSMENT 61

North Dakota
THE AVAILABILITY OF CALCULATORS
In North Dakota, most students or their families (100 percent) owned calculators (Table18); however, fewer students (49 percent) had teachers who explained the use of calculatorsto them. From Table Al8 in the Data Appendix:
In North Dakota, 48 percent of White students, 64 percent of Hispanicstudents, and 61 percent of American Indian students had teachers whoexplained how to use them.
Females were as likely as males to have the use of calculators explained tothem (47 percent and 50 percent, respectively).
TABLE 18 Students' Reports on Whether They Own aCalculator and Whether Their Teacher ExplainsHow To Use One
PERCENTAGE OF STUDENTS ANDAVERAGE MATHEMATICS PROFICIENCY
1900 NAEP TRIAL STATE ASSESSMENT North Dakota Central Nation
=O1M-
Do you or your family own a calculator?
Yes
Does your mathematics teacher explainhow to use a calculator for mathematicsproblems?
Yes
ercentage Percontaga Percentageand and and
Proficiency Proficiency Profidency
96 1 0.6)266 ( 2.5)
2 ( 0.6)
97 ( 0.4)263 ( 1.3)
3 ( 0.4)234 ( 3.8)
Percontage Pertentage Percontageand and and
Proficiency Proficiency Proficiency
49 ( 1.7)279 ( 1.7)
51 ( 1.7)284 ( 1.3)
56 ( 4.9) 49 ( 2.3)263 ( 3.0) 258 ( 1.7)
44 ( 4.9) 51 ( 2.3)269 ( 3.4) 266 ( 1.5)
The standard errors of the estimated statistics appear in parentheses. It can tic said with about 95 percentcertainty that, for each population of interest, the value for the entire population is within -r 2 standard errorsof the esumate for the sample. ** Sample size is insufficient to permit a reliable estimate (fewer than 62students).
G7
62 THE 1990 NAEP TRIAL STATE ASSESSMENT

North Dakota
THE USE OF CALCULATORS
As previously noted, calculators can free students from tedious computations and allowthem to concentrate instead on problem solving and other important skills and content.As part of the Trial State Assessment, stty' 'ts were asked how frequently (never,sometimes, almost always) they used cak.t. _ors for working problems in class, doingproblems at home, and taking quizzes or tests. As reported in Table 19:
In North Dakota, 23 percent of the students never used a calculator towork problems in class, while 46 percent almost always did.
Some of the students (12 percent) never used a calculator to workproblems at home, compared to 31 percent who almost always used one.
Less than half of the students (34 percent) never used a calculator to takequizzes or tests, while 23 percent almost always did.
TABLE 19 I Students' Reports on the Use of a Calculatorfor Problem Solving or Tests
PERCENTAGE OF STUDENTS ANDAVERAGE MATHEMATICS PROFICIENCY
IWO NAEP TRIAL STATE ASSESSMENT North Dakota Central Nation
Percentageand
Proficiency
Pamentageand
Naticiancy
Percentageand
Proficiency
How often do you use a calculator for thefollowing tasks?
Working problems Hi dass
Almost always 48 ( 1.6) 51 ( 3.8) 48 ( 1.5)277 ( 13) 260 ( 2.8) 254 ( 1.5)
Never 23 ( 1.6) 18 ( 3.6) 23 ( 1.9)288 ( 1.4) 270 ( 4.1)! 272 ( 1.4)
Doing problems at home
Almost always 31 ( 1.4) 35 ( 2.2) 30 ( 1.3)261 ( 1.5) 266 ( 2.8) 261 ( 1.8)
Never 12 ( 0.9) 16 ( 2.1) 191 0.9)282 ( 1.9) 263 ( 3.3) 263 ( 1.8)
Taking quizzes or tests
Almost always 23 ( 1.2) 29 ( 4.5) 27 ( 1.4)277 ( 1.9) 280 ( 4.0) 253 ( 2.4)
Never 34 ( 1.7) 22 ( 4.8) 30 ( 2.0)269 ( 1.2) 271 ( 3.4)i 274 ( 1.3)
The standard errors of the estimated statistics appear in parentheses. It can be said with about 95 percentcertainty that, for each population of interest, the value for the entire population is within .1. 2 standard errorsof the estimate for the sample. The percentages may not total 100 percent because the "Sometimes" categoryis not included. ! Interpret with caution -- the nature of the sample does not allow accurate determination ofthe variability of this estimated mean proficiency.
THE 1990 NAEP TRIAL STATE ASSESSMENT 63

North Dakota
WHEN TO USE A CALCULATOR
Part of the Trial State Assessment was designed to investigate w.iether students know when
the use of a calculator is helpful and when it is not. There were seven sections of
mathematics questions in the assessment; however, each student took only three of those
sections. For two of the seven sections, students were given calculators to use. The test
administrator provided the students with instructions and practice on how to use a
calculator prior to the assessment. During the assessment, students were allowed to choose
whether or not to use a calculator for each item in the calculator sections, and they were
asked to indicate in their test booklets whether they did or did not use a calculator for each
item.
Certain items ii the calculator sections were defined as "calculator-active" items -- that is,
items that required the student to use the calculator to determine the comet response.
Certain other items were defined as "calculator-inactive" items -- items whose solution
neither required nor suggested the use of a calculator. The remainder of the items were
"calculator-neutral" items, for which the solution to the question did not require the use
of a calculator.
In total, there were eight calculator-active items, 13 calculator-neutral items, and 17
calculator-inactive items across the two sections. However, because of the sampling
methodology used as part of the Trial State Assessment, not every student took both
sections. Some took both sections, some took only one section, and some took neither.
To examine the characteristics of students who generally knew when the use of the
calculator was helpful and those who did not, the students who responded to one or both
of the calculator sections were categorized into two groups:
High -- students who used the calculator appropriately (i.e., used it for thecalculator-active items and did not use it for the calculator-inactive items)at least 85 percent of the time and indicated that they had used thecalculator for at least half of the calculator-active items they were presented.
Other -- students who did not use the calculator appropriately at least 85percent of the time or indicated that they had used the calculator for less
than half of the calculator-active items thv were presented.
64THE 1990 NAEP TRIAL STATE ASSESSMENT

North Dakota
The data presented in Table 20 and Table A20 in the Data Appendix are highlighted below:
A greater percentage of students in North Dakota weir in the High groupthan were in the Other group.
About the same percentage of males and females were in the High group.
In addition, 57 percent of White students, 54 percent of Hispanic students,and 32 percent of American Indian students were in the High goup.
TABLE 20 I Students' Knowledge of Using Calculators
PERCENTAGE OF STUDENTS ANDAVERAGE MATHEMATICS PROFICIENCY
1900 NAEP TRIAL STATE ASSESSMENT North Dakota emirs, Nation
,"CaInulator-use" groupIL
High
Other
Percentageand
Pro &dewy
Percentage Percentageand and
Proficiency Prolkiency
58 ( 1.5) 48 ( 1.8) 42 ( 1.3)286 ( 1.6) 272 ( 3.4) 272 ( 1.8)
44 ( 14) 54 ( 1.8) 56 ( 1.3)275 ( 1.8) 280 ( 2.7) 255 ( 1.5)
The standard errors of the estimated statistics appear in parentheses. It can be said with about 95 percentcertainty that, for each population of interest, the value for the entire population is within ± 2 standard errorsof the estimate for the sample.
70THE 1990 NAEP TRIAL STATE ASSESSMENT 65

North Dakota
SUMMARY
Given the prevalence of inexpensive calculators, it may no longer be necessary or useful to
devote large portions of instructional time to teaching students how to perform routinecalculations by hand. Using calculators to replace this time-consuming process would
create more instructional time for other mathematical skill topics, such as problem solving,
to be tmphasized.
The data related to calculators and their use show that:
In comparison to 33 percent across the nation, 39 percent of the studentsin North Dakota had teachers who allowed calculators to be used for tests.
About the same percentage of students in North Dakota and in the nationhad teachers who permitted unrestricted use of calculators (24 percent and18 percent, respectively).
In North Dakota, most students or their families (100 percent) ownedcalculators; however, fewer students (49 percent) had teachers whoexplained the use of calculators to them.
In North Dakota, 23 percent of the students never used a calculator towork problems in class, while 46 percent almost always did.
Some of the students (12 percent) never used a calculator to workproblems at home, compared to 31 percent who almost always used one.
Less than half of the students (34 percent) never used a calculator to takequizzes or tests, while 23 percent almost always did.
71
66 THE 1990 NAEP TRIAL STATE MSESSM ENT

North Dakota
CHAPTER 6
Who Is Teaching Eighth-Grade Mathematics?
In recent years, accountability for educational outcomes has become an issue of increasingimportance to federal, state, and local governments. As part of their effort to improve theeducational process, policymakers have reexamined existing methods of educating andcertifying teachers.° Many states have begun to raise teacher certification standards andstrengthen teacher training programs. As shown in Table 21:
In North Dakota, 19 percent of the students were being taTIght bymathematics teachers who reported having at least a master's or educationspecialist's degree. This compares to 44 percent for students across thenation.
More than half of the students (69 percent) had mathematics teachers whohad the highest level of teaching certification available. This is similar tothe figure for the nation, where 66 percent of the students were taught bymathematics teachers who were certified at the highest level available intheir states.
Almost all of the students (91 percent) had mathematics teachers who hada mathematics (middle school or secondary) teaching certificate. Thiscompares to 84 percent for the nation.
9 National Council of Teachers of Mathematics, Professional Standards for the Teaching of Mathematics(Reston, VA: National Council of Teachers of Mathematics, 1991).
7 2THE 1990 NAEP TRIAL STATE ASSESSMENT 67

North Dakota
TABLE 21 I Profile of Eighth-Grade Public-SchoolMathematics Teachers
PERCENTAGE OF STUDENTS
10110 NAEP TRIAL STATE ASSESSMENT North Dakota Central Nation
Percentage of students whose mathematics teachersreported having the following degrees
Percentage Percentage Percentage
Bachelor's degree 81 ( 1.9) 48 ( 9.1) 56 ( 4.2)Master's or specialist's degree 19 ( 1.9) 48 ( 8.8) 42 ( 4.2)Doctorate or professional degree 0 ( 0.0) 4 ( 2.7) 2 ( 1.4)
Percentage of students whose mathematics teachers havethe Mowing types of teaching certificates that arerecognized by North Dakota
No regular certification ( 0.2) 4 ( 2.7) 4 ( 1.2)Regular certification but less than the highest available 30 ( 4.1) 25 ( 7,3) 29 ( 4.3)Highest certification available (permanent or long-term) 69 ( 4.1) 71 ( 7.3) 60 ( 4.3)
Percentage of students *hose mathematics teachers havethe following types of teaching certificates that arerecognized by North Dakota
Mathematics (middle school or secondary) 91 ( 1.6) 77 ( 4.5) 84 ( 22)Education (elementary or middle school) 5 ( 1.4) 17 ( 75) 12 ( 2.6)
Other 3 ( 0.6) 7 ( 4.8) 4 ( 1,5)
The standard errors of the estimated statistics appear in parentheses. It can be said with about 95 percentcertainty that, for each population of interest, the value for the entire population is within ± 2 standard errorsof the estimate for the sample.
EDUCATIONAL BACKGROUND
Although mathematics teachers are held responsible for providing high-quality instruction
to their students, there is a concern that many teachers have had limited exposure to
content and concepts in the subject area. Accordingly, the Trial State Assessment gathered
details on the teachers' educational backgrounds more specifically, their undergraduate
and graduate majors and their in-service training.
73
58 THE 1990 NAEP TRIAL STATE ASSESSMENT

North Dakota
Teachers' responses to questions concerning their undergraduate and graduate fields ofstudy (Table 22) show that:
In North Dakota, 61 percent of the eighth-grade public-school studentswere being taught mathematics by teachers who had an undergraduatemajor in mathematics. In comparison, 43 percent of the students acrossthe nation had mathematics teachers with the same major.
Some of the eighth-grade public-school students in North Dakota(15 percent) were taught mathematics by teachers who had a graduatemajor in mathematics. Across the nation, 22 percent of the students weretaught by teachers who majored in mathematics in graduate school.
TABLE 22 I Teachers' Reports on Their Undergraduate and1 Graduate Fields of Study
PERCENTAGE OF STUDENTS
1a00 NAEP TRIAL. STATE ASSESSMENT North Dakota Central Nation
What was your undergraduate major? Percentage Percentage Percentage
Mathematics 61 ( 3.0) 57 ( 7.1) 43 ( 3.9)Education 28 ( 2.8) 29 ( 6.4) 36 ( 3.8)Other 11 ( 1.1) 14 ( 5.4) 22 ( 3.3)
-1What was your graduate major, Percentage Percentage Percentaga
Mathematics 15 ( 1.5) 34 ( 9.1) 22 ( 3.4)Education 28 ( 2.9) 34 ( 6.2) 38 ( 3.5)Other or no graduat level study 57 ( 3.3) 32 ( 6.6) 40 ( 3.4)
The standard errors of the estimated statistics appear in parentheses, 1t can be said with about 95 percentcertainty that, for eaLh population of interest, the value for the entire population is within ± 2 standard errorsof the estimate for the sample,
7THE 1990 NAEP TRIAL STATE ASSESSMENT 69

North Dakota
Teachers' responses to questions concerning their in-service training for the year up to theTrial State Assessment (Table 23) show that:
In North Dakota, 25 percent of the eighth-grade public-school studentshad teachers who spent at least 16 hours on in-service education dedicatedto mathematics or the teaching of mathematics. Across the nation,39 percent of the students had teachers who spent at least that much timeon similar types of in-semice training.
Some of the students in North Dakota (20 percent) had mathematicsteachers who spent no time on in-service education devoted to mathematicsor the teaching of mathematics. Nationally, 11 percent of the students badmathematics teachers who spent no time on similar in-service training.
TABLE 23 I Teachers' Reports on Their In-Service Training
PERCENTAGE OF STUDENTS
WOO NAEP TRIAL STATE ASSESSMENT North Dakota Cintral Nation
During the last year, how much time intotal have you spent on in-serviceeducation in mathema:ics or the teachingof mathematics?
NonaOno to 15 hours16 hours or more
Percentage Percentage Percontago
20 ( 2.4) ( 1.3) 11 ( 2.1)55 ( 3.8) 71 ( 5.4) 51 ( 4.1)25 ( 2.0) 28 ( 5.0) ( 3.8)
The standard errors of the estimated statistics appear in parentheses. It can be said with about 95 percentcertainty that, for each population of interest, the value for the entire population is within ± 2 standard errorsof the estimate for the sample.
P*7 J
THE 1990 NAEP TRIAL STATE ASSESSMENT

North Dakota
SUMMARY
Recent results from international studies have shown that students from the United Statesdo not compare favorably with students from other nations in mathematics and scienceachievement." Further, results from NAEP assessments have indicated that students'achievement in mathematics and science is much lower than educators and the publicwould like it to be." In cuniculum areas requiring special attention and improvement,
such as mathematics, it is particularly important to have well-qualified teachers. Whenperformance differences across states and territories are described, variations in teachergratifications and practices may point to areas worth further exploration. There is noguarantc.: that individuals with a specific set of credentials will be effective teachers:
however, it is likely that relevant training and experience do contribute to better teaching.
The informaticn about teachers' educational backgrounds and experience reveals that:
In North Dakota, 19 percent of the assessed students were being taughtby mathematics teachers who reported having at least a master's oreducation specialist's degree. This compares to 44 percent for studentsacross the nation.
More than half of the students (69 percent) had mathematics teachers whohad the highest level of teaching certification available. This is similar tothe figure for the nation, where 66 percent of students were taught bymathematics teachers who were certified at the highest level available intheir states.
In North Dakota, 61 percent of the eighth-grade public-school studentswere being taught mathematics by teachers who had an undergraduatemajor in mathematics. In comparison, 43 percent of the students acrossthe nation had mathematics teachers with the same major.
Some of the eighth-grade public-school students in North Dakota(15 percent) were taught mathematics by teathers who had a graduatemajor in mathematics. Across the nation, 22 percent of the students weretaught by teachers who majored in mathematics in graduate school.
'° Archie E. Lapointe, Nancy A. Mead, and Gary W. Phillips, A World of Differences An InternationalAssessment of Mathematics and Science (Prmceton, NJ: Center for the Assessment of Educational Progress,Educational Testing Service, '958).
lna V.S. Mullis, John A. Dossey, Eugene H. Owen, and Gary W. Phillips, The State of MathematicsAchievement NAEP's 1990 Assessment of the Nation and the Tnal Assessment of the States (Princeton, NJ:National Assessment of Educational Progress, Educational Testing Service, 1991).
THE 1990 NAEP TRIAL STATE ASSESSMENT 71

North Dakota
In North Dakota, 25 percent of the eighth-grade public-scliool studentshad teachers who spurt at least 16 hours on in-service education dedicatedto mathematics or the teaching of mathematics. Across the nation,39 percent of the students had teachers who spent at least that much timeon similar types of in-service training.
Some of the students in Nozth Dakota (20 percent) had mathematicsteachers who spent no time on in-service education devoted to mathematicsor the teaching of mathematics. Nationally, 11 percent of the students hadmathmatics teachers who spent no time on similar in-service training.
'77
72 THE 1990 NAEP TRIAL STATE ASSESSMENT

North Dakota
CHAPTER 7
The Conditions Beyond School that Facilitate
Mathematics Learning and Teaching
Because students spend much more time out of school each day than they do in school, itis reasonable to expect that out-of-school factors greatly influence students' attitudes and
behaviors in school. Parents and guardians can therefore play an important role in theeducation of their children. Family expectations, encouragement, and participation instudent learning experiences are powerful influences. Together, teachers and parents canhelp build students' motivation to learn and can broaden their interest in mathematics andother subjects.
To examine the relationship between home environment and mathematics proficiency,students participating in the Trial State Assessment were asked a series of questions aboutthemselves, their parents or guardians, and home factors related to education.
THE 1990 NAEP TRIAL STATE ASSESSMENT 73

North Dakota
AMOUNT OF READLNG MATERIALS IN THE HOME
The number and types of reading and reference materials in the home may be an indicatorof the value placed by parents on learning and schooling. Students participating in the Trial
State Assessment were asked about the availability of newspapers, magazines, books, and
an encyclopedia at home. Average mathematics proficiency associated with having zero totwo, three, or four of these types of materials in the home is shown in Table 24 and TableA24 in the Data Appendix.
TABLE 24 I Students' Reports on Types of ReadingI Materials in the Home
PERCENTAGE OF STUDENTS ANDAVERAGE MATHEMATICS PROFICIENCY
1900 NAEP TRIAL STATE ASSESSMENT North Dakota Cantral Nation
Does your family have, or receive on aregular basis, any of the following Items:more than 25 books, an encyclopedia,newspapers, magazines?
Zero to two typos
Three types
Four types
parcemageand
Proficiency
Percentageand
Prod,* fancy
Percent Agoand
Proadency
10 ( 1.0) 19 ( 2.1) 21 ( 1.0)281 ( 3.5) 250 ( 3.4) 244 ( 2.0)
30 ( 1.2) 31 ( 2.2) 30 ( 1.0)280 ( 1.8) 265 ( 3.6) 258 ( 1.7)
60 ( 1.3) 50 ( 1.8) 48 ( 1.3)
285 ( 0.9) 272 ( 2.1) 272 ( 1.5)
The standard errors of the estimated statistics appear in parentheses. lt can be said with about 95 percentcertainty that, for each population of interest, the value for the entire population is within t 2 standard errorsof the estimate for the sample.
The data for North Dakota reveal that:
Students in North Dakota who had all four of these types of materials inthe home showed higher mathematics proficiency than did students withzero to two types of materials. This is similar to the results for the nation,where students who had all four types of materials showed highermathematics proficiency than did students who had zero to two types.
74 THE 1990 NAEP TRIAL STATE ASSESSMENT

North Dakota
A smaller percentage of Hispanic and American Indian students had allfour types of these reading materials in their homes than did Whitestudents.
About the same percentage of students attending schools in advantagedurban areas as in extreme rural areas and areas classified as "other" had allfour types of these reading materials in their homes.
HOURS OF TELEVISION WATCHED PER DAY
Excessive television watching is generally seen as detracting from time spent on educational
pursuits. Students participating in the Tri,u State Assessment were asked to report on theamount of television they watched each day (Table 25).
TABLE 25 I Students' Reports on the Amount of Time SpentI Watching Television Each Day
PERCENTAGE OF STUDENTS ANDAVERAGE MATHEMATICS PROFICIENCY
_
19e0 NAEP TRIAL STATE ASSESSMENT North Dakota Central Nation
How much television do you usually ,
watch each day?
Percentage
Plvtlelency
Percentage
PruNdency
Percentage1111d
Proficiency
One hour or less 14 ( 0.9) 11 ( 1.6) 12 ( 0.8)289 ( 2.0) 270 ( 3.5) 269 ( 2.2)
Two hours 27 ( 1.2) 22 ( 1.7) 21 ( 0.9)283 ( 1.3) 274 ( 3.2) 268 ( 1.8)
Three hours 26 ( 12) 25 ( 2.4) 22 ( 0.8)282 ( 1.6) 271 ( 4.0) 265 ( 1.7)
Four to five hours 28 ( 1.3) 27 ( 3.0) 28 ( 1.1)279 ( 2.3) 261 ( 2.9) 260 ( 1.7)
Sbc hours or,more 8 ( 0.7) 14 ( 1.6) 18 ( 1.0)284 ( 3.1) 247 ( 3.4) 245 ( 1.7)
The standard errors of the estimated statistics appear in parentheses. It can be said with about 95 percentcertainty that, for each population of interest, the value for the entire population is within -2.: 2 standard errorsof the estimate for the sample.
THE 1990 NAEP TRIAL STATE ASSESSMENT 75

North Dakota
From Table 25 and Table A25 in the Data Appendix:
In North Dakota, average mathematics proficiency was lowest for studentswho spent six hours or more watching television each day.
Some of the eighth-grade public-school students in North Dakota(14 percent) watched one hour or less of television each day; 6 percentwatched six hours or more.
About the same percentage of males and females tended to watch six ormore hours of television daily. However, a smaller percentage of malesthan females watched one hour or less per day.
In addition, 6 percent of White students, 8 percent of Hispanic students,and 14 percent of American Indian students watched six hours or more oftelevirim each day. In comparison, 15 percent of White students,10 percent of Hispanic students, and 9 percent of American Indianstudents tended to watch only an hour or less.
STUDENT ABSENTEEISM
Excessive absenteeism may also be an obstacle to students' success in school. To examinethe relationship of student absenteeism to mathematics proficiency, the studentsparticipating in the Trial State Assessment were asked to report on the number of days ofschool they missed during the one-month period preceding the assessment.
From Table 26 and Table A26 in the Data Appendix:
In North Dakota, average mathematics proficiency was lowest for studentswho missed three or more days of school.
About half of the students in North Dakota (50 percent) did not miss anyschool days in the month prior to the assessment, while 14 percent missedthree days or more.
In addition, 13 percent of White students, 20 percent of Hispanic students,and 33 percent of American Indian students missed thret. or more days ofschool.
81
76 THE 1990 NAEP TRIAL STATE ASSESSMENT

North Dakota
Similarly, 14 percent of students attending schools in advantaged urbanareas, 15 percent in schools in extreme rural areas, and 15 percent inschools in areas classified as "other" missed three or more days of school.
TABLE 26 1 Students' Reports on the Number of Days ofSchool Missed
PERCENTAGE OF STUDENTS ANDAVERAGE MATHEMATICS PROFICIENCY
1090 MEP TRIAL ST4,:': ASSESSMENT North DMota Central Nation
IDA
How many days of school did you misslast month?
000 Of two days
Three days or more
Percentiles Permit..and and
Profit:fancy Praddancy
SO ( 1.2)285 ( 12)
38 ( 1.2)281 ( 1.3)
14 ( 1.0)269 ( 2.9)
47 ( 1.7)269 ( 2.5)
30 ( 2.0)271 ( 3.4)
23 ( 2.0)252 ( 3.3)
Panontageand
Proliclincy
45 ( 1.1)265 ( 1.8)
32 ( 0.9)266 ( 1.6)
23 ( 1.1)250 ( 1.9)
The standard errors of the estimated statistics appear in parentheses. It can be said with about 95 percentcertainty that, for each population of interest, the value for the entire population is within ± 2 standard errorsof the estimate for the sample.
THE 1990 NAEP TRIAL STATE ASSESSMENT 77
North Dakota
..;IUDENTS' PERCEPTIONS OF MATHEMATICS
According to the National Council of Teachers of Mathematics, leaning mathematics
should require students not only to master essential skills and concepts but also to develop
confidence in their mathematicai abilities and to value mathematics as a discipline.' 2
Students were asked if thr agreed or disagreed with five statements designed to elicit their
perceptions of mathematics. These included statements about:
Personal experience with mathematics, including students' enjoyment ofmathematics and level of confidence in their mathematics abilities: I likemathematics; I am good in mathematics.
Value of mathematics, including students' perceptions of its present utilityand its expected relevance to future work and life requirements: Almost allpeople use mathematics in their jobs; mathematics is not more for boys thanfor girls.
The nature of mathematics, including students' ability to identify the salientfeatures of the discipline: Mathematics is useful for .viving everydayproblems.
A student "perception index" was developed to examine students' perceptions of and
attitudes toward mathematics. For each of the five statements, students who responded
"strongly agree" were given a value of I (indicating very positive attitudes about the
subject), those who responded "agree" were given a value of 2, and those who responded
"undecided," "disagree," or "strongly disagree" were given a value of 3. Each student's
responses were averaged over the five statements. The students were then as&igned a
perception index according to whether they tended to strongly agree with the statements
(an index of 1), tended to agree with the statements (an index of 2), or tended to be
undecided, to disagree. or to strongly disagree with the statements :an index of 3).
Table 27 provides the data for the students' attitudes toward mathematics as defmed by
their perception index. The following results were observed for North Dakota:
Average mathematics proficiency was highest for students who were in the"strongly agree" category and lowest for students who were in the"undecided, disagree, strongly disagree" category.
About one-quarter of the students (29 percent) were in the "stronglyagree" cate:ory (perception index of 1). This compares to 27 percentacross the nation.
Some of the students in North Dakota (20 percent), compared to24 percent across the nation, were in the "undecided, disagree, or stronglydisagree" category (perception index of 3).
" National Council of Teachers of Mathematics, Curriculum and Evaluation Standards for School Mathematks
(Reston, VA: National Council of Tearherr of Mathematics, 1989).
Cr) 3
78 THE 1990 NAEP TRIAL STATE ASSURMENT

North Dakota
TABLE 27 1 Students' Perceptions of Mathematics
PERCENTAGE OF STUDENTS ANDAVERAGE MATHEMATICS PROFICIENCY
-MO MEP TRIAL STATE ASSESSMENT North Dakota Central Nation
Student "perception index" groups Percentageand
Proeciency
Percentageand
Proficiency
Percentageand
Praffelency
Strongly agree 29 ( 1,5) 25 ( 1.6) 27 ( 1.3)("perception Index" of 1) 293 ( 1.5) 272 ( 3.5) 271 ( 1.9)
Agree 50 ( 1.4) 50 ( 1.8) ( 1.0)("Perception index" ot 2) 280 ( 1$) 267 ( 3.1) 262 ( 1.7)
Undecided, disagree, strongly disagree 20 ( 1.1) 25 ( 2.2) 24 ( 1.2)("perception index" of 3) 268 ( 2.2) 256 ( 2.3) 251 ( 1.8)
The standard errors of the estimated statistics appear in parentheses. It can be said with about 95 percentcertainty that, for each population of interest, the value for the entire population is within /. 2 standard errorsof the estimate for the sample.
SUMMARY
Some out-of-school factors cannot be changed, but others can be altered in a positive wayto influence a student's learning and motivation. Partnerships among students, parents,teachers, and the larger community can affect the educational environment in the home,resulting in more out-of-school reading and an increased value placed on educationalachievement, among other desirable outcomes.
The data related to out-of-school factors show that:
Students in North Dakota who had four types of reading materials (anencyclopedia, newspapers, magazines, and more than 25 books) at homeshowed higher mathematics proficiency than did students with zero to twotypes of materials. This is similar to the res,ilts for the nation, wherestudents who had all four types of materials showed higher mathematicsproficiency than did students who hz.d zero to two types.
S 4
THE 1990 NAEP TRIAL STATE ASSESSMENT 79

North Dakota
Some of the eighth-grade public-school studesits in North Dakota(14 percent) watch.ed one hour or less of television each day; 6 percentwatched six hours or more. Average mathematics proficiency was lowestfor students who spent six hours or more watching television each day.
About half of the students in North Dakota (50 percent) did not miss anyschool days in the month prior to the assessment, while 14 percent missedthree days or more. Average mathematics proficiency was lowest forstudents who missed three or more days of school.
About one-quarter of the students (29 percent) were in the "stronglyagree" category relating to students' perceptions of mathematics. Averagemathematics proficiency was highest for students who were in the "stronglyagree" category and lowest for students who were in the "undecided,disagree, strongly disagree" category.
r
80 THE 1990 NAEP TRIAL STATE ASSESSMENT

North Dakota
THE NATION'SREPORT
CARD
PROCEDURAL APPENDIX
This appendix provides an overview of the technical details of the 1990 Trial StateAssessment Program. It includes a discussion of the assessment design, the mathematicsframework and objectives upon which the assessment was based, and the procedures usedto analyze the results.
The objectives for the assessment were developed through a consensus process managedby the Council of Chief State School Officers, and the items were developed through asimilar process managed by Edu......-;;,,nal Testing Service. The development of the TrialState Assessment Program benefitted from the involvement of hundreds of representativesfrom State Education Agencies who attended numerous NETWORK meetings, served oncommittees, reviewed the framework, objectives, and questions, and, in general, providedimportant suggestions on all aspects of the program.
Assetement Design
The 1990 Trial State Assessment was based on a focused balanced incomplete block (BIB)spiral matrix design a design that enables broad coverage of mathematics content whileminimizing the burden for any one student.
In total, 137 cognitive mathematics items were developed for the assessment, including 35open-ended items. The first step in implementing the BIB design required dividing theentire set of mathematics items into seven units called blocks. Each block was designed tobe completed in 15 minutes.
C5 0
THE 3990 NAEP TRIAL STATE ASSESSMENT 81

North Dakota
The blocks were then assembled into assessment booklets so that each booklet containedtwo background questionnaires -- the first consisting of general background questions andthe second consisting of mathematics background questions -- and thnee blocks of cognitivemathematics items. Student3 were given five minutes to complete each of the backgroundquestionnaires and 45 minutes to complete the three 15-minute blocks of mathematicsitems. Thus, the entire assessment required approximately 55 minutes of student time.
In accordance with he BIB design, the blocks were assigned to the assessment booklets sothat each block appeared in exactly three booklets and each block appeared with everyother block in one booklet. Seven assessment booklets were used in the Trial StateAssessment Program. The booklets were spiraled or interleaved in a systematic sequenceso that each booklet appeared an appropriate number of times in the sample. The studentswithin an assessment session were assigned booklets in the order in which thebooklets werespiraled. Thus, students in any given session received a variety of different booklets andonly a small number of students in the session received the same booklet.
Assessment Content
The framework and objectives for the Trial State Assessment Program were developedusing a broad-based cor iensus process, as described in the introduction to this report.'The assessment framework consisted of two dimensions: mathematical content areas andabilities. The five content areas assessed were Numbers and Operations; Measurement;Geometry; Data Analysis, Statistics, and Probability; and Algebra and Functions (seeFigure Al). The three mathematical ability areas assessed were Conceptual Understanding,Procedural Knowledge, and Problem Solving (sec Figure A2).
Data Analysis and Scales
Once the assessments had bem conducted and information from the assessment bookletshad been compiled in a database, the assessment data were weighted to match knownpopulation proportions and adjusted for nonresponse. Analyses were then conducted todetermine the percentages of students who gave various responses to each cognitive andbackground question.
Item response theory (IRT) was used to estimate average mathematics proficiency for eachjurisdiction and for various subpopulations, based on students' performance on the set ofmathematics items they received. IR T provides a common scale on which performancecan be reported for the nation, each jurisdiction, and suhpopulations, even when allstudents do not answer the same set of questions. This common scale makes it possibleto report on relationships between students' characteristics (based on their responses to thebackground questions) and their overall performance in the assessment.
National Assessment of Educational Progress. Mathematics Objectives 1990 Assessment (Princeton, NJ:
Educational Testing Service, 1988).
82 THE 1990 NAEP TRIAL STATE ASSESSMENT

North Dakota
FIGURE Al I Content Areas Assessed
Numbers and Operations
This content area focuses on students' understanding of numbers (whole numbers, fractions, decimals,integers) and their application to real-world situations, as well as computational and estimation situations.Understanding numerical relationships as expressed in ratios, proportions, and percents is emphasized.Students' abilities in estimation, mental computation, use of calculators, generalization of numericalpatterns, and verification of reSults are also included.
Measurement
This content area focuses on students' ability to describe real-world objects using numbers. Students areasked to identify attributes, select appropriate units, apply measurement concepts, and communicatemeasurement-related ideas to others. Questions are included that require an ability to read instrumentsusing metric, customary, or nonstandard units, with emphasis on precision and accuracy. Questionsrequiring estimation, measurements, and applications of measurements of length, rime, money,
temperature, mass/weight, area, volume, capacity, and angles are also included in this content area.
[GeometryM=IMINM
This content area focuses on students' knowledge of geometric figures and relationships and On their skillsin working with this knowledge. These skills are important at all levels of schooling as well as in practicalapplications. Students need to be able to model and visualize geometric figures in one, two, and threedimensions and to communicate geometric ideas. In addition, students should be able to use informalreasoning to establish geometric relationships.
Data Analysis, Statistics, and Probability
This content area focuses on data representation and analysis across all disciplines and reflects theimportance and prevalence of these activities in our society. Statistical knowledge and the ability tointerpret clata are necessary skills in the contemporary world. Questions emphasize appropriate methodsfor gathering data, the visual exploration of data, and the development and evaluation of arguments based
on data analysis.
Algebra and Functions
This content area is broad in scope, covering algedraic and functional concepts in more informal,exploratory ways for the eighth-grade Trial State Assessment. Proficiency in this concept area requiresboth manipulative facility and conceptual underatanding: it in.rolves the ability to use algebra as a meansof representation and algebraic processing as a problem-solving tool. Functions are viewed not only interms of algebraic formulas, but also in terms of verbal descriptions, tables of values, and graphs.
CIC)
THE 1990 NAEP TRIAL STATE ASSESSMENT 83
North Dakota
FIGURE A2 I Mathematical Abilities
The following three categones of mathematical abilities are not to be constru' as hierarchical. For
example, problem solving involves interactions between conceptual knowledge procedural skills, but
what is considered complex problem solving at one grade level may be considered conceptualunderstanding or procedural knowledge at another.
Conceptual Understanding
Students demonstrate conceptual understanding in mathematics when they provide evidence that they can
recognize, label, and generate examples and counterexamples of concepts: can use and interrelate models,
diagrams, and varied representations of concepts; can identify and apply principles: know and can apply
facts and definitions: can compare, contrast, and integrate related concepts and principles: can recognize,
interpret, and apply the signs, symbols, and terms used to represent cOncepts; and can interpret the
assumptions and relations involving concepts In mathematical settings. Such understandings are essential
to performing procedures in a meaningful way and applying them in problem-solving situations.
Procedural Knowledge
Students demonstrate procedural knowledge in mathematics when they provide evidence of their ability to
select and apply appropriate procedures correctly, verify and justify the correctness of a procedure using
concrete models or symbolic methods, and extend or modify procedures to deal with factors inherent in
problem settings. Procedural knowledge includes the various numerical algorithms in mathematics that
have been created as tools to meet specific needs in an efficient manner. It also encompasses the abilities
to read and produce graphs and tables, execute geometric constructions, and perform noncomputational
skiffs such as rounding and ordering.
Problem Solving
In problem solving, students are required to use their reasoning and analytic abiliti , when they encounter
new situations. Problem solving includes the ability to recognize and formulate problems: determine the
sufficiency and consistency of data: use strategies, data, models, and relevant mathematics; generate,
extend, and modify procedures: use reasoning (i.e., spatial, inductive, deductive, statistical, and
proportional); and judge the reasonableness and correctness of solutions.
84 THE 19g0 NAEP TRIAL STATE ASSESSMENT

North Dakota
A scale ranging from 0 to 500 was created to report perfonnance for each content area.Each content-atea scale was based on the distribution of student performance across allthree grades assessed in the 1990 national assessment (grades 4, 8, and 12) and had a meanof 250 and a standard deviation of 50.
A composite scale was created as an overall measure of students' mathematics proficiency.The composite scale was a weighted average of the five content area scales, where theweight for each content area was proportional to the relative importance assigned to thecontent area in the specifications developed by the Mathematics Objectives Panel.
Scale Anchoring
Scale anchoring is a method for defining performance along a scale. Traditionally,performance on educational scales has been defined by norm-referencing -- that is, bycomparing students at a particular scale level to other students. In contnist, the NAEPscale anchoring is accomplished by describing what students at selected leveh know andcan do.
The scale anchoring process for the 1990 Trial State Assessment began with the selectionof four levels -- 200, 250, 300, and 350 -- on the 0-to-500 scale. Although proficiency levelsbelow 200 and above 350 could theoretically have been defmed, they were not because sofew students performed at the extreme ends of the scale. Any attempts to define levels atthe extremes would therefore have been highly speculative.
To define performance at each of the four levels on the scale, NAEP analyzed sets ofmathematics item i pm the 1990 assessment that discriminated well between adjacentlevels. The criteria fir selecting these "benchmark" items were as follows:
To d line performance at level 200, items were chosen that were answeredcorrectly by at least 65 percent of the students whose proficiency was at ornear 200 on the scale.
To define performance at each of the higher levels on the scale, items werechosen that were: a) answered cornctly by at least 65 percent of studentswhose proficiency was at or near that level; and b) answered incorrectly bya majority (at least 50 percent) of the students performing at or near thenext lower level.
The percentage of students at a level who answered the item correctly hadto be at least 30 points higher than the percentage of students at the nextlower level who answered it correctly.
noTHE 1990 NAEP TRIAL STATE ASSESSMENT 85

North Dakota
Once these empirically selected sets of questions had been identified, mathematics educatorsanalyzed the questions and used their expert judgment to characterize the knowledge, skills,and understandings of students performing at each level. Each of the four proficiency levelswas defined by describing the types of mathematics questions that most students attainingthat proficiency level would be able to perform successfully. Figure 3 in Chapter 1 providesa summary of the levels and their characteristic skills. Example questions for each level areprovided in Figure A3, together with data on the estimated propoition of students at orabove each of the four proficiency levels who correctly answered each question.'
Questionnaires for Teachers and Schools
As part of the Trial State Assessment, questionnaires were given to the mathematicsteachers of assessed students and to the principal or other administrator in eachparticipating school.
A Policy Analysis and Use Panel drafted a set of policy issues and guidelines and maderecommendations concerning the design of these questionnaires. For the 1990 assessment,the teacher and school questionnaires focused on six educational areas: curriculum,instructional practices, teacher qualifications, educational standards and reform, schoolconditions, and conditions outside of the school that facilitate learning and instruction.Similar to the development of the materials given to students, the policy guidelines and theteacher and school questionnaires were prepared through an iterative process that involvedextensive development, field testing, and review by external advisory groups.
MATHEMATICS TEACHER QUESTIONNAIRE
The questionnaire for eighth-grade mathematics teachers consisted of two parts. The firstrequested information about the teacher, such as race/ethnicity and gender, as well asacademic degrees held, teaching certification, training in mathematics, and ability to getinstructional resources. In the second part, teachers were asked to provide information oneach class they taught that included one or more students who participated in the TrialState Assessment Program. The information included, among other things, the amountof time spent on mathematics instruction and homework, the extent to which textbooksor work.heets were used, the instructional emphasis placed on different mathematicaltopics, ar -I the use of various instructional approaches. Because of the nature of thesampling far the Trial State Assessment, the responses to the mathematics teacherquestionr aire do not necessarily represent all eighth-grade mathematics teachers in a stateor territory. Rather, they represent the teachers of the particular students being assessed.
Since t'lere were msufficient numbers of eighth-grade questions at levels 200 and 350, one of the questionsexemplifying level 200 is from the fourth-grade national assessment and one exemplifying level 350 is from the
twelfth-grade national assessment.
;)..1
86 THE 1990 NAEP TRIAL STATE ASSESSMENT

North Dakota
FIGURE A3 I Example Items for Mathematics Proficiency Levels
Level 200: Simple Additive Reasoning and Problem Solving with WholeNumbers
EXAMPLE 1
Tomas Golflab
0Lake,
7. Linda had thus imot Wm all the use elm sad data difkustbells u shwa 'ems II she Mb aid box with dee bad a/ hark 'haw..which hos will hare as Mew belie ka it?
0> The los with the lamas hatia
tD The baa lush she pall beLlo
tD The lax with tht tubber bah
ti) You us% telL
EXAMPLE 2
SOUS OF PANT PtCSEDAT FARAWAY FARMS
;441 Th W Thari
Ow Mk we*
OtesgetLamm
Geopefsat IMMO
C. How sway boxes at asetases wele sada as Thttudayi
CD SS
C1Ct 60
OD 70
OD so
CD 90
CO I don't know.
Grade 4Overall PercentagePercentage CorrectNg65 91
Grade 4Overall PercentagePercentage Correctg9g 22475 91
Correct: 73%for Anchor Levels:202100
Grade 8Overall PercentagePercentage Correct22276 87
P2
Corrv t %
for Anw. Levels:
100
Correct: 89%for Anchor Levels:
1t296 100
THE 1990 NAEP TRIAL STATE ASSESSMENT 87

North Dakota
FIGURE A3 I Example Items for Mathematics Proficiency Levels(continued)
Level 250: Simple Multiplicative Reasoning and Two-Stop Problem Solving
EXAMPLE
7. What 15 the vatuc of a + $ when a 3
Answer
EXAMPLE 2
Kat MILCIt ARMMALTS
Calor et Pommy
37
S3
Tbe tabk Avec skines ihe setolo at Ferny id bais VAN.On do dickbelow, oaks e Ode mph to Wesson do doe in tbe obis Labe sobpen id the assie look ends sbe ammo heir sides
Dsd you use the takulatess on ibo ;tunic.*
Ws 0 hie
EXAMPU 3
6. koala= Is pecking heathens taw boxes Eath box hofds 6 baseballs Shehes 24 belb. Much number sentence will help Ma rind out how manyboxes she will need;
Cro 24 6 w 0
cp 24 6 w 0
cer 24 + 6 w, 0
cr 24 x 6 w 0
(I!) I don't know.
Grade 8Overall Percentage Correct 78%Percentage Correct for Anchor Levels:222 211/ 12125 59 95 95
Grade 8Overall Percentage Correct: 73%Percentage Correct for Anchor Levels:
Mt &IQ N1221 58 92 22
Grade 8Overall Percentage Correct 77%Percentage Correct for Anchor Levels:
ZQQ ZQ i§g37 71 95 100
c 3
88 THE 1990 NAEP TRIAL srATE ASSESSMENT

North Dakota
FIGURE A3J Example Items for Mathematics Proficiency Levels
(continued)
Level 300: Reasoning and Problem Solving invoMng Fractions, Decimals,Percents, Elementary Geometric Properties, and SimpleAlgebraic Manipulations
EXAMPLE 1
ID. Mikhail du foliewtse shows tbe weigh a Ilsprag flu above mangle ovaliae
OD
EXAMPLE 2
In the NNW tenr* dui elm bethlias. aw IS kes loot stqweseelds leek me&dlt Wits Jaw lithe use Leak* suet 5 hes
hap% would be repssentat L Arale weld kw way Ada bight
CP
4D I
SI 7coy
Oil rsu 11 doe ealetileiet e* die eiitatioet
Vas C) No
Grade 8Overall Percentage Correct 80%Percentwi Correct for Anchor Levels:
221 12233 49 77 90
Grade 12Overall Percentage Correct 75%Percentage Cava for Anchor livels:222 2i14
48 79 95
Grade 8Overall Percentage Correct 59%Percentage Correct for Anchor Levels:2tX1 2C0 22217 46 86 99
!j4 BEST COPY AVAILABLY
THE 1990 NAEP TRIAL STATE ASSESSMENT 89

Nonit Dakota
FIGURE i' f Example Items for Mathematics Proficiency Levels(continued)
Level 350: Reasoning and Problem Solving InvoMng GeometricRelationships, Algebraic Equations, and Beginning Statistics andProbability
EXAMPLE 1
IP Questions 16-17 tofu to tbs We* uti :sumo oi dotstiores.
S
2
16. It this pouts') oi dot-biutts tsecAttsuod. ).01 sassy dots toil be in the)00th hprel
GD
CD 101
CD 199
21D 200
CD 201
EXAMPLE 2
17. Explain bow sou food yew soswct to Surstion 16.
Anetwor
Grade 8Overall Percentage Correct 34%Percentage Correct for Anchor Levels:
2911 NS/13 19 53 88
Grade 12Overall Percentage Correct: 49%Percentage Correct for Anchor Levels:;22 Ug 1.14
22 48 90
Grade 8Overall Percentage Correct: 15%Percentage Correct for Anchor Levels:
2212 kftg Z242 IN1 4 28 74
Grade 12Ovrall Percentage Correct: 27%Percentage Correct for Anchor Levels:
Al4 gri9 2S/43 22 74
90 THE 1990 NAEP TRIAL SPATE ASSFSSMENT

North Dakota
SCHOOL CHARACTERISTICS AND POLICIES QUESTIONNAIRE
An extensive school questionnaire was completed by principals or other administrators inthe schools participating in the Trial State Assessment. In addition to questions about theindividuals who completed the questionnaires, there were questions about school policies,course offerings, and special priority areas, among other topics.
It is important to note that in this report, as in all NAEP reports, the student is always theunit of analysis, even when information from the teacher or school questionnaire is beingreported. Having the student as the unit of analysis makes it possible to describe theinstruction received by representative samples of eighth-grade students in public schools.Although this approach may provide a different perspective from that which would beobtained by simply collecting information from a sample of eighth-gade mathematicsteachers or from a sample of schools, it is consistent with NAEP's goal of providinginfonnation about the educational context and performance of students.
Estimating Variability
The statistics reported by NAEP (average proficiencies, percentages of students at or aboveparticular scale-score levels, and percentages of students responding in certain ways tobackground questions) air estimates of the corresponding information for the populationof eighth-grade students in public schools in a state. These estimates are based on theperformance of a carefully selected, representative sample of eighth-grade public-schoolstudents from the state or territory.
If a different representative sample of students were selected and the assessment repeated,it is likely that the estimates might vary somewhat, and both of these sample estimatesmight differ somewhat from the value of the mean or percentage that would be obtainedif every eighth-grade public-school student in the state or territory were assessed. Virtuallyall statistics that are based on samples (including those in NAEP) arc subject to a certaindegree of uncertainty. The uncertainty attributable to using samples of students is referredto as sampling error.
like almost all estimates based on assessment measum, NAFP's total group and subgroupproficiency estimates are subject to a second source of mcertainty, in addition to samplingerror. As previously noted, each student who participated in the Trial State Assessmentwas administered a subset of questions from the total set of questions. If each student hadbeen administered a different, but equally appropriate, set of the assessment questions --or the entire set of questions -- somewhat different estimates of total group and subgroupproficiency might have been obtained. Thus, a second source of uncertainty arises becauseeach student was administered a subset of the total pool of questions.
THE 1990 NAEP TRIAL STATE ASSESSMEN1. 91

North Dakota
In addition to reporting estimates of average proficiencies, proportions of students at orabove particular scale-score levels, and proportions of students giving various responses tobackground questions, this report also provides estimates of the magnitude of theuncertainty associated with these statistics. These measures of the uncertainty are calledstandard errors and are given in parentheses in each of the tables in the report. Thestandard errors of the estimates of mathematics proficiency statistics reflect both sourcesof uncertainty discussed above. The standard errors of the other statistir. (such as theproportion of students answering a background question in a certain way or the proportionof students in certain racial/ethnic groups) reflect only sampling error. NAEP uses amethodology called the jackknife procetlure to estimate these standard errors.
Drawing Inferences from the Results
One of the goals of the Trial State Assessment Program is to make inferences about theoverall population of eighth-grade students in public schools in each participating state andterritory bas,:l on the particular sample of students assessed. One uses the results from thesample -- taking into account the unt rtainty associated with all samples -- to makeinferences about the population.
The use of confidence intervals, based on the standard errors, provides a way to makeinferences about the population means and proportions in a manner that reflects theuncertainty associated with the sample estimates. An estimated sample mean proficiency± 2 standard errors represents a 95 percent confidence interval for the correspondingpopulation quantity. This means that with approximately 95 percent certainty, the averageperformance of the entire population of interest (e.g., all eighth-grade students in publicschools in a state or tfaritory) is within ± 2 standard errors of the sample mean:
As an example, suppose that the average mathematics proficiency of the students in aparticular state's sample were 256 with a standard error of 1.2. A 95 percent confidenceinterval for the population quantity would be as follows:
Mean ± 2 standard errors = 256 ± 2 (1.2) = 256 ± 2.4 =
256 - 2.4 and 256 + 2.4 = 253.6, 258.4
'Thus, one can conclude with 95 percent certainty that the average proficiency for the e- tirepopulation of eighth-grade students in public schools in that state is between 253.6 and258.4.
Similar confidence intervals can be constructed for oeltentages, provided that thepercentages are not extremely large (greater than 9d percent) or extremely small ( less than10 percent). For extreme percentages, confidence intervals constructed in the abovemanner may not be appropriate and procedures for obtaining accurate confidence thtervalsare quite complicated.
92 THE 1990 NAEP TRIAL STATE ASSESSMENT

North Dakota
Analyzing Subgroup Differences in Proficiencies and Proportions
In addition to the overall results, this report presents outcomes separately for a variety ofimportant subgroups. Many of these subgroups are defined by shared characteristics ofstudents, such as their gender, race/ethnicity, and the type of community in which theirschool is located. Other subgroups are defined by students' responses to backgroundquestions such as About how much time do you usualO spend each day on matherratkshomework? Still other subgroups are defined by the responses of the assessed students'mathematics teachers to questions in the mathematics teacher questionnaire.
As an example, one might be interested in answering the question: Do students whoreported spending 45 minutes or more doing mathematics homework each day exhibit higheraverage mathematics proficiency than students who reported spending 15 minutes or less?
To answer the question posed above, one begins by comparing the average mathematicsproficiency for the two groups being analyzed. If the mean for the group who reportedspending 45 minutes or more on mathematics homework is hiLher, one may be temptedto conclude that that group does have higher achievement than the group who reportedspending 15 minutes or less on homework. However, even though the means differ, theremay be no real difference in performance between the two groups in the population becauseof the uncertainty associated with the estimated average proficiency of the groups in thesample. Remember that the intent is to make a statement about the entire population, notabout the particular sample that was assessed. The data from the sample are used to makeinferences about the population as a whole.
As discussed in the previous section, each estimated sample mean proficiency (orproportion) has a degree of uncertainty associated with it. It is therefore possible that ifall students in the population had been assessed, rather than a sample of students, or if theassessment had been repeated with a different sample of students or a different, butequivalent, set of questions, the performances of various groups would have been different.Thus, to determine whether there is a rea/ difference between the mean proficiency (orproportion of a certain attribute) for two groups in the population, one must obtain anestimate of the degree of uncertainty associated with the difference between the proficiencymeans or proportions of those groups for the sample. This estimate of the degree ofumertainty called the standard error of the difference between the groups -- is obtainedby taking the square of each group's standard error, summing these squared standard errors,and then taking the square root of this sum.
Similar to the manner in which the standard error for an individual group mean orproportion is used, the standard error of the difference can be used to help determinewhether differences between groups in the population are real. The difference between themean proficiency or proportion of the two groups ± 2 standard errors of the differencerepresents an approximate 95 percent confidence interval. If the resulting interval includeszero, one should conclude that there is insufficient evidence to claim a real differencebetween groups in the population. If the interval does not contain Zell), the differencebetween groups is statistically significant (different) at the .05 level.
nsTHE 1990 NAEP TRIAL STATE ASSESSMENT 93

North Dakota
As an example, suppose that one were interested in detesmining whether the averagemathematics proficiency of eighth-pade females is higher than that of eighth-grade malesin a particular state's public schools. Suppose that the sample estimates of the meanproficiencies and standard errors for females and males were as follows:
GroupAverage
ProficiencyStandard
Error
Female 259 2.0
Mak: 255 2.1
The difference between the estimates of the mean proficiencies of females and males is fourpoints (259 - 255). The standard error of this difference is
Nri.02 + 2.12 = 2.9
Thus, an approximate 95 percent confidence interval for this difference is
Mean difference ± 2 standard errors of the difference =
4 ± 2 (2.9) = 4 ± 5.8 = 4 - 5.8 and 4 + 5.8 = -1.8, 9.8
The value zero is within this confidence interval, which extends from -1.8 to 9.8 (i.e., zerois between -!.8 and 9.8). Thus, one should conclude that there is insufficiept evidence toclaim a difference in average mathematics proficiency between the population ...feighth-glade females and males in public schools in the state.'
Throughout this report, when the mean proficiency or proportions for two groups werecompared, procedures like the one described above were used to draw the conclusions thatare presereed. .If a statement appears in the report indicating that a particular group hadhigher (or lower) average proficiency than a second group, the 95 percent confidenceinterval for the difference between groups did not contain zero. When a statement indicatesthat the average proficiency or proportion of some attribute was about the same for twogroups,. the confidence interval included zero, and thus no difference could be assumedbetween the groups. The reader is cautioned to avoid drawing conclusions solely on thebasis of the magnitude of the differences. A difference between two groups in the samplethat appears to be slight may represent a statistically significant difference in the populationbecause of the magnitude of the standard errors. Conversely, a difference that appears tobe large may not be statistically significant.
3 The procedure described above (especially the estimation of the standard error of the difference) is, in a strict
sense, only appropriate when the statistics being compared come from independent samples. For certaincomparisons in the report, the groups were not independent. In those eases, a different (and moreappropriate) estimate of the standard error of the difference was used.
94 THE. 1990 NAEP TIUAL STATE ASSESSMENT

North Dakota
The procedures described in this section, and the certainty ascribed to intervals (e.g., a 95percent confidence interval), are based on statistical theory that assumes that only oneconfidence interval or test of statistical significance is being performed. However, in eachchapter of this report, many different groups are being compared (i.e., multiple sets ofconfidence intervals are being analyzed). When one considers sets of confidence intervals,statistical theory indicates that the certainty associated with the entire set of intervals is lessthan that attributable to each individual comparison from the set. If one wants to hold thecertainty level for the set of comparisons at a particular level (e.g., .95), adjustments (calledmultiple comparison procedures) must be made to the methods described in the previoussection. One such procedure -- the Bonferroni method -- was used in the analyses describedin this report to form confidence intervals for the differences between groups whenever setsof comparisons were considered. Thus, the confidence intervals in the text that are basedon sets of comparisons are more conservative than those described on the previous pages.A more detailed description of the use of the Bonferroni procedure appears in the TrialState Assessment technical report.
Statistics with Poorly Detel mined Standard Errors
The standard errors for means and proportions reported by NAEP are statistics andtherefore are subject to a certain degree of uncertainty. In certain cases, typically when thestandard error is based on a small number of students, or when the group of students isenrolled in a small number of schools, the amount of uncertainty associated with thestandard errors may be quite large. Thrcughout this report, estimates of staward errorssubject to a large degree of uncertainty are followed by the symbol "!". In such cases, thestandard errors -- and any confidence intervals or significance tests involving these standardermrs -- should be interpreted cautiously. Further details concerning procedures foridentifying such standard errors are discussed in the Trial State Assessment technical report.
Minimum Subgroup Sample Sizes
Results for mathematics proficiency and background variables were tabulated and reportedfor groups defined by race/ethnicity and type of school community, as well as by genderand parents' education level. NAEP collects data for five racial/ethnic subgroups (White,Black, Hispanic, Asian/Pacific Islander, and American Indian/Alaskan Native) and fourtypes of communities (Advantaged Urban, Disadvantaged Urban, Extreme Rural, andOther Communities). However, in many states or territories, and for some regions of thecountry, the number of students in some of these groups was not sufficiently high to permitaccurate estimation of proficiency and/or background variable mults. As a result, data arenot provided for Cie subgroups with very small sample sizes. For results to be reported forany subgroup, a minimum sample size 62 students was required. This number wasdetermined by computing the ;ample size required to detect an effect size of .2 with aprobability of .8 or greater.
100
THE 1990 NAEP TRIAL STATE ASSESSMENT 95

North Dakota
The effect size of .2 pertains to the true difference between the average proficiency of thesubgroup in question and the average proficiency for the total eighth-grade public-schoolpopulation in the state or territory, divided by the standard deviation of thc proficiency inthe total population. If the true difference between subgroup and total group mean is .2total-group standard deviation units, then a sample size of at least 62 is required to detectsuch a difference with a probability of .8. Further details about the procedure fordetermining minimum sample size appear in the Trial State Assessment technical repolt
Describing the Size of Percentages
Some of the percentages reported in the text of the report are given quantitativedescriptions. For example, the number of students being taught by teachers with master'sdegrees in mathematics might be described as "relatively few" or "almost all," dependingon the size of the percentage in question. Any convention for choosing descriptive termsfor the magnitude of percentages is to some degree arbitrary. The descriptive phrases usedin the report and the rules used to select them are shown below.
Percentage Dascription of Text In Report
p = 0 None0 < p 5 10 Relatively few10 < p 5. 20 Some20 < p 5 30 About one-quarter30 < p 5 44 Less than half44 < p 5 55 About half55 < p 5 69 More than half69 < p 5 79 About three-quarters79 < p 5 89 Many89 < p < 100 Almost all
p = 100 AR
IC i
96 THE 1990 NAEP TRIAL STATE ASSESWENT

North Dakota
THE NATION'SREPORT
CARD
DATA APPENDIX
For each of the tables in the main body of the report that presents mathematics proficiencyresults, this appendix contains corresponding data for each level of the four reportingsubpopulations -- race/ethnicity, type of community, parents' education level, and gender.
102
THE 1990 NAEP TRIAL STATE ASSESSMENT 97

North Dakota
TABLE AS I Students' Reports on the Mathematics ClassI They Are Taking
PERCENTAGE OF STUDENTS ANDAVERAGE MATHEMATICS PROFICIENCY-
1910 NAEP TRIAL Elghth-gradeSTATE ASSESSMENT Mathematics Pre-alilihrit Atilibbni
TOTAL.
andPreliciency
Percentageand
Proliciency
Percenielleand
Preeciency
State 73 ( 2.0) 17 ( 1.9) 8 ( 1.0)277 ( 1.4) ( 2.4) 307 ( 4.4)
Nation d2 ( 2.1) 19 ( 1.9) 15 ( 1.2)
251 ( 1.4) 272 ( 2.4) 298 ( 2,4)
RACE/ETHNICITY
WhiteState 73 ( 2.1) 17 ( 2.0) 9 ( 1.2)
280 ( 1.1) 291 ( 2.4) 308 ( 4.7)
Nation 59 ( 2.5) 21 ( 2.4) 17 ( 1.5)259 ( 1.6) 277 ( 2.2) 300 ( 2.3)
HispanicState SO ( 6.1) 10 ( 4.3) 0 ( 0.0)
*OM ***)
Nation 75 ( 4.4) 8 ( 1.5)
240 ( 2.4) MM. 11,411 (
American IndianState 78 ( 4.8) 1 ( 1.2)
240 ( 4.1)i *411)
Nation 84 ( 5.7) 8 ( 72)...) ***( 2.7)
TYPE OF COMMUNITy
Advantaged urbanState 79 (
279 ( 3.6) 4. ***)14 (
***3.2)
Nation 55 ( 9.4) 22 ( 7.9) 21 ( 4.4)
bdranse rural269 ( 2.5)1
m)
State 75 ( 5.2) 19 ( 4.9) 5 ( 2.2)279 ( 3.2) 286 ( 2.1)1 277 ( 2.5)'
Nation 7'4 (24$. (
4.5)3.1)1
14 ((
5.0) 7 ( 2.2)
OtherState 70 (
276 (1.9)1.0)
18 (291 (
1.3)4.3)
10 ((
0.9).4)
Nation 61 ( 2.2) 20 ( 2.1) 18 ( 1.4)
251 ( 2.0) 272 ( 2.8) 294 ( 2.7)
The standard errors of the estimated statistics appear in parentheses. It can be said with about 95 percentcertainty that, for each population of interest, the value for the entire population is within ± 2 standard errorsof the estimate for the sample. The percentages may not total 100 percent because a small number of studentsreported taking other mathematics courses. ! Interpret with caution - the nature of the sample does not allowaccurate determination of the variability of this estimated mean proficiency. "* Sample sin is insufficient topermit a reliable estimate (fewer than 62 students).
r
98 THE 1990 NAEP TRIAL STATE ASSESSMENT

North Dakota
TABLE AS I Students' Reports on the Mathematics Class(ccetinued) I They Are Taking
PERCENTAGE OF STUDENTS ANDAVERAGE MATHEMATICS PROFICIENCY
1990 NAEP TRIALSTATE ASSESSMENT
Eighth-gradeMathematics
.,.__
Pre-algebra Algebra
.
TOTAL.
porcantdlleand
Pre *dem
Percentageand
Pradalency
Ponandapand
Pradahwicy
State 73 ( 2.0) 17 ( 1.9) ( 1.0)277 ( 1.4) 289 ( 2.4) 201 ( AA)
Nation 62 ( 2.1) 19 ( 1.9) "5 ( 1.2)251 ( 1.4) 272 ( 2.4) 290 ( 24)
PARENTS EDUCATION
HS nee-graduateState 67 ( 7.7)
259 ( 4.4)14.
04514 ( 7.8)
Nation 77 ( 3.7)241 ( 2.1)
13 ( 3,4)4.14 ( .11 3 ( 1.1).1m )
NS graduatState 81 ( 3.8)
270 ( 2.8)12 ( 2.9)
282 ( 3.5)15 ( 1.7))
Nation 70 2.8) 18 ( 2.4) 8 ( 1.1)249 ( 1.9) 288 ( 3.5) 277 5.2)
Same collegeState 73 ( 2.9)
279 ( 1.9)20 ( 2.7)
290 ( 5.0)8 ( 1.1))
Nation 60 ( 3.1) 21 ( 2.9) 15 ( 1.9)257 ( 2.1) 276 ( 2.8) 295 ( 3.2)
College graduateState 89 ( 2.2) 1$ ( 1.9) 11 ( 1.1)
263 ( 1.4) 294 ( 3.0) 316 ( 4.0)Nation 53 ( 2.7) ( 2.3) 24 ( 1.7)
259 ( 1.5) 276 ( 2.6) 303 ( 2.3)
GENDER
MaleSta,e 74 ( 2.5) 15 ( 2.2) 9 ( 1.1)
280 ( 1.6) 293 ( 2.7) 314( 6.0)Nation 63 ( 2.1) 18 ( 1.8) 15 ( 1.2)
252 ( 1.6) 275 ( 2.9) 299 ( 2.5)Female
State 72 ( 2.0) 18 ( 2.1) ( 1.4)274 ( 1.6) 285 ( 3.5) 300 ( 5.7)
Nation 61 t, 2.6) 20 ( 2.3) 15( 1.7)251 ( 1.5) 269 ( 3.0) 293 ( 2.8)
The standard errors of the estimated statistics appear in parentheses. it can be said with about 95 percentcertainty that, for each population of interest, the value "or the entire population is within ± 2 standard errorsof the estimate for the sample. The percentages may not total 100 percent because a small number of studentsreported taking other mathematics courses. ! Interpret with caution -- the nature of the sample does not allowaccurate determination of the variability of this estimated mean proficiency. *** Sample size is insufficient topermit a reliable estimate (fewer than 62 students).
NTHE. 1990 NAEP TRIAL STATE ASSESSMENT 99

North Dakota
TABLE A6 Teachers' Reports on the Amount of TimeStudents Spent on Mathematics HomeworkEach Day
PERCENTP.GE OF STUDENTS ANDAVERAGE MATHEMATICS PROFICIENCY
1460 NAEP TRIALSTATE ASSESSMEKi
None 15 Minutes 30 Minutes 45 Merman An Hour or]More
TOTAL
Perventageand
Profidency
1 ( 0.8)
( 03)«4 .)
1 ( 0.9)*MR ( eel
1 ( 0.3)+.)
0 ( 0.0)( "")
1 ( 0.8)**** ".)
0 ( 0.4)*** (.")
o ( 0.0)*****)
0 ( 0.0)
3 ( 2.1)( `")
0 ( 0.0)** ( ".)
0 ( 0.4)*** ( ***)
( 0.4)(
Percentageand
Proficiency
37 ( 2.6)279 ( 2.2)43 ( 42)
25C ( 2.3)
38 ( 2.9)283 ( 1.2)
39 ( 4.5)206 ( 2.2)
39 ( 8.9)041
46 ( 7.6)245 ( 3.0)1
51 (12.0)
74 (31.9)Mit 11141
39 ( 82)
61 (11.3)273 ( 3.1)1
35 ( 5.3)277 ( 5.6)68 (14.9)
253 ( 5.4)1
36 ( 2.9)281 ( 1.6)
37 ( 4.3)256 ( 3.1)
Percentageand
Preficiencar
51 ( 3.7)283 (1.6)43 ( 4,$)
296 ( 2.6)
52 ( 3.9)285 ( 1.5)45 ( 5.1)
270 ( 2.7)
43 ( 8.9)...)34 ( 8.8)
251 ( 4.2)1
21 ( 7.3)
22 (28.2)
28 ( 1.7)
32 ( 8.6)( "")
51 ( 7.9)286 ( 2.7)114 (10.9)
54 ( 3.3)281 ( 1.6)49 ( 5.1)
265 ( 2.5)
Percentageand
Prolidency
10 ( 1.6)262 ( 3,7)10 ( 1.9)
272 ( 5.7)1
9 ( 13)289 ( 4.3)
11 ( 2.4)277 ( 7,8)1
18 ( 4.2)
13 ( 2.9)iv*
2!) ( 8.8)
0 ( 0.0)
21 ( 2.2)
( 3.4)
10 ( 3.7)266 ( 7.8)1
( 5.6)
9 ( 1.3)293 ( 7.7)
10 ( 2.4)278 ( 8.8)1
Percentageand
Prondoncy
2 ( 93)
4 ( 0.9)278 ( 5.1)1
2 ( 0.3)44* ( .41
4 ( 0.9)279 ( 5.8)1
0 ( 0.0)«HI
( 2.1).41
*** ( ***)4 ( 4.8)
( "")
11 ( 4.2)
0.0)t
0 0. 1 )ite-41 ( *fit)
10 7.3)
1 ( 0.1)
4( 1.1)282 (11.6)1
State
Nation
RACE/ETHNICITY
WhiteState
Nation
HispanicState
Nation
American Ind lanState
Nation
TYPE OF COMMUNITY
Advantaged urbanState
Nation
Extreme noelState
Nation
OtherState
Nation
The standard errors of the estimated statistics appear in parentheses. It can be said with about 95 percentcertainty that, for each popufation of interest, the value for the entire population is within 2 standard errorsof the estimate for the sample. Interpret with caution -- the nature of the sample does not allow accuratedetermination of the variability of this estimated mean proficiency. ** Sample size is insufficient to permit areliable estimate (fewer than 62 students).
IC 5
100 THE 1990 NAEP TRIAL STATE ASSESSMENT

North Dakota
TABLE A6 Teachers' Reports on the Amount of Time(mutinued) Students Spent on Mathematics Homework
Each DayPERCENTAGE OF STUDENTS AND
AVERAGE MATHEMATICS PROFICIENCY
1990 NAEP TRIALSTATE ASSESSMEXT
_
None 15 Minutes
_
X Minutes 46 Minutes
.An Hoar or
More
TOTAL
State
Nation
PARENTS EDUCATION
141 non-grackiateState
Nation
H3 graduateState
Nation
Some collageState
Nation
Cc4lege graduateState
Nation
GENDER
MaleState
Nation
FemaleState
Nation
Penedo,end
Prefickncy
6 ( 4.0)(
( 0.6)16.
1 0.6)
0.5)
2 ( 1.3)***)
( 0.9)*** ( ***)
1 ( 0.6)(
( .")
Palmtopand
Proency
37 2.8)279 2.2)43 (4.2)
258 ( 2.3)
27 ( 6.3)444 ( 11411
49 ( 8.3)240 ( 2.8)
35 ( 3.9)
43 ( 5.2)249 ( 3.1)
35 ( 4.0)279 ( 2.7)44 ( 5.4)
265 ( 2.6)
39 ( 2.7)286 ( 2.4)40 ( 4.7)
285 ( 2.5)
36 ( 3.2)282 ( 2.0)44 ( 4.4)
257 ( 2.9)
35 ( 3.2)275 ( 2.9)41 ( 4.4)
255 (
Perventageand
Prolialency
51 ( 3.7)283 ( 1.8)43 ( 43)
208 ( 2.6)
80 ( 8 .0)*44 (
40 ( 8.1)248 ( 31)
53 ( 5.7)277 ( 2.6)44 ( 5.6)
258 ( 2.7)
b5 ( 4.7)288 ( 2.7)43 ( 5.8)
270 ( 3.6)
48 ( 3.4)288 ( 1.8)44 ( 4.1)
277 ( 3.0)
51 ( 3.7)285 ( 2.0)43 ( 4.3)
268 ( 2.9)
50 ( 4.4)281 ( 1.9)43 ( 4.7)
254 ( 2.8)
Perceitegeand
Prelidency
10 ( 1.8)282 ( 33)
10 ( 1.8)272 ( 5.7)1
18 ( 6.4)
8 (1.7)***)
11 ( 3.4)40R WO* )
9 ( 3.4)( *el
7 ( 22)Mr* ***)
( 2.1)9411 ( 1,111?)
10 ( 1.3)298 ( 5.1)
11 ( 2.3)287 ( 6.1)1
9 ( 1.1)290 ( 7.0)
9 ( 1.9)273 ( 7.3)1
11 ( 2.7)275 ( 6.0)1
11 ( 2.0)272 ( 5.7)1
Percentageand
Proficiency
2 ( 02)
4 ( 0.9)276 ( 5.1)1
0 ( 0.0)«4 ( 441
4 ( 1.3)
1 ( 0.5)
3 ( 1.0)( 0,1
4 ( 1.0)we* (
2 ( 0.5)( *Mr)
5 ( 1.3)*". (
1 ( 0.5)415 ( 1.3)
279 ( 7.7)1
2 ( 0.8)(
4 ( 0.9)( )
The standard errors of the estimated statistics appea; in parentheses. It can be said with about 95 percentcertainty that, for each population of interest, the vaivy for the entire population i: within ± 2 standard errorsof the estimate for the sample. 1 Interpret with caution - the nature of the sample does not allow accuratedetermination of the variability of this estimated mean proficiency. *** Sample size is insufficient to permit areliable estimate (fewer than 62 students).
1 6THE 1990 NAEP TRIAL STATE ASSESSMENT 101

North Dakota
TABLE A7 I Students' Reports on the Amount ef Time TheyI Spent on Mathematics Homework Each Day
PERCENTAGE OF STUDENTS ANDAVERAGE MATHEMATICS PROFICIENCY
1110 NAEP TRIALSTATE ASSESSMENT Nene 15 Minutes
_
30 Minutes a Minutes
_
An Hour orMare
TOTAL
Percentageand
Preildency
( 0.6)267 ( 2.6)
( 0.8)251 ( 2.8)
9 ( 0.7)290 ( 2.7)
10 ( 1.0)256 ( 3.4)
9 ( 43)MI*
12 ( 1.8). .416 ( 1.3)
44.
13 ( 5.3)*4* (
7 ( 1.4)
b ( 2$)*44)
8 ( 0.9)290 ( 2.1)
( 2.3)IhNI ( SIM
1 0 ( 0.9)284 ( 3.9)
9 ( 1.0)250 ( 3.8)
Percentageand
Preedency
31 t4)284 ( 1.4)
31 2.0)264 ( 1.9)
33 ( 1.5)285 ( 1.5)33 ( 2.4)
270 ( 1.9)
15 ( 5.8)*44(444)27 ( 3.0)
246 ( 3.6)
14 ( 4.8)144(444)30 (10.0)
**it ( .114)
36 ( 4.7)*Mb ( 4**
41 (123)278 ( 3.0)4
30 ( 2.0)285 ( 23)36 ( 4.6)
260 ( 3.5)1
30 ( 2.2)233 ( 2.0)
30 ( 1.8)263 ( 2.3)
Percentageand
Pandang
83 ( 1A)280 ( 1.5)32 ( 1.2)
2.13 ( 1.9)
32 ( 1.5)283 ( 1.4)32 ( 1.3)
270 ( 2.1)
46 ( 9.5)
30 ( 2.8)243 ( 3A)
36 ( 63)( "")
32 ( 4.8)444 ( ANN )
31 ( 6.6)280 ( 4.6)1
33 ( 2.0)278 ( 2.1)
31 ( 2.9)25$ ( 5.1)1
34 ( 1.7)283 ( 1.9)
32 ( 1.3)264 ( 2.3)
Percentageand
Madam
18 ( 1.1)278 ( 2.3)16 ( 1.0)
208 ( ta)
15 ( 1.0)282 ( 22)
15 ( 0.9)277 ( 2.2)
21 ( 7.0)go+,
17 ( 2.1)241 ( 4.3)
22 ( 3.0)( *el24 (142)
12 ( 3.9)
12 ( 3.3)(444*4*)
17 ( 15)276 ( 3.9)
18 ( 3.8)4.0 ( **I)
16 ( 1.6)279 ( 2.7)
15 ( 1.1)267 ( 2,1)
Percentageand
Preaching,
12 ( 0.7)279 ( 3.0)
12 ( 1.1)256 ( 3.1)
11 ( 0.9)284 ( 2.1)
11 ( 1.3)268 ( 33)
9 ( 4.6)( 4.114 ( 1.7)
.44)
6 ( 6.4)***)
OM* (
7 ( 3.4)
12 ( 1.2)273 ( 6.4)
7 ( 2.7)«.
10 ( 1.1)279 ( :47)13 ( 1.1)
258 ( 3$)
State
Nation
RACE/ETNNICITY
WhitsState
Nation
NispankState
Nation
American hiclianState
Nation
TYPE Of COMMUNITY
Advantaged urbanState
Nation
Extrante ruralState
Nation
OtherState
Nation
The standard errors of the estimated statistics appear in parentheses. It can be said with about 95 percentcertainty that, for each population of interest, the value for the entire population is within ± 2 standard errorsof the estimate for the sample. ! Interpret with caution - the nature of the sample does not allow accuratedetermination of the variability of this estimated mean proficiency. *" Sample size is insufficient to permit areliable estimate (fewer than 62 students).
117
102 THE 1990 NAEP TRIAL STATE ASSESSMENT

North Dakota
TABLE A7 I Students' Reports on the Amount of Time They(continued)
I Spent on Mathematics Homework Each DayPERCENTAGE OF STUDENTS AND
AVERAGE MATHEMATICS PROFICIENCY
1990 NAEP TRIALSTATE ASSESSMENT None 15 Minutes 30 Wades 45 Minutes An Hour or
More
TOTAL
Perantageand
Profidency
Percettageand
Proficiency
Percentageand
Protiodency
Parcentageand
Proficiency
Percentageand
lontficiency
State ( 0.0) 31 ( 1.4) 33 ( 1.4) 16 ( 1.1) 12 ( 0.7)287 ( 2.5) 284 ( 1.a) 280 ( 1.5) 218 ( 2.3) 279 ( 3.0)
NatIon 9 ( 0.8) 31 ( 2.0) 32 ( 12) 16 ( 1.0) 12 ( 1.1)251 ( 2.8) 284 ( 1.9) 2.3 ( 1.9) 208 ( 1.9) 258 ( 3.1)
PARENTS EDUCATION
14S nongraduateState 12 ( 5.0)
*44)40 ( 7.4) 28 (- ( 5.7) 15 ( 4.8)4 4 (- ( 2.1)..)
Nation 17 ( 3.0)-) 26 (248 (
3.3)4,0)
34 (246 (
4.4)2.6)
12 ( 2.5)) 10 ( 2.2))NS graduate
State 7 ( 1.6) 28 ( 2.4) 33 ( 2.8) 19 ( 2.4) 13 ( 1.9)278 ( 3.2) 210 ( 2.7) 270 ( 4.5) 271 ( 4.8)
Nation 10 ( 1.7) 33 ( 22) 31 ( 1.9) 16 ( 1.4) 11 ( 1.5)240 ( 4.2) 259( 3.2) 254 ( 2.4) 256 ( 2.8) 244 ( 3.4)
Some collegeState 9 ( 1.7) 28 ( 2.6) 32 ( 22) 49 ( 2.7) 12 ( 1.7)
*I* ( *1! ) 285 ( 2.7) 280 ( 2.8) 282 ( 3.9) 284 ( 4.2)Nation 9 ( 12)) 30 (
286 (2.7)3.0)
3$ (266 (
2.1)2.8)
14 (274 (
1.8)3.5)
11 ( 1.5))
College graduateState 10 ( 1.0) 33 ( 1.6) 34 ( 1.7) 13 ( 1.4) 10 ( 1.2)
294 ( 3.7) 289 ( 2.0) 289 ( 1.7) 285 ( 3.3) 287 ( 3.3)Nation 7 ( 0.9) 31 ( 3.4) 31 ( 2.0) 18 ( 12) 14 ( 1.9)
285( 3.6) 275 ( 2.0) 275 ( 2.5) 278 ( 3.2) 271 ( 2.8)
GENDER
MatoState 11 ( 1.0) 35 ( 1.7) 30 ( 1.4) 14 ( 1.2) 10 ( 1.1)
287 ( 3.6) 287 ( 1.7) 283 ( 2.5) 283 ( 2.4) 278 ( 4.8)Nation 11 ( 1.1) 34 ( 2.4) 29 ( 1.3) 15 ( 1.2) 11 ( 1.4)
255 ( 3.0) 264 ( 2.8) 266 ( 2.4) 285 ( 3.0) 258 ( 4.1)Fong'.
State 6 ( 1.0) 27 ( 1.7) 37 ( 2.1) 17 ( 1.6) 13 ( 1.2)286 ( 3.0) 280 ( 1.8) 277 ( 1.9) 274 ( 3.5) 280 ( 3.5)
Nation 7 ( 0.9) 28 ( 2.0) 35 ( 1.7) 17 ( 1.0) 13 ( 1.3)248 ( 4.1) 263 ( 1.5) 260 ( 2.0) 267 ( 2.4) 258 ( 3.3)....--.
The standard errors of the estimated statistics appear in parentheses. It can be said with about 95 percentcertainty that, for each population of interest, the value for the entire population is within ± 2 standard errorsof the estimate for the sample. *" Sample size is insufficient to permit a reliable estimate (fewer than 62students).
108THE 1990 NAEP TRIAL STATE ASSESSMENT 103

North Dakota
TABLE A8 I Teachers' Reports on the Emphasis Given ToSpecific Mathematics Content Areas
PERCENTAGE OF STUDENTS ANDAVERAGE MATHEMATICS PROFICIENCY
1990 NAEP 'TRIALSTATE ASSESSMENT
Numbers and Operadons Measurement i Geometry
HeavyEmphasis
Little or NoEmphasis
HeavyEmphasis
Utile or NoEmphasis
HeavyPnphasis
Little or NoEmphasis
TOTAL
Parnontageend
Preedinay
49 (283 ( 1.949 ( 3.8
280(1.8
Farcentageand
Praidancy
0.8)295 2.4)
15 2.1)287 34)
Paraintageand
Pranciency
277 5.017 9.0
250 8.8)
State
Nation
Hafftfia.,_,_IICITY
WineState 4$ ( 3.1) 11 ( 0.8) 13 ( 2.8)
288 ( 1.8) 298 1.9) 280 ( 50)4Nation 46 ( 3.7) 18 2.4) 14 ( 3.4)
267 ( 2.2) 289 3.5) 259 ( 8.9)4Hispanic
State 52 ( 8.8) 8 4.2) 9 ( 3.5)*NI ( **I n ..)
Nation 47 ( 8.7) 8 2.2) 23 ( 4.1)246 ( 4.8) ") ( ***)
American IndianState 60 ( 9.9) 0 0.0) 12 ( 4,5)
242 ( 2.7)1 *a. *441
Nation 84 (18.5) 6 8.9) 7 ( 8.7)( a" "41) a ( aa.)
TYPE OF COMMUNITY
'alvantaged urbanState 21 ( 4.7) 27 ( 4.7) 0 ( 0.0)
( *4 ) *MI ( )
Natpn 28 (13.0) 18 ( 4.2).404)
Extrema ruralState 51 ( 7.2) 3 ( 0.7) 6 ( 1.8)
284 ( 3.6) 296 ( 2.5)1 263 ( 7.5)1Nation 53 (12.4)
257 ( 7.1)1 .04( 3.6) 6 ( 4.9)
MawState 51 ( 3.4) 12 ( 1.1) 17 ( 4.3)
233 ( 1.7) 293 ( 3.3) 278 ( 6.3)1Nation 52 ( 4.1) 16 ( 2.7) 16 ( 3.9)
260 ( 2.3) 286 ( 3.6) 253 ( 7.1)1
Parcanfroa Paroaedsge Pannalagsand and and
Praliakinew Pralidonay Praisiannt
35( 23 (284 3.1 280 1.8 279 1.833 4.0 28 SA 21 3.3
272 ( 4.0 280 3.2 254 5.4
33 ( 3.2) 24 ( 32) 19 ( 1.9)290 ( 21) 281 ( 1.7) 283 ( 2.0)30 ( 4.7) 27 ( 4,4) 22 ( 34 )
277 ( 4.3) 265 ( 3.3) 273 ( 55)
46 ( 85) 23 ( 5.9) 6 ( 2.7)(
34 ( 5.8) 27 ( 6.8) 18 ( 5.5)255 ( 4.4)1 ( ***) ( 11")
62 (10.0) 11 ( 5.8) 301 95).4* ( *a) ( t.s.) mai
13 (15.5) 113 (19.7) 6 (10.4)( ahra) aaa ( aat) (
)20 ( 6.4)
40 (m 8.5) 3$ (267 (
9.4)4.9)1
39 ( 7.4) 18 ( 4.8)276 ( 5.0)1 279 ( 2.4)1
32 (41.7) 9 ( 8.1)265 ( 9.1)1 (
28 ( 2.4) 27 ( 4.4)288 3.1) 281 ( 2.9)
34 ( 5.3) 28 ( 4.8)270 ( 4.6) 200 ( 3.9)
( 2.4)( 44113 ( 3.2)
19 ( 4.6)257 ( 1.9)118 ( 7.9),)21 ( 1.6)
286 ( 2.5)24 ( 4.3)
285 ( 5.7)
The standard errors of the estimated statistics appear in parentheses. It can be said with about 95 percentcertainty that, for each population of interest, the value for the entire population is within ± 2 standard errorsof the estimate for the sample. The percentages may not total 100 percent because the "Moderate emphasis"category is not included. I Interpret with caution - the nature of the sample does not allow accuratedetermination of the variability of this estimated mean proficiency. *** Sample size is insufficient to permit areliable estimate (fewer than 62 students).
C
104 THE 1990 NAEP TRIAL STATE ASSESSMENT

North Dakota
TABLE A8 I Teachers' Reports on the Emphasis Given to(continued) i Specific Mathematics Content Areas
PERCENTAGE OF STUDENTS ANDAVERAGE MATHEMATICS PROFICIENCY
1960 NAEP TRIALSTATE ASSESSMENT
Numbers and Operation Monurement Geometry
HeavyEmphasis
Little or NoEmphasis
HeavyEmphasis
Little or NoEmphasis
HeavyEmphasis
tittle or NoEmphasis
iPsrantago
TOTAL
andProfeioney
49 ( 3.2)233 ( 1.9)49 ( 3.8)
200 ( 1.8)
40 ( 7.7)*we .,)60 ( 6.9)
251 ( 3.4)
50 ( 5.0)275 ( 3.5)55 ( 4.3)
259 ( 2.9)
50 ( 4.4)284 ( 3.8)4? ( 4.4)
265 ( 2.6)
( 3.0)289 ( 2.2)44 ( 4.1)
269 ( 2.8)
48(3.7)285 ( 1.8)48 ( 4.1)
261 ( 2.5)
50 ( 3.4)280 ( 3.0)51 ( 3.9)
260 ( 2.0)
Pareaniagoand
Pro Scieney
10 ( 0.8)295 (
15 ( 2.1237 ( 3.4
3.9)
7 ( 2.3)(
9 ( 22)**raj
11 ( 2.8)**.
9 ( 1.6)01* ( ffret)
17 ( 3.3)284 ( 4.1)1
12 ( 1.3)298 ( 3.9)
19 ( 2.4)298 ( 3.4)
10 ( 13)300 ( 5.8)
14 ( 2.1)287 ( 4.4)
11 ( 1.4)290 ( 3.9)
15 ( 2.4)288 ( 3.3)
Ponontageand
Proteiancy
13 ( 2.6)277 ( 5.0)117 ( 3.0)
250 ( 5.6)
19 ( 7.2)414r4f **41)
22 ( 5.3)( 414 ( 3.8)
270 ( 7.0)117 ( 3.9)
251 (
13 ( 2.9)***)
12 2.7)441
11 ( 2_5)237 ( 6.8)116 ( 3.3)
264 ( 7.2)1
11 ( 1.7)285 ( 4.5)17 ( 3.3)
258 ( 6.7)
14 ( 3.8)270 ( 8.6)117 ( 3.2)
241 ( 5.4)
Pareadagoand
Pro Waxy
35 ( 3.3)234 (33 ( 4.0
272 ( 4.0
29 ( 6.2)«in25 ( 5.3)
31 ( 5.1)276 ( 6.3)27 ( 5.0)
253 ( 4.7)4
38 ( 4.8)287 ( 5.0)39 ( 5.5?
279 ( 4.5)
35 ( 2.8)291 ( 3.9)37 ( 3.8)
283 ( 3.8)
36 ( 3.4)291 ( 3.6)32 ( 3.9)
275 ( 4.8)
34 ( 3.8)275 ( 4.6)35 ( 4.3)
268 ( 4.1)
Pareentageand
Pre Wow/
23 ( 3.0)280 ( 1.8)28 ( 3.8)
260 ( 3.2)
18 ( 5.5)*41
-32 ( 6.3)
25 ( 4.7)267 ( 3.1)127 ( 4.5)
255 ( 4.2)
24 ( 3.8)278 ( 3.1)27 ( 5.0)
262 ( 4.8)1
23 ( 3.1)291 ( 2.9)26 ( 3.4)
270 ( 3.8)
23 ( 2.9)231 ( 3.1)29 ( 4.1)
263 ( 3.8)
24 ( 3.8)280 ( 3.3)27 ( 3.9)
256 ( 3.3)
Pareentagoand
Pm/Wow'
20 ( 1.8)279 ( 1.8)21 ( 3.3)
264 ( 5.4)
26 ( 5.9)trilv Mel
20 ( 6.7)( 41
19 ( 3.4)266 ( 4.3)424 ( 5.1)
246 ( 4.8)1
20 ( 2.7)282 ( 4.6)23 ( 4.1)
270 ( 4.7)
19 ( 1.7)291 ( 3.5)21 ( 2.9)
280 ( 6.4)
21 ( 2.2)282 ( 2.9)20 ( 3.3)
266 ( 8.8)
18 ( 2.0)276 ( 3.4)23( 3-5)
263 ( 5.0)
State
Nation
PARENTS' EDUCATION
NS non-graduateState
Nation
ItS graduatState
Nation
Some wiles!'State
Nation
Co Neg. graduateState
Nation
GENDER
MatsState
Nation
Fans**State
Nation
The standard errors of the estimated statistics appear in parentheses. It can be said with about 95 percentcertainty that, for each population of interest, the value for the entire populat..in is within ± 2 standard errorsof the estimate for the sample. The percentages may not total 100 percent because the "Moderate emphas-is"category is not included. ! Interpret with caution - the nature of the sample does not allow accuratedetermination of the variability of this estimated mean proficiency. *** Sample size is insufficient to permit areliable estimate (fewer than 62 students).
I 1 0
THE 1990 NAEP TRIAL STATE ASSESSMENT 105

North Dakota
TABLE AS I Teachers' Reports on the Emphasis Given To(ccintinucd) I Specific Mathematics Content Areas
PERCENTAGE OF STUDENTS ANDAVERAGE MATHEMATICS PROFICIENCY
1990 NAEP TRIALSTATE ASSESSMENT
..
Data Analysis, Statistics, andProbabilitY
Algebra and Functions
,Heavy Emphasis
Little or NoEmphasis
Heavy EmphasisLittle or NoEmphasis
TOTAL
State
Nation
RACE/ETNNWITY
MN.State
Nation
HispanicState
Nation
Anvrican IndianState
Nation
TYPE OF COMMUNITY
Advantaged urbanState
Nation
Extreme ruralState
Nation
OtherState
Nation
Peroentageand
Proicioncy
9 2.6)296 3,7)1
14 2.2)264 4.3)
8 ( 2.9)292 ( 4.1)1
14 ( 2.4)276 ( 4.1)
8 ( 2.5)
15 ( 4.1)
27 ( 6.6)*4*
3 ( 42)
8 ( 0.9)276 ( 4.0)
5 ( 5.4)1114. ***
1 1 ( 4.7)289 ( 4,7)1
15 ( 2.9)267 ( 4.7)
peramtap Peradnisp Percedsidand and and
fortiidmitgr lorsiciency Prolkiercy
74 ( 2.6)2.6 ( 1.4)53 ( 4.4)
261 ( 2.0)
76 ( 2.5)268 ( 1.3)53 ( 5.0)
271 ( 3.1)
78 ( 8.0)
56 ( 6.3)246 ( 4.4)
24 ( 7.3)0-0")
82 (29.1)..**)
It** ( )
65 (19.4)284 ( 7.4)1
78 ( 4.6)287 ( 2.6)65 (18.9)
254 ( 6.7)1
70 ( 3.4)285 ( 1.6)$3 ( 52)
260 ( 3.4)
56 $.4)281 1.2)45 3.6)
275 2.5)
57 ( 3.3)283 ( 1.3)48 ( 4.2)
261 ( 3.0)
52 ( 82).44
46 ( 5.9)257 ( 4.0)1
42 (10.5)M.* ( *4)16 (21.5)
4,44 (
79 ( 4.7)
41 ( $.9)296 ( 7.9)I
54 ( 7.3)276 ( 1.8)33 ( al)
( 4.1P
56 ( 3.7)283 ( 1.9)47 ( 4.3)
276 ( 2.8)
( 1.0)266 ( 4.6)120 ( 3.0)
243 ( 3.0)
9 ( 2.1)272 ( 4.2)118 ( 2.8)
251 ( 3.3)
9 ( 5.5)
18 ( 42)*Mr ( *MI
8 ( 4,1)*04)
67 (51.6)
o ( 0.0)
12 5.2)269 ( 8.0)142 (16.0)
241 ( 5.9)1
8 ( 0.9)270 ( 4.6)
17 ( 3.3)245 ( 4.4)1
The standard errors of the estimated statistics appear in parentheses. It can be said with about 95 percentcertainty that, for each population of interest, the value for the entire population is within ± 2 standard errorsof the estimate for the sample. The percentages may not total 100 percent because the "Moderate emphasis"category is not included. ! Interpret with caution -- the nature of the sample does not allow accuratedetermination of the variability of this estimated mean proficiency. *** Sample size is insufficient to permit areliable estimate (fewer than 62 students).
106 THE 1990 NAEP TRIAL STATE ASSESSMENT
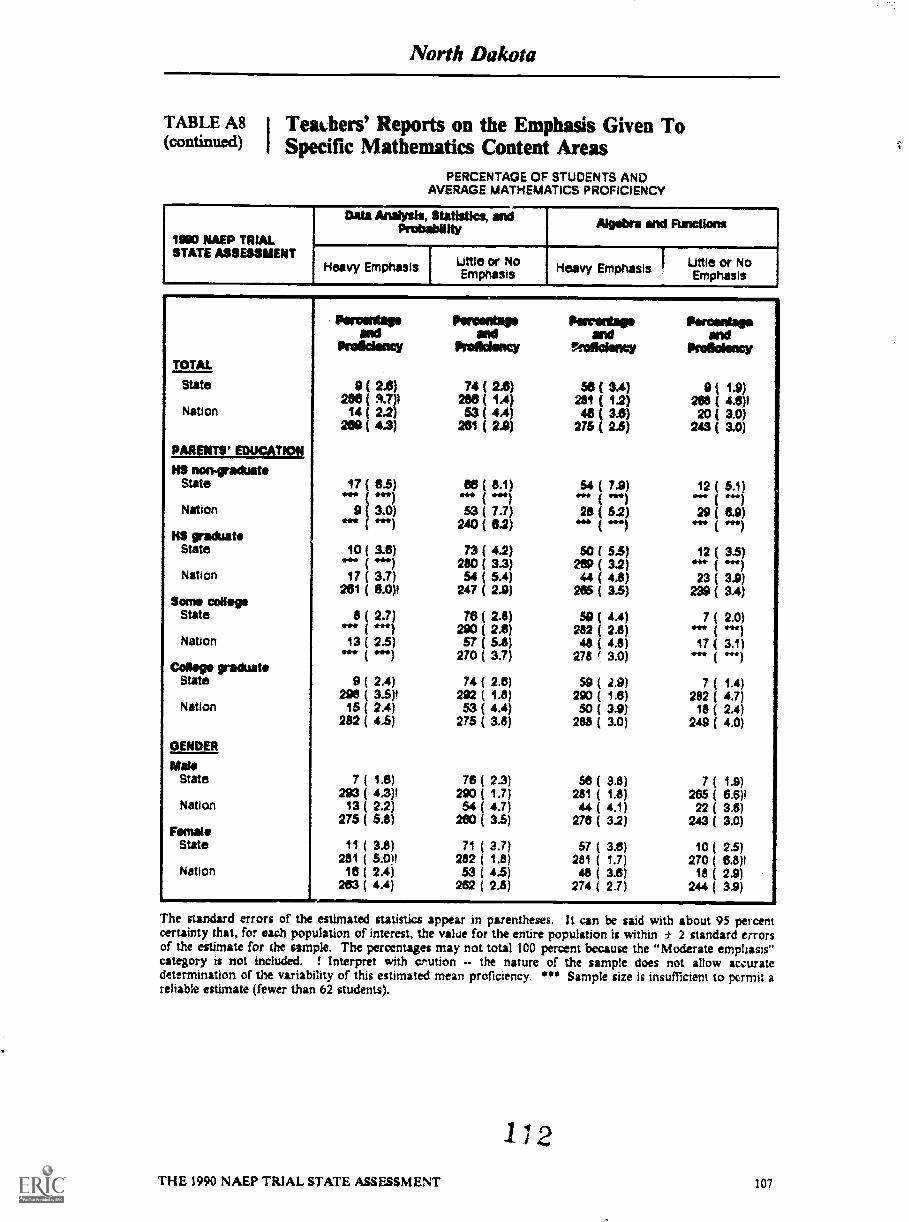
North Dakota
TABLE A8 I TeaLhers' Reports on the Emphasis Given To(continued) I Specific Mathematics Content Areas
PERCENTAGE OF STUDENTS ANDAVERAGE MATHEMATICS PROFICIENCY
1080 NAEP TRIALSTATE ASSESSMENT
Data Analysis, Statistics, andProbability Algebra ioxl Ravel loos
Heavy EmPhasis Little or NoEmpbasis
1 Little or Novy Emphasis .HeaEmphasis
..
TOTAL
Paramtagasad
Pro Many
Perventareand
Prediciancy
Parentageand
.rfaitaktany
Parrantneeand
Proldanay
State 0 ( 2.0) 74 ( 2.6) 58 ( SA) 9 ( 1.9)298 ( A.7)1 288 ( 1.4) 281 ( 1.2) 216 ( 4.6)1
Nation 14 ( 2.2) 53 ( 4.4) 46 ( 3.6) 20 ( 3.0)209 ( 4.3) 261 ( 24) 275 ( 2.5) 243 ( 3.0)
PARENTS' EDUCATION
HS noograduatorState 17 ( 8.5) 86 ( $.1)*4i 54 ( 7.9)
( *41Nation 9 (
.443.0) 53
240( 7.7)( 6.2)
28 (.44 (
5.2) 29 ( 8.9)
KS graduateState 10 (
44,3.6)4.**)
73280 (
( 4.2)3.3)
50 (269 (
5.5)3.2)
12 ( 3.5)e«.)
Nation 17 ( 3.7) 54 ( 5.4) 44 ( 4.8) 23 ( 3.9)261 ( 6.0)1 247 ( 2.9) 265 ( 3.5) 239 ( 3A)
Some collegeState 8 ( 2.7) 76
290 (( 2.8)
2.6)59 (
282 (4.4)2.8)
7 ( 2.0)«fre «in
Nation 13 ( 2.5) 57 ( 5.8) 48 ( 4.8) 17 ( 3.1)270 ( 3.7) 278 " 3.0) 1111*
Canasta graduat.State 9 ( 2.4) 74 ( 2.6) 59 ( 2.9) 7 ( 1.4)
296 ( 3.5)1 292 ( 1.8) 290 ( 1.6) 282 ( 4.7)Nation 15 ( 2.4) 53 ( 4.4) 50 ( 3.9) 18 ( 2.4)
282 ( 4.5) 275 ( 3.8) 283 ( 3.0) 249 ( 4.0)
GENDER
MaleState ( 1.6) 76 ( 2.3) 56 ( 3.8) 7 ( 1.9)
293 ( 4.3)1 290 ( 1.7) 281 ( 1.8) 265 ( 6.6)1Nation 13 ( 2.2) 54 ( 4.7) 44 ( 4.1) 22 ( 3.8)
275 ( 5.8) 260 ( 3.5) 278 ( 3.2) 243 ( 3.0)Female
State 11 ( 3.8) 71 ( 3.7) 57 ( 3.6) 10 ( 2.5)281 ( 5.0)1 282 ( 1.8) 281 ( 1.7) 270 ( 6.8)1
Nation 16 ( 2.4) 53 ( 4.5) 48 ( 3.6) 18 ( 2.9)263 ( 4.4) 262 ( 2.8) 274 ( 2.7) 244 ( 3.9)
11111011.MIl
The standard errors of the estimated statistics appear in parentheses. It can be said with about 95 percentcertainty that, for each population of interest, the value for the entire population is within ± 2 standard errorsof the estimate for the sample. The percentages may not total 100 percent because the "Moderate emphasis"category is not included. I Interpret with cr,ution -- the nature of the sample does not allow accuratedetermination of the variability of this estimated mean proficiency. *** Sample size is insufficient to permit areliable estimate (fewer than 62 students).
112THE 1990 NAEP TRIAL STATE ASSESSMENT 107

North Dakota
TABLE A9 I Ttachers' Reports on the Availability ofResources
PERCENTAGE OF STUDENTS ANDAVERAGE MATHEMATICS PROFICIENCY
1900 NAEP TRIAL I Oet AU the Resources I Mot Most of the I Get Some or None ofSTATE ASSESSMENT Need Routines I Need the Resoirces I Need
TOTAL
andProficiency
Percentageand
Proficiency
State 18 ( 2.7) 4 ( 2.9)279 ( 3.2) 282 ( 1.7)
Nation 13 ( 2.4) 56 ( 4.0)265 ( 4.2) 265 ( 2.0)
RACE/ETHNICITY
WhiteState 17 ( 2.7) 48 ( 2.7)
281 ( 2.8) 285 ( 1.1)
Nation 11 ( 2.5) 58 ( 4.6)275 ( 3.5)1 270 ( 2.3)
HispeninState 33 ( 7.3) 41 ( 9.2)
Nation 23 ( 7,6) 44 ( 4.9)246 ( 7.7)! 250 ( 2,9)
American IndianState 3 ( 1.4)
"4150 (11.5)
0+4
Nation 6 (***
7.4) 72 (26.8)
TYPE Of COMMUNITY
Advantaged urbanState
( 114437 ( 4.6)
***)
Nation 38 ( 9.2) 59 ( 8.9)272 ( 8.5)1 288 ( 1.3)1
Extreme ruralState 20 ( 6.3) 43 ( 6.8)
287 ( 1.7)1 276 ( 3.7)
Nation 2 (44,4,
2.6) 54 (10.4)260 ( 8.8)1
OtherState 17 ( 3.3) 53 ( 3.3)
272 ( 3.5)1 286 ( 1.3)
Nation 11 ( 2.9) 58 ( 5.4)265 ( 3.9)1 264 ( 2.1)
Percentageand
ProRcHetcy
35 ( 3.4)282 ( 1.8)31 ( 4.2)
asi ( 2.9)
35 ( 3.5)285 ( 1.7)30 ( 4.6)
267 ( 3.3)
26 ( 7.0)1111ht 111P1
31 ( 7.7)244 ( 3.0)1
47 (10.9)24$ ( 1$)22 (20.7)
4,4*
40 ( 3.0)***)
4.)
37 ( 8.5)282 ( 3.5)143 (10.3)
257 ( 5.0)1
31 ( 2.8)280 ( 1.2)
31 ( 5.6)263 ( 4.2)
The standard errors of the estimated statistics appear in parentheses. ft can be said with about 95 percentcertainty that, for each population of interest, the value for the entire population is within ± 2 standard errorsof the estimate for the sample. ! Interpret with caution -- the nature of the sample does not allow accurate
determination of the variability of this estimated mean proficiency. *" Sample size is insufficient to permit areliable estimate (fewer than 62 students).
108 THE 1990 NAEP TRIAL STATE ASSESSMENT

North Dak9ta
TABLE A9 I Teachers' Reports on the Availability of(continued) I Resources
PERCENTAGE OF STUDENTS ANDAVERAGE MATHEMATICS PROFICIENCY
1910 NAEP TRIAL I Ost AN the Roams* 1 I Get Most of the I OM Some or Nona ofSTATE ASSESSMENT Mod Resources I Need the Respires* I Nomad
TOTALProlding
ParcoNageant
Nr8Sokacy
Iherosslap
PreNdaNcy
State 18 ( 2.7) 411 ( 88(3.4)279 ( 3.2) 262 ( 1.7 282 ( 14)
Nation 13 ( 2.4) 31 ( 4.2)265 ( 42) 205 ( 2.0) 261 ( 2M
PARENTS' ECKMATION
NS non-graduateState 18 ( 6.8)
(52 ( 7.7) 30 ( 65).4* (
Nation 8 ( 2.8) 54 ( b.7) 38 ( 63)he* ( eel 244 ( 2.7) 249 ( 3.5)4NS graduats
State 17 ( 3.7) 43 ( 4.3) 40 ( 5.7)( 4.9)1 274 ( 4.0) 215 ( 3.2)
Nation 10 ( 23) 54 ( 4.9) 36 ( 4.9)253 ( 4.8)1 250 ( 1.9) 258 ( 2.8)
Some collsgsState 20 ( 3.8) 49 ( 3.9) 31 ( 3.7)
293 ( 5.4) 264 ( 1.9) 282 ( 33)Nation 52 ( 4.3) 25 ( 4.1)Off ( 289 ( 2.5) 267 ( 3.8)
Collage graduatoState 17 ( 3.0) 49 ( 3.1) 34 ( 3.1)
285 ( 2.0) 289 ( 1.9) 269 ( 13)Nation 15 ( 2.9) 58 C 4.9) 30 ( 5.1)
278 ( 5.4)4 2/6 ( 2.2) 273 ( 3.7)
GENDER
UstiState 18 ( 2.9) 49 ( 3.5) 35 ( 3.8)
281 ( 3.1) 28$ ( 2.0) 284 ( 2.2)Nation 13 ( 2.6) 57 ( 4.0) 30 ( 4.0)
264 ( 5.0)1 255 ( 2.5) 264 ( 3.3)Facials
State 20 ( 2.8) 48 ( 2.9) 34 ( 3.6)277 ( 4.2) 279 ( 2.6) 279 ( IA)
Nation 13 ( 24) 55 ( 4.4) 32 ( 4.7)286 ( 3.9) 284 ( 2.0) 257 ( 3.0)
The standard errors of the estimated statistics appear in parentheses. It can be said with about 95 percentcertainty that, for each population of interest, the value for the entire population is within * 2 standard errorsof the estimate for the sample. ! Interpret with caution - the nature of the sample does not allow accuratedetermination of the variability of this estimated mean proficiency. *** Sample size is insufficient to permitreliable estimate (fewer than 62 students).
THE 1990 NAEP TRIAL STATE ASSESSMENT 109

North Dakota
TABLE Al Oa I Teachers' Reports on the Frequency of SmallGroup Work
PERCENTAGE OF STUDENTS ANDAVERAGE MATHEMATICS PROFICIENCY
1900 NAEP MALSTATE ASSESSMENT
,
At Least Once a Weak Leas Than Ones a Week Now
TOTAL
Percentageand
Preadency
Peramtageand
proderia
Percentageand
Prelidencg
State 38 ( 3.3) 3.1) 18 ( 2.1)281 ( 2.5) 284 1.5) 279 ( 2.5)
Nation 50 ( 4A) 43 4.1) 8 2.0)200 ( 2.2) 284 ( 2.3) 277 sAp
RACEMTHNOTY
State 37 ( 3.3) 44 ( 3.7) 19 ( 2.2)285 ( 1.7) 288 ( 1.5) 280 ( 2.0)
Nation 49 ( 4.8) 43 ( 4.5) ( 2.3)205 ( 2.7) 271 ( 22) 285 ( 4.9)I
NkpartIcState 38 (
44, (8.3)*44)
44 ( OA)0.fr.)
18 ( 5.2)1111
Nation 64 (246 (
7.2)2.5)
32 ( 6.9)247 ( 8.3)1
4 ( 1.4)..**)
American WienState 80 (10.4) 33 ( 0.3)
248 ( 4.8)1( 4.0),.)
Nation 18 (24.3) 80 (27.2) 2 ( 32)(
TYPE Of COMMUNITY
Advantaged urbanState 32 ( 4.2) 40 ( 6.4) 28 ( 2.2)
Nation 39 (22.9) 41 (17.9)273 ( 6.0)1
20(12.2)..**)
Extrema ruralState 37 ( 7.2) 51 ( 8.8) 12 ( 4.5)
278 ( 4.9)1 285 ( 2.6)1 275 ( 52)1
Nation 35 (14.8) 56 (17.1) ( 9.8)
255 ( 55)1 258 ( 5.9)! (
OtherState 42 ( 4.3) 42 ( 3.4) 18 ( 1.8)
283 ( 2.8) 283 ( 1.4) 281 ( 2.5)
Nation 50 ( 4.4) 44 ( 4.5) 8 ( 1.8)
260 ( 2.4) 264 ( 2.8) 277 ( 8.3)1
The standard errors of the estimated statistics appear in parentheses. It can be said with about 95 percentcertainty that, for each population of interest, the value for the entire population is within ± 2 standard errorsof the estimate for the sample. I Interpret with caution -- the nature of the simple does not allow accuratedetermination of the variability of this estimated mean proficiency. *** Sample size is insufficient to permit areliable estimate (fewer than (2 students).
1
110 THE 1990 NAEP TRIAL STATE ASSESSMENT

North Dakota
TABLE AlGa I Teachers' Reports on the Frequency of Small(mtinued) I Group Work
PERCENTAGE OF STUDENTS ANDAVERAGE MATHEMATICS PROFICIENCY
19110 NAEP TRIALSTATE ASSESSMENT
, .
At Least Once a Week"i
Less Mum Once a Week
.
Moo r
TOTAL
640:0661140and
peldiale081
36 (261 ( 2.550 ( 4A
200 ( 2.2
PqramiageaW
Pre4kinney
43 ( 3.7)204 1.5!43 (4.1)
264 (2.3)
Panatelaand
Maslow
16 ( 2.1)279 ( 24)
( 2.0277 ( 5A)I
State
Nation
PARENTS EDUCATION
NS non-graduateState 44 ( 8.5) 35 ( 7.6) 22
MIN/( 7.5)( 111
Nation 60 ( 8.4) 39 ( 6.5) /.4)244 ( 3.2) 244 ( 3.2)1 Ns* ( Mel
NS graduateState 39 ( 5.1) 44 ( 8.0) 17 ( 3.4)
273 ( 4.5) 275 ( 2.9) 268 ( 5.2)Nation 49 ( 4.8) 45 ( 5-1) 0 ( 2.5)
252 ( 2.8) 257 ( 2.7)Some college
State 41 ( 4.2) 41 ( 4.2) 17 ( 2.7)283 ( 3.8) 285 ( 22) 262 ( 3.2)
Nation 51 ( 52) 42 ( 5.1) 7 ( 2.3)266( 3 1) 268 ( 32)
College graduatState 37 ( 3.3) 44 ( 3.4) 19( 2.1)
288 ( 2.3) 291 ( 1.8) 286 ( 2.9)Nation 46 ( 5.2) 43 ( 4.4) 11 ( 2.7)
271 ( 2.8) 278 ( 3.0) 285 ( 4.9)1
GENDER
MaliState 37 ( 3.5) 45 ( 3.9) 18 ( 2.1)
284 ( 2.8) 287 ( 1.8) 281 ( 2.4)Nation 50 ( 4.5) 42 ( 4.0) 8 ( 2.1)
261 ( 3.0) 265 ( 3.1) 278 ( 5.3)4Female
State 39 ( 3.7) 42 ( 3.6) 19 ( 2.9)277 ( 3.3) 281 ( 1.9) 276 ( 3.3)
Nation 50 ( 4.7) 43 ( 4.7) 7 ( 2.1)259 ( 2.2) 263 ( 2.1) 275 ( 8.6)1
The standard errors of the estimated statistics appear in parentheses. It can be said with about 95 percentcertainty that, for each population of interest, the value for the entire population is within 2 standard errorsof the estimate for the sample. ! Interpret with caution -- the nature of the sample does not allow accuratedetermination of the variability of this estimated mean proficiency. *" Sample size is insufficient to permit areliable estimate (fewer than 62 students),
THE 1990 NAEP TRIAL STATE ASSESSMENT II I

North Dakota
TABLE AlOb I Teachers' Reports on the Use of Mathematicali Objects
PERCENTAGE OF STUDENTS ANDAVERAGE MATHEMATICS PROFICIENCY
MO NAEP TRIALSTAT SESSMENTE AS
I.,At Least Once a Week Laos Thin Once a Weak
-Never
TOTAL
State
Nation
RACE/ETHNICITY
WhiteState
Nation
Mica*State
Nation
American WienState
Nation
TYPE OF COMMUNITY
Advantaged urbanState
Nation
Extreme ruralState
Nation
OtherState
Nat ,
Ihnotagsawl
Proficiency
21( 2.7)279 ( 1.3)
22 ( 3.7)254 ( 3-2)
20 ( 2.8)283 ( 1.3)
17 ( 4.0)261 ( 3.8)1
26 ( 6.6)
39 ( 7.5)247 ( 3.8)
34 ( 8.8)M101 ( *NI78 (34.6)
o ( 0.0)
23 (14.4)Te,
22 ( 7.0)275 ( 2.4)1
27 (14.9)at44 .41
20 ( 2.1)282 ( 1.8)
19 ( 4.3)253 ( 3.9)1
Persontageand
Praidarto
74 2.9)261 1,5)09 3.9)
263 1.9)
75 ( 2.9)264 ( 1.1)72 ( 42)
2.1)
89 ( 7.0)
55 ( 7.3)245 ( 3,6)f
06 ( 8.8)240 ( 4.7)1
22 (34.6)( *41
100 ( 0.0)288 ( 2.7)
63 (11.5)27$ ( 5.8)1
89 ( 7.1)280 ( 3.1)
65 (14.8)262 ( 2.8)I
73 ( 2$)282 ( 1.7)72 ( 5.0)
263 ( 2.2)
Paroolagsend
Praildency
5 0.9)4,41
9 2.6)282 ( 5.9)1
5 ( 1.1)(
10 ( 2.7)288 ( 62);
5 ( 5.0)( 0.*)
7 ( 2.6)4.44,
0 ( 0.0)
o ( 0.0).")
( 0.0)*** (15 ( 9.3)
*** ( ***)
2 ( 2.2)..**)
8 ( 3.9)
7 ( 1.0)
9 ( 32)281 ( 7,1)1
The standard errors of the estimated statistics appear in parentheses. It can be said with about 95 percentcertainty that, for each population of interest, the value for the entire population is within ± 2 standard errorsof the estimate for the sample. Interpret with caution -- the nature at' the sample does not allow accuratedetermination of the variability of this estimated mean proficiency. *** Sample size is insufficient to permit areliable estimate (fewer than 62 gut-lents).
112 THE 1990 NAEP TRIAL STATE ASSESSMENT

North Dakota
TABLE A lOb I Teachers' Reports on the Use of Mathematical(continued) I Objects
PERCENTAGE OF STUDENTS ANDAVERAGE MATHEMATICS PROFICIENCY
1990 NAEP TRIALSTATE ASSESSMENT
_
At Least Once a weak Less Than Once a Week Kamer
TOTAL
Peroantigeand
Proliciona
Parnerdagoand
Prolloionoy
Poroaniagaand
Proficiency
State 21 ( 2.7)279 ( 1.9)
74 ( 2.9)281 ( 1.3)
5 ( 0.9)( *elNation 22 ( 3.7) 09 ( 3.9) 9 ( 2.6)
234 C 3.2) 263 ( 1.9) 282 ( 5.9)1
PARENTS EDUCATION
KS non-graduateState 35 ( 7.5) 58 ( 6.0)rrr cowl ( 4.6)err ( rrr)Nation 25 ( 5.6) Oa ( 7 2) 9 ( 6.5)val 243 ( 22)
NS graduateState 24 ( 4.6) 74 ( 4.7) 2 ( 1.0)
272 ( 2.1) 272 ( 2.9)Nation 23 ( 4.8)
246 ( 4.0)1( 5.3)
255 ( 2.2)7 ( 2.8)rri
$om. collar)State 20 ( 4.1)
284 ( 2.9)173 ( 4.4)
281 ( 2.4)( 2,0)rr. (
Nation 18 ( 4.0) 73 ( 4.3) 9 ( 2.4)261 ( 4.4)i 289 ( 2.3)
College graduateState 18 ( 22) 78 ( 2.8) 6 ( 1.7)
287 ( 22) 289 ( 1.6)Nation 20 ( 3.9) 69 ( 3.7) 11 ( 2$)
266 ( 3.5)1 274 ( 2.2) 297 ( 4.2)1
GENDER
MaleState 21 ( 3.2)
279 ( 2.4)75 ( 3.2)
285 ( 1.6)4 ( 0.9)
rpr «inNation 22 ( 4.1) 69 ( 4.1) 8 ( 2.0)
265 ( 4.1) 265 ( 2.1) 267 ( 7.2)1Female
State 20 ( 2.9) 74 ( 3.1) 6 ( 1.2)278 ( 2.6) 277 ( 2.1)
Nation 21 ( 3.6) 69 ( 4.2) 10 ( 3.3)254 ( 3.3) 262 ( 1.9) 278 ( 6.0)1
The standard errors of the estimated statistics appear in parentheses. It can be said with about 95 percentcertainty that, for each population of interest, the value for the entire population is within ± 2 standard errorsof the estimate for the sample. ! Interpret with caution - the nature of the sample does not allow accuratedetermination of the variability of this estimated mean proficiency. *** Sample size is insufficient to permit areliable estimate (fewer than 62 students).
1 ; 8
THE 1990 NAEP TRIAL STATE ASSESSMENT 113

North Dakota
TABLE Alla Teachers' Reports on the Frequency ofMathematics Textbook Use
PERCENTAGE OF STUDENTS ANDAVERAGE MATHEMATICS PROFICIENCY
1900 MEP TRIALSTATE ASSESSMENT
Almost boy Day Savarai Times a Wm*About Once a Week or
Lass
TOTAL
Pareantaaand
Pra Salem
79 ( 33)262 ( 1.1)82 ( 3.4)
207 ( 1.8)
80 ( 3.2)284 ( 1.0)64 ( 3.7)
272 ( 1.9)
79 ( 7.4)
61 ( 6.8)251 ( 3.1)
42 (10.6)2413 ( 3.9)i
15 (25.9)
83 (15.9)283 ( 7.3)1
77 ( 8.6)281 ( 1.4)50 (10.6)
288 ( 4.0)!
79 ( 1.4)282 ( 1$)63 ( 3.9)
2e1 ( 2.3)
Peraente86 Poreentagaand and
Prolkilancy Praidenq
18 ( 3.4) 5 ( 0.3)260 ( 56)1 ipen
31 ( 3.1) 1.8)254 ( 2.9) 260 ( 5.1$
14 ( 3.3 6 ( 0.4).44(4.4)268 ( 3.5)128 ( 3.2) 8 ( 2.3)
264 ( 3.4) 284 ( 5.4)!
15 ( 8.0) ( 5.5)«hp
32 ( 5.3) 8 ( 2.3)240 ( 4.3)1 44,1
5$ (10.6) 0 ( 0.0).kik .4.9) 444 «al83 (28.3) 2 ( 3.0)
0,4 44)(
0 ( 0.0) 28 ( 1.7)4) 4,123 ( 5.2) 14 (14.6)
*V* ( IN* )
23 ( $.8) 0 ( 0.0)277 ( 9.4)140 (10.0) 10 ( 7.3)*** )247 ( 7.6)1
14 ( 1.2) 8 ( 0.4)282 ( 4.2)
31 ( 3.5) ( 1.9)255 ( 3.1) 257 ( 5,8)1
State
Nation
RACE/ETHNICITY
WhiteState
Nation
HispanicState
Nation
American ImilanState
Nation
TYPE Of COMMUNITY
Advantaged urbanState
Nation
Extrema nralState
Nation
OtherState
Nation
The standard errors of the estimated statistics appear in parentheses. It can be said with about 95 percentcertainty that, for each population of interest, the value for the entire population is within * 2 standard errorsof the estimate for the sample. ! Interpret with caution -- the nature of the sample does not allow awuratedetermination of the variability of this estimated mean proficiency. *** Sample 6i2e is insufficient to permit areliable estimate (fewer than 62 students).
114 THE 1990 NAEP TRIAL STATE ASSESSMENT

North Dakota
TABLE Al la I Tembers' Reports on the Frequency of(continued) Mathematics Textbook Use
PERCENTAGE OF STUDENTS ANDAVERAGE MATHEMATICS PROFICIENCY
1990 1,11EP TRIALSTATE ASSESSMENT
Aknost EVary Day Several Times a Week About Ones a Mask orLoss
TOTAL
Percontesetand
Prediciency
Poroontegoand
Pronciency
Percoatagoand
Proficiency
State 79 (282 (
3.3)1.1)
16 (2$0 (
34)5.6)1
5 («h.
0.3)
Nation 62 ( 3.4) 31 ( 3.1) ( 1.8)267 ( 1.8) 264 ( 2.9) 200 ( 5.1)1
PAgENTS' EDUCATION
NS not-graduateState 74 ( 6.2) 26 ( 62) 0 ( 0.0)
259 ( 4.1)1 ( ***)Nation 67 (
245 (5.5)3.2)
27 (.44 (
52)
HS graduateState 75 ( 5.7) 22 ( 5.7) 3 ( 0.8)
272 ( 2.4) 275 ( 7.4)1Nation 61 ( 4.4) 34 ( 3.7) ( 1.5)
257 ( 2.5) 250 ( 2.9) ( ***/Some coilog.
Ptate 84 ( 4.0) 12 ( 4.0) 5 ( 0.8)284 ( 1.9) ( "")
Nation 68 ( 42) 26 ( 3.7) 8 ( 1.9)272 ( 2.7) 258 ( 52) ( "")
Cottage graduateState 80 ( 3.1) 13 ( 3.1) ( 0.5)
289 ( 1.4) 290 ( 6.7)1 ( ***)Nation 61 (
281 (4.0)2.2)
31 (265 (
3.9)3.1)
( 3.1)*** ( ese)
GENDER
MaleState 78 ( 3.8) 17 ( 3.9) 5 ( 0.7)
284 ( 1.4) 287 ( 5.1)1Nation 60 ( 3.7) 33 ( 3.4) ( 1.9)
269 ( 2.1) 256 ( 3.6) 281 ( 0.7)1Female
State 60 ( 3.1) 15 ( 3.0) 6 ( 0.5)280 ( 1.5) 270 ( 8.9)1
Nation 65 ( 3.8) 26 ( 3.3) ( 2.2)266 ( 1.8) 253 ( 2.5)
The standard errors of the estimated statistics appear in parentheses. It can be said with about 95 percentcertainty that, for each population Of interest, the value for the entire population is within ± 2 standard errorsof the estimate for the sample. ! Interpret with caution - the nature of the sample dots not allow accuratedetermination of the variability of this estimated mean proficiency. * Sample size is insufficient to permit areliable estimate (fewer than 62 students).
THE 1990 NAEP TRIAL STATE ASSESSMENT 115

North Dakota
TABLE Al lb I Teachers' Reports on the Frequency ofMathematics Worksheet Use
PERCENTAGE OF STUDENTS ANDAVERAGE MATHEMATICS PROFICIENCY
1990 NAEP TRIAL At Lust Several TknesSTATE ASSESSMENT a WM About Once a Wuk Lm than Weeny
._
TOTAL
Percentageand
Praldensy
Perventageand
Prellatency
Percentagesatil
Prelkflancy
State S7 ( 2.5) 34 ( 3.3) 20 ( 2.1)279 ( 2.1) 201 1.5) 286 ( 2.3)
Nation 34 ( 3.8)256 ( 23)
33 ( $.4)200 ( 2.3) 324 "27 .712
RACE/ETHNICITY
MitaState 38 ( 2.8) 33 ( 3.5) 31 ( 2.9)
283 ( 1.1) 285 ( 1.4) 239 ( 2.2)Nation 32 ( 4.1) 33 ( 3.5) ( 3E)
264 ( 2.7) 284 ( 22) 279 ( 2.9)
HispanicState 40 ( 9.1)
HP* ( 414143 ( 7.8)
WS* 114117 ( 1.4)
a.*
Nation 41 7.7) 26 ( 5.3) 33 ( 7.5)
242 ( 3.2)I 244 ( 5.1)I 257 ( 2.3)1
&nods= MienState 54 (11.3)
4.** (44 (10.8)
*fir2 ( 1.1)
Nation 10 (18.8) 78 (362).41
13 (18.5)OitT 14111
TYPE Of COMMUNITY
Advantaged urbanState 41 ( 1.9)
.44 ( ...)32 ( 5.6)( 4 ) 28 ( 0.6)
*** ( . )Nation 59 (13.9) 20 ( 8.0) 21 ( 8.2)
273 ( 3.4)1....* ( 444.) 0*4 ( *** )
Extreme ruralState 37 ( 5.8) 32 ( 6,0) 31 ( 5,6)
278 ( 5.3) 278 ( 3.0)1 286 ( 3.7)1
Nation 27 (14.3)..... ( .t.g.)
49 (12.7)258 ( 8.7)f
24 (10,1). ( ,,,,,)
WhirrState 39 ( 2.4) 36 ( 4.0) 24 ( 2.7)
279 ( 1.3) 283 ( 2.4) 285 ( 2.7)
Nation 30 ( 4.4) 35 ( 4.3) 36 ( 4.2)256 ( 3.3) 259 ( 2.8) 272 ( 2.9)
The standard errors of the estimated statistics appear in parentheses. It can be said with about 95 percent
certainty that, for each population of interest, the value for the entire population is within t 2 standard errors
of the estimate for the sample. ! Interpret with caution -- the nature of the sample does not allow accurate
determination of the variability of this estimated mean proficiency. *** Sample size is insufficient to permit a
reliable estimate (fewer than 62 students).
116 THE 1990 NAEP TRIAL. STATE ASSESSMENT

North Dakota
TABLE Al lb I Teachers' Reports on the Frequency of(continued) I Mathematics Worksheet Use
PERCENTAGE OF STUDENTS ANDAVERAGE MATHEMATICS PROFICIENCY
MU NAEP TRIALSTATE ASSESSMENT
At Least Several Timesa Week About Once a Week Less than Weekly
tom.
Percentageand
Proficiency
Peroentageand
Proidancy
Percentageand
Proficiency
state 37 ( 34 ( 3.3) 29 ( 2.7)279 ( 2.1 2$1.( 1.6) 288 ( 2.3)
Nation 34 ( 3.11 32 ( 3.8)2se 2.3) 200" 274 ( 2.7)
PANBITS' EDDCATiOil
NS non-graduateState 43
(( 8.1)«el 34 ( 8.8) 23 ( 7.4),.)
Nation 35239
( 8.0)( 3.5)
29 (*N. (
6.3) 30 (250 (
8.9)4.5)1
NS graduateState 33 ( 3.8) 39 ( 4.6) 27 ( 3.9)
270 ( 4.0) 273 ( 3.0) 278 ( 5.1)Nation 35 ( 5.3) 36 ( 4.5) 30 ( 4.8)
250 ( 3.6) 250 ( 2.7) 283 ( 3,4)$0.1141 college
State 38 ( 3.9) 32 ( 4.2) 31 ( 3.8)280 ( 2.6) 285 ( 3.8) 258 ( 3.2)
Nation 33 ( 4.7) 32 ( 4.0) 35( 4.1)200 ( 2.8) 286 ( 4.2) 278 ( 2.8)
College graduateState 37 ( 2.5) 32 ( 3.1) 31 ( 2.9)
287 ( 2.2) 288 ( 2.2) 292 ( 2.0)Nation ( 3.8) 32 ( 3.4) 33 ( 3.5)
264 ( 2.8) 271 ( 2.4) 289 ( 2.9)
GENDER
M.State 38 ( 2.9) 33 ( 3.3) 20. ( 3.4)
283 ( 2.4) 284 ( 1.8) 288 ( 2.8)Nation 35 ( 4.1) 35 ( 3.6) 31 ( 3.5)
257 ( 3.2) 261 ( 2.8) 275 ( 3.2)Female
State ( 3.0) 35 ( 4.0) 29 ( 2.8)275 ( 3.1) 279 ( 2.1) 283 ( 2.6)
Nation 34 ( 4.1) 32 ( 3.7) 34 ( 4.1)254 ( 2.1) 258 ( 2.3) 273 ( 2.8)
The standard errors of the estimateJ statistics appear in parentheses. It can be said with about 95 percentcertainty that, for each population of interest, the value for the entire population is within ± 2 rtandatd errorsof the estimate for the sample. ! Interpret with caution the nature of the sample does not allow accuratedetermination of the variability of this estimated mean proficiency. *** Sample size is insufficient to permit areliable estimate (fewer than 62 students).
1 22
THE 1990 NAEP TRIAL STATE ASSESSMENT 117

North Dakota
TABLE Al2 I Students' Reports on the Frequency of SmallGroup Work
PERCENTAGE OF STUDENTS ANDAWRAGE MATHEMATICS PROFICIENCY
1990 NAEP MALSTATE ASSESSMENT Al Lust Once a Week Less Than Once a Ws* Myer
TOTAL
Pewits.,and
Preflalana
Pargeltaffand
Pralidenty
forgentelleand
Proficiang
State 19 ( 1.8) Si ( 1.2) SO (282 ( -1.7) 283 ( 1.6) 200 ( 1.5
Nation 28 ( 2.5) 28 ( 1.4) 44 ( 2.9256 ( 2.7) 267 ( 2.0) 281 ( 1.8)
RACE/ETHNICITY
*biteState 19( 1.7) 32 ( 1.3) SO ( 2.1)
287 ( 1$) 285 ( 1.8) 283 ( 1.2)Nation 27 ( 2.9) 29 ( 1.7) 44 ( 3.5)
288 ( 3.1) 272 ( 1.9) 270 ( 1.7)Hispanic
State 27 8.8)fere (
21 ( 4.7)04111
52 ( 8.7)( .41Nation 37 ( 5.2) 22 ( 3.8) 41 ( 5.0)
242 ( 3.9) 250 ( 3.4) 240 ( 2.8)American kulian
State 24 ( 4.1) 30 ( 4.6) 48 ( 5.5)239 ( 5.7)I
Nation 31 ( 5.1)..**)
35 ( 5.5) 33 ( 5.0)-0* (
TYPE OF COMMUNITY
Advaniagad urbanState 10 ( 2.9) 54 ( 2.8)( 0.1Nation 27 (13,9) 33 ( 4.5) 40 (13.4)
286 ( 5.4)1 279 ( 33)1Extreme rural
State 18 ( 22) 28 ( 1.9) 56 ( 3.1)274 ( 3.7) 282 ( 3.1) 281 ( 2.8)
Nation 34 (10.8) 27 ( 3.8) 39 (11.6)249 ( 5.2)1 284 ( 3.5)1 256 ( 8.2)1
OtherState 22 ( 2A) 33 ( 1.7) 45 ( 2.8)
288 ( 2.1) 282 ( 2.0) 279 ( 2.0)Nation 27 ( 2.6) 28 ( 1.7) 45 ( 3.3)
280 ( 3.3) 284 ( 2.11 262 ( 2.2)
The standard errors of the estimated statistics appear in parentheses. It can be said with sbout 95 percentcertainty that, for each population of interest, the value for the entire population is within ± 2 standard errorsof the estimate for the sample. ! Interpret with caution - the nature of the sample does not allow accuratedetermination of the variability of this estimated mean proficiency. 11 Sample size is insufficient to permit areliable estimate (fewer than 62 students).
1 rt1 t... j
1 18 THE 1990 NAEP TRIAL STATE ASSESSMENT

North Dakota
TABLE Al2 I Students' Reports on the Frequency of Small
(continued) I Group WorkPERCENTAGE OF STUDENTS AND
AVERAGE MATHEMAT(CS PROFICIENCY
1500 NAEP MALSTATE ASSESSMENT
1 At Lead Once a Meek Lass Than Once a Week Never
TOTAL
Paramtapand
PrelicioncY
10 1.6)252 1.7)23 2.5)
258(2.1)
Percistage
Prellthacy
31 1.2)2113 1,8)
26 1.4)( 2.0)
State
Nation
PARENTS' ECUCAT1ON
HS non-graduateState 19 ( 5.5)
1,,,, ( ..e.)26 ( 5.4)
4.1)
Nation 29 ( 43) 29 ( 3.0)242 ( 3.4) 244 ( 3.0)
NS graduateState 17 ( 2A) St ( 32)
276 ( 5.5) 272 2.5)
Nation 23 ( 3.0) 26 14)251 ( 3.7) 261 23)
Some collegeState 20 ( 3.3) 30 ( 3.3)
283 ( 3.0) 264 ( 23)Nation 27 ( 3.9) 27 ( 2.4)
2t$ ( 33) 268 ( 3.3)
College graduateState 19 ( 2.0) 31 ( 13)
289 ( 2.9) 291 ( 2.6)
Nation 28 ( 3.0) 26 ( 1,9)270 ( 2.7) 276 ( 23)
SIENDE9
MiteState 20 ( 1.7) 31 ( 1,7)
287 ( 2.4) 287 ( 2.4)
Nation 31 ( 2.9) 2$ ( 1.7)
250 ( 32) ( 23)AMMO
State 18 ( 2.8) 31 ( 13)
Nation277 ( 2.8)2e ( 24)
279 ( 2.3)27 ( 13)
257 ( 2.8) 268 ( 1.7)
111109611010end
Ihrseekoliat
SO 2.0)200 14)
44 2,0)201 13)
SS 0.71
42 ( 43)242 ( 2.7)
49 ( 4.0)272 (43 ( 3.4
252 ( 13
50 ( 4.$)283 ( 2.5)46 ( 33)
255 ( 2.1)
50 ( 22)2ee ( 1.5)44 ( 34)
275 ( 22)
49 ( 22)282 ( 1.7)41 ( 2.9)
262 ( 1.8)
Si ( 2.7)278 ( 1.9)47 ( 3.2)
260 ( 13)
The standard errors of the estimated statisfics appear in parentheses. It can be said with about 95 percent
certainty that, for each population of interest, the ,alue for the entire population is within * 2 standard errors
of the estimate for the sample. *** Sample size is insufficient to permit a reliable estimate (fewer than 62
student4).
1 2 4
THE 1990 NAEP TRIAL STATE ASSESSMENT119

North Dakota
TABLE A13 I Students' Reports on the Use of MathematicsObjects
PERCENTAGE OF STUDENTS ANDAVERAGE MATHEMATICS PROFICIENCY
1990 NAEP TRIALSTATE ASSESSMENT
At Least Once a Week Less Than Once a Week New
TOTAL
Pomade/toand
Pre/dewy
Percentageand
Prelidency
Percentogeand
Proficiency
State 24 ( 1.4) 45 ( 1.5) 1.4)276 ( 1.7) 294 . 1 AI) 280 1.9)
Nation 28 ( 1.8) 31 ( .1.2) 41 2.2)258 ( 2.0) 209 ( 1.5) 259 ( 1.6)
RACE/ETHNICITY
WhitsState 24 ( 13) 47 ( 1.6) 30 ( 1.5)
281 ( 1.4) 286 ( 1.6) 284 ( 1.9)Nation 27 ( 1.0) 33 ( 1.6) 40 ( 2.5)
266 ( 2.6) 275 ( 1.6) 268 ( 1.8)Hispanic
State 34 (INT* (
7.8)*el41 ( 7.2)
..04)
Nation 33 ( 4.2) 23 ( 2.0) 40 ( 4.0)241 ( 4.6) 253 ( 4.3) 240 ( 1.9)
American IndianState 38 ( 3.5) 34 ( 3.7)
( "") *fib 238 ( 4.5)1Nation 35 ( 3.4) 37 ( 8.2) 28 ( 8.8)
( ***/(
TYPE OF COMMUNITY
Advantaged urbanState 16 ( 3.8)
)50 ( 2.3) 34
ov( 3.1)
«I»)
Nation 36 (10.3) 33 ( 4.8) 32 (11.1)278 ( 6.1)1 284 ( 3.2)1 281 ( 5.9)1
Extreme ruralState 25 ( 2.3) 47 ( 2.3) 28 ( 2.9)
276 ( 2.6) 284 ( 2.9) 277 ( 3.8)Nation 21 ( 3.1 ) 37 ( 4.7) 43 ( 5.0)
262 ( 4.7)1 251 ( 5.2)1
OtherState 25 ( 2.2) 42 ( 2.4) 33( 1.9)
279 ( 2.6) 286 ( 2.3) 279 ( 2.4)Nation 27 ( 2.0) 31 ( 1.4) 41 ( 2.4)
258 ( 2.9) 270 ( 1.8) 260 ( 2.2)=11..'The standard errors of the estimated statistics appear in parentheses. It car be said with about 95 percentcertainty that, for each population of interest, the value for the entire population is within ± 2 standard errorsof the estimate for the sample. ! Interpret with caution - the nature of the sample does not allow accuratedetermination of the variability of this estimated mean proficiency. *** Sample size is insufficient to permit areliable estimate (fewer than 62 students).
120 THE 1990 NAEP TRIAL STATE ASSESSMENT

North Dakota
TABLE A13 I Students' Reports on the Use of Mathematics(ccetinued) I Objects
PERCENTAGE OF STUDENTS ANDAVERAGE MATHEMATICS PROFICIENCY
IMO NAEP TRIALSTATE ASSESSMENT At Least Once a Week Lass Than Once a Week Now
TOTAL
Parandainand
Paranoias*and
Pnaliciancy
Peranealleand
Profideray
State 24 ( 45 1.5) 30(14 )27$ ( 1.7) 264 1.6) 280 ( 1.9)
Nation 26 ( 16) 31 1.2) 41 ( 2.2)258 ( 2.6) 209 ( 1.5) 250 ( 1.6)
PARENTS EDUCATION
HS non-graduateState 31 ( 6.1) 37 ( 62) 31 ( 6.0)
Of* (
Nation 27 ( 42) 26 ( 2.7) 47 ( 5.0)237 ( 3.0) 253 ( 3.5) 240 ( 2.3)
14S graduateState 23 ( 3.2) 45 ( 3.8) 32 ( 33)
267 ( 3.4) 278 ( 3.0) 270 ( 32)Nation 27 ( 2.7) 31 ( 2.4) 43 ( 33)
250 ( 2.4) 259 ( 2.7) 253 ( 2.1)Some college
State 24 ( 3.0) 43 ( 3.4) 33 ( 32)280 ( 3.1) 285 ( 2.4) 283 ( 3.4)
Nation 29 ( 2.6) 36 ( 2.3) 35 ( 2.6)261 ( 3.5) 274 ( 2.2) 263 ( 2.1)
College graduateState 24 ( 1.8) 43 ( 2.1) 29 ( 1.5)
285 ( 2.1) 290 ( 1.8) 289 ( 2.2)Nation 30 ( 2.5) 32 ( 2.0) 38 ( 2.6)
269 ( 3.0) 278 ( 2.0) 275 ( 2.0)
GENDER
MakeState 29 ( 2.0) 44 ( 2.2) 27 ( 1.9)
280 ( 1.9) 287 ( 1.9) 284 ( 3.0)Nation 32 ( 2.0) 30 ( 1.5) 38 ( 2.2)
258 ( 2.9) 271 ( 2.1) 260 ( 1.8)Female
State 19 ( 1.5) 47 ( 1.8) 34 ( 1.8)274 ( 2.6) 282 ( 2.0) 276 ( 2.0)
Nation 25 ( 2.0) 31 ( 1.9) 44 ( 2.6)257 ( 3.0) 268 ( 1$) 257 ( 1.9)
The standard errors of the estimated statistics appear in parentheses. It can be said with about 95 percentcertainty that, for each population of interest, the value for the entire population is within ± 2 standard errorsof the estimate for the sample. *** Sample size is insufficient to permit a reliable estimate (fewer than 62students).
iGTHE 1990 NAEP TRIAL STATE ASSESSMENT 121

North Dakota
TABLE A14 I Students' Reports on the Frequency of1 Mathematics Textbook Use
PERCENTAGE OF STUDENTS ANDAVERAGE MATHEMATICS PROFICIENCY
1950 NAEP TRIALSTATE ASSESSMENT
Almost Every Day Several Times a WeekAbout Once a Week or
Lass
TOTAL
a841Proadwav
60 ( 1.2)264 ( 1.1)74 ( 1.9)
287 ( 1.2)
82 ( 1.0)268 ( 1.0)78 ( 2.5)
274 ( 1.3)
58 ( 9.3)«..t)
61 ( 3.7)249 ( 2.3)
49 ( 7.3)249 ( 3.4)61 ( 4.4)
Imo ( 0.*)
711( 0.5)267 ( 2.1)73(11.1)
286 ( 4.6)1
84 ( 2.7)264 ( 1.8)68 (11.3)
263 ( 4.2)1
76 ( 1.0)284 ( 1.3)
75 ( 2.2)267 ( 1.6)
Illeventweind
Proicionqf
11 0.9)28$ 3.7)
14 0.$)252 1.7)
9 ( 0.9)277 ( 22)13 ( 0.8)
258 ( 2.2)
25 ( 7.5)41,1* (
21 ( 2.9)242 ( 5.1)
39 ( 5.6)
22 ( 3.6)
11 ( 3.0)*44)
13 ( 1.7)(
12 ( 1.7)257 ( 7.5)is ( 3.6)
*4* (
11 ( 1.2)272 ( 3.2)14 ( 1.0)
252 ( 2.6)
Percerdageand
!radon
9 ( 0.6)275 ( 2.5)
12 ( 1.11)242 ( 4.5)
9 ( 0.9)260 ( 2.4)
11 ( 22)252 (
17 ( 7.7)
17 ( 2.7)224 ( 3.4)
12 ( 2.3)( It** )
17 ( 4.0)l*
444 (
14 (10.4)(
5 ( 1.5)IP* 11-11
+Mt
13 ( 1.0)Imp*
10 ( 1.9)239 ( 4.3)1
State
Nation
BASNEWffllyWhite
State
Nation
HtspanteState
Nation
American MainState
Nation
TYPE OF COMMUNITY
Advantaged urbanState
Nation
Extreme ruralState
Nation
OtherState
Nation
The standard esrors of the estimated statistics appear in parentheses. It can be said with about 95 percentcertainty that, for each population of interest, the value for the entire population is within ± 2 standard errorsof the estimate for the sample. I Interpret with caution - the nature of the sample does not allow accuratedetermination of the variability of this estimated mean proficiency. ** Sample size is insufficient to permit areliable estimate (fewer than 62 students).
122 THE 1990 NAEP TRIAL STATE ASSESSMENT

North Dakota
TABLE A14 I Students' Reports on the Frequency of(continued) i Mathematics Textbook Use
PERCENTAGE OF STUDENTS ANDAVERAGE MATHEMATICS PROFICIENCY
12110 NAEP TRULLSTATE ASSESSMENT Almost Every Day Several Times a Week About Once a Week or
Lass
TOTAL
Percertioseand
Proficiency
PsrooNaigemid
Prelialeivar
Percentageand
Preedency
State 80 ( 12) 11 ( 0.9) 9 ( OA)284 ( 1.1) 266 ( 3.7) 275 ( 2.5)
Nation 74 ( 1.9) 14 ( 0.6) 12 ( 1.6)287 ( 1.2) 252 ( 13) 242 ( 4.5)
PARENTS' EDUCATION
HS non-graduateState 73 (
260 (7.1)42)
14 («oft
5.8) 12 ( 5.1)tHigt)
Nation 64 (245 (
34)2.3)
16 ( 2.0) 18 ( 3.1)441
ItS graduateState 80 ( 2.7) 10( 1.6) 10 ( 1.9)
270 ( 2.3) 258 ( 7.4)Nation 71 ( 3.6) 10 ( 1.8) 13 ( 2.8)
256 ( 1 .6) 249 ( 32) 239 ( 3.4)lSome colter
State 79 (286 (
3.1)2.0)
18 ( 2.6) .41Nation
college graduate
80 (270 (
2.0)1.9)
11 ((
1.2)441
9 ((
1.7)
Statd 81 ( 1.5) 9 ( 0.9)290 ( 1.3) 279 ( 4.7)
Nation 77 ( 2.7) 13 ( 0.9) 10 ( 2.3)279 ( 1.8) ( 2.8) 257 ( 6.4)1
GENDER
MaleState 78 ( 1.5) 13 ( 1.3) 9 ( 1.0)
287 ( 1.3) 273 ( 3.2) 278 ( 7.1)Nation 72 ( 2.4) 16 ( 1.2) 12 ( 2.1)
268 ( 1.8) 252 ( 23) 242 ( 8.1)Female
State $2 ( 1.4) 9 ( 1.1) 10 ( 1.2)2$1 ( 1.4) 259 4.9) 274 ( 5.8)
Nation 78 ( 1.8) 13 ( 1.0) 11 ( 1.8)265 ( 1.3) 250 ( 2.5) 242 ( 3.8)
The standard errors of the estimated statistics appear in parentheses. It can be said with about 95 percentcertainty that, for each population of interest, the value for the entire population is within ± 2 standard errorsof the estimate for the sample. ! Interpret with caution - the nature of the sample does not allow accuratedetermination of the variability of this estimated mean proficiency. *** Sample size is insufficient to permit areliable estimate (fewer than 62 students).
78
THE 1990 NAEP TRIAL STATE ASSESSMENT 123

North Dakota
TABLE A 15 I Students' Reports on the Frequency of1 Mathematics Worksheet Use
PERCENTAGE OF STUDENTS ANDAVERAGE MATHEMATICS PROFICIENCY
100 NAEP TRIALSTATE ASSESSMENT
,
At Lust Suomi Thusa Moak About Ones a Wook Lass Than Weakly
TOTAL
80ventapand
Pirsialancy
Perosidassand
finsidency
State 36 1.9) 24 ( 1.4)275 2.0) 2.0 ( 1.8)
Nation 38 24) 25 ( 1.2)253 ( 2.2) 201 ( 1.4)
RACE/ETHNICITY
WhiteState 35 ( 2.1) 24 ( 14)
283 ( 1.5) 293 ( 14)Nation 35 ( 2.9) 24 ( 1.3)
tiltbank262 ( 2.5) zee ( 1.5)
State 35$44,
( 8.4).44)
27 ((
8.0)
Nation 44 ( 4.1) 25 ( 3.4)238 ( 31) 247 ( 3.3)
American IndianState 59 ( 8.5) 23 ( 7.2)
241 ( 3.3)1 **It (
Nation 41 ( 4.2) 30 (11.3)*el
TYPE OF COMMUNITY
Advantaged trbanState 25 (
(1.3)*44 )
19 (et, 2.6)
Nat1on 50 (271 (
9.0)3.3)1
19 ( 4.9).1.4)
Exfrsene ruralState ( 3.9) 25 ( 3.4)
277 ( 4.1) 260 ( 2.3)Nation 42 (10.1) 30 ( 4.4)
249 ( 4.0)1 250 ( 3.4)1
OtherState 37 ( 2.4) 24 ( 1.9)
279 ( 2.1) 281 ( 2.7)Natioct 30 ( 2.9) 28 ( 1.2)
252 ( 3.0) 261 ( 2.1)
Paressise
ProRdway
40 ( 24)21g
2 7 2 ( Ti
41 ( 24)iA)
41 ( 3.0)277 ( 2.0)
38 ( 9.0)dim ( .4132( 4.3)
248 ( 3.3)
18 ( 3.6).)28 (12.5)
ilP**
58 ( 1.8)( 441
31 ( 9.3)299 ( 5.3)1
36 ( 49)283 ( 3.6)
25 ( 7.5)267 ( 7.3)1
39 ( 3.3)265 ( 1.7)
38 ( 24)272 ( 1.8)
The standard errors of the estimated statistics appear in parentheses. It can be said with about 95 percentcertainty that, for each population of interest, the value for the entire population is within ± 2 standard errorsof the estimate for the sample. I Interpret with caution -- the nature of the sample does not allow accuratedetermination of the variability of this estimated mean proficiency. *** Sample size is insufficient to permit areliable estimate (fewer than 62 students).
I 2
124 THE 1990 NAEP TRIAL STATE ASSESSMENT

North Dakota
TABLE A15 I Students' Reports on the Frequency of(continUed) I Mathematics Worksheet Use
PERCENTAGE OF STUDENTS ANDAVERAGE MATHEMATICS PROFICIENCY
1900 NAB' TRIALSTATE ASSESSMENT
At Least Several Tknesa Weak About Once &Weak Lest Than *Reidy
Perosntageand
Prs idiocy
PmentagemW
Pradencll
percapiapand
PnAdency
state 38 ( 1.9) 24 ( 1.8) 40 ( 2.4)278 ( 2.0) 260 ( 1.8) 284 ( 1$)
Nation 38 ( 2.4) 25 ( 12) 37 ( 24)253 ( 2.2) 261.( 1A) 272 ( 1.9)
PARENTS' EDUCATION
le non-graduateState 43
ft**(8.9)
***)17 ( 4.4)) 35 (
MgrT.?)
Nation 41 ( 4.5) 30 ( 2.7) 29 ( 4.0)235 ( 3.1) 243 ( 2.7) 253 ( 2.8)
HS graduateState 35 ( 3.4) 24 ( 3.2) 41 ( 4.0)
270 ( 3.2) 274 ( 3.0) 275 ( 3.1)Nation 40 ( 32) 29 ( 2.2) 32 ( 3.5)
247 ( 2.7) 256 ( 2.5) 262 ( 2.2)Saw college
State 38 ( 3-3) 25 ( 34) 38 ( 4.0)280 ( 2.0) 285 ( 34) 284 ( 3.0)
Nation 34 ( 3.4) 20 ( 22) 40 ( 3.5)259 ( 2.3) 269 ( 2.8) 271 ( 2.8)
College graduateState 35 ( 2.3) 24 ( 1.9) 41 ( 2.5)
287 ( 2.1) 285 ( 2.8) 292 ( 1.8)Nation 38 ( 2.8) 22 ( 1.6) 41 ( 2.6)
264 ( 2.6) 273 ( 2.5) 285 ( 2.3)
5IENDER
MaleState 37 ( 2.5) 25 ( 2.2) 3$ ( 3.0)
281 ( 2.1) 284 ( 2.4) 287 ( 2.1)Nation 39 ( 2.7) 25 ( 1.6) 35 ( 2.7)
253 ( 2.7) 203 ( 2.3) 274 ( 2.4)Female
State 34 ( 2.5) 24 ( 1.9) 42 ( 2.7)275 ( 2.7) 277 ( 2.3) 282 ( 1.6)
Nation 37 ( 2-5) 2S ( 14) 38 ( 2.6)253 ( 2.1) 259 ( 1.8) 269 ( 2.2)
The standard errors of the estimated statistics appear in parentheses. It can be said with about 95 percentcertainty that, for each population of interest, the value for the entire population is within ± 2 standard errorsof the estimate for the sample. *** Sample size is insufficient to permit a reliable estimate (fewer than 62students).
1 30
THE 1990 NAEP TRIAL STATE ASSESSMENT 125

North Dakota
TABLE Al8 Students' Reports on Whether They Own aCalculator and Whether Their Teacher ExplainsHow to Use One
PERCENTAGE OF STUDENTS ANDAVERAGE MATHEMATICS PROFICIENCY
18110 PIMP TRIALSTATE ASSESSMENT
Calculator Teacher Explains Calculator the
Yes No_
,
Yes No
TOTAL
Poraantagaand
Praidancy
Paroantapand
Preadancy
Portantapand
Preficiency
Parcentageand
Proficiency
State 100 ( 0.1) 1 ( 0.1) 49 ( 1.7) 51 ( 1.7)281 ( 1.2) 279 1.7) 264 ( 1.3)
Nation 97 ( 0.4) 3 ( 0.4) 49 2.3) 51 ( 2.3)263 ( 1.3) 234 ( 3.8) 2511 ( 1.7) 206 ( 1.5)
RACFATHNICITY
WhiteState 100 ( 0.1)
284 ( 0.9)0 ( 0.1)
( 44148 ( 1.7)
262 ( 1.1)52 ( 1.7)
286 ( 1.3)Nation 98 ( 0.3) 2 ( 0.3) 4$ ( 2.6) 54 ( 2.6)
270 ( 1.5) 266 ( 1.8) 273 ( 1.8)Hispanic
State 99 ( 0.7)251 ( 4.9)
( 0.7)( "")
64 ( 8.4)4,137 ( 8.4)41
Nation 92 ( 1.2) 8 ( 1.2) 63 ( 4.3) 37 ( 4.3)245 ( 2.7) 243 ( 3.4) 245 ( 2.9)
Arnorican IndianState R2 ( 3.1) ( 3.1) 01 ( 7.0) 39 ( 7.0)
243 ( 3.8)1 241 ( 4.4)1 244 ( 4.2)Nation 94 ( 3.1) 6 ( 3.1)
( ***)71 (16.7) 29 (16.7)
.p** «on
TYPE OF COMMUNITY
Advargagod urbanState 100 ( 0.0) 0 ( 0.0) 49 ( 3.0) 51 ( 3.0)
285 ( 1.8) 1144, ( 0-.11 4,-«* 44.*
Nation 99 ( 1.0) 1 ( 1 ) 45 (12.2) 55 (12.2)281 ( 3.8)1
*44 ( 276 ( 2$)! 285 ( 8.4)1
Extreme ruralState 99 ( 0.3) 1 ( 0.3) 47 ( 3.3) 53 ( 3.3)
280 ( 2.5) 278 ( 4.1) 283 ( 2.2)Nation 96 ( 1.3) 4 ( 1.3) 42 ( 8.7) 58 ( 13.7)
257 ( 3.9)1 251 ( 4.8)1 261 ( 4.4)1
OtherState 99 ( 0.2) ( 0,2) 49( 2.2) 51 ( 2.2)
282 ( 1.3) 280( 1.3) 283 ( 1.9)Nation 97 ( 0,5) 3 ( 0.5) 50 ( 2.7) 50 ( 2.7)
283 ( 1.7) 233 ( 5.4) 258 ( 2.1) 266 ( 2.0)
The standard errors of the estimated statistics appear in parentheses. It can be said with about 95 percentcertainty that, for each population of interest, the value for the entire population is within ± 2 standard errorsof the estimate for the sample. ! Interpret with caution - the nature of the sample does not allow accuratedetermMation of the variability of this estimated mean proficiency *** Sample size is insufficient to permit areliable estimate (fewer than 62 students).
131
126 THE 1990 NAEP TRIAL STATE ASSESSMENT

North Dakota
TABLE Al8(continued)
Students' Reports on Whether They Own aCalculator and Whether Their Teacher ExplainsHow'To Use One
PERCENTAGE OF STUDENTS ANDAVERAGE MATHEMATICS PROFICIENCY
1980 NAEP TRIALSTATE ASSESSMENT
Own a Calculator-
Teacher Dv lens Caktiattor Usea
Yes No Ye3 No
TOTAL
Percentageand
Prt &dew
100 ( 0.1)2111 ( 1.2)97 ( 0.4)
263( 1.3)
State
Nation
PARENTS' EDUCATION
1111 non-graduateState 98 ( 1.3)
256 ( 3.6)Nation 92 ( 1.6)
243 ( 2.0)1111 graduate
State 99 ( 0.4)273 ( 2.4)
Nation 97 ( 0.8)255 ( 1.5)
Nom collegeState 100 ( 02)
263 ( 1.9)Nation 96 ( 0.9)
26$ ( 1.8)College graduate
State 100 ( 0.0)288 ( 1.3)
Nation 09 ( 0.2)275 ( 1.6)
GENDER
State 100 ( 0.1)264 ( 1.4)
Nation 97 ( 0.5)264 ( 1.7)
Ferrol.State 99 ( 0.2)
279 ( 1.5)Nation 97 ( 0.5)
262 ( 1.3)
Percentageand
Prot Money
1 0.1)
3 0.4)234 3.8)
2 ( 1.3)
8 ( 1.6)444 (
( 0.4)
3 ( 0.6)(
0 ( 0.2)(
4 ( 0.9)44 ( )
0 ( 0.0)
( 02)P* ( *41
Percentageand
Pro *ism
Percentageand
Pnolicionev
49 ( 1.7) 51 ( 1.7)279 1.7) 254 ( 1.3)49 2.3) 51 ( 2.3)
25$ ( 1.7) 206 ( 1.5)
43 ( 8.4)..**)
52 ( 8.4)
53 ( 4.6) 47 ( 4.6)242 ( 2.9) 243 ( 2.5)
49 ( 2.5) 51 ( 2.5)270 ( 3.5) 275 ( 2.6)54 ( 3.0) 46 ( 3.0)
252 ( 1.9) 258 ( 2.0)
52 ( 4.2) 48 ( 42)281 ( 2.0) 285 ( 2.9)48 ( 3.2) 52 ( 3.2)
265 ( 2.4) 268 ( 22)
47 ( 2.0) 53 ( 2.0)287 ( 1.7) 290 ( 1.6)46 ( 2.6) 54 ( 2.6)
266 ( 2.2) 280 ( 1.9)
50 ( 2.1) 50 ( 2.1)282 ( 2.0) 286 ( 1.8)
51 ( 2.6) 49 ( 2.6)256 ( 2.1) 269 ( 2.1)
47 ( 2.3) 531 2.3)275 ( 2.4) 281 ( 1.5)
47 ( 2.5) 53 ( 2.5)258 ( 1.7) 263 ( 1.6)
The standard errors of the estimated statistics appear in parentheses. It can be said with about 95 percentcertainty that, for each population of interest, the value for the entire population is within I 2 standard errorsof the estimate for the sample. *" Sample size is insufficient to permit a reliable estimate (fewer than 62students).
132THE 1990 NAEP TRIAL STATE ASSESSMENT 127

North Dakota
TABLE A19 I Students' Reports on the Use of a CalculatorI for Problem Solving or Tests
PERCENTAGE OF STUDENTS ANDAVERAGE MATHEMATICS PROFICIENCY
I
1900 NAEP TRIALSTATE ASSESSMENT
Worldng Problems inClasS Doing Problems at Nome Taking Quizz or Tests
AlmostAlways Ne if Almost
Always Never AlmostAlways Never
.
TOTAL
Paramiageand
Pralidency
Percentageand
Proficiency
State 415 23 (277 1.5 238 ( 1.4
Nation 48 1.5 23 ( 1.9254, ( 1.5) 272 ( 1.4)
RACE/ETHNICITY
WhiteState 46( 1.8) 23 ( 1.7)
2$0 ( 1.2) 290 ( 1.4)Nation 46 ( 1.7) 24 ( 2.2)
262 ( 1.7) 278 ( 1.3)Hispanic
State 4$ (1, ( 7.0) 11 ( 4.3)( **el
Nation 51 ( 2.9) 18 ( 3.5)239 ( 2.8) 252 ( 3.3)1
Ametican IndianState 42 (
*4,4 (4.5)141
24 (***
5.5)
Nation 33 ( 9.8) 23 ( 4.9)*b. ( Mel *4110 4* )
TYPE OF COMMUNITY
Advantaged urbanState 48 ( 4.2)
.1,4)20 ( 2.1)
4.4.)
Nation 51 ( 5.4) 23 (10.7)270 ( 4.7)1
Extreme ruralState 42 2.7) 29 ( 2.8)
275 ( 3.5) 287 ( 2.1)Nation 46 ( 7.4) 29 ( 8.5)
248 ( 4,3)1 268 ( 8.1)1Other
State 46 ( 2.0) 20 ( 2.1)278 ( 1.8) 290 ( 2.0)
Nation 48 ( 1.9) 22 ( 2.0)254 ( 2.1) 272 ( 1.8)
Pawning, Percentage Penology Penentageand end and and
Proficiency Psi:114mm Pre Scam linliciency
31 (231 ( 1.530 ( 1.3
261 ( 1.8)
32 ( 1.4)263 ( 1.5)31 ( 1.5)
270 ( 1.7)
40 ( 7.8)( «it.)
26 ( 3.2)238 ( 4.8)
21 ( 3.3)
15 ( 4.9)*14 ( MN)
39 ( 2.7)
32 ( 6.1)274 ( 4.9)1
26 ( 2.4)277 ( 2.9)20 ( 2.5)
34 (. 1.9)282 ( 2.2)32 ( 1.7)
263 ( 2.3)
12 ( 0.9) 23 ( 1.2) 34 1.7)282 ( 1.9) 277 ( 1.9) 20 1.2)
19 ( 0.9) 27 ( 1.4) 30 2.0)263 ( 1.11) 253 ( 2.4) 274 ( 1.3)
12 ( 0.9) 23 ( 1.3) 35 ( 1.8)237 ( 1.7) 260 ( 2.1) 291 ( 1.2)
18 ( 1.2) 25 ( 1.5) 32 ( 2.3)289 ( 2.3) 263 ( 2,8) 279 ( 1.2)
18 ( 0.8) 24 ((
7.2) 20 (414se
7.0)***)
21 ( 2.1) 26 ( 2.7) 22 ( 3.1)244 ( 3.1) 237 ( 3.2) 258 ( 4.2)
24 (444
3.9) 28 ((
2.0)441
31 (*44 (
4.9)
32 (10.1) 20 ( 6.2) 21 ( 7.8)*Mb ( **111 IMP1 *NI ( 1111.1
4 ( 1.7) 27 ( 3.4) 29 ( 4.5)***)
15 ( 24) 31 ( 3.8) 28 ( 9.8)281 ( 7.6)r 285 ( 4.2)1
16 ( 1.8) 23 ( 1.7) 38 ( 2.7)280 ( 2.7) 275 ( 3.7) 288 ( 2.0)23 ( 3.9) 24 ( 8.6) 37 ( 8.3)
283 ( 4.4)1 270 ( 4.0)1
12 ( 1.3) 22 ( 1.8) 32 ( 2.2)283 ( 3.0) 277 ( 2.5) 289 ( 1.7)
18 ( 1.1) 27 ( 1,8) 29 ( 2.1)283 ( 2.8) 253 ( 2.7) 276 ( 1.9)
The standard errors of the estimated statistics appear in parentheses. It can be said with about 95 percentcertainty that, for each population of interest, the value for the entire population is within ± 2 standard errorsof the estimate for the sample. The percentages may not total 100 percent because the "Sometimes" categoryis not included. ! Interpret with caution - the nature of the sample does not allow accurate determination ofthe variability of this estimated mean proficiency. *** Sample size is insufficient to permit a reliable estimate(fewer than 62 students).
L'; 3
328 THE 1990 NAEP TRIAL STATE ASSESSMENT

North Dakota
TABLE A 19 I Students' Reports on the Use of a alkillator(continued) I for Problem Solving or Tests
PERCENTAGE OF STUDENTS ANDAVERAGE MATHEMATICS PROFICIENCY
1960 MEP TRIAL.STATE ASSESSMENT
"icing Prciaiams inam.
Doing Problems at Homo.
Taking Quizzes or Testa
AlmostAlways
.
Never AlmostAlways Never
_
,
AlmostAlwa ys
,I Never
TOTAL
State
Nation
PARENTS EDUCATION
NS non-graduateState
Nation
NS graduateState
NatiOn
Some collegeState
Nation
College graduateState
Nation
GENDER
MaleState
NatiOn
FemaleState
Nation
Porimeass Pommies* Pereeniese Pereeniase Poraniese Perosegeseand and am6 and me
Preiloionos Madam Peoliciemy Prelicioncy Maoism Preeoliner
48 ( 1.6) 23 ( 1.6) 31 ( 1.4) 12 0.9 23 34 1.1277 ( 2111( 14) 291 ( 252 1.9 277 1.9 MS 1.246 ( 1.5 23 ( 1.9) 90 ( 1.3 19 0.9 27 1.4 so 2.0
254 ( 1.5 272 ( 1.4) 261 ( 13 263 13 253 2.4) 274 13
00 ( 6.0) 15 ( 4.5) 25 ( 5.9) 15 ( 4.8)*IN ( *e) *** 114. ) CINNI ( '141
54 ( 3.3) 19 ( 3.8) 26 ( 3.1) 22 ( 2.0)240 ( 2.3) *** ( ') 244 ( 3.8) 244 ( 4.2)
45 ( 2.9) 19 ( 2.2) 33 ( 2.9) 10 ( 1.5)260 ( 3.1) 281 ( 2.8) 275 ( 3.2) 271 ( 4.2)52 ( 2.5) 20 ( 2.4) 29 ( 1.9) 18 ( 1.5)
248 ( 1.4) 206 ( 2.7) 250 ( 2.4) 256 ( 2.4)
45 ( 2.8) 21 ( 2.6) 29 ( 3.5) 17 ( 2.4)281 ( 2.2) 286 ( 3.8) 281 ( 2.4) 285 ( 3.3)46 ( 2.8) 26 ( 2.8) 28 ( 2.0) 20 ( 1.9)
258 ( 2.1) 272 ( 2.5) 267 ( 3.0) 268 ( 3.2)
45 ( 2.2) 25 ( 2.1) 32 ( 2.2) 11 ( 1.2)284 ( 1.8) 295 ( 1.7) 287 ( 2.0) 289 ( 3.2)45 ( 1.9) 25 ( 2.4) 33 ( 2.0) 16 ( 1.4)
265 ( 1.7) 284 ( 1.8) 274 ( 2.2) 278 ( 2.8)
48 ( 2.2)280 ( 1.7)50 ( 1.7)
255 ( 1.9)
43 ( 2.1)273 ( 2.2)46 ( 2.0)
252 ( 1.7)
21 ( 1.8)293 ( 2.0)20 ( 2.0)
275 ( 2.2)
24 ( 2.2)285 ( 1.7)26 ( 2.1)
269 ( 1$)
31 ( 2.0)284 ( 2.1)29 ( 1.6)
264 ( 2.8)
31 ( 2.3)278 ( 1.8)32 ( 1.6)
259 ( 1.7)
14 ( 1.3)2b4 ( 2.5)
19 ( 1.3)263 ( 23)
11 ( 1.3)278 ( 3.1)
18 ( 1.2)263 ( 2.1)
24 ( 6.4) 21 ( 5.3)AM. 1144, IN*
32 ( 3.6) 24 3.2237 ( 2.3) 251 4.6
24 ( 2.3) 30 ( 2.6)209 ( 4.1) 261 ( 2.5)26 ( 1.5) 27 ( 2.2)
246 ( 2.6) 265 ( 2.0)
22 ( 2.7) 35 ( 2.8)233 ( 3.0) 286 ( 3$)26 ( 2.4) 35 ( 2.5)
255 ( 3.6) 275 ( 2.0)
23 ( 1.7) 36 ( 2.1)263 ( 2.6) 296 ( 1.7)26 ( 1.8) 33 ( 2.7)
268 ( 2.6) 285 ( 2.0)
23 ( 1.3) 31 ( 2.0)281 ( 2.7) 293 ( 1.5)27 ( 1$ ) 26 ( 2.1)
256 ( 3.0) 277 ( 1.9)
23 ( 2.1) 37 ( 2.4)273 ( 3.0) 285 ( 1.5)27 ( 1.8) 33 ( 2.1)
251 ( 2.4) 271 ( 1.5)
The standard errors of the estimated statistics appear in parentheses. It can be said with about 95 percentcertainty that, for each population of interest, the value for the entire population is within ± 2 standard errorsof the estimate for the sample. The percentages may not total 100 percent because the "Sontetimes" categoryis not included. *1* Sample size is insufficient to permit a reliable estimate (fewer than 62 students).
134
THE 1990 NAEP TRIAL STATE ASSESSMENT 129

North Dakota
TABLE A20 I Students' Knowledge of Using CalculatorsPERCENTAGE OF STUDENTS AND
AVERAGE MATHEMATICS PROFICIENCY
ISS0 NAEP TRIAL "Calculator-Use" "CMculator-Use"STATE ASSESSMENT
High Group Ot Mr Grow
,
TOTAL
Parcantap Pareantatand and
Paoli Idiocy Madam
State 56 ( 1.5) 44 ( 1.5)286 ( 1.8 275 ( 1.8)
Nation 42 ( 1.3 Set 1.3)272 ( 12) 255 ( 1.5)
RACE/ETWOCITY
M.State 57 ( 1.6) 43 ( 1.6)
288 ( 1.6) 279 ( 1.5)Nation 44 ( 1.4) 56 ( 1.4)
277 ( 1.7) 263 ( 1.7)Hispank
Sts.e 54 ( 8.9) 46 ( 6.9)IMO ( CM/
Nation 38 ( 42) 84 ( 42)254 ( 4.8) 238 ( 3.0)
American IndianState 32 ( 7.3) 88 ( 7.3)
240 ( 3.9)1Nation 29 (12.0)
***71 (12.0)
TYPE OF COMMUNITY
Advantaged urbanState 50 ( 5.6)
44-.)50 ( 5.6)
Nation 50 ( 3.8) 50 ( 3.8)288 ( 4.9)1 275 ( 4.4)1
Extreme ruralState 55 ( 2.3) 45 ( 2.3)
286 ( 2.5) 272 ( 3.6)Nation 39 ( 5.6) 81 ( 5.8)
289 ( 4.4)1 248 ( 4.3)1Other
State 57 ( 1.7) 43 ( 1.7)286 ( 2.3) 275 ( 1.9)
Nation 42 ( 1.4) 58 ( 1.4)271 ( 1.9) 255 ( 2.0)
The sti ndard errors of the estimated statistics appear in parentheses. It can be said with about 95 percentcertainty that, for each population of interest, the value for the entire population is within ± 2 standard errorsof the estimate for the sample. Interpret with caution -- the nature of the sample does not allow accuratedetermination of the variability of this estimated mean proficiency. "1* Sample size is insufficient to permit areliable estimate (fewer than 62 students).
t L.)
130 THE 1990 NAEP TRIAL STATE ASSESSMENT

North Dakota
TABLE A20 I Students' Knowledge of Using Calculators(continued) I
PERCENTAGE OF STUDENTS ANDAVERAGE MATHEMATICS PROFICIENCY
1800 MEP TRW.STATE MOSESSMENT
High "Cidadator-Use" Group Other "Caiculattw-Uee" OANIP
TOTAL
Per4Nolele8811
Praid01441,
208 1.642 1.3
272 1.6
State
Nation
PA/MI5' EpLICATION146 non-graduate
State 34 ( 8.6)***)
oistion 34 ( 3.3)248 ( 4.4)
149 graduateState 56 ( 3.2)
277 ( 2.6)Nation 40 ( 22)
263 ( 2.0)Some colkoge
State SS ( 3.4)290 ( 2.7)
Nation 48 ( 22)277 ( 2.6)
CeRege graduateState 57 ( 2.1)
292 ( 1.8)Nation 48 ( 2.0)
282 ( 2.1)
GENDER
MaleState 53 ( 2.5)
288 ( 2.0)Nation 39 ( 2.0)
274 ( 2.0)Female
State 59 ( 2.3)284 ( 2.1)
Nation 45 ( 1.8)269 ( 1.7)
awldirelkisicy
44 ( 1.5)275 ( 14)58 ( 1.3)
255 ( 1.5)
66 ( 8.8)( ***)
ea ( 3.3)242 ( 2.4)
44 ( 3.2)207 ( 3.2)00 ( 2.2)
249 ( 1.8)
42 ( 3.4)276 ( 2.3)52 ( 2.2)
258 ( 2.5)
43 ( 2.1)283 ( 2.5)54 ( 2.0)
208 ( 1.9)
47 ( 2.5)270 ( 2.5)
( 2.0)255 ( 2.3)
4? ( 2.3)273 ( 1.9)55 ( 1.8)
254 ( 1.3)
The standard errors of the estimated statistics appear in parentheses. It can be said with about 95 percentcertainty that, for each population of interest, the value for the entire population is within ± 2 standard errorsof the estimate for the sample. *** Sample size is insufficient to permit a reliable estimate (fewer than 62students).
136
THE 1990 NAEP TRIAL STATE ASSESSMENT 131

North 2. ia
TABLE A24 I Students' Reports on Types of ReadingI Materials in the Home
PERCENTAGE OF STUDENTS ANDAVERAGE MATHEMATICS PROFICIENCY
MO NAEP TRIALSTATE ASSESSMENT
Zero to Two Typos Pow Typos
TOTAL
Pernantageand
Skolicialoy
Persentageand
Prolledency
Potvonlogoowl
Proildoncy
State 10 ( 1.0) 30 ( 12) ex 1.3)261 ( 3.5) ( 1.8) ( 0.9)
Nation 21 ( 1.0) 90 ( 1.0) ( 41.3)
244 ( 2.0) 258 ( 1.7) 272 ( 1.5)
NMI/IMO.%Mita
State ( 0.0) 30 ( 1.3) 63 ( 1.3)269 ( 2.8) 284 ( 1.6) 288 ( 1.0)
Nation 16 ( 1.1) 29 ( 1.3) 58 ( 13)251 ( 22) 268 ( 1.5) 278 ( 13)
HispankState 25 ( 6.8) 35 (.44 (
8.2)041
40((
1.0)fen
Nation 44 ( 3.0) 30 ( 2.4) 26 ( 2.3)237 ( 3.4) 244 ( 4.3) 253 ( 2.4)
American WhenState 32 (
.4*2.8) 44 ( 4.3) 24 ( 4.2)Vi
Nation 29 (11.1)***)
40 ( 4.9) 31 (4* 9.21*41(
TYPE OF COMMUNITY
Advantaged urbanState 8 ( 28) 29 ( 6.4) 63 ( 6.1)
*00 ( 269 ( 1.5)
Nation 13 (4.* (
3.8) 26 (4*. (
2.1).41
61 (287 (
4.9)3.6)!
Extreme ruralState 9 ( 1.4) 30 ( 1.7) 51 ( 1.7)
253 ( 6.4) 277 ( 4.1) 2135 ( 1.0)Nation 17 ( 4.9) 33 ( 3.2) 50 ( 5.1)
253 ( 4.3)i 263 ( 5.6)1
OtherState 10 ( 1.6) 30 ( 1.8) 60 ( 2.0)
263 ( 4.8) 232 ( 2.2) 265 ( 1.3)
Nation 22 ( 1.5) 30 ( 1.3) 46 ( 1.5)244 ( 2.8) 259 ( 2.2) 272 ( 1.7)
The standard errors of the estiolated statistics appear in parentheses. It can be said with about 95 percentcertainty that, for each populatie.1 of :rest, the value for the entire population is within * 2 standard errorsof the estimate for the sample. Interpret with caution - the nature of the sample does not allow accuratedetermination of the variability of this estimated mean proficiency. "8 Sample size is insufficient to permit areliable estimate (fewer than 62 students).
137
132 THE 1990 NAEP TRIAL STATE ASSESSMENT

North Dakota
TABLE A24 I Students' Reports on Types of Reading(continued) I Materials in the Home
PERCENTAGE OF STUDENTS ANDAVERAGE MATHEMATICS PROFICIENCY
1990 MAEP TRIALSTATE ASSESSMENT
Zero to Two Types Trims Types Four Types
TOTAL
Percentageand
Prolidency
Plavantageand
Proficiency
Percentageand
Proficiency
State 10 ( 1.0) 30 ( 12) CO ( 1.3)261 ( 3.5) 280 ( 1.8) 285 ( 0.9)
Nation 21 ( 1.0) 30 ( 1.0) 48 ( 1.3)244 ( 2.0) 258 ( 1.7) 272 ( 1.5)
PARENTS EDUCATION
HO nors-graduateState
Nation 47 ( 4.0) 28 ( 3.0) 25 ( 2.8)240 ( 3.4) 243 ( 3.3) 246 ( 3.3)
HS graduateState 14 ( 2.2) a* ( 2.5) 54 ( 2.3)
253 ( 4.8) 272 ( 3.4) 278 ( 2.1)Nation 26 ( 2.2) 33 ( 1.9) 40 ( 1.7)
246 ( 2.2) 253 ( 2.7) 260 ( 2.1)Some college
State 8 ( 1.8) 30 ( 2.8) 62 ( 3.0)( 282 ( 2.5) 285 ( 2.2)
Nation 17 ( 14) 32 ( 1.7) 51 ( 2.0)251 ( 4.0) 262 ( 2.6) 274 ( 1.9)
College gracluateState 6 ( 1.2) 28 ' : ' 65 ( 1.9)
281 290 ( 1-3)Nation 10 ( 0.8) 26. , " 62 ( 2.0)
254 ( 2.8) 269 ( :e....41 280 ( 1.8)
GENDER
MaleState 10 ( 1.2) 29 ( 1.6) 61 ( 1.9)
264 ( 3.6) 282 ( 32) 288 ( 1.3)Nation 21 (
244 (1.5)2.3)
31 (259 (
14)2.1)
48 (273 (
1.4)2.0)
FemaleState 9 ( 1.3) 31 ( 1.8) 59 ( 1.7)
257 ( 5.9) 278 ( 1.8) 282 ( 1.6)Nation 22 ( 1.2) 29 ( 1.4) 49 ( 1.9)
244 ( 2.2) 258 ( 1.9) 270 ( 1.7)
The standard errors of the estimated statistics appear in parentheses. It can be said with atm:, 95 percentcertainty that, for each population of interest, the value for the ritire population is within ± 2 standard errorsof the estimate for the sample. *** Sample size is insufficient to permit a reliable estimate (fewer than 62students).
1 18
THE 1990 NAEP TRIAL STATE ASSESSM EN , 133

North Dakota
TABLE A25 I Students' Reports on the Amount of Time SpentI Watching Television Each Day
PERCENTAGE OF STUDENTS ANDAVERAGE MATHEMATICS PROFICIENCY
1
11790 NAEP TRIAL One Hour or Four to Five Six Hours orSTATE ASSESSMENT Less T wo Hours Three Hours Hours More
TOTAL
Peramtageand
Pro *Maw
14 ( 0.9)
Porcentagaand
Wolk Macy
27 ( 1.2)
illeroantagsand
Pro Many
24 ( 1.2)
Pannuntagaand
Pro edam
24 ( 13)
Parcsata
Pr8081808W
( 81)* te289 ( 2.0) 263 ( 1.3) 2$2 ( 279 2.3) 284 ( 3.1)
volition 12 ( 0.8) 21 ( 0.9) 22 ( 0.6 28 1.1) 15 ( 1.0)209 ( 24) 205 ( 1.8) 206 ( 1.7 200 1.7) 245 ( 1.7)
RACE/ETHNICITY
WhiteState 15 ( 0.9) 28 ( 1.3) 24 ( 1.3) 25 ( 1.4) (
290 ( 2.0) 255 ( 1.5) 255 ( 1.4) 283 ( 2.1) 270 ( 2.4Nation 13 ( 1.0) 23 ( 1.2) 24 ( 1.1) 27 ( 1.4) 12 ( 1.2
278 ( 2.5) 275 ( 2.2) 272 ( 14) 1.7) 253 ( 2.4Hispanic
State 10 ( 42)ipos ( *61 32 t a 0)) 21 ( 0.1) 29 ( 8.3)
440 ( .4418 ( 42)
1P 11.1
Nation 14 ( 2.4) :0 ( 2.5) 19 ( 2.1) 31 ( 3.1) 17 ( 1.7)*SIP ( WO* ) 245 ( 3.2) 242 ( 5.6) 247 ( 3.5) 235 ( 3.5)
American IndianState 9 ( 3.0)
vs.)14 ( 2.1)
felt ( 11 27 ( 4.7)es. (
36 ( 4.6)***)
14 ( 4.1)«he (
Nation 13 ("ir 44 )
21 (10.5).0**)
25 ( 5.7)*4* (
22 ( 5.4)«04. ( «el
TYPE Of COMMUNITY
Advantaged urbanState 21 ( 4.3) 24 ( 5.4) 25 ( 8.5)
(22 ( 2.1)te ( *4-1 3 ( 1.9)1014fr )
Nation 18 ( 1.4)svs)
25 ( 4.3)(
21 ( 1.8)s,H,)
30 ( 4.3) ( 2.0)(
Extreme ruralState 14 ( 1.3) 24 ( 1.7) 25 ( 1.2) 31 ( 1.7) 8 ( 1.1)
285 ( 2.3) 285 ( 1.0) 278 ( 2.5) 279 ( 3.8) 253 ( 8.8)Nation 14 ( 3.3)( .41 26 ( 2.7)
256 ( 3.6)1Other
State 13 ( 12) 29 ( 1.6) 27 ( 1.7) 24 ( 2.2) 7 ( 1.1)290 ( 3.3) 282 ( 1.7) 283 ( 2.4) 279 ( 3.3) 271 ( 2.5)
Nation 12 ( 1.0) 21 ( 1.0) 23 ( 1.2) 27 ( 1.2) 17 ( 1.4)268 ( 2.6) 289 ( 2.3) 265 ( 2.1) 259 ( 2.2) 246 ( 2.5)
The standard errors of the estimated statistics appear in parentheses. It can be said with about 95 percentcertainty that, for each population of interest, the value for the entire population is within ± 2 standard errorsof the estimate for the sample. ! Interpret with caution - the nature of the sample does not allow accuratedetermination of the variability of this estimated mean proficiency. *** Sample size is insufficient to permit areliable estimate (fewer than 62 students).
()t t
134 THE 1990 NAEP TRIAL STATE ASSESSMENT

North Dakota
TABLE A25 I Students' Reports on the Amount of Time Spent(continued) I Watching Television Each Day
PERCENTAGE OF STUDENTS ANDAVERAGE MATHEMATICS PROFICIENCY
1000 NAEP TRIALSTATE ASSESSMENT
Ono Hour or 'PauLoss Nom{
1 n HoursTar
.
Four' to FivoHours
SIx Hours orMons
TOTAL
Percentageand
Pradancy
14 ( 0.9)289 ( 2.0)12 ( 0.8)
269 2.2)
13 ( 4.9).4112 ( 22)a* ( el1 0 ( 1.8)
282 ( 3.6)8 ( 1.0)
249 ( 4.7)
15 ( 2.4)283 ( 3.6)
10 ( 1.4)***)
17 ( 1.4)295 ( 2.8)17 ( 1.3)
282 ( 2.6)
11 ( 1.1)290 ( 2.8)11 ( 0.9)
269 ( 3.3)
18 ( 1.5)288 ( 25)
14 ( 1.1)269 ( 2.8)
Paroantagsand
Prollidency
27 ( 1.2)263 ( 1.3)21 ( 0.9)
268 ( 1.8)
25 ( 6.9)1144 ( *41
24 ( 2.3)274 ( 3.4)
17 ( 1.4)257 ( 2.8)
26 ( 2.8)285 ( 2.5)25 ( 2.4)
275 ( 2.7)
30 ( 2.0)289 ( 1.9)
22 ( 1.6)280 ( 2,5)
25 ( 1.9)287 ( 1.8)22 ( 1.2)
267 ( 2.6)
30 ( 1.6)280 ( 2.0)20 ( 1.3)
269 ( 22)
Parcantagaand
Prolidency
26( 1.2)282 ( 1.6)22 ( 0.8)
2es ( 1.7)
30 ( 6.3)
21 ( 2.8)
25 ( 2.6)275 ( 3.0)23 ( 2.0)
259 ( 3.2)
25 ( 2.4)281 ( 4.1)
23 ( 2.6)269 ( 3.5)
26 ( 1.8)289 ( 2.4)
23 ( 1.1)277 ( 2.2)
30 ( 1.5)285 ( 2.1)22 ( 1.0)
267 ( 2.2)
21 ( 1.8)277 ( 2.5)23 ( 1.4)
264 ( 1.8)
Psroantagaand
PM/dem
20 ( 1.3)279 ( 2.3)26 ( 1.1)
260 ( 1.7)
20 ( 5.3)( «al28 ( 2.9)
244 ( 3.2)
32 ( 2.8)270 ( 4.1)32 ( 2.3)
253 ( 2.5)
31 ( 3.2)284 ( 3.6)28 ( 22)
267 ( 2.5)
22 ( 1.8)286 ( 2.8)25 ( 1.5)
270 ( 2.4)
27 ( 1.6)282 ( 2.8)28 ( 1.3)
252 ( 2.1)
25 ( 1.7)275 ( 2.4)28 ( 1.6)
258 ( 1.9)
Parcantagaand
!madam
( 0.7)264 ( 3.1)16 ( 1.0)
245 ( 1.7)
12 ( 4.3)«Hi ( fin20 ( 2.4)
( 441
9 ( 1.3)( .4119 ( 1.6)
248 ( 3.0)
3 ( 1.0)Mr* ( 441
14 ( 1.5)242 ( 3,4)
5 ( 0.9)
12 ( 1.1)255 ( 3.2)
( 1.1)269 ( 2.6)
17 ( 1.5)248 ( 2.5)
5 ( 1.0)256 ( 5.3)115 ( 1.2)
241 ( 2.2)
State
Nation
PARENTS EDUCATION
H5 nonipraduateState
Nation
HS oraduatoState
Nation
Som collegeState
Nation
College graduateState
Nation
GENDER
MaleState
Nation
FsmaleState
Nation
The standard errors of the estimated statistics appear in parentheses. It can be said with about 95 percentcertainty that, for each population of interest, the value for the entire population is withM ± 2 standard errorsof the estimate for the sample. ! Interpret with caution -- the nature of the sample does not allow accuratedetermination of the variability of this est& .ed mean proficiency. *** Sample size is insufficient to permit areliable estimate (fewer than 62 students).
1 40
THE 1990 NAEP TRIAL STATE ASSESSMENT 135

North Dakota
TABLE A26 I Students' Reports on the Number of Days of1 School Missed
PERCENTAGE OF STUDENTS ANDAVERAGE MATHEMATICS PROFICIENCY
rSagNAEP TRIAL
TATE ASSESSMENTNone One or TWO Days Three Dalt* re' Mere
TOTAL
PlifoRlaisand
Prolidatcy
Parambigesad
Palidency
Paraddigeaid
Prellaamt
State 50 ( 1.2) 30 ( 1.2) 14 ( 1.0)285 1.2) 281 1.3) 289 ( 2.9)
Nation 45 1.1) 32 0.9) 23 ( 1.1)
twojrnimictry
205
51 (
1.8)
1.1)
ne
35 (
1.5)
12)
250 (
13 (
1.9)
1.0)write
state287 ( 1.1) 284 ( 1.3) 275 ( 2.3)
Nation 43 ( 1.2) 34 ( 12) 23 ( 1.2)273 ( 1.8) 272 ( 1.7) 258 ( 2.1)
HispankState 37 (
(7.3)4.1
43 ( 8.4) 20 ( 5.9)
Natlon 41 ( 3.3) 32 ( 22) 27 ( 2.6)245 ( 4.6) 250 ( 3.3) 235 ( 3.1)
Modem IndianState 26 ( 2.5) 41 ( 3.4) 33 ( 4.3)
Nation 23 ( 8.8)gpie.)
39 (et*
5.1)**) 38 (***
5.2)***)
TYPE OF COMMUNITY
Advantaged urbanState 48 (
Mr* (4.7) 38 ( 5.6)*el 14 ( 2.0)
Nation 47 ( 2.3) 38 ( 2.6)284 ( 4.4)1 279 ( 4,5)1 4-4H1
Extreme ruralState 51 ( 1.7) 34 ( 1.7) 15 ( 1.7)
284 ( 1.8) 281 ( 2.5) 284 ( 5.8)Nation 43 ( 4.4) 32 ( 4.2) 25 ( 3.8)
257 ( 4.1)1 264 ( 5.8)1Other
State 48 ( 1.8) 37 ( 1.5) 15 ( 1.7)285 ( 1.6) 282 ( 1.8) 272 ( 3.0)
Nation 1.3) 32 ( 1.1) 23 ( 1.1)265 ( 2.2) 266 ( 1.9) 251 ( 2.4)
The standard errors of the estimated statistics appear in parentheses. It can be said with about 95 percentcertainty that, for each population of interest, the value for the entire population is within ± 2 standard errorsof the estimate for the sample. I Interpret with caution - the nature of the sample does not allow accuratedetermination of the variability of this estimated mean proficiency. *** Sample size is insufficient to permit areliable estimate (fewer than 62 students).
141
136 THE 1990 NAEP TRIAL STATE ASSESSMENT

North Dakota
TABLE A26 I Students' Reports on the Number of Days of(mntinued) I School Nlissed
PERCENTAGE OF STUDENTS ANDAVERAGE MATHEMATICS PROFICIENCY
1880 NAEP TRIALSTATE ASSESSMENT
Mona 1_ One or Two Days Three Days or More
TOTAL
State
Nation
PARENTS goucAroN
NS non-graduateState
Nation
HS graduateState
Nation
Some collegeState
Nation
College graduateState
Nation
OENDER
M.State
Nation
FemaleState
Nation
losrosetageand
Pridlaisacy
50 1.2)265 1.2)45 1.1)
285 1.6)
29 ( 5$)
38 ( 3.2)245 ( 3.0)
49 ( 3.1)275 ( 2.9)43 ( 2.1)
255 ( 2.0)
47 ( 3.7)265 ( 2.2)40 ( 1.6)
270 ( 3.0)
54 ( 1.9)291 ( 1.3)51 ( 1.8)
275 ( 2.1)
55 ( 1.8)288 ( 1.7)47 ( 1.8)
288 ( 2.0)
45 ( 2.0)283 ( 1.9)43 ( 1.4)
264 ( 2.3)
Pomade.tad
Prelikkincy
38 ( 1.2261 ( 1,3132 ( 0.9
208 ( 1.5)
43 ( 8.4)*Mt ( fen
Poremelpami
Pralkienay
14(1.9)209 2.9123 1.1)
250 1.9)
28 ( 5.9).414.
26 ( 3.1) 3.5)249 ( 3.3) 237 ( 3.1)
32 ( 2.9) 19278 ( 2.8) 262 5.131 ( 1.9) 27 1.9
257 ( 2.8) 249 ( 24)
44 ( 3A) 10 (IA)263 ( 2.7) IN* 1441)
37 ( 1.8) 23 1.8)271 ( 2.5) 253 ( 3.1)
33 ( 1.9) 13 ( 1.3)286 ( 2.0) 278 ( 4.1)33 ( 1.2) 18 ( 1.3)
277 ( 1.7) 285 ( 3.1)
33 ( 1.9) 12 ( 1.4)234 ( 2.1) 276 ( 3.8)
31 ( 1A) 22 ( 1.4)267 ( 2.1) 250 ( 2.6)
38 ( 1.7) 17 ( 1.6)279 ( 1.9) 265 ( 3.3)
32 ( 1.1) 25 ( 1.3)208 ( 1.7) 250 1.8)
The standard errors of the estimated statistics appear in parentheses. It can be said with about 95 percentcertainty that, for each population of interest, the value for the entire population is within ± 2 standard errorsof the estimate for the sample. *** Sample size is insufficient to permit a reliable estimate (fewer than 62students).
72
THE 1990 NAEP TRIAL STATE ASSESSMENT 137

North Dakota
TABLE A27 I Students' Perceptions of MathematicsPERCENTAGE OF STUDENTS AND
AVERAGE MATHEMATICS PROFICIENCY
1990 NAEP TRIALSTATE ASSESSMENT Sir/m*441m Agin Undecided. Disagree,
Wrongly Disagree
TOTAL.
Percentageand
Pr Cadency
Percentageand
Proficiency
Percentageand
PreNdency
State 29 ( 1.5) 50 ( 1.4) 20 ( 1.1)293 ( 1.5) 2S0 ( 1.5) 268 ( 2.2)
Nation 27 ( 1.3) 49 ( 1.0) 24 ( 1.2)271 ( 1.9) 262 ( 1.7) 251 ( 1.6)
RACE/ETHNICITY
WO,State 30 ( 1.5) 51 ( 1.5) 20 ( 1.1)
296 ( 1.3) 283 ( 1.4) 272 ( 1.9)Nation 26 ( 1.6) 4$ ( 1.3) 26 ( 1.5)
279 ( 2.0) 272 ( 1.8) 257 ( 2.0)Hispanic
State 23IMP
( 7.4)(
37 (***
8.2)*44 )
40 (. 7.4)41Nation 24 ( 2.5) 48 ( 2.6) 28 ( 2.1)
257 ( 5.5) 244 ( 2.2) 236 ( 3.8)American Indian
State 17 ( 3.3)f.e.)
50 (248 (
7.5)3.8)1
34 ((
52)
Nation 23 ( 7.4)(
48 (14.9)SIM ( 41.1111)
29 (***
9.5)**)
TYPE OF COMMUNITY
Aidvantaged urbanState 36 ( 4.7) 49 ( 5.2) 15 ( 1.5)
( **It) 0,11* 41.44 ( *TR )
Nation 17 ( 3.2) 55 (280 (
2.4)4.1)1
28 ( 4.2)*44)
Extreme ruralState 28 ( 2.1) 50 ( 1.9) 22 ( 1.7)
202 ( 2.8) 280 ( 2.5) 266 ( 3.6)Nation 34 ( 2.8) 49 ( 2.2)
270 ( 3.9)1 252 ( 4.1)1
OtherState 28 ( 2.3) 50 ( 2.3) 22 ( 1.8)
295 ( 2.2) 281 ( 2.0) 269 ( 2.9)Nation 27 ( 1.4) 4$ ( 1.2) 25 ( 1.4)
271 ( 2.4) 263 ( 2.2) 250 ( 1.9)1The standard errors of the estimated statistics appear in parentheses. It can be said with about 95 percentcertainty that, for each population of interest, the value for the entire population is within ± 2 standard errorsof the estimate for the sample. I Interpret with caution - the nature of the sample does not allow accuratedetermination of the variability of this estimated mean proficiency. *** Sample size is insufficient to permit areliable estimate (fewer than 62 students).
138 THE 1990 NAEP TRIAL STATE ASSESSMENT

North Dakota
TABLE A27 I Students' Perceptions of Mathematics(continued) I
PERCENTAGE OF STUDENTS ANDAVERAGE MATHEMATICS PROFICIENCY
MO NAEP MALSTATE ASSESSMENT Wan* Airs* AM* Undecided, Disagree,
Strongly Disagree
TOTAl,
Percentageand
Pre Odom
Pireatilleand
Proficiency
Peramenieand
Prolkdency
State 29 ( 14) 50 ( 14) 20 ( 1.1)293 ( 1.5) 280 ( 1.5) 2S8 ( 22)
Nation 27 ( 1.3) 49 ( 1.0) 24 ( 1.2)271 ( 1.9) 2112 ( 1.7) 251 ( 14)
PARENTS EDUCATION
NS non-graduateState 16 ( 5.0)*41
54 ( 82) 29 7.5)
Nation 50 ( 3.3) 30 ( 3.6)243 ( 2.6) 238 ( 4.3)
Id graduateState 26 ( 2.3) 51 ( 2.8) 23 ( 2.4)
284 ( 3.9) 273 ( 2.6) 200 ( 3.5)Nation 27 ( 2.1) 47 ( 2.3) 26 ( 2.0)
262 ( 2.7) 255 ( 2.3) 245 ( 2.4)Some college
State 27 ( 2.5) 53 ( 2.9) 20 ( 2.4)292 ( 2.3) 283 ( 2.3) 272 ( 4.3)
Nation 28 ( 2.5) 47 ( 2.4) 25 ( 1.8)274 ( 3.1) 267 ( 1.9) 258 ( 32)
Coi lege graduateState 34 ( 2.3) 50 ( 1.7) 17 ( 1.4)
300 ( 1.9) 285 ( 1.8) 277 ( 2.3)Nation 30 ( 2.3) 51 ( 1S) 19 ( 1.8)
280 ( 2.4) 274 ( 2.2) 206 ( 2.5)
GENDER
State 31 ( 1.9) 50 ( 1.9) 19 ( 1.5)298 ( 2.2) 262 ( 1.5) 271 ( 2.6)
Nation 28 ( 1.5) 48 ( 1.2) 24 ( 1.4)273 ( 2.3) 283 ( 2.0) 251 ( 2.4)
FemalState 28 ( 1.9) 50 ( 2.0) 22 ( 1.7)
289 ( 2.0) 278 ( 2.0) 265 ( 2.7)Nation 26 ( 1.7) 50 ( 1.7) 25 ( 1.9)
269 ( 2.1) 2EG ( 1.8) 252 ( 1.9)
The standard errors of the estimated statistics appear in parentheses. It can be said with about 95 percentcertainty that, for each population of interest, the value for the entire population is within ± 2 standard errorsof the estimate for the sample. *** Sample size is muff-icier to permit a reliable estimate (fewer than 62students).
144
THE 1990 NAEP TRIAL STATE ASSESSMENT 139

Acknowledgments
The design, development, analysis, and repotting of the first Trial State Assessment was truly acollaborative effort among staff from State Education Agencies, the National Center for Education Statistics(NCES), Educational Testing Service (ETS), Westat, and National Computer Systems (NCS). The programbenefitted from the contributions of hundreds of individuals at the state and local levels Governors, ChiefState School Officers, State and District Test Directors, State Coordinators, and district administrators whotirelessly provided their wisdom, experience, and hard work. Fmally, and most importantly, NAEP is gratefulto the students and school staff who participated in the Trial State Assessment.
Special recognition is due the Council of Chief State School Offirers (CCSSO) for its considerablecontributions to the program, especially its management of the National Assessment Planning Project. Thatproject resulted in the mathematics framework and objectives for the assessment and recommendationsabout reporting the results of the program. In particular, we note the significant contributions of RamsaySelden, Director of the State Education Assessment Center for the CCSSO and the members of the SteeringMathematics Objectives, and Analysis and Reports Committees of the National Assessment Planning Project.
The Trial State Assessment was funded through NCES, in the Office of Educational Research andImprovement of the US. Department of Education. Emerson Elliott, NCES Acting Commissioner, providedconsistent support and guidance. The staff particularly Gary Phillips, Eugene Owen, Stephen Gorman,Maureen Treacy, and Raul Garza worked closely and collegially with ETS, Westat, and NCS staff andplayed a crucial role in all aspects of the program.
The members of the National Assessment Governing Board (NAGB) and NAGB staff alsodeserve
credit for their advice and guidance.
We owe a great deal to the Mathematics Item Development and Mathematics Scale AnchoringPanels. These people from school districts, colleges and universities, and State Education Agenciesworked tirelessly to help ETS staff develop the assessment and a framework for interpreting the results.
Under the NAEP contract to ETS, Archie Lapointe served as the project director and Ina Mullis asthe deputy director. Statistical and psychometric activities were led by John Mazza, with consultation fromEugene Johnson and Donald Rock. John Barone managed the data analysis activities; Jules Goodison, theoperational aspects; Walter MacDonald and Chancey Jones, test development; David Hobson, the fiscalaspects; and Stephen Koffler, state services. Sampling and data collection activities were carried out byWestat under the supervision of Renee Slobasky, Keith Rust, Nancy Caldwell, and the late Morris Hansen.The printing, distribution, and processing of the materials were the responsibility of NCS, under the directionof John O'Neill and Lynn Zaback.
The large number of states and territories participating in the first Trial State Assessment introduced
many unique challenges, including the need to develop 40 different reports, customized for each jurisdictionbased on its charactesistics and the results of its assessed students. To meet this challenge, a computerizedreport generation system was built, combining the speed and accuracy of computer-generated data with highresolution text and graphics normally found only in typesetting environments. Jennifer Nelson created thesystem and led the computer-based development of the report. John Mazzeo oversaw the analyses for thisreport. John Ferris, David Freund, Bruce Kaplan, Edward Kulick, and Phillip Leung collaborated to generatethe data and perform analyses. They were assisted by Drew Bowker, Laura McCamley, and Craig Pizzuti.Debra Kline coordinated the efforts of the data analysis staff. Stephen Koffier wrote the text for the report.Kent Ashworth was responale for coordinating thc cover design and final printing of this report.
Special thanks are also due to many individuals for their invaluable assistance in reviewing thereports, especially the editors who improved the text and the analysts who checked the data.
1 5

146


![Nanoparticles For Soot Reduction [Div]](https://static.fdocuments.in/doc/165x107/61fbd2699871014c47523f3a/nanoparticles-for-soot-reduction-div.jpg)


