Teletech Corporation, 2005
24
Teletech Corporation, 2005 Estimating the Cost of Capital
-
date post
05-Dec-2015 -
Category
Documents
-
view
245 -
download
26
description
sdf
Transcript of Teletech Corporation, 2005

Teletech Corporation, 2005Estimating the Cost of Capital

“Wake-up Call Needed” - Investors
Reclusive Billionaire Victor Yossarian acquired 10% stake in Telectech in October 2005.
• His Demands are:
Two Seats on the Board of Directors.
Sell Product and System segment.
Focus on creating value for Shareholders.

Teletech Corporation
A large regional telecommunication firm headquartered in Dallas,
Texas.
Provider of Integrated information movement and management.
Telecommunication Services
Long-distance, local, and cellular telephone service.
Business and residential customers.
Product and Systems
Manufacturer of computing and telecommunication equipment.
Business Segments

Executives
Maxwell Harper, CEO
Margaret Weston, CFO
Rick Phillips, VP(Telecommunication)
Helen Buono, VP(Product and System)

Telecommunication ServicesMerits:
Purchase of few telephone-operating companies through auctions in Latin America.
Has invested aggressively in new technology (digital switches and optical fiber
cables).
Leading service provider in geographical market and product segments.
Leader in Customer satisfaction and Product quality.
Demerits:
× Lack of rate relief from Government regulators.
× Market penetration by competitors.
× Pressure on profit margins.
× Strategic decisions for investments are costly in this segment.
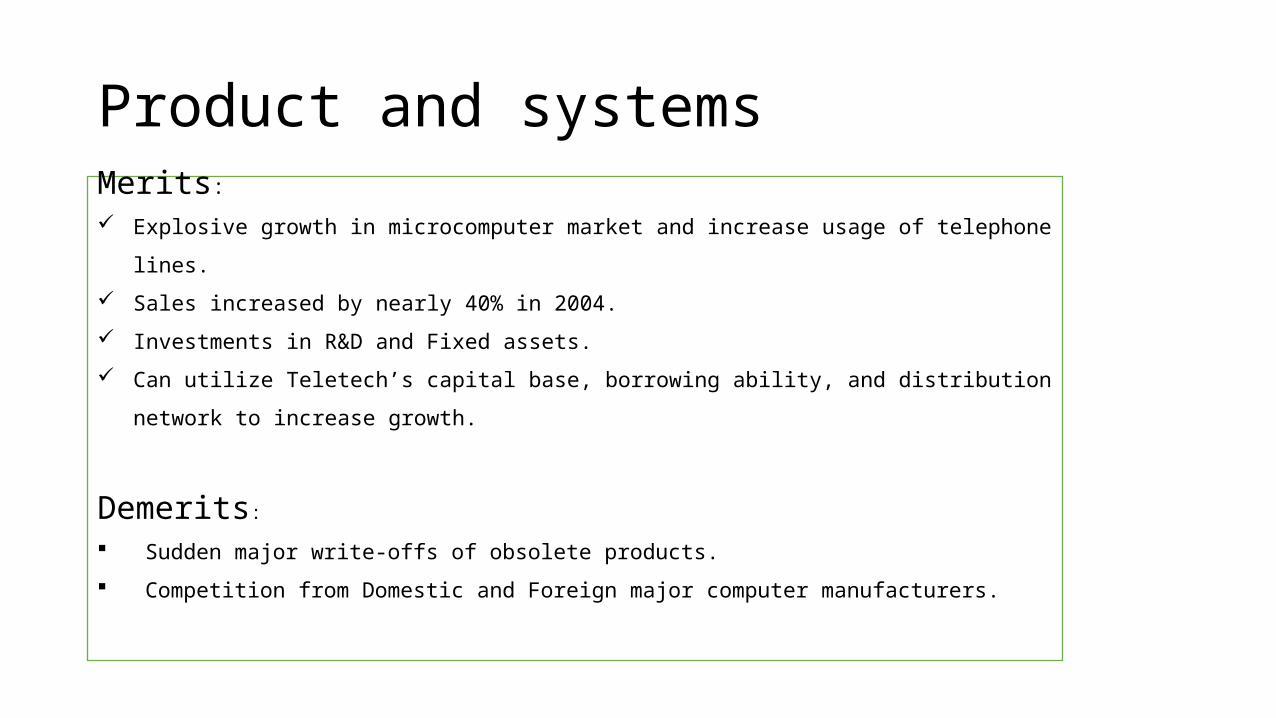
Product and systems
Merits:
Explosive growth in microcomputer market and increase usage of telephone lines.
Sales increased by nearly 40% in 2004.
Investments in R&D and Fixed assets.
Can utilize Teletech’s capital base, borrowing ability, and distribution network to
increase growth.
Demerits:
Sudden major write-offs of obsolete products.
Competition from Domestic and Foreign major computer manufacturers.

Key figures & Performance
TelecommunicationProduct and Systems
Return on Capital (9.58%) 9.10% 11%
Current Book Value ($16B) $11.4B $4.6B
Current Market Value (?) 75% 25%
Telecommunication Product and Systems
Revenue growth [2000-04] 3% 40%
Revenue $11B
NOPAT $1.18B $480m
Net Assets $11.4B $4.6B
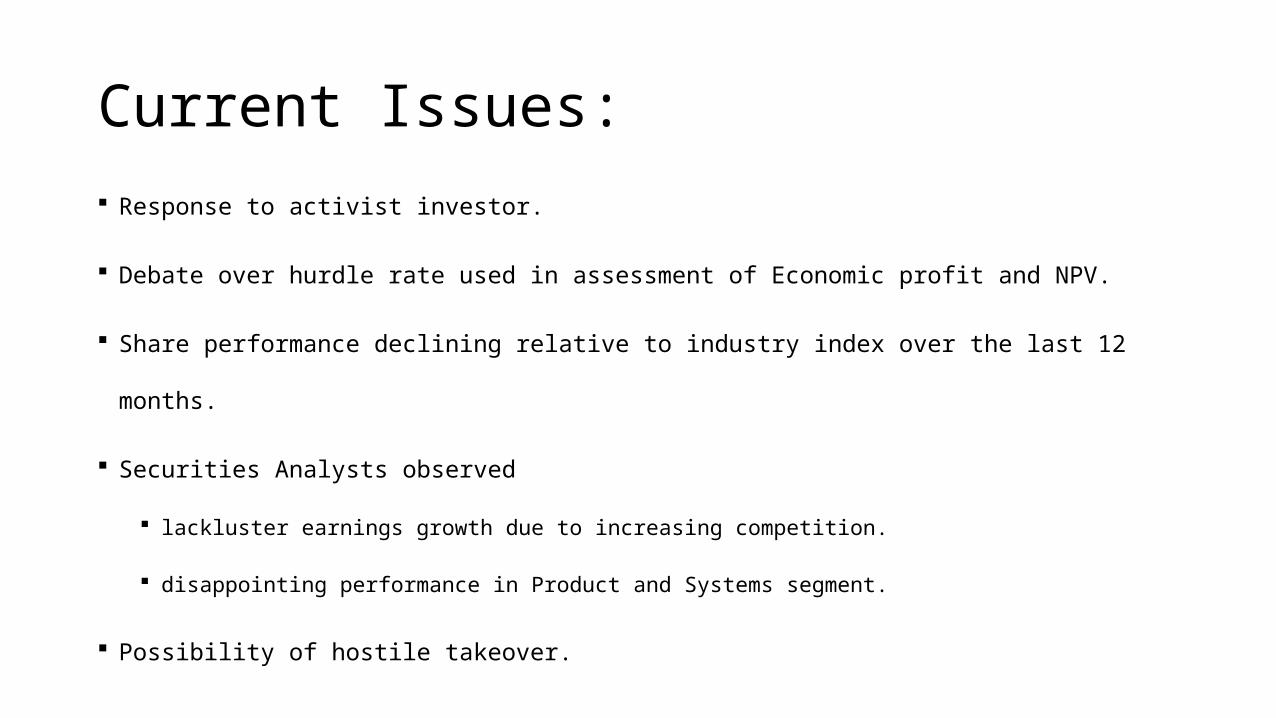
Current Issues:
Response to activist investor.
Debate over hurdle rate used in assessment of Economic profit and NPV.
Share performance declining relative to industry index over the last 12 months.
Securities Analysts observed
lackluster earnings growth due to increasing competition.
disappointing performance in Product and Systems segment.
Possibility of hostile takeover.

Share performance relative to industry index
Possibility of hostile takeover?

Rick Phillip – VP (Telecommunication)Both segments have different nature of risks.
Telecommunication has lower risk than Product and Systems segments.
Telecommunication can raise large capital from debt market with solid ‘A’ rating.
Product and Systems segment should be financed with high yielding (BB-) debt.
Multiple Hurdle Rate to get best return on equity and to reduce cost of equity
funds.
Stockholders are equally concerned with risk.
Comparatively higher debt funding for lower risk segment.

Rick Phillip’s assessment
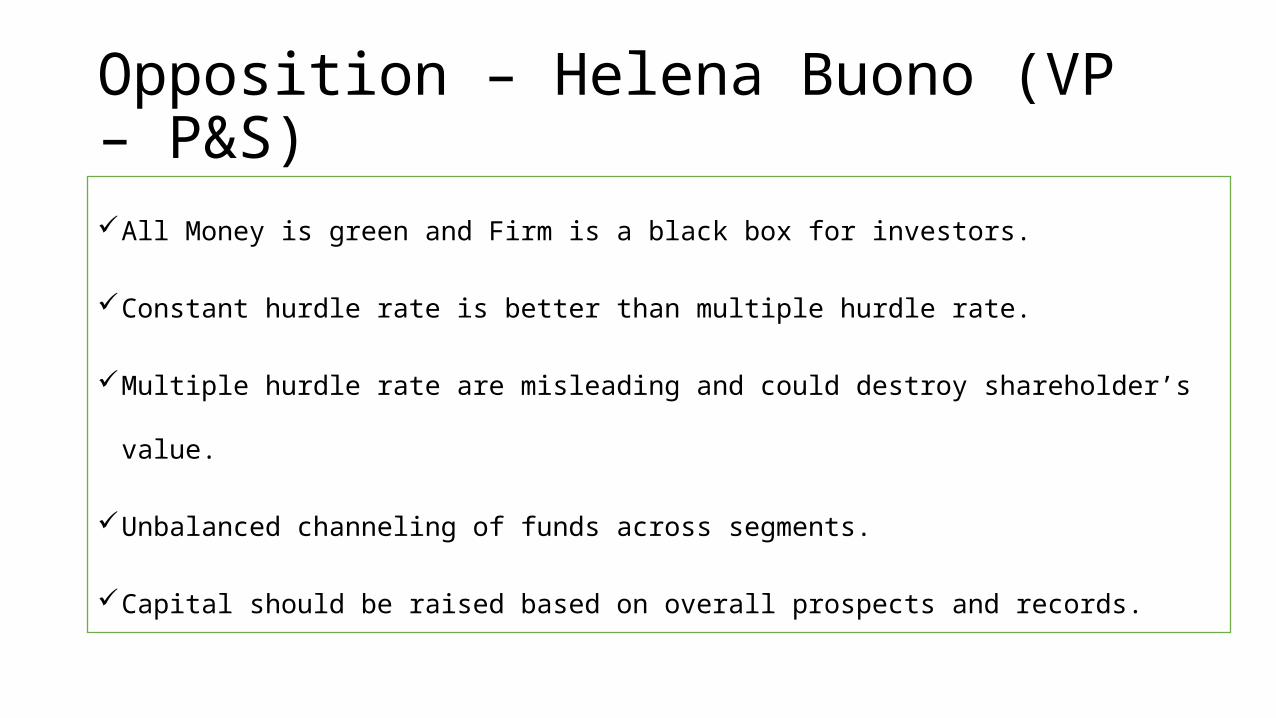
Opposition – Helena Buono (VP – P&S)All Money is green and Firm is a black box for investors.
Constant hurdle rate is better than multiple hurdle rate.
Multiple hurdle rate are misleading and could destroy shareholder’s value.
Unbalanced channeling of funds across segments.
Capital should be raised based on overall prospects and records.

Protagonist- Margaret Weston’s concerns• Corporate strategy is toward Integration of two segments.
• R&D and application projects seem difficult with multiple hurdle rate.
• Multiple hurdle rates are right based on capital costs not based on strategic cost.
• Lack of clarity to achieve strategic objective when allocating funds.
• Constant hurdle rate make NPV results consistent.
• Impossible to borrow debt for product and systems segment separately for high risk
projects.
• Investment decisions should not be mixed with financial decisions.
• Response to activist investor.

Capital Structure (Market)
No Preferred Shares

Market WACC - Telecommunication
Cost of equity = Risk free rate + Equity Beta (Risk Premium)
Equity Beta = Industry Beta = 1.04 (Exhibit 3)
Risk free rate = 4.62% (Exhibit 4)
Risk Premium = 5.50% (Exhibit 1)
Cost of equity = 4.62% + 1.04 (5.50%) = 10.34%
After-tax cost of debt = 3.44% (Exhibit 3)
Market WACC = 3.44% (22.2%) + 10.34% (77.8%) = 8.8081%
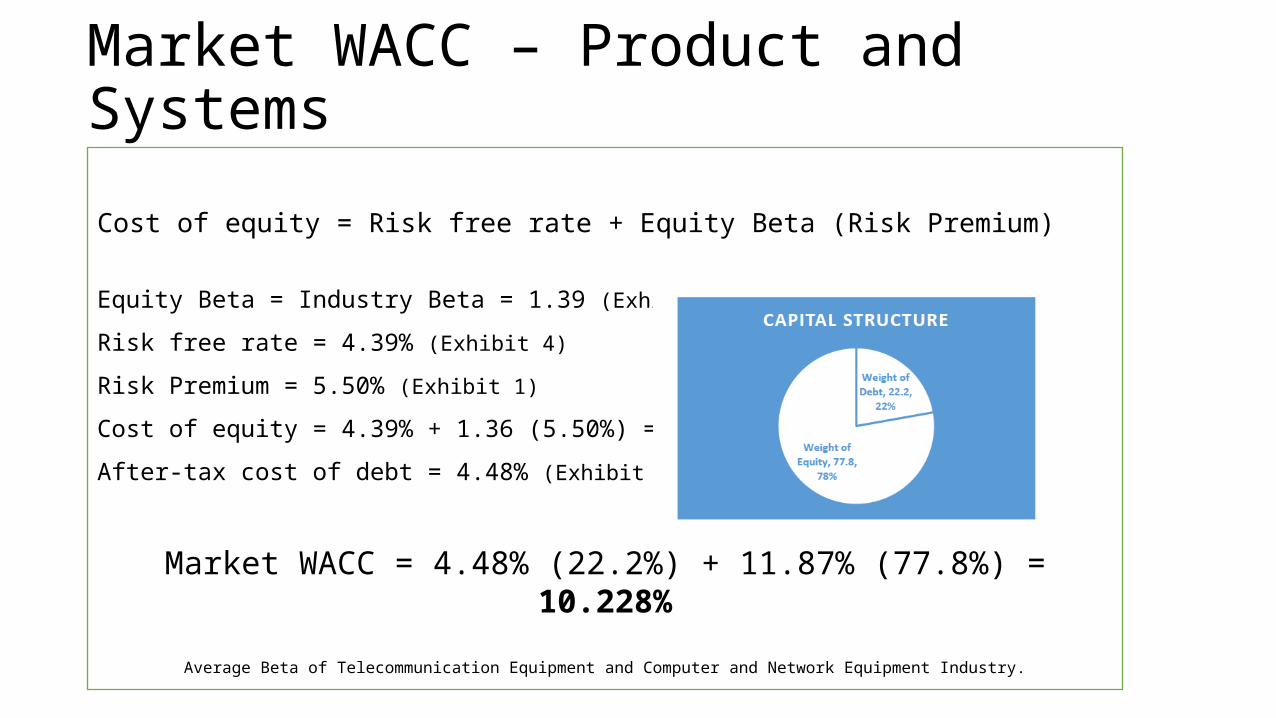
Market WACC – Product and Systems
Cost of equity = Risk free rate + Equity Beta (Risk Premium)
Equity Beta = Industry Beta = 1.39 (Exhibit 3)
Risk free rate = 4.39% (Exhibit 4)
Risk Premium = 5.50% (Exhibit 1)
Cost of equity = 4.39% + 1.36 (5.50%) = 11.87%
After-tax cost of debt = 4.48% (Exhibit 3)
Market WACC = 4.48% (22.2%) + 11.87% (77.8%) = 10.228%
Average Beta of Telecommunication Equipment and Computer and Network Equipment Industry.

Focus on value?
Economic profit = (ROC – Hurdle Rate) * Capital EmployedHurdle Rate for Telecommunication = 8.8081%
Hurdle Rate for Product and Systems = 10.228%
ROC NOPAT Capital Employed
=(NOPAT/ROC)
Economic Profit(Single
HR=9.30%)
Economic Profit(Multiple HR)
Telecommunication
9.10% $1.18 B $12.967 B $-2.5934 B $3.890 B
Product and Systems
11% $480 m $4.367 B $7.4239 B $3.372 B

Why Multiple Hurdle Rate?
WACC reflects average of market reaction to a mix of
risks.
Low risk projects – low premium - more acceptance.
High risk projects – high premium.
Maximize return on equity funds.
Helps to maximize return to shareholders.


Alternatives• To Increase IRR they could sell telecommunications equipment to leasing companies to lower the capital costs. They could separate the
business entirely into separate companies through a spin-off adjusting capitalization to meet the percentages generally used by competitors. •
• If these two companies were completely unrelated business lines I would say that they would need to sell one of the companies because its nearly impossible to manage completely different product lines as proven over and over again during the 1970’s and 1980’s when companies were looking to diversify into unrelated product lines.
• • Overall, I like the idea of having both companies within the corporate structure. The main reason is Teletech can use these two companies to develop interrelationship brands, which will enable the company to realize economies or scale and capacity utilization with the company. I think that there needs to be a continued investment into the separate product lines at separate hurdle rates as a form of diversification to the company to ultimately bring a higher NPV back to the shareholder.
• WACC for Telecommunications: 75% Debt Telecommunications = 11.77*(0.25) + 7.00*(0.6)*(0.75) = 2.94 + 3.15 = 6.09% • competition in this industry is extremely competitive. • The fact is there have been extensive buyouts and only a few competitors now dominate the industry. • My guess is Victor Yossarian would be looking to “flip” this investment to a dominant player in the industry such as Verizon. • Weston could lower the WACC by purchasing Yossarian's shares. If debt was used to purchase the shares, the new debt to equity ratio would be 28% debt and 72% equity. The new WACC for Telecommunications = 11.77*(0.72) +7.00*(0.6)*(0.28) = 8.47% + 1.18% = 9.65%

Weston’s response to Victor Yossarian

Questions?
• Why Market vs Book WACC?• Why 10 vs 30 year risk free rate?• What does the capital structure look like in both
segments?• Should we sell Product and Systems segment and if not
then why?• Should we use market industry beta? If yes then why?• Why should we use same market risk premium for all
WACC calculation?• Should we make our decision based on Economic profit?

Questions?
• Should two segments have different WACC if yes then
what are the assumption and implication of decisions?
• Why Exhibit 2 is so important?
• Why should we look for similar companies in Exhibit 3?

Questions?
Image Credit: http://www.opencolleges.edu.au/informed/features/student-driven-learning/