Telephone Questionnaire Assistance Customer … 2000 Evaluation A.1.b January 30, 2002 Telephone...
54
Census 2000 Evaluation A.1.b January 30, 2002 Telephone Questionnaire Assistance Customer Satisfaction Survey FINAL REPORT This evaluation reports the results of research and analysis undertaken by the U.S. Census Bureau. It is part of a broad program, the Census 2000 Testing, Experimentation, and Evaluation (TXE) Program, designed to assess Census 2000 and to inform 2010 Census planning. Findings from the Census 2000 TXE Program reports are integrated into topic reports that provide context and background for broader interpretation of results. Neala Stevens Planning, Research, and Evaluation Division
Transcript of Telephone Questionnaire Assistance Customer … 2000 Evaluation A.1.b January 30, 2002 Telephone...

Census 2000 Evaluation A.1.bJanuary 30, 2002
Telephone Questionnaire Assistance Customer Satisfaction Survey FINAL REPORT
This evaluation reports the results of research and analysis undertaken by the U.S. Census Bureau. It is part of a broad program, the Census 2000 Testing, Experimentation, and Evaluation (TXE) Program, designed to assess Census 2000 and to inform 2010 Census planning. Findings from the Census 2000 TXE Program reports are integrated into topic reports that provide context and background for broader interpretation of results.
Neala Stevens Planning, Research, and Evaluation Division

______________________________________________________________________ Intentionally Blank

CONTENTS
EXECUTIVE SUMMARY . . . . . . . . . . . . . . . . . . . . . . . . . . . . . . . . . . . . . . . . . . . . . . . . . . . . v
1. BACKGROUND . . . . . . . . . . . . . . . . . . . . . . . . . . . . . . . . . . . . . . . . . . . . . . . . . . . . . . . . . 11.1 Overview of the Census 2000 inbound TQA operation . . . . . . . . . . . . . . . . . . . . . . . . 11.2 Overview of this evaluation . . . . . . . . . . . . . . . . . . . . . . . . . . . . . . . . . . . . . . . . . . . . 11.3 Measuring customer satisfaction . . . . . . . . . . . . . . . . . . . . . . . . . . . . . . . . . . . . . . . . . 2
2. METHODS . . . . . . . . . . . . . . . . . . . . . . . . . . . . . . . . . . . . . . . . . . . . . . . . . . . . . . . . . . . . . 22.1 Customer satisfaction survey . . . . . . . . . . . . . . . . . . . . . . . . . . . . . . . . . . . . . . . . . . . . 22.2 Agent debriefing . . . . . . . . . . . . . . . . . . . . . . . . . . . . . . . . . . . . . . . . . . . . . . . . . . . . . . 52.3 Statistical methods . . . . . . . . . . . . . . . . . . . . . . . . . . . . . . . . . . . . . . . . . . . . . . . . . . . . 72.4 Applying quality assurance procedures . . . . . . . . . . . . . . . . . . . . . . . . . . . . . . . . . . . . 8
3. LIMITS . . . . . . . . . . . . . . . . . . . . . . . . . . . . . . . . . . . . . . . . . . . . . . . . . . . . . . . . . . . . . . . . 83.1 Limitations of the sample design and data collection procedures for the customer
satisfaction survey . . . . . . . . . . . . . . . . . . . . . . . . . . . . . . . . . . . . . . . . . . . . . . . . . . . . 83.2 Limitations of the design and data collection procedures for the agent
debriefing . . . . . . . . . . . . . . . . . . . . . . . . . . . . . . . . . . . . . . . . . . . . . . . . . . . . . . . . . . . 9
4. RESULTS . . . . . . . . . . . . . . . . . . . . . . . . . . . . . . . . . . . . . . . . . . . . . . . . . . . . . . . . . . . . . . 94.1 Were the inbound TQA operation callers satisfied? . . . . . . . . . . . . . . . . . . . . . . . . . . 94.2 Were the inbound TQA operation agents satisfied? . . . . . . . . . . . . . . . . . . . . . . . . . . 194.3 How do the callers’ and agents’ satisfaction compare? . . . . . . . . . . . . . . . . . . . . . . . 29
5. RECOMMENDATIONS . . . . . . . . . . . . . . . . . . . . . . . . . . . . . . . . . . . . . . . . . . . . . . . . . . 29
References . . . . . . . . . . . . . . . . . . . . . . . . . . . . . . . . . . . . . . . . . . . . . . . . . . . . . . . . . . . . . . . . 30
Appendix A: Customer satisfaction survey questions . . . . . . . . . . . . . . . . . . . . . . . . . . . . . . 31Appendix B: Time line for response rates of the IVR-only and IVR-agent customer
satisfaction surveys over the data collection period . . . . . . . . . . . . . . . . . . . . . 33Appendix C: Agent debriefing questionnaire . . . . . . . . . . . . . . . . . . . . . . . . . . . . . . . . . . . . . 34Appendix D: Limitations of the sample design and data collection procedures for the
customer satisfaction survey due to technical problems . . . . . . . . . . . . . . . . . . 36Appendix E: Responses to the IVR-only and IVR-agent customer satisfaction surveys . . . . 39Appendix F: Overall satisfaction ratings for the IVR-only and IVR-agent customer
satisfaction survey over the data collection period . . . . . . . . . . . . . . . . . . . . . . 40Appendix G: Responses to the agent debriefing questionnaire . . . . . . . . . . . . . . . . . . . . . . . 41Appendix H: Gamma statistics between questions 1 through 19 on the agent
debriefing questionnaire . . . . . . . . . . . . . . . . . . . . . . . . . . . . . . . . . . . . . . . . . . 42Appendix I: Gamma statistics between questions 1 through 19 and questions
A through H on the agent debriefing questionnaire . . . . . . . . . . . . . . . . . . . . . 44
i

LIST OF TABLES
Table 1. Number of respondents to the customer satisfaction survey . . . . . . . . . . . . . . . . . . . 4
Table 2. IVR-only callers responding favorably to the customer satisfaction survey . . . . . . 11
Table 3. IVR-agent callers responding favorably to the customer satisfaction survey . . . . . 12
Table 4. Results of the Wilcoxon rank sum test to compare the IVR-only and IVR-agent questions . . . . . . . . . . . . . . . . . . . . . . . . . . . . . . . . . . . . . . . . . . . . . . . . . . . . . . . . 13
Table 5. IVR-only callers responding favorably to the customer satisfaction survey fromMarch 3 to March 21 and March 22 to June 8 . . . . . . . . . . . . . . . . . . . . . . . . . . . . . . . . . . . . . 15
Table 6. IVR-agent callers responding favorably to the customer satisfaction survey fromMarch 3 to March 21 and March 22 to June 8 . . . . . . . . . . . . . . . . . . . . . . . . . . . . . . . . . . . . . 16
Table 7. Gamma statistics among the IVR-only customer satisfaction survey questions . . . 17
Table 8. Gamma statistics among the IVR-agent customer satisfaction survey questions . . . 17
Table 9. Summary information for the Operator Support System questions . . . . . . . . . . . . . 21
Table 10. Summary information for the training questions . . . . . . . . . . . . . . . . . . . . . . . . . . 22
Table 11. Summary information for the interaction with the public questions . . . . . . . . . . . 23
Table 12. Summary information for the other general questions . . . . . . . . . . . . . . . . . . . . . . 24
Table 13. Ranking of the three types of calls handled by the agents . . . . . . . . . . . . . . . . . . . 24
Table 14. Responses to the open-ended question on the agent debriefing questionnaire . . . . 25
Table 15. Responses to the agent information questions . . . . . . . . . . . . . . . . . . . . . . . . . . . . 26
Table 16. Ten highest gamma statistics between pairs of questions on the agent debriefingquestionnaire . . . . . . . . . . . . . . . . . . . . . . . . . . . . . . . . . . . . . . . . . . . . . . . . . . . . . . . . . . . . . . 27
Table 17. Responses to the IVR-only customer satisfaction survey . . . . . . . . . . . . . . . . . . . . 39
Table 18. Responses to the IVR-agent customer satisfaction survey . . . . . . . . . . . . . . . . . . . 39
Table 19. Responses to the agent debriefing questionnaire . . . . . . . . . . . . . . . . . . . . . . . . . . 41
Table 20. Gamma statistics between questions 1 through 19 on the agent debriefing questionnaire . . . . . . . . . . . . . . . . . . . . . . . . . . . . . . . . . . . . . . . . . . . . . . . . . . . . . . . . . . . . . . 42
ii

Table 21. Gammas statistics between questions 1 through 19 and questions A through Hon the agent debriefing questionnaire . . . . . . . . . . . . . . . . . . . . . . . . . . . . . . . . . . . . . . . . . . . 44
LIST OF FIGURES
Figure 1. Confidence intervals for the percent of IVR-only callers responding favorably to the customer satisfaction survey . . . . . . . . . . . . . . . . . . . . . . . . . . . . . . . . . . . . . . . . . . . . . 11
Figure 2. Confidence intervals for the percent of IVR-agent callers responding favorably to the customer satisfaction survey . . . . . . . . . . . . . . . . . . . . . . . . . . . . . . . . . . . . . . . . . . . . . 12
Figure 3. IVR-only callers responding favorably to the customer satisfaction survey fromMarch 3 to March 21 and March 22 to June 8 . . . . . . . . . . . . . . . . . . . . . . . . . . . . . . . . . . . . . 15
Figure 4. IVR-agent callers responding favorably to the customer satisfaction survey fromMarch 3 to March 21 and March 22 to June 8 . . . . . . . . . . . . . . . . . . . . . . . . . . . . . . . . . . . . . 16
Figure 5. Multidimensional scaling model of the gamma statistics among the IVR-only customer satisfaction survey questions . . . . . . . . . . . . . . . . . . . . . . . . . . . . . . . . . . . . . . . . . . 18
Figure 6. Multidimensional scaling model of the gamma statistics among the IVR-agentcustomer satisfaction survey questions . . . . . . . . . . . . . . . . . . . . . . . . . . . . . . . . . . . . . . . . . . 19
Figure 7. Multidimensional scaling model of the gamma statistics among the agent debriefing questions . . . . . . . . . . . . . . . . . . . . . . . . . . . . . . . . . . . . . . . . . . . . . . . . . . . . . . . . . 28
Figure 8. Time line for the response rates of the IVR-only and IVR-agent customer satisfaction surveys over the data collection period . . . . . . . . . . . . . . . . . . . . . . . . . . . . . . . . 33
Figure 9. Overall satisfaction ratings for the IVR-only and IVR-agent customer satisfaction surveys over the data collection period . . . . . . . . . . . . . . . . . . . . . . . . . . . . . . . . . . . . . . . . . . 40
iii

______________________________________________________________________ Intentionally Blank
iv

EXECUTIVE SUMMARY
The Census 2000 inbound Telephone Questionnaire Assistance operation handled all incoming calls from the public as follows: provided the public with convenient access to general Census 2000 information, provided help in completing census forms, fielded requests for forms and language guides, and collected short form data from callers. When the public called one of the toll-free numbers, most were connected to an automated interactive voice response system, but a few were connected directly to an agent, someone trained to handle the Telephone Questionnaire Assistance calls. Most of the callers who connected to the automated interactive voice response system could answer their questions successfully with the automated system. However, some of the callers who used the automated system also spoke with an agent.
The purpose of this evaluation is to measure how satisfied the callers were with the inbound Telephone Questionnaire Assistance operation for Census 2000. We measured customer satisfaction from two perspectives: the caller and the agent who handled the call.
Were callers satisfied?
Overall, the callers were satisfied with the inbound Telephone Questionnaire Assistance operation. At least 72 percent of the respondents to the customer satisfaction survey replied favorably. The survey included five or seven questions depending on whether they spoke to an agent. The questions asked about ease of moving through the automated menu system, quickness of the agent in understanding their request, agent’s level of interest in helping, overall satisfaction with the call, and other customer concerns.
Were the agents satisfied?
Overall, agents widely supported most aspects of the inbound Telephone Questionnaire Assistance operation mentioned on the agent debriefing questionnaire. Only three out of nineteen questions were viewed negatively by the majority of the agents. The agents’ satisfaction with the operation supports the callers’ satisfaction.
We gave the agents a debriefing questionnaire to complete during a week of expected peak activity. The agents agreed that: they understood the caller’s requests, the visual design of the Operator Support System made it easy to read the prepared answers, training helped them understand Census concepts, and that it was easy for them to use the Operator Support System to find the information that callers requested. However, the agents felt the callers seemed dissatisfied when they repeated the same verbatim information and they felt they could have used more practice with the Operator Support System before fielding calls.
v
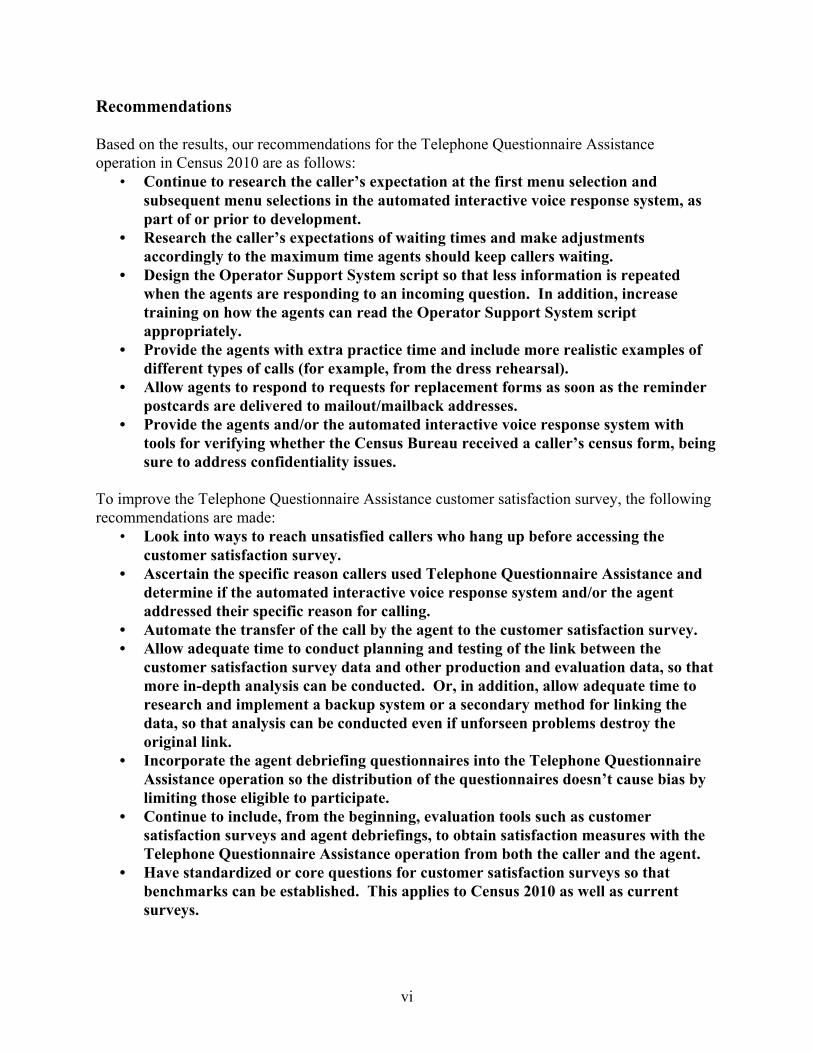
Recommendations
Based on the results, our recommendations for the Telephone Questionnaire Assistance operation in Census 2010 are as follows:
• Continue to research the caller’s expectation at the first menu selection and subsequent menu selections in the automated interactive voice response system, as part of or prior to development.
• Research the caller’s expectations of waiting times and make adjustments accordingly to the maximum time agents should keep callers waiting.
• Design the Operator Support System script so that less information is repeated when the agents are responding to an incoming question. In addition, increase training on how the agents can read the Operator Support System script appropriately.
• Provide the agents with extra practice time and include more realistic examples of different types of calls (for example, from the dress rehearsal).
• Allow agents to respond to requests for replacement forms as soon as the reminder postcards are delivered to mailout/mailback addresses.
• Provide the agents and/or the automated interactive voice response system with tools for verifying whether the Census Bureau received a caller’s census form, being sure to address confidentiality issues.
To improve the Telephone Questionnaire Assistance customer satisfaction survey, the following recommendations are made:
• Look into ways to reach unsatisfied callers who hang up before accessing the customer satisfaction survey.
• Ascertain the specific reason callers used Telephone Questionnaire Assistance and determine if the automated interactive voice response system and/or the agent addressed their specific reason for calling.
• Automate the transfer of the call by the agent to the customer satisfaction survey. • Allow adequate time to conduct planning and testing of the link between the
customer satisfaction survey data and other production and evaluation data, so that more in-depth analysis can be conducted. Or, in addition, allow adequate time to research and implement a backup system or a secondary method for linking the data, so that analysis can be conducted even if unforseen problems destroy the original link.
• Incorporate the agent debriefing questionnaires into the Telephone Questionnaire Assistance operation so the distribution of the questionnaires doesn’t cause bias by limiting those eligible to participate.
• Continue to include, from the beginning, evaluation tools such as customer satisfaction surveys and agent debriefings, to obtain satisfaction measures with the Telephone Questionnaire Assistance operation from both the caller and the agent.
• Have standardized or core questions for customer satisfaction surveys so that benchmarks can be established. This applies to Census 2010 as well as current surveys.
vi

1. BACKGROUND
This evaluation seeks to measure the customer’s level of satisfaction with the inbound Telephone Questionnaire Assistance (TQA) operation for Census 2000. We examined customer satisfaction from two perspectives: the caller and the agent who handled the call.
1.1 Overview of the Census 2000 Inbound TQA operation
The Census 2000 inbound TQA operation handled all incoming calls from the public as follows: provided the public with convenient access to general Census 2000 information, provided help in completing census forms, fielded requests for forms and language guides, and collected short form data from callers. Census 2000 implemented a large-scale TQA operation to support calls in English, Spanish, Chinese, Korean, Vietnamese, and Tagalog.
According to the Census 2000 TQA Program Master Plan (Angueira, 2001), the public accessed the TQA system by calling one of the six toll-free numbers for the languages mentioned above or a Telephone Device for the Deaf (TDD) toll-free number printed on the Census forms. Depending on the language assistance the caller needed, different options were available. The English touch-tone and rotary callers were routed to the English Interactive Voice Response (IVR) system. The Spanish-speaking touch-tone callers were routed to the Spanish IVR, while the Spanish-speaking rotary callers were directed to a Spanish-speaking agent. The Asian callers were routed directly to an agent who spoke the appropriate Asian language. If callers, who were originally routed to the IVR, had a question the IVR couldn’t answer or if they preferred to speak to an agent, then the system routed the caller to the next available agent. The IVR menu options corresponded to the anticipated reasons for calling, for example, requests for Census forms. The IVR also recorded evaluative data for operational analysis.
When agents received a call, they used a web-based instrument, referred to as the Operator Support System (OSS) to (1) answer callers’ questions, (2) take requests for census forms, or (3) conduct short form interviews when appropriate. The OSS contained scripted responses to questions and concerns that callers may have had, based on the 1990 census and tests leading up to 2000, including the Census 2000 dress rehearsal. The OSS also contained a telephone version of the short form questionnaire. The OSS could be used to record short form interview responses, as well as other evaluative data for operational analysis of the TQA operation.
1.2 Overview of this evaluation
The overall objective of this evaluation is to determine, in a statistically valid manner, the satisfaction of callers who received assistance over the telephone and the satisfaction of the agents. In addition, we will also relate the agents’ experience to the caller’s satisfaction.
For the caller’s perspective, we conducted a customer satisfaction survey using an automated IVR system that handles touch-tone and rotary callers. This survey occurred at the end of the call. For the agent, we conducted an agent debriefing consisting of a two-page questionnaire. The results from these two perspectives indicates satisfaction with these programs.
1

There was an outbound telephone operation that made calls to specific census cases that failed one of the two types of coverage edits (count discrepancy or large household). This operation was referred to as Coverage Edit Followup and is not covered in this evaluation.
1.3 Measuring customer satisfaction
In 1993, the National Performance Review (NPR, now known as the National Partnership for Reinventing Government) was formed to help create customer focused government, and the Congress passed nearly 100 laws to support a more effective and efficient government. Since then, a key NPR goal is to ensure that the Federal government provides the highest quality services to the American people. The Census Bureau believes strongly in the importance of excellent customer service and has defined five standards of customer service. The standard of accessibility states that the Census Bureau will provide its customers with choices for products, services, and the means of delivery. To do this, the Census Bureau will periodically survey its customers to assess their needs, and will use the results of these customer surveys for product development. In support of this government-wide initiative to measure customer satisfaction with government services, we conducted a customer satisfaction survey and an agent debriefing with users of the TQA systems.
2. METHODS
2.1 Customer satisfaction survey
The survey measures customer satisfaction by asking questions which cover the general aspects of a caller’s TQA experience. We administered the survey from March 3 to June 8, 2000, using an IVR system.1 To ensure the independence of the customer satisfaction survey, the contractor who conducted the TQA operation did not conduct the customer satisfaction survey
There were two versions of the customer satisfaction survey. One survey was for the callers who only used the IVR system (IVR-only callers) and the other survey was for the callers who used the IVR system and also spoke to an agent or who only spoke to an agent (IVR-agent callers). The IVR-only survey contained five questions, and the IVR-agent survey contained seven questions. The actual questions are in Appendix A. For the remainder of the paper, we will refer to these two groups as IVR-only callers and IVR-agent callers.
The surveys consisted of positively worded questions to avoid any confusion the caller may experience when listening to the questions over the telephone. We chose a seven point scale to
1 The TQA customer satisfaction survey ended June 8, 2000, but the TQA operation ended June 30, 2000. The original end date for both the TQA operation and the TQA customer satisfaction survey was June 8. When the TQA operation was extended to June 30, it was determined to be cost ineffective to extend the customer satisfaction survey contract to June 30 due to low call volume near the end of the TQA operation.
2

give the respondents the option of a middle point for those who are undecided or indifferent and to allow the respondents to choose from a range of responses.
2.1.1 Sample design for the customer satisfaction survey
The sample design for the customer satisfaction survey consisted of a systematic sample of English touch-tone and rotary, and Spanish touch-tone TQA callers. This included callers from Puerto Rico. The extremely low volume of anticipated Asian calls made inclusion of the Asian callers in the eligible universe cost prohibitive.
At the beginning of the data collection period, we expected a 15 percent response rate from the callers selected for the survey. During the data collection period (based on the data from March 22, 2000), we cut the sampling rate in half because we had a response rate of somewhere between 7 and 8 percent which is about half of what we expected and because the volume of calls to TQA was much lower than estimated. This change in sampling rates occurred at 3:00 P.M. on March 23, 2000. All of the data will be treated as a random sample from an infinite population, but with weights of two before 3:00 P.M. on March 23 and one after 3:00 P.M. on March 23. We discuss how we will account for nonresponse in section 2.1.3.
2.1.2 Data collection procedures for the customer satisfaction survey
The IVR gave special instructions at the beginning of the call to the callers selected for the customer satisfaction survey. If selected for the survey, touch-tone callers were instructed that at the end of the call they should press the “*” key and the voice recognition callers were instructed to give a verbal indication that they were ending the call. This indicated to the Intelligent Call Routing system to pass the call from the IVR system to the customer satisfaction survey site, along with information identifying the call, such as a unique identification number and a label indicating whether the call was transferred from an agent or the IVR. Transferring to the customer satisfaction survey site from an agent required only that the caller give their consent to participate. The agent, on the other hand, needed to manually transfer the call back to the Intelligent Call Routing system so the call could be passed to the survey site along with the associated identifying information. As the operation progressed, we realized not all agents understood how to make the transfer. Initially, we thought that the transfer from the agent to the survey site would occur automatically. Therefore, the training materials did not cover the manual transfer. The training staff had to scramble to work with the sites to get this covered since procedures varied by call center site. Unfortunately, the manual transfer was never adequately understood and many agents did not make the transfer.
2.1.3 Response rate for the customer satisfaction survey
Of the approximately 5.8 million callers to the TQA operation from March 3 to June 8, 2000, we selected 47,263 callers for the TQA customer satisfaction survey. Some callers connected to the customer satisfaction survey, but then did not answer any of the questions. If we include only the callers that responded to at least one question, then we obtained an 8.3 percent response rate.
3

Table 1 shows the distribution of the occurrence of callers connecting to the customer satisfaction survey and responding to at least one question.
Table 1. Number of respondents to the customer satisfaction survey Types of Callers Callers who connected to the Callers who responded to at least
customer satisfaction survey site one question
IVR-only callers 4,663 3,046
IVR-agent callers 1,248 888
Total 5,911 3,934
The ratio between the IVR-only survey and IVR-agent survey is quite the opposite of what we anticipated. We expected to receive more IVR-agent surveys than IVR-only surveys because the transfer from the agent did not require any action on the callers part, and because we forecasted that approximately 60 percent of the callers would transfer to an agent. However, we think we obtained more IVR-only surveys than IVR-agent surveys due to technical and agent training difficulties. We discuss the difficulties in more detail in the limits section.
A graph of the response rate over the data collection period is located in Appendix B - Figure 8. The response rate includes both IVR-only and IVR-agent callers who responded to at least one question on the customer satisfaction survey. The graph displays the moving average of the daily response rate and the 90 percent confidence interval around the moving average. We calculated the moving average (or loess smooth) as suggested by Cleveland (1979).
The graph shows us that the response rate at the beginning of the inbound TQA operation was much lower than the response rate starting on March 22, day 20 of the operation. Perhaps, this occurred because of the major technical problems with the customer satisfaction survey that were mostly fixed by March 22. However, we can’t use weights to account for nonresponse because we don’t know how many of the people selected for the customer satisfaction survey experienced technical difficulties and could not respond to the survey. Instead of just providing overall estimates that don’t take into account nonresponse, we provide overall results and additionally two subsets of results: from March 3 to March 21 and from March 22 to June 8. We present the subsets of results to show how the technical difficulties affected satisfaction.
2.1.4 Answering the data analysis questions
There were two main data analysis questions for the customer satisfaction survey.
First, we wanted to determine how the callers rated the questions asked in both customer satisfaction surveys. We answer this question with descriptive statistics, including proportions, means, and the corresponding standard errors and confidence intervals. We used a formula for confidence intervals that accounts for the multiple intervals computed simultaneously. We calculated simultaneous confidence intervals to ensure that the error rate for the entire set of confidence intervals remained at 10 percent. Also, we conducted multiple comparison tests to determine the statistical significance of the responses for each question. (See section 2.3.3 for these formulas.) For the questions included on both the IVR-only and IVR-agent surveys, we
4

conducted the Wilcoxon Rank Sum Test to determine if the responses for both types of callers are significantly different.
Second, we determined which specific aspects of the IVR or agent interaction were associated with the caller’s overall satisfaction. To answer this question, we measured the association of each question with an overall satisfaction question. The gamma statistic measures this association. We also used a multidimensional scaling model to graphically display the gamma statistics. (See sections 2.3.1 and 2.3.2 for a description of the gamma statistic and multidimensional scaling model.)
2.2 Agent debriefing
2.2.1 Design used for the agent debriefing
The design required that each agent working on inbound TQA between April 4 and April 11, 2000, receive one and only one agent debriefing questionnaire. As a result, this data collection approximated a census of all agents. There wasn’t a specific followup plan for the nonrespondents. Because the data are treated as a census, our assumption is that there isn’t any sampling variability.
2.2.2 Data collection procedures for the agent debriefing
Each of the 22 inbound TQA call centers received enough agent debriefing questionnaires to distribute to the expected number of agents working during the data collection period. The call centers could not photocopy the questionnaire under any circumstances. If a call center ran out of questionnaires, they contacted the Census Bureau. The agent debriefing questions are in Appendix C.
The call centers gave each inbound TQA agent a debriefing questionnaire and a pre-addressed postage-paid return envelope to complete and return April 4 through April 11, 2000 (agent debriefing census week). We suspect that the agent’s responses to the debriefing questionnaire for this census week may differ from responses they may have given at other times; and, that their responses may not be representative of all agents employed for the entire TQA inbound operation. Data show that during our census week, call volume was approximately 20 percent lower than we projected and was much lower than the previous two weeks. Therefore, the call centers had likely released some agents who worked during peak periods. Agents working during peak periods may have had different experiences (and thus responses) than agents working during non peak periods. Even if we have some agents who worked during peak periods, their responses are potentially limited to their experiences during the census week and thus don’t reflect how they would have answered at other times. We were restricted to the census week because the idea and development of the agent debriefing questionnaire was too late to integrate into the inbound TQA operation. Because of this restriction, our data are potentially biased given that not every agent was working during the census week and given that experiences may have differed at other times.
5

The agents completed the debriefing questionnaire during their regularly scheduled work hours. The call centers staggered the dissemination of the questionnaires so that completing the questionnaire did not impact the call center’s ability to handle the expected call volume.
The agents’ responses were confidential. Agents did not provide names or identification numbers. The identification numbers printed on the questionnaire were arbitrary and only used for controlling the keying process. Also, to maintain the confidentiality of their responses, we provided envelopes for the agents. Agents sealed their completed questionnaire in the envelope and returned them to their supervisors. If the agent preferred, they could mail their completed questionnaire directly to the Census Bureau. However, this was not the preferred method because it made it harder to track the number of responses per call center and costs were higher than for a single shipment.
The agents’ supervisors or designated call center official(s) collected the completed questionnaires and returned them to the Census Bureau in the pre-addressed postage-paid box provided. In the box, the call center enclosed a letter documenting the total number of questionnaires disseminated and the number of returns in the box.
2.2.3 Response rate for the agent debriefing
Of the 9,415 agents trained and hired in the 22 inbound TQA call centers, we received 3,178 completed agent debriefing questionnaires. We received questionnaires back from 20 of the 22 inbound TQA call centers. Some of the 9,415 agents may have quit before the week the questionnaires were distributed, and others may have been hired after this week. Therefore, a lower bound response rate is 34 percent. If we had a count of only the number of agents working during the week the questionnaires were distributed, then we would calculate a higher response rate.
2.2.4 Answering the data analysis questions
There are two main data analysis questions for the agent debriefing questionnaire. These data analysis questions are similar to those asked of the customer satisfaction survey.
First, we wanted to determine how the inbound TQA agents rated their experience. The questions included aspects related to the Operator Support System, training, and interactions with the public. We answer this question by looking at descriptive statistics, including proportions, means, and standard errors. Since the data are treated as a census, there is no sampling variability. Therefore, any differences observed are significantly different.
Second, we wanted to determine the associations among various aspects of the inbound TQA operation. To answer this question, we measure the association of each question with a question on overall satisfaction. We used the gamma statistic to measure this association. We also use a multidimensional scaling model to graphically depict the association. (See sections 2.3.1 and 2.3.2 for a description of the gamma statistic and multidimensional scaling model.)
2.3 Statistical Methods
6

2.3.1 Gamma statistic
Our survey data is ordinal by nature. A basic question usually posed when analyzing ordinal data is “Does Y tend to increase as X increases?” Bivariate analyses of interval-scale variables often summarize covariation by the Pearson correlation, which describes the degree to which Y has a linear relationship with X. Ordinal variables do not have a defined metric, so the notion of linearity is not meaningful. However, the inherent ordering of categories allows consideration of monotonicity–that is, whether Y tends to increase as X does. (Agresti 1990.)
The gamma statistic is a measure of association for ordinal variables and is analogous to the Pearson correlation. It describes the degree to which the relationship is monotone. When comparing two respondents on an ordinal scale, we can classify the pair of respondents as concordant or discordant. The pair is concordant if a respondent who ranks higher on variable X also ranks higher on variable Y. The pair is discordant if a respondent who ranks higher on X also ranks lower on Y. The pair is tied if the respondents have the same classification on X and/or Y (Agresti 1990). The sample gamma is defined:
γ$ = ( C - D ) / ( C + D )
where C is the total number of concordant pairs and D is the total number of discordant pairs.
2.3.2 Multidimensional scaling models
According to Borg (1997), multidimensional scaling models can be used to help see the structure in the data. Multidimensional scaling models can represent a measure of relative association as distances between points on a two-dimensional space. We use the gamma statistic as our measures of association. The points are configured so that their distances correspond to the gammas. If two points are close together then they are highly associated. However, if two points are far apart then they are not highly associated.
2.3.3 Computations of the confidence intervals and multiple comparisons for the customer satisfaction survey
We used a formula proposed by Gold (1963) and later enhanced by Goodman (1965) to take into account the simultaneous confidence intervals being computed.
1 2
pc ∈ p$ j ± gα /2c
p$ j (1 n − p$ j )
/
j = 1, . . . , c.
7

where the critical constant gp is defined by g p
1 − p = 2π 1
∫ e− y2 /2 dy. −∞
8

In addition, to determine if the proportions are significantly different by question, we conduct a simultaneous contrast. We compute simultaneous confidence intervals on the differences between the proportions of each pair of questions. For pj - pjN , j …jN, the projected interval is
/1 2
p j − p j ′ ∈ p$ j − p$ j ′ ± gα /2C p$ j + p$ j ′ − ( p$ j − p$ j ′ )
2 where C =
2 c .
n
Similar to the simultaneous confidence intervals, Gold(1963) proposed this formula and Goodman (1965) shortened the interval. To interpret the results of this interval, we determine if the interval includes zero for each comparison. If the interval includes zero, then we do not have enough data to say the responses are significantly different. However, if the interval doesn’t include zero, then we can say that the responses to the two questions that are being compared are significantly different.
2.4 Applying quality assurance procedures
We applied quality assurance procedures throughout the creation of this report. They encompassed how we determined evaluation methods, created specifications for project procedures and software, designed and reviewed computer systems, developed clerical and computer procedures, analyzed data, and prepared this report. For a description of these procedures, see the binder “Census 2000 Evaluation Program Quality Assurance Process.”
3. LIMITS
3.1 Limitations of the sample design and data collection procedures for the customer satisfaction survey
According to the TQA and Coverage Edit Followup Lessons Learned for Census 2000 (Longini, 2001), the many technical difficulties that occurred during the data collection period caused some callers to be excluded from the customer satisfaction survey sample. Many of these technical difficulties were the result of insufficient time for developing and testing the TQA systems. Some of the problems occurred for a limited time period and we know the extent of the problem. However, for most of the problems, we do not have any way of assessing the impact, or resulting bias. Appendix D lists these technical difficulties.
In addition to the technical problems, there are other limitations in the customer satisfaction survey.
• Historically, customer satisfaction surveys have low response rates. Low response rates may lead to high nonresponse bias. Nonresponse bias, therefore, may limit the generalizations of the survey data. We found that many people did not respond to the customer satisfaction survey even after they connected to the survey.
9

• In general, customer satisfaction surveys suffer from response bias in that typically only the very pleased and very displeased respond. However, given that one technical difficulty held callers for thirty seconds before connecting them to the survey, it seems possible that satisfied callers may have stayed on the line while others hung up. Therefore, it also seems possible that the results may represent satisfied callers who transferred to the survey, which may provide a positive response bias.
• The agents may not have passed along unhappy or difficult callers to the customer satisfaction survey since they had to do it manually, though we have no data, anecdotal nor otherwise, that speaks to this.
We originally planned to match TQA production files to the customer satisfaction survey data, but we could not because of time constraints related to file availability of revised and edited production files and problems with the variable used to link the files.
3.2 Limitations of the design and data collection procedures for the agent debriefing
There are two major limitations on the design and data collection procedures for the agent debriefing. First, the followup to nonresponding call centers was inconsistent. We worked with the prime contractor to complete the debriefing, who in turn, worked with the subcontractors to encourage response. Therefore, obtaining agent participation differed by call center. In fact, we did not receive any questionnaires back from two of the call centers. Second, although we had a “census week,” we did not have complete coverage. We do not have coverage of the inbound TQA agents who left the program prior to arrival of the questionnaires in the call centers and the inbound TQA agents who started after April 11. In both cases, we are concerned that nonresponding agents may differ from the agents who responded in ways that effect our agent debriefing results.
4. RESULTS
4.1 Were the inbound TQA operation callers satisfied?
4.1.1 Overall Conclusions
Overall, the callers were satisfied with the inbound TQA operation. At least 72 percent of the respondents to the customer satisfaction survey replied favorably. The survey included five or seven questions depending on if they had to speak to an agent (see Appendix A for full question wording). The questions asked about ease of moving through the automated menu system, quickness of the agent in understanding their request, agent’s level of interest in helping, overall satisfaction with the call, and other customer concerns. The questions were rated on a scale of one to seven where one was the lowest (unfavorable) score and seven was the highest (favorable) score a caller could give.
The data exclude those callers who transferred to the customer satisfaction survey but who did not respond to any of the questions. Therefore, the results are based on the responses to 3,046 IVR-only surveys and 888 IVR-agent surveys.
10

4.1.2 Question specific results
For each question asked of the IVR-only and IVR-agent callers, we calculated confidence intervals for the percent of callers who responded favorably. Because all of the confidence intervals fall above 68 percent, we say that the callers were satisfied. Before analysis began, we decided that the callers were satisfied if the confidence intervals fell above 50 percent.
For the IVR-only callers, we found the only question answered significantly different from the other questions was the question concerning the ease of moving through the automated menu system. The IVR-only callers rated this question higher than the other questions asked on the IVR-only survey. There were not any significant differences among the responses to any of the questions asked of the IVR-agent callers. We conducted this multiple comparison test on the percent of respondents who answered favorably, for both the IVR-only callers and the IVR-agent callers. This test determines if the callers responded differently to one question versus another question asked on the survey.
Tables 2 and 3 contain the percent, standard error, and upper and lower 90 percent confidence level for the callers who responded favorably. We calculated the confidence intervals using the formulas in section 2.3.2. For each question, we calculated the percent of callers who responded favorably by taking the number of callers who responded with a five, six, or seven, divided by the total number of callers who responded to that question. For more detail, Tables 17 and 18 of Appendix E give a complete look at the responses.
In Table 2, we observe that just over: • Eighty-five percent of IVR-only callers thought that it was easy to move through the
automated menu system. As stated above, this question was determined to be rated significantly higher than the remaining questions asked of the IVR-only callers ("=0.10).
• Seventy-six percent of IVR-only callers felt the information they received would help them participate in the Census.
In Table 3, we find that: • About 81 percent of IVR-agent callers thought it was easy to move through the
automated menu system. • Seventy-two percent of the IVR-agent callers felt that the first menu selection on the
automated menu system fit their expectations.
11
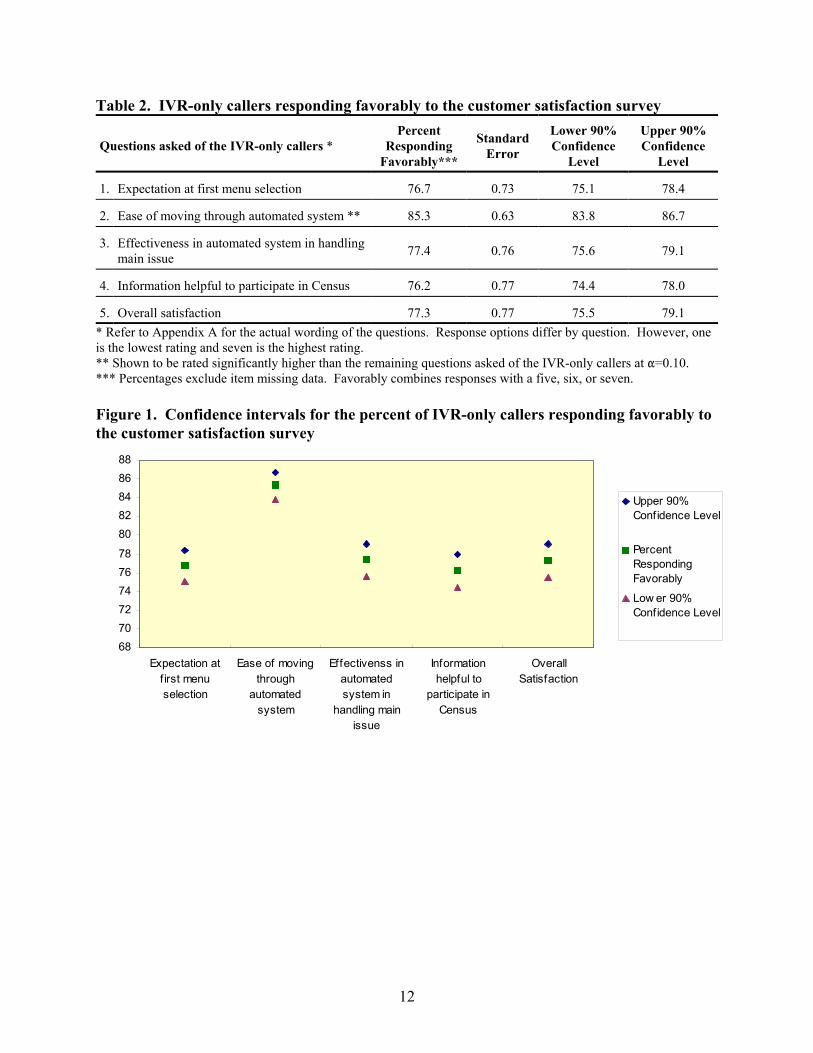
Table 2. IVR-only callers responding favorably to the customer satisfaction survey Percent Standard Lower 90% Upper 90%
Questions asked of the IVR-only callers * Responding Error Confidence Confidence Favorably*** Level Level
1. Expectation at first menu selection 76.7 0.73 75.1 78.4
2. Ease of moving through automated system ** 85.3 0.63 83.8 86.7
3. Effectiveness in automated system in handling 77.4 0.76 75.6 79.1 main issue
4. Information helpful to participate in Census 76.2 0.77 74.4 78.0
5. Overall satisfaction 77.3 0.77 75.5 79.1 * Refer to Appendix A for the actual wording of the questions. Response options differ by question. However, one is the lowest rating and seven is the highest rating. ** Shown to be rated significantly higher than the remaining questions asked of the IVR-only callers at "=0.10. *** Percentages exclude item missing data. Favorably combines responses with a five, six, or seven.
Figure 1. Confidence intervals for the percent of IVR-only callers responding favorably to the customer satisfaction survey
88 86 84 82 80
78 76 74 72 70
Upper 90% Confidence Level
Percent Responding Favorably
Low er 90% Confidence Level
68 Expectation at Ease of moving Effectivenss in Information Overall
f irst menu through automated helpful to Satisfaction selection automated system in participate in
system handling main Census issue
12

Table 3. IVR-agent callers responding favorably to the customer satisfaction survey Percent Standard Lower 90% Upper 90%
Questions asked of the IVR-agent callers * Responding Error Confidence Confidence Favorably *** Level Level
1. Expectation at first menu selection 72.0 1.30 68.8 75.2
2. Ease of moving through automated system 80.7 1.17 77.9 83.6
3. Quickness of agent understanding request 73.8 1.40 70.3 77.2
4. Agent’s level of interest in helping 78.9 1.35 75.6 82.2
5. Effectiveness of agent in handling main issue 77.5 1.33 74.2 80.7
6. Information helpful to participate in Census 77.6 1.39 74.2 81.0
7. Overall satisfaction 77.4 1.35 74.1 80.7 * Refer to Appendix A for the actual wording of the questions. Response options differ by question. However, one is the lowest rating and seven is the highest rating. *** Percentages exclude item missing data. Favorably combines responses with a five, six, or seven. Note: None of the percentages are shown to be significantly different at "=0.10.
Figure 2. Confidence intervals for the percent of IVR-agent callers responding favorably to the customer satisfaction survey
88 86 84 82 80 78 76 74 72 70 68
Expectation at Ease of Quickness of Agent's level Effectiveness Information Overall f irst menu moving agent of interest in in agent in helpful to Satisfaction selection through understanding helping handling main participate in
automated request issue Census system
Upper 90% Confidence Level Percent Responding Favorably Low er 90% Confidence Level
4.1.3 Comparison of the responses for IVR-only callers and IVR-agent callers
Of the five common questions to both the IVR-only and IVR-agent surveys, there were three questions that the IVR-only and IVR-agent callers rated significantly different (" = 0.10). These three questions were concerning the expectation at the first menu selection of the automated system, ease of moving through the automated system, and whether the information was helpful to participate in the Census.
The IVR-only callers rated their expectation at the first menu selection and the ease of moving through the automated system higher than the IVR-agent callers rated these selections. This may have occurred because the IVR-agent callers had more complicated questions than the IVR was designed to answer or because these callers were unable to find their answers in the automated
13

system and had to speak with an agent. In addition, to help manage call volumes at the agent level and to maximize the use of the IVR, we designed the system so that if the caller pressed zero at the beginning of the call in an attempt to reach an agent, they were given the following message: “In order to take more calls and save tax dollars, we have provided automated answers to the most common questions about the Census. Please listen to the automated choices again.” However we hypothesize that some callers may have perceived this message as unresponsive and therefore rated their expectation at the first menu selection lower than they would have otherwise.
The IVR-agent callers rated whether the information was helpful to participate in the Census higher than the IVR-only callers. For this question, the differences are statistically significant but they may not be meaningful because 76.2 percent of IVR-only callers responded favorably and 77.6 percent of IVR-agent responded favorably. Sample size may be driving these differences to test statistically significant.
There is not a significant difference in the responses to the overall satisfaction question. Therefore, the IVR-only callers are,overall, as satisfied as the IVR-agent callers.
Table 4 gives the p-value of the Wilcoxon rank sum test (Cody, 1997) that compares the questions asked of both the IVR-only and IVR-agent callers. We conducted five separate tests. Each test had the significance level set at " = 0.10.
Table 4. Results of the Wilcoxon rank sum test to compare the IVR-only and IVR-agent questions Questions asked of both the IVR-only and IVR-agent callers * p-value
Expectation at first menu selection < 0.01 **
Ease of moving through automated system < 0.01 **
Effectiveness in automated system/agent in handling main issue 0.50
Information helpful to participate in Census 0.04 **
Overall satisfaction 0.90 * Refer to Appendix A for the actual wording of the questions. ** Significantly different at "= 0.10
4.1.4 Results by day of call
As we examined the data across the entire data collection period (Appendix B and F), we saw that both the response rates and satisfaction levels for March 3 to March 21 were lower than the response rates and satisfaction levels from March 22 to June 8. One plausible reason for the difference which occurs before March 22 is the numerous technical problems during this time that may have reduced the response rate and level of satisfaction. In addition, the agents were less experienced and they handled higher volumes prior to March 22, both of which could affect level of service. However, we have no way to decipher among these plausible causes.
14

In addition to the low satisfaction level before March 22, there was a larger drop in customer satisfaction around March 19, 20, and 21. A possible reason for this large decline in satisfaction was related to an event that occurred between March 20 and March 22. Residents in mailout/mailback areas were sent a postcard (D-9) reminding them to fill out their Census 2000 questionnaire. The postcard listed the toll-free TQA telephone number. The caller’s dissatisfaction may have been related to the agents inability to report whether a caller’s census form had been received. In addition, the callers may have called the TQA toll-free number because they had not received a Census 2000 questionnaire or they wanted a replacement form. Their dissatisfaction may have arisen when both the IVR system and agents were unable to process their request that a questionnaire be mailed at a later time because they did not have their Census ID. March 22 was the first time requests for questionnaires were taken without a Census ID. Figure 9 in Appendix F shows the results of the overall satisfaction question over the duration of the data collection period that includes both the IVR-only and IVR-agent callers. The remaining questions asked of both the IVR-only and IVR-agent callers show similar results.
Tables 5 and 6 and Figures 3 and 4 show the results of the customer satisfaction survey from March 3 to March 22 and the results from March 22 to June 8. The tables show that the satisfaction levels from March 3 to March 21 are much lower than the satisfaction levels from March 22 to June 8 for both the IVR-only and IVR-agent callers.
15

Table 5. IVR-only callers responding favorably to the customer satisfaction survey from March 3 to March 21 and March 22 to June 8
Percent responding favorably ***
March 3 to March 21
Percent responding favorably ***
March 22 to June 8Questions asked of the IVR-only callers * Percent Std Error n Percent Std Error n
1. Expectation at first menu selection 37.0 5.06 92 79.1 0.79 2,878
2. Ease of moving through automated system 63.5 5.25 85 86.5 0.67 2,750
3. Effectiveness in automated system in 41.0 5.61 78 79.3 0.82 2,615handling main issue
4. Information helpful to participate in Census 26.6 5.00 79 79.0 0.84 2,589
5. Overall satisfaction 29.6 5.11 81 80.1 0.83 2,507 * Refer to Appendix A for the actual wording of the questions. Response options differ by question. However, one is the lowest rating and seven is the highest rating. *** Percentages exclude item missing data. Favorably combines responses with a five, six, or seven.
Figure 3. IVR-only callers responding favorably to the customer satisfaction survey from March 3 to March 21 and March 22 to June 8
100
90
80
70
60 50
40
30
20
10
0 Expectation at Ease of moving Effectiveness of Information helpful Overall
f irst menu through automated system to participate in satisfaction selection automated system in handling main Census
issue
Perc
ent r
espo
ndin
g fa
vora
bly
March 3 to March 21 March 22 to June 8 Overall
16

Table 6. IVR-agent callers responding favorably to the customer satisfaction survey from March 3 to March 21 and March 22 to June 8
Percent responding favorably ***
March 3 to March 21
Percent responding favorably ***
March 22 to June 8Questions asked of the IVR-agent callers * Percent Std Error n Percent Std Error n
1. Expectation at first menu selection 55.6 3.48 205 80.5 1.62 663
2. Ease of moving through automated system 73.7 3.20 190 84.3 1.53 638
3. Quickness of agent understanding request 47.4 4.06 152 85.4 1.58 598
4. Agent’s level of interest in helping 56.7 4.41 127 87.4 1.52 576
5. Effectiveness of agent in handling main issue 58.4 3.98 154 86.1 1.53 580
6. Information helpful to participate in Census 54.0 4.49 124 86.6 1.57 563
7. Overall satisfaction 56.7 4.19 141 85.9 1.54 581 * Refer to Appendix A for the actual wording of the questions. Response options differ by question. However, one is the lowest rating and seven is the highest rating. *** Percentages exclude item missing data. Favorably combines responses with a five, six, or seven.
Figure 4. IVR-agent callers responding favorably to the customer satisfaction survey from March 3 to March 21 and March 22 to June 8
100 90 80 70 60 50 40 30 20 10 0
Expectation at Ease of moving Quickness of Agent’s level Effectiveness Information Overall f irst menu through agent of interest in of agent in helpful to satisfaction selection automated understanding helping handling main participate in
system request issue Census
Perc
ent r
espo
ndin
g fa
vora
bly
March 3 to March 21 March 22 to June 8 Overall
17

4.1.5 Gamma statistics and multidimensional scaling models between items on the IVR-only survey and IVR-agent survey
To determine the measure of association between the questions asked on the customer satisfaction survey, we examine the gamma statistics between the questions for the IVR-only callers and the IVR-agent callers.
The gamma statistics in Tables 7 and 8 give the degree of the relationship between two questions on the survey. For both the IVR-only and IVR-agent callers, the question with the highest association with overall satisfaction was whether the information was helpful to participate in Census (gamma statistics of 0.89 and 0.88). The question with the lowest association with overall satisfaction for both types of callers was ease of moving through the automated system (gamma statistics of 0.75 and 0.62). (See section 2.3.1 for a description of the gamma statistic.)
Table 7. Gamma statistics among the IVR-only customer satisfaction survey questions Question (Variable Name) * 1 2 3 4 5
1. Expectation at first menu selection (Menu) 1.00
2. Ease of moving through automated system 0.74 1.00(Navigation)
3. Effectiveness of automated instrument in handling 0.71 0.67 1.00 main issue (Issue)
4. Information helpful to participate in Census 0.77 0.72 0.80 1.00(Participate)
5. Overall satisfaction (Overall) 0.80 0.75 0.82 0.89 1.00 * Refer to Appendix A for the actual wording of the questions.
Table 8. Gamma statistics among the IVR-agent customer satisfaction survey questions Question (Variable Name) * 1 2 3 4 5 6 7
1. Expectation at first menu selection (Menu) 1.00
2. Ease of moving through automated system 0.72 1.00 (Navigation)
3. Quickness of agent understanding request 0.61 0.56 1.00 (Understand)
4. Agent’s level of interest in helping (Interest) 0.61 0.57 0.87 1.00
5. Effectiveness of agent in handling main issue 0.68 0.61 0.79 0.79 1.00 (Issue)
6. Information helpful to participate in Census 0.65 0.54 0.84 0.85 0.85 1.00 (Participate)
7. Overall satisfaction (Overall) 0.71 0.62 0.79 0.79 0.82 0.88 1.00 * Refer to Appendix A for the actual wording of the questions.
18

Figures 5 and 6 show the multidimensional scaling model which graphically displays the gamma statistic. Two points that are close together are highly associated, while two points that are far apart are not as highly associated.
We can see that for both the IVR-only callers and IVR-agent callers, the points closest to Overall (overall satisfaction) are Participate (information helpful to participate in the Census) and Issue (effectiveness of the agent or automated system in handling main issue). Therefore, we could interpret this to mean that because we provided information useful to the caller, in terms of facilitating their participation in the Census, they felt satisfied with the outcome of the call.
The furthest points away from Overall are Navigation (ease of moving through the automated system) and Menu (expectation at first menu selection). This may imply that technical issues aren’t as critical to callers’ overall satisfaction as is whether the automated system or the agent addressed their main issue. Callers may have a basic expectation that there will not be any technical issues, but the presence of technical issues may influence satisfaction negatively.
Figure 5. Multidimensional scaling model of the gamma statistics among the IVR-only customer satisfaction survey
Note: Refer to Appendix A for the actual wording of the questions
Figure 6. Multidimensional scaling model of the gamma statistics among the IVR-agent customer satisfaction survey questions
Note: Refer to Appendix A for the actual wording of the questions.
19

4.2 Were the inbound TQA agents satisfied?
Overall, agents widely supported most aspects of the inbound TQA operation. The agent’s satisfaction with the operation supports the caller’s satisfaction.
4.2.1 Overall Conclusions
Overall, the majority of respondents replied positively to the questionnaire items. The key findings are based on responses of agreement and disagreement, unless otherwise noted. ‘Agreement’ includes somewhat agree, agree, and strongly agree and ‘disagreement’ includes somewhat disagree, disagree, and strongly disagree.
To determine the agent’s degree of satisfaction or dissatisfaction with the TQA operation, we looked at the agent’s reported level of agreement or disagreement with several statements about the TQA operation on the 3,178 agent debriefing questionnaires received from the call centers. The actual agent debriefing questions are found in Appendix C. The top five statements are below:
• 92.4 percent agreed I understood the caller's requests. • 90.4 percent agreed The visual design of the OSS screens made it easy to read the
prepared answers. • 85.8 percent agreed Training helped me understand Census concepts. • 84.3 percent agreed Overall, it was easy for me to use the OSS to find the
information that callers requested. • 83.2 percent agreed The training materials helped me to learn my job.
There were only three statements where the majority of the respondents (greater than 50 percent) replied negatively.
• 69.9 percent agreed Callers seemed dissatisfied when I repeated the same information.
• 55.5 percent disagreed I used the Questionnaire Reference Book (QRB) search tool on a regular basis.
• 52.7 percent agreed I could have used more practice with the OSS instrument before fielding calls.
4.2.2 Agent Debriefing Topic Summaries
In the sections that follow, we provide a specific summary for each topic on the agent debriefing questionnaire. In each section, the table summarizing the information contains:
• the mean of the seven point scale • the percent of respondents who somewhat agree, agree, or strongly agree • the percent of respondents who neither agree nor disagree • the percent of respondents who somewhat disagree, disagree, or strongly disagree.
20

The mean is calculated on a seven-point scale from one to seven, where one represents strongly disagree and seven represents strongly agree. Refer to Table 19 in Appendix G to find, for each question on the debriefing form, the percent missing and the percent answering each of the responses.
Note that some questions are worded negatively. They are noted by four asterisks (****). For these questions, if the agents are satisfied, then we would expect most of the respondents to strongly disagree, disagree, or somewhat disagree with the statement.
21

4.2.3 Operator Support System (OSS)
Most agents were satisfied with the Operator Support System (OSS). Most of the agents agreed that it was easy for them to use the OSS to find the information that callers requested (84.3 percent). In addition, 90.4 percent of the agents agreed that the visual design of the OSS screens made it easy to read the prepared answers and 73.3 percent of the agents disagreed with the statement that they had a difficult time using the menu system in the OSS instrument.
Only 33.1 percent agreed with the statement that they used the Questionnaire Reference Book (QRB) search tool on a regular basis. However, the TQA program staff expected that the QRB search tool wouldn’t be used on a regular basis because it (1) had a limited search capability and (2) was meant to be used only as a last resort. Thus, it wasn’t covered in training with much detail. Refer to Table 9 for more information on the OSS questions on the agent debriefing forms.
Table 9. Summary information for the Operator Support System questions
Agent Debriefing Questionnaire Inbound TQA Operation
Operator Support System
Mean
Percent of Respondents who . . . ***
Strongly Strongly Disagree,
Disagree, or Somewhat Disagree
Neither Agree nor Disagree
Agree, Agree, or Somewhat
Agree
1. Overall, it was easy for me to use the OSS to find 5.5 12.2 3.5 84.3the information that callers requested.
2. The visual design of the OSS screens made it 5.9 6.1 3.5 90.4easy to read the prepared answers.
3. I used the QRB search tool on a regular basis 3.3 55.5 11.4 33.1
4. I had a difficult time using the menu system in 2.7 73.3 8.8 18.0the OSS instrument. **** *** Percentages exclude item missing data and may not total to 100 percent due to rounding. **** Negatively worded question.
4.2.4 Training
Overall, 82.3 percent of the agents were satisfied with the training they received for inbound TQA. Results for more specific training components are as follows:
• 85.8 percent agreed training helped them to understand Census concepts. • 83.2 percent felt the training materials helped them to learn their job. • 78.9 percent were satisfied with the training they received on the OSS instrument. • 68.4 percent felt they received enough instruction to deal with difficult callers.
Although most of the responses to training were positive, 52.7 percent of the respondents felt they could have used more practice with the OSS instrument before fielding calls. In addition, as stated above, 68.4 percent of the respondents felt they received enough instruction to deal with difficult callers. Therefore, we may want to incorporate more training with difficult callers to
22

help the 31.6 percent of the respondents who did not agree with the statement. Refer to Table 10 for more information on the training questions on the agent debriefing questionnaire.
Table 10. Summary information for the training questions
Agent Debriefing Questionnaire Inbound TQA Operation
Training
Mean
Percent of Respondents who . . . ***
Strongly Strongly Disagree,
Disagree, or Somewhat Disagree
Neither Agree nor Disagree
Agree, Agree, or Somewhat
Agree
5. I was satisfied with the training I received on 5.5 15.3 5.8 78.9the OSS instrument.
6. Training helped me understand Census 5.8 8.5 5.7 85.8concepts.
7. I could have used more practice with the OSS 4.3 37.0 10.3 52.7instrument before fielding calls. ****
8. The training materials helped me to learn my 5.6 9.8 7.0 83.2job.
9. I received enough instruction to deal with 5.0 23.1 8.5 68.4difficult callers.
10. Overall, I was satisfied with the training I 5.6 10.6 7.1 82.3received for TQA. *** Percentages exclude item missing data and may not total to 100 percent due to rounding. **** Negatively worded question.
4.2.5 Interaction with the Public
In this section, the highest rated statement was whether the agents felt they understood the caller’s requests (92.4 percent). After receiving the caller’s request, 78.2 percent agreed that they found the answer within 30 seconds.
In response to how they felt about the interaction with the caller, the respondents had these positive statements:
• 70.0 percent felt the callers seemed satisfied with the answers provided. • 69.0 percent felt the callers seemed likely to participate in Census 2000. • 68.2 percent felt the callers seemed to understand the answers provided.
Even though the agents agreed with most of the statements about the caller’s views, 69.9 percent of them felt that the callers seemed dissatisfied when they repeated the same information. Agents were to read scripts verbatim, but they could pick portions of the script relevant to callers concerns. However, training did not adequately cover these instructions. We need to research ways to modify the scripts, the verbatim rules, and the content of training without affecting the accuracy of the information given to the callers. Refer to Table 11 for more information on the agent debriefing questionnaire about the interaction with the public.
23

Table 11. Summary information for the interaction with the public questions Percent of Respondents who . . . ***
Agent Debriefing Questionnaire Inbound TQA Operation Strongly Neither Strongly
Mean Disagree, Agree nor Agree, Agree, Interaction with the Public Disagree, or Disagree or Somewhat
Somewhat Agree Disagree
11. I understood the caller's requests. 6.0 3.3 4.3 92.4
12. After receiving the caller's request, I found the 5.3 12.7 9.1 78.2answer within 30 seconds.
13. Callers seemed to understand the answers that I 4.9 23.8 8.1 68.2provided.
14. Callers seemed dissatisfied when I repeated the 5.1 20.0 10.1 69.9 same information. ****
15. Callers seemed satisfied with the answers I 4.9 19.5 10.5 70.0provided.
16. Callers seemed likely to participate in Census 5.0 16.8 14.2 69.02000. *** Percentages exclude item missing data and may not total to 100 percent due to rounding. **** Negatively worded question.
4.2.6 Other General Questions
Seventy-six percent were satisfied with the help/assistance they received from their supervisors and 72.7 percent were satisfied with the help/assistance they received from their Quality Assurance Representatives (QARs). There was no consensus on whether the agents used the desk guide on a regular basis (41.6 percent disagreed with the statement, 40.9 percent agreed with the statement, 17.5 percent neither agreed nor disagreed). Each site dealt with the distribution of the guide and supplemental instructions differently. It is likely that the agents did not know what the survey question on the desk guide was referring to given that none of their materials were specifically titled in that manner. Refer to Table 12 for more information on these general questions.
24

Table 12. Summary information for the other general agent questions Agent Debriefing Questionnaire Percent of Respondents who . . . ***
Inbound TQA Operation Strongly Neither Strongly
Other General Questions Mean Disagree, Agree nor Agree, Agree, Disagree, or Disagree or Somewhat Somewhat Agree Disagree
17. I used the desk guide on a regular basis. 3.8 41.6 17.5 40.9
18. I was satisfied with the help/assistance that I 5.3 15.6 8.5 76.0received from my supervisors.
19. I was satisfied with the help/assistance that I 5.2 14.8 12.5 72.7received from my QARs. *** Percentages exclude item missing data and may not total to 100 percent due to rounding.
Of the types of calls handled, the agents felt that the hardest was informational (49.9 percent). These calls required the agents to probe for the caller’s reason for calling so they could connect the caller to the correct path among numerous paths within the OSS. The medium ranked call was the short form interview (45.8 percent) and the easiest call was requests for forms (65.5 percent). The agents may have felt these the easiest because the caller’s reason for calling is more obvious, and thus the choice on how to proceed through the OSS is more clear. Refer to Table 13 for more information about this question.
Table 13. Ranking of the three types of calls handled by the agents Types of Calls Hardest Medium Easiest Missing Handled Difficulty
(%) (%) (%) (%)
Forms Request 15.1 12.7 65.5 6.7
Short Form Interview 9.4 45.8 38.0 6.8
Informational 49.9 22.8 20.3 7.0
25

In an open-ended question, we asked the agents to provide suggestions to help us improve the inbound TQA operation for the Census in 2010. A summary of the responses are in Table 14. Of the 1,920 agents who responded to this question, about 17.8 percent felt that there should be more flexibility with the verbatim, 12.7 percent felt they needed more/better training, and 5.5 percent felt the supervisors needed better training. We could not categorize 36.4 percent of the responses.
Table 14. Responses to the open-ended question on the agent debriefing questionnaire Agent’s replies * Number of responses Percent
More flexibility with verbatim 342 17.8
Comment on the OSS 281 14.6
Better/more training 244 12.7
Better Spanish translation 142 7.4
Comment on a specific Census question 137 7.1
Train supervisors better 106 5.5
Comment on the agent’s call center 103 5.4
Miscellaneous 699 36.4 *Some responses fit in more than one category, so percentages may sum to over 100 percent.
26

4.2.7 Agent Information
The remaining questions on the agent debriefing questionnaire dealt with general agent information. Refer to Table 15 for this information. This table indicates the range of previous experience with telephone call centers and the range of current experience with the inbound TQA operation.
Table 15. Responses to the agent information questions A. Before TQA, what kinds of calling campaigns had you worked on?1
Customer Service 56.5% Survey Research 13.9% Missing 2.0% Sales 34.9% Other 10.1% Marketing 21.0% None 22.3%
B. Before TQA, how much experience did you have working as an agent at a telephone call center? None 29.6% 6-8 months 8.1% Missing 2.0%Less than 3 months 10.2% 9-11 Months 5.7%3-5 Months 9.9% More than 11 months 34.7%
C. Before TQA, how much experience did you have using a mouse and a menu-driven system? None 5.2% 1-2 weeks 1.6% More than 4 weeks 88.4% Less than one week 1.2% 3-4 weeks 2.2% Missing 1.5%
D. How many weeks have you been assigned to the TQA inbound operation? Less than one week 3.1% 3-4 weeks 34.3% Missing 2.5% 1-2 weeks 8.2% More than 4 weeks 52.0%
E. During the TQA inbound operation, were you assigned to another project? Yes 16.5% No 81.1% Missing 2.4%
F. During the past week, about how many hours were you assigned to the TQA inbound operation? Less than 8 hours 3.5% 17-24 hours 13.7% More than 32 hours 56.4% 8-16 hours 7.4% 25-32 hours 16.9% Missing 2.2%
G. During the inbound operation, did you participate in the performance improvement program? Yes 15.1% No 79.2% Missing 5.7%
H. During the inbound operation, for what languages did you handle calls? 1
English 83.4% Vietnamese 6.2% Missing 2.4% Spanish 52.5% Korean 4.2% Chinese 10.2% Taglaog 2.1%
1 Respondents were allowed to mark more than one box, so percentages may sum to over 100 percent.
4.2.8 Gamma statistics between items on the agent debriefing questionnaire
The following analysis focuses on the gamma statistics between questions one through nineteen on the questionnaire to determine which questions on the agent debriefing questionnaire were highly associated. Table 16 indicates the ten highest gammas between these questions. (See section 2.1.3 for a description of the gamma statistic.)
27

As shown in Table 16, most of the highest associations involve training issues. However, there are two high associations that do not deal with training. There is a strong relationship between the following:
C Whether callers seemed to understand the answers the agent provided and whether callers seemed satisfied with the answers the agent provided (0.71).
C How satisfied the agent was with the help/assistance received from supervisors and the help/assistance received from QARs (0.59).
After looking at the high gamma statistics with the questions in the training section, one might expect a similar relationship with the questions in the interaction with the public section. With the exception of the first case listed above, this is not the case. For example, we only see a small association with whether the agents felt the callers seemed likely to participate in Census 2000 and whether the agents felt the callers seemed dissatisfied when they repeated the same information (-0.20). Refer to Table 20 in Appendix H for the remaining gamma values between questions one and nineteen on the agent debriefing questionnaire.
Table 16. Ten highest gammas between pairs of questions on the agent debriefing questionnaire
Gamma Agent Debriefing Question Number and Wording
0.82 (5) I was satisfied with the training I received (10) Overall, I was satisfied with the training I on the OSS instrument. received for TQA.
0.76 (5) I was satisfied with the training I received (6) Training helped me understand Census on the OSS instrument concepts
0.75 (6) Training helped me understand Census (10) Overall, I was satisfied with the training I concepts received for TQA
0.71 (13) Callers seemed to understand the answers (15) Callers seemed satisfied with the answers I that I provided. provided.
0.70 (8) The training materials helped me to learn (10) Overall, I was satisfied with the training I my job received for TQA
0.70 (9) I received enough instruction to deal with (10) Overall, I was satisfied with the training I difficult callers received for TQA
0.67 (6) Training helped me understand Census (8) The training materials helped me to learn concepts my job
0.64 (5) I was satisfied with the training I received (8) The training materials helped me to learn on the OSS instrument my job
0.59 (18) I was satisfied with the help/assistance that (19) I was satisfied with the help/assistance that I received from my supervisors. I received from my QARs.
0.57 (8) The training materials helped me to learn (9) I received enough instruction to deal with my job difficult callers
28

4.2.9 Multidimensional scaling model of the gamma statistics between questions one through nineteen
Figure 7 gives a multidimensional scaling model of the gamma statistics. The question numbers that are close together represent a higher association while the question numbers that are further apart represent a lower association. The program used to create the multidimensional scaling model does its best to fit the 171 gamma statistics together on the two-dimensional graph. Although it is not a perfect fit, it is a useful tool.
In Figure 7, we added a line to split the top and bottom of the multidimensional scaling model. The top portion includes questions related to the operation and the bottom portion includes questions related to the agent’s interaction with the caller.
Figure 7. Multidimensional scaling model of the gamma statistics among the agent debriefing questions
*Refer to Appendix C for the question that corresponds to each number above.
4.2.10 The gamma statistics between the agent information questions and the operational assessment questions on the agent debriefing questionnaire
An additional question that arose during our analysis: were any of the responses to the agent information questions (questions A through H) associated with the agents responses to operational assessment questions (questions one through nineteen)? We measured this by looking at the gamma statistics associated with these questions. As shown in Table 21 in Appendix I, all of the gammas are between -0.30 and 0.30 and most of the gammas fall close to zero which indicates only a small association, if any at all, between the agent information questions and the operational assessment questions. This may indicate that even though there are differences in the agents’ prior experiences, there are not enough data to state that their prior experience is associated with their level of satisfaction.
29

4.3 How do the callers’ and agents’ satisfaction compare?
Both the callers and the agents were satisfied with the TQA operation. The agents’ satisfaction with the operation supports the callers’ satisfaction. An interesting result is that the highest association with overall satisfaction for the IVR-agent callers was whether the information was helpful to participate in Census (gamma statistic of 0.88). Similarly, the agents agreed with the statements that the callers seemed satisfied with the answers the agent provided (70 percent) and the callers seemed likely to participate in Census 2000 (69 percent).
5. Recommendations
Given the results and limitations of the data, here are some Census 2010 recommendations for the inbound TQA operation and the TQA customer satisfaction survey.
Based on the results, our recommendations for the inbound TQA operation in Census 2010 are as follows:
• Continue to research the caller’s expectation at the first menu selection and subsequent menu selections in the automated IVR system, as part of or prior to development.
• Research the caller’s expectations of waiting times and make adjustments accordingly to the maximum time agents should keep callers waiting.
• Design the OSS script so that less information is repeated when the agents are responding to an incoming question, given that 69.9 percent of the agents felt that callers seemed dissatisfied when they repeated the same information. In addition, increase training on how the agents can read the OSS script appropriately.
• Provide the agents with extra practice time and include more realistic examples of different types of calls (for example, from the dress rehearsal), given that 52.7 percent of the agents felt they could have used more practice with the OSS instrument before fielding calls.
• Allow agents to respond to requests for replacement forms as soon as the reminder postcards are delivered to mailout/mailback addresses, given the low levels of satisfaction associated with the agents inability to send forms.
• Provide the agents and/or the automated IVR system with tools for verifying whether the Census Bureau received a caller’s census form, being sure to address confidentiality issues.
To improve the TQA customer satisfaction survey, the following suggestions are made: • Look into ways to reach unsatisfied callers who hang up before accessing the customer
satisfaction survey. • Ascertain the specific reason callers called the TQA number and determine if the
automated IVR system and/or agent addressed their specific reason for calling. • Automate the transfer of the call by the agent to the customer satisfaction survey site. • Allow adequate time to conduct planning and testing of the link between the customer
satisfaction survey data and other production and evaluation data, so that more in-depth analysis can be conducted. Or, in addition, allow adequate time to research and
30

implement a backup system or a secondary method for linking the data, so that analysis can be conducted even if unforseen problems destroy the original link.
• Incorporate the agent debriefing questionnaires into the TQA operation so the distribution of the questionnaires doesn’t cause bias by limiting those eligible to participate.
• Continue to include, from the beginning, evaluation tools such as customer satisfaction surveys and agent debriefings, to obtain satisfaction measures with the TQA operation from both the caller and the agent.
• Have standardized or core questions for customer satisfaction surveys so that benchmarks can be established. This applies to Census 2010 as well as current surveys.
References
Agresti, Alan, Categorical Data Analysis, John Wiley & Sons, Inc., New York City, p. 19-23, 1990.
Angueira, Teresa, Census 2000 Telephone Questionnaire Assistance Program Master Plan (PMP), Census 2000 Informational Memorandum No. 111, Bureau of the Census, August 14, 2001.
Borg, Ingwer and Groenen, Patrick, Modern Multidimensional Scaling: Theory and Applications, Springer-Verlag New York, Inc., New York, NY, p. 3-6, 1997.
Cleveland, William, “Robust Locally Weighted Regression and Smoothing Scatterplots,” Journal of the American Statistical Association, Volume 74, Number 368, p. 829-836, 1979.
Cody, R. and Smith, J, Applied Statistics and the SAS Programming Language, Fourth Edition, Prentice Hall, New Jersey, p. 143-145, 1997.
Gold, R.Z., “Tests auxiliary to P2 tests in a Marchov chain,” Annals of Mathematical Statistics, Volume 34, p. 56-74, 1963.
Goodman, L.A., “On simultaneous confidence intervals for multinomial populations,” Technometrics, Volume 7, p. 247-254, 1965.
Longini, Michael J., Telephone Questionnaire Assistance (TQA) and Coverage Edit Followup (CEFU) Lessons Learned for Census 2000 - Revised, Census 2000 Decennial Systems and Contract Management Office (DSCMO) General Memorandum Series No. 01-01 (Revised), Bureau of the Census, June 12, 2001.
31

Appendix A
Customer Satisfaction Survey Questions For Callers Who Only Used the IVR System
(IVR-Only Callers)
Introduction
Thank you for participating in this two-minute survey conducted by an independent organization. Your feedback will assist the U.S. Census Bureau in evaluating the customer service provided during Census 2000.
Before beginning our survey, I need to know if you are calling from a touch-tone phone. If so, press 5 now. If you are calling from a rotary dial phone, please wait a few seconds and I’ll be back.
For the questions I ask, please respond by pressing the buttons on your telephone keypad. To repeat a question, press the star button. To skip a question, press 0.
You will be rating our customer service on a scale of one to seven where seven is always the best score and one is always the lowest score. You may also use any number in between to indicate your answers.
Questions
1. An automated menu system answered your call today and gave you a list of options. Once you made your first menu selection, rate how well the information that followed fit your expectation for that selection, with 7 being exactly what you expected and 1 being not at all what you expected.
2. Rate how easy it was to move through the automated menu system with 7 being very easy and 1 being not at all easy.
3. Thinking of the main reason you called today, rate the effectiveness of the automated system in handling that particular issue with 7 being very effective and 1 being not at all effective.
4. Rate how much the information you received today will help you participate in Census 2000, with 7 being very helpful and 1 being not at all helpful.
5. Rate your overall satisfaction with your call today to the Census 2000 Assistance Center with 7 being very satisfied and 1 being not at all satisfied.
32

Customer Satisfaction Survey QuestionsFor Callers Who Used the IVR System and Spoke to an Agent
(IVR-Agent Callers)
Introduction
Thank you for participating in this two-minute survey conducted by an independent organization. Your feedback will assist the U.S. Census Bureau in evaluating the customer service provided during Census 2000.
Before beginning our survey, I need to know if you are calling from a touch-tone phone. If so, press 5 now. If you are calling from a rotary dial phone, please wait a few seconds and I’ll be back.
For the questions I ask, please respond by pressing the buttons on your telephone keypad. To repeat a question, press the star button. To skip a question, press 0.
You will be rating our customer service on a scale of one to seven where seven is always the best score and one is always the lowest score. You may also use any number in between to indicate your answers.
Questions
1. An automated menu system answered your call today and gave you a list of options. Once you made your first menu selection, rate how well the information that followed fit your expectation for that selection, with 7 being exactly what you expected and 1 being not at all what you expected.
2. Rate how easy it was to move through the automated menu system with 7 being very easy and 1 being not at all easy.
3. Upon reaching the telephone agent and explaining the reason for your call, rate how quickly he or she understood your request with 7 being very quickly and 1 being not at all quickly.
4. Rate the agent’s level of interest in helping you with 7 being very interested in helping you and 1 being not at all interested.
5. Thinking of the main reason you called today, rate the effectiveness of the agent in handling that particular issue with 7 being very effective and 1 being not at all effective.
6. Rate how much the information you received today will help you participate in Census 2000, with 7 being very helpful and 1 being not at all helpful.
7. Rate your overall satisfaction with your call today to the Census 2000 Assistance Center with 7 being very satisfied and 1 being not at all satisfied.
33

Appendix B
Figure 8. Time line for response rates of the IVR-only and IVR-agent customer satisfaction surveys over the data collection period
TQA Day of data Description phase collection
During this period, the greeting gives the Internet address, tells the caller we are in
I 3/3/00 - 3/21/00the process of delivering forms, and to call back after 3/22 if a form is not received. The IVR main menu only gives the caller an opportunity to request that a replacement form be mailed during this phase if a census ID is provided.
During this period, the greeting gives the Internet address, tells the caller that Census 2000 forms have been delivered, that information must be as of Census
II 3/22/00 - 4/7/00 Day, April 1 and that if the form is not received by 4/12, the caller may be visited by a Census taker to complete a form. The main menu does allow for the caller to request that a form be mailed. In this phase, a Census ID is not necessary to request a form.
During this period, the greeting is essentially the same as in Phase II, except that the 4/12 date for the Census Bureau to receive a form is not read. No forms are
III 4/8/00 - 6/8/00 mailed in this phase because of the proximity to the Nonresponse Followup (NRFU) operation. However, the main menu does allow the caller to indicate that they have not received a form and then the call goes directly to a TQA agent for a short form telephone interview.
Reference for moving average is Cleveland (1979).
34

Appendix CAgent Debriefing Questionnaire
Inbound Telephone Questionnaire Assistance Operation
Operator Support System 1 2 3 4 5 6 7 1. Overall, it was easy for me to use the OSS to find the 1 2 3 4 5 6 7information that callers requested. 2. The visual design of the OSS screens (text color,
background color, font size, font type, and overall layout of 1 2 3 4 5 6 7 the page) made it easy to read the prepared answers.
3. I used the QRB search tool on a regular basis 1 2 3 4 5 6 7 4. I had a difficult time using the menu system in the OSS 1 2 3 4 5 6 7instrument.
Training 5. I was satisfied with the training I received on the OSS 1 2 3 4 5 6 7instrument.
Stro
ngly
Dis
agre
e6. Training helped me understand Census concepts. 1 2 3 4 5 6 7 7. I could have used more practice with the OSS instrument 1 2 3 4 5 6 7
Dis
agre
e before fielding calls
8. The training materials helped me to learn my job. 1 2 3 4 5 6 7 So
mew
hat D
isag
ree
9. I received enough instruction to deal with difficult callers. 1 2 3 4 5 6 7 10. Overall, I was satisfied with the training I received for 1 2 3 4 5 6 7
Nei
ther
Agr
ee n
or
TQA. D
isag
ree
Som
ewha
t Agr
eeInteractions with the Public
11. I understood the caller's requests. 1 2 3 4 5 6 7 A
gree
12. After receiving the caller's request, I found the answer 1 2 3 4 5 6 7within 30 seconds. 13. Callers seemed to understand the answers that I provided. 1 2 3 4 5 6 7 14. Callers seemed dissatisfied when I repeated the same 1 2 3 4 5 6 7information 15. Callers seemed satisfied with the answers I provided. 1 2 3 4 5 6 7 16. Callers seemed likely to participate in Census 2000. 1 2 3 4 5 6 7
Other 17. I used the desk guide on a regular basis. 1 2 3 4 5 6 7 18. I was satisfied with the help/assistance that I received from 1 2 3 4 5 6 7 my supervisors. 19. I was satisfied with the help/assistance that I received from 1 2 3 4 5 6 7 my QARs.
Stro
ngly
Agr
ee
35
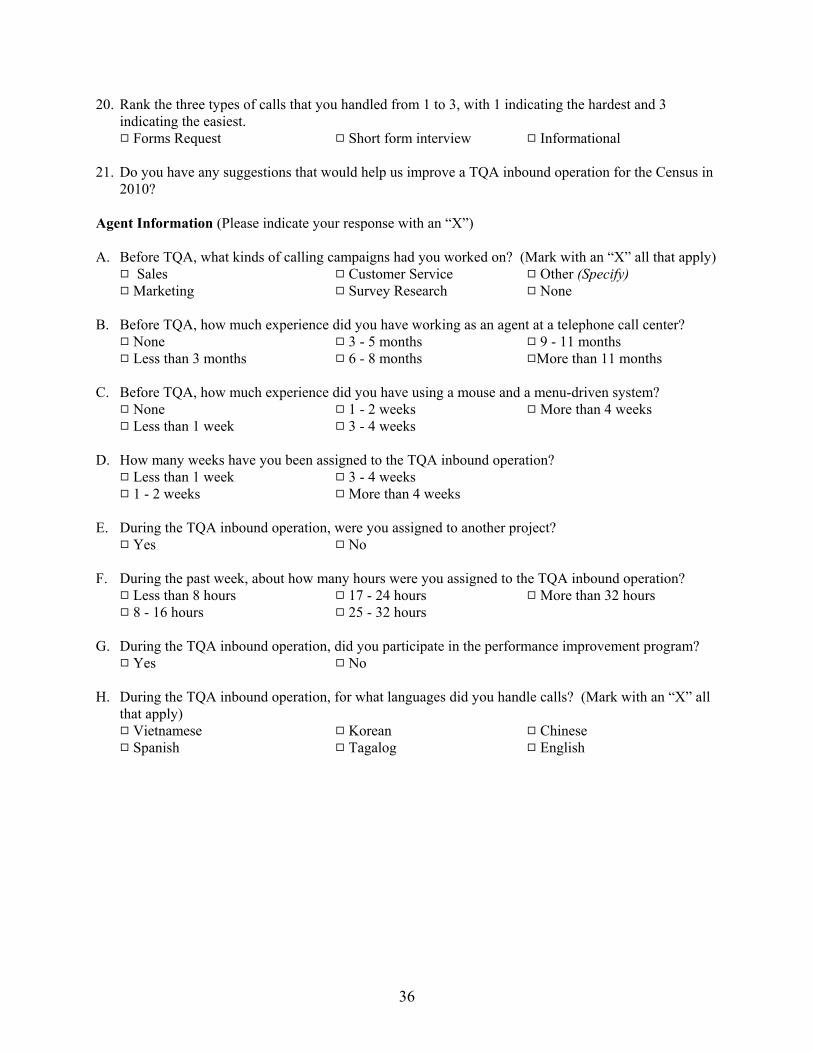
20. Rank the three types of calls that you handled from 1 to 3, with 1 indicating the hardest and 3 indicating the easiest. 9 Forms Request 9 Short form interview 9 Informational
21. Do you have any suggestions that would help us improve a TQA inbound operation for the Census in 2010?
Agent Information (Please indicate your response with an “X”)
A. Before TQA, what kinds of calling campaigns had you worked on? (Mark with an “X” all that apply) 9 Sales 9 Customer Service 9 Other (Specify) 9 Marketing 9 Survey Research 9 None
B. Before TQA, how much experience did you have working as an agent at a telephone call center? 9 None 9 3 - 5 months 9 9 - 11 months 9 Less than 3 months 9 6 - 8 months 9More than 11 months
C. Before TQA, how much experience did you have using a mouse and a menu-driven system? 9 None 9 1 - 2 weeks 9 More than 4 weeks 9 Less than 1 week 9 3 - 4 weeks
D. How many weeks have you been assigned to the TQA inbound operation? 9 Less than 1 week 9 3 - 4 weeks 9 1 - 2 weeks 9 More than 4 weeks
E. During the TQA inbound operation, were you assigned to another project? 9 Yes 9 No
F. During the past week, about how many hours were you assigned to the TQA inbound operation? 9 Less than 8 hours 9 17 - 24 hours 9 More than 32 hours 9 8 - 16 hours 9 25 - 32 hours
G. During the TQA inbound operation, did you participate in the performance improvement program? 9 Yes 9 No
H. During the TQA inbound operation, for what languages did you handle calls? (Mark with an “X” all that apply) 9 Vietnamese 9 Korean 9 Chinese 9 Spanish 9 Tagalog 9 English
36

Appendix D
Limitations of the sample design and data collection procedures for the customer satisfaction survey due to technical problems
There are several limitations on the sample selected and the data collection procedures for the customer satisfaction survey. They are as follows:
• Exclusion of three call center sites from sample. For technical reasons, three sites were not included in the sample universe. Two of the sites were Spanish bilingual sites probably resulting in very few eligible Spanish callers. This is a potential bias in the survey results to the extent that Spanish callers had a different experience in the TQA network than English callers.
• English voice recognition callers were excluded from customer satisfaction survey sample until correction occurred. As noted in the main report, the intended survey universe was all English calls (touch-tone and voice recognition) and all touch-tone Spanish calls. However, the TQA program staff determined during operations that the telecommunication integrator incorrectly programmed the survey universe and excluded both English and Spanish voice recognition calls, rather than just Spanish. They identified the problem and the integrator corrected the programming on March 30, 2000. As in the previous bullet this problem potentially results in biased survey results to the extent that voice recognition callers had a different experience than touch-tone callers in the TQA network.
• Exclusion of calls on March 13 and 14 from customer satisfaction survey sample. There was an error in the telecommunication integrator’s programming that affected pre-routing and resulted in blocked calls and long queues in the TQA network. While the technical staff worked on a fix for this, it was necessary to turn off the functions that affected pre-routing which meant that no calls could be transferred to the customer satisfaction site during that time period. Unfortunately, the re-programming occurred during the peak calling period, March 13 and 142, when there was potential for the callers to have had a different experience in the network than they would during lower volume periods.
• Errors in programming caused lost calls to customer satisfaction survey site. Errors in both the telecommunication integrator’s programming and the programming at the customer satisfaction survey site resulted in what the TQA program staff believe to be numerous lost calls to the customer satisfaction survey site. Essentially there was incorrect coordination of the timing between when the integrator notified the customer satisfaction survey site they had a call and when the customer satisfaction survey site responded. The result of the timing problem meant the telecommunication provider
2 The pre-routing had actually been turned off sometime March 13, 14, and the morning of March 15. We do not know when it was turned off on March 13. According to operational reports, we did not get any calls (or not enough that a call would have been selected for customer satisfaction survey) prior to the time on March 15 when the pre-routing was turned on. So, for the customer satisfaction survey, only two days were affected.
37

dropped the call in many instances before the customer satisfaction survey site picked it up. These errors were not fixed until March 22, 2000. As a contributor to the low-response rate, there is potential for bias to the extent that these callers who were dropped by the system differ from other callers. However, since the drop was due to a programming error and not a respondent related problem, the correlations between the callers experience and being dropped is likely very low.
• Switch problems at call centers resulted in some IVR-agent callers going to the IVR-only customer satisfaction survey site. The Intelligent Call Routing system and one particular brand of switch employed at the call centers did not communicate properly with one another. As a result the switch modified the labels that identified the call as an IVR-agent call. Thus, once the customer satisfaction survey site received the call, the label was no longer recognizable and the customer satisfaction survey site then defaulted the call to the IVR-only survey. In other words, some unidentifiable portion of the IVR-only surveys should have been IVR-agent surveys. The telecommunication integrator could not completely fix this problem and it occurred throughout the duration of the inbound program. However, late on March 22, 2000, the integrator implemented a pseudo-fix that diminished the extent of the problem somewhat.
There are two potential problems in the data resulting from this problem: 1) no information was collected about the interaction with the agent, and 2), callers may have included the agent portion of their experience in their response, thus potentially creating additional noise in the IVR-only survey data.
• Communication problem resulted in IVR-agent callers being sent to IVR-only customer satisfaction survey site. There was another communication problem between the integrator and the customer satisfaction survey site that also resulted in IVR-agent calls being labeled inappropriately as IVR-only calls. This was not fixed until March 27, 2000. The potential data problems are the same as that noted above.
• Programming error inappropriately labeled some IVR-only callers as IVR-agent callers. The telecommunication integrator had another programming error that inappropriately labeled some IVR-only calls as IVR-agent calls. Again, the TQA program staff cannot identify what calls encountered this programming error so we do not know what portion of the IVR-agent surveys should have been IVR-only surveys. This problem was not identified and fixed until March 24, 2000.
The impact to the data is slightly more problematic with this error. Essentially, the IVR-agent survey asks callers to respond to questions specific to their interaction with an agent. For IVR-only callers, their responses to these questions are completely invalid. But since the TQA program staff cannot identify which of the IVR-agent surveys IVR-only callers completed, we cannot remove them from the analysis population.
• Agent training did not cover the transfer of the caller from the agent to the customer satisfaction survey site. Lastly, the TQA program staff misunderstood what the telecommunication integrator meant when they told us that the transfer from the agent to the customer satisfaction survey site was automatic. Their understanding was that the
38

agent would be able to click something on the desktop that would trigger the transfer of the call to the customer satisfaction survey site. However, late in January 2000 they learned that the agent would have to transfer the call to a four-digit extension and that the actual four digits depended on the call center and the type of switch used.
Because this was not the original understanding, the training materials did not cover it and the training staff had to scramble to work with the sites to get this covered. Unfortunately, because of the late date relative to the start of training, the transfer was never adequately covered and many agents could not make the transfer during operations. Thus, even callers who agreed to participate in the survey did not always get to complete a survey.
The TQA program staff did not understand the extent of this problem until March 24, 2000. At that time, the prime contractor asked all call centers to review transfer procedures with the agents, but they never seemed to get a noticeable improvement in the agent’s ability to transfer calls. This has a potential negative impact on the validity of the data to the extent that there is a difference between agents who eventually could perform this transfer and those who could not. It seems reasonable that there might be a correlation between the quality of the callers’ interaction with the agent and the agent’s ability to successfully complete this transfer.
Unfortunately, no one identified these problems or developed adequate solutions until after the peak calling period for the operation which was between mid-March through the end of March. This is significant to the extent that there may be a difference in how the technology responds and how agents perform in high volume periods versus periods with lesser volume. But we do not have any way of assessing the potential impact, or bias, resulting from any of these problems.
39

Appendix E
Responses to the IVR-only and IVR-agent customer satisfaction surveys
Table 17. Responses to the IVR-only customer satisfaction survey
Questions asked of the IVR-only Responses (%) Std callers * 1 2 3 4 5 6 7 Missing
Mean Error
1. Expectation at first menu 14.9 2.0 2.2 3.5 9.9 9.8 55.1 2.6 5.47 0.043selection
2. Ease of moving through 8.7 1.2 1.6 2.3 6.7 8.1 64.6 6.9 6.01 0.038automated system
3. Effectiveness in automated system 12.4 1.9 2.2 3.6 7.4 6.4 54.8 11.4 5.60 0.045in handling main issue
4. Information helpful to participate 14.4 2.1 1.4 3.0 6.4 7.2 53.4 12.1 5.50 0.047in Census
5. Overall satisfaction 11.2 1.7 2.6 3.8 7.6 10.6 47.9 14.6 5.55 0.044 * Refer to Appendix A for the actual wording of the questions. Response options differ by question. However, one is the lowest rating and seven is the highest rating.
Table 18. Responses to the IVR-agent customer satisfaction survey
Questions asked of the IVR-agent Responses (%) Std callers * 1 2 3 4 5 6 7 Missing
Mean Error
1. Expectation at first menu selection 17.0 2.9 3.6 3.9 11.6 9.4 49.2 2.5 5.21 0.084
2. Ease of moving through 9.4 2.0 3.6 2.9 8.7 8.1 58.1 7.3 5.76 0.076automated system
3. Quickness of agent understanding 16.1 2.1 1.6 1.4 4.8 6.4 48.5 19.2 5.35 0.093request
4. Agent’s level of interest in 11.8 1.1 1.1 1.7 3.7 6.3 48.9 25.5 5.66 0.091helping
5. Effectiveness of agent in handling 13.1 1.5 1.0 2.5 6.9 6.4 48.9 19.7 5.53 0.090 main issue
6. Information helpful to participate 12.1 1.5 1.2 1.6 3.6 5.2 47.9 26.9 5.60 0.094in Census
7. Overall satisfaction 10.9 2.2 1.8 2.9 8.0 8.0 44.9 21.3 5.52 0.088 * Refer to Appendix A for the actual wording of the questions. Response options differ by question. However, one is the lowest rating and seven is the highest rating.
40
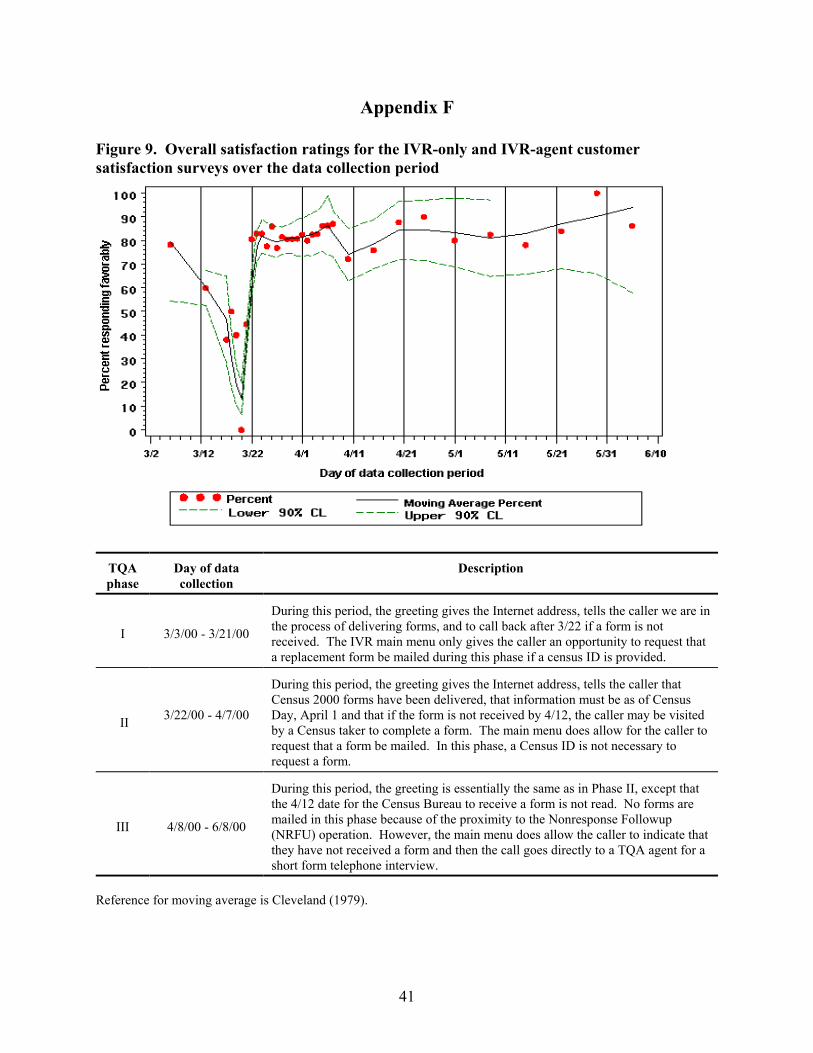
Appendix F
Figure 9. Overall satisfaction ratings for the IVR-only and IVR-agent customer satisfaction surveys over the data collection period
TQA Day of data Description phase collection
During this period, the greeting gives the Internet address, tells the caller we are in
I 3/3/00 - 3/21/00the process of delivering forms, and to call back after 3/22 if a form is not received. The IVR main menu only gives the caller an opportunity to request that a replacement form be mailed during this phase if a census ID is provided.
During this period, the greeting gives the Internet address, tells the caller that Census 2000 forms have been delivered, that information must be as of Census
II 3/22/00 - 4/7/00 Day, April 1 and that if the form is not received by 4/12, the caller may be visited by a Census taker to complete a form. The main menu does allow for the caller to request that a form be mailed. In this phase, a Census ID is not necessary to request a form.
During this period, the greeting is essentially the same as in Phase II, except that the 4/12 date for the Census Bureau to receive a form is not read. No forms are
III 4/8/00 - 6/8/00 mailed in this phase because of the proximity to the Nonresponse Followup (NRFU) operation. However, the main menu does allow the caller to indicate that they have not received a form and then the call goes directly to a TQA agent for a short form telephone interview.
Reference for moving average is Cleveland (1979).
41

Appendix G
Table 19. Responses to the agent debriefing questionnaire Percent of Respondents (%)
Agent Debriefing Questions Str D D Sw D N Sw A A Str A Missing
1. Overall, it was easy for me to use the OSS to find the 1.7 3.0 7.2 3.5 20.1 42.4 20.6 1.4information that callers requested.
2. The visual design of the OSS screens made it easy to 1.2 1.9 2.9 3.5 12.1 47.0 30.2 1.4read the prepared answers.
3. I used the QRB search tool on a regular basis 24.3 21.3 8.5 11.1 12.8 13.2 6.1 2.7
4. I had a difficult time using the menu system in the OSS 26.2 36.4 9.3 8.6 8.8 6.0 2.8 1.8instrument. ****
5. I was satisfied with the training I received on the OSS 3.9 4.6 6.7 5.7 12.1 37.3 28.9 0.8instrument.
6. Training helped me understand Census concepts. 2.2 2.5 3.6 5.6 13.1 38.4 33.4 1.2
7. I could have used more practice with the OSS 11.4 17.1 8.0 10.2 14.6 19.8 17.7 1.4instrument before fielding calls ****
8. The training materials helped me to learn my job. 2.5 2.6 4.6 7.0 16.1 41.5 24.7 1.1
9. I received enough instruction to deal with difficult 5.3 7.2 10.3 8.3 18.3 31.1 17.9 1.7callers.
10. Overall, I was satisfied with the training I received for 2.5 2.8 5.1 7.0 15.0 39.9 26.0 1.6TQA.
11. I understood the caller's requests. 0.8 0.7 1.7 4.3 12.2 48.1 31.1 1.1
12. After receiving the caller's request, I found the answer 2.5 3.6 6.5 9.0 24.5 34.8 18.0 1.0within 30 seconds.
13. Callers seemed to understand the answers that I 6.2 6.5 10.7 7.9 20.7 30.5 15.9 1.5provided.
14. Callers seemed dissatisfied when I repeated the same 5.3 8.3 6.1 9.9 17.0 25.3 26.7 1.3information ****
15. Callers seemed satisfied with the answers I provided. 5.2 5.0 9.1 10.3 26.5 29.5 13.2 1.2
16. Callers seemed likely to participate in Census 2000. 5.0 4.6 7.0 14.1 21.7 30.7 15.9 1.0
17. I used the desk guide on a regular basis. 16.1 17.4 6.9 16.9 14.0 19.4 6.3 3.0
18. I was satisfied with the help/assistance that I received 5.4 3.9 6.0 8.3 14.4 35.0 25.5 1.5from my supervisors.
19. I was satisfied with the help/assistance that I received 4.4 4.8 5.1 12.2 16.6 34.0 20.0 2.9from my QARs. Note: Str D = Strongly Disagree, D = Disagree, Sw D = Somewhat Disagree, N = Neither Agree nor Disagree, Sw A = Somewhat Agree, A = Agree, Str A = Strongly Agree**** Negatively worded question.
42

Appendix H
Table 20. Gamma statistics between questions 1 through 19 on the agent debriefing questionnaire
Agent Debriefing Question
1. Overall, it was easy for me to use the OSS to find the information that callers requested.
2. The visual design of the OSS screens made it easy to read the prepared answers.
3. I used the QRB search tool on a regular basis
4. I had a difficult time using the menu system in the OSS instrument.
5. I was satisfied with the training I received on the OSS instrument.
6. Training helped me understand Census concepts.
7. I could have used more practice with the OSS instrument before fielding calls
8. The training materials helped me to learn my job.
9. I received enough instruction to deal with difficult callers.
1 2 3 4 5 6 7 8 9 10 11 12 13 14 15 16 17 18 19
1.00
0.51 1.00
0.15 0.07 1.00
-0.44 0.31 0.04 1.00
0.42 0.39 0.14 -0.28 1.00
0.39 0.42 0.15 -0.24 0.76 1.00
-0.19 -0.11 0.04 0.28 -0.30 -0.17 1.00
0.44 0.42 0.15 -0.24 0.64 0.67 -0.18 1.00
0.41 0.32 0.14 -0.20 0.57 0.55 -0.22 0.57 1.00
43

Agent Debriefing Question 1 2 3 4 5 6 7 8 9 10 11 12 13 14 15 16 17 18 19
10. Overall, I was satisfied with the 0.50 0.42 0.12 -0.28 0.82 0.75 -0.27 0.70 0.70 1.00training I received for TQA.
11. I understood the caller's 0.39 0.36 0.06 -0.23 0.26 0.34 -0.03 0.32 0.30 0.35 1.00requests.
12. After receiving the caller's request, I found the answer 0.49 0.30 0.11 -0.28 0.27 0.29 -0.15 0.33 0.32 0.34 0.48 1.00 within 30 seconds.
13. Callers seemed to understand 0.38 0.22 0.16 -0.14 0.24 0.31 -0.03 0.33 0.33 0.32 0.37 0.44 1.00the answers that I provided.
14. Callers seemed dissatisfied when I repeated the same -0.12 -0.04 -0.05 0.11 -0.03 -0.06 0.10 -0.10 -0.11 -0.09 0.02 -0.08 -0.27 1.00 information
15. Callers seemed satisfied with 0.39 0.23 0.18 -0.14 0.26 0.34 -0.01 0.35 0.35 0.37 0.32 0.37 0.71 -0.28 1.00the answers I provided.
16 Callers seemed likely to 0.26 0.21 0.14 -0.09 0.22 0.31 0.01 0.30 0.29 0.29 0.29 0.30 0.48 -0.20 0.53 1.00participate in Census 2000.
17. I used the desk guide on a 0.12 0.05 0.30 0.04 0.11 0.13 0.08 0.18 0.10 0.13 0.06 0.07 0.14 -0.08 0.19 0.15 1.00regular basis.
18. I was satisfied with the help/assistance that I received 0.27 0.23 0.15 -0.10 0.37 0.39 -0.05 0.38 0.37 0.42 0.22 0.20 0.28 -0.12 0.30 0.31 0.17 1.00 from my supervisors.
19. I was satisfied with the help/assistance that I received 0.31 0.27 0.15 -0.14 0.35 0.39 -0.05 0.37 0.35 0.41 0.24 0.22 0.28 -0.10 0.29 0.27 0.15 0.59 1.00 from my QARs.
44

Appendix I
Table 21. Gamma statistics between questions 1 through 19 and questions A through H on the agent debriefing questionnaire
Agent Debriefing Question * 1 2 3 4 5 6 7 8 9 10 11 12 13 14 15 16 17 18 19
A. Before TQA, what kinds of calling campaigns had you worked on?
Sales 0.03 *** 0.01 -0.06 0.02 0.05 -0.07 0.02 0.04 0.02 0.08 0.05 0.01 *** -0.01 0.03 -0.02 -0.04 0.02 Customer Service 0.10 0.05 0.05 -0.05 0.04 ** -0.06 0.03 0.05 -0.01 0.12 0.12 -0.01 0.04 -0.02 -0.02 0.02 -0.07 -0.03 Other -0.01 0.02 0.01 0.01 -0.02 -0.05 0.06 -0.05 -0.05 -0.05 0.13 0.02 *** 0.07 ** -0.03 -0.02 -0.05 0.02 Marketing 0.05 -0.02 0.02 -0.08 0.10 0.09 -0.09 0.03 0.03 0.07 0.06 0.03 0.01 0.03 -0.01 ** 0.03 -0.07 -0.01 Survey Research -0.10 -0.13 -0.01 -0.04 -0.14 -0.14 -0.02 -0.17 -0.15 -0.16 0.03 -0.04 -0.11 0.07 -0.12 -0.05 -0.06 -0.12 -0.07 None -0.08 -0.03 -0.06 0.09 -0.05 -0.02 0.05 -0.04 -0.03 ** -0.14 -0.12 0.05 -0.04 0.02 0.02 -0.01 0.12 ***
B. Before TQA, how much experience did you have working as an agent at a telephone call center?
C. Before TQA, how much experience did you have using a mouse and a menu-driven system?
D. How many weeks have you been assigned to the TQA inbound operation?
E. During the TQA inbound operation, were you assigned to another project?
0.01 -0.01 0.01 -0.02 -0.01 -0.03 -0.02 -0.02 -0.01 -0.03 0.06 0.02 -0.06 0.05 -0.08 -0.06 -0.03 -0.11 -0.04
0.03 0.03 -0.06 -0.08 0.02 -0.01 -0.01 -0.03 -0.04 -0.03 0.11 0.08 -0.13 0.15 -0.13 -0.14 -0.04 -0.12 -0.13
** ** -0.02 *** -0.07 -0.08 0.07 -0.08 -0.05 -0.07 0.05 0.05 -0.04 0.06 -0.06 -0.08 -0.01 -0.05 -0.08
0.10 ** -0.05 -0.08 0.05 0.05 -0.01 0.07 ** 0.01 0.10 0.15 0.20 -0.10 0.17 0.12 0.04 0.08 0.01
45

Agent Debriefing Question * 1 2 3 4 5 6 7 8 9 10 11 12 13 14 15 16 17 18 19
F. During the past week, about how many hours were you 0.10 ** -0.02 -0.06 -0.02 -0.05 -0.04 -0.01 -0.03 -0.03 0.06 0.09 -0.02 0.03 -0.02 -0.08 0.02 -0.08 -0.07assigned to the TQA inboundoperation?
G. During the inbound operation, did you participate in the -0.15 -0.03 -0.23 0.06 -0.16 -0.15 0.01 -0.16 -0.16 -0.18 -0.16 -0.12 -0.16 0.06 -0.19 -0.13 -0.26 -0.14 -0.19performance improvementprogram?
H. During the inbound operation, for what languages did you handle calls?
Vietnamese ** -0.05 0.04 -0.09 0.01 -0.09 -0.01 -0.07 -0.06 -0.07 -0.07 0.01 -0.09 0.06 -0.13 -0.16 -0.03 -0.12 -0.03 Korean -0.06 -0.06 0.05 0.06 -0.14 -0.09 *** -0.10 -0.02 -0.06 -0.03 0.04 0.07 0.02 *** -0.05 -0.04 -0.05 -0.05
Chinese -0.05 0.03 0.08 -0.05 *** -0.07 *** -0.03 -0.01 -0.03 -0.10 -0.05 -0.10 0.10 -0.09 -0.19 0.01 -0.05 -0.01 Spanish 0.07 ** 0.07 -0.02 0.01 0.02 0.10 0.04 -0.01 0.01 0.13 0.08 0.09 -0.04 0.10 0.11 0.12 0.01 0.02 Tagalog 0.15 0.13 0.17 0.07 0.17 0.29 0.02 0.19 0.23 0.19 0.08 -0.04 0.11 ** 0.09 -0.09 -0.02 -0.04 0.17 English 0.01 0.13 -0.15 -0.14 0.05 -0.02 -0.06 -0.05 -0.05 0.03 0.02 -0.01 -0.18 0.14 -0.19 -0.14 -0.13 -0.02 -0.03
* See Appendix C for the wording of questions 1 through 19. ** Indicates values greater than -0.005 and less than 0. *** Indicates values greater than 0 and less than 0.005.
46