Dynamic Model for COTS Glue Code Development and COTS Integration
Upload
truongtramCategory
view
228download
0
1
Telemetry Tracking &Control (TT&C) – First TDRSS, then Commercial GEO &Big LEO and Now Through LEO
Dwayne R. Morgan, NASA/GSFC/WFF code 584, Bldg. N-161 rm.226, Wallops Island, VA, 23337,(757)-824-1349, email: [email protected]
Ronald G. Streich, Computer Sciences Corp. (CSC), Bldg. E-108 rm.303, Wallops Island, VA, 23337,(757)-824-2191, email: [email protected]
Barton Bull, NASA/GSFC/WFF code 571, Bldg. E-108 rm.120, Wallops Island, VA, 23337,(757)-824-1893, email: [email protected]
Charles Grant, Computer Sciences Corp. (CSC), Bldg. E-108 rm.305, Wallops Island, VA, 23337,(757)-824-1633, email: [email protected]
Abstract:The advent of low earth orbit (LEO) commercial communication satellites provides an opportunity todramatically reduce Telemetry, Tracking and Control (TT&C) costs of launch vehicles, Unpiloted AerialVehicles (UAVs), Research Balloons and spacecraft by reducing or eliminating ground infrastructure.Personnel from the Goddard Space Flight Center’s Wallops Flight Facility (GSFC\WFF) have successfullyused commercial Geostationary Earth Orbit (GEO) and Big LEO communications satellites for LongDuration Balloon Flight TT&C. The Flight Modem is a GSFC\WFF Advanced Range Technologyinitiative (ARTI) designed to streamline TT&C capability in the user community of these scientific datagathering platforms at low cost. Making use of existing LEO satellites and adapting commerciallyavailable components; two-way, over the horizon communications may be established with these vehiclesat great savings due to reduced infrastructure. Initially planned as a means for permitting GPS data fortracking and recovery of sounding rocket and balloon payloads, expectations are that the bandwidth cansoon be expanded to allow more comprehensive data transfer. The system architecture which integratesantennas, GPS receiver, commercial satellite packet data modem and a single board computer with customsoftware is described and technical challenges are discussed along with the plan for their resolution. Athree-phase testing and development plan is outlined and the current results are reported. Results and statusof ongoing flight tests on aircraft and sounding rockets are reported. Future applications on these platformsand the potential for satellite support are discussed along with an analysis of cost effectiveness of thismethod vs. other tracking and data transmission schemes.
Introduction
TDRSS initially served as one of the early TT&C space based satellite networks designed to replace theneed for multiple ground tracking systems with GEO satellites capable of routing signals in full duplexfrom a single central ground station. Then came the commercial version of TDRSS through such entities asINMARSAT and ARGOS. Customers are charged for service costs rather than investing in equipment oroperations costs. The Low Earth Orbit (LEO) satellite commercial companies such as ICO GlobeCom,Iridium and Globalstar improve on the commercial purchase of data at lower cost through shared resourcesand distribution through the Internet. Cost leveraging is further exploited by numerous LEO non-spacecraftcommercial services for data relay such as monitoring truck movement, gas pipeline flow, and aircraft in-flight email & FAX services. This paper presents “The Flight Modem” as an alternative to loweringspacecraft ground station and infrastructure costs while leveraging commercial COTS products to achievescientific objectives.
The Flight Modem exists today as an Advanced Range Technology Initiative (ARTI) funded by the NASAGoddard Space Flight Center (GSFC) Space Operations and Management Office (SOMO). The FlightModem is an enabling technology designed to bridge existing technology with commercial products andstreamline missions with a more cost effective tool that eliminates the requirement for ground system andinfrastructure support for tracking and command. The Flight Modem began as a concept to lower missioncosts by leveraging advances in existing space based Internet Protocol (IP) communications for over thehorizon (OTH) low bandwidth (< 9600 baud) data. There were many LEO satellite commercial companies
2
to choose from. Only one offered global commercial IP space based communications with COTS OriginalEquipment Manufacturer (OEM) products to support full duplex and low bandwidth data requirements on asatellite constellation, Globalstar. The Flight Modem uses a GPS receiver and a Satellite Packet Modemcompatible with the Globalstar satellite network. Field-testing with aircraft, sounding rockets and balloonshas revealed other valuable applications that have the potential to reduce mission costs significantly. Smallspacecraft use low rate command data at typically 2 kbps. The Globalstar link supports 9.6 kbps withgreater global coverage than the existing ground and aircraft tracking systems such as the Advanced RangeInstrumentation Aircraft (ARIA), P-3 Extended Area Telemetry System (EATS), and the E-9A AirborneTelemetry Platform.
The Flight Modem is undergoing three phases of testing; Phase I: Ground System Testing, Phase II:Aircraft Flight Tests, and Phase III: Sounding Rocket Test Flight. Phase I is the terrestrial based testingconducted with an early version of the Satellite Packet Modem called the tri-mode phone. These tests helpestablish latency measurements, Bit Error Rate (BER) testing, and software development of an automateddialup connection. Phase II are the aircraft test flights designed to test satellite handover, BER tests, andapplication data flows such as GPS and other airborne data. Phase III moves the Flight Modem into asounding rocket test flight to conduct environmental testing, dual frequency wrap around antenna design,received satellite signal strength, and coverage at higher altitudes.
Phase I: Ground System Testing
Phase I introduces a description of the flight modem and its components used during ground system testing.A comprehensive measurement of in and out of band emissions on the tri-mode phone and car kit follows.Peak power to level measurements and FCC/NTIA rules on Out-of-Band Emissions for Global MobilPersonal Communications (GMPCS) operating in the 1610-1660.5 MHz Band is then discussed.
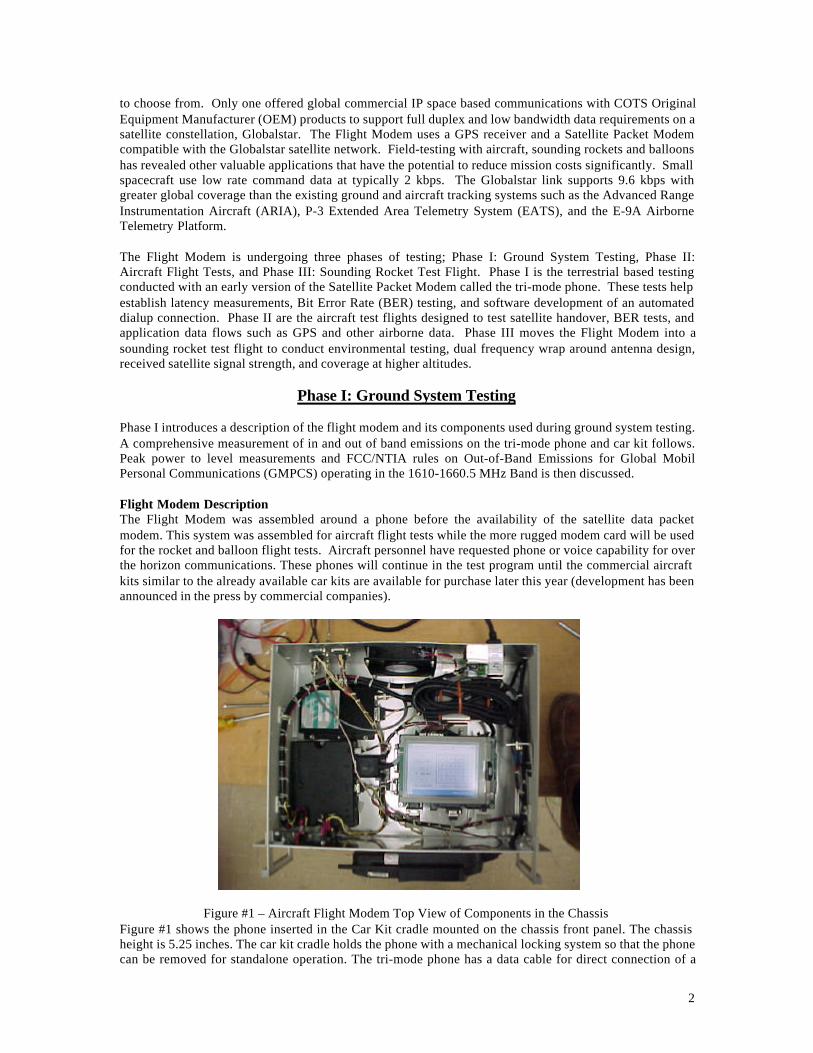
Flight Modem DescriptionThe Flight Modem was assembled around a phone before the availability of the satellite data packetmodem. This system was assembled for aircraft flight tests while the more rugged modem card will be usedfor the rocket and balloon flight tests. Aircraft personnel have requested phone or voice capability for overthe horizon communications. These phones will continue in the test program until the commercial aircraftkits similar to the already available car kits are available for purchase later this year (development has beenannounced in the press by commercial companies).
Figure #1 – Aircraft Flight Modem Top View of Components in the ChassisFigure #1 shows the phone inserted in the Car Kit cradle mounted on the chassis front panel. The chassisheight is 5.25 inches. The car kit cradle holds the phone with a mechanical locking system so that the phonecan be removed for standalone operation. The tri-mode phone has a data cable for direct connection of a
3
laptop without the car kit but this limits operation to 45 minutes of continuous operation using the batterycharge of the phone. The car kit consists of (1) the phone cradle, (2) an auxiliary black box, (3) a separateprivate handset for use while the phone is in the cradle, (4) separate speaker and microphone for hands freeoperation, (5) a magnetic base car top antenna and (6) all required cables and wiring. The auxiliary blackbox contains an interface connector for a laptop through RS-232, 12V wire harness for connection to a carbattery or other power supply, a 7dB power amplifier to boost the 1610-1625 MHz at 0.4W from the phoneup to 2.0W, and RF interface connectors for cables to the phone and car top or aircraft antennas.
The front panel mounting is required for turning on phone power and monitoring the phone operation forpreoperational checks. Normal flight tests of BER or GPS data transmission are hands free operation withturn on and preoperational checks before flight then turn off after flight. The red power switch can alsoturn off all power. Figure #1 shows the top view of the components mounted in the chassis. Figure #1shows the car kit auxiliary black box in the lower left corner, the flight computer LCD screen in the lowerright corner, and an internal GPS receiver in the upper left corner, and a power converter (110VAC to+5VDC and +12VDC) under its AC power cord in the upper right corner. The fixture at the upper rightcorner with the external power cord is the AC filter/fuse/connector unit.
When the new satellite data packet modem card is available, the Car Kit and tri-mode phone are no longerrequired. The modem is a single printed circuit card about 7”LX3.5”WX0.65”H and there will be only datacapability with no voice. But, Voice Over Internet Protocol (VOIP) is likely to provide voice for themodem in the future. The Flight Computer display will also be deleted after software development and testis completed. The flight computer printed circuit board below the display is smaller than the display. Thecommercial aircraft antenna is 2.5”Wx3.0”Lx0.7”H. It contains a band pass filter on the receive antenna toreject the transmit antenna signal to protect the 2485-2500 MHz low noise amplifier (LNA).
Duplex CommunicationsThe LEO satellite communications system must be treated as any other commercial telecommunicationssystem such as the public switched telephone network (PSTN). Error free data flow is guaranteed whenevera connection is made. The User Terminal (UT) – a phone or satellite packet data modem – operates similarto cellular phones and modems. The UT cannot transmit until it receives a signal containing information onits allocated transmission frequency. A gateway is a satellite ground station that controls the RFtransmissions between UT, satellites and voice or data to the PSTN.
The LEO communications system we have tested was designed for global coverage on the earth’s surfaceand also for commercial airliner communications on a continuous basis. When the UT goes to higheraltitudes than commercial airliners then limitations of the LEO satellite antenna beam-widths and satellitepositions determine when a connection can be made.
Initial requirements for a vehicle locator system required only UT to science control center to send vehicleor UT GPS position data. However, the system, like a phone system is always full duplex or continuoustwo way. Tests were conducted for forward link (science center to UT), return link (UT to science center)and loopback (UT to gateway where the same data is then looped back to the UT for comparison). Thesetests were conducted with Pseudo Noise (PN) sequences used by most satellite telemetry pulse codemodulation (PCM) links. Our conclusions after two months of tests were that the bit error rate tests (BER)always produced error free data for all configurations if a connection were made. And, connections weremade as easily as a GPS receiver acquires its satellite signals and provides position data.
Recently, a satellite packet data modem Developer’s Kit that provides information for third partydevelopers to interface with the LEO system. This kit confirmed that BER techniques are used for forwarderror correction (FEC) and connection is terminated when the data cannot be corrected. FEC codes providethe number of corrected errors based on the error code regeneration so that corrected errors are a goodmeasure available for ensuring quality of service before the user is subjected to degradation. Correctederror counts allow the LEO communications system to raise UT or gateway transmitter power level forbetter link margin or reduce power level to allow more UT signals through the satellite transponder.
4
Our BER tests included transmission of the data to and from the gateway through the Internet. Tests with aleased commercial data circuit to and from the gateway were cancelled due to the error free performanceand low latency of the Internet.
Latency MeasurementsLatency was measured by adding a time stamp to our transmitted data as it went to the UT then timestamping the received data. The difference between the two times is the latency. Latency included the UTtransmission delays, UT to satellite delay, gateway delays, Internet delays and receiving equipment delays.Typical latency for the Wallops Island, VA BER data through the UT through the satellite and gateway andback to Wallops BER equipment was 25 milliseconds.
The latency appears reasonable when reviewing the transmission path. The laptop or BER data transfersinto the UT at 33.8 kbs where it is buffered into a 9600 bps stream required for RF transmission. The datais transmitted continuously and the UT was able to accept continuous input of BER data for hours on end.Transmission from the UT to satellite at an altitude of 1440 kilometers (km) should be about 4 milliseconds(ms) but will vary as the range to the satellite moving in orbit. Since three or more satellites typicallyreceive the UT signal the gateway stored the data from each path, time aligns the data and performsdiversity combining to provide the best signal. This diversity combining eliminates satellite-to-satellitehandover that ground stations must deal with due to horizon break or loss of line of sight for the signal. Thediversity combining delay can be as high as 7 ms to accommodate signals from satellites overhead and onthe horizon at the same time. Total latency is then about 2 ms for the UT low rate data buffers, about 4 msfrom UT to satellite, about 4 ms from satellite to gateway, 7 ms or less for diversity combining, 6 ms forInternet and 2 ms for BER test set receiver to buffer the low rate data.
Automated S/W dialupCommercial service is straightforward – plug in a laptop or PC running Windows 98 or later, enter thephone number of the gateway into the web browser then surf the web, send e-mail or FTP data like anyother Internet connection. The gateway to Internet interface is seamless. The challenge is to perform thesame functions on a flight computer that must read data from a GPS receiver or telemetry equipment, timestamp the data and make the dial up connection. Most flight computers do not run Windows 98. WindowsCE was chosen as the likely candidate for simple implementation of dial up; but, the lack of documentationproved astounding. Fortunately, Windows CE Version 3.0 became available just before we were to choosea different operating system then trial and error techniques found the combinations of code to make dial upperform correctly. Starting with a different operating system may have been less time consuming.
The techniques for automating dialup connections, initiating TCP/IP connections, and reading/writing toserial communications ports are widely available for Windows 95/98/NT. However, Windows CE does notimplement these techniques in the same manner as the other operating systems. The most likely source ofprogramming techniques was obviously going to be the Microsoft Developer Network (MSDN) as itprovides all of the techniques and guidelines needed to create programs under Windows CE. When usingthe MSDN, though, we found the information somewhat cryptic in nature and rather difficult to navigate.Techniques found in the MSDN were, for the most part, incomplete in their explanation of programming asthey failed to mention other steps required before, after, or in addition to the current programmingtechnique. After much research, we were able to locate and purchase a book called Windows CE 3.0Application Programming [10]. This book explained, in detail, most of the steps required each of thetechniques for our software. After much trial and error and the explanations in this book, we wereeventually able to bring all of the pieces together and perform automated dialup and data transfer.
BER TestsThe Developer’s Kit for the UT provides interface cables, documentation and software to read ReceivedSignal Strength Indicator (RSSI), bit errors from the FEC corrected error count, number of bad frames(frames with corrected errors) and total number of frames received. In addition, control is provided to dialanother phone number at the gateway to initiate a loopback test from the UT to the gateway and back to theUT. These tests demonstrated how well the system is controlled for quality of service. Our BER data sentthrough the system was always error free whenever a connection was made.
5
The Developer’s Kit also has tools required for airborne and certain satellite users. The kit allows the UT tobe configured to search for only designated gateways rather than all possible worldwide gateways to reducesearch time for acquisition or reacquisition. This limited search is especially useful for sub-orbital rocketsand aircraft flight tests. A couple of second’s acquisition time is usually not a concern for satellites orballoons. Maneuvering aircraft causes rapid changes in antenna pattern orientation as well as dynamicDoppler frequency changes so that rapid reacquisition of the connection is critical to near continuousposition information. Multiple radars are often deployed for these reasons. One example is a UAV andanother is over the horizon (OTH) aircraft science data gathering where experiment control requires scienceinformation to control on-board sensors.
There is even more sophisticated control and monitoring capabilities available called the DiagnosticMonitor used by service technicians. These tools are licensed and sold only after Non DisclosureAgreement documents are signed. Use of these tools is neither necessary nor recommended becausechanging the system operation is a serious risk with so many activities highly interactive.
In-Band EmissionsA major concern for the in-band emissions is protection of the National Radio Astronomy Observatories(NRAO) that share the 1610.0-1613.0 MHz band with the Global Mobile Personal Communications(GMPCS) systems that include LEO satellite communications systems. Regulations provide protectionzones around NRAO excluding GMPCS airborne transmissions in these zones during scheduled NRAOoperations. In addition, GMPCS will take measures to preclude interference to NRAO operations. Code ofFederal Regulations [1] CFR 47 Section 25.213(a)(1)(iv) has a formula of no airborne transmission withind^2 = 16.81(h) where d is the ground distance in kilometers between the airborne vehicle and NRAOantenna and h is the airborne vehicle altitude in meters. These concerns do not apply to satellites becausepath attenuation is great. This concern is for nearby airborne vehicles.
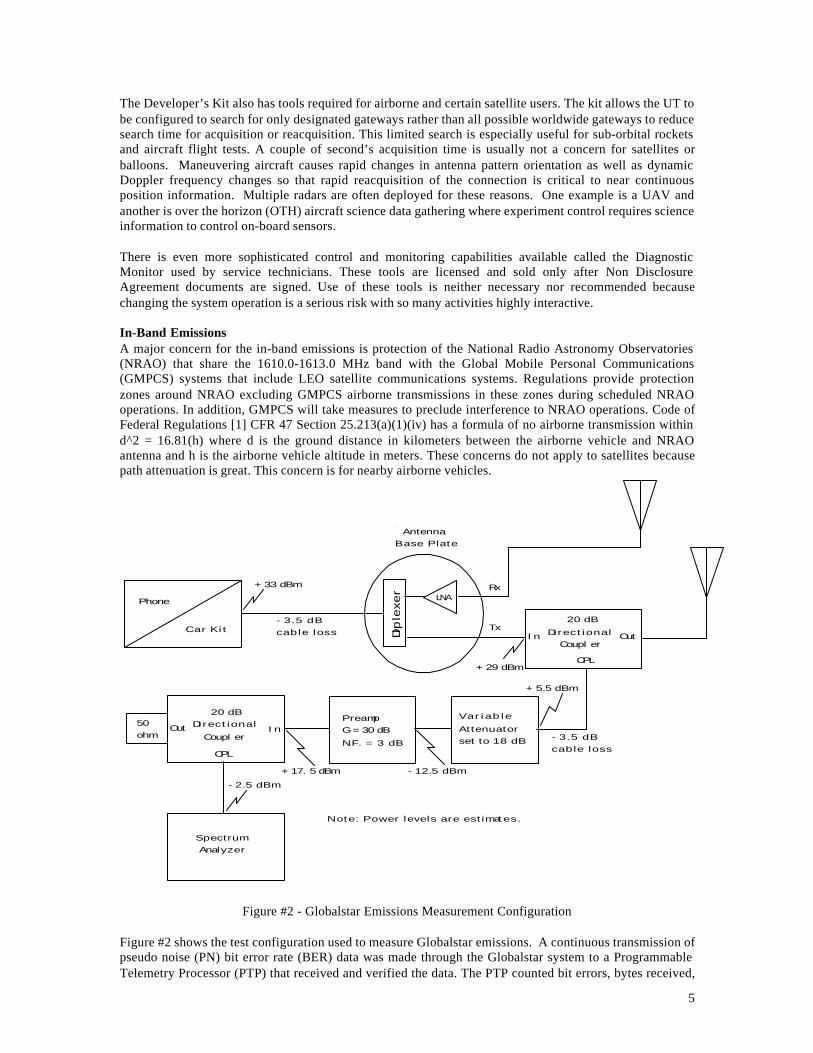
Figure #2 - Globalstar Emissions Measurement Configuration
Figure #2 shows the test configuration used to measure Globalstar emissions. A continuous transmission ofpseudo noise (PN) bit error rate (BER) data was made through the Globalstar system to a ProgrammableTelemetry Processor (PTP) that received and verified the data. The PTP counted bit errors, bytes received,
Phone
Car Kit Dip
lexe
r LNA
20 dB
Directional Coupl er
I n Out
CPL
I nOut
CPL
20 dBDirectional
Coupl er
Rx
Tx
AntennaBase Plate
Spectrum Analyzer
- 2.5 dBm
50ohm
PreampG = 30 dB
N.F. = 3 dB
Variable
Attenuatorset to 18 dB
Note: Power levels are estimates.
+ 33 dBm
- 3.5 dBcable loss
- 3.5 dBcable loss
+ 17. 5 dBm - 12.5 dBm
+ 29 dBm
+ 5.5 dBm
6
frames received and displayed the IP socket connection status. Zero bit errors were observed whenever thesocket was connected. An occasional single bit error would occur when the socket connection was made orbroken. Socket connection was usually lost only when the operator terminated a connection to change RFcable configurations for calibration signals.
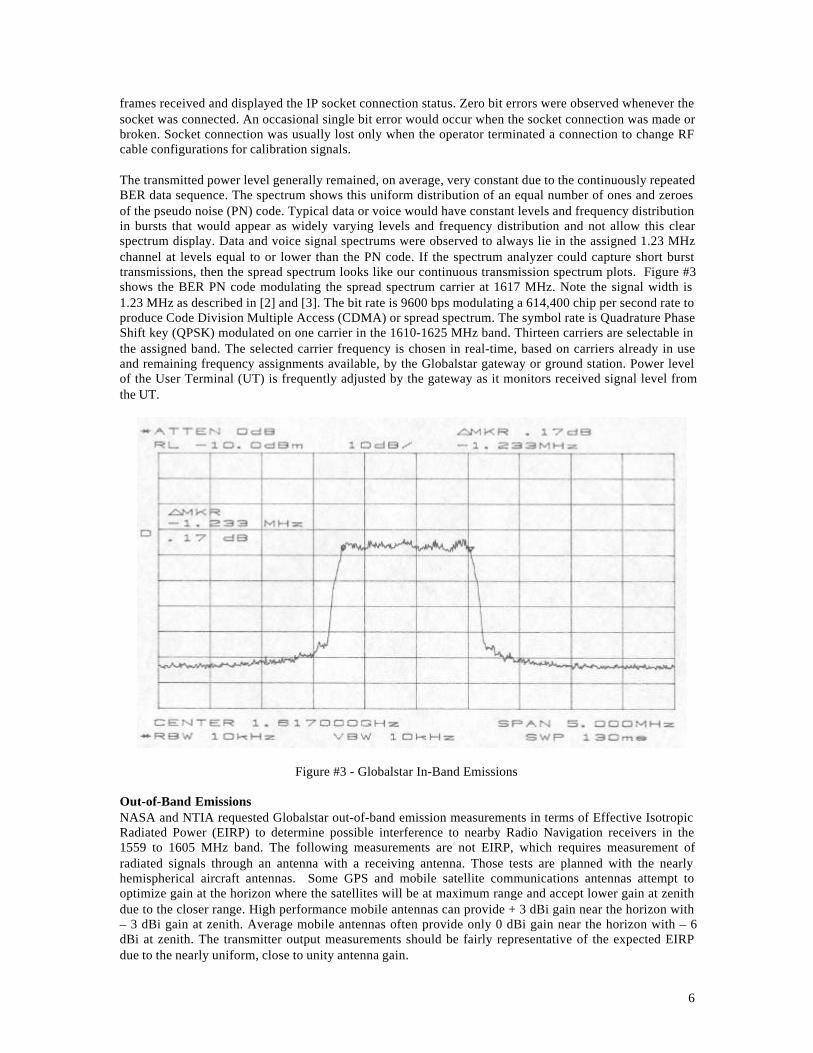
The transmitted power level generally remained, on average, very constant due to the continuously repeatedBER data sequence. The spectrum shows this uniform distribution of an equal number of ones and zeroesof the pseudo noise (PN) code. Typical data or voice would have constant levels and frequency distributionin bursts that would appear as widely varying levels and frequency distribution and not allow this clearspectrum display. Data and voice signal spectrums were observed to always lie in the assigned 1.23 MHzchannel at levels equal to or lower than the PN code. If the spectrum analyzer could capture short bursttransmissions, then the spread spectrum looks like our continuous transmission spectrum plots. Figure #3shows the BER PN code modulating the spread spectrum carrier at 1617 MHz. Note the signal width is1.23 MHz as described in [2] and [3]. The bit rate is 9600 bps modulating a 614,400 chip per second rate toproduce Code Division Multiple Access (CDMA) or spread spectrum. The symbol rate is Quadrature PhaseShift key (QPSK) modulated on one carrier in the 1610-1625 MHz band. Thirteen carriers are selectable inthe assigned band. The selected carrier frequency is chosen in real-time, based on carriers already in useand remaining frequency assignments available, by the Globalstar gateway or ground station. Power levelof the User Terminal (UT) is frequently adjusted by the gateway as it monitors received signal level fromthe UT.
Figure #3 - Globalstar In-Band Emissions
Out-of-Band EmissionsNASA and NTIA requested Globalstar out-of-band emission measurements in terms of Effective IsotropicRadiated Power (EIRP) to determine possible interference to nearby Radio Navigation receivers in the1559 to 1605 MHz band. The following measurements are not EIRP, which requires measurement ofradiated signals through an antenna with a receiving antenna. Those tests are planned with the nearlyhemispherical aircraft antennas. Some GPS and mobile satellite communications antennas attempt tooptimize gain at the horizon where the satellites will be at maximum range and accept lower gain at zenithdue to the closer range. High performance mobile antennas can provide + 3 dBi gain near the horizon with– 3 dBi gain at zenith. Average mobile antennas often provide only 0 dBi gain near the horizon with – 6dBi at zenith. The transmitter output measurements should be fairly representative of the expected EIRPdue to the nearly uniform, close to unity antenna gain.
7
Additional tests are planned to measure how close the Globalstar transmit antenna can be placed to a GPSreceive antenna before degradation of the GPS performance is observed. Preliminary results show nosignificant GPS degradation when the antennas are six inches apart for our flight rated equipment. Our GPSLNA contains a measured 15 dB out-of-band rejection at 1575 MHz +/- 35 MHz.
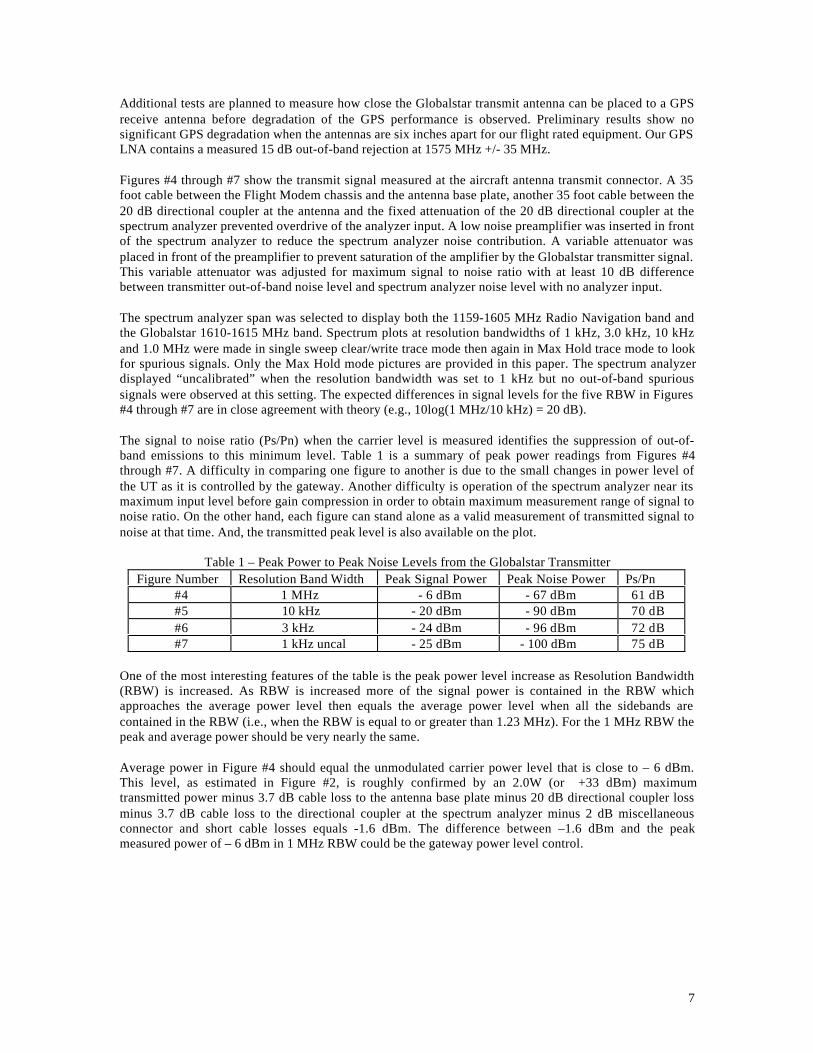
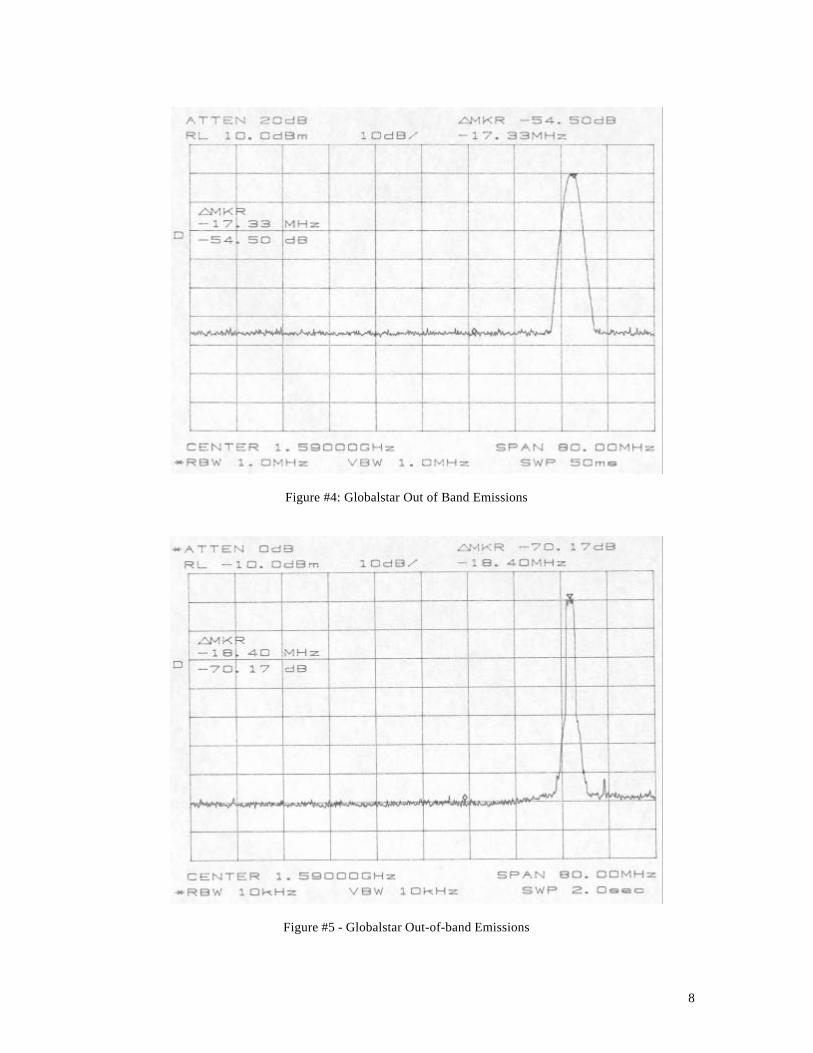
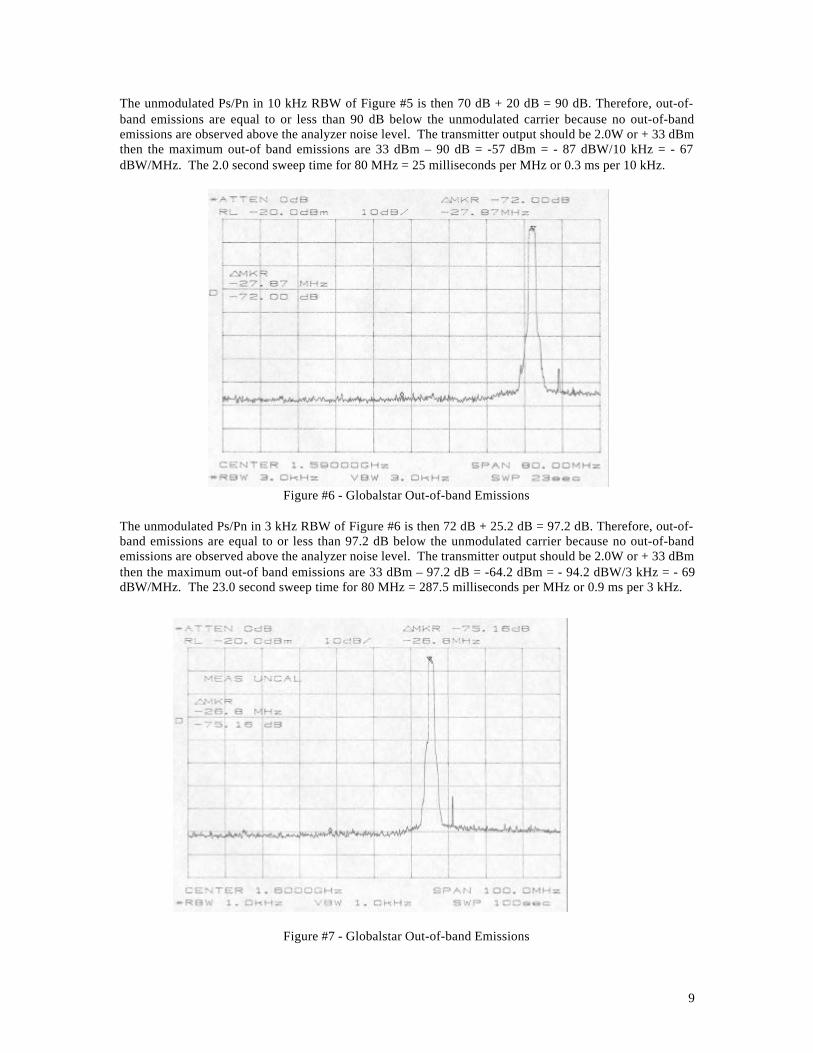
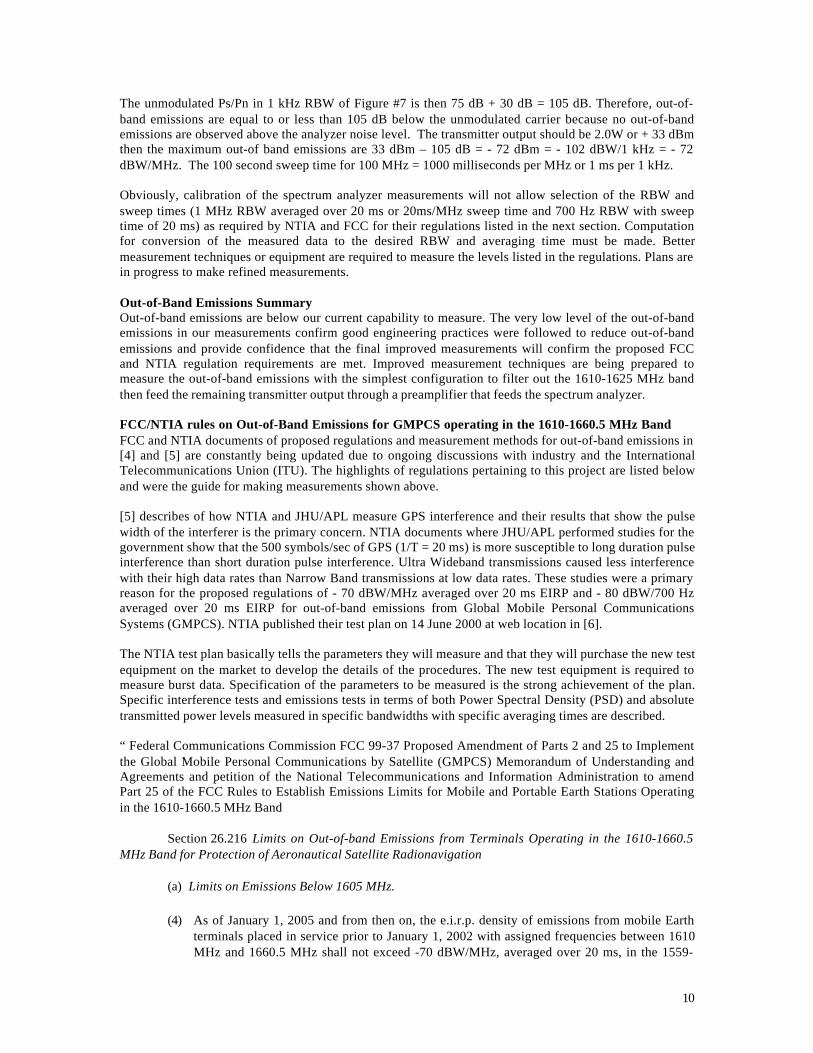
Figures #4 through #7 show the transmit signal measured at the aircraft antenna transmit connector. A 35foot cable between the Flight Modem chassis and the antenna base plate, another 35 foot cable between the20 dB directional coupler at the antenna and the fixed attenuation of the 20 dB directional coupler at thespectrum analyzer prevented overdrive of the analyzer input. A low noise preamplifier was inserted in frontof the spectrum analyzer to reduce the spectrum analyzer noise contribution. A variable attenuator wasplaced in front of the preamplifier to prevent saturation of the amplifier by the Globalstar transmitter signal.This variable attenuator was adjusted for maximum signal to noise ratio with at least 10 dB differencebetween transmitter out-of-band noise level and spectrum analyzer noise level with no analyzer input.
The spectrum analyzer span was selected to display both the 1159-1605 MHz Radio Navigation band andthe Globalstar 1610-1615 MHz band. Spectrum plots at resolution bandwidths of 1 kHz, 3.0 kHz, 10 kHzand 1.0 MHz were made in single sweep clear/write trace mode then again in Max Hold trace mode to lookfor spurious signals. Only the Max Hold mode pictures are provided in this paper. The spectrum analyzerdisplayed “uncalibrated” when the resolution bandwidth was set to 1 kHz but no out-of-band spurioussignals were observed at this setting. The expected differences in signal levels for the five RBW in Figures#4 through #7 are in close agreement with theory (e.g., 10log(1 MHz/10 kHz) = 20 dB).
The signal to noise ratio (Ps/Pn) when the carrier level is measured identifies the suppression of out-of-band emissions to this minimum level. Table 1 is a summary of peak power readings from Figures #4through #7. A difficulty in comparing one figure to another is due to the small changes in power level ofthe UT as it is controlled by the gateway. Another difficulty is operation of the spectrum analyzer near itsmaximum input level before gain compression in order to obtain maximum measurement range of signal tonoise ratio. On the other hand, each figure can stand alone as a valid measurement of transmitted signal tonoise at that time. And, the transmitted peak level is also available on the plot.
Table 1 – Peak Power to Peak Noise Levels from the Globalstar TransmitterFigure Number Resolution Band Width Peak Signal Power Peak Noise Power Ps/Pn
#4 1 MHz - 6 dBm - 67 dBm 61 dB#5 10 kHz - 20 dBm - 90 dBm 70 dB#6 3 kHz - 24 dBm - 96 dBm 72 dB#7 1 kHz uncal - 25 dBm - 100 dBm 75 dB
One of the most interesting features of the table is the peak power level increase as Resolution Bandwidth(RBW) is increased. As RBW is increased more of the signal power is contained in the RBW whichapproaches the average power level then equals the average power level when all the sidebands arecontained in the RBW (i.e., when the RBW is equal to or greater than 1.23 MHz). For the 1 MHz RBW thepeak and average power should be very nearly the same.
Average power in Figure #4 should equal the unmodulated carrier power level that is close to – 6 dBm.This level, as estimated in Figure #2, is roughly confirmed by an 2.0W (or +33 dBm) maximumtransmitted power minus 3.7 dB cable loss to the antenna base plate minus 20 dB directional coupler lossminus 3.7 dB cable loss to the directional coupler at the spectrum analyzer minus 2 dB miscellaneousconnector and short cable losses equals -1.6 dBm. The difference between –1.6 dBm and the peakmeasured power of – 6 dBm in 1 MHz RBW could be the gateway power level control.
8
Figure #4: Globalstar Out of Band Emissions
Figure #5 - Globalstar Out-of-band Emissions
9
The unmodulated Ps/Pn in 10 kHz RBW of Figure #5 is then 70 dB + 20 dB = 90 dB. Therefore, out-of-band emissions are equal to or less than 90 dB below the unmodulated carrier because no out-of-bandemissions are observed above the analyzer noise level. The transmitter output should be 2.0W or + 33 dBmthen the maximum out-of band emissions are 33 dBm – 90 dB = -57 dBm = - 87 dBW/10 kHz = - 67dBW/MHz. The 2.0 second sweep time for 80 MHz = 25 milliseconds per MHz or 0.3 ms per 10 kHz.
Figure #6 - Globalstar Out-of-band Emissions
The unmodulated Ps/Pn in 3 kHz RBW of Figure #6 is then 72 dB + 25.2 dB = 97.2 dB. Therefore, out-of-band emissions are equal to or less than 97.2 dB below the unmodulated carrier because no out-of-bandemissions are observed above the analyzer noise level. The transmitter output should be 2.0W or + 33 dBmthen the maximum out-of band emissions are 33 dBm – 97.2 dB = -64.2 dBm = - 94.2 dBW/3 kHz = - 69dBW/MHz. The 23.0 second sweep time for 80 MHz = 287.5 milliseconds per MHz or 0.9 ms per 3 kHz.
Figure #7 - Globalstar Out-of-band Emissions
10
The unmodulated Ps/Pn in 1 kHz RBW of Figure #7 is then 75 dB + 30 dB = 105 dB. Therefore, out-of-band emissions are equal to or less than 105 dB below the unmodulated carrier because no out-of-bandemissions are observed above the analyzer noise level. The transmitter output should be 2.0W or + 33 dBmthen the maximum out-of band emissions are 33 dBm – 105 dB = - 72 dBm = - 102 dBW/1 kHz = - 72dBW/MHz. The 100 second sweep time for 100 MHz = 1000 milliseconds per MHz or 1 ms per 1 kHz.
Obviously, calibration of the spectrum analyzer measurements will not allow selection of the RBW andsweep times (1 MHz RBW averaged over 20 ms or 20ms/MHz sweep time and 700 Hz RBW with sweeptime of 20 ms) as required by NTIA and FCC for their regulations listed in the next section. Computationfor conversion of the measured data to the desired RBW and averaging time must be made. Bettermeasurement techniques or equipment are required to measure the levels listed in the regulations. Plans arein progress to make refined measurements.
Out-of-Band Emissions SummaryOut-of-band emissions are below our current capability to measure. The very low level of the out-of-bandemissions in our measurements confirm good engineering practices were followed to reduce out-of-bandemissions and provide confidence that the final improved measurements will confirm the proposed FCCand NTIA regulation requirements are met. Improved measurement techniques are being prepared tomeasure the out-of-band emissions with the simplest configuration to filter out the 1610-1625 MHz bandthen feed the remaining transmitter output through a preamplifier that feeds the spectrum analyzer.
FCC/NTIA rules on Out-of-Band Emissions for GMPCS operating in the 1610-1660.5 MHz BandFCC and NTIA documents of proposed regulations and measurement methods for out-of-band emissions in[4] and [5] are constantly being updated due to ongoing discussions with industry and the InternationalTelecommunications Union (ITU). The highlights of regulations pertaining to this project are listed belowand were the guide for making measurements shown above.
[5] describes of how NTIA and JHU/APL measure GPS interference and their results that show the pulsewidth of the interferer is the primary concern. NTIA documents where JHU/APL performed studies for thegovernment show that the 500 symbols/sec of GPS (1/T = 20 ms) is more susceptible to long duration pulseinterference than short duration pulse interference. Ultra Wideband transmissions caused less interferencewith their high data rates than Narrow Band transmissions at low data rates. These studies were a primaryreason for the proposed regulations of - 70 dBW/MHz averaged over 20 ms EIRP and - 80 dBW/700 Hzaveraged over 20 ms EIRP for out-of-band emissions from Global Mobile Personal CommunicationsSystems (GMPCS). NTIA published their test plan on 14 June 2000 at web location in [6].
The NTIA test plan basically tells the parameters they will measure and that they will purchase the new testequipment on the market to develop the details of the procedures. The new test equipment is required tomeasure burst data. Specification of the parameters to be measured is the strong achievement of the plan.Specific interference tests and emissions tests in terms of both Power Spectral Density (PSD) and absolutetransmitted power levels measured in specific bandwidths with specific averaging times are described.
“ Federal Communications Commission FCC 99-37 Proposed Amendment of Parts 2 and 25 to Implementthe Global Mobile Personal Communications by Satellite (GMPCS) Memorandum of Understanding andAgreements and petition of the National Telecommunications and Information Administration to amendPart 25 of the FCC Rules to Establish Emissions Limits for Mobile and Portable Earth Stations Operatingin the 1610-1660.5 MHz Band
Section 26.216 Limits on Out-of-band Emissions from Terminals Operating in the 1610-1660.5MHz Band for Protection of Aeronautical Satellite Radionavigation
(a) Limits on Emissions Below 1605 MHz.
(4) As of January 1, 2005 and from then on, the e.i.r.p. density of emissions from mobile Earthterminals placed in service prior to January 1, 2002 with assigned frequencies between 1610MHz and 1660.5 MHz shall not exceed -70 dBW/MHz, averaged over 20 ms, in the 1559-
11
1605 MHz band, and the e.i.r.p. of spurious emissions of less than 700 Hz bandwidth fromsuch terminals shall not exceed -80 dBW, averaged over 20 ms, in that band. ”
Comparisons of measurements, rules and measurement parametersMeasurement configuration improvements are required to verify the very low levels of – 80 dBW/MHz in a20 ms average time and – 70 dBW/700 Hz in a 20 ms average time. The next method of measurement is tofeed the transmitter into a 1610-1625 MHz band reject filter to reduce the carrier level without reduction ofthe out-of-band emissions. Without this rejection filter the spectrum analyzer must measure from + 33 dBmdown to –80 dBW/700 Hz = -50 dBm/700 Hz for a measurement range of + 33 dBm – (-50 dBm/700 Hz) =83 dB. A 1610-1625 MHz rejection filter of at least 60 dB rejection is being procured.
Phase II: Aircraft Flight Tests
Phase II discusses the NRAO RF protection zones and the concern for frequency interference when flyingaircraft that use the Flight Modem transmit frequencies close to NRAO bands. The Tyndall AFB E-9A isintroduced as the first aircraft platform, and a discussion on aircraft antenna locations follows. Issues andresolutions experienced during data flows through the Flight Modem at the Tyndall AFB are then detailed.Results of the E-9A Sea Surveillance Radar (SSR) data integration with the flight modem are addressed,and future plans for aircraft platform testing at high altitudes and UAV applications follow.
NRAO Protection ZonesAn important step in planning aircraft flight tests is verification of the NRAO protection zones. At TyndallAFB, the aircraft maximum altitude is 25000 feet or 7620 meters resulting in d = 358km = 222.4 statutemiles = 195.7 nm. This minimum distance of 358 km from a radio observatory for operation in the 1610.0-1626.5 MHz band on an airborne platform is easily met. For the most north and most west tip of theTyndall AFB flight area over the Gulf of Mexico and a most north and most east tip of the flight area thetwo closest radio observatories in CFR 47 Section 25.213(1) Protection zones are Ft. Davis, Texas andGreen Bank Telescope, West Virginia. The Texas observatory is more than 1463 km (800 nm) from theclosest part of the Tyndall AFB Gulf test area and the West Virginia observatory is 1097 km (600nm) fromthe closest part of the Tyndall AFB Gulf test area. Both observatories are more than three times therequired distance before the observatory operating schedule must be checked for periods of operation.However, coordination soon showed that NRAO prefers to monitor the aircraft operations with their moresensitive sites in New Mexico and Puerto Rico.
The NRAO frequency manager provided the following guidelines on their operations in the 1610-1613MHz band during discussions on NRAO monitoring of our GMPCS transmissions during the aircraftflights: “The Very Long Array (VLA) and Very Long Baseline Array (VLBA) radio receiver front ends arewide open, on the order of 500 MHz to 1GHz, depending on center frequency. After a series of amplifiersand bandpass filters the VLBA can output a total of eight 16 MHz Intermediate Frequencies (IF). A typicalIF bandwidth used is 16 MHz. The minimum selectable bandwidths are on the order of a kHz, dependingon the observation.”
Tyndall AFB E-9A BackgroundThe USAF houses an inventory of only two E-9A aircraft of which both are stationed along the Gulf ofMexico in Panama City, Florida, at the Tyndall AFB. The E-9A is a modified Dehaviland Dash 8instrumented with a telemetry relay subsystem, an ultrahigh frequency (UHF) voice relay subsystem, radarsea surveillance, and a Gulf Range drone control relay data link subsystem. The E-9A contains a flat platephased array antenna equipped with 140 low noise amplifiers (LNAs) for airborne over the Horizon (OTH)communication relays.
The E-9A provides airborne telemetry and command relay communications for over the Horizon (OTH)data and voice communications during weapons evaluation missions. Additionally, the E-9A is capable oflocating an over-water range area clear of boats for missile launches commonly called the shoot box withits sea surveillance radar (SSR) system in support of missile launch evaluations. These capabilities producean ideal aircraft platform to test the concepts of OTH packetized IP data communications for the flightmodem project.
12
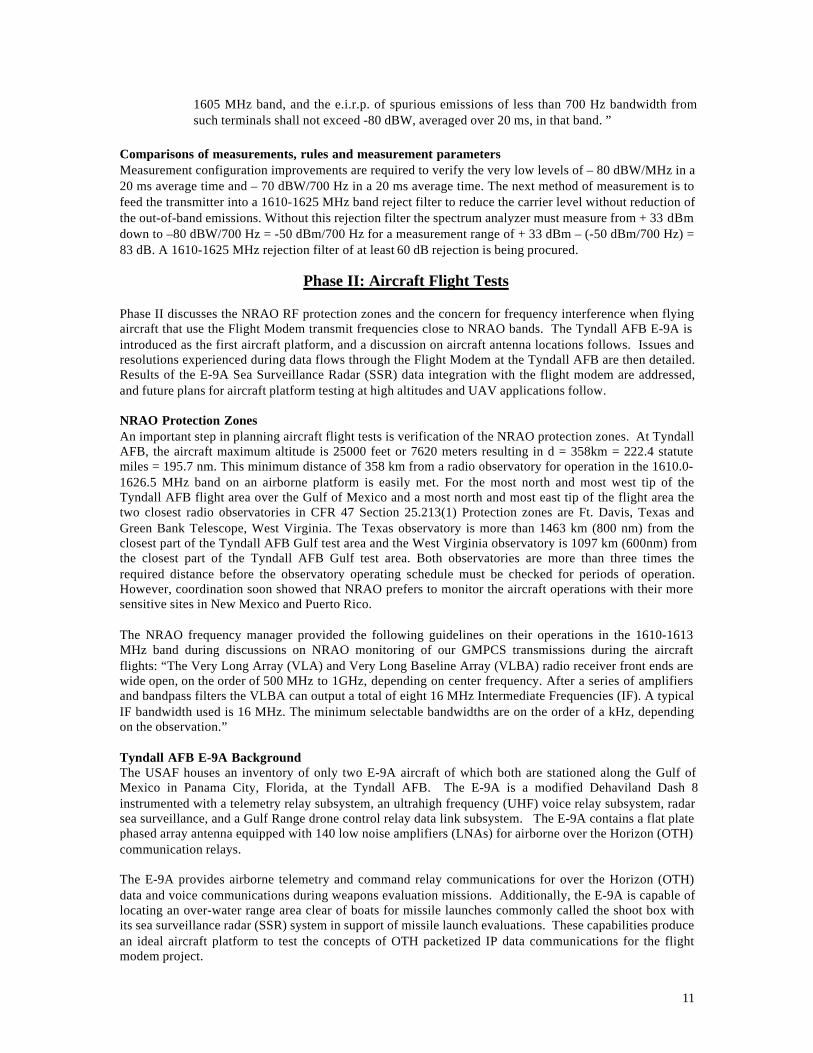
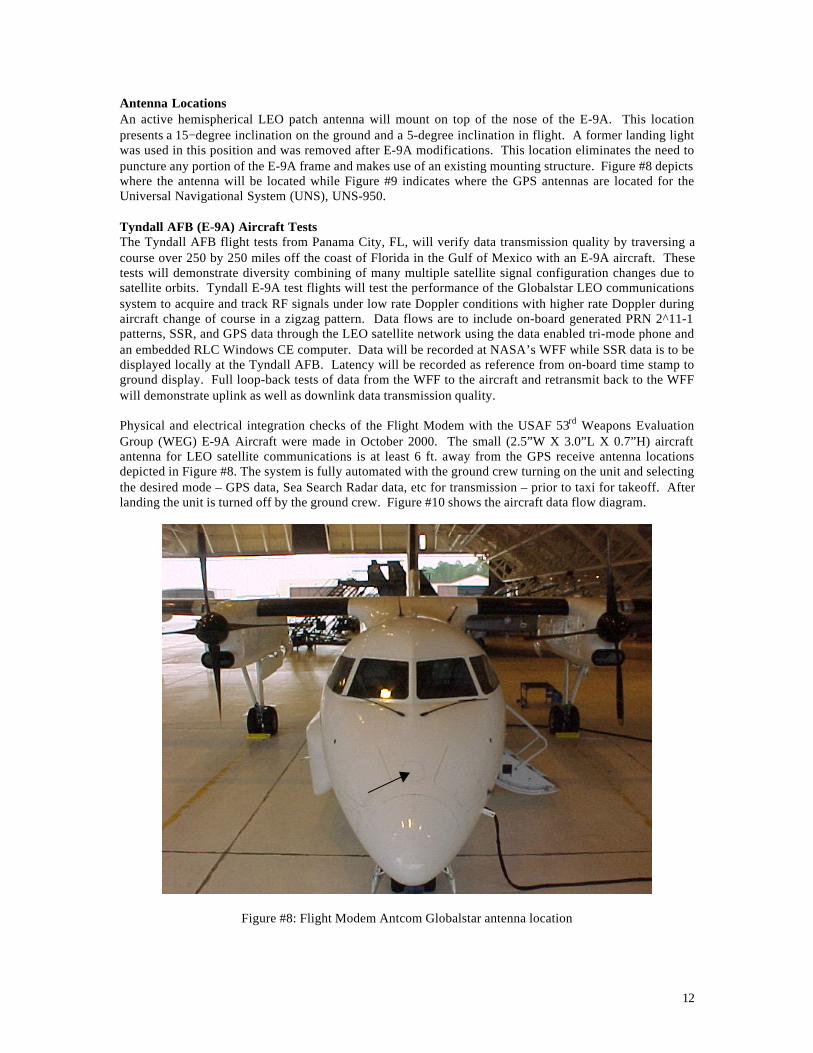
Antenna LocationsAn active hemispherical LEO patch antenna will mount on top of the nose of the E-9A. This locationpresents a 15−degree inclination on the ground and a 5-degree inclination in flight. A former landing lightwas used in this position and was removed after E-9A modifications. This location eliminates the need topuncture any portion of the E-9A frame and makes use of an existing mounting structure. Figure #8 depictswhere the antenna will be located while Figure #9 indicates where the GPS antennas are located for theUniversal Navigational System (UNS), UNS-950.
Tyndall AFB (E-9A) Aircraft TestsThe Tyndall AFB flight tests from Panama City, FL, will verify data transmission quality by traversing acourse over 250 by 250 miles off the coast of Florida in the Gulf of Mexico with an E-9A aircraft. Thesetests will demonstrate diversity combining of many multiple satellite signal configuration changes due tosatellite orbits. Tyndall E-9A test flights will test the performance of the Globalstar LEO communicationssystem to acquire and track RF signals under low rate Doppler conditions with higher rate Doppler duringaircraft change of course in a zigzag pattern. Data flows are to include on-board generated PRN 2^11-1patterns, SSR, and GPS data through the LEO satellite network using the data enabled tri-mode phone andan embedded RLC Windows CE computer. Data will be recorded at NASA’s WFF while SSR data is to bedisplayed locally at the Tyndall AFB. Latency will be recorded as reference from on-board time stamp toground display. Full loop-back tests of data from the WFF to the aircraft and retransmit back to the WFFwill demonstrate uplink as well as downlink data transmission quality.
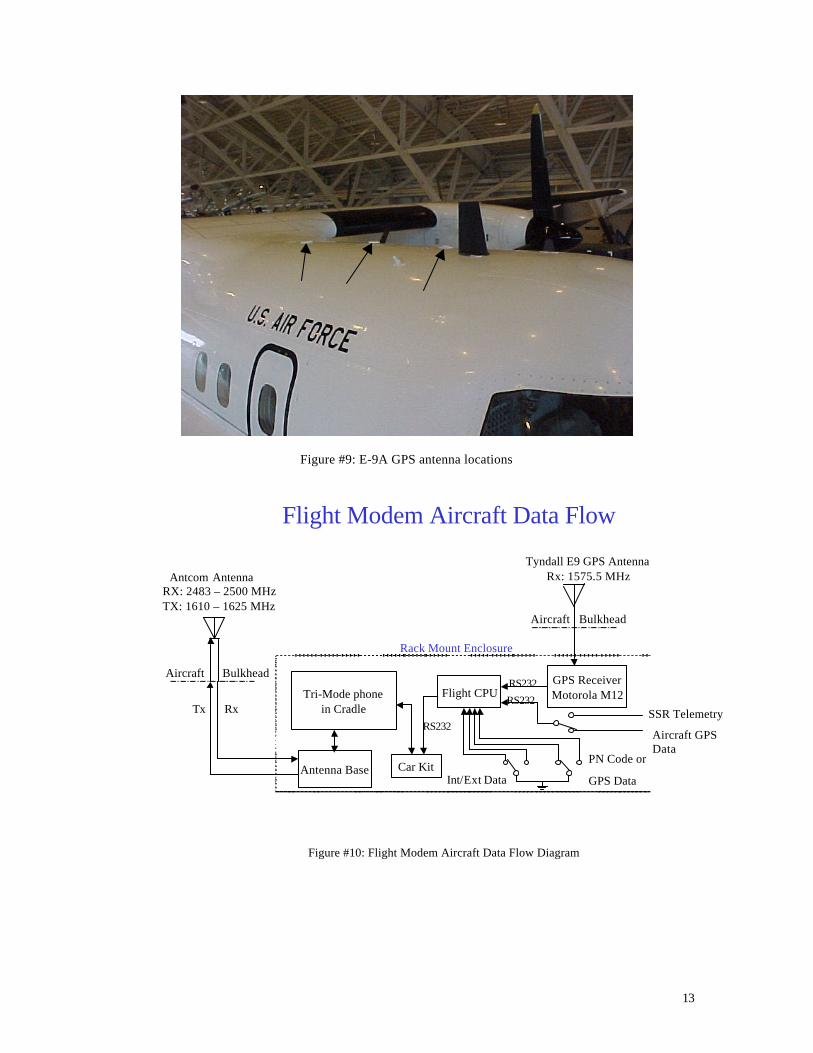
Physical and electrical integration checks of the Flight Modem with the USAF 53rd Weapons EvaluationGroup (WEG) E-9A Aircraft were made in October 2000. The small (2.5”W X 3.0”L X 0.7”H) aircraftantenna for LEO satellite communications is at least 6 ft. away from the GPS receive antenna locationsdepicted in Figure #8. The system is fully automated with the ground crew turning on the unit and selectingthe desired mode – GPS data, Sea Search Radar data, etc for transmission – prior to taxi for takeoff. Afterlanding the unit is turned off by the ground crew. Figure #10 shows the aircraft data flow diagram.
Figure #8: Flight Modem Antcom Globalstar antenna location
13
Figure #9: E-9A GPS antenna locations
Flight Modem Aircraft Data Flow
GPS ReceiverMotorola M12
Tyndall E9 GPS Antenna Rx: 1575.5 MHz
Tri-Mode phonein Cradle
Antenna Base
Aircraft Bulkhead
Flight CPU
Antcom AntennaRX: 2483 – 2500 MHzTX: 1610 – 1625 MHz
RS232Rx
Car Kit
RS232
Rack Mount Enclosure
Aircraft Bulkhead
Tx SSR Telemetry
RS232
Aircraft GPSData
Int/Ext Data
PN Code or
GPS Data
Figure #10: Flight Modem Aircraft Data Flow Diagram
14
PRN Data flow from Tyndall AFB to WFF PTPA laptop computer was used to generate a pseudorandom (PRN) 2^11-1 pattern into the QualcommGSP1600 tri-mode phone. Data was then transmitted in IP packetized format via the Globalstar satellitenetwork to a NASA/GSFC/WFF programmable telemetry processor (PTP) from the Tyndall AFB.
PRN Data flow local to the Tyndall AFBAn attempt was made to data stream PRN 2^11-1 data from a laptop through the flight modem and to alocal Tyndall AFB PC. Tyndall AFB PCs use a dynamically assigned IP address for all incoming IP data.Data enters Tyndall AFB through a proxy server then translated and distributed to local PCs on base.Globalstar requires static IP destinations rather than randomly assigned IP addresses. We were able tosecure a 3-day static IP address, but the proxy translation and firewalls prevented any coherent datastreaming to a local Tyndall AFB PC. King Aerospace is contracted to maintain E-9A operations, and isworking with the Communications Squadron to establish a secure open port for the flight project.
E-9A SSR data interfacing to the Flight ModemA cable was strung from the RS422 outputs of the Sea Surveillance Radar (SSR) system to an RS422 toRS232 converter box. The RS232 output was then connected to the flight modem laptop for testing. Datawas streaming into the flight modem laptop at 110 baud and bursted once a minute. A HyperTerminal onthe laptop confirmed clean receipt of all data. King Aerospace gave us a sample file to develop software toformat the SSR data into IP packets.
Future Aircraft Test PlansTyndall AFB flights will be conducted February – June 2001. Data collected and recorded will be used tomeasure the Globalstar data quality link with BER data flow and frame drop out measurements. TheDryden Flight Research Center (DFRC) ER-2 and DC-8 aircraft will traverse the continental US fromEdwards AFB to the WFF. Planned testing is to include procedures and limitations for gateway handoversduring data flows, latency and BER measurements. The NASA/GSFC/WFF P-3 aircraft will be used toconduct similar tests to the Tyndall AFB E-9A and DFRC aircraft. The WFF P-3 covers a large area offthe east coast of Florida enabling coverage limits to be determined in Spring 2001.
Phase III: Sounding Rocket Test Flight
A piggyback sounding rocket test flight in conjunction with Swedish Space Corporation (SSC) will offerthe opportunity to measure the altitude and Doppler limits of the LEO satellite constellationcommunications. The rocket altitude of 100 km exceeds the satellite constellation designed support altitudefor commercial airlines. Loss and return of connection is possible as the payload parachutes back to earth.The rocket trajectory will cause Doppler frequency changes exceeding the 3 kHz differential Dopplercapability of the satellite communications system for acquisition and tracking during portions of the flight.The capability to track differential Doppler frequencies less than 3 kHz will also be demonstrated. Theenvironmental conditions for temperature, vibration, shock and acceleration are met by the ruggedconstruction and mounting of the equipment. Preflight environmental tests will confirm readiness then theflight will confirm the performance.
LimitationsThere are numerous European gateways in operation for voice only. Data equipment is being added to thesegateways as quickly as negotiations with local telephone companies can be completed on customer datarate charges. Data rate charges were agreed in December 2000 for the U.S. and these rates may offer amodel for the European negotiations. The In-Flight Network (IFN) through our current LEO satelliteconstellation service provider is scheduled to begin commercial airline operations in Europe on April 1,2001 (shortly after our launch). There are three gateways particularly well suited for the sounding rocketlaunch support near Kiruna, Sweden – near (1) Karkilla, Finland, (2) Paris, France, and (3) Moscow,Russia. These sites will not be available for IP data enabled packet trails for our first sounding rocketlaunch opportunity.
15
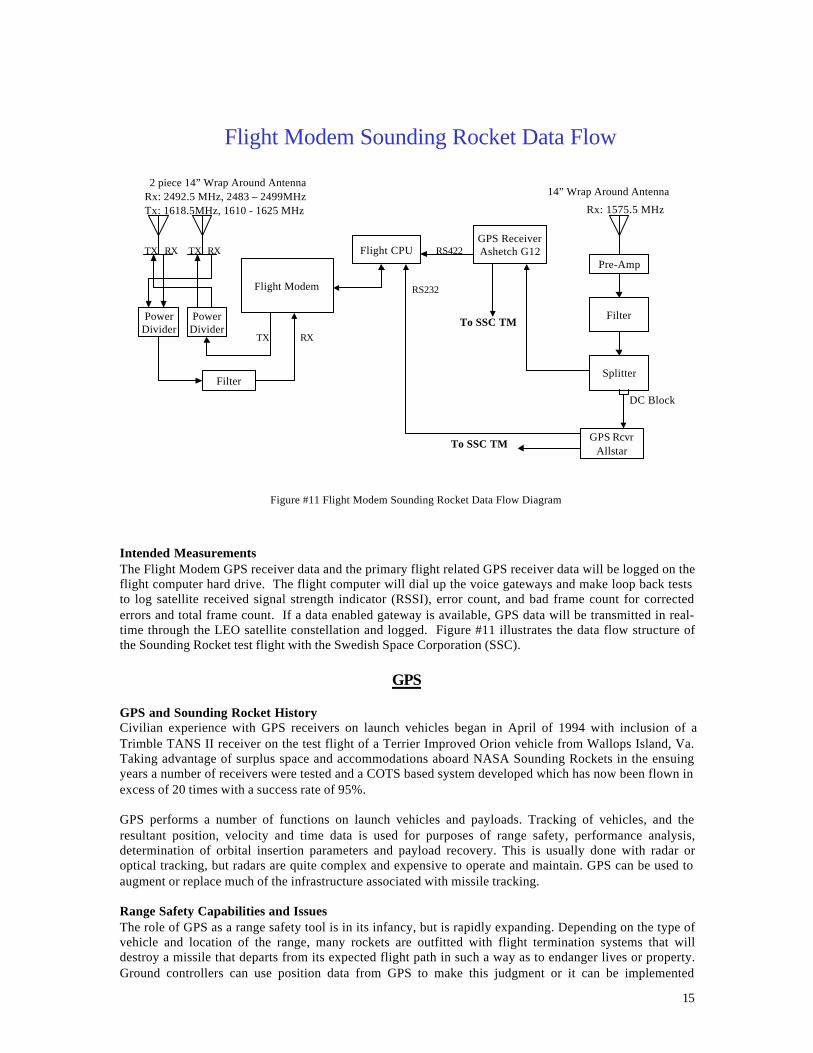
Flight Modem Sounding Rocket Data Flow
GPS ReceiverAshetch G12
Pre-Amp
14” Wrap Around Antenna
Rx: 1575.5 MHz
Flight Modem
Rx: 2492.5 MHz, 2483 – 2499MHzTx: 1618.5MHz, 1610 - 1625 MHz
Flight CPU
2 piece 14” Wrap Around Antenna
RS422
PowerDivider
GPS RcvrAllstar
DC Block
To SSC TM
RS232
Filter
TX RX
PowerDivider
TX RX
TX RX
Splitter
To SSC TMFilter
Figure #11 Flight Modem Sounding Rocket Data Flow Diagram
Intended MeasurementsThe Flight Modem GPS receiver data and the primary flight related GPS receiver data will be logged on theflight computer hard drive. The flight computer will dial up the voice gateways and make loop back teststo log satellite received signal strength indicator (RSSI), error count, and bad frame count for correctederrors and total frame count. If a data enabled gateway is available, GPS data will be transmitted in real-time through the LEO satellite constellation and logged. Figure #11 illustrates the data flow structure ofthe Sounding Rocket test flight with the Swedish Space Corporation (SSC).
GPS
GPS and Sounding Rocket HistoryCivilian experience with GPS receivers on launch vehicles began in April of 1994 with inclusion of aTrimble TANS II receiver on the test flight of a Terrier Improved Orion vehicle from Wallops Island, Va.Taking advantage of surplus space and accommodations aboard NASA Sounding Rockets in the ensuingyears a number of receivers were tested and a COTS based system developed which has now been flown inexcess of 20 times with a success rate of 95%.
GPS performs a number of functions on launch vehicles and payloads. Tracking of vehicles, and theresultant position, velocity and time data is used for purposes of range safety, performance analysis,determination of orbital insertion parameters and payload recovery. This is usually done with radar oroptical tracking, but radars are quite complex and expensive to operate and maintain. GPS can be used toaugment or replace much of the infrastructure associated with missile tracking.
Range Safety Capabilities and IssuesThe role of GPS as a range safety tool is in its infancy, but is rapidly expanding. Depending on the type ofvehicle and location of the range, many rockets are outfitted with flight termination systems that willdestroy a missile that departs from its expected flight path in such a way as to endanger lives or property.Ground controllers can use position data from GPS to make this judgment or it can be implemented
16
autonomously. Even if a vehicle has no flight termination system, it is the responsibility of the range toknow its location at all times and to be able to predict the point of impact. The Eastern and Western TestRanges will cease radar tracking within two years. The Range Commanders Council Safety Committee iscurrently defining requirements for qualification of GPS receivers to provide tracking data for flighttermination systems.
Even when traditional methods such as radars, telemetry antennas, telescopes, and cameras are used totrack rockets, they sometimes cannot be pointed to track continuously from the launch pad and occasionallythey lose track. For this reason, there must exist a means of directing them to a determined location inspace. These devices are networked to accept and output data, either from computer predictions or anothertracking device. GPS data received in real time from the vehicle in flight can now be a source of thisslaving data.
GPS AccuracyGPS is capable of simultaneously tracking multiple vehicles or payloads much more accurately andefficiently than traditional methods such as radar. GPS can also be used to very precisely time tag datasamples allowing them to be correlated with other data or used for interferometric measurements.
Precise position, velocity and time (PVT) are often necessary for evaluating the scientific data. Extremelyaccurate time from GPS can be used to time stamp the housekeeping and science data. It has beendemonstrated that the precision of data time tagging can be increased a thousand-fold over the commonmethod of tagging the data on the ground as received. [7] The time of payload events such as a shutteropening, boom deployment or the saturation of a sensor can be similarly established. Similarly, eventssuch as deployments, course changes and flight termination can be triggered by the PVT data.
GPS System ArchitectureNew Mexico State University Physical Science Laboratory (NMSU/PSL) designed the antenna to WFFspecifications. It consists of eight right hand circularly polarized radiating elements fabricated on two 1/8”thick by 5.5” width half rings which are joined together and flush mounted in a groove milled into the skinof the rocket’s payload section. The two sub-arrays are fed in-phase with a coaxial power divider harness.A radome is incorporated into each subarray to protect against heat. The pattern is fairly circular with -8dBic at 90% full coverage. Due to the elements being fed in-phase, a null of 3 to 5 dB at the 3dB downlevel exists along the axis of the rocket. The VSWR is approximately 2 with a bandwidth of about 10 MHz.
The combined signal from the antenna is routed to a Trimble preamplifier that provides 42dB of gain.Power for the preamplifier is provided via the coaxial cable. The frequency range is 1565 to 1585 MH withexcellent rejection of out of band signals.
The receiver consists of two printed circuit boards. One board is the Ashtech G12 HDMA GPS enginemanufactured by the Magellan Corporation and the other, designed and built at WFF, provides powerconditioning, communications format conversion, and analog to digital conversion. Both the boards areintegrated into a 3” x 5” x 1” aluminum box with a single 25 pin D connector and an SMA RF connector.Even filled with a plastic potting solution to stabilize the boards against vibrations, the receiver weighs onlya few ounces.
The G12 HDMA is a 12 channel L1 C/A code receiver which features wide tracking loops to accommodatethe high Doppler rate involved in missile launches, low data latency, rapid acquisition of lock and iscapable of outputting at up to a 10 Hz update rate. A highly stable and accurate 1 PPS signal is available fortime tagging and synchronization of other payload data. Data is output as a serial RS422 stream.Parameters such as signal level and elevation masks, tracking loop bandwidths and satellite exclusion areselectable and a variety of data formats are available. In addition to position, velocity and time,pseudorange data and carrier phase information is included and may be used on the ground to calculate ahighly accurate differential solution. An onboard memory saves almanac data and operating parameters inorder to avoid programming in the field.
17
A waiver is granted to NASA as U.S. Government agency to allow operation of the receiver above the1000kt, 60,000 ft altitude limit imposed by the International Trade in Arms Reduction (ITAR) actrestrictions.
Real time differential tracking with the system is accurate to less than 10m real time with post missionprocessing better than 1m. Velocity accuracy is better than 1 m/s real time and up to 10 cm/s postprocessed. Precision of actual post processed flight data has been shown to be 4 cm [8].
Challenges
Antenna DevelopmentThe antenna for attitude controlled satellites is zenith oriented with roughly hemispherical coverage with 0dBi gain. However, it is typically optimized for lower gain (-3 dBi) at zenith and higher gain at the horizon(0 dBi). A satellite that is not attitude controlled requires an omni directional antenna. The antennarequirements can be stated as + 27 dBm EIRP is required for transmit and a minimum – 20 dB G/T forreceive. The transmitter in-band power is limited by regulations to 2 Watts EIRP and LEO satelliteconstellation providers require control of the transmitter power and require that you use their modem thatcontains the transmitter and transmitter power control. Environmental testing of the commercial units forqualification for flight appears to be the most cost effective solution and is the one chosen by WFF.
No development is required for aircraft, UAV or balloon applications because these antennas are availablefrom several aircraft antenna manufacturers. Sounding rocket wraparound antennas were developed forWFF by PSL and can also be designed and provided by WFF personnel. Commercial GPS, telemetrysatcom, and many other wraparound antennas are also available. The wraparound design is very similar toGPS wraparound antennas for transmit and to telemetry S-band antennas for receive.
Doppler Rates and EnvironmentalThe satellites are primarily repeaters with the Doppler acquisition and tracking requirements met by thedemodulation equipment at the gateways. The design goal was to operate with differential Doppler rates upto 3 kHz. Tests are scheduled at WFF using a dual local oscillator (L.O.) frequency translator with oneL.O. as a sweep generator. This dual L.O. translator will allow us to measure the differential Dopplercapability of the communication system before the first test flight. The test program has proven excellentfor UT operation.
Small Satellite Application
The Flight Modem offers many significant cost advantages including reduced spacecraft communicationsequipment, and on-board recording. The size and power of the telemetry transmitter, command receiver,and high performance transmit antenna are reduced to a 7.5”Lx3.5”Wx1”H modem card and ahemispherical or omni antenna. Operations costs are reduced to a $0.99/per minute rate as compared to theaverage $300/satellite pass for recovering S-band data from LEO spacecrafts. Scheduling does not requireconflict resolution inherent to ground station capability to track a single spacecraft. Securing a dial-upconnection through the Globalstar network is enough to begin data flows. Down range trackers (i.e. radarsand telemetry antennas) are no longer required since IP communications are widely available. Complexityis reduced to a personal computer and an Internet connection. Link margin is not an issue since the datarate limit and coverage of the Globalstar LEO satellite constellation has been defined thus reducing TT&Cmission planning. However, there are limitations to the flight modem operations that must be considered.
Proposed scheduling requirements are to establish an IP connection through the LEO constellation every 2minutes or other selected interval since communications availability will be much higher than with groundstations. Use of store and forward commands and playback recorded downlink data has eliminated theneed for all but a few ground stations. For time critical or real-time communications the 2-line orbitalelement sets for the LEO satellites are available at http://celestrak.com/NORAD/elements/ with service intransition in December 2000 to ftp.celestrak.com for free ephemeris downloads to determine exact times ofcommunications availability.
18
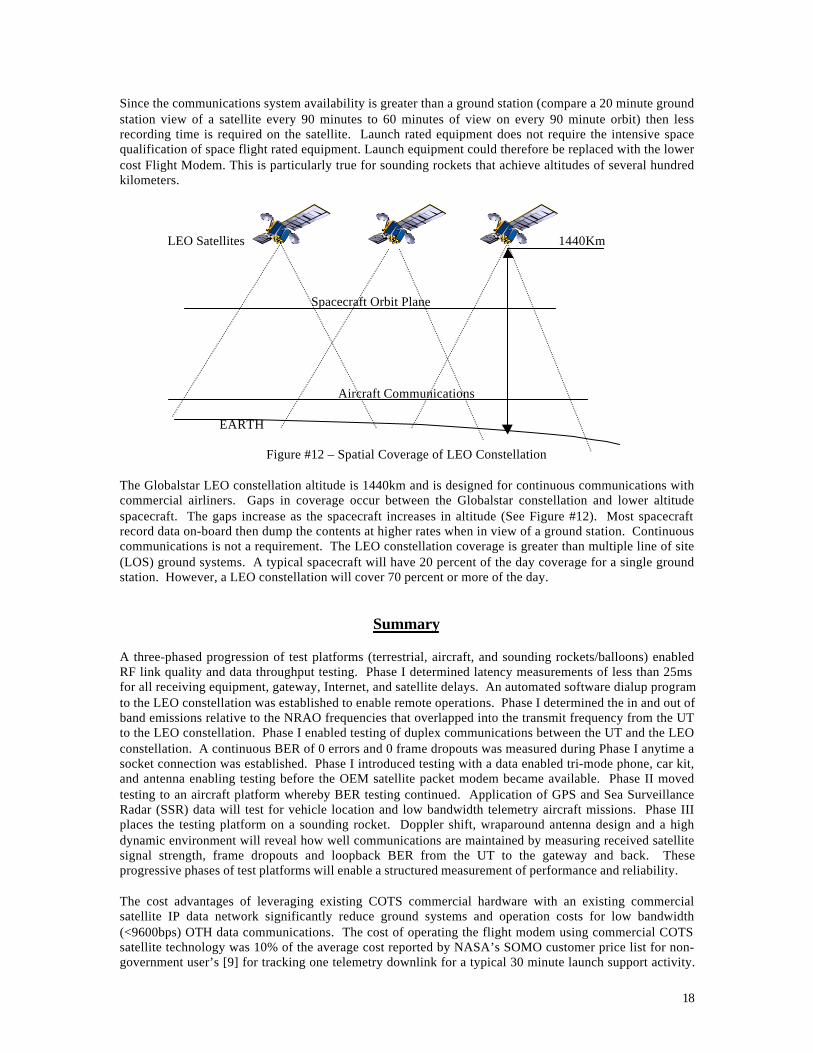
Since the communications system availability is greater than a ground station (compare a 20 minute groundstation view of a satellite every 90 minutes to 60 minutes of view on every 90 minute orbit) then lessrecording time is required on the satellite. Launch rated equipment does not require the intensive spacequalification of space flight rated equipment. Launch equipment could therefore be replaced with the lowercost Flight Modem. This is particularly true for sounding rockets that achieve altitudes of several hundredkilometers.
LEO Satellites 1440Km
Spacecraft Orbit Plane
Aircraft Communications
EARTH
Figure #12 – Spatial Coverage of LEO Constellation
The Globalstar LEO constellation altitude is 1440km and is designed for continuous communications withcommercial airliners. Gaps in coverage occur between the Globalstar constellation and lower altitudespacecraft. The gaps increase as the spacecraft increases in altitude (See Figure #12). Most spacecraftrecord data on-board then dump the contents at higher rates when in view of a ground station. Continuouscommunications is not a requirement. The LEO constellation coverage is greater than multiple line of site(LOS) ground systems. A typical spacecraft will have 20 percent of the day coverage for a single groundstation. However, a LEO constellation will cover 70 percent or more of the day.
Summary
A three-phased progression of test platforms (terrestrial, aircraft, and sounding rockets/balloons) enabledRF link quality and data throughput testing. Phase I determined latency measurements of less than 25msfor all receiving equipment, gateway, Internet, and satellite delays. An automated software dialup programto the LEO constellation was established to enable remote operations. Phase I determined the in and out ofband emissions relative to the NRAO frequencies that overlapped into the transmit frequency from the UTto the LEO constellation. Phase I enabled testing of duplex communications between the UT and the LEOconstellation. A continuous BER of 0 errors and 0 frame dropouts was measured during Phase I anytime asocket connection was established. Phase I introduced testing with a data enabled tri-mode phone, car kit,and antenna enabling testing before the OEM satellite packet modem became available. Phase II movedtesting to an aircraft platform whereby BER testing continued. Application of GPS and Sea SurveillanceRadar (SSR) data will test for vehicle location and low bandwidth telemetry aircraft missions. Phase IIIplaces the testing platform on a sounding rocket. Doppler shift, wraparound antenna design and a highdynamic environment will reveal how well communications are maintained by measuring received satellitesignal strength, frame dropouts and loopback BER from the UT to the gateway and back. Theseprogressive phases of test platforms will enable a structured measurement of performance and reliability.
The cost advantages of leveraging existing COTS commercial hardware with an existing commercialsatellite IP data network significantly reduce ground systems and operation costs for low bandwidth(<9600bps) OTH data communications. The cost of operating the flight modem using commercial COTSsatellite technology was 10% of the average cost reported by NASA’s SOMO customer price list for non-government user’s [9] for tracking one telemetry downlink for a typical 30 minute launch support activity.
19
A cost savings of 90% is realized for operations. The cost of operations is an on demand service wherebycosts are only initiated once an IP connection is made. The user does not incur costs for down rangeantenna shipping, equipment materials or schedule conflicts. The Satellite Packet Data Modem is one ofthe first OEM IP COTS data products that enable duplex OTH data communications for an existingcommercial LEO constellation.
Acknowledgements
Mr. Thomas J. Pittman from NASA/GSFC/WFF Code 584 provided much of the vision for this project andcampaigned to secure funds through the ARTI development effort. The Flight Modem today is a productof his vision for bridging IP satellite technology of today with commercial and governmental partnershipsof tomorrow. Mr. Richard Chapman from the Tyndall AFB 53rd Weapons Evaluation Group (WEG)provided the opportunity for aircraft flights using the E-9A. Mr. Randy Albertson from the AirborneScience Directorate office located at Dryden Flight Research Center has provided an opportunity to test thesatellite packet modem on board an ER-2 from Dryden Flight Research Center to the Wallops FlightFacility. Many thanks to our team for the long hours and continued commitment to advance over thehorizon communications (OTH) to the next generation of Internet protocol (IP) satellite communications.
20
References
1. United States Government Printing Office, Code of Federal Regulations Title 47 Telecommunications, “http://frwebgate.access.gpo.gov/cgi-bin/get- fr.cgi?TITLE=47&PART=25&SECTION=213&YEAR=2000&TYPE=TEXT”
2. Hirshfield, E., “The Globalstar System,” Applied Microwave and Wireless magazine, summer 1995
3. Hirshfield, E., et al, "GLOBALSTAR'S PERFORMANCE" Space Technology, Vol 19, No 1, pp 5-38, 1999
4. United States Federal Communications Commission Document 99-037,“http://www.fcc.gov/Bureaus/International/Notices/1999/fcc99037.txt”
5. United States National Telecommunications Information Agency Document,“http://www.ntia.doc.gov/ntiahome/fccfilings/nprm9165_62399.htm#VIII”
6. United States National Telecommunications Information Agency Document,”http://www.ntia.doc.gov/osmhome/uwbtestplan/testplan_final_pcr2.htm”
7. Powell, S.P., and Kintner, P. M., "Using GPS for Telemetry System Clock Generation andSynchronization On-Board Sounding Rockets", ION GPS-96, Kansas City, Missouri, U.S.A.,September 1997.
8. H. Martell and B. Bull, "Tracking the Relative Motion of Four Space Payloads Launched from a Sub-Orbital NASA Rocket", Proceedings of the ION GPS-99 Nashville, Tennessee, U.S.A., September1997.
9. NASA Space Operations Management Office (SOMO), FY’01 Customer Price List, pg. 3.
10. Grattan & Brain, Windows CE 3.0 Application Programming, Prentice Hall Inc., New Jersey, 2001.