Telematics: Wheels in motion - finity.com.au · Market Update Recent Launches and market action...
34
© 2015 Finity Consulting Pty Limited Telematics: Wheels in motion Finity Personal Lines Pricing and Portfolio Management Seminar 30 April 2015 Jon Tindall
Transcript of Telematics: Wheels in motion - finity.com.au · Market Update Recent Launches and market action...

© 2015 Finity Consulting Pty Limited
Telematics:
Wheels in motion
Finity Personal Lines Pricing
and Portfolio Management Seminar
30 April 2015
Jon Tindall

Overview
1. Quick Market Update
2. Alternative Customer Propositions
3. Technology, Data & Scoring
4. Using the Data for Pricing & Portfolio
Management
5. Into the Crystal Ball
6. Wrap-up
2

Market Update

Market Update
Recent Launches and market action
AAMI – SafeDriver App
QBE – Launched 2013 – moving to an app strategy
What's been happening overseas?
UK - 2% penetration – mainly in the younger market
EU – Italy estimate to see 5% penetration by end of 2015
- Octo launches Rider 1 – 1st motorcycle telematics
product
India - Liberty Videocon undertaking trial in Mumbai
Japan - MS&AD spent £105m on buying InsureTheBox 4

Market Update
5
More than 50 Insurance brands have entered the
telematics market globally
+ NZ
South Africa
Source: Wunelli 2014

AAMI SafeDriver
Early-mover advantage – owning the
safe-driver ‘angle’
First app-based telematics launch in
Australia
Auto-start functionality
No significant premium discounting at
the moment
using competitions and ‘safety’
as the incentives.
$100k Competition prize –
“Australia’s Best Driver” 6

Feedback
7
“Inaccurate speed limits”
“rigged competition”
“As if I’d trust an insurance
company ….”
“Keeps getting me for speeding when im not!, unreliable”
“They say that now but this is just the start
….”
“Not a good competition
when there are so many bugs”
“….. your app is no good, it's got no idea of the posted speed”

8

Alternative Customer
Propositions

Marketing drive/focus
How do you differentiate your Telematics product /
program?
Safe-driving is a common theme – but what other
options are there?
Requires some ‘thinking outside the box’
Product Design – thinking outside the box
10
Technology options Benefit mechanisms

Product Design – Case Studies
AXA
Individualised driver score and Premiums
Upfront discount + review of premium after
3,6 and 9 months
Premiums can go up or down:
62% receive a decrease (ave. = - £37)
22% have no change
16% get an increase (ave. = + £47)
11
‘Driveology’

Product Design – Case Studies
Discovery
50% of your BP fuel spend every month - max R750 –
approx. AUD$80
Contribute points towards the Excess Funder Account
Paying off excess in the case of an accident
Withdrawn for cash under particular circumstances
12
‘Vitalitydrive’

Points-style Program
Earn points for driving well or other things
that improve the risk
Spend these points on:
Premium discounts
Improved policy terms and conditions
3rd party goods and services e.g. fuel, service and repairs, retail outlets etc
Tie-ins with 3rd parties – Cheaper than the face
value of benefits + enriched data
13
‘Frequent-Flyer’ style reward program
1

Technology, Data and
Scoring

Key Rating Factors*
15
Time of Day
Speeding
Braking
Type of Road
Familiarity
Day of the Week
Location
doesn’t need to be recorded
* Assumes distance as a factor has already been accounted for

Smartphone vs ‘Box’
Which Technology?
16
Key difference is in the data
‘Snippets’ of driving behaviour
Importance of Auto-start and hence Driver
DNA
Smartphone – is this the only viable business
model for Aus & NZ in the short-term?

Which Technology?
17
Hardwire OBD II Tethered Smartphone
Data transmission cost
High High
Low Low
Identify vehicle? Yes Yes Yes No
Identify driver?
No
No
Yes
Yes
Vehicle Score? Yes Yes No No
Driver Score No No Yes Yes
Future proof No No No Yes
Mileage Yes Yes Yes No
Logistics required High
Med Med
Low

Smartphone vs OBDII
18
LexisNexis smartphone GPS test, 2012
OBDII recorded speed
40
30
20
10
0
mph
Overlay of OBDII and smartphone
40
30
20
10
0
mph
Smartphone recorded speed
40
30
20
10
0
mph

Driver DNA
19

Mapping and Ancillary Services
20
Large investment to get
the ‘enrichment’ required – i.e.
accurate speed zones and
road types
Potentially other geospatial
‘enrichment’ of the data – e.g. for
weather or traffic conditions

Using Data in Pricing &
Portfolio Management

Usage based is not enough
Just using distance as an
exposure or risk factor is
not enough
Other things influence
risk:
Road type
Speed limit
22
Road Speed
Limit
Miles
Travelled
% total
miles
Fault claim
rate per
mile
<= 40 mph 75,645,841 42% 11.6
50 - 60 mph 53,317,470 29% 4.8
70 mph 52,624,061 29% 1.0
and likely others as well:
Behaviour – speeding, braking
Time of day, familiarity, weather conditions

Predicting Claims
23
Strong correlation between driving score
and loss ratios ……
…. but little correlation between driving score and
‘risk premium’ based on traditional variables
Source: Wunelli – ‘Think Outside the Box’ 2014

Stabilisation of the Score
24
So the driving score is
predictive, but …
How quickly can the driving score be established?
80% of the variation
reduced after
approximately 600km
Source: Wunelli – ‘Think Outside the Box’ 2014
• Progressive – 6 weeks (42 days)
• TOWER NZ – now 150km (3 trips)
• AAMI – 300km (10 trips)
Translated from average UK driving
distances
0%
5%
10%
15%
20%
25%
30%
35%
0%
5%
10%
15%
20%
25%
30%
35%
1 2 3 4 5 6 7 8 9 10
At
Fau
lt C
laim
Fre
qu
en
cy
Telematics Score Quantile
Actual Traditional Model Prediction
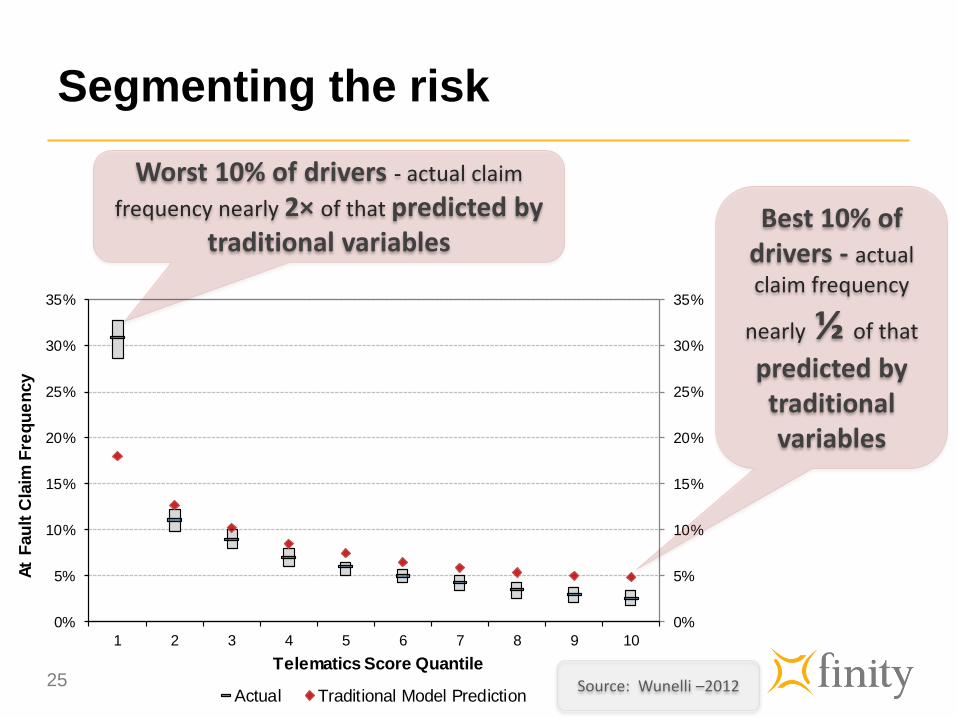
Segmenting the risk
25 Source: Wunelli –2012
Worst 10% of drivers - actual claim
frequency nearly 2× of that predicted by traditional variables
Best 10% of drivers - actual
claim frequency
nearly ½ of that
predicted by traditional variables

Into the Crystal Ball
– 20 years from now

Into the crystal Ball – 10 years from now
27
Will we be creating a class of uninsurable
risks?
How will telematics interplay with the
automation of the motor vehicle and the
connected car?
How and where will the data be
utilised?
What might the Telematics Industry
look lie in 2025?

2025 - The Connected Car
In a decade more than
2/3 of all vehicles on
the road should have inbuilt
telematics capability
28
How will this affect the insurers place in the world?
e.g. Manufactures
How will telematics
devices interact with
other car technologies?
Who is to blame? The
driver or the car?

2025 - The Connected Car
29
Apps loaded onto on-
board computer + tethered with
the smartphone. No more auto-
start or driver DNA
Follow the driver – multiple
cars, car-sharing programs, rental
vehicles
2-way ‘comms’ (upload &
downloadable content)
Integrated information
Marketing opportunities

Wrap-up

Questions for lunch ….
31
Where are things heading in Australia and NZ over the
next 12 months?
What are the predictions for 2015/16
Further launches
Product innovation / evolution
What are the challenges going to be?
The customer proposition
Privacy and security
Handling the ‘big-data’

Questions?
32

Contact
Your Name
Title
Tel: +61 2 8252 3300
Mobile:
www.finity.com.au
Jon Tindall
Senior Consultant
Tel: +61 2 8252 3300
www.finity.com.au

Distribution & Use
This presentation has been prepared for the
Finity Consulting Personal Lines Pricing &
Portfolio Management Seminar, held on 30
April 2015. It is not intended, nor
necessarily suitable, for any other purpose.
Third parties should recognise that the
furnishing of this presentation is not a
substitute for their own due diligence and
should place no reliance on this
presentation or the data contained herein
which would result in the creation of any
duty or liability by Finity to the third party.
Reliances & Limitations
Finity wishes it to be understood that the
information presented at the Seminar is of a
general nature and does not constitute
actuarial advice or investment advice.
While Finity has taken reasonable care in
compiling the information presented, Finity
does not warrant that the information
provided is relevant to a particular reader’s
situation, specific objectives or needs.
Finity does not have any responsibility to
any attendee at the conference or to any
other party arising from the content of this
presentation. Before acting on any
information provided by Finity in this
presentation, readers should consider their
own circumstances and their need for
advice on the subject – Finity would be
pleased to assist.