Telekom austria q12015
47
Vienna, 22 April 2015 Results for the first quarter 2015
-
Upload
company-spotlight -
Category
Investor Relations
-
view
518 -
download
0
Transcript of Telekom austria q12015

Vienna, 22 April 2015
Results for the first quarter 2015

Cautionary statement
'This presentation contains forward-looking statements. These forward-looking statements are usually accompanied by words such as 'believe', 'intend', 'anticipate', 'plan', 'expect' and similar expressions. Actual events may differ materially from those anticipated in these forward-looking statements as a result of a number of factors. Forward-looking statements involve inherent risks and uncertainties. A number of important factors could cause actual results or outcomes to differ materially from those expressed in any forward-looking statement. Neither Telekom Austria Group nor any other person accepts any liability for any such forward-looking statements. Telekom Austria Group will not update these forward-looking statements, whether due to changed factual circumstances, changes in assumptions or expectations. This presentation does not constitute a recommendation or invitation to purchase or sell securities of Telekom Austria Group.'
2Results for the first quarter 2015
Operational and financial highlights for the first quarter 2015
3Results for the first quarter 2015

> Reduced revenue decline of 2.0% driven by better trends in Austria and Bulgaria and
revenue growth in Croatia, 10.0% FX devaluation impacts revenues in Belarus
> EUR 10.9 mn OPEX reduction achieved with Austria and Belarus as key contributors
> Group EBITDA comparable grows 5.8% reported; 2.7% growth clean of one-off effect in
Slovenia and FX effects
> Strong growth in fixed broadband and TV services across the Group: 4.5% fixed access
lines growth
> Austria: Increased competition via new MVNOs, but revenue decline slows further
> 0.8% revenue decline and 6.3% EBITDA comparable growth
> Operational improvements in the Bulgarian residential mobile and fixed line markets
but 4.1% revenue decline due to strong price pressure
Q1 2015: Challenging mobile markets, strong fixed-line trends and BYR devaluation drive revenues
4Results for the first quarter 2015

> 1.6% revenue growth in Croatia offset by higher spectrum fee imposed by government
> Belarus: Financial performance remains on track despite FX devaluation reducing
customer demand
> Additional markets: Continued growth in the Republic of Serbia (excl. effects of
changes of handset accounting) and in the Republic of Macedonia while Slovenia
challenged by pricing trends
> Net income grows by 127.5% to EUR 92.7 mn
> Change in Management Board: COO Alejandro Plater follows CTO Günther Ottendorfer
> Outlook for 2015 unchanged*: Revenue growth of approx. 2%, CAPEX of
EUR 700 – 750 mn, intended dividend of EUR 0.05/share**
Q1 2015: Challenging mobile markets, strong fixed-line trends and BYR devaluation drive revenues
5Results for the first quarter 2015
* This guidance is on a constant currency basis except for Belarus (20% devaluation for FY 2015). CAPEX guidance excludes investments in spectrum and acquisitions.
** Intended proposal for the AGM 2015
Key financial developments in thefirst quarter 2015
6Results for the first quarter 2015

Q1 2015: OPEX savings drive EBITDA comparable trend as revenue decline slows down
7
> Reduced revenue decline of 2.0% driven by better trends in Austria and Bulgaria and revenue growth in Croatia, 10.0% FX devaluation impacts revenues in Belarus (inflation accounting ended as of Q1 2015)
> 5.8% EBITDA comparable growth including EUR 20.0 mn one-off in Slovenia and EUR 10.1 mn FX effect
> 2.7% EBITDA comparable growth excl. Slovenian one-off and FX effects
> EUR 10.9 mn OPEX savings: mainly in Austria due to lower marketing & sales costs, subsidies and intensified cost cutting activities
> Net income grows by 127.5%
Results for the first quarter 2015
(in EUR million) Q1 2015 Q1 2014 % change
Revenues 956.0 975.9 -2.0%
EBITDA comparable* 338.5 319.9 5.8%EBITDA comparable margin* 35.4% 32.8%
Restructuring -3.9 -7.7 n.m.
Impairment 0.0 0.0 n.a.
Depreciation & amortisation -194.9 -214.9 n.m.
Operating income 139.7 97.4 43.5%
Financial result -39.8 -46.4 n.m.
Income before income taxes 99.9 51.0 96.0%
Income tax gain/expense -7.2 -10.2 n.m.
Net income / Net loss 92.7 40.8 127.5%
* Excluding effects from restructuring and impairment tests

975.9 -4.6 -3.7 1.3 -3.8 -10.10.9 956.0
900
920
940
960
980
1,000
1,020
1,040
1,060
1,080
1,100
RevenuesQ1 2014
Austria Bulgaria Croatia Belarus AdditionalMarkets
Others RevenuesQ1 2015
> Bulgaria: Monthly fee and traffic revenues impacted by price pressure in contract customer segment, especially in business
> Croatia: Equipment revenues higher due to instalment sales; monthly fee and traffic revenues increase due to strong fixed-line growth
> Belarus: 16.8% revenue growth in local currency due to inflation-linked price increases, EUR 17.4 mn FX translation effect
> Additional markets: Regulatory cuts and negative pricing trends in mobile lead to revenue decline in Slovenia
> Revenue decline slows to 0.8% versus -9.7% in Q1 2014 as monthly fee and traffic revenues stabilised
> 3.3% ARPU growth to EUR 15.7 due to higher monthly fees in premium segment despite sharp decline in prepaid following MVNO activities
> Mobile subscriber numbers decline by 4.8% driven by the residential contract business
> ARPL decline continues with –3.7% due to voice minute losses despite strong broadband & TV take-ups
Segment Austria International Segments
Group revenues: Improving trend driven by Austria and Croatia
Quarterly revenue development (in EUR million)
8Results for the first quarter 2015
-2.0%

319.9 12.3 -2.3 -3.6 1.8 12.6 -2.2 338.5
EBITDA comp.Q1 2014
Austria Bulgaria Croatia Belarus AdditionalMarkets
Others EBITDA comp.Q1 2015
> Bulgaria: 4.7% higher operating expenses as customer retention activities weigh on material expenses
> Croatia: Operating expenses increase by 8.3% due to the higher frequency usage fees as well as higher marketing and sales costs
> Belarus: Local currency EBITDA comparable rises by 28.0% despite 6.4% OPEX increase on a local currency basis driven by higher maintenance & repair and employee costs as well as FX denominated costs as rental expenses, frequencies and energy
> Additional markets: 2.7% lower OPEX mainly due to Slovenia
2.7% clean EBITDA comparable growth*
9
Quarterly EBITDA comparable development (in EUR million)
> EBITDA comparable growth of 6.3% y-o-y
> EUR 14.2 mn OPEX reduction (-3.3%): lower marketing and sales costs, interconnection costs, as well as reduced costs for support services, consulting and transportation
> 65.9% lower SACs
> 45.3% lower SRCs
Segment Austria International Segments
Results for the first quarter 2015
Clean EBITDA: +2.7%*+5.8%
* Excluding EUR 10.1 mn FX effects and EUR 20.0 mn one-off effect in Slovenia

(in EUR million) Q1 2015 Q1 2014 % change
Gross cash flow 303.7 284.0 6.9%
Change in working capital -31.5 -135.1 n.m.
Cashflow from operating activities 272.2 148.9 82.8%
Ordinary capital expenditures -121.1 -99.4 n.m.
Proceeds from sale of equipment 2.1 2.3 -9.9%
Free cash flow 153.2 51.8 195.6%
Free cash flow increases four times due to lower working capital needs
10
Year-to-date analysis
> EUR 20 mn cash-relevant one-off effect in Slovenia leads to increase in gross cash flow
> Moderate working capital needs as a reduction in accounts payable was partly mitigated by the decrease in accounts receivable
> Higher CAPEX mainly stemming from Austria, as investments were comparably low in Q1 2014
> Increase in free cash flow to EUR 153.2 mn
Results for the first quarter 2015

11
Focus points
Results for the first quarter 2015

1,000
2,000
3,000
4,000
5,000
Q1 14 Q2 14 Q3 14 Q4 14 Q1 15
Contract Prepaid
12Results for the first quarter 2015
Austria: New MVNOs result in increased competition; growth target remains intact
> MVNO launches:
> UPC in December 2014
> HoT in January 2015
> Temporary subsidy promotion launched to close gap between premium and no-frills segment
> Additional cost savings to offset higher subsidies
> Target: Halt customer decline and grow revenues
Total subscribers(in ‘000)
Subscriber acquisition & retention costs (SACs & SRCs)(in EUR million)
Mobile service revenues(in EUR million)
-5.8%
-4.4%
220
240
260
280
300
Q1 14 Q2 14 Q3 14 Q4 14 Q1 15
ARPU-relevant revenuesARPU-relevant revenues excl. interconnection
0
5
10
15
20
25
Q1 14 Q2 14 Q3 14 Q4 14 Q1 15
SAC total SRC total

13Results for the first quarter 2015
Increasing trend towards data and ICT solutions –Recent transactions in Austria
IT Outsourcing for EGLO E-Care TerminalThalia Cisco Meraki
> Outsourcing of all IT applications
> Managed and hosted datacenter services
> Migration and integration of more than 30 servers
> Distribution and servicepartner for Cisco Meraki
> Centralised management ofwifi system for eachindividual branch
> Users
> Access
> Bandwith
> etc.
> Customer analysis
> Service screen for hospitalbeds: information, communication, entertainment, etc.
> 12 hospitals
> 4000 terminals
> Latest transaction: GESPAG (Assocation of hospital in Upper Austria)

14Results for the first quarter 2015
Bulgaria: Initiatives implemented to achieve EBITDA stabilisation
Mobile residentialretail customers
Mobile businesscustomers
Fixed-linesegment
Increase homesconnected
> Improve brandperception
Increase contractcustomer base
> Enhancement ofsales capabilities:
> Door-to-door> Improve shop
performance
> Improve value focus in retentionand aquisition
> Churn reductionand customer valuemanagement
> Salesforce training > Retention focus
> TV push after DTH launch
> Proactive upsellingto convergentoffers to improvecustomer value
Targets
Initiatives> Upselling to data
tariffs
Optimise customervalue development
Stabilise market share

> Mobile market share stabilisation in Q1 2015
> Awareness of fully integrated operator strengthened
> 26% increase in TV customers driven by DTH push
> Pricing trends and challenges in business segment continue to weigh on total revenues
15Results for the first quarter 2015
Bulgaria: Customer KPIs improving but revenues reflect negative pricing trends
Mobile residential contract net additions
Homes passed to homes connected ratio
> Positive net additions in last two consecutive quarters
> Turnaround in Q1 2015 initiated
14.0%
14.4%
14.8%
15.2%
15.6%
16.0%
Q1 14 Q2 14 Q3 14 Q4 14 Q1 15
Revenues
80
85
90
95
100
Q1 14 Q2 14 Q3 14 Q4 14 Q1 15
in EUR million
-50,000
-30,000
-10,000
10,000
30,000
Q1 14 Q2 14 Q3 14 Q4 14 Q1 15

12,000
14,000
16,000
18,000
20,000
Jan-15 Feb-15 Mar-15
1,000
1,200
1,400
1,600
Q1 14 Q2 14 Q3 14 Q4 14 Q1 15
16Results for the first quarter 2015
Belarus: Financial performance on track despite macro and FX challenges
velcom BYR revenues
EURBYR development
10.0% BYR devaluation in Q1 15
Macro challenges but FX improvements
> GDP forecast lowered to 2-4%* decline for 2015> Higher oil price, tight monetary and price control
lead to 16.4% BYR appreciation since its low in mid-January
Shrinking consumer demand
> Reduced real purchasing power and increasingunemployment
> Discontinuation of instalment sales> Net additions slow to -29,000
Financial result remains on track
> 16.8% y-o-y revenue growth and 28.0% EBITDAcomparable growth in local currency in Q1 2015
> Focus on premium quality to allow premiumpricing
> Ban on price increases ended> Instalment plan re-established to facilitate
upselling and capitalise on data growth
in billion
* Source: IMF

Outlook for the full year 2015
17Results for the first quarter 2015

* Does not include investments for spectrum and acquisitions
** Intended proposal for the AGM 2015
18
Telekom Austria Group outlook for the full year 2015 unchanged
EUR 0.05
Approx. +2%
EUR 700-750 mn
Revenues
CAPEX*
Proposed Dividend**
Revenues
CAPEX*
Proposed dividend**
22 April 2015
Results for the first quarter 2015
On a constant currency basis with the exception of Belarus; assumed BYR devaluation of 20%
EUR 0.05
Approx. +2%
EUR 700-750 mn
10 February 2015
Appendix 1
19Results for the first quarter 2015

20
as of 31 March 2015(in ‘000, in %)
The leading regional communications playerproviding convergent telecommunication services
Mobile:> Market share: 40.4% (Q1 2014: 42.1%)> Subscriber base: 5,375 (Q1 2014: 5,646)Fixed Line:> Access Lines: 2,289 (Q1 2014: 2,288)
Austria
Mobile:> Market share: 39.2% (Q1 2014: 38.5%)> Subscriber base: 4.311 (Q1 2014: 4,111)Fixed Line:> Access Lines: 170 (Q1 2014: 154)
Bulgaria*
Mobile:> Market share: 42.6% (Q1 2014: 42.9%)> Subscriber base: 4,921 (Q1 2014: 4,939)
Belarus
Mobile:> Market share: 36.3% (Q1 2014: 37.0%)> Subscriber base: 1,726 (Q1 2014: 1,807)Fixed Line:> Access Lines: 229 (Q1 2014: 202)
Croatia
Republic of MacedoniaMobile:> Market share: 28.4% (Q1 2014: 28.3%)> Subscriber base: 616 (Q1 2014: 622)Fixed Line:> Access Lines: 76 (Q1 2014: 63.1)
Mobile:> Market share: 29.2% (Q1 2014: 29.9%)> Subscriber base: 684 (Q1 2014: 678)
Slovenia
Republic of SerbiaMobile:> Market share: 22.5% (Q1 2014: 21.5%)> Subscriber base: 2,126 (Q1 2014: 2,044)
Results for the first quarter 2015

Revenue Split - Segment Austria (in EUR million) Q1 2015 Q1 2014 % change
Monthly fee and traffic 447.8 446.4 0.3%
Data and ICT solutions 55.2 54.4 1.5%
Wholesale (incl. Roaming) 33.1 40.7 -18.6%
Interconnection 43.3 44.9 -3.6%
Equipment 24.5 23.0 6.5%
Other revenues 5.5 4.6 19.5%
Total revenues - Segment Austria 609.5 614.1 -0.8%
Revenue Split - International Operations (in EUR million) Q1 2015 Q1 2014 % change
Monthly fee and traffic 264.8 281.3 -5.9%
Data and ICT solutions 0.4 0.3 38.6%
Wholesale (incl. Roaming) 4.0 4.2 -4.9%
Interconnection 29.4 36.4 -19.2%
Equipment 52.2 45.8 14.0%
Other revenues 3.1 2.1 50.2%
Total revenues - int. Operations 353.9 370.1 -4.4%
Telekom Austria Group – Revenue breakdown
21Results for the first quarter 2015

Telekom Austria Group – Expense breakdown
22Results for the first quarter 2015
Operating Expense - Segment Austria (in EUR million) Q1 2015 Q1 2014 % change
Material expense 56.2 52.3 7.5%
Employee costs 179.4 176.7 1.5%
Interconnection 40.1 42.1 -4.6%
Maintenance and repairs 22.5 22.7 -0.9%
Services received 26.1 27.6 -5.4%
Other support services 29.4 33.5 -12.3%
Other 68.4 81.5 -16.0%
Total OPEX - Segment Austria 422.0 436.3 -3.3%
Operating Expense - International Operations (in EUR million) Q1 2015 Q1 2014 % change
Material expense 53.1 52.6 1.0%
Employee costs 36.5 35.1 3.7%
Interconnection 30.4 39.7 -23.3%
Maintenance and repairs 16.0 15.6 2.7%
Services received 19.1 26.7 -28.4%
Other support services 6.5 5.4 20.4%
Other 83.7 70.4 18.9%
Total OPEX - int. Operations 245.2 245.4 -0.1%

FTE (Average period) Q1 2015 Q1 2014 % change
Austria 8,724 8,866 -1.6%
International 7,362 7,073 4.1%
Telekom Austria Group* 16,270 16,111 1.0%
FTE (End of period) Q1 2015 Q1 2014 % changeAustria 8,746 8,895 -1.7%
International 7,365 7,020 4.9%
Telekom Austria Group* 16,298 16,090 1.3%
Telekom Austria Group – Headcount development
* Including corporates
23Results for the first quarter 2015

Capital Expenditures (in EUR million) Q1 2015 Q1 2014 % change
Segment Austria 68.5 61.5 11.4%
Segment Bulgaria 13.6 6.6 105.5%
Segment Croatia 9.4 12.6 -25.8%
Segment Belarus 7.6 8.3 -7.8%
Segment Additional Markets 22.0 10.4 111.1%
Slovenia 4.3 3.1 37.9%
Republic of Serbia 15.5 6.1 151.9%
Republic of Macedonia 2.2 1.1 96.4%
Liechtenstein 0.0 0.0 n.m.
Eliminations additional markets 0.0 0.0 n.a.
Corporate, Others & Elimination 0.0 0.0 n.a.
Total capital expenditures 121.1 99.4 21.8%
Thereof tangible 91.9 71.4 28.6%
Thereof intangible 29.2 28.0 4.3%
Telekom Austria Group – Capital expenditures split
24Results for the first quarter 2015

Net debt* (in EUR million) 31 March 2015 31 December 2014 % change
Long-term debt 2,634.3 3,385.0 -22.2%
Short-term borrowings** 1,054.1 340.8 209.3%
Cash and cash equivalents and short-term investments -1,110.8 -1,032.5 n.m.
Net Debt** of Telekom Austria Group 2,577.6 2,693.3 -4.3%
Telekom Austria Group – Net debt
25
EUR 600 mn non-call 5 years hybrid bond qualified as 100% equity under IFRS
Results for the first quarter 2015
* As of 31 December 2014 long-term financial investments, instalment sales receivables and financial leasing are no longer included in the calculation of net debt; comparative figures have been restated accordingly
** The deferred consideration for the acquisition of SOBS paid in June 2014 is included in short-term borrowings as of 31 December 2013.
290.7
816.1
546.2
205.3
47.3 0.0
743.0 741.9
297.9
2015 2016 2017 2018 2019 2020 2021 2022 2023
* EUR 600 mn non-call 5 years hybrid bond qualified as 100% equity under IFRS
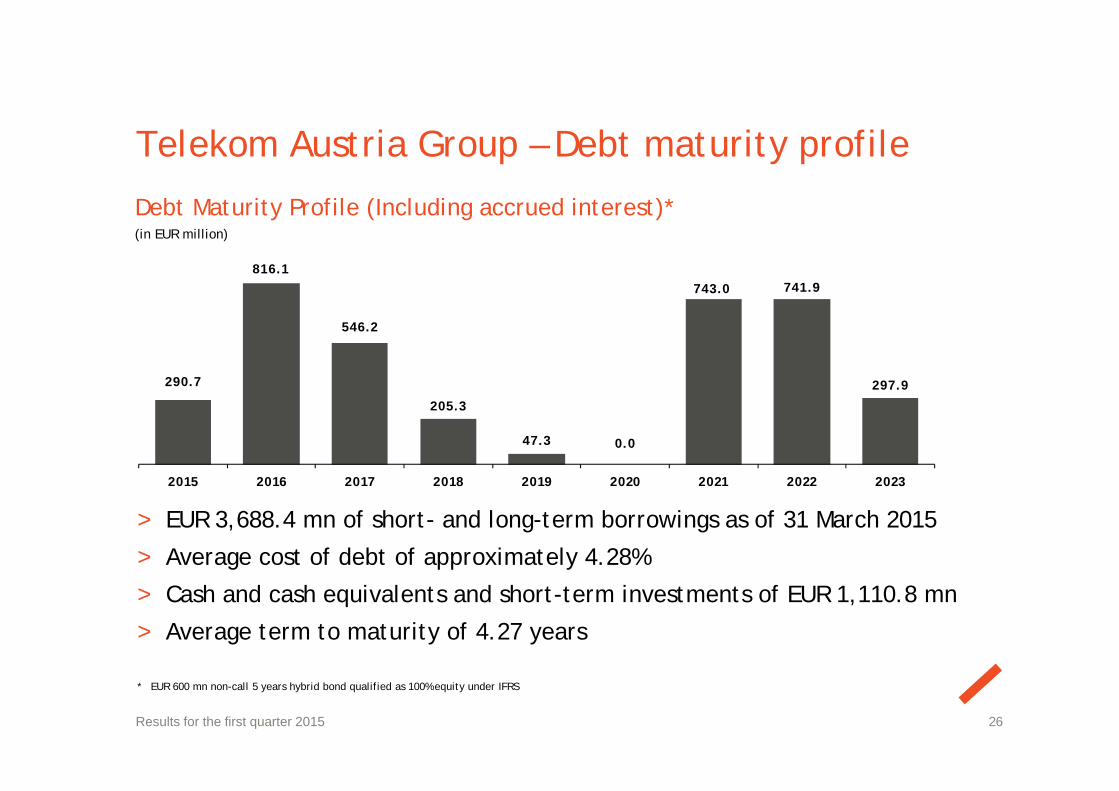
Telekom Austria Group – Debt maturity profile
Debt Maturity Profile (Including accrued interest)*(in EUR million)
> EUR 3,688.4 mn of short- and long-term borrowings as of 31 March 2015
> Average cost of debt of approximately 4.28%
> Cash and cash equivalents and short-term investments of EUR 1,110.8 mn
> Average term to maturity of 4.27 years
26Results for the first quarter 2015

Telekom Austria Group – Debt profile
Overview debt instruments Fixed-floating mix
> S&P: BBB (outlook stable)
> Moody’s: Baa2 (outlook stable)
Lines of credit Ratings
> Undrawn committed credit lines amounting to EUR 1,000 mn
> Average term to maturity of approx. 4.6 years
27Results for the first quarter 2015
100.0%
Fixed
16.4%
83.6%
Loans Bonds

37 37 37 36 36
1,377 1,388 1,405 1,433 1,453
247 245 242 239 240
Q1 14 Q2 14 Q3 14 Q4 14 Q1 15
2,288 2,275 2,275 2,287 2,289
Q1 14 Q2 14 Q3 14 Q4 14 Q1 15
1,052 1,046 1,044 1,050 1,050
240.0 241.6 243.9 251.8 255.7
150.00
200.00
250.00
300.00
350.00
0.00200.00400.00600.00800.00
1000.001200.00
Q1 14 Q2 14 Q3 14 Q4 14 Q1 15
30.6 30.3 30.2 30.5 29.5
210.2 207.4 206.0 208.5202.7
Q1 14 Q2 14 Q3 14 Q4 14 Q1 15
Fixed broadband access lines(in ‘000)
Bundle subscriber growth(in ‘000)
Unbundled lines
Segment Austria – Fixed-line key performance indicators
ARPL & ARPL-relevant revenues(in EUR, in EUR million)
Total fixed access lines & net adds(in ‘000)
28
ARPL ARPL-relevant revenues
Fixed retail broadband linesFixed wholesale broadband lines
Bundles A1 TV
Total fixed access lines Net adds
Results for the first quarter 2015
3.8
-12.60.4
11.61.8

157.3%156.3% 156.2% 155.1% 155.3%
Q1 14 Q2 14 Q3 14 Q4 14 Q1 15
788.3743.9
722.9 714.9 692.1
Q1 14 Q2 14 Q3 14 Q4 14 Q1 15
138.1 137.8 139.0 141.0 137.6
Q1 14 Q2 14 Q3 14 Q4 14 Q1 15
15.2 16.2 16.9 16.5 15.7
259.2270.2 277.4
268.6 254.1
Q1 14 Q2 14 Q3 14 Q4 14 Q1 15
Segment Austria – Mobile key performance indicators
ARPU & ARPU-relevant revenues*(in EUR)
MoU per subscriber**(in min)
Mobile broadband customers(in ‘000)
Mobile penetration(in %)
29
ARPU ARPU relevant revenues
Results for the first quarter 2015
* As of Q1 2015 ARPU relevant revenues excluding mobile value added services (immaterial).** As of Q1 2015 the calculation methodology of MOU has changed. To ensure comparability, historical numbers for the year 2014 have been restated accordingly.

Market share fixed-line broadband(in %)
Segment Austria – Broadband market split
30
Market share total broadband(in %)
Market share mobile broadband(in %)
Results for the first quarter 2015
30.4% 30.9%
0.8% 0.8%
17.4% 14.7%
16.3% 16.8%
4.8% 4.4%
30.2% 32.5%
Q1 14 Q1 15
Mobile BroadbandOther Operations
Unbundled Lines
Cable
A1 MobileBroadband
A1 FixedWholesale
A1 Fixed Retail
36.5% 31.2%
41.6% 44.1%
14.8% 17.3%
7.1% 6.4%
Q1 14 Q1 15
Tele.ring
T-mobile
Hutchison
A1
58.0% 58.6%
5.1% 4.6%
22.4% 22.3%
14.5% 14.5%
Q1 14 Q1 15
Others
UPC
Tele2/UTA
A1

Segment Austria – Voice market split
Market share total minutes(in %)
31
Market share fixed-line minutes(in %)
Results for the first quarter 2015
8.5% 8.1%5.3% 5.0%
86.2% 87.0%
Q1 14 Q1 15
Fixed Line Telekom Austria Fixed Line Others Mobile
60.3% 60.6%
21.8% 22.7%
3.9% 3.5%14.0% 13.2%
Q1 14 Q1 15
A1 Tele2/UTA UPC Others

14.3 14.5 14.4 14.4 13.4
6.8 6.7 6.6 6.6 6.5
Q1 14 Q2 14 Q3 14 Q4 14 Q1 15
Segment Bulgaria – Fixed-line key performance indicators
ARPL & ARPL-relevant revenues(in EUR, in EUR million)
Fixed broadband retail access lines(in ‘000)
Total fixed access lines(in ‘000)
ARPL ARPL-relevant revenues
32
TV subscribers(in ‘000)
Results for the first quarter 2015
154.4 153.0 151.3 153.6
170.4
Q1 14 Q2 14 Q3 14 Q4 14 Q1 15
149.7 148.5 147.5 145.1150.8
Q1 14 Q2 14 Q3 14 Q4 14 Q1 15
77.3 78.8 80.784.3
97.3
Q1 14 Q2 14 Q3 14 Q4 14 Q1 15
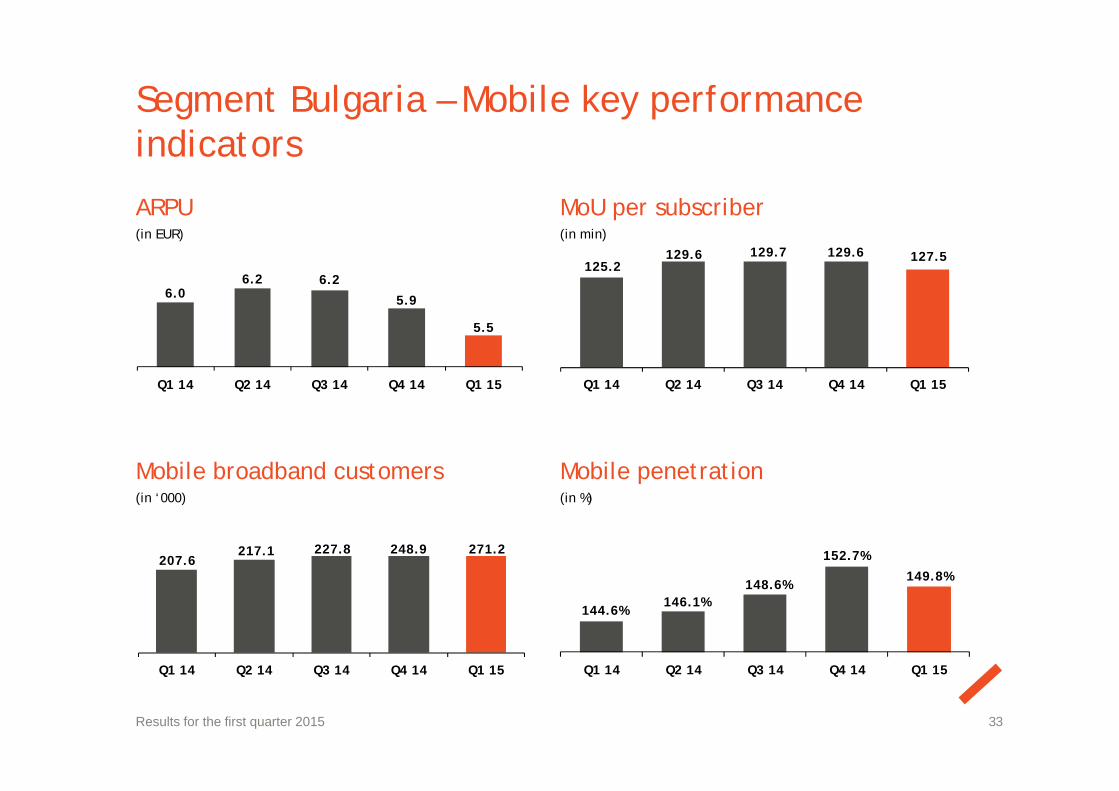
Segment Bulgaria – Mobile key performance indicators
ARPU(in EUR)
MoU per subscriber(in min)
Mobile broadband customers(in ‘000)
Mobile penetration(in %)
33Results for the first quarter 2015
6.06.2 6.2
5.9
5.5
Q1 14 Q2 14 Q3 14 Q4 14 Q1 15
125.2129.6 129.7 129.6 127.5
Q1 14 Q2 14 Q3 14 Q4 14 Q1 15
207.6217.1 227.8 248.9 271.2
Q1 14 Q2 14 Q3 14 Q4 14 Q1 15
144.6%146.1%
148.6%
152.7%
149.8%
Q1 14 Q2 14 Q3 14 Q4 14 Q1 15

Segment Croatia – Fixed-line key performance indicators
ARPL & ARPL-relevant revenues(in EUR, in EUR million)
Fixed broadband retail access lines(in ‘000)
Total fixed access lines(in ‘000)
ARPL ARPL-relevant revenues
34
TV subscribers(in ‘000)
Results for the first quarter 2015
21.6 21.3 21.1 21.4 21.2
12.8 13.2 13.3 13.9 14.3
Q1 14 Q2 14 Q3 14 Q4 14 Q1 15
115.9 121.0127.6
136.0 145.5
Q1 14 Q2 14 Q3 14 Q4 14 Q1 15
202.1 208.0 212.3 219.9 228.9
Q1 14 Q2 14 Q3 14 Q4 14 Q1 15
159.8 162.9 163.4 167.7 171.5
Q1 14 Q2 14 Q3 14 Q4 14 Q1 15
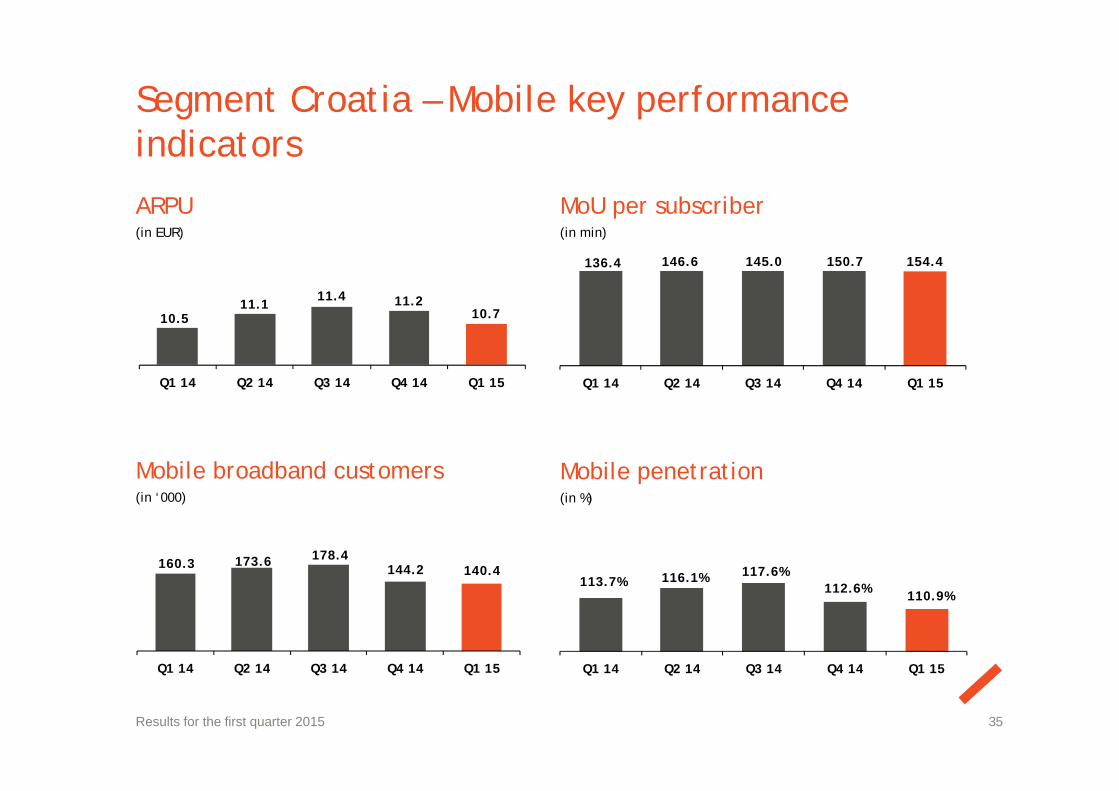
Segment Croatia – Mobile key performance indicators
ARPU(in EUR)
MoU per subscriber (in min)
Mobile broadband customers(in ‘000)
Mobile penetration(in %)
35Results for the first quarter 2015
10.511.1
11.4 11.210.7
Q1 14 Q2 14 Q3 14 Q4 14 Q1 15
136.4 146.6 145.0 150.7 154.4
Q1 14 Q2 14 Q3 14 Q4 14 Q1 15
160.3 173.6 178.4144.2 140.4
Q1 14 Q2 14 Q3 14 Q4 14 Q1 15
113.7% 116.1% 117.6%112.6% 110.9%
Q1 14 Q2 14 Q3 14 Q4 14 Q1 15

Segment Belarus – Mobile key performance indicators
ARPU(in EUR)
MoU per subscriber*(in min)
Mobile penetration(in %)
Mobile broadband customers(in ‘000)
36Results for the first quarter 2015
4.7
5.0 6.2
4.54.6
Q1 14 Q2 14 Q3 14 Q4 14 Q1 15
184.6197.7 198.8 201.4
187.8
Q1 14 Q2 14 Q3 14 Q4 14 Q1 15
252.6262.3 272.4
284.1 282.9
Q1 14 Q2 14 Q3 14 Q4 14 Q1 15
121.6% 122.8% 123.1% 123.3%121.9%
Q1 14 Q2 14 Q3 14 Q4 14 Q1 15

Segment Additional Markets – Mobile key performance indicators
Slovenia - ARPU(in EUR)
Republic of Serbia - ARPU(in EUR)
Slovenia - MoU per subscriber(in min)
Republic of Macedonia - ARPU(in EUR)
37Results for the first quarter 2015
19.8 19.8 19.617.3
15.8
Q1 14 Q2 14 Q3 14 Q4 14 Q1 15
190.7 192.2 188.0 190.4 190.3
Q1 14 Q2 14 Q3 14 Q4 14 Q1 15
6.77.1 7.3
6.7
6.0
Q1 14 Q2 14 Q3 14 Q4 14 Q1 15
6.67.0 7.2
6.7
6.1
Q1 14 Q2 14 Q3 14 Q4 14 Q1 15

Appendix 2 –Regulatory topics
38Results for the first quarter 2015

39
* National MTRs stated. International MTRs differ** Belarus values: peak times/off-peak times – the medium weighted MTR value amounts to BYR 150 per minute
Glide Path of Mobile Termination RatesEU Pressure on National Regulatory Authorities to Further Decrease Rates
Jan2014
Jul2014
Sep2014
Jan2015
Jul2015
Austria (EUR) 0.008049 0.008049 0.008049 0.008049 0.008049
Bulgaria (BGN) 0.02 0.02 0.02 0.019 0.019
Croatia (HRK) 0.1282* 0.1282* 0.1282* 0.063* 0.063*
Belarus (BYR) 180/90** 180/90** 180/90** 180/90** 180/90**
Slovenia (EUR) 0.0324 0.0324 0.0114 0.0114 0.0114
Serbia (RSD) 3.95 3.95 3.95 3.43 3.43
Macedonia (MKD) 1.20 1.20 0.90 0.90 0.90
Results for the first quarter 2015

EU Roaming Price Regulation
40
RETAIL (in EURc) July 2013 July 2014
Data (per MB) 45 20
Voice-calls made (per minute) 24 19
Voice-calls received (per minute) 7 5
SMS (per SMS) 8 6
WHOLESALE (in EURc) July 2013 July 2014
Data (per MB) 15 5
Voice (per minute) 10 5
SMS (per SMS) 2 2
Results for the first quarter 2015

41
Planned/Expected Comments
Austria 2019 (2100 MHz) -
Bulgaria 2015 (1800 MHz) 2600 MHz band planned to be free from 1st Sept. 2015; allocation procedure currently undecided
Croatia2015 (1800 MHz)2016-2017 (2100 MHz)2017-2018 (2600 MHz)
2100 MHz: dependent on LTE roll out dynamics and traffic development (on request of at least one operator)2600 MHz: dependent on traffic development
Belarus 2015 (2100 MHz)
2100 MHz: 4th block countrywide
LTE license only awarded to B-cloud, allocation to other operators not expected before 2016
Slovenia 2017NRA announced preparation of a new tender for public spectrum auction of ‘leftovers’ 700 MHz, 1400 MHz, 1800 MHz, 2100MHz, 2300 MHz, 3500 MHz and 3700 MHz
Republic of Serbia 2015 (800 MHz)2016 (900 MHz)
Republic of Macedonia 2016-2017 (900 MHz & 1800 MHz)900 MHz (2x10) & 1800 MHz (2x10): Prolongations (Vip operator licenses in these spectrum valid until 22.03.2017)
Upcoming spectrum tenders/prolongations/assignments
Results for the first quarter 2015

Appendix 3 –Personnel restructuring in Austria
42Results for the first quarter 2015

2010 2011 2012 2013 2014
Q1
2015
Transfer to
government 158 264 308 330 242 195
Social plans 299 922 1,030 1,315 1,460 1,460
Staff released
from work763 649 510 410 350 345
Total 1,220 1,835 1,848 2,055 2,052 2,000
2010 2011 2012 2013 2014
Q1
2015
Transfer to
government 158 106 44 22 52 10
Social plans 28 685 94 409 199 7
Staff released
from work27 0 0 0 0 0
Total 213 791 138 431 251 17
Quarterly overview – Restructuring charges and provision vs. FTEOverview restructuring charges(in EUR million)
FTEs addressed
43
Overview restructuring provision**(in EUR million)
Provisioned FTEs
* Including EUR 15.0 mn due to the judgment of the European Court of Justice from November 11, 2014 regarding the remuneration and legal rights of civil servants (‘Vorrückungsstichtag’)
** Including liabilities for transfer of civil servants to government bodies since 2010
Results for the first quarter 2015
2010 2011 2012 2013 2014
Q1
2015
FTE effect 76.9 274.3 49.9 149.0 86.4* 4.5
Servicekom 0.0 -40.6 -76.7 -103.8 -39.4 -0.6
Interest rate
adjustments47.2 0.0 61.4 0.0 42.6 0.0
Total124.1 233.7 34.7 45.2 89.6 3.9
721.9888.8 852.7 810.0 809.5 791.1
2010 2011 2012 2013 2014 Q1 2015
* *

Overview – Cash flow impact of restructuring
Overview cash flow impact*(in EUR million)
44
> Total cash flow impact comprises old and new programmes
> Cash flow impact for Q1 2015 of
EUR 25.2 mn
> Total expected cash flow impact for 2015 of approximately EUR 100 - 110 mn
* Historical numbers have been restated since 2011 to fully reflect all payments from the transfer of civil servants to government bodies.
Results for the first quarter 2015
Total cash-flow impact
2010 57.9
2011 93.4
2012 104.0
2013 108.0
2014 107.1
Q1 2015 25.2

Appendix 4 –Corporate sustainability
45Results for the first quarter 2015

Alignment with core business and materiality analysis define sustainability strategy
46Results for the first quarter 2015

Key figures
47
Selected Group-wide KPIs
Products: Providing Responsible Products 2013
Customer contacts in customer service ('000) 40.640
Employees in customer service (in FTE) 3.627
Environment: Living Green* 2013
Total CO2 Emissions (Scope 1+2 in tonnes) 222.722
Energy efficiency index (in Mwh/terabyte) 1,1
Paper consumption (in tonnes) 1.777
Collected old mobile phones (in pcs) 107.353
E-billing share (in %) 64
Employees: Empowering People 2013
Share of femal employees (in %) 37
Share of femal executives (in %) 31
Internally hired positions 631
Society: Creating Equal Opportunities 2013
Participants in trainings on media literacy** 24.483
Local educational projects over 30
* Mobilkom liechtenstein is not included due to size of the operating company** Since beginning of the initiative
Ratings
Memberships
›Classification: B (93 points out of100)
Indices
›Classification: C+
Results for the first quarter 2015