Telecom Egypt 1H 10 - Jazira Capital
11
JAZIRA SECURITIES BROKERAGE Monday, September 20, 2010 TELECOM EGYPT Equity Research Mobile is not the only new play TE can get Egypt’s fixed line addressable market penetration rate has fallen to 48% in 1H FY10, down from 60% at the end of 2008, as TE has cleaned up its customer base from inactive and non-paying customers. This clean-up has resulted in muting the impact mobile market price wars had on TE’s fixed line ARPU, which even with TE’s writing-off 2.3 million or 20% of its customers count, have remained almost flat at EGP40.6/month. However, TE is fighting back with more visible promotions and marketing approach. The fixed line revenue stream declined 3.7% per annum over the past 4 years and is expected to wit- ness a 1.7% CAGR decline over the forecasted period. We believe TE should be seen simply, as the third largest player in the local & national telephony in Egypt, as its and mobile operators’ markets and strategies have became extremely intertwined. Internet & data is the sole activity in TE’s retail segment which is demon- strating healthy growth of 48% CAGR over the past four FYs, and is expected to witness 22% CAGR from 2010 to 2015, as TE’s fully owned ISP, TE Data, captures over 60% of Egypt’s broadband market, which its addressable market penetration is expected to witness a 21% CAGR over the coming 5 years. The global economic slowdown and the further rise of VoIP are both pounding on the international call revenue stream. However, TE has man- aged to increase international revenues by 14% to EGP1.89 billion in 1H FY10, through the generating of around EGP312 mn from the sale of its new cable capacities. We expect that sale of TE North and transit corridor capacities will maintain international revenues growth in 2010 and 2011. Although Vodafone Egypt has reported a yoy bottom line decline in the 6 months ending June 2010 of 9% to EGP1.35 billion, TE reported a 16% in- crease in investment income from VE to EGP730 million, as a result of some adjustments VE made in its employee profit share account. We project that VE will report 6% decline in net profit for the 12 months ending December 2010, a minor setback in a year in which we expect Mobinil to witness nearly 27% bottom line decline. For FY10, we expect revenues to grow by 1.1% after receiving a bump up from the cable operation mitigating the expected declining fixed line revenue stream. Going further forward, we project revenues growth will start to pick up mo- mentum by 2013, as the global economic recovery will support relatively better international call revenue, plus better domestic wholesale revenues from the sale of capacities to satisfy a growing broadband demand and businesses including call center activity, in addition to acceleration of the broadband revenues growth on the retail front. TE has a cash rich balance sheet, which improved even further after receiv- ing EGP1.35 billion cash dividend from VE in July 2010. While TE has no intentions to invest abroad, TE has its eyes on expanding its operations locally, into areas that would integrate with its prevailing operations. TE revealed it’s in the look out for a system integrator company to consolidate. TE is still a dual play operator, the initiative of making the whole of Luxor wi-fi covered can be done on a wider scale, and with the surge of smart phones, Ipad and laptops accessing the net on the go, TE can capture significant por- tion of the wireless broadband revenue, which currently is dominated by mo- bile operators. Still to be a real triple play operator, TE has the potential to penetrate the cable TV, content and media fields. To be a quadruple player, TE would need to have its own mobile network. We see Etisalat Misr is a perfect candidate, since if anyone can make this network profitable it would be TE due to the inte- gration potential. However, we don’t think Etisalat’s owners would sell any time soon as long as banks are still giving them more funding, supported by the operator’s mother company credit reputation. A forth network, well this would be just one network too many... 1 FY ending Dec. 2009a 2010e 2011f 2012f Revenues (EGP mn) 9,960 10,072 10,372 10,493 EBITDA Margin 50.3% 47.6% 47.0% 45.6% EPS (EGP) 1.64 1.78 1.81 1.95 DPS (EGP) 1.30 1.30 1.50 1.65 PER 10.4x 9.6x 9.4x 8.7x DY 7.6% 7.6% 8.8% 9.7% EV/EBITDA 5.6x 5.4x 4.9x 4.7x Net Debt (EGP mn) 1,063 (1,015) (2,646) (4,127) Analyst: Mohamed Fahmy Email : mfahmy@jazir acapital.com Mobile: +2012 2157312 TE Share Pri ce (EGP) 15 17 19 21 S - 09 O- 09 N- 09 D- 09 D- 09 J - 10 F- 10 M- 10 M- 10 A- 10 M- 10 J - 10 J - 10 J - 10 A- 10 S - 10 HOLD Market Price (EGP/share) 17.3 Target (EGP/share) 19.5 Upside 13% Reuters Codes ETEl.CA ETELq.L Full Name: Telecom Egypt Company Short Name TE Exchange Listing EGX LSE Index Inclusion EGX30 Number of Shares (mn) 1,707 Market Cap (EGP bn) 29.5 EV 2010 (EGP bn) 29.8 52 Week Low-High (EGP) 15.1 - 20.3 Average Daily Volume (52 weeks) 1.3 mn Stock Performance Absolute / Relative to index Three Month +1.7% / -1.6% Six Month -1.9% / -3.3% One Year -8.0% / -5.7% Shareholders Ownership stake Egypt Government 80% Free Float & Others 20% GDR Market Price (US$/GDR) 15.3 GDR Target (US$/GDR) 17.2 Share : GDR Conversion Rate 5:1
-
Upload
mohamed-fahmy -
Category
Documents
-
view
217 -
download
0
Transcript of Telecom Egypt 1H 10 - Jazira Capital

8/7/2019 Telecom Egypt 1H 10 - Jazira Capital
http://slidepdf.com/reader/full/telecom-egypt-1h-10-jazira-capital 1/10
JAZIRA SECURITIES BROKERAGE Monday, September 20, 2010
TELECOM EGYPT Equity Research
Mobile is not the only new play TE can getEgypt’s fixed line addressable market penetration rate has fallen to 48% in 1HFY10, down from 60% at the end of 2008, as TE has cleaned up its customerbase from inactive and non-paying customers. This clean-up has resulted in
muting the impact mobile market price wars had on TE’s fixed line ARPU,
which even with TE’s writing-off 2.3 million or 20% of its customers count,have remained almost flat at EGP40.6/month. However, TE is fighting back with more visible promotions and marketing approach. The fixed line revenuestream declined 3.7% per annum over the past 4 years and is expected to wit-ness a 1.7% CAGR decline over the forecasted period.We believe TE should be seen simply, as the third largest player in the local
& national telephony in Egypt, as its and mobile operators’ markets andstrategies have became extremely intertwined.
Internet & data is the sole activity in TE’s retail segment which is demon-
strating healthy growth of 48% CAGR over the past four FYs, and is expectedto witness 22% CAGR from 2010 to 2015, as TE’s fully owned ISP, TE Data,captures over 60% of Egypt’s broadband market, which its addressable marketpenetration is expected to witness a 21% CAGR over the coming 5 years.
The global economic slowdown and the further rise of VoIP are bothpounding on the international call revenue stream. However, TE has man-aged to increase international revenues by 14% to EGP1.89 billion in 1H FY10,through the generating of around EGP312 mn from the sale of its new cablecapacities. We expect that sale of TE North and transit corridor capacities
will maintain international revenues growth in 2010 and 2011.
Although Vodafone Egypt has reported a yoy bottom line decline in the 6months ending June 2010 of 9% to EGP1.35 billion, TE reported a 16% in-crease in investment income from VE to EGP730 million, as a result of someadjustments VE made in its employee profit share account. We project that VE
will report 6% decline in net profit for the 12 months ending December2010, a minor setback in a year in which we expect Mobinil to witness nearly
27% bottom line decline.For FY10, we expect revenues to grow by 1.1% after receiving a bump up fromthe cable operation mitigating the expected declining fixed line revenue stream.Going further forward, we project revenues growth will start to pick up mo-
mentum by 2013, as the global economic recovery will support relatively
better international call revenue, plus better domestic wholesale revenues
from the sale of capacities to satisfy a growing broadband demand and
businesses including call center activity, in addition to acceleration of the
broadband revenues growth on the retail front.
TE has a cash rich balance sheet, which improved even further after receiv-ing EGP1.35 billion cash dividend from VE in July 2010. While TE has nointentions to invest abroad, TE has its eyes on expanding its operations locally,into areas that would integrate with its prevailing operations. TE revealed it’s inthe look out for a system integrator company to consolidate.
TE is still a dual play operator, the initiative of making the whole of Luxorwi-fi covered can be done on a wider scale, and with the surge of smart phones,Ipad and laptops accessing the net on the go, TE can capture significant por-tion of the wireless broadband revenue, which currently is dominated by mo-bile operators.
Still to be a real triple play operator, TE has the potential to penetrate the
cable TV, content and media fields. To be a quadruple player, TE would needto have its own mobile network. We see Etisalat Misr is a perfect candidate,since if anyone can make this network profitable it would be TE due to the inte-gration potential. However, we don’t think Etisalat’s owners would sell any
time soon as long as banks are still giving them more funding, supported by
the operator’s mother company credit reputation. A forth network, well thiswould be just one network too many...
1
FY ending Dec. 2009a 2010e 2011f 2012f
Revenues (EGP mn) 9,960 10,072 10,372 10,493
EBITDA Margin 50.3% 47.6% 47.0% 45.6%
EPS (EGP) 1.64 1.78 1.81 1.95
DPS (EGP) 1.30 1.30 1.50 1.65
PER 10.4x 9.6x 9.4x 8.7x
DY 7.6% 7.6% 8.8% 9.7%
EV/EBITDA 5.6x 5.4x 4.9x 4.7x
Net Debt (EGP mn) 1,063 (1,015) (2,646) (4,127)
Analyst: Mohamed Fahmy
Email : [email protected]
Mobile: +2012 2157312
TE Share Price (EGP)
15
17
19
21
S -
09
O-
09
N-
09
D-
09
D-
09
J -
10
F-
10
M-
10
M-
10
A-
10
M-
10
J -
10
J -
10
J -
10
A-
10
S -
10
HOLD
Market Price (EGP/share) 17.3
Target (EGP/share) 19.5
Upside 13%
Reuters Codes ETEl.CAETELq.L
Full Name: Telecom Egypt Company
Short Name TE
Exchange Listing EGXLSE
Index Inclusion EGX30
Number of Shares (mn) 1,707
Market Cap (EGP bn) 29.5
EV 2010 (EGP bn) 29.8
52 Week Low-High (EGP) 15.1 - 20.3
Average Daily Volume (52 weeks) 1.3 mn
Stock Performance Absolute / Relative to index
Three Month +1.7% / -1.6%
Six Month -1.9% / -3.3%
One Year -8.0% / -5.7%
Shareholders Ownership stake
Egypt Government 80%
Free Float & Others 20%
GDR Market Price (US$/GDR) 15.3
GDR Target (US$/GDR) 17.2
Share : GDR Conversion Rate 5:1

8/7/2019 Telecom Egypt 1H 10 - Jazira Capital
http://slidepdf.com/reader/full/telecom-egypt-1h-10-jazira-capital 2/10
JAZIRA SECURITIES BROKERAGE September 20, 2010
TELECOM EGYPT Equity Research
Fixed Line Activity
Telecom Egypt have wrote off inactive customers in 2009 and in Q1 2010, bringing total sub-scribers down from 11.7 million at the end of 2008 to 9.6 million at the end of 2009, and furtherdown to 9.3 million at the end of Q1 2010. Writing off subscribers is great to reflect the truepenetration level and revenue generating customer base. Currently, fixed line penetration stand
at 48% of the addressable market down from 60% at the end of 2008. However, the real issue isthat ARPU, which should have went up as a result of filtering out the inactive subscribers, haveactually went down. Although the 2% decline in 2009 fixed line services ARPU, is in face valuea small decline, it hides the fact that ARPU would have declined at a larger degree if not for theinactive subscribers write off.
However, some signs that TE is able to hold back the fixed line ARPU from falling further haveshowed up in 1H 2010 ARPU levels, which reached EGP40.6 gaining 1.1% over FY09 figure.But again subscribers stood at 9.42 million down from 9.55 million, which imply that it can berather lesser revenue per sub but distributed on a lesser pool of customers.
So, who’s eating TE’s cheese?
Mobile operators in their competition to grab more subscribers or even just retain their subscrib-
ers in a market with limited access to new customers, have brought mobile airtime rates signifi-cantly lower, in part they have expanded the country’s communications revenue pool but aslohave went deep into TE’s traditional fixed line airtime revenue comfort zone.
We believe without the need for a second fixed line operator, TE is in fact just the third out of afour players local and national telephone connectivity market. We also believe that TE recog-nizing this fact, have upped its marketing campaigns and promotions while lowering rates. Thecompetition will remain fierce and we expect TE fixed line services ARPU to continue itsdownward trend and to have limited customer growth.
We project that customer base growth will mainly be related to new houses and businessesopening. So, it will be closely tied to the Egyptian economic and population growth trends.Based on these factors we estimated that TE will attract between 350k and 400k new customerseach year over the coming 5 years.
Regarding ARPU, we expect fixed line services ARPU to witness a -3.1% compounded annualdecline rate over the same period, as a result of decline in both subscription fees per customerand decline in airtime ARPU.
All this would lead to revenue from fixed line services to decline 13% in FY10, but will managea CAGR of 0.3% from FY11 to FY15.
Internet Activity may be the retail segment’s only balancing factor
Egypt’s broadband addressable market penetration stood at 10.7% at the end of 2009. Still thereis way much potential in this area. We expect broadband addressable market penetration toreach 37.6% by 2015. However, competition is fierce in the broadband market, and again themobile operators are leaping to capture a portion of TE’s best single performing segment of operation. Both Mobinil (EMOB.CA) and Vodafone Egypt have bought internet service provid-
ers in order to support their efforts to boost their wireless broadband provision and diversifyrevenue sources. The mobile providers broadband initiative may not be appealing to the wholespectrum of their subscribers, but it will sure sell well to the high end customers and businesses.
Furthermore, internet service provision is capital intensive and having a mobile operator back-ing the operation will boost the incumbent mobile operators’ ISP business in the face of TEData dominant market position.
TE Data is TE’s fully owned IS provider, and currently holds over 60% market share. TE inter-net & data revenues as a percentage of total TE’s retail segment revenues have increased from2% in 2005 to 11% in 2009. Furthermore, the segment’s ARPU declined at a compounded aver-age of 36% over the same period to EGP103/month.
We expect TE to manage to maintain a mid 60s% broadband market share, over the forecasted
period while its ARPU is expected to decline 6% per annum over the forecasted period.
2
Customer clean up over thepast two years have maskedthe real declining trend of TE’s fixed line ARPU The lines between fixed and
mobile telephony are becom-ing blurry
Broadband addressable marketpenetration rate is expected tohike to 38% in 2015 from 11%at the end of 2009
Mobile operators have thecapacity to invest in ISPs

8/7/2019 Telecom Egypt 1H 10 - Jazira Capital
http://slidepdf.com/reader/full/telecom-egypt-1h-10-jazira-capital 3/10
JAZIRA SECURITIES BROKERAGE September 20, 2010
TELECOM EGYPT Equity Research
Retail Revenue contribution to shrink
The expected growth in TE Data revenues, while all other of TE’s retail activity are expected toweaken further over the years, will result in the internet & data transmission segment of opera-tion to have a larger contribution of the total retail revenues from its current 14.5% contributionin 1H FY10 to 33.5% in FY15. All in all, retail revenues will contribute an average of 54% of
TE’s total revenues over the forecasted period versus 58% in FY09 and an average of 63% overthe past 4 years.
The Wholesale Activity
Income from international dialing is jeopardized by VoIP popularity
International calls revenue stream has been always a lucrative segment for Telecom Egypt,given Egypt’s large expat community in oil rich countries. International segment, all in all, rep-resented 75% of the wholesale services revenues for TE in FY09 and 32% of total revenues,with its majority stemming from international calls. However, global competition on this lucra-tive segment of communications is extremely high with cheaper substitutes such as voice overinternet protocol have made strong strides to attract a considerable portion of the traditionalinternational calls market. Furthermore, with telecom operators worldwide not able to limitVoIP growth, they decided to join them, through providing their own VoIP services. This looks
very similar to airlines banning travelers from the use of mobiles claiming it is not good fornavigation just to boost profits, while now have caved to customer needs and accepted to com-promise and permit a degree of on-flight mobile usage.
The same for fixed line operators own VoIP service, it is limited and rates are expensive com-pared to pure VoIP providers on the pretense that it is of better quality and include true infra-structure cost. However, with the boom in internet capacities, and cheaper service rates, custom-ers will be able to acquire higher bandwidth with cheaper rates which would leave the pretenseof better quality of fixed line telephone weak.
This will result in increased competition from pure VoIP providers, which will push some coun-tries to aggressively lower their rates to maintain their market stake, especially that most fixedline operators are already using wholesale VoIP to carry their international traffic in order to cutcosts. TE may not be one of the first to take such actions but its share of international call reve-
nue originated from such countries will be impacted. Furthermore, with Egypt’s internet sub-scription fees getting lower, while its speed and affordability are getting higher, the competitionon international calls is expected to increase over the coming period.
Cable capacities rollout is starting to have a significant contribution to TE’s revenues
Amazingly, the VoIP which is expected to weaken the lucrative international calls market iscreating new opportunities in the call centers market among others. Call centers is part of thebandwidth hungry new batch of solutions which TE have identified as opportunities for growthand constructed the TE North cable linking Europe to mainland Egypt and into Asia. TE havesold around EGP312 million of the estimated total cable bandwidth income of EGP800 millionduring 1H 2010. The remaining of the lease capacities value of the cable bandwidth is expectedto be sold through the remaining of 2010 and over 2011. Furthermore, TE will receive 4% of the leased capacity sale value per annum, over the contract period, which is estimated between
10-15 years.
Domestic Wholesale Revenues
TE’s domestic wholesale market is essentially broken down into two parts, the first and largerup till now, is the mobile to fixed termination fee income which TE collects from the mobileoperators. The second part, is the revenue generated from the income TE receives from provid-ing its infrastructure to mobile operators and internet service providers and is currently gainingground. We expect that the boost in call centers and broadband penetration in Egypt will sup-port the expansion of TE’s domestic wholesale revenues in the medium term.
Egypt has been ranked the 4th most favorite destination for contact centers in a recent Datamoni-tor report. With the explosion of call center hubs on the outskirts of Cairo with the new Maadicontact center that will add 40,000 seat capacity, once completely operational by 2012, to
Egypt’s growing contact center business. Contact service business is expected to witness aCAGR higher than 20% over the coming 4 years.
We see that Egypt will reach a saturation in telecommunication and bandwidth capacity in lessthat four years time, after which growth will be muted in tune with economic growth levels.
3
Retail segment contribution toTE’s revenues to shrink to54% over the forecasted pe-riod from 63% recorded aver-age for the past 4 FYs
Fixed line operators are al-ready adopting wholesaleVoIP to carry their interna-tional calls in order to cut cost
TE cable operation will gener-ate around EGP800 millionworth of leased bandwidthcapacities in 2010 & 2011
Mobile & ISPs demand forinfrastructure is boosting TE’sdomestic wholesale revenues Egypt has been ranked as thethe 4th most favorite destina-tion for contact centers

8/7/2019 Telecom Egypt 1H 10 - Jazira Capital
http://slidepdf.com/reader/full/telecom-egypt-1h-10-jazira-capital 4/10
JAZIRA SECURITIES BROKERAGE September 20, 2010
TELECOM EGYPT Equity Research
Wholesale Activity
International calls wholesale revenues witnessed a decline of 4.8% in 1H FY10, as a result of asofter global economy and lower international rates by carriers. However, the sum of interna-tional wholesale operations witnessed a 14% growth in 1H FY10 to EGP1.9 bn compared toEGP1.7 bn in 1H FY09, as a result of the cable business EGP312 million sales during 1H FY10,
while no such revenue was recorded in 1H FY09.
The domestic wholesale grew by 17% to EGP619 mn in 1H FY10, driven by infrastructuresales to ISPs and mobile operators, while the wholesale operation in total witnessed a 15% in-crease in 1H FY10 to EGP2.5 billion compared to EGP2.2 billion in 1H FY09.
We expect the wholesale segment revenues to grow at a CAGR of 6% over the forecasted pe-riod supported by the growth in triple play provision to new suburban communities, more infra-structure requirements from local ISPs and mobile operators and new cable business rollout. Onthe other hand, we expect that international gateway revenues to shrink further, due to VoIPcustomer migration, Etisalat increasing its customer base thereby routing their calls through itsown international gateway and TE itself lowering rates in order to ward off any further loss of market position.
Consolidated RevenuesAll in all, we expect revenues to grow by 1.1% in FY10 to EGP10.07 billion compared toEGP9.96 billion in FY09. Revenues grew 0.13% in 1H FY10, we expect the better end of yeartop line growth to stem from more cable sales, improved internet based income growth andTE’s customers become more responsive to TE’s fixed line airtime offers. Over the coming 5years, we expect revenues to improve at a CAGR of 4.5%, driven essentially by broadband re-tail and wholesale domestic activi-ties. Furthermore, as the globaleconomy improves, we expect theinternational wholesale income willrelativity improve as Egyptian ex-pats count in the gulf region in-creases along with current expats’income and consumer confidenceimprovement, resulting in relativelyhigher level of international callconsumption. In addition to TE roll-ing out further international cablecapacities.
EBITDA
EBITDA margin fell from 51.6% in1H FY09 to 49.6% in 1H FY10.Management attributed the declineto the cables operation lower mar-gins compared to TE’s conventionaloperations margins. However, webelieve it’s the competition on allfronts and consequent lower ARPUlevels are the main culprits for thisdecline.
Going forward, we expect theEBITDA margin to gradually fall tothe mid 40s % by 2013. We expectthe EBITDA figure to drop 2.8% inFY10, but starts improving by 2011,with a CAGR of 2.7% from 2011 to2015.
4
International revenues grew14% yoy in 1H 2010 driven bycable capacities sale Sale of local infrastructure leddomestic wholesale to rise by17% in 1H The wholesale segment is ex-pect to have a greater influ-ence on TE’s top line over thecoming years
TE’s consolidated revenuesare expected to witness 1.1%growth in FY10 and 5%CAGR over the following 5years
EBITDA margin is expectedto reach mid 40s% by 2013
First Half KPIs Ending June 2009 2010 Change
Fixed line Subscribers (k) 9,840 9,424 -4.2%
Fixed line ARPU (EGP) 41.81 40.57 -2.9%
Broadband Subscribers (k) 502 741 47.6%
Broadband ARPU (EGP) 104.9 88.4 -15.7%
Broadband Market Share 59.8% 61.4% 2.7%
Capex (EGP mn) 615 519 -15.6%
Net Cash Position (EGP mn) -112 894 n/a
Vodafone Egypt
Closing Subscribers (k) 20,370 25,791 26.6%
ARPU (EGP) 48 38 -21.2%
VE Revenues (EGP mn) 5,846 5,830 -0.3%
VE Net Income (EGP mn) 1,486 1,349 -9.2%
TE Invest. Income from VE (EGP mn) 632 730 15.5%
Income Statement (EGP mn) 1H09 1H10 Change
Access Revenue 1,073 908 -15.4%
Voice Revenue 1,413 1,118 -20.9%
Internet & Data 316 393 24.4%
Others 216 284 31.6%
Retail Revenues 3,018 2,703 -10.4%
Domestic 530 618 16.6%
International 1,654 1,887 14.1%
Wholesale Revenues 2,184 2,506 14.7%
Total Operating Revenues 5,202 5,209 0.1%
COGS 1,476 1,524
Gross Profit 3,726 3,685 -1.1%
S, G & Adm. Expenses 937 934
Ongoing Provisions 14 10
Other Operating Expenses 88 158
EBITDA 2,687 2,583 -3.8%
EBITDA Margin 51.6% 49.6% -4.0%
Depreciation 1,330 1,281
Reported EBITA 1,357 1,302 -4.1%
Interest Income 85 68 -19.1%
Investment Income 636 735 15.6%
Other Non-Operating Income 48 148 209.9%
Other Non-Operating Expenses 0 1
Interest Expense 104 11 -89.1%
NPBT 2,022 2,241 10.9%
Income Tax 284 325 14.5%
Total Extra-Ordinary Items 16 47 197.4%
Minority Interest 4 0 -88.7%
Net Income 1,750 1,963 12.1%
Source: Telecom Egypt

8/7/2019 Telecom Egypt 1H 10 - Jazira Capital
http://slidepdf.com/reader/full/telecom-egypt-1h-10-jazira-capital 5/10
JAZIRA SECURITIES BROKERAGE September 20, 2010
TELECOM EGYPT Equity Research
Vodafone Egypt
Although it’s mobile business that is eating from TE’s fixed line operation pie, the mobile op-erators won’t fair better this year. The Egyptian mobile sector is facing a slowdown in customeruptake as its mobile penetration level is close to the 70% rate. In addition to Etisalat’s offers,which in its attempt to see some real feasibility to its operation has brought prices significantly
lower, compounded with a sluggish consumer sentiment are drowning the sector into a declin-ing profit trend. This has brought us to expect that TE’s 45% stake in Vodafone Egypt will gen-erate lower income this year by 3% compared to 2009. VE’s net income in 1H FY10 based onTE’s fiscal year already reported a 9% decline to EGP1.35 billion compared to EGP1.49 billionin the 6-month ending June 2009 and is expected to close the 12 month period ending Decem-ber with a 6% yoy decline.
TE has reported EGP730 mn of investment income from VE in 1H FY10 compared to EGP631mn in 1H FY09. We don’t expect the full year income to witness such growth, since it includedsome one off adjustments.
Our Vodafone Egypt assumptions pertained that VE’s market share would remain in the low tomid 40s%, revenues to suffer a mild decline in 2010, but start a positive trend next year, andpick an upward robust momentum by 2013, as the economic recovery will relatively boost new
subscriber uptake, mobile airtime and data consumption.
The book value of TE’s stake in VE stood at EGP8.14 billion in 1H FY10, while we valued it atEGP13.3 billion using an earning discounted model, since we do not have VE’s detailed incomestatement to correctly assess what’s over or below the EBITDA, in order to value the companyusing a DCF model.
Cash & Interest Bearing Debt
Telecom Egypt had a total interest bearing debt of EGP1.04 billion at the end of FY09, and aslong term debt levels went down in 1H 2010, we expect the interest bearing debt to fall in FY10to EGP852 million.
TE is cash rich, even after distributing a EGP0.55/share or EGP939 million cash dividend onJune 30, 2010, its 1H FY10 financials showed over EGP1.74 billion of cash. Furthermore, inAugust 2010, Tarek Tantawy, TE’s CEO revealed that the company’s cash position has soaredto around EGP3.5 billion, essentially driven by the Vodafone Egypt, July 7, 2010, cash divi-dends in which TE’s portion amounted to EGP1.35 billion.
Net Income
TE has reported a 12% increase in 1H FY10 net income, mainly driven by a 16% increase ininvestment income and sharp drop in interest expense as most of the its long term debt is for-eign currency denominated, while a large EGP denominated loan had matured in September2009, which had an interest rate of corridor +1%. Furthermore, 1H FY10 income included a nonrecurring customs duty refund at the amount of EGP70 million.
We expect FY10 full year bottom line to record a yoy increase of 6.6% to EGP3.3 billion. Thegrowth will be driven by a mild increase in top line, essentially driven by cable revenues
growth. EBITDA is expected to decline by 4.2%, due to lower margins due to competition andcable’s revenues lower margin than those of TE’s conventional lines of business.
Also, an expected one off custom duty rebate in the amount of EGP150 million is expected toboost TE’s FY10 non-operating revenues. Furthermore, due to the sharp drop in interest ex-pense, and boost in cash, TE would record a net interest income of EGP132 million comparedto a net interest expense of EGP5 million in FY09.
5
TE reported a 15.6% growthin its investment income fromVE during 1H FY10, however,VE’s bottom line declined 9%over the same period
We valued TE’s stake in VE atEGP13.3 billion TE is practically debt free TE is estimated to has now
over EGP3.5 billion of cash

8/7/2019 Telecom Egypt 1H 10 - Jazira Capital
http://slidepdf.com/reader/full/telecom-egypt-1h-10-jazira-capital 6/10
8/7/2019 Telecom Egypt 1H 10 - Jazira Capital
http://slidepdf.com/reader/full/telecom-egypt-1h-10-jazira-capital 7/10
JAZIRA SECURITIES BROKERAGE September 20, 2010
TELECOM EGYPT Equity Research
7
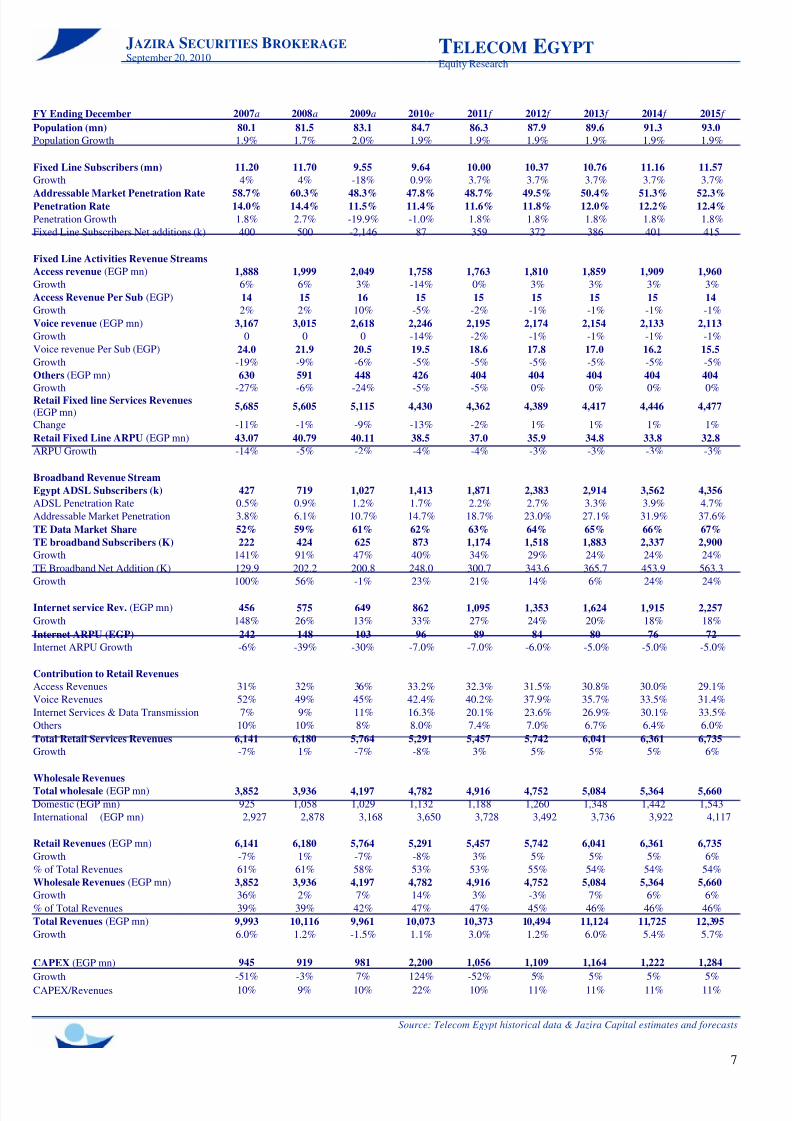
FY Ending December 2007a 2008a 2009a 2010e 2011f 2012f 2013f 2014f 2015f
Population (mn) 80.1 81.5 83.1 84.7 86.3 87.9 89.6 91.3 93.0
Population Growth 1.9% 1.7% 2.0% 1.9% 1.9% 1.9% 1.9% 1.9% 1.9%
Fixed Line Subscribers (mn) 11.20 11.70 9.55 9.64 10.00 10.37 10.76 11.16 11.57
Growth 4% 4% -18% 0.9% 3.7% 3.7% 3.7% 3.7% 3.7%
Addressable Market Penetration Rate 58.7% 60.3% 48.3% 47.8% 48.7% 49.5% 50.4% 51.3% 52.3%Penetration Rate 14.0% 14.4% 11.5% 11.4% 11.6% 11.8% 12.0% 12.2% 12.4%
Penetration Growth 1.8% 2.7% -19.9% -1.0% 1.8% 1.8% 1.8% 1.8% 1.8%
Fixed Line Subscribers Net additions (k) 400 500 -2,146 87 359 372 386 401 415
Fixed Line Activities Revenue Streams
Access revenue (EGP mn) 1,888 1,999 2,049 1,758 1,763 1,810 1,859 1,909 1,960
Growth 6% 6% 3% -14% 0% 3% 3% 3% 3%
Access Revenue Per Sub (EGP) 14 15 16 15 15 15 15 15 14
Growth 2% 2% 10% -5% -2% -1% -1% -1% -1%
Voice revenue (EGP mn) 3,167 3,015 2,618 2,246 2,195 2,174 2,154 2,133 2,113
Growth 0 0 0 -14% -2% -1% -1% -1% -1%
Voice revenue Per Sub (EGP) 24.0 21.9 20.5 19.5 18.6 17.8 17.0 16.2 15.5
Growth -19% -9% -6% -5% -5% -5% -5% -5% -5%
Others (EGP mn) 630 591 448 426 404 404 404 404 404
Growth -27% -6% -24% -5% -5% 0% 0% 0% 0%Retail Fixed line Services Revenues
(EGP mn)5,685 5,605 5,115 4,430 4,362 4,389 4,417 4,446 4,477
Change -11% -1% -9% -13% -2% 1% 1% 1% 1%
Retail Fixed Line ARPU (EGP mn) 43.07 40.79 40.11 38.5 37.0 35.9 34.8 33.8 32.8
ARPU Growth -14% -5% -2% -4% -4% -3% -3% -3% -3%
Broadband Revenue Stream
Egypt ADSL Subscribers (k) 427 719 1,027 1,413 1,871 2,383 2,914 3,562 4,356
ADSL Penetration Rate 0.5% 0.9% 1.2% 1.7% 2.2% 2.7% 3.3% 3.9% 4.7%
Addressable Market Penetration 3.8% 6.1% 10.7% 14.7% 18.7% 23.0% 27.1% 31.9% 37.6%
TE Data Market Share 52% 59% 61% 62% 63% 64% 65% 66% 67%
TE broadband Subscribers (K) 222 424 625 873 1,174 1,518 1,883 2,337 2,900
Growth 141% 91% 47% 40% 34% 29% 24% 24% 24%
TE Broadband Net Addition (K) 129.9 202.2 200.8 248.0 300.7 343.6 365.7 453.9 563.3
Growth 100% 56% -1% 23% 21% 14% 6% 24% 24%
Internet service Rev. (EGP mn) 456 575 649 862 1,095 1,353 1,624 1,915 2,257
Internet ARPU (EGP) 242 148 103 96 89 84 80 76 72
Internet ARPU Growth -6% -39% -30% -7.0% -7.0% -6.0% -5.0% -5.0% -5.0%
Contribution to Retail Revenues
Access Revenues 31% 32% 36% 33.2% 32.3% 31.5% 30.8% 30.0% 29.1%
Voice Revenues 52% 49% 45% 42.4% 40.2% 37.9% 35.7% 33.5% 31.4%
Internet Services & Data Transmission 7% 9% 11% 16.3% 20.1% 23.6% 26.9% 30.1% 33.5%
Others 10% 10% 8% 8.0% 7.4% 7.0% 6.7% 6.4% 6.0%
Total Retail Services Revenues 6,141 6,180 5,764 5,291 5,457 5,742 6,041 6,361 6,735
Growth -7% 1% -7% -8% 3% 5% 5% 5% 6%
Wholesale Revenues
Total wholesale (EGP mn) 3,852 3,936 4,197 4,782 4,916 4,752 5,084 5,364 5,660
Domestic (EGP mn) 925 1,058 1,029 1,132 1,188 1,260 1,348 1,442 1,543
International (EGP mn) 2,927 2,878 3,168 3,650 3,728 3,492 3,736 3,922 4,117
Retail Revenues (EGP mn) 6,141 6,180 5,764 5,291 5,457 5,742 6,041 6,361 6,735
Growth -7% 1% -7% -8% 3% 5% 5% 5% 6%
% of Total Revenues 61% 61% 58% 53% 53% 55% 54% 54% 54%
Wholesale Revenues (EGP mn) 3,852 3,936 4,197 4,782 4,916 4,752 5,084 5,364 5,660
Growth 36% 2% 7% 14% 3% -3% 7% 6% 6%
% of Total Revenues 39% 39% 42% 47% 47% 45% 46% 46% 46%
Total Revenues (EGP mn) 9,993 10,116 9,961 10,073 10,373 10,494 11,124 11,725 12,395
Growth 6.0% 1.2% -1.5% 1.1% 3.0% 1.2% 6.0% 5.4% 5.7%
CAPEX (EGP mn) 945 919 981 2,200 1,056 1,109 1,164 1,222 1,284
Growth-51% -3% 7% 124% -52% 5% 5% 5% 5%
CAPEX/Revenues 10% 9% 10% 22% 10% 11% 11% 11% 11%
Growth 148% 26% 13% 33% 27% 24% 20% 18% 18%
Source: Telecom Egypt historical data & Jazira Capital estimates and forecasts

8/7/2019 Telecom Egypt 1H 10 - Jazira Capital
http://slidepdf.com/reader/full/telecom-egypt-1h-10-jazira-capital 8/10
JAZIRA SECURITIES BROKERAGE September 20, 2010
TELECOM EGYPT Equity Research
8
FY Ending December 2007a 2008a 2009a 2010e 2011f 2012f 2013f 2014f 2015f
Vodafone Egypt Assumptions
Mobile Penetration 36% 50% 63% 71% 77% 83% 87% 90% 91%
Active Subscribers (mn) 29.1 40.6 52.7 60 67 73 78 82 85
Growth 56% 40% 30% 14% 11% 9% 7% 5% 4%
Mobinil 14.2 19.2 24.1 27.6 30.7 33.5 36.0 37.8 39.4Vodafone 12.5 16.8 22.2 25.3 28.2 30.8 33.0 34.8 36.2
Etisalat 2.4 4.6 6.4 7.3 7.9 8.5 8.9 9.2 9.3
Market Share
Mobinil 48.7% 47.3% 45.8% 45.8% 45.9% 46.0% 46.1% 46.3% 46.4%
Vodafone 42.9% 41.4% 42.1% 42.1% 42.2% 42.3% 42.4% 42.5% 42.6%
Etisalat 8.4% 11.4% 12.1% 12.1% 11.9% 11.7% 11.4% 11.2% 11.0%
Vodafone Rev. (EGP mn) 9,933 11,577 11,990 11,899 12,463 13,282 14,753 16,324 18,013
Growth 0 17% 4% -1% 5% 7% 11% 11% 10%
ARPU (EGP) 73 62 49 39.75 36.95 35.72 36.66 38.19 40.26
Growth -15% -14% -22% -19% -7% -3% 3% 4% 5%
Net profit (EGP mn) 2,820 2,918 3,216 3,032 3,112 3,284 3,647 4,036 4,453
Growth 12% 3% 10% -6% 3% 6% 11% 11% 10%
Net Profit Margin 28% 25% 27% 25% 25% 25% 25% 25% 25%
TE Valuation Breakdown Total (EGP
mn)Per Share % of Total
TE Standalone Value 19,965 11.7 60%
VE Value 13,288 7.8 40%TE Consolidated Valuation 33,253 19.5 100%
Source: Telecom Egypt historical data & Jazira Capital estimates and forecasts

8/7/2019 Telecom Egypt 1H 10 - Jazira Capital
http://slidepdf.com/reader/full/telecom-egypt-1h-10-jazira-capital 9/10
JAZIRA SECURITIES BROKERAGE September 20, 2010
TELECOM EGYPT Equity Research
9
Income Statement 2008a 2009a 2010e 2011f 2012f 2013f 2014f 2015f
Revenues 10,117 9,960 10,072 10,372 10,493 11,124 11,724 12,394
Growth 1.2% -1.5% 1.1% 3.0% 1.2% 6.0% 5.4% 5.7%
EBITDA 5,150 5,007 4,795 4,870 4,787 5,019 5,235 5,483
Growth -4.2% -2.8% -4.2% 1.6% -1.7% 4.8% 4.3% 4.7%
EBITDA Margin 50.9% 50.3% 47.6% 47.0% 45.6% 45.1% 44.7% 44.2%
Depreciation & Amortization (2,734) (2,731) (2,506) (2,581) (2,448) (2,329) (2,225) (2,137)
Reported EBIT 2,416 2,275 2,289 2,289 2,339 2,690 3,010 3,346
Non-Operating Items 1,073 1,258 1,414 1,409 1,520 1,722 1,937 2,168
Net Interest (203) (5) 132 273 422 559 700 833
Net Profit Before Tax 3,286 3,528 3,835 3,971 4,281 4,971 5,648 6,346
Income Tax (512) (453) (575) (596) (642) (746) (847) (952)
Net Profit After Tax 2,774 3,075 3,260 3,376 3,639 4,226 4,800 5,394
Extraordinary Items 21 (18) 50 - - - - -
Minority Interest (6) (5) (6) (6) (6) (7) (8) (9)
Net Income 2,790 3,051 3,304 3,370 3,632 4,218 4,792 5,385
Non-Appropriation Items (251) (252) (272) (278) (299) (348) (395) (444)
Net Attributable Income 2,539 2,800 3,031 3,092 3,333 3,870 4,397 4,941
EPS 1.5 1.6 1.8 1.8 2.0 2.3 2.6 2.9
Growth 8.4% 10.3% 8.3% 2.0% 7.8% 16.1% 13.6% 12.4%
Balance Sheet 2008a 2009a 2010e 2011f 2012f 2013f 2014f 2015f
Cash & Marketable Securities 2,735 2,453 4,359 6,192 7,879 9,638 11,286 12,845
Trade Receivables-Net 2,965 2,821 2,795 2,879 2,912 3,087 3,254 3,440
Inventory 473 414 419 431 436 462 487 515
Other Current Assets 1,869 1,532 1,550 1,596 1,614 1,711 1,804 1,907
Total Current Assets 8,042 7,220 9,122 11,097 12,842 14,899 16,831 18,707
Net Fixed Assets 17,531 16,086 15,780 14,255 12,915 11,750 10,747 9,894
Other LT Assets 8,297 9,155 8,177 8,388 8,610 8,858 9,131 9,434
Non-Current Assets 25,828 25,241 23,957 22,642 21,525 20,607 19,879 19,327Total Assets 33,870 32,461 33,079 33,740 34,367 35,506 36,709 38,034
Short Term Bank Debt & CPLTD 1,520 186 140 71 68 68 68 68
Account Payable 477 488 493 508 514 545 574 607
Dividends Payable 2,471 2,472 2,492 2,836 3,117 3,620 4,112 4,621
Other Current Liabilities 3,128 3,263 3,199 3,072 2,933 2,970 2,998 3,042
Total Current Liabilities 7,595 6,408 6,324 6,488 6,633 7,203 7,753 8,338
Long-Term Debt & Bonds 1,626 858 712 638 568 497 427 356
Other LT Liabilities 487 439 475 512 550 591 635 682
Non-Current Liabilities 2,113 1,296 1,187 1,150 1,118 1,088 1,061 1,038
Paid in Capital 17,071 17,071 17,071 17,071 17,071 17,071 17,071 17,071
Total Shareholders' Equity 24,161 24,757 25,569 26,102 26,617 27,215 27,895 28,659
Net Debt (adjusted with Div. Payable & Cash) 2,882 1,063 (1,015) (2,646) (4,127) (5,453) (6,679) (7,800)
Working Capital 447 812 2,799 4,609 6,209 7,696 9,078 10,369
Free Cash Flow 2008a 2009a 2010e 2011f 2012f 2013f 2014f 2015f
NOPLAT 1,809 1,755 1,776 1,744 1,757 2,017 2,248 2,493
Depreciation 2,734 2,731 2,506 2,581 2,448 2,329 2,225 2,137
Gross Cash Flow 4,543 4,486 4,282 4,326 4,206 4,346 4,473 4,630
Gross Investments 103 (501) (2,505) (1,325) (1,305) (1,426) (1,479) (1,558)
Operating Free Cash Flow Excluding Intangibles 4,646 3,985 1,778 3,001 2,901 2,920 2,994 3,072
Investment in Goodwill & Intangibles 69 27 - - - - - -
Operating Free Cash Flow Including Intangibles 4,715 4,012 1,778 3,001 2,901 2,920 2,994 3,072
Non -Operating Cash Flow (643) 665 915 (342) 32 288 714 1,126
Free Cash Flow 4,072 4,677 2,693 2,660 2,933 3,208 3,708 4,198
Figures are in EGP mn
Historical & forecasted financials
Source: Telecom Egypt financials & Jazira Capital estimates and forecasts

8/7/2019 Telecom Egypt 1H 10 - Jazira Capital
http://slidepdf.com/reader/full/telecom-egypt-1h-10-jazira-capital 10/10
10
Disclaimer• Jazira Securities Brokerage (JSB) is a licensed Egyptian Stock Market Broker, regulated by the Egyptian Financial Service
Authority.
• Opinions, estimates and projections contained in the research reports or documents are of the author as of the date published
and are subject to change without notice
• JSB research reports or documents are not, and are not to be construed as, an offer to sell or solicitation of an offer to buy
any securities.
• Unless otherwise noted, all JSB research reports and documents provide information of a general nature and do not address
the circumstances of any particular investor.
• Neither JSB nor its mother company (Jazira Capital), or any of its affiliates accept liability whatsoever for any investment
loss arising from any use of the research reports or their contents.
• The information and opinions contained in JSB research reports or documents have been compiled or arrived at from sources
believed reliable but no representation or warranty, express or implied, is made as to their accuracy or completeness.
• JSB, Jazira Capital or any of its affiliates and/or their respective officers, directors or employees may from time to time ac-quire, hold or sell securities mentioned herein as principal or agent.
• JSB research reports and all the information, opinions and conclusions contained in them are protected by copyright.
• The research reports or documents may not be reproduced or distributed in whole or in part without express consent of JSBResearch. JSB research reports or documents, recommendations and information are subject to change without further notice.
JAZIRA SECURITIES BROKERAGE
Arkadia Mall,Cornich El Nil St., 8th Floor,Cairo - EgyptTel: +202 2578 09 31-2Fax: +202 2578 09 33www.jaziracapital.com
Jazira Securities Online Trading
You can trade online through Jazira Securitiesonline trading portal ... Please contact our customer Service representa-tives for further information..
JSB Contacts Title Land Line Mobile
Hussein El Sawalhy, CFA Managing Director +202 2578 0931/2 +2010 1410 690
Ahmed Helmy Head of Sales & Trading +2010 1004 482
Mohamed Fahmy Head of Research +2012 2157 312
Mohamed Gaber Online Trading Tech. Support +2012 1615409
+202 2576 0188
+202 2578 0931/2
+202 2578 09 31/2
George Mansour Customer Service +202 2578 09 31/2 +2012 9214069
Doaa Osman Customer Service +202 2578 09 31/2 +2012 7552436
JAZIRA SECURITIES BROKERAGE September 20, 2010
TELECOM EGYPT Equity Research