TEI of IBM Information Management Solutions
42
A Forrester Total Economic Impact™ Study Commissioned By IBM Project Directors: Jon Erickson Adrienne Capaldo Project Contributor: Rudy Hernandez October 2014 The Total Economic Impact™ Of IBM’s Information Management Solutions An Analysis Examining The Value Of IBM’s Big Data Management Solutions
-
Upload
ibm-analytics -
Category
Technology
-
view
138 -
download
0
Transcript of TEI of IBM Information Management Solutions

A Forrester Total Economic
Impact™ Study
Commissioned By
IBM
Project Directors:
Jon Erickson
Adrienne Capaldo
Project Contributor:
Rudy Hernandez
October 2014
The Total Economic
Impact™ Of IBM’s
Information Management
Solutions An Analysis Examining The Value Of IBM’s Big Data Management Solutions

Table Of Contents
Executive Summary .................................................................................... 3
Disclosures .................................................................................................. 5
TEI Framework And Methodology ............................................................ 6
Market Overview .......................................................................................... 7
Analysis ...................................................................................................... 10
Financial Summary ................................................................................... 36
IBM Information Management Solutions: Overview ............................. 37
Appendix A: IBM Products And Use Cases........................................... 38
Appendix B: Composite Organization Description .............................. 39
Appendix C: Total Economic Impact™ Overview ................................. 40
Appendix D: Glossary ............................................................................... 41
Appendix E: Endnotes .............................................................................. 42
ABOUT FORRESTER CONSULTING
Forrester Consulting provides independent and objective research-based
consulting to help leaders succeed in their organizations. Ranging in scope from a
short strategy session to custom projects, Forrester’s Consulting services connect
you directly with research analysts who apply expert insight to your specific
business challenges. For more information, visit forrester.com/consulting.
© 2014, Forrester Research, Inc. All rights reserved. Unauthorized reproduction is strictly prohibited.
Information is based on best available resources. Opinions reflect judgment at the time and are subject to
change. Forrester®, Technographics
®, Forrester Wave, RoleView, TechRadar, and Total Economic Impact
are trademarks of Forrester Research, Inc. All other trademarks are the property of their respective
companies. For additional information, go to www.forrester.com.

3
Executive Summary
As big data initiatives become less of an abstract thought and more of a concrete reality, businesses are focusing on how
they can leverage big data solutions to solve their real business problems. IBM commissioned Forrester Consulting to
conduct a Total Economic Impact™ (TEI) study and examine the potential return on investment (ROI) enterprises may
realize by leveraging IBM Information Management solutions focusing on big data within their environment. The purpose of
this study is to provide readers with a framework to evaluate the potential financial impact of solving important business
problems through leveraging IBM Information Management solutions. Forrester focused on three specific big data use cases
IBM has developed to help its customers solve important business problems:
› Enhanced 360-Degree View Of The Customer: The purpose of this use case is to extend existing customer views by
incorporating additional internal and external information sources and gaining a more complete understanding of
customers.
› Security and Intelligence Extension: This use case looks to create enhanced intelligence and surveillance insight to
prevent, predict, and mitigate cyberattacks and physical attacks in real time.
› Data Warehouse Modernization: This use case focuses on the modernization of the data warehouse with new
technology, including in-memory computing, Hadoop, appliances, social data, telematics, and the internet of things, while
building confidence in existing data
Each of these use cases is supported by specific IBM Information Management solutions. For a full listing of the IBM
products and solutions that support each use case, please see Appendix A. This study illustrates the value that organizations
see by increasing tool adoption and standardizing on a common IBM tool set to manage their big data problems. Note that
these use cases are not meant to be in a prioritized or sequential order. Forrester encourages readers to identify which use
cases make the most sense for their organization given the challenges they face.
To better understand the benefits, costs, and risks associated with these three use cases, Forrester interviewed existing IBM
customers standardizing on IBM’s Information Management solutions, focusing on big data use cases to help leverage
advanced analytics and improve business processes and strategic decision-making. Forrester also conducted an online
survey of 379 global line-of-business and IT professionals involved in big data management strategy to better understand the
current market impact, attitudes, and behaviors with regard to the big data management market space.
FIGURE 1
Financial Summary Showing Five-Year Risk-Adjusted Results
ROI: 148%
Total benefits (present value):
$31,213,638
Source: Forrester Research, Inc.
Prior to investing in IBM’s Information Management solutions, customers had worked with multiple vendors and ad hoc
applications to support their business needs in regards to customer understanding, security and fraud, and the data
warehouse. However, these organizations felt they lacked the tools and capabilities to fully leverage structured, unstructured,
and streaming data sources across their individual business units, and felt they were not taking advantage of new
technologies and modern approaches to get the most out of their data environments. The existing information management
tools were siloed and ad hoc without a coherent information management strategy for big data opportunities. With the

4
implementation of IBM’s Information Management solutions, customers were able to create visibility into their data and
introduce real-time analytic capabilities to meet their business objectives.
Our interviews with six existing customers, our online survey of 379 organizations across the globe, and subsequent financial
analysis found that a representative, composite organization based on these interviewed and surveyed organizations
experienced the risk-adjusted ROI, benefits, and costs for the three targeted use cases shown in Figure 1.1 See Appendix A
for a description of the composite organization.
› Benefits. A composite organization experienced the risk-adjusted benefits for each use case shown in Figure 2 from its
investment in an Information Management solution from IBM.
FIGURE 2
Benefits Summary And Five-Year Risk-Adjusted Present Value Results
Source: Forrester Research, Inc.
› Costs. The composite organization experienced the following risk-adjusted costs, encompassing all three use cases:
• Software costs.
• Hardware costs associated with additional software.
• Planning and implementation.
• Costs associated with professional services, internal support, and change management.
Enhanced 360-Degree View of the Customer: $23,028,754
• Increased revenue per customer.
• Increased customer acquisition.
• Savings due to reduced cost of creating marketing campaigns.
• Cost benefits associated with a decrease in customer attrition.
• Improved marketing employee productivity.
• Reduced IT spend.
Security and Intelligence Extension: $3,184,876
• Improved process efficiency in meeting security requirements.
• Reduced likelihood of regulatory fines.
• Reduced cost to recover from a breach.
• Improvement in fraud detection rates.
• Improved efficiency of fraud management.
Data Warehouse Modernization: $5,000,008
• Reduced cost to store and process persisted data.
• Reduced cost of infrastructure due to increased data warehouse performance and speed.
• Increased data warehouse analytic capabilities.

5
Disclosures
The reader should be aware of the following:
› The study is commissioned by IBM and delivered by Forrester Consulting. It is not meant to be used as a competitive
analysis.
› Forrester makes no assumptions as to the potential ROI that other organizations will receive. Forrester strongly advises
that readers use their own estimates within the framework provided in the report to determine the appropriateness of an
investment in IBM’s Information Management solutions.
› IBM reviewed and provided feedback to Forrester, but Forrester maintains editorial control over the study and its findings
and does not accept changes to the study that contradict Forrester’s findings or obscure the meaning of the study.
› IBM provided the customer names for the interviews but did not participate in the interviews. Survey responses were
sourced by Forrester and include responses from the United States, Brazil, France, Germany, China, and India.

6
TEI Framework And Methodology
INTRODUCTION
From the information provided in the interviews, Forrester has constructed a Total Economic Impact (TEI) framework for
those organizations considering implementing IBM/Big Data Management Solutions. The objective of the framework is to
identify the cost, benefit, flexibility, and risk factors that affect the investment decision.
APPROACH AND METHODOLOGY
Forrester took a multistep approach to evaluate the impact that IBM/Big Data Management Solutions can have on an
organization (see Figure 3). Specifically, we:
› Interviewed IBM marketing, sales, and/or consulting personnel, along with Forrester analysts, to gather data relative to
IBM’s Information Management Solutions and the marketplace for information management solutions.
› Interviewed eight organizations currently using IBM/Big Data Management Solutions to obtain data with respect to costs,
benefits, and risks.
› Conducted an online survey of 379 organizations in the US, Brazil, Western Europe, China, and India to evaluate their big
data management strategies in our three specific use cases. Survey participants included line-of-business and IT
professionals who make, influence, or have knowledge around decisions related to big data management strategy from
firms with 500 or more employees. The study was conducted in July 2014.
› Designed a composite organization based on characteristics of the interviewed organizations (see Appendix B).
› Constructed a financial model representative of the interviews and online survey using the TEI methodology. The financial
model is populated with the cost and benefit data obtained from the interviews and online survey as applied to the
composite organization.
› Risk-adjusted the financial model based on issues and concerns the interviewed organizations highlighted in interviews.
Risk adjustment is a key part of the TEI methodology. While interviewed organizations provided cost and benefit
estimates, some categories included a broad range of responses or had a number of outside forces that might have
affected the results. For that reason, some cost and benefit totals have been risk-adjusted and are detailed in each
relevant section.
Forrester employed four fundamental elements of TEI in modeling IBM/Big Data Management Solutions’ service: benefits,
costs, flexibility, and risks.
Given the increasing sophistication that enterprises have regarding ROI analyses related to IT investments, Forrester’s TEI
methodology serves to provide a complete picture of the total economic impact of purchase decisions. Please see Appendix
C for additional information on the TEI methodology.
FIGURE 3
TEI Approach
Source: Forrester Research, Inc.
Perform
due diligence
Conduct customer interviews/online
survey
Design composite
organization
Construct financial model using TEI
framework
Write
case study

7
Market Overview
THE CURRENT STATE OF INFORMATION MANAGEMENT IN THE MARKETPLACE
In order to better understand the current state of information management solutions, with a particular focus on big data
initiatives, Forrester conducted an online survey of 379 organizations in the US, Brazil, Western Europe, China, and India to
evaluate their attitudes and feelings related to the three specific use cases. The study focused on organizations’ behavior
and their attitudes toward the use of information management systems for their big data strategy as it pertains to
understanding of the customer, enterprise security and intelligence, and modernization of the data warehouse. From the
survey, we discovered:
Enhanced 360-Degree View Of The Customer
› The need to identify and proactively retain the best customers is a key reason organizations use the 360-
Degree View Of The Customer use case. When asked what was the primary reason their organization decided
to use information management systems to support big data use cases for acquiring, growing, and retaining
customers, 42% of respondents highlighted the need to both understand who the best customers are and what
makes them satisfied customers as key drivers for this use case. Along with understanding the customer, they
also want to be able to understand the relationships and influencer networks for these key customers.
Organizations also identified that they need to make effective use of the customer data they already have access
to (38%), as well as be better able to improve the personalization of customer engagement (37%). These and
other drivers are highlighted in Figure 4.
FIGURE 4
Top Five Drivers For Enhanced 360-Degree View Of The Customer Use Case
Base: 312 360-Degree View Of The Customer decision-makers
Source: Forrester Research, Inc.
› Increasing the revenue per customer is a key metric when measuring the success of these initiatives. Seventy-six
percent of respondents stated that when their organizations want to improve the value of a customer, they want to be able
to see an increase in revenue per customer to prove these initiatives have been a success. Sixty-nine percent of
organizations also reported that they look to increased customer acquisition, and 54% look for an improved speed in
acquiring new customers as a measurement of success.
“What are the primary reasons your organization decided to use big data management solutionsfor acquiring, growing, and retaining customers? Please rank the top three.”
We need a method to analyze customer sentimentand behavior across digital channels
10% 12% 7%
We want to provide information services tocustomers to help them in their businesses
8% 11% 11%
We want to improve our ability to personalizecustomer engagement
14% 12% 11%
We need to make effective use of the customerdata we have already collected
16% 11% 11%
We want to identify and proactively retain our bestcustomers and understand relationships/
influencer networks for key customers13% 16% 13%
Rank 1 Rank 2 Rank 3

8
› Driving improved employee efficiency is also crucial to the success of a big data initiative focusing on the
customer. The surveyed organizations also identified that these initiatives are successful when they improve the internal
processes of the organization. Specifically, 73% of respondents look to make employees more efficient, 66% hope to
reduce the cost to reach the customer, and 48% want to reduce the cost of making these initiatives work.
Security and Intelligence Extension
› Organizations want to be more proactive with their security measures. When we looked at why organizations used
information management systems to support big data projects focused on maintaining and improving enterprise security,
over 60% of organizations stated that they wish to be more proactive with their security measures. We also heard from
58% of organizations that they want a more cost-effective solution than their current enterprise security solutions. Fifty-
seven percent of organizations told us they are also facing new regulations and compliance requirements that mean they
need to update how their organizations handle security. These and other drivers are highlighted in Figure 5.
FIGURE 5
Top Five Drivers For Security and Intelligence Extension Use Case
Base: 315 Security and Intelligence Extension decision-makers
Source: Forrester Research, Inc.
› Improving the process efficiency of security measures is key to the success of organizations’ big data initiatives.
When asked how they measure the success of their big data initiatives for their enterprise security, an overwhelming 82%
of organizations spoke of the need to improve the process efficiency of meeting the new regulations and compliance
requirements these organizations face. Forty-four percent of organizations also measure success through their ability to
reduce the likelihood of being hit with regulatory fines and penalties from inadequate security measures at their company.
Additionally, 41% of companies also focus on the reduction in fines they actually needed to pay by using a big data
initiative for their enterprise security.
Data Warehouse Modernization
› Organizations are driven to increase the performance and speed of their data warehouse. With the increase in the
amount and variety of data that the warehouse infrastructure is being asked to handle, nearly half of organizations
reported that they feel the need to increase the performance and speed of their data warehouse to provide the business
the ability to create better business insights. Along with better performance and speed, 43% of organizations also want to
create a more agile and flexible data warehouse to optimize the warehouse infrastructure and ultimately save money.
“What are the primary reasons your organization decided to use big data managementsolutions for maintaining and improving enterprise security?”
We are concerned about brand reputation lossand fallout from a potential data breach
We wish to prevent a future data breach
We need to improve security in the face of newregulations/compliance requirements
We want to find a more cost-effective solutionthan our current enterprise security
We wish to be more proactive with our security measures
Rank 1 Rank 2 Rank 3
12% 16% 13%
12% 15% 16%
20% 19% 18%
23% 17% 18%
23% 20% 20%

9
› Increasing the analytic capabilities of the data warehouse creates more value for the business. A critical driver for
over a third of our surveyed organizations using big data technology to improve the warehouse is to create more value for
the business through advances in analytic capabilities. With so many new data sources, organizations need to prepare the
data from all these sources so they can use it to strengthen their analytic capabilities to ensure the business can take
advantage of the new insights this data creates. Figure 6 below illustrates these drivers.
FIGURE 6
Top Five Drivers For Data Warehouse Modernization Use Case
Base: 327 Data Warehouse Modernization decision-makers
Source: Forrester Research, Inc.
“What are the primary reasons your organization decided to use big data managementsolutions for modernizing data warehouse infrastructure and capabilities?”
We want to reduce the cost to storeand/or process persisted data
We want to streamline processes and ultimately reduceperson-hours spent on maintaining the data warehouse
We want to increase data warehouse analytic capabilities
We want to increase data warehouse agility/flexibility
We want to increase data warehouse performance and speed
Rank 1 Rank 2 Rank 3
14% 11% 12%
12% 13% 12%
16% 10% 12%
11% 16% 16%
13% 18% 18%

10
Analysis
COMPOSITE ORGANIZATION
For this study, Forrester conducted a broad market survey of 379 organizations across the globe as well as a total of six
interviews with representatives from the following companies, which are using IBM tools to support our three main big data
use cases:
› A European-based government agency.
› A US-based health insurance provider.
› Two US-based insurance and financial services organizations.
› Two European-based financial services organizations.
Based on the interviews and supported by the survey data, Forrester constructed a TEI framework, a composite company,
and an associated ROI analysis that illustrates the areas financially affected from an investment in big data initiatives. The
composite organization that Forrester synthesized from these results represents an organization with the following
characteristics:
› A US-based financial organization with offices worldwide, offering retail financial products like credit cards, personal
banking accounts, and loans.
› 88,000 employees worldwide.
› A total annual revenue of $40 billion.
› 28 million customers worldwide.
After researching a number of solutions and partners, the
composite organization chose to work with IBM for its big data
initiatives.
Similar to our interviewed organizations, the composite
organization faced an enormous amount of complex, detailed
data coming from a variety of sources, and it was having
difficulty finding a way to not only process the data, but be able
to use it in a way that would support the different initiatives of the
organization. Prior to the investment, the composite organization
was using multiple vendors and ad hoc applications to support
its business needs in regards to customer understanding,
security and fraud, and the data warehouse. The goal of the overall big data project was to increase the maturity, visibility,
and access to data in these three use cases. The primary driver for the organization was to better leverage its data and
support the business initiatives across the three key use cases outlined below. This is part of the organization’s strategy
around being able to better leverage big data opportunities:
› Realizing the complexity of the work required, the representative organization saw this as a transformational process over
five years to improve its big data capabilities. The first two years represent a rollout period, with many benefits beginning to
hit in years 2 and 3, and continuing into Year 5.
› Prior to the investment, the organization felt it did not have the tools and capabilities to fully leverage both structured and
unstructured data across individual business units. The existing information management tools were siloed and ad hoc
without a coherent information management strategy for capitalizing on big data opportunities.
“Success will be being able to
appropriately manage and
take advantage of these
incoming data sets and pivot
that into business value.”
~A US-based insurance and financial services
organization

11
› As part of its big data initiative, our composite organization chose to focus its initial big data projects in one region of the
US.
› For the purposes of this study, we will be focusing on this region. This region makes up about one-fifth of the
organization’s US annual revenue and supports 4.2 million customers.
› This region has an annual IT budget of $240 million, with roughly $16.8 million devoted to data management and
governance.
› The goal was to use big data solutions for each of the three use cases in different areas of the company:
• Leverage big data insights to acquire, grow, and retain customers through the Enhanced 360-Degree View Of The
Customer use case. The representative organization used the following IBM solutions to support this use case:
InfoSphere Master Data Management, IBM InfoSphere BigInsights, IBM InfoSphere Streams, IBM InfoSphere
Information Server for Data Integration, IBM InfoSphere Information Server for Data Quality, and IBM Data
Warehousing (DB2/Informix).
• Use information and knowledge gained from big data in order to improve security throughout the organization with
the Security and Intelligence Extension use case. In support of this use case, the composite organization used IBM
QRadar Security Intelligence Platform, IBM InfoSphere BigInsights, IBM InfoSphere Streams, IBM PureData for
Analytics (Netezza), IBM InfoSphere Guardium, and IBM InfoSphere Optim.
• Optimize and update the data warehouse in order to improve performance and better support big data capabilities
through the Data Warehouse Modernization use case. The IBM products used as part of this initiative include IBM
InfoSphere BigInsights, IBM InfoSphere Streams, IBM Watson Explorer IBM’s information, IBM PureData for
Analytics, IBM Data Warehousing (DB2/Informix), IBM DB2 with BLU Acceleration, IBM InfoSphere Information
Server, and other InfoSphere information integration and governance (IIG) offerings.
INTERVIEW HIGHLIGHTS
Along with the online survey, the findings from the interviews were the primary driver for the analysis. While the business
challenges our organizations faced varied, several common
themes were uncovered across our interviews.
The interviews revealed a common number of drivers for why
companies needed to invest in information management solutions
to meet their big data initiatives:
› There is a greater variety and complexity of structured and
unstructured data available to the organizations than ever
before. In each of our interviews, the organizations discussed
the amount of structured and unstructured data that they are
faced with at their company. As one organization discussed: “We
offer a wide variety of services, and we have more than 150
different line[s]-of-business applications, and they all have data
we need on them. And they are all sort of distinct functional
systems that do particular things; we need all that data.”
The organizations understood that this data was crucial to their
success, but they realized that they lacked the ability internally to
make sense of it and turn it into valuable data. “For instance, a
traditional DBMS doesn’t lend itself to the huge amount of
unstructured data that we are beginning to deal with. Success
“And if people had the visibility
into the full picture, they
would realize that the risk to a
particular [client] was much
higher than in their own
particular perspective of the
data.”
~A European-based government agency
discussing the importance of having complete
visibility into the available data

12
will be being able to appropriately manage and take advantage of these incoming data sets and pivot that into business
value.” They understood that getting this data into a solution that would help them become more successful was key for
them to remain competitive in their various industries.
› They needed visibility into their existing data to build out the best business insights. From our interviews, we heard
over and over again that organizations want better visibility into their distinct data sources. The organizations are looking
for ways to pull valuable insights from these sources to help them make the best business decisions for their companies.
We heard from these organizations that, prior to their investments, they lacked visibility into these different data sources,
and it hurt their abilities to make real-time business decisions.
As a Forrester analyst discussed, “Customer information is typically distributed not only across various product-specific
applications and data stores but also across fragmented channel solutions.”2 One of our interviews discussed how lack of
visibility into the company’s data not only creates issues for creating value for the company, but also introduces the
dangers of poor data quality and data governance: “The way our data was organized, people only know where to find a
small amount of the data they could actually have access to. If they start looking at all these different data environments
and people are changing data in one place, and not in others . . . you start losing the visibility into what’s happening.” In
another interview, an organization focused on providing governmental services summed up the need for better visibility
into existing data well: “One of the things that has been a real driver to getting technology was the issue that different
services working with a [client] didn’t know what other services were involved, and there was a breakdown in terms of
communication. And if people had the visibility into the full picture, they would realize that the risk to a particular [client]
was much higher than in their own particular perspective of the data.”
› Organizations require real-time business insights to stay
competitively ahead. Another main driver that came up for many
organizations, regardless of the specific business challenge they
faced, was the need for real-time analytics to support their business
decisions. One organization, focusing on their enterprise security
and intelligence needs, said to us: “We need a way to monitor
database activity and monitor who is accessing and using our most
sensitive data. While we did have some homegrown programs out
there that could report on this, we found that we could not get that
information in real time, and we needed some better tools or
capabilities in order to monitor that activity in real time and do it
more efficiently.” While in this case, unwarranted access and data
breaches were at stake, regardless of the challenge these organizations faced, they understood that real-time business
insights could help them make better business decisions to improve customer satisfaction, improve enterprise security,
and understand how to optimize their warehouse.
› Addressing their big data business challenges was often about protecting their brand perception. The interviewed
organizations mentioned a variety of ways that addressing their big data business challenges helped them to protect their
brand, whether it was creating better, more targeted marketing campaigns that, in turn, improve customer satisfaction, or
building out the security of an organization. For example, using big data insights can bring a competitive advantage to
banks and financial service companies, providing them with insights to create better products and provide higher levels of
customer service.3 This can be applied to a variety of industries, all of which can use big data insights to become more
customer-focused and competitive in their specific markets. For many organizations, big data provided them with a more
secure enterprise, allowing them to prove to their customers how they were, in turn, protecting them. As one organization
told us “Telling our customers about our security measures, people have a good feeling for our company because they
know we are going in-depth for security. Security is a very hot topic among our customers, and we are able to take a
strong position on security.”
“The way IBM’s products are
sold as a suite and designed to
work together — that brings
major value to us.”
~A US-based health insurance provider

13
Our interviews uncovered that IBM’s Information Management solutions were selected to help our interviewed organizations
with their big data initiatives, not only because IBM helped these organizations with their above goals, but also due to IBM’s
reputation as a solid partner. In addition, IBM’s Information Management solutions helped these organizations realize
additional benefits due to IBM’s ability to support and solve multiple big data challenges and use cases, as well as how well
IBM’s tools work together to support business goals.
The interviews revealed that IBM’s Information Management solutions were selected because:
› IBM has a reputation as a solid partner, with easy-to-use products. For each of our organizations, their investments to
meet their big data initiatives were seen as long-term investments. Our interviewees discussed that they were comfortable
moving forward with IBM due to its reputation as a strong partner and its ability to understand the variety of business
challenges these organizations are faced with. One organization said: “We have a great relationship with IBM. From an IT
perspective, they understood our needs, and their capabilities were able to fill in the gaps in our environment.” Another
organization shared with us: “I think our environment is pretty complex — I think all organizations think their environment is
complex. Having a relationship with IBM where they understand how things are done here, and they kind of know what our
environment looks like, I think that definitely helped us as well.” Another organization, when discussing its process to find a
partner for its big data challenges, said: “We find that IBM’s products are easy to use, and that’s a key factor for us. Some
of the other products, it’s a nightmare to create rules, deploy rules, and so on — for us, that would have been such a waste
of time. Working with IBM saves our time and ensures our performance remains high.” Organizations also felt that working
with a well-respected vendor like IBM reduced their overall risk when entering into such a long-term initiative. “On its own,
just working with IBM reduces our risk by working with a respected vendor. It’s assuring; we don’t have to worry.”
› Investing in one big data use case opens the door to support additional use cases and do more with big data.
When an organization comes to IBM for a specific use case, it quickly finds it can apply its learnings, knowledge, and
investment to support other use cases. One company we spoke with that was initially very focused on the Security and
Intelligence Extension use case was able to utilize IBM’s tools to do an overhaul on its data warehouse and be better able
to support all areas of the company. Another organization, whose main focus was the complete 360-degree view of the
customer, was able to manipulate its data in order to detect, in real time, potential fraudulent activities. “We have all these
different silos of data that are robust on their own, but they sit separate. Bringing all this data together brings us more
value. Our data teaches us about our customer; it also exposes all kinds of risk and exposure considerations that will
boggle the mind, where we can go with this data. Fraud protection is a big one.” For another organization, this reason
alone was the main selling point to invest in the technology: “Initially we did not have the budget for this. But then, when
you start to combine this with other areas of the company that can use this data, particularly in debt collection and fraud,
the business case for bringing all of the customer data together [with these solutions] was quite stacked.”
› Organizations found using multiple IBM products together to be the best way to support business goals. A key
benefit of working with IBM that the organizations discussed was the value of the IBM products when the tools are working
together. Our organizations found that they were able to do more to meet their big data challenges by creating a solution
from IBM’s portfolio of products. According to one organization: “When selecting a vendor, I think one of the things to
consider is the way that IBM’s products work together. I think the way IBM’s products are sold as a suite and designed to
work together, that brings major value to us. It’s not just about picking the one singular best product, but understanding
how those products integrate together and add more value.” One organization told of us of its struggle with multiple
vendors and how it found the best solution to its problem through an investment in IBM: “We are looking for something that
we can deal with large amounts of data, deal both analytically and transactionally, and is at the same time easy to roll out
insights and integrate with business processes — that’s where we need to be. If we throw this on [different tools], well, it
doesn’t quite meet the analytical side, or it doesn’t meet the nonfunctional requirements. We need multiple tools to work
together.” One organization summed up nicely why it found IBM to be the best fit for its big data challenges: “Because of
the best of suite point-of-view, the interoperability, the integration capabilities, and the benefits of partnering with IBM, they
are certainly the top vendor for us.”

14
BENEFITS
The composite organization experienced a number of quantified benefits in this case study. Benefits were seen across three
business initiatives, as follows:
Enhanced 360-Degree View Of The Customer
› Increased revenue per customer.
› Increase customer acquisition.
› Savings due to reduced cost of creating marketing campaigns.
› Cost benefits associated with a decrease in customer attrition.
› Improved marketing employee productivity.
› Reduced IT spend.
Security and Intelligence Extension
› Improved process efficiency in meeting security requirements.
› Reduced likelihood of regulatory fines.
› Reduced cost to recover from a breach.
› Improvement in fraud detection rates.
› Improved efficiency on fraud management.
Data Warehouse Modernization
› Reduced cost to store and process persisted data.
› Reduced cost of infrastructure due to increased data warehouse performance and speed.
› Increased data warehouse analytic capabilities.
Across each of these use cases, another important benefit uncovered was an increase in both customer satisfaction and
employee satisfaction. While customer and employee satisfaction depend on a number of factors, the impact of these
improvements should be considered when considering a big data management project.
Note that these use cases are not meant to be in a prioritized or sequential order. Forrester encourages readers to identify
which use cases make the most sense for their organization given the challenges they face.
Enhanced 360-Degree View Of The Customer
Many banks understand big data’s “vital role in winning and retaining customers”4; the interviews with IBM’s clients unveiled
that this is very accurate. Organizations understand the importance of how a clearer view into customer analytics empowers
them to make smarter business decisions and ultimately improve the bottom line. Similar to our interviewed organizations
and survey respondents, the composite organization implemented IBM Information Management solutions in order to
leverage big data insights to better inform marketing campaigns to acquire new customers and grow and retain existing
customers. The IBM products the organization used include InfoSphere Master Data Management, IBM InfoSphere
BigInsights, IBM InfoSphere Streams, IBM InfoSphere Information Server for Data Integration, IBM InfoSphere Information
Server for Data Quality, and IBM Data Warehousing (DB2/Informix). The composite organization experienced a number of

15
quantifiable benefits as part of this initiative to better leverage its data to understand customers. The risk-adjusted present
value total benefit resulting from the Enhanced 360-Degree View Of The Customer use case over the five years was
$23,028,754. See the section on Risks for more detail.
While this section of the study focuses on improvement for the marketing team in general, it is important to note that these
insights into customer behavior have an impact on a wide variety of functional areas, from customer service to product
development, and creating an enhanced single view of the customer helps the business improve how it serves customers.
Increased Revenue Per Customer
A key contributor to the measurable success of the big data initiatives is the creation of a 360-degree view of the customer.
Specifically, interviewed organizations and the broader survey respondents indicated that they were using big data to
increase the revenue per customer. Through its investment in IBM’s Information Management solutions, the representative
organization’s marketing team was able to create real-time, advanced analytics from a greater variety of structured and
unstructured data, allowing the creation of a single cohesive view of its customer. The marketing team was able to use these
new insights in order to better understand what drives its existing customers to invest in additional retail financial products.
Access to this data enabled the marketing team to enhance its marketing campaigns, creating more targeted and impactful
materials that resonate better with buyers. The result is an increase in the revenue earned per existing customer.
The composite organization has roughly 4.2 million customers in the region where it rolled out this initiative. That number
increases by an average of 5% year over year. However, only a certain number of those customers are affected by this big
data project, increasing to 15% of the total customers over a five-year period. The average yearly value of an existing
customer is $1,800, with a gross margin of 13%.
As use of IBM’s Information Management solutions matures, the marketing team is able to gradually improve its use of the
data available, creating better marketing materials that, in turn, improve the percentage increase of revenue per customer.
Over a five-year period, the composite organization uses the new insights created by advanced analytics to increase its
revenue per customer to 7.5% by Year 5. Table 1 shows this benefit in each of the five years of analysis.
Interviewed organizations provided a broad range of revenue improvements, since there are a variety of outside forces that
might also affect this. To compensate, this benefit was risk-adjusted and reduced by 10%. The risk-adjusted total benefit
resulting from increased revenue per customer over the five years was $$21,361,217. See the section on Risks for more
detail.

16
TABLE 1
Increased Revenue Per Customer
Ref. Metric Calculation Year 1 Year 2 Year 3 Year 4 Year 5
A1 Number of existing customers in
targeted region 4,200,000 4,410,000 4,630,500 4,862,025 5,105,126
A2 Percent growth of customers YOY
(average) 5% 5% 5% 5% 5%
A3 Percentage of customers affected by
big data project 0% 3% 5% 10% 15%
A4 Total big data project customers A1 * A3 0 132,300 231,525 486,203 765,769
A5 Average yearly value of existing
customer $1,800 $1,800 $1,800 $1,935 $2,080
A6 Percentage increase of revenue per
customer due to big data project 0.0% 1.5% 3.0% 5.0% 7.5%
A7 Gross margin 13% 13% 13% 13% 13%
At Increased revenue per customer A4 * A5 * A6 *
A7 $0 $464,373 $1,625,306 $6,115,212 $15,529,794
Risk adjustment 10%
Atr Increased revenue per customer (risk-
adjusted) $0 $417,936 $1,462,775 $5,503,691 $13,976,815
Source: Forrester Research, Inc.
Increase Customer Acquisition
Along with gaining a better understanding of the representative organization’s existing customers, the investment in IBM
Information Management solutions creates analytics that help the marketing team learn how to better target new customers.
The investment allows the representative organization to mine the existing information on customers, as well as access new
sources of information, to create insights into how best to engage with new customers and develop a trusted relationship
with prospective clients.
Through its focus on improving how it targets and engages with prospective customers, the composite organization was able
to gradually increase the percentage of new customers acquired due to the big data project, leading to a percentage
increase of 7.4% in customer acquisition by Year 5. Table 2 illustrates how this was calculated, with the number of
customers per year, average yearly value of new customers ($1,000), and gross margin (13%).
As with the existing customers, Forrester understands that many variables can affect the precise percentage increase in new
customers. As such, Forrester risk-adjusted the value of this benefit down by 5% to reflect this uncertainty.

17
TABLE 2
Increase Customer Acquisition
Ref. Metric Calculation Year 1 Year 2 Year 3 Year 4 Year 5
B1 Total number of customers affected by big
data project A4 0 132,300 231,525 486,203 765,769
B2 Percentage increase in customer acquisition 0.0% 2.5% 4.0% 5.9% 7.4%
B3 Number of new customers per year B1 * B2 0 3,308 9,261 28,686 56,667
B4 Average yearly value of new customer 1,000 1,000 1,000 1,000 1,000
B5 Gross margin 13% 13% 13% 13% 13%
Bt Increased customer acquisition B3 * B4 * B5 $0 $429,975 $1,203,930 $3,729,173 $7,366,697
Risk adjustment 5%
Btr Increased customer acquisition (risk-adjusted) $0 $408,476 $1,143,734 $3,542,715 $6,998,362
Source: Forrester Research, Inc.
Savings Due To Reduced Cost Of Creating Marketing Campaigns
Additionally, the investment in IBM’s Information Management solutions helps reduce the cost of targeting and acquiring
customer data, in turn reducing the cost of creating marketing campaigns. With better data access, the marketing team finds
it easier to gather this information, helping to bring down the cost of an overall campaign. While we did not specifically
quantify this benefit, with faster access to better data, the investment can also help speed up the time it takes to create these
campaigns and reduce the cost to reach out to a customer.
To calculate the reduction in cost of creating marketing campaigns, we estimate that the target region spends over $5.5
million on each campaign it runs, including data acquisition, labor, and campaign promotion. To create a conservative
analysis, Forrester specifically looked at the part of the budget that was focused on gathering data for targeting and acquiring
customers. Forrester applied industry knowledge and information collected from interviewees to determine that about 15% of
the campaign budget is for targeting and acquiring data.
As time goes by, the marketing team becomes increasingly proficient with targeting and acquiring data, and the percentage
reduction in campaign cost increases as the team is able to build additional insights that create more opportunity to decrease
the cost. By Year 5, there is a 6.2% reduction in campaign costs due to the big data initiative. Additionally, the number of
campaigns that can use this data increases as the marketing team becomes more proficient and comfortable with the
analytics; in Year 5, the team has an impact on four campaigns a year with its big data initiative. Table 3 highlights how this
was calculated.
As we have seen, there are a number of factors that could affect the percent reduction in campaign costs. To compensate
for these variations, Forrester has reduced the value of this benefit by 5%. For more on risk adjustments, please see the
section on Risks.

18
TABLE 3
Savings Due To Reduced Cost Of Creating Marketing Campaigns
Ref. Metric Calculation Year 1 Year 2 Year 3 Year 4 Year 5
C1
Total number of
marketing campaigns per
year
16 16 16 16 16
C2 Total marketing budget in
region
1.5% of total
revenue 90,000,000 90,000,000 90,000,000 90,000,000 90,000,000
C3 Total cost per marketing
campaign C2 / C1 5,625,000 5,625,000 5,625,000 5,625,000 5,625,000
C4
Percent of campaign
budget for targeting and
acquiring customer data
(big data project)
15% 15% 15% 15% 15%
C5
Percentage reduction in
campaign cost due to big
data project
0.0% 1.5% 3.0% 4.5% 6.2%
C6 Number of big data-based
campaigns per year 1 1 2 3 4
Ct
Savings due to reduced
cost of creating marketing
campaigns
C3 * C4 * C5 *
C6 $0 $12,656 $50,625 $113,906 $209,250
Risk adjustment 5%
Ctr
Savings due to reduced
cost of creating marketing
campaigns (risk-adjusted)
$0 $12,023 $48,094 $108,211 $198,788
Source: Forrester Research, Inc.
Cost Benefits Associated With A Decrease In Customer Attrition
The investment in IBM’s Information Management solutions to create a more holistic view of its customers has enabled the
representative organization to better understand what motivates the customers. It has enabled the organization to improve
its offerings and customer service and achieve more positive outcomes with clients. Because the organization is better able
to understand customers from advanced analytics and new customer insights it is able to create, our representative
organization has seen a decrease in the customer attrition rate.
Prior to its investment with IBM, the representative organization had a customer attrition rate of 3%; through its focus on
improving its understanding of the customer through its big data initiative, the representative organization was able to
decrease the attrition rate by 0.5% after the five-year period. There are many reasons why a customer may leave a banking
institution; to compensate for this factor, Forrester estimates that about 30% of that decrease in customer attrition is

19
attributable to the big data initiative, based on our interviews. Figuring in the average yearly value of an existing customer
and the gross margin, Table 4 shows this benefit in each of the five years of analysis.
Interviewed organizations highlighted that there are a variety of outside forces that could affect customer attrition. To
compensate, this benefit was risk-adjusted and reduced by 5%. The risk-adjusted total benefit resulting from a decrease in
customer attrition over the five years was $401,508. See the section on Risks for more detail.
TABLE 4
Cost Benefits Associated With A Decrease In Customer Attrition
Ref. Metric Calculation Year 1 Year 2 Year 3 Year 4 Year 5
D1
Total number of
customers affected by big
data project
A4 0 132,300 231,525 486,203 765,769
D2 Decrease in attrition rate 0.0% 0.0% 0.13% 0.25% 0.50%
D3 Average yearly value of
an existing customer $1,800 $1,800 $1,800 $1,935 $2,080
D4 Gross margin 13% 13% 13% 13% 13%
D5
Percentage of decrease
that is attributable to big
data project
30% 30% 30% 30% 30%
Dt Cost benefits of decrease
in customer attrition
D1 * D2 * D3
* D4 * D5 $0 $0 $20,316 $91,728 $310,596
Risk adjustment 5%
Dtr
Cost benefits of decrease
in customer attrition (risk-
adjusted)
$0 $0 $19,301 $87,142 $295,066
Source: Forrester Research, Inc.
Improved Marketing Employee Productivity
Due to the use of IBM’s information management solutions, the composite organization was able to gain overall efficiency
from its marketing users. The faster delivery of the analytics meant that the marketing team spent less time waiting for
information and could now more quickly apply these insights to day-to-day activities, making the team more productive
overall.
We estimated that the number of marketing employees benefiting from the big data initiative begins at five employees in
Year 1, and as the initiative rolls out to more people, increases to 30 marketing employees by Year 5. As we’ve seen in other
benefits, over time the employees are able to more efficiently utilize the analytics and insights from the big data initiative, and
we see that the productivity of these employees improves year over year. Based on feedback from the interviewed
organizations and the overall online study, Forrester conservatively estimates that the productivity savings will be 7% by the
end of Year 5. Forrester also adjusts productivity savings by assuming that only 50% of this time saved is used for productive
work.
20
To compensate for the variety of adoption challenges and efficiency gains that could potentially affect this calculation, this
benefit was risk-adjusted and reduced by 5%. With an assumed annual fully loaded salary of $120,000, the risk-adjusted
improved efficiency of the marketing staff for our representative organization is valued at $257,070. Table 5 illustrates the
calculations used.
TABLE 5
Improved Marketing Employee Productivity
Ref. Metric Calculation Year 1 Year 2 Year 3 Year 4 Year 5
E1
Number of marketing
employees benefiting
from big data project
5 10 15 20 30
E2 Average fully loaded
salary $120,000 $120,000 $120,000 $120,000 $120,000 $120,000
E3 Percentage productivity
improvement 1.0% 3.5% 5.0% 6.3% 7.0%
E4 Percent captured 50% 50% 50% 50% 50%
Et Improved marketing
employee efficiency
E1 * E2 * E3 *
E4 $3,000 $21,000 $45,000 $75,600 $126,000
Risk adjustment 5%
Etr
Improved marketing
employee efficiency (risk-
adjusted)
$2,850 $19,950 $42,750 $71,820 $119,700
Source: Forrester Research, Inc.
Reduced IT Spend From Supporting Unnecesary Databases
Prior to its investment in IBM’s Information Management solutions for its big data project, the representative organization
maintained a number of databases that held different information about its customers. Before the investment, multiple people
within the organization had to access more than one database to assemble information on a customer. Now, that information
is consolidated, and the organization is able to take old databases offline over time.
To calculate this benefit, Forrester assumes that old databases are taken offline slowly, ending with four total systems that
are no longer supported after the five-year period. The model conservatively assumes an average running cost of $75,000.
Figuring in a risk-adjustment of 1%, the reduction in IT spend from supporting unnecessary databases is $742,500 after five
years. Table 6 shows these calculations.

21
TABLE 6
Reduced IT Spend From Supporting Unnecessary Databases
Ref. Metric Calculation Year 1 Year 2 Year 3 Year 4 Year 5
F1 Number of unnecessary
databases 0 1 2 3 4
F2 Average cost associated
with database $75,000 $75,000 $75,000 $75,000 $75,000
Ft
Reduced IT spend from
supporting unnecessary
databases
F1 * F2 $0 $75,000 $150,000 $225,000 $300,000
Risk adjustment 1%
Ftr
Reduced IT spend from
supporting unnecessary
databases (risk-adjusted)
$0 $74,250 $148,500 $222,750 $297,000
Source: Forrester Research, Inc.
Security and Intelligence Extension
The interviews with IBM customers uncovered how essential enterprise security is to these organizations. As one
organization told us: “Our company has put a high level of importance on security, and they do recognize that we need to
make this investment to protect our data. So from a business perspective, we are taking major steps to protect our data —
that’s our number one concern.” Another organization explained: “We have more emphasis on database security and
compliance these days than we did ever before; the discussion around how to create that safer, more secure company — it
gets people thinking about how to build that environment.”
Similar to our interviewed organizations, the composite organization
implemented IBM Information Management solutions in order to
utilize information and knowledge gained from big data in order to
improve security throughout the organization with the Security and
Intelligence Extension use case. As part of this initiative, our
representative organization used the following IBM products: IBM
QRadar Security Intelligence Platform, IBM InfoSphere BigInsights,
IBM InfoSphere Streams, IBM PureData for Analytics (Netezza),
IBM InfoSphere Guardium, and IBM InfoSphere Optim. The
composite organization experienced a number of quantifiable
benefits as part of this initiative to better leverage its data to improve
its security. The risk-adjusted present value total benefit resulting
from the Security and Intelligence Extension use case over the five
years was $3,184,876. See the section on Risks for more detail.
As we discussed earlier, while this section is focused specifically on
the financial impact of IBM’s Information Management solutions in creating advanced enterprise security through big data,
there are a number of nonquantified benefits around this solution to keep in mind. By improving the enterprise security
through a big data initiative, companies also see an improved brand reputation, as well as more satisfied customers. When
asked about how investing in IBM’s Information Management solutions for security improvements affects both the
organization’s reputation and the customer experience, one organization told us: “It creates a good feeling for our customers
“We have more emphasis on
database security and
compliance these days than we
did ever before.”
~US-based insurance and financial services
organization

22
— when they join us, we tell them what we are doing with our security, and when I am talking about our IBM solutions, they
are impressed. Some of our competitors had leakages, and the leaks were coming from the database itself. For our
customers that are coming to us, it’s really impressing for them to know how we are protecting their data.” Another explained
the impact it has on the organization’s reputation: “It’s kind of making a statement as well that we take it seriously, and do
something about it. It’s quite serious stuff.” IBM’s Information Management solutions also improve the data security and
privacy of the organization’s data. These are key factors when considering how an investment in enterprise security will
affect your organization. Additionally, while this study focuses primarily on digital security, it is important to note that these
solutions can also increase security of physical assets as well.
Improved Process Efficiency In Meeting Security Requirements
A key measure of success of the big data initiative to improve enterprise security for both the survey respondents and our
interviewed organizations was the ability to improve the process efficiency in meeting security requirements. Through
implementing IBM’s Information Management solutions, the representative organization was able to improve its database
security, auditing protocols, and reporting capability, enabling the staff to handle security requirements more quickly. Being
able to audit faster and reduce the overall time spent on processes needed to meet security requirements helped enable
individuals like data privacy specialists, data architects, and auditors to become more efficient and save the company money.
To calculate the improved process efficiency in meeting security requirements, we estimate that in Year 1, 10 members of
the organization’s staff will be affected by the big data initiative to improve security, growing to 50 members of the staff by
Year 5. We assume that these employees spend an average of 20% of their time working on processes that deal with
meeting the regulatory and security requirements. As time goes by, these team members become increasingly proficient with
using IBM’s solutions, and by Year 5, are able to reduce the time they spend on security requirements by 10%. Table 7
highlights how this was calculated.
There are a number of factors that could affect the team’s ability to reduce the time it spends on security requirements. To
compensate for these variations, Forrester has reduced the value of this benefit by 5%. For more on risk adjustments, please
see the section on Risks.

23
TABLE 7
Improved Process Efficiency In Meeting Security Requirements
Ref. Metric Calculation Year 1 Year 2 Year 3 Year 4 Year 5
G1 Number of staff affected
by big data project 10 20 30 40 50
G2 Average annual fully
loaded salary $120,000 $120,000 $120,000 $120,000 $120,000 $120,000
G3
Percent of time spent on
security requirement
processes
20% 20% 20% 20% 20%
G4
Percent reduction in time
spent on security
requirements
0% 3% 5% 8% 10%
Gt
Improved process
efficiency in meeting
security requirements
G1 * G2 * G3 *
G4 $0 $14,400 $36,000 $76,800 $120,000
Risk adjustment 5%
Gtr
Improved process
efficiency in meeting
security requirements
(risk-adjusted)
$0 $13,680 $34,200 $72,960 $114,000
Source: Forrester Research, Inc.
Reduced Likelihood Of Regulatory Fines
There is significant risk associated with getting fined by a court or other regulatory body for failure to comply with regulations.
Through its investment in IBM’s solutions, our representative organization has gained greater efficiency and effectiveness in
its database security, auditing, and reporting capabilities that improve compliance. Due to this, the organization is able to
reduce the likelihood that it will be fined.
To calculate this risk, we look at the amount of a potential fine. Forrester conservatively estimates that the organization could
face a $25 million fine each year without proper measures in place to prove compliance. By investing in a big data initiative
for security, the representative organization is better able to meet its security requirements and reduces the probability of a
fine to 2%. The calculation is shown in Table 8.
Forrester understands that there are a number of variables that could potentially affect this calculation. To assume for that
risk, we have adjusted the benefit down by 5%, for a total five-year risk-adjusted benefit of $2,375,000.

24
TABLE 8
Reduced Likelihood Of Regulatory Fines
Ref. Metric Calculation Year 1 Year 2 Year 3 Year 4 Year 5
H1 Average potential fine $25,000,000 $25,000,000 $25,000,000 $25,000,000 $25,000,000
H2 Probability of fine 2% 2% 2% 2% 2%
Ht Reduced likelihood of
regulatory fines H1 * H2 $500,000 $500,000 $500,000 $500,000 $500,000
Risk adjustment 5%
Htr
Reduced likelihood of
regulatory fines (risk-
adjusted)
$475,000 $475,000 $475,000 $475,000 $475,000
Source: Forrester Research, Inc.
Reduced Cost To Recover From A Breach
The ability to analyze a large volume and variety of both structured and unstructured data with IBM’s Information
Management solutions has improved the enterprise security of the representative organization. The organization’s new
advanced security analytics allows it to expand its security analysis beyond the typical channels and increase the scope to
analyze an enormous amount of data, in real time, to create better intelligence information. Due to this, the investment also
helps the organization avoid potentially significant costs that it could incur if a data breach against its records were to occur.
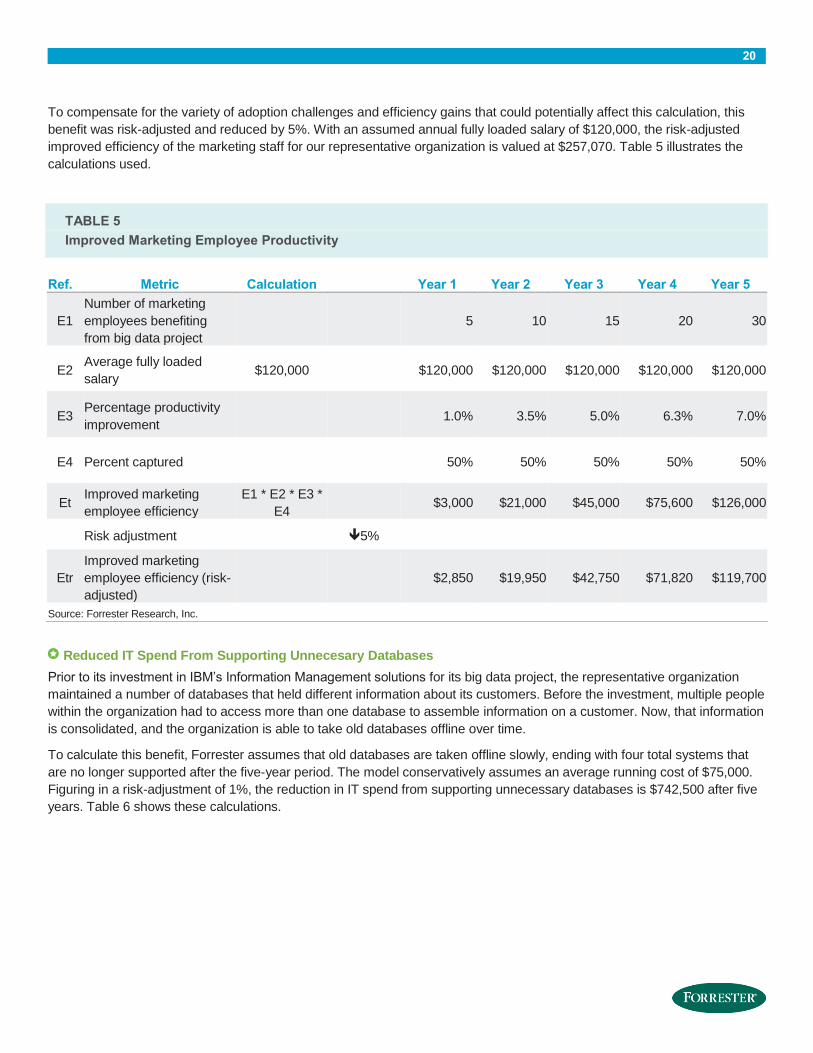
We estimate that the probability of a breach is about 12% in any given year. While the actual cost of a data breach could be
astronomical, Forrester conservatively estimates the average potential cost of a data breach to our representative
organization to be around $2.5 million in any given year. By taking advantage of the advanced analytical capabilities IBM has
created for the security organization, and analyzing a wide variety of data looking for suspicious anomalies or patterns, the
organization is now able to significantly reduce the likelihood of a breach. As the security team becomes increasingly
proficient in analyzing data, the likelihood of a breach becomes less likely year after year. By Year 5, the organization sees a
45% reduced likelihood of a data breach.
There are a number of outside forces that could affect the cost of a data breach or reduced likelihood of a breach; to account
for this, Forrester has reduced the value of this benefit by 5%. This results in a risk-adjusted total benefit of $304,950. Table
9 shows this calculation.
25
TABLE 9
Reduced Cost To Recover From A Breach
Ref. Metric Calculation Year 1 Year 2 Year 3 Year 4 Year 5
I1 Average data breach cost $2,500,000 $2,500,000 $2,500,000 $2,500,000 $2,500,000
I2 Probability of a breach 12% 12% 12% 12% 12%
I3 Reduced likelihood of a
breach 0% 9% 20% 33% 45%
It Reduced cost to recover
from a breach I1 * I2 * I3 $0 $27,000 $60,000 $99,000 $135,000
Risk adjustment 5%
Itr
Reduced cost to recover
from a breach (risk-
adjusted)
$0 $25,650 $57,000 $94,050 $128,250
Source: Forrester Research, Inc.
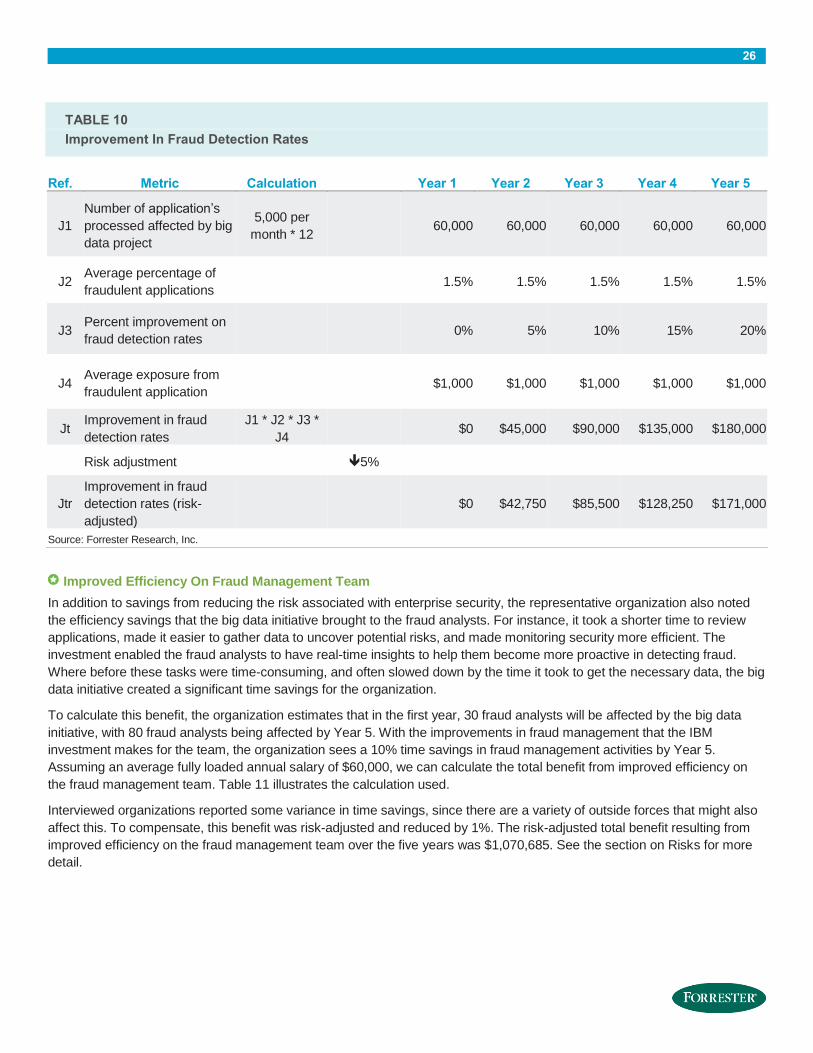
Improvement In Fraud Detection Rates
IBM’s Information Management solutions enabled our representative organization to integrate big data analytic capabilities
into its overall security intelligence plans. It is now able to quickly and efficiently analyze a high volume of complex data and
alert the organization in real time to any threats. The investment allows the organization to predict, detect, and act on fraud
proactively, instead of after it’s too late.
The representative organization has specifically seen benefits in efforts to detect fraud in credit applications. With its new
analytical capabilities, the organization is able to quickly identify and detect fraudulent applications. With IBM’s Information
Management solutions, it is now able to identify risky patterns and facts about applications, enabling it to improve its
percentage of fraud detection rates.
To calculate this benefit, Forrester estimates that the representative organization receives about 5,000 credit card
applications per month. Forrester applied industry knowledge and information collected from interviewees to determine the
average percent of fraudulent applications to be 1.5%. With its big data initiative to improve security, the representative
organization will improve the detection of these fraudulent applications by 20% in Year 5.
To compensate for the variety of challenges that could potentially affect this calculation, this benefit was risk-adjusted and
reduced by 5%. Assuming an average of $1,000 for each fraudulent application, the risk-adjusted total benefit resulting from
improvement in fraud detection rates over the five years was $427,500. Table 10 shows this calculation for each year. See
the section on Risks for more detail.
26
TABLE 10
Improvement In Fraud Detection Rates
Ref. Metric Calculation Year 1 Year 2 Year 3 Year 4 Year 5
J1
Number of application’s
processed affected by big
data project
5,000 per
month * 12 60,000 60,000 60,000 60,000 60,000
J2 Average percentage of
fraudulent applications 1.5% 1.5% 1.5% 1.5% 1.5%
J3 Percent improvement on
fraud detection rates 0% 5% 10% 15% 20%
J4 Average exposure from
fraudulent application $1,000 $1,000 $1,000 $1,000 $1,000
Jt Improvement in fraud
detection rates
J1 * J2 * J3 *
J4 $0 $45,000 $90,000 $135,000 $180,000
Risk adjustment 5%
Jtr
Improvement in fraud
detection rates (risk-
adjusted)
$0 $42,750 $85,500 $128,250 $171,000
Source: Forrester Research, Inc.
Improved Efficiency On Fraud Management Team
In addition to savings from reducing the risk associated with enterprise security, the representative organization also noted
the efficiency savings that the big data initiative brought to the fraud analysts. For instance, it took a shorter time to review
applications, made it easier to gather data to uncover potential risks, and made monitoring security more efficient. The
investment enabled the fraud analysts to have real-time insights to help them become more proactive in detecting fraud.
Where before these tasks were time-consuming, and often slowed down by the time it took to get the necessary data, the big
data initiative created a significant time savings for the organization.
To calculate this benefit, the organization estimates that in the first year, 30 fraud analysts will be affected by the big data
initiative, with 80 fraud analysts being affected by Year 5. With the improvements in fraud management that the IBM
investment makes for the team, the organization sees a 10% time savings in fraud management activities by Year 5.
Assuming an average fully loaded annual salary of $60,000, we can calculate the total benefit from improved efficiency on
the fraud management team. Table 11 illustrates the calculation used.
Interviewed organizations reported some variance in time savings, since there are a variety of outside forces that might also
affect this. To compensate, this benefit was risk-adjusted and reduced by 1%. The risk-adjusted total benefit resulting from
improved efficiency on the fraud management team over the five years was $1,070,685. See the section on Risks for more
detail.

27
TABLE 11
Improved Efficiency Of Fraud Management
Ref. Metric Calculation Initial Year 1 Year 2 Year 3 Year 4 Year 5
K1
Number of fraud analysts
affected by big data
project
30 40 55 65 80
K2 Average annual fully
loaded salary $60,000 $60,000 $60,000 $60,000 $60,000
K3 Time savings in fraud
management activities 0% 3% 6% 8.5% 10%
Kt Improved efficiency on
fraud management team K1 * K2 * K3 $0 $0 $72,000 $198,000 $331,500 $480,000
Risk adjustment 1%
Ktr
Improved efficiency of
fraud management (risk-
adjusted)
$0 $0 $71,280 $196,020 $328,185 $475,200
Source: Forrester Research, Inc.
Data Warehouse Modernization
The organizations we spoke with shared with us that modernizing their data warehouse was key to their ability to create
better insights into their data. With increasing amounts of data, the warehouse has to be optimized in order to support the
increased analytic capabilities the business end users need. Integrating these big data technologies into the warehouse not
only enables an organization to have access to these business insights, but also optimizes the warehouse infrastructure to
cost effectively store and process data as well as improve the performance and speed of the data warehouse. It also
improves the quality of the data delivered to the data warehouse. Similarly, our representative organization implemented IBM
Information Management solutions in order to optimize and update the data warehouse, improve performance, and better
support big data capabilities through the Data Warehouse Modernization use case. The IBM products used as part of this
initiative include IBM InfoSphere BigInsights, IBM InfoSphere Streams, IBM Watson Explorer, IBM PureData for Analytics
and IBM Digital Analytics Accelerator (IDAA for System Z), IBM Data Warehousing (DB2/Informix), IBM DB2 with BLU
Acceleration, IBM InfoSphere Information Server, and other InfoSphere IIG offerings. The risk-adjusted present value total
benefit resulting from the Data Warehouse Modernization use case over the five years was $5,000,008. See the section on
Risks for more detail.
Reduced Cost To Store And Process Persisted Data
One benefit of investing in modernizing its data warehouse for the composite organization was the reduced cost of
processing and storing persisted data. Through its work with IBM, the composite organization was able to make use of new
technologies in order to reduce these costs. For example, IBM helped the organization leverage in-memory and columnar
technology that helped to boost the performance of the organization’s analytic processes and increased the overall data
warehouse efficiency. The organization used Hadoop in order to store queryable data, which also helped to reduce the
overall costs of managing and storing data. In addition, IBM enabled the organization to use stream computing in order to
achieve greater storage cost efficiency. Through investing in IBM’s technologies, the composite organization was able to
reduce the overall cost of managing and storing data, while maintaining an environment that supports quality of data and
advanced analytic capabilities.

28
We estimated that in Year 1, the specific region of the composite organization that the big data project was focusing on had
300 TB of data and this data was growing at a rate of 25% each year. Based on our interviews and survey results, the model
assumes that the composite organization can expect to reduce the cost of storage each year, working to a 7.1% reduction by
Year 5. Assuming an average enterprise cost of storage per TB of data of $25,000, Table 12 shows how this was calculated.
To account for variations that could affect this calculation, Forrester risk-adjusted the benefit down by 1%, for a risk-adjusted
total benefit of $471,458 after the five-year period.
TABLE 12
Reduced Cost To Store And Process Persisted Data
Ref. Metric Calculation Year 1 Year 2 Year 3 Year 4 Year 5
L1 Number of terabytes 300 375 469 586 732
L2 Number of new TBs per
year 0 75 94 117 146
L3 Cost per TB $25,000 $25,000 $25,000 $25,000 $25,000 $25,000
L4 Percent reduction in cost
of storage 0% 1% 2.8% 4.5% 7.1%
Lt
Reduced cost to store
and process persisted
data
L2 * L3 * L4 $0 $18,750 $65,625 $131,836 $260,010
Risk adjustment 1%
Ltr
Reduced cost to store
and process persisted
data (risk-adjusted)
$0 $18,563 $64,969 $130,518 $257,410
Source: Forrester Research, Inc.
Reduced Cost Of Infrastructure
In addition to reductions in storage costs, the investment in IBM to modernize the data warehouse allows the organization to
realize operational and capital infrastructure savings. The investment in new technologies like in-memory technology,
columnar technology, Hadoop, and stream computing provides the capability of reducing the infrastructure footprint within
the data center, lowering the growth of server and networking costs within the new data center environment. While not
directly quantified below, the investment also ensures that the performance and speed of the data warehouse, as well as the
quality of the data in the data warehouse, are increased as well.
To calculate this benefit, we assume that 7% of the company’s IT budget is focused on infrastructure operations that
specifically support the data and storage environment. Based on industry averages, we assume that budget is growing by
5% each year. With the investment in IBM, the representative organization is able to reduce the infrastructure costs each
year, reducing the cost by 12% in Year 5. To adjust for the variance in infrastructure costs and percent reduction, we risk-
adjust the benefit down by 5%. After the five-year analysis period, the composite organization has a risk-adjusted total
benefit of $2,327,938. Table 13 highlights the calculations for each year.

29
TABLE 13
Reduced Cost Of Infrastructure
Ref. Metric Calculation Year 1 Year 2 Year 3 Year 4 Year 5
M1 Total annual revenue for
Northeast 6,000,000,000
M2
Percent of total annual
revenue that makes up
IT budget
4% 4%
M3 IT budget M1 * M2 240,000,000
M4
Percent of IT budget that
supports data and
storage environment
7% $16,800,000 $17,640,000 $18,522,000 $19,448,100 $20,420,505
M5 Percent reduction in
infrastructure costs 0% 3% 6% 8% 12%
Mt Reduced cost of
infrastructure M4 * M5 $0 $529,200 $1,111,320 $1,555,848 $2,450,461
Risk adjustment 5%
Mtr
Reduced cost of
infrastructure (risk-
adjusted)
$0 $502,740 $1,055,754 $1,478,056 $2,327,938
Source: Forrester Research, Inc.
Increased Efficiency From Increased Data Warehouse Analytic Capabilities
The final benefit that our organization received was the increased efficiency of the end users due to improvements at the
data warehouse. With the increased analytic capabilities now possible from the data warehouse, the end users waste less
time waiting for the data they need, and in turn can increase their efficiency by being able to act on analytics sooner. At the
same time, the investment in modernizing the data warehouse has improved the quality of the data, meaning that end users
can feel more confident in the decisions they are making. While not quantified directly here, this could also lead to better
business insights that could have a significant impact on the bottom line, as well as free up time for the staff to spend more
time on analysis.
To calculate this benefit, we consider the number of end users who use big data analytics; 45 end users are using big data
analytics in Year 1, increasing to 160 employees by Year 5. Forrester assumes that these end users spend an average of
25% of their time on analytics. As the end users become more proficient using the tools that help them find data faster,
prepare it faster, and become better at leveraging these insights, the percentage improvement rises to 20% by Year 5. To
account for variations in percentage improvement, Forrester risk-adjusted this benefit down by 5%. After five years, the total
risk-adjusted benefit is valued at $1,525,938. These calculations are highlighted in Table 14.

30
TABLE 14
Increased Efficiency From Data Warehouse Analytic Capabilities
Ref. Metric Calculation Year 1 Year 2 Year 3 Year 4 Year 5
N1 Number of staff using big
data analytics 45 70 100 125 160
N2 Average fully loaded
annual salary 100,000 100,000 100,000 100,000 100,000
N3 Average percentage of
time spent on analytics 25% 25% 25% 25% 25%
N4 Percent improvement 0% 5% 10% 15% 20%
Nt
Increased efficiency from
increased data
warehouse analytic
capabilities
N1 * N2 * N3 *
N4 $0 $87,500 $250,000 $468,750 $800,000
Risk adjustment 5%
Ntr
Increased efficiency from
increased data
warehouse analytic
capabilities (risk-adjusted)
$0 $83,125 $237,500 $445,313 $760,000
Source: Forrester Research, Inc.
Total Benefits
Table 15 shows the total of all benefits across the benefit areas listed above, as well as present values (PVs) discounted at
10%. Over five years, the composite organization expects risk-adjusted total benefits to be a PV of more than $31 million.
Table 15 also shows the subtotals for each use case individually. It is important to note that all three use cases increase
efficiencies and reduce costs. In addition to the improved efficiencies and reduced costs, the Enhanced 360-Degree View of
the Customer use case also enhances revenue, increasing the overall benefit.

31
TABLE 15
Total Benefits (Risk-Adjusted)
Benefit Category Year 1 Year 2 Year 3 Year 4 Year 5 Total
Present
Value
Enhanced 360-Degree View Of Customer Benefits
Increased revenue per customer $0 $417,936 $1,462,775 $5,503,691 $13,976,815 $21,361,216 $13,882,003
Increased customer acquisition $0 $408,476 $1,143,734 $3,542,715 $6,998,362 $12,093,287 $7,962,042
Savings due to reduced cost of
creating marketing campaigns $0 $12,023 $48,094 $108,211 $198,788 $367,116 $243,411
Cost benefits of decrease in
customer attrition $0 $0 $19,301 $87,142 $295,066 $401,508 $257,233
Improved marketing employee
productivity $2,850 $19,950 $42,750 $71,820 $119,700 $257,070 $174,576
Reduced IT spend in supporting
unnecessary databases $0 $74,250 $148,500 $222,750 $297,000 $742,500 $509,489
Enhanced 360-Degree View of
the Customer benefits subtotals $2,850 $932,635 $2,865,153 $9,536,328 $21,885,731 $35,222,697 $23,028,754
Security and Intelligence Extension Benefits
Improved process efficiency in
meeting security requirements $0 $13,680 $34,200 $72,960 $114,000 $234,840 $157,618
Reduced likelihood of regulatory
fines $475,000 $475,000 $475,000 $475,000 $475,000 $2,375,000 $1,800,624
Reduced cost to recover from a
breach $0 $25,650 $57,000 $94,050 $128,250 $304,950 $207,894
Improvement in fraud detection
rates $0 $42,750 $85,500 $128,250 $171,000 $427,500 $293,342
Improved efficiency of fraud
management $0 $71,280 $196,020 $328,185 $475,200 $1,070,685 $725,398
Security and Intelligence
Extension benefits subtotals $475,000 $628,360 $847,720 $1,098,445 $1,363,450 $4,412,975 $3,184,876
Data Warehouse Modernization Benefits
Reduced cost to store and
process persisted data $0 $18,563 $64,969 $130,518 $257,410 $471,458 $313,129
Reduced cost of infrastructure $0 $502,740 $1,055,754 $1,478,056 $2,327,938 $5,364,487 $3,663,689
Increased data warehouse $0 $83,125 $237,500 $445,313 $760,000 $1,525,938 $1,023,190

32
analytic capabilities
Data Warehouse Modernization
benefits subtotals $0 $604,428 $1,358,223 $2,053,886 $3,345,347 $7,361,883 $5,000,008
Total benefits (risk-adjusted) $477,850 $2,165,423 $5,071,095 $12,688,659 $26,594,528 $46,997,555 $31,213,638
Source: Forrester Research, Inc.

33
COSTS
The representative organization experienced a number of costs associated with the deployment of IBM’s Information
Management solutions:
› Software costs.
› Hardware costs to support software investment.
› Planning and implementation costs.
› Professional services, internal support, and change management costs.
These represent the mix of internal and external costs experienced by the representative organization for initial planning,
implementation, and ongoing maintenance associated with the solution.
Total Costs
Table 16 shows the total of all costs as well as associated present values, discounted at 10%. Over five years, the composite
organization expects total costs to total a net present value of a little more than $12.5 million.
TABLE 16
Total Costs (Risk-Adjusted)
Cost Category Initial Year 1 Year 2 Year 3 Year 4 Year 5 Total
Present
Value
Software costs $0 $438,900 $1,077,300 $877,800 $861,840 $861,840 $4,117,680 $3,072,618
Hardware $0 $219,450 $538,650 $438,900 $430,920 $430,920 $2,058,840 $1,536,309
Planning and
implementation $2,646,000 $0 $0 $0 $0 $0 $2,646,000 $2,646,000
Professional
services, internal
support, and
change
management
$0 $762,300 $1,871,100 $1,524,600 $1,496,880 $1,496,880 $7,151,760 $5,336,652
Total costs (risk-
adjusted) $2,646,000 $1,420,650 $3,487,050 $2,841,300 $2,789,640 $2,789,640 $15,974,280 $12,591,579
Source: Forrester Research, Inc.
FLEXIBILITY
Flexibility, as defined by TEI, represents an investment in additional capacity or capability that could be turned into business
benefit for some future additional investment. This provides an organization with the “right” or the ability to engage in future
initiatives but not the obligation to do so. There are multiple scenarios in which a customer might choose to implement IBM’s
Information Management solutions for big data and later realize additional uses and business opportunities. Flexibility would
also be quantified when evaluated as part of a specific project (described in more detail in Appendix C).

34
RISKS
Forrester defines two types of risk associated with this analysis: “implementation risk” and “impact risk.” Implementation risk
is the risk that a proposed investment in information management solutions may deviate from the original or expected
requirements, resulting in higher costs than anticipated. Impact risk refers to the risk that the business or technology needs
of the organization may not be met by the investment in information management solutions, resulting in lower overall total
benefits. The greater the uncertainty, the wider the potential range of outcomes for cost and benefit estimates.
Quantitatively capturing implementation risk and impact risk by directly adjusting the financial estimates results provides
more meaningful and accurate estimates and a more accurate projection of the ROI. In general, risks affect costs by raising
the original estimates, and they affect benefits by reducing the original estimates. The risk-adjusted numbers should be taken
as “realistic” expectations since they represent the expected values considering risk.
The following impact risks that affect benefits are identified as part of the analysis:
› Change management may take longer than anticipated due to the complexity of the environment.
› There may be a lower percentage of increased profit than expected.
› Productivity and efficiency savings may be lower than anticipated.
The following implementation risks that affect costs are identified as part of this analysis:
› The cost to implement new tools and solutions may be higher due to lack of available resources.
› The time to implement may be slower due to the delays in getting business buy-in for an enterprisewide initiative.
Table 17 shows the values used to adjust for risk and uncertainty in the cost and benefit estimates for the composite
organization. Readers are urged to apply their own risk ranges based on their own degree of confidence in the cost and
benefit estimates.

35
TABLE 17
Benefit And Cost Risk Adjustments
Enhanced 360-Degree View Of The Customer benefits Adjustment
Increased revenue per customer 10%
Increased customer acquisition 5%
Savings due to reduced cost of creating marketing campaigns 5%
Cost benefits of decrease in customer attrition 5%
Improved marketing employee efficiency 5%
Reduced IT spend 1%
Security and Intelligence Extension benefits Adjustment
Improved process efficiency in meeting security requirements 5%
Reduced likelihood of regulatory fines 5%
Reduced cost to recover from a breach 5%
Improvement in fraud detection rates 5%
Improved efficiency of fraud management 1%
Data Warehouse Modernization benefits Adjustment
Reduced cost to store and process persisted data 1%
Reduced cost of infrastructure due to increased data warehouse performance
and speed 5%
Increased data warehouse analytic capabilities 5%
Costs Adjustment
Software costs 5%
Hardware costs 5%
Planning and implementation costs 10%
Professional services, internal support, and change management costs 10%
Source: Forrester Research, Inc.

36
Financial Summary
The financial results calculated in the Benefits and Costs sections can be used to determine the ROI, NPV, and payback
period for the composite organization’s investment in IBM’s Information Management solutions.
Table 18 below shows the risk-adjusted ROI, NPV, and payback period values. These values are determined by applying the
risk-adjustment values from Table 17 in the Risks section to the unadjusted results in each relevant cost and benefit section.
FIGURE 7
Cash Flow Chart (Risk-Adjusted)
Source: Forrester Research, Inc.
TABLE 18
Cash Flow (Risk-Adjusted)
Summary Initial Year 1 Year 2 Year 3 Year 4 Year 5 Total
Present
Value
Total costs ($2,646,000) ($1,420,650) ($3,487,050) ($2,841,300) ($2,789,640) ($2,789,640) ($15,974,280) ($12,591,579)
Total benefits $0 $477,850 $2,165,423 $5,071,095 $12,688,659 $26,594,528 $46,997,555 $31,213,638
Total ($2,646,000) ($942,800) ($1,321,627) $2,229,795 $9,899,019 $23,804,888 $31,023,275 $18,622,059
ROI 148%
Payback period
(months) 39.2
Source: Forrester Research, Inc.
($10,000,000)
($5,000,000)
$0
$5,000,000
$10,000,000
$15,000,000
$20,000,000
$25,000,000
$30,000,000
$35,000,000
Initial Year 1 Year 2 Year 3 Year 4 Year 5
Cas
h f
low
s
Financial analysis (risk-adjusted)
Total Costs Total Benefits Cumulative Total

37
IBM Information Management Solutions: Overview
The following information is provided by IBM. Forrester has not validated any claims and does not endorse IBM or its
offerings.
IBM Information Management solutions deliver trusted information throughout the information supply chain and help
businesses analyze their information to gain insights, identify breakdowns, and make better decisions.
Capabilities include:
› Data management. IBM solutions deliver industry-leading database performance across multiple workloads while
lowering administration, storage, development, and server costs. The comprehensive portfolio is available:
• As software on existing infrastructure to maximize current investments.
• In a prebuilt system to accelerate deployment.
• On a cloud environment for maximum flexibility.
› Data warehousing. IBM solutions help clients extend and evolve their data warehouse investments so they can discover
deeper insights at a lower total cost of ownership. Designed to make the most of existing client solutions, integrated IBM
solutions help clients quickly add next-generation database technology and appliances optimized for analytics workloads
that can be up and running in hours.
› Hadoop system. The rich IBM Hadoop distribution brings the power of Apache Hadoop to the enterprise with application
accelerators, analytics, visualization, development tools, performance, and security features — all ready to help clients
manage and analyze massive volumes of structured and unstructured data.
› Stream computing. IBM solutions efficiently deliver real-time analytic processing on constantly changing data in motion
and enable descriptive and predictive analytics to support real-time decisions. Users can capture and analyze all data, all
the time, just in time. Stream computing helps organizations store less, analyze more, and make better decisions faster.
› Information integration and governance. IBM solutions bring together data from diverse sources for diverse targets,
manage its quality, and maintain master data for multiple domains; they secure and protect data, manage it across its life
cycle, and facilitate information-based collaboration across business and technical teams. These broad capabilities help
organizations increase the value of data for information-intensive projects like big data analytics, application consolidation
and retirement, data security and compliance, 360-degree views, and many others.

38
Appendix A: IBM Products And Use Cases
TABLE 19
IBM Use Cases And Product Mapping
Enhanced 360-Degree View of the
Customer Security and Intelligence Extension Data Warehouse Modernization
InfoSphere Master Data Management IBM QRadar Security Intelligence
Platform IBM InfoSphere BigInsights
IBM InfoSphere BigInsights IBM InfoSphere BigInsights IBM InfoSphere Streams
IBM InfoSphere Streams IBM InfoSphere Streams IBM InfoSphere Data Explorer
IBM InfoSphere Information Server for
Data Integration IBM PureData for Analytics (Netezza) IBM InfoSphere Guardium
IBM InfoSphere Information Server for
Data Quality IBM InfoSphere Guardium IBM InfoSphere Optim
IBM Data Warehousing (DB2/Informix) IBM InfoSphere Optim IBM InfoSphere Master Data
Management
IBM Watson Explorer Other IBM information, integration, and
governance offerings IBM Data Warehousing (DB2/Informix)
IBM InfoSphere Information Server
IBM Digital Analytics Accelerator
(IDAA for System Z)
Source: Forrester Research, Inc.

39
Appendix B: Composite Organization Description
For this TEI study, Forrester has created a composite organization to illustrate the quantifiable benefits and costs of
implementing information management solutions focusing on big data. The composite company is intended to represent a
regional bank and is based on characteristics of the interviewed customers:
› A US-based financial organization with offices worldwide, offering products like credit cards, personal banking accounts,
and loans.
› 88,000 employees worldwide.
› A total annual revenue worldwide of $40 billion.
› 28 million customers.
After researching a number of solutions and partners, the composite organization chose to work with IBM Information
Management for its big data project.
As part of its big data initiative, our composite organization chose to focus its initial big data projects in one region of the US.
For the purposes of this study, we will be focusing on this region. This region makes up about one-fifth of its US annual
revenue and supports 4.2 million customers.
FRAMEWORK ASSUMPTIONS
Table 20 provides the model assumptions that Forrester used in this analysis.
The discount rate used in the PV and NPV calculations is 10%, and the time horizon used for the financial modeling is five
years. Organizations typically use discount rates between 8% and 16% based on their current environment. Readers are
urged to consult with their respective company’s finance department to determine the most appropriate discount rate to use
within their own organizations.
TABLE 20
Model Assumptions
Ref. Metric Calculation Value
O1 Hours per week 40
O2 Weeks per year 52
O3 Hours per year (M-F, 9-5) 2,080
O4 Hours per year (24x7) 8,736
O5 Average yearly value of a new customer $1,000
O6 Average yearly value of an existing customer $1,800
O7 Gross profit margin 13%
Source: Forrester Research, Inc.

40
Appendix C: Total Economic Impact™ Overview
Total Economic Impact is a methodology developed by Forrester Research that enhances a company’s technology decision-
making processes and assists vendors in communicating the value proposition of their products and services to clients. The
TEI methodology helps companies demonstrate, justify, and realize the tangible value of IT initiatives to both senior
management and other key business stakeholders.
The TEI methodology consists of four components to evaluate investment value: benefits, costs, flexibility, and risks.
BENEFITS
Benefits represent the value delivered to the user organization — IT and/or business units — by the proposed product or
project. Often, product or project justification exercises focus just on IT cost and cost reduction, leaving little room to analyze
the effect of the technology on the entire organization. The TEI methodology and the resulting financial model place equal
weight on the measure of benefits and the measure of costs, allowing for a full examination of the effect of the technology on
the entire organization. Calculation of benefit estimates involves a clear dialogue with the user organization to understand
the specific value that is created. In addition, Forrester also requires that there be a clear line of accountability established
between the measurement and justification of benefit estimates after the project has been completed. This ensures that
benefit estimates tie back directly to the bottom line.
COSTS
Costs represent the investment necessary to capture the value, or benefits, of the proposed project. IT or the business units
may incur costs in the form of fully burdened labor, subcontractors, or materials. Costs consider all the investments and
expenses necessary to deliver the proposed value. In addition, the cost category within TEI captures any incremental costs
over the existing environment for ongoing costs associated with the solution. All costs must be tied to the benefits that are
created.
FLEXIBILITY
Within the TEI methodology, direct benefits represent one part of the investment value. While direct benefits can typically be
the primary way to justify a project, Forrester believes that organizations should be able to measure the strategic value of an
investment. Flexibility represents the value that can be obtained for some future additional investment building on top of the
initial investment already made. For instance, an investment in an enterprisewide upgrade of an office productivity suite can
potentially increase standardization (to increase efficiency) and reduce licensing costs. However, an embedded collaboration
feature may translate to greater worker productivity if activated. The collaboration can only be used with additional
investment in training at some future point. However, having the ability to capture that benefit has a PV that can be
estimated. The flexibility component of TEI captures that value.
RISKS
Risks measure the uncertainty of benefit and cost estimates contained within the investment. Uncertainty is measured in two
ways: 1) the likelihood that the cost and benefit estimates will meet the original projections and 2) the likelihood that the
estimates will be measured and tracked over time. TEI risk factors are based on a probability density function known as
“triangular distribution” to the values entered. At a minimum, three values are calculated to estimate the risk factor around
each cost and benefit.

41
Appendix D: Glossary
Discount rate: The interest rate used in cash flow analysis to take into account the time value of money. Companies set
their own discount rate based on their business and investment environment. Forrester assumes a yearly discount rate of
10% for this analysis. Organizations typically use discount rates between 8% and 16% based on their current environment.
Readers are urged to consult their respective organizations to determine the most appropriate discount rate to use in their
own environment.
Net present value (NPV): The present or current value of (discounted) future net cash flows given an interest rate (the
discount rate). A positive project NPV normally indicates that the investment should be made, unless other projects have
higher NPVs.
Present value (PV): The present or current value of (discounted) cost and benefit estimates given at an interest rate (the
discount rate). The PV of costs and benefits feed into the total NPV of cash flows.
Payback period: The breakeven point for an investment. This is the point in time at which net benefits (benefits minus costs)
equal initial investment or cost.
Return on investment (ROI): A measure of a project’s expected return in percentage terms. ROI is calculated by dividing
net benefits (benefits minus costs) by costs.
A NOTE ON CASH FLOW TABLES
The following is a note on the cash flow tables used in this study (see the example table below). The initial investment
column contains costs incurred at “time 0” or at the beginning of Year 1. Those costs are not discounted. All other cash flows
in years 1 through 3 are discounted using the discount rate (shown in the Framework Assumptions section) at the end of the
year. PV calculations are calculated for each total cost and benefit estimate. NPV calculations are not calculated until the
summary tables are the sum of the initial investment and the discounted cash flows in each year.
Sums and present value calculations of the Total Benefits, Total Costs, and Cash Flow tables may not exactly add up, as
some rounding may occur.
TABLE [EXAMPLE]
Example Table
Ref. Metric Calculation Year 1 Year 2 Year 3
Source: Forrester Research, Inc.

42
Appendix E: Endnotes
1 Forrester risk-adjusts the summary financial metrics to take into account the potential uncertainty of the cost and benefit
estimates. For more information, see the section on Risks.
2 Source: “Big Data In Banking: It’s Time To Act,” Forrester Research, Inc., April 15, 2014.
3 Source: “Big Data In Banking: It’s Time To Act,” Forrester Research, Inc., April 15, 2014.
4 Source: “Big Data In Banking: It’s Time To Act,” Forrester Research, Inc., April 15, 2014.