
TED ANKARA COLLEGE FOUNDATION HIGH SCHOOL … · Aim of the Project ... According to Ohm’s Law,...
25
TED ANKARA COLLEGE FOUNDATION HIGH SCHOOL IB STANDARD LEVEL PHYSICS EXTENDED ESSAY FACTORS AFFECTING THE SENSITIVITY OF THE WHEATSTONE BRIDGE IN ITS PURPOSE FOR RESISTANCE MEASUREMENT Date: 26 February 2009 Candidate’s Name: Onur Solmaz Candidate’s Number: D1129015 Candidate’s Supervisor: Vedat Gül Word Count: 3738
Transcript of TED ANKARA COLLEGE FOUNDATION HIGH SCHOOL … · Aim of the Project ... According to Ohm’s Law,...

TED ANKARA COLLEGE FOUNDATION HIGH SCHOOL
IB STANDARD LEVEL PHYSICS EXTENDED ESSAY
FACTORS AFFECTING THE SENSITIVITY OF THE WHEATSTONE BRIDGE IN
ITS PURPOSE FOR RESISTANCE MEASUREMENT
Date: 26 February 2009
Candidate’s Name: Onur Solmaz
Candidate’s Number: D1129015
Candidate’s Supervisor: Vedat Gül
Word Count: 3738

SOLMAZ D1129015
1
1. ABSTRACT
The reason for me to pick Wheatstone bridge as my subject is that it is a perfect example of
electrical complexity that has many issues for many factors that have affected the flow of
electricity (or have been affected from it). It is rich in topics, and I have thought that it would
be a pleasure for me to do some research about it, and then present my extended essay. The
part that bothered me about the measurements with the Wheatstone bridge was that, does it
give precise results after it has just been balanced, or is it necessary to fulfill some conditions.
For extremely precise results, the temperature must have been constant, to reduce the thermo-
electric effect and keep the resistances constant. The temperature was not a problem, after it
has been kept constant, but there is something more important about the resistance ratios. The
current that is applied to the circuit must be suitable for the circuit, and to get the most precise
results, electrical leakage that can result from the inductance or capacitance should be kept as
minimum. The resistance to be measured and the one to be adjusted would be the only
variable resistances, and the other ones should be kept in a constant ratio. In this experiment,
they were kept to a constant ratio of 1 in order to have a wide range of measurement.
(Word Count: 230)
SOLMAZ D1129015
2
TABLE OF CONTENTS
Page
1. ABSTRACT ...................................................................................................................1
2. INTRODUCTION .........................................................................................................3
2.1. Aim of the Project ........................................................................................................3
2.2. Background Research ..................................................................................................3
2.3. Principles of the Wheatstone Bridge ............................................................................3
2.4. The Galvanometer........................................................................................................5
2.5. Basic properties of the bridge .......................................................................................6
2.6. Medium Effect .............................................................................................................6
3. HYPOTHESIS ...............................................................................................................7
4. METHOD DEVELOPMENT AND PLANNING ........................................................7
4.1. Research Question .......................................................................................................8
4.2. Key Variables ..............................................................................................................8
4.3. Materials ......................................................................................................................8
4.4. Method ........................................................................................................................9
4.5. Data Collection and Processing .................................................................................. 10
5. CONCLUSION ............................................................................................................ 11
6. EVALUATION ............................................................................................................ 12
6.1. Sources of Error ......................................................................................................... 12
7. APPENDIX .................................................................................................................. 13
7.1. Data Collection and Processing .................................................................................. 13
7.1.1. Data Collection.............................................................................................. 13
7.1.2. Data Processing and Presentation .................................................................. 15
7.1.2.1. Resistance Calculations ............................................................................ 16
7.1.3. Error Analysis ............................................................................................... 20
8. BIBLIOGRAPHY ....................................................................................................... 24
SOLMAZ D1129015
3
2. INTRODUCTION
2.1. Aim of the Project
Aim of this project is to investigate the relation between the sensitivity of the Wheatstone
bridge and bridge’s resistances.
2.2. Background Research
Since the Wheatstone bridge was invented by Samuel Hunter Christie and later improved by
Charles Wheatstone, the scientists used it to measure resistances (capacitance and inductance
when functioning in alternating current too). It consists of the most basic electrical
components, just four resistors and a galvanometer. Throughout the 19th century, it helped
some of the industrial improvements, for the precise measurement of the resistances to be
used in electrical devices. At first, the galvanometers were not portable and too heavy to
carry. However, D’Arsonval’s new design of the galvanometer helped the improvements in
the area of measurement. Portable ammeters, ohmmeters and voltmeter were produced; and
then it was realized that they needed a shunt resistance to operate. This was causing an
ignorable error in the measurement; however a Wheatstone bridge was still necessary for the
precise measurements of the resistances. The error could be calculated and corrected, by
knowing the value of the shunt resistance, but even that was not enough; so the Wheatstone
bridge did not lose its popularity until the 20th century.
Even if the precise measurement is possible with a Wheatstone bridge, there are conditions to
be fulfilled when using it. The operation principle of the bridge is explained below:
2.3. Principles of the Wheatstone Bridge
In a bridge circuit, the current is splitted into two different paths as it enters the bridge, later
combining at a single junction into the initial current. Bridge structures are used in electric
circuits for a variety of purposes, with the help of little adjustments. In direct current, a bridge
can be used to measure resistance, if four resistances are connected to the bridge in parallel.
This bridge is known as the Wheatstone bridge and it consists of four resistors connected in
parallel as pairs, with a galvanometer connected to the middle of the resistor on each path.
The Wheatstone bridge may be used to measure resistances to a high precision, but it also has
another advantage as a measurement method. The Wheatstone bridge lacks the shunt
resistance that a practical ohmmeter has, therefore being able to measure more precisely than
an ohmmeter. A theoretical ohmmeter has a shunt resistance infinitely small; however a
practical resistor would have a finite resistance therefore bypassing some of the current,
leading to inconsistent results. Although a galvanometer is used to measure the current in the
central arm of the Wheatstone Bridge, and its inner resistance may affect the outcome of the
SOLMAZ D1129015
4
measurement, the deviation is often ignored. However the Wheatstone bridge can also be used
to measure the inner resistance of the galvanometer, therefore letting the scientists correct the
outcome of the measurement.
The principle for the Wheatstone bridge is quite simple. The system consists of four
resistances paired parallel, with a galvanometer connected between the paired resistances to
control if there is electrical current passing from it, but how can it be used to measure a
resistance? According to Ohm’s Law, deriving its name from Georg Ohm, the resistance is
directly proportional with the voltage in a circuit, and inversely proportional with the current,
found by dividing voltage by the electrical current.
Therefore, the electrical current passing from a wire will decrease, if the resistance of that
wire is increased. In this situation, the electrical current would be distributed inversely
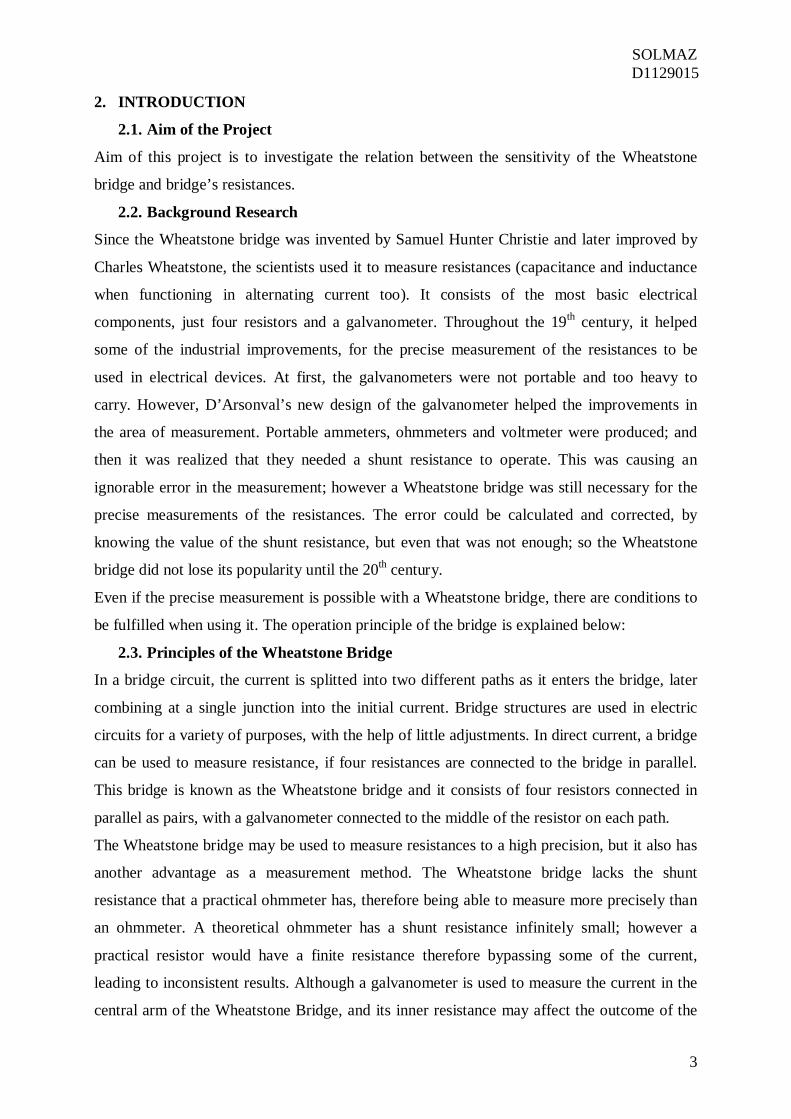
proportional to the total resistance in each branch of the circuit. The diagram for the
Wheatstone bridge is shown below:
It is not possible to calculate the potential
difference between the terminals of the
galvanometer via Ohm’s Law. Therefore,
we need to apply Kirchhoff’s voltage and
current rules in order to find an equation
for the Wheatstone bridge. According to
the Kirchhoff’s current rule, the sum of
the currents heading to a junction is equal
to the sum of the currents leaving it.
Therefore, according to Figure 1:
We know that the current flowing through the galvanometer is zero, so .
If we apply the voltage rule on the junctions C and D, we would obtain:
Since the current passing through the galvanometer is zero, we would obtain the following
equations:
Figure 1: Wheatstone bridge circuit

SOLMAZ D1129015
5
If we divide each side, the equation would take the following form:
Therefore, the basic principle of the bridge is that if , the potential
difference between C and D would be zero, so there would be no current passing from the
galvanometer, and the bridge is balanced. For instance (in Figure 1), if we are to find the
resistance R4, the equation can be rewritten as:
in order to express the equations in terms of the adjustable resistances (which are adjustable
through the rheostat). This shows that:
• If the ratio is excessively greater than (for example 10 or 100), resistances much
higher than R3 can be measured.
• If the ratio is excessively lower than (for example 0.1 or 0.01), resistances much
lower than R3 can be measured.
• The bridge can also be operated to measure by preserving the ratios of and adjusting
only R1 to stabilize the bridge.
2.4. The Galvanometer
D’Arsonval’s galvanometer, invented by Jacques-Arsène d'Arsonval in 1882 consists of a
pointer, attached to a coil of wire pivoting freely in the magnetic field of a permanent magnet.
The electrical current flowing through the coil causes magnetic induction which exerts a
torque on the pointer. As a result, the pointer moves in two directions on the scale, directly
proportional to the current passing through the coil. The scale is calibrated to give a realistic
result and to return the pointer to its initial position when no current is present, a spring is
added to the system.
With D’Arsonval’s and Weston’s, galvanometers became portable to be used anywhere
independent from the earth’s magnetic field allowing sensitive and precise measurements.
Ohm’s law was formed consequently with the improvements in the galvanometer design.
D’Arsonval’s galvanometer can be modified to measure both the potential difference and the
electrical current, with the usage of a resistor.

SOLMAZ D1129015
6
2.5. Basic properties of the bridge
A Wheatstone bridge can measure resistances in the range between 10 ohms and 10000
naturally. In a standard experiment, the outcome would be accurate up to 99.9% even the
internal resistances of the battery and the galvanometer are ignored.
“The components of the bridge, sometimes including the battery and the detector, may be
assembled as a unit for convenience. The bridge resistance should be of “Manganin” for
precise work on account of its low temperature coefficient of resistance and low
thermoelectric e.m.f. to copper, and should be substantially free from inductance and
capacitance.”1
In a Wheatstone bridge, lower resistances are much more difficult to measure accurately. The
reason is:
If the resistance to be measured is very low, the potential difference across the resistance is
also low unless the current the current is large. Considering thermo-electric electromotive
forces, the situation leads to a point where potential difference across the galvanometer is
thoroughly manipulated by the thermo-electric effect instead of the potential difference
resulting from the stabilization of the bridge. Since the resistance that is to be measured is
very small, the potential difference created is also to be small. For example, a resistance of
0.001 ohm, a current of 0.1 A would only produce a potential difference of 0.1 mV across the
resistance. To balance the bridge, only a small fraction of this is required. In order to have an
accurate result, it is necessary for the adjustable resistance to endure very high currents and
the unknown resistance be close enough to this resistance.
If the resistances to be measured are high, the potential difference applied to the bridge should
be increased, while controlling the temperature of the resistance coils. If the system overheats,
than the resistance would increase and the current flowing through it would decrease.
Therefore the sensitivity is decreased. Insulation must be done thoroughly in order to prevent
leakage currents. If it is not sufficient enough, the measurement would result in more than an
ignorable error. Of course, this must be taken into consideration when measuring resistances
more than 1000 ohms. Otherwise, it is not necessary to increase the voltage.
2.6. Medium Effect
There are medium-related factors affecting the sensitivity of the Wheatstone bridge. These are
generally about extra resistances or temperature effect, which may cause a great deal in the
outcome of a measurement (done with a Wheatstone bridge).
1 Principles of Electrical Measurements.- H. Buckingham

SOLMAZ D1129015
7
• The resistance of the connecting leads may increase the resistance of a bridge in each
arm. If the resistances of each arm are not close enough, this may cause mostly 1%
deviation in the results.
• Another effect of the medium is the thermo-electric change. A 1°C change in
temperature can affect the resistance of a conductor in the ratio of 0.01%, if a 1V
voltage source is used.
• Temperature coefficient of a resistance can affect the outcome of the measurement.
Even with a resistance of the coefficient 0.000004/°C, a 25°C increase would result in
0.01% decrease in resistance.
3. HYPOTHESIS
As mentioned previously, it has been stated that for an accurate measurement, it is necessary
to choose close values of resistances for R3 and R4. If the ratio of is not much greater or
lower than 1, i.e. then it is possible to get accurate results. It is an
important factor here that the resistance values of R1 and R2 should also be closer to that of R3
and R4; however the values of R3 and R4 should not exceed the values of R1 and R2
excessively. Instead, it is possible to choose R1 and R2 values much higher than R3 and R4 in
order to manipulate the electrical current towards these resistors. This will create a higher
potential difference across the resistors R1 and R2, and a higher electrical current flowing
through R3 and R4. Therefore it will be possible to detect the smallest current that can cause a
deflection in the multimeter, and to harvest more accurate results.
However, if resistance values of R1 and R2 lower which are than R3 and R4 are used, the
deviation in the results should be higher than expected. The system would focus all the
current to R1 and R2 instead of R3 and R4, in which R4 the resistance to be measured and R3 is
the resistance to be adjusted according to R4. Therefore, if R3 and R4 have values too extreme
compared to R1 and R2, the experiment would not lead to accurate and clear results.
4. METHOD DEVELOPMENT AND PLANNING
The method will include the basic testing of the Wheatstone bridge, from the primary
principle by testing the reliability of Wheatstone bridge. In the following experiment, a
Wheatstone bridge is established with a constant ratio of (in which R1 and R2 equal to
10ohm). R3 and R4 resistance values are changing throughout the experiment, from lower than
R1 and R2 to higher, in order to test this hypothesis. A rheostat is going to be used for the
adjustable resistor R3, and 17 different resistors of 17 different resistance values are going to

SOLMAZ D1129015
8
be used for R4 in which all of them are going to be used to measure throughout the
experiment.
In this experiment, in order to test the hypothesis, every independent factor except the
resistances of R3 and R4 should be controlled. High electrical current has a tendency to
increase the temperature of a resistor, affecting its resistance and causing inaccuracy. The
bridge resistances which are used in the experiment should be made of Manganin instead of
copper in order to decrease this effect, on account of its low temperature coefficient of
resistance and low thermo-electric electromotive force. However, it is difficult to find one of
these resistors today, so the experiment is going to be done using copper resistors qualified
enough for the experiment. The resistances should also be free of capacitance or inductance,
which causes transient currents when any change to the system is made.
The voltage source should also be capable enough to apply a constant current to the bridge, to
prevent any current changes that can result from the capacitance of the rheostat coil.
4.1. Research Question
How is the sensitivity of a Wheatstone bridge affected by the changes in the resistances R3
and R4?
4.2. Key Variables
Independent Variables: The resistance of R4
Distance of the slider from the head of the rheostat
Dependent Variables: The electrical current flowing through the galvanometer
Potential difference between the terminals of the galvanometer
The electrical current flowing through the resistors
Temperature of the resistances
Controlled Variables: Electromotive force
4.3. Materials
• A copper rheostat with the length of 100.00±0.05cm and the resistance of
150.00±0.05Ω
• 19 carbon composition resistors of the resistances 0.1, 1, 2, 4, 6, 8, 10, 10, 10, 20, 25,
30, 35, 40, 50, 60, 70, 90, 100 (±0.05Ω)
• A multimeter (Max input = 50A)
• An emf source (Max output = 110V)
• At least 15 wires of length 20±0.05cm with crocodile clips
• A ruler of the length 30cm (±0.05cm)

SOLMAZ D1129015
9
4.4. Method
1. Prepare the circuit as seen in
Figure 2. Note that the rheostat will
become R3. Use the two 10Ω resistors for
R1 and R2. Use the 0.1Ω resistor for R4.
2. Connect one terminal of the
galvanometer between the resistors, and
the other one to the slider of the rheostat
(R3), as seen in Figure 2.
3. Connect the system to the voltage
source. Give the system a potential
difference of 30V.
4. Adjust the rheostat till no current
passes from the multimeter (Check from the multimeter).
5. Measure and note the distance of the slider from where it touches the coil of the
rheostat, to the initial point (head of the rheostat). Shut the voltage source down and
disconnect it from the circuit.
6. Disconnect the 0.1Ω resistor from the circuit and connect the 1Ω resistor instead.
Connect the system to the voltage source. Give the system a potential difference of
30V. Adjust the rheostat till no current passes from the multimeter (Check from the
multimeter). Measure and note the distance of the slider from where it touches the coil
of the rheostat, to the initial point (head of the rheostat). Shut the voltage source down
and disconnect it from the circuit.
7. Disconnect the 1Ω resistor from the circuit and connect the 2Ω resistor instead.
Connect the system to the voltage source. Give the system a potential difference of
30V. Adjust the rheostat till no current passes from the multimeter (Check from the
multimeter). Measure and note the distance of the slider from where it touches the coil
of the rheostat, to the initial point (head of the rheostat). Shut the voltage source down
and disconnect it from the circuit.
8. Disconnect the 2Ω resistor from the circuit and connect the 4Ω resistor instead.
Connect the system to the voltage source. Give the system a potential difference of
30V. Adjust the rheostat till no current passes from the multimeter (Check from the
multimeter). Measure and note the distance of the slider from where it touches the coil
Figure 2: Wheatstone bridge circuit prepared for
the experiment
The Voltage Source
The Galvanometer

SOLMAZ D1129015
10
of the rheostat, to the initial point (head of the rheostat). Shut the voltage source down
and disconnect it from the circuit.
9. Repeat the 8th step by disconnecting the 4Ω resistor from the circuit and connecting
the 6Ω resistor instead. Note the results.
10. Repeat the 8th step by disconnecting the 6Ω resistor from the circuit and connecting
the 8Ω resistor instead. Note the results.
11. Repeat the 8th step by disconnecting the 8Ω resistor from the circuit and connecting
the 10Ω resistor instead. Note the results.
12. Repeat the 8th step by disconnecting the 10Ω resistor from the circuit and connecting
the 20Ω resistor instead. Note the results.
13. Repeat the 8th step by disconnecting the 25Ω resistor from the circuit and connecting
the 30Ω resistor instead. Note the results.
14. Repeat the 8th step by disconnecting the 30Ω resistor from the circuit and connecting
the 35Ω resistor instead. Note the results.
15. Repeat the 8th step by disconnecting the 35Ω resistor from the circuit and connecting
the 40Ω resistor instead. Note the results.
16. Repeat the 8th step by disconnecting the 40Ω resistor from the circuit and connecting
the 50Ω resistor instead. Note the results.
17. Repeat the 8th step by disconnecting the 50Ω resistor from the circuit and connecting
the 60Ω resistor instead. Note the results.
18. Repeat the 8th step by disconnecting the 60Ω resistor from the circuit and connecting
the 70Ω resistor instead. Note the results.
19. Repeat the 8th step by disconnecting the 70Ω resistor from the circuit and connecting
the 90Ω resistor instead. Note the results.
20. Repeat the 8th step by disconnecting the 90Ω resistor from the circuit and connecting
the 100Ω resistor instead. Note the results.
4.5. Data Collection and Processing
In this section, all the values obtained from the experiment are interpreted for error analysis.
In the experiment, the distance of the slider from the head of the rheostat was measured and
noted in centimeters. Then 2 tables are formed (Data Collection is shown in Appendix 7.1.1)
with these values to be able to do calculations. In Table 1, the resistances R1, R2, R4, voltage
of the battery and the current flowing through the galvanometer were listed. The current

SOLMAZ D1129015
11
flowing through the galvanometer was listed in order to indicate that no current passed
through it, and the bridge was balanced.
The resistance values of R3 were calculated according to the following equation:
This equation would give the resistance of R3 when the distance is compared to the total
length of the rheostat. Finally, the errors were analyzed. The calculations are shown in
Appendix 7.1.3.
5. CONCLUSION
In this extended essay, factors (related with the resistance to be measured and the adjustable
one) affecting the sensitivity of a Wheatstone bridge for its purpose in measurement were
investigated. The results indicated that, although precise measurement can be done with the
help of a Wheatstone bridge, there are conditions for it that need to be fulfilled. Firstly, the
values of R1 and R2 must be close enough to allow a sensitive measurement for both high and
high values of resistances. It is important not to ignore the temperature change while
balancing the bridge, since a shift in temperature can also affect the resistance of a resistor.
The actual and calculated values of R4 should have been equal for all the trials; however the
results clearly indicate the existence of a deviation with an increase in R3 and R4. As seen in
Graph 2, the results differ increasingly with the number of trials, which tested R3 and R4
values in an increasing order. The absolute and percentage errors can be calculated as the
following:
Mean of the Literature Values = 32.42
Mean of the Difference between the calculated and literature values = 32.42 – 30.77
= 1.65 = Absolute error
Percentage Error = Absolute Error/Literature Value = 1.65/32.42 = 0.0510 = 5.1%
The absolute error for the trials increased with the values of R3 and R4. However, since the
absolute errors were small compared to the literature values, the percentage errors for the
trials were not in increasing order, the first trial having the biggest percentage error. The
reason for this is in the first trial, a 0.5Ω absolute error is compared to the literature value of
0.1Ω. In the last trial however, although the percentage error was 11%, a 10.75Ω deviation
was compared to a 100Ω literature value. A graph was plotted to show the increase in the
value of the absolute error with each trial.
SOLMAZ D1129015
12
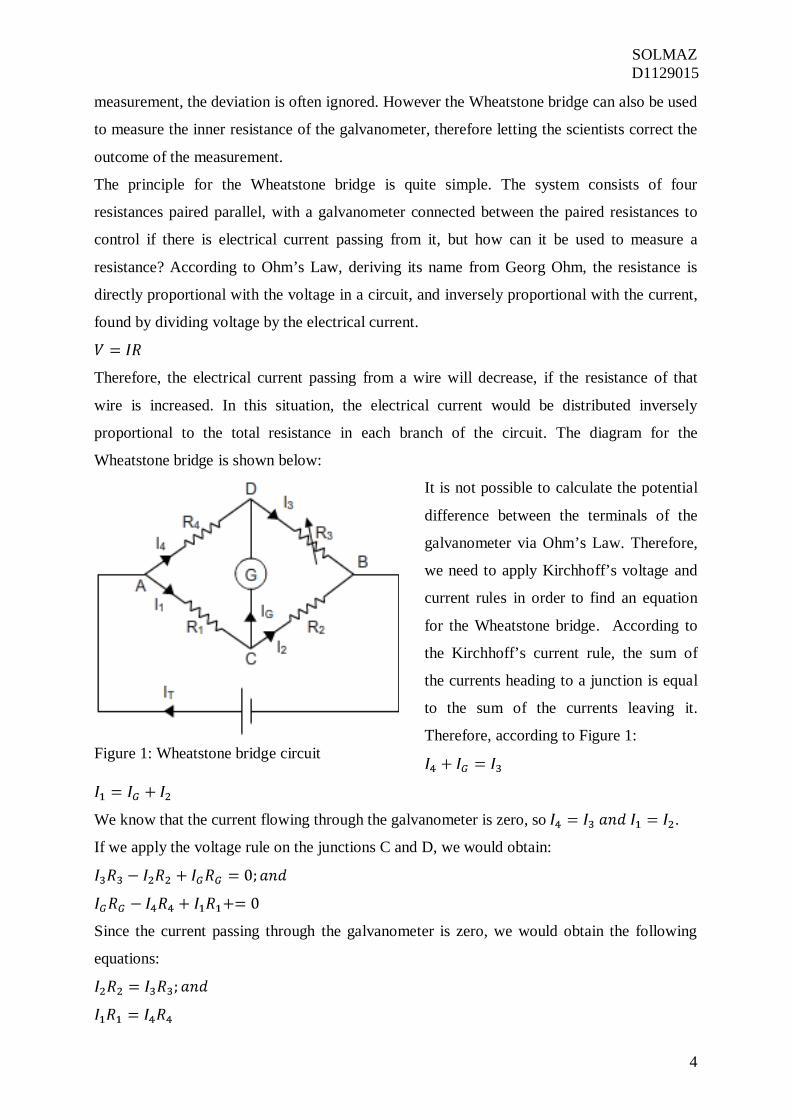
Although the experiment resulted in a percentage error of 5.1% which is acceptable, it also
showed clearly that with an increase in R3 and R4, the correlation of the results has clearly
decreased.
6. EVALUATION
6.1. Sources of Error
• A source of error may be the increase in temperature. If the thermo-electrical friction
coefficient of the resistors was too large, it may have caused the resistance to increase
and current to decrease. It is an important fact that the experiment should be made in
an isolated medium, in which the temperature is kept constant. The potential
difference of the system should be limited to a minimum which could both allow a
sensitive measurement and prevent overheating.
• Another source of error might have resulted from the multimeter itself. If the shunt
resistance of the multimeter was too big, it may have caused inaccuracy; or the
multimeter could not have get rid of its initial charge, causing inaccuracy at the
beginning of the experiment. To correct this source of error, another multimeter with a
smaller shunt resistance can be used.,
• Other than the stated reasons, the source of error may be what was tried to be proven
in the hypothesis. The values of R3 and R4 should be smaller than that of R1 and R2 or
close values for the measurement to be even more accurate.
• The resistance of the connecting leads could have caused the inaccuracy in the
experiment. “A foot of 22 S.W.G. copper wire has a resistance of about 0.014 ohm.”
This shows that the resistances of the bridge arms may have increased with the wires
that connect them to each other.
Wheatstone bridge is an instrument that has brought a new meaning to electrical
measurement. With it, the scientists have explored new and alternative ways of measurement
(especially in alternating current), and with its help many factors that have once been ignored
were brought to daylight. The Wheatstone bridge is a perfect and most basic example of
circuit which describes the temperature’s effects on electricity, something which we cannot
ignore especially when designing and constructing today’s technology. The bridge circuit is
the only circuit when the current that is applied cannot be derived via Ohm’s law, and is a
perfect example of the application of Kirchhoff’s rules. During the first time it was invented,
it was a leap towards a new age for the electrical industry; and we are happy to see its
mysteries solved today.

SOLMAZ D1129015
13
7. APPENDIX
7.1. Data Collection and Processing
7.1.1. Data Collection
# of
trials
Resistance of
R4 (±0.05Ω)
Resistance of
R1 (±0.05Ω)
Resistance of
R2 (±0.05Ω)
Voltage of the
battery
(±0.05v)
Current flowing
through the
multimeter
(±0.05A)
1 0.10 10.00 10.00 30.00 0.00
2 1.00 10.00 10.00 30.00 0.00
3 2.00 10.00 10.00 30.00 0.00
4 4.00 10.00 10.00 30.00 0.00
5 6.00 10.00 10.00 30.00 0.00
6 8.00 10.00 10.00 30.00 0.00
7 10.00 10.00 10.00 30.00 0.00
8 20.00 10.00 10.00 30.00 0.00
9 25.00 10.00 10.00 30.00 0.00
10 30.00 10.00 10.00 30.00 0.00
11 35.00 10.00 10.00 30.00 0.00
12 40.00 10.00 10.00 30.00 0.00
13 50.00 10.00 10.00 30.00 0.00
14 60.00 10.00 10.00 30.00 0.00
15 70.00 10.00 10.00 30.00 0.00
16 90.00 10.00 10.00 30.00 0.00
17 100.0 10.00 10.00 30.00 0.00
Table 1: Table showing the different resistances used during the experiment, the resistance of
the rheostat, length of the rheostat (in order to calculate R3), distance of the slider from the
head of the slider, voltage of the battery, and the current that is read in the multimeter, to
indicate that no current has passed through it.
SOLMAZ D1129015
14
# of
trials
Resistance of the rheostat
(±0.05Ω)
Length of the rheostat
(±0.05cm)
Distance of the slider from
the head of the rheostat
(±0.05cm)
1 150.00 100.00 0.40
2 150.00 100.00 0.90
3 150.00 100.00 1.50
4 150.00 100.00 2.80
5 150.00 100.00 4.10
6 150.00 100.00 5.40
7 150.00 100.00 5.80
8 150.00 100.00 15.30
9 150.00 100.00 16.50
10 150.00 100.00 18.10
11 150.00 100.00 21.00
12 150.00 100.00 24.90
13 150.00 100.00 30.10
14 150.00 100.00 42.60
15 150.00 100.00 43.40
16 150.00 100.00 56.40
17 150.00 100.00 59.50
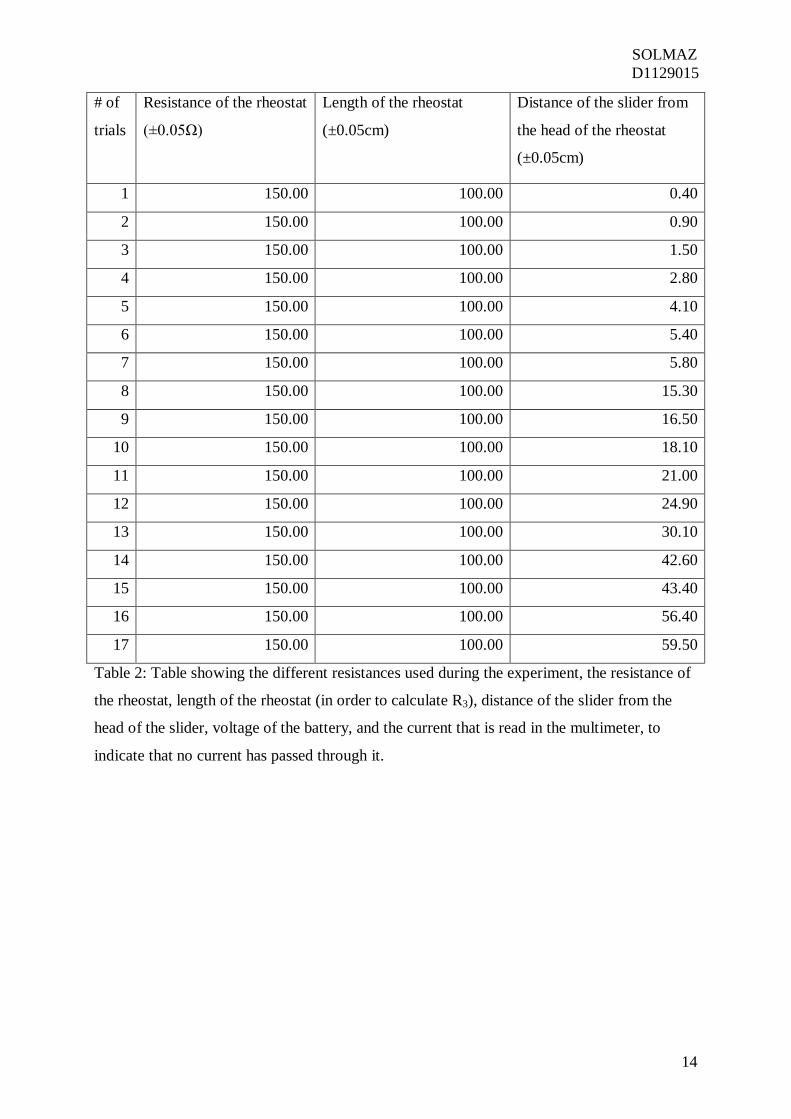
Table 2: Table showing the different resistances used during the experiment, the resistance of
the rheostat, length of the rheostat (in order to calculate R3), distance of the slider from the
head of the slider, voltage of the battery, and the current that is read in the multimeter, to
indicate that no current has passed through it.

SOLMAZ D1129015
15
7.1.2. Data Processing and Presentation
Figure 3: Figure representing the rheostat as the resistor R3.
To see if the data collection was precise, we must calculate the resistance of R3. Since is
equal to 1 (because the resistances R1 and R2 are both equal to 10.00), R3 that is calculated in
the data processing (as in the equation below) should be equal to R4. The resistance of R3 is
would be calculated as the following. Also, according to the equation about
Figure 1 that has been mentioned before:
According to the formula above, all of the R3 values can be calculated precisely. The
calculations are showed in the following section.

SOLMAZ D1129015
16
7.1.2.1. Resistance Calculations
Trial 1:
Trial 2:
Trial 3:
Trial 4:
Trial 5:
Trial 6:
Trial 7:
Trial 8:
Trial 9:
Trial 10:
Trial 11:
Trial 12:
Trial 13:
Trial 14:
Trial 15:
Trial 16:
Trial 17:

SOLMAZ D1129015
17
# of
trials
Resistance of
the rheostat
(±0.05Ω)
Length of the
rheostat
(±0.05cm)
Distance of the
slider from the
head of the
rheostat
(±0.05cm)
Calculated
resistance of R3
which should also
be equal to R4 (Ω)
Resistance of
R4 used in the
experiment
(±0.05Ω)
1 150.00 100.00 0.40 0.60 ± 0.08 0.10
2 150.00 100.00 0.90 1.35 ± 0.08 1.00
3 150.00 100.00 1.50 2.25 ± 0.08 2.00
4 150.00 100.00 2.80 4.20 ± 0.08 4.00
5 150.00 100.00 4.10 6.15 ± 0.08 6.00
6 150.00 100.00 5.40 8.10 ± 0.08 8.00
7 150.00 100.00 5.80 8.70 ± 0.08 10.00
8 150.00 100.00 15.30 22.95 ± 0.09 20.00
9 150.00 100.00 16.50 24.75 ± 0.10 25.00
10 150.00 100.00 18.10 27.15 ± 0.10 30.00
11 150.00 100.00 21.00 31.50 ± 0.10 35.00
12 150.00 100.00 24.90 37.35 ± 0.11 40.00
13 150.00 100.00 30.10 45.15 ± 0.11 50.00
14 150.00 100.00 42.60 63.90 ± 0.13 60.00
15 150.00 100.00 43.40 65.10 ± 0.13 70.00
16 150.00 100.00 56.40 84.60 ± 0.15 90.00
17 150.00 100.00 59.50 89.25 ± 0.15 100.00
Table 3: Table showing the resistance and the length of the rheostat, the distance of the slider
from the head of the rheostat, the resistance of R4 used in the experiment and the calculated
resistance of R3 which should be equal to R4 as mentioned previously.
SOLMAZ D1129015
18
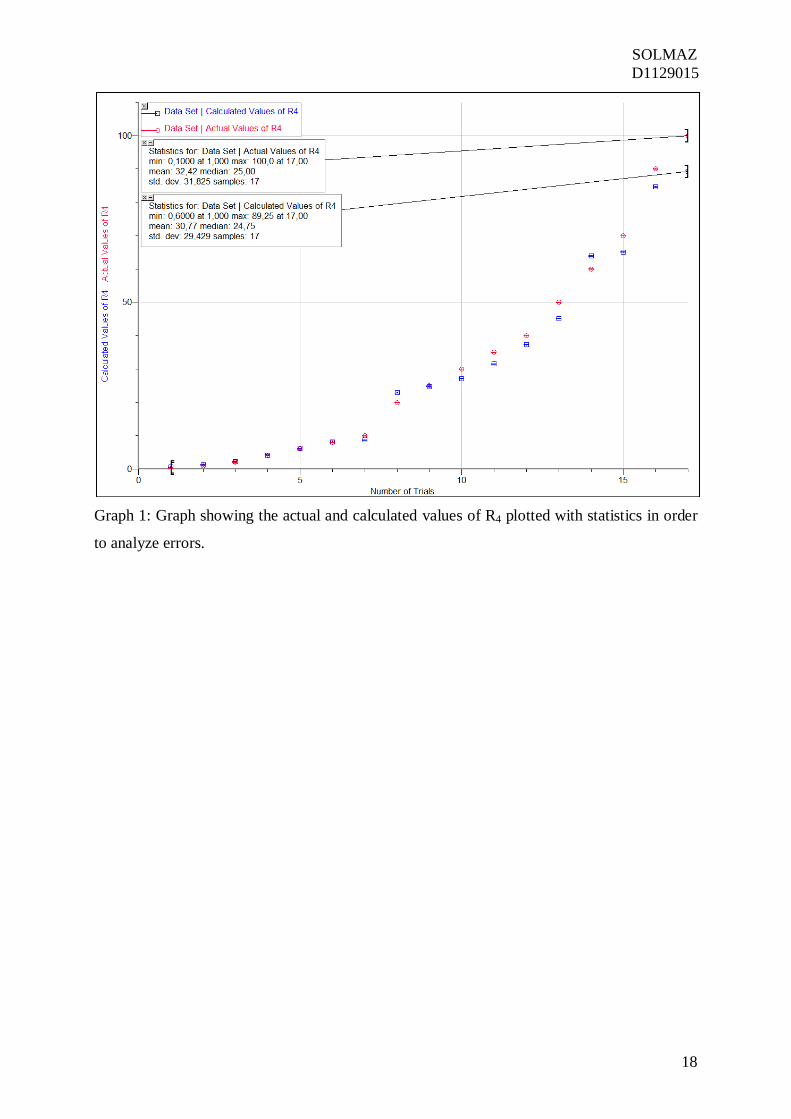
Graph 1: Graph showing the actual and calculated values of R4 plotted with statistics in order
to analyze errors.
SOLMAZ D1129015
19
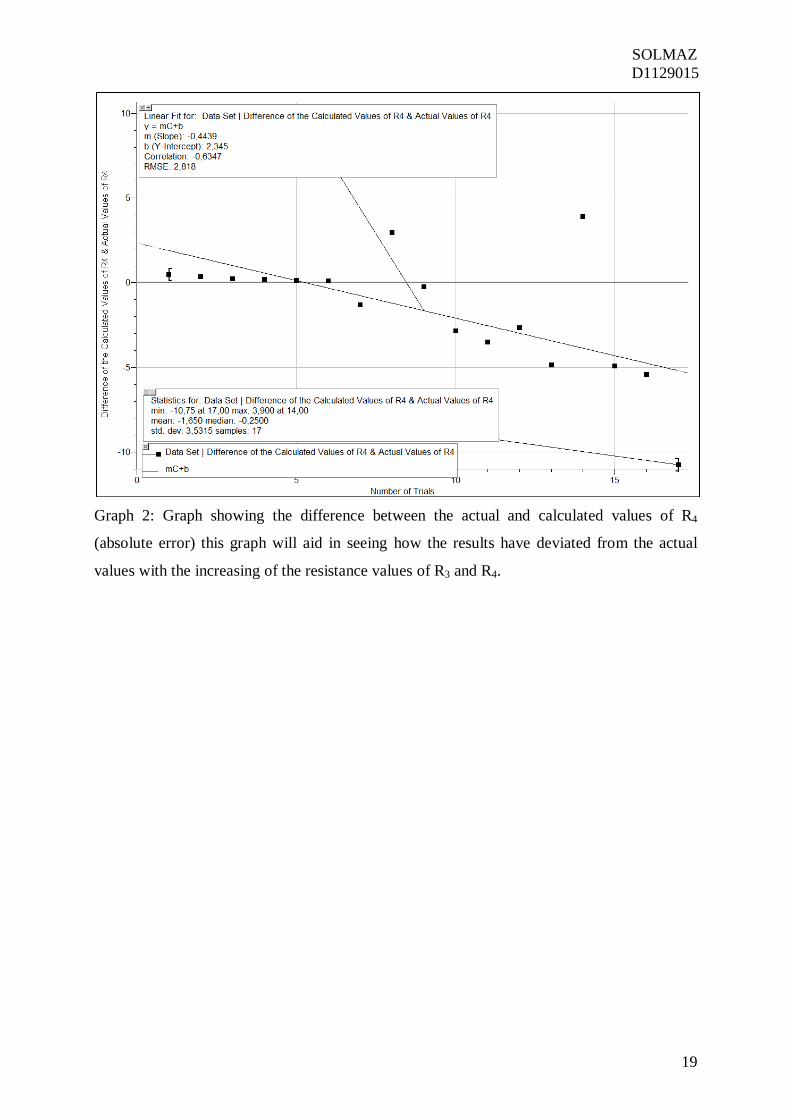
Graph 2: Graph showing the difference between the actual and calculated values of R4
(absolute error) this graph will aid in seeing how the results have deviated from the actual
values with the increasing of the resistance values of R3 and R4.
SOLMAZ D1129015
20
7.1.3. Error Analysis
In the third table of Data Processing and Presentation, the column “Resistance of R4 used in
the experiment” is going to be used as the literature value for the error analysis, since the
resistance values that belong to R4 are measured and actual values. The absolute error is
calculated as:
Where Δx is the absolute error,
x0 is the literature value,
x is the experiment value. Therefore, the absolute errors for all the trials are calculated as:

SOLMAZ D1129015
21
Trial 1: =0.50 ± 0.03
Trial 2: =0.35 ± 0.03
Trial 3: =0.25 ± 0.03
Trial 4: =0.20 ± 0.03
Trial 5: =0.15 ± 0.03
Trial 6: =0.10 ± 0.03
Trial 7: =1.30 ± 0.03
Trial 8: =2.95 ± 0.04
Trial 9: =0.25 ± 0.05
Trial 10: =2.85 ± 0.05
Trial 11: =3.50 ± 0.05
Trial 12: =2.65 ± 0.06
Trial 13: =4.85 ± 0.06
Trial 14: =3.90 ± 0.08
Trial 15: =4.90 ± 0.08
Trial 16: =5.40 ± 0.10
Trial 17: =10.75 ± 0.10

SOLMAZ D1129015
22
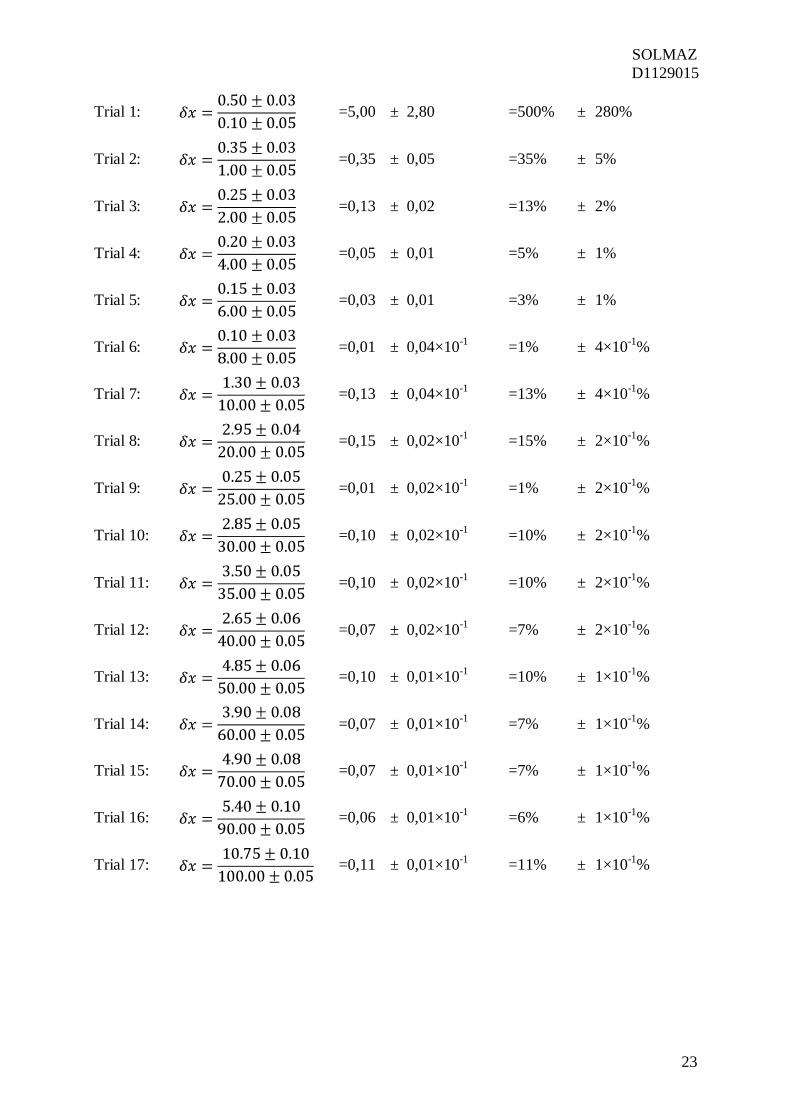
Relative error for each trial will be calculated as in the following equation:
Where δx is the relative error,
Δx is the absolute error,
x is the literature value.
The percentage error is equal to the relative error multiplied by 100. The calculations are done
accordingly below:
SOLMAZ D1129015
23
Trial 1: =5,00 ± 2,80 =500% ± 280%
Trial 2: =0,35 ± 0,05 =35% ± 5%
Trial 3: =0,13 ± 0,02 =13% ± 2%
Trial 4: =0,05 ± 0,01 =5% ± 1%
Trial 5: =0,03 ± 0,01 =3% ± 1%
Trial 6: =0,01 ± 0,04×10-1 =1% ± 4×10⁻¹%
Trial 7: =0,13 ± 0,04×10-1 =13% ± 4×10⁻¹%
Trial 8: =0,15 ± 0,02×10-1 =15% ± 2×10⁻¹%
Trial 9: =0,01 ± 0,02×10-1 =1% ± 2×10⁻¹%
Trial 10: =0,10 ± 0,02×10-1 =10% ± 2×10⁻¹%
Trial 11: =0,10 ± 0,02×10-1 =10% ± 2×10⁻¹%
Trial 12: =0,07 ± 0,02×10-1 =7% ± 2×10⁻¹%
Trial 13: =0,10 ± 0,01×10-1 =10% ± 1×10⁻¹%
Trial 14: =0,07 ± 0,01×10-1 =7% ± 1×10⁻¹%
Trial 15: =0,07 ± 0,01×10-1 =7% ± 1×10⁻¹%
Trial 16: =0,06 ± 0,01×10-1 =6% ± 1×10⁻¹%
Trial 17: =0,11 ± 0,01×10-1 =11% ± 1×10⁻¹%

SOLMAZ D1129015
24
8. BIBLIOGRAPHY
• Brophy, James J.. Basic Electronics for Scientists
• Buckingham, H..
. Fifth Edition. McGraw-Hill
Companies, 1990.
Principles of Electrical Measurements
• Northrup, Edwin Fitch.
. London: Hodder &
Stoughton Ltd, 1966.
Methods of measuring electrical resistance
• Noakes, G.R..
. New York:
McGraw-Hill Companies, 1912.
New intermediate physics
• Giancoli, Douglas C..
. Fifth Edition. London: Macmillan, 1970.
Physics: Principles with Applications
• Serway, Raymond A..
. Fifth Edition. New
Jersey: Prentice Hall, 1997.
Physics for Scientists and Engineers with Modern Physics.
Fourth Edition. U.S.A.: James Madison University, 1996.


![Basic Laws [相容模式] - National Chiao Tung University · Basic Laws •Ohm’s Law (resistors) •Nodes, Branches, and Loops •Kirchhoff’s Laws •Series Resistors and Voltage](https://static.fdocuments.in/doc/165x107/5f15b0c622d58c259b26ad85/basic-laws-c-national-chiao-tung-basic-laws-aohmas-law-resistors.jpg)