Teck Chair in Exploration Geophysics - University of · PDF fileTeck Chair in Exploration...
24
Contact: Bernd Milkereit Phone: 416-978-2466 Email: [email protected] Teck Chair in Exploration Geophysics Annual Activity Report 2015/2016
Transcript of Teck Chair in Exploration Geophysics - University of · PDF fileTeck Chair in Exploration...

Contact: Bernd Milkereit Phone: 416-978-2466 Email: [email protected]
Teck Chair in Exploration Geophysics
Annual Activity Report 2015/2016

2
Direction of Research In July 2013, I transferred to the Department of Earth Sciences at the University of Toronto. We maintain a fully visible research program in exploration geophysics. We combine the development of new geophysical exploration technology with international scientific drilling or drilling projects conducted by industry. Seismic imaging of high impedance mineral and gas hydrate deposits Applying conventional seismic exploration techniques to image gas hydrate accumulations or deep mineral deposits poses a problem: seismic wave scattering caused by strong local contrasts in physical rock properties. Massive sulfides exhibit variable compressional and shear wave velocities but density contrasts often exceed 50%. Gas hydrate accumulations are characterized by high compressional and shear wave contrasts (up to 100%), highly variable attenuation (Q-factor) and no significant density contrasts. Modeling studies of such local high impedance (velocity-density product) contrasts require accurate 3D geological/petrophysical models consistent with all available borehole geophysical, geological and structural data. When strong local contrasts in physical rock properties are present, seismic waves are scattered by the inhomogeneities. Two effects can be observed: the attenuation of the transmitted (direct) wave, the excitation of seismic coda (due to P-S wave conversion). Robust modeling capabilities of strong seismic impedance contrasts are important for a better understanding of wave propagation effects in small scale structures. 3D elastic/visco-elastic modeling of high impedance exploration targets (massive sulfides and gas hydrates) revealed that local high impedance exploration targets (massive sulfides and gas hydrates) revealed that local high impedance contrasts lead to strong and complex scattering responses, often dominated by converted shear waves. In addition, amplitude focusing caused by the shape of the deposit (scale factors) will lead to pronounced amplitude versus offset/azimuth trends. Thus seismic data acquisition geometries and source frequencies must be carefully selected in order to observe characteristic amplitude and phase variations. If observed, the scattering response may serve as a diagnostic tool to classify the composition of the seismic exploration target.

3
Recently, I initiated long-term research projects in two new areas:
Estimation of geotechnical parameters from seismic and density data with special emphasis of high density rocks (such as massive sulfide ores, Fe-oxides, barite). In collaboration with industry, we are developing a new 3-parameter framework of seismic velocities, densities and elastic moduli in order to accommodate the high density materials. Borehole geophysical test data sets (full waveform sonic and calibrated density logs) as well as drill core samples for geotechnical testing are provided by the industry partners.
I used my current sabbatical to initiate and to conduct a number geophysical field projects (borehole EM for gold exploration in northern Quebec, in-mine geophysics in Sudbury, and random walk magnetic data acquisition for bedrock mapping in New Brunswick).
Collaborative Research Projects
Acknowledgement – Research Supports In 2015-2016, research grants were provided by NSERC (Natural Sciences and Engineering Research Council of Canada) and CEMI (Center for Excellence in Mining Innovation) for evaluation of geophysical monitoring tools and techniques in deep mines (the SUMIT ORF project).
Rock Mass Characterization and Monitoring (SUMIT: Smart Underground Monitoring and Integrated Technologies for Deep Mining Project) A collaborative ORF proposal (SUMIT) was submitted by Laurentian University, University of Toronto and Queen’s University for the integration of novel technology into the mineral resource extraction process. The SUMIT project develops data collection, information and energy management strategies, control systems and smart engineering techniques to assist in reducing risks at deep underground mines ( a 5 year project: 2011-2016).
These collaborative interdisciplinary research teams are addressing many of the barriers currently delaying the establishment of new mines and the deepening of existing mines. These outstanding teams are helping to develop new ways to mitigate and manage risks, accelerate mine development and reduce energy consumption by: capturing and sharing data in innovative ways from underground environments to optimize deep underground mine design and construction techniques and also developing communications hardware/software, data storage, security and sharing control systems and related technologies.

4
The NSERC-CRD “Integrated multi-parameter footprints of ore systems: The next generation of ore deposit models” provides the experimental and computational framework for advances in exploration geophysics and petrophysical studies of large Copper, Uranium and Gold deposits in Canada (a 5 year project: 2013-2018).
Mineral exploration in Canada is increasingly focused on concealed and
deeply buried targets, requiring more effective tools to detect large-scale ore-forming systems and to vector from their most distal margins to their high-grade cores. This network has been formed to aid the mining industry in discovering the next generation of mineral deposits. The network includes 42 researchers from 24 universities across Canada and 45 industry collaborators from 27 mining, mineral exploration, and mineral exploration service companies, with initial funding of ~$13m cash and in-kind support from the Canada Mining Innovation Council (CMIC) and the Collaborative Research and Development Program of the Natural Sciences and Engineering Research Council of Canada. Phase I of the first project will establish the linkages between different kinds of geological, mineralogical, geochemical, and geophysical data at three of Canada's most important ore deposit types to discover new combinations of measurable parameters that define the footprints of ore systems.
Locations:
We combine the development of new geophysical exploration technology/methodology with the drilling projects conducted by industry (mineral exploration in Canada) or International Continental Drilling Projects ICDP) (gas hydrates, impact craters and hydrothermal systems). Ongoing research projects focus on unique pressure-temperature conditions related to meteorite impacts (Bosumtwi, Ghana; Chicxulub, Mexico; Sudbury & Wanapitei, Canada; Monturaqui, Chile), the physical properties of permafrost and gas hydrates (Mackenzie Delta, Canada) and 3D seismic research projects for deep mineral exploration (Ontario, Quebec, New Brunswick, Alaska, Ireland, British Columbia and Athabasca Basin) (Figure 1 and Table).

5
Figure 1: Location map of past, current and future scientific drilling projects, seismic and borehole geophysical studies conducted between 2003 and 2016.
L
M
N O P Q
6
Location Project
A Malik, NWT, Canada Permafrost & Gashydrate studies 3D seismic imaging
B Athabasca Basin, Canada Borehole Geophysics MacArthur River Mines
C Chicxulub, Mexico Hydrothermal System Meteorite Impact
D Monturaqui Impact Crater, Chile Geophysics and Geology
E Bosumtwi, Ghana Scientific Drilling Hydrothermal System Meteorite Impact
F Bathurst Mining Camp, NB, Canada Physical Rock Properties of Massive Sulfides
G Sudbury, Ontario, Canada Meteorite Impact Physical Rock Properties Borehole Geophysics
H Outokumpo, Finland Physical Rock Properties Scientific Drilling
I Val d’Or, Quebec, Canada 3D Seismic Imaging, borehole
J Thompson, Manitoba Petrophysics 3D Seismic Drilling
K Mjoeinir Meteorite Impact, Barent Sea, N
Scientific Drilling
L Perth, Western Australia Groundwater exploration
M Alaska, USA Physical rock properties; Seismic Imaging for Mineral exploration
N Ireland Physical rock properties; Seismic Imaging for Mineral exploration
O Athabasca Basin Borehole Geophysics. Vertical seismic profiling (VSP) Mineral Exploration. 3D-3C Seismic Imaging
P Malartic Quebec 3D Borehole DC/IP Imaging
Q HVC (Highland Valley Copper), B.C. Near Surface Seismic Imaging

7
Current Research Projects
Analysis of velocity dispersion using full-waveform multi-channel sonic logging data: a case study (Sun et al., 2016) Seismic attenuation and velocity dispersion are potentially able to reveal the rock physical properties of the subsurface. Conventionally, a frequency-independent quality factor (Q) is measured. This Q is equivalent to the total velocity dispersion in a seismic record and is inadequate for analyzing the attenuation mechanism or rock physical properties. Here a new method is proposed to extract the velocity dispersion curves, so that more attributes can be obtained from full-waveform multi-channel sonic logging data, especially the critical frequency (fc) if it is within the bandwidth of the data. This method first decomposes the seismic data into a series of frequency components, computes the semblance of each frequency component for different velocity values, cross-correlates the semblance matrices of adjacent frequency components to get the velocity gradients, and finally integrates to obtain a velocity dispersion curve. Results of this method are of satisfactory accuracy and robustness. Figure 2. shows a synthetic data set with the new beam forming velocity analysis. This method is applied to the data acquired in Mallik 5L-38 gas hydrate research well in Mackenzie Delta, Northwest Territory, Canada. The observed P-wave velocity dispersion compares well with the geological setting. In the gas hydrate zone (about 900-1100 m), high concentration of gas hydrate causes very strong velocity dispersion and a distinct fc at about 15 kHz, likely due to strong scattering of centimeter inclusions of gas hydrate; concurrently, water flow in connected cracks in some ranges of this zone adds a large part of velocity dispersion and a dimmer fc at about 9.5 kHz. Immediate underneath the gas hydrate zone, abundant free water in weakly-laminated sediments causes quite strong velocity dispersion and an fc at about 6.5 kHz. Velocity dispersion is mild and without an obvious fc in sediments above the gas hydrate zone.

8
Figure 2: A synthetic example of full-waveform multi-channel sonic logging data with P and S waves. (A)The waveform. For the record at the first channel, the bandwidth above –40 dB is 7.5-20.5 kHz for P wave and 3.5-24.5 kHz for S wave. Maximal amplitude of P wave is –16 dB in the 11-17 kHz band. The P-wave onset is at 1.1 ms, and the S-wave onset is at 1.8 ms. Records at the other channels are calculated using a constant Q of 15, VP (14 kHz) = 2500 m/s, and VS (14 kHz) = 1580 m/s. Sampling interval 10 ns. (B) The semblance matrix calculated using beam forming, ∆v = 2 m/s. The black box marks the τ–v range of P wave, and the white circle denotes the maximum, indicating a VP measurement of 2500 m/s..

9
Time-lapse Geophysical Data from a Stressed Environment (Tibbo et al., 2015) A complication in geophysical monitoring of deep mines is the high-stress dependency of the physical properties of hard rocks. This project is part of a comprehensive, exploration geophysical study in a deep, highly stressed mine located in Sudbury, Ontario, Canada. Data from in situ monitoring of the mining induced seismicity, conductivity, and stress dependent physical properties have been obtained from two boreholes located in this mine. These borehole are approximately 400 m long with NQ diameters and depths of about 1300 - 1600 m and 1700 - 2000 m. Three borehole logging surveys were performed on both boreholes between October 2013 and July 2015, in order to perform a time-lapse analysis of the geophysical changes in the mine. These multi-parameter surveys include caliper, full waveform sonic, televiewer, chargeability (IP), and resistivity. Multi-electrode array DC/IP borehole and borehole-to-borehole surveys were also conducted in 2014, showing an increase in resistivity only in the 1300 m borehole near the active mining area, possibly due to stress induced closing of fractures.(Fig.3). There is only exploration activity near the 1700 m borehole over this time period, and it therefore shows no changes in resistivity.
Fig 3. Apparent resistivity pseudo-section 1300 level borehole measured in 2013-2015. Note the overall increase in resistivity over the 2-year period (green-blue colour). The red colour at 50 m distance indicate the presence of the above ore in the deep mine.
10
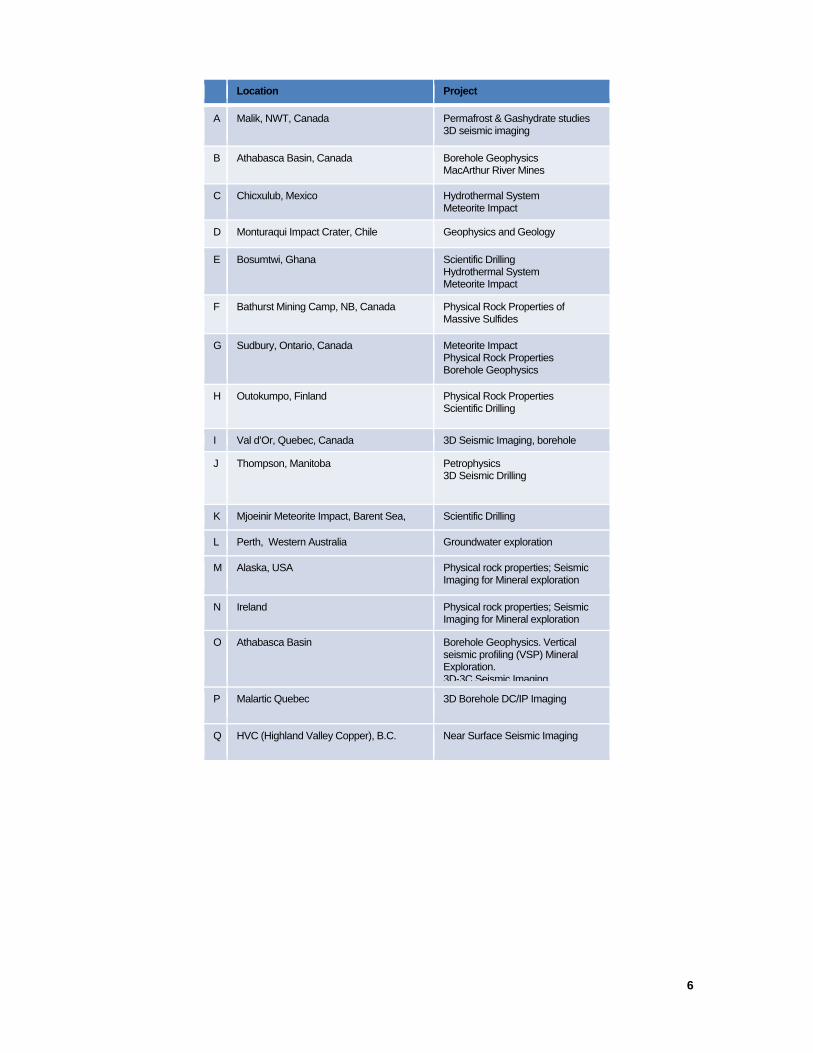
Seismic Imaging in a low Q Environment (Shi, D. et al, 2016) Seismic data quality can be reduced significantly in a strong attenuation environment with low Q values. The very strong attenuation of seismic waves in the Athabasca Basin, Saskatchewan, was previously assumed to occur because of the presence of unconsolidated near surface materials (i.e. the overburden). However, we observe an extremely low Q over the entire extent (i.e. from 50 to 450m) of the vertical seismic profiling (VSP) data acquired in 2007. Various measuring techniques performed on the near-offset dataset confirm that locally Q can be lower than 10 (Fig.4).
Figure 4: Left: the time-domain amplitude decay measurement of the over-all Q from the Athabasca Basin VSP dataset. Right: Spectrum ratio and dispersion measurements of Q values at each receiver depth from uncorrelated VSP data. Qkk: calculated from the linear dispersion of the ray-path-average VP in the 30 to 150 Hz band. Qsr: calculated from the spectral ratio of the first break in the 120 to 290 Hz band.

11
Q estimation methods used are time-domain amplitude decay, frequency-domain spectrum ratio and forward viscoelastic waveform modelling. The Q is lower than values obtained from marine and land seismic exploration datasets associated with either gas anomalies or volcanic chambers. Meanwhile, high Q (i.e. >>100) observed from the offset VSP data (i.e. source located 300 m away from the near-offset one, and likely to be away from local alteration) indicates the attenuation condition can be correlated with sandstone alteration. Thus, a vertically occurring low-Q body (e.g. an attenuating plume) is a more realistic model to explain the strong attenuation rather than the overburden-only model. Such environments are challenging for seismic imaging as the signal-to-noise ratio (SNR) is strongly reduced by loss of wave energy. We therefore expect to achieve an attribute model through Q tomography, and this will be utilized for compensation of the energy loss in the future processing of surface seismic data in the Athabasca Basin.
Seismic detection and delineation of a low Q structure (Shi, et al., 2016) A highly localized and extremely low Q values are detected through multiple measurements from seismic datasets acquired for mineral exploration in the Athabasca Basin. Q estimation methods used are time-domain amplitude decay, frequency-domain spectrum ratio and velocity dispersion. The results confirm that locally Q can be smaller than 10, which is lower than all the values obtained from marine and land seismic exploration datasets associated with either gas anomalies or volcanic chambers. The very strong attenuation of seismic waves in the Athabasca Basin was previously assumed to occur because of the overburden. However, low Q observed over the entire borehole extent indicates it reflects deep rock anelastic properties.

12
Figure 5: Upper left: manually picked first break times from 181 shots plotted with absolute offsets. Upper right: first break RMS amplitudes from the same shots plotted with absolute offsets. Lower left: first break azimuthal apparent velocities, calculated from the decomposed traveltime with 10-degree intervals. Lower right: azimuthal Q, calculated from the decomposed above RMS amplitude with 10- degree intervals We have also discovered an azimuth-dependent nature of both the velocity and Q through the analyses of the manually picked first break traveltimes and amplitudes from the surface data. Variations of velocity appear to be primarily affected by the local topography, while behaviours of Q reflect deeper features such as fault and fault associated alterations. Such environments are challenging for seismic imaging as the signal-to-noise ratio is strongly reduced. An attribute model through Q tomography can be utilized for compensation of the energy loss in the future processing of surface seismic data.
13
Linking Seismic and Geotechnical Parameters using the Velocity-Density Relationship (Kassam et al., 2016) Density, Birch’s seismic parameter, and bulk modulus create a link between observed compressional and shear wave velocities of rock densities for common silicates, iron-oxides, and massive sulfides established from a previous study using lab measurements. Real field borehole measurements are analyzed against a caculated theoretical three-dimensional surface and compared with existing lab samples and a seismic Earth model. All data points fall on this surface or a plane thereby supporting an empirical surface relationship to which elastic moduli can be obtained from seismic compressional and shear velocities and in turn calculate the density physical property of rocks. In many geotechnical applications, borehole logging is used extensively to measure physical rock property contrasts and evaluate the quantitative link between geology and geophysics. Additional logging may be required for each well if more than one physical property is to be measured (i.e density and acoustic impedance) which can be costly and time consuming. Density is a measurement of mass per unit volume (kg/m3) and is particularly an important parameter used for rock characterization to differentiate between lithologies and calculate other petrophysical properties. Furthermore licensing, shipping and safety considerations of radioactive material such as Cs137 or Co60, often used in density logging are impediments to its use. Long-established empirical relationships such as Gardner, Birch, and Nafe-Drake relationships show that compressional wave (Vp) and shear wave (Vs) velocities increase with increasing densities of common crystalline rocks but do not for iron-oxides and massive sulfides nor do they consider S-wave velocities. A new unique velocity-density relationship of common silicates, iron-oxides, and massive sulfides has been discovered in a previous study, presented at the 3rd International Workshop on Rock Physics in Australia, using a database of elastic parameters based on widespread compilation of lab samples. Lab measurements were taken from core samples of isotropic, non-porous metamorphic rocks. In this study, the goal is to use real measurements from borehole logging to link seismic and geotechnical parameters by using a theoretical three-dimensional surface and comparing it to the lab measurements and a seismic Earth model. The d-sp-k surface could be derived into a parametric equations to then be used for obtaining elastic moduli from Vp and Vs borehole seismic data and as a result provides a link to calculate density. Using borehole seismic data acquistion in lieu of borehole density logging to determine elastic moduli for rock charaterization can lead to large cost-saving effects plus improved understanding as Vp/Vs is aquired more routinely with less regulatory and safety concerns.

14
Figure 6: A and B, two different perspective views of three-parameter cross plot of d-sp-k theoretical surface with lab measurements, PREM seismic Earth model, and real mineral exploration/hardrock borehole geophysical data superimposed. All physical rock property data trend along the theoretical surface.

15
3D Wave-Equation-based wavefront reconstruction from sparse data using a finite-difference reverse-time migration technique (Carey, et al, 2016) Extrapolation of seismic wavefields can be very useful for determining the location of the seismic source, as well as how the wavefront propagates given different local conditions. Reverse-time migration can be used effectively to achieve this extrapolation, and does not suffer from the shortcomings of depth migration such as incorrectly migrating steeply dipping layers. Using reverse-time migration, this study aims to reconstruct 3D wavefronts from sparse synthetic data, and to apply this method to real data from Nickel Rim South mine in Sudbury, Ontario. This allows for visualization of the propagation of wavefronts, which is essential for understanding localized effects on seismic waves. Sparse data can also be seen in microseismic arrays involving surface and borehole receivers, which can offer poor azimuthal coverage. Synthetic seismic data will be generated to examine the limit of azimuthal coverage that still enables accurate wavefront reconstruction. A method for extrapolating seismic wavefields backwards in time, known as reverse-time migration (RTM) was introduced by McMechan (1983) and Baysal (1983). Using the two-way wave equation, energy can be propagated through a two-dimensional second order finite-difference grid, thus propagating the wavefront iteratively backwards in time. Prior to RTM, finite-difference algorithms with paraxial approximations had been used in a similar process known as depth-migration, where due to difficulties with these approximations, were not able to correctly migrate steeply dipping layers. The method of reversetime extrapolation is able to migrate these same dipping layers correctly, as the two-way wave equation, not an approximate one-way wave equation, is used. Using this method, wavefronts can be propagated backwards in time to t = 0, where the location of the source may be determined. Using RTM to reconstruct wavefronts incrementally backward in time may offer insight into localized peak particle velocity (PPV) and peak particle acceleration (PPA) used in hazard assessment. This is a step forward from conventional monitoring, where event triangulation is used and local effects are not usually considered. With microseismic monitoring arrays, used in mining as well as hydraulic fracturing operations, full coverage can be an issue. This leads to sparse data being recorded, and hence more difficulty using migration techniques for imaging purposes. For in-mine microseismic monitoring systems, there is true 3D coverage, but generally it is a sparse array of geophones (see figure 7.1). In the case of monitoring hydraulic fracturing wells, vertical seismic profiling is generally used. This involves an array of 3-component (3C) geophones within a borehole, as well as an array of 3C surface geophones (see figure 7.1). This specific type of setup may have limited azimuthal coverage in three dimensions. This study will determine a lower-bound to data needed for accurate wave-equation-based reconstruction of wavefronts. In addition to determining source location, the wavefront may be

16
analyzed for local anomalous behavior throughout the reverse-time migration. (Fig 7.2, 7.25, 7.3). Using finite-difference techniques for reverse-time migration, wavefronts can be reconstructed from sparse data. This is useful for potential hazard assessment of areas where local changes in medium may affect the peak particle velocity or acceleration. Areas like mines and hydraulic fracturing sites need to ensure the highest level of safety, and being able to understand how exactly a wavefront propagates through a specific locality lends itself well to that goal.
Figure 7.1: 3D data acquisition model of a combination of borehole and surface 3C seismic arrays, surrounding a seismic source. This type of setup is seen in microseismic and hydraulic fracture monitoring.
Figure 7.2: Shift of wavefronts towards Figure 7.3: Reverse-time migration reference radius, followed by interpolation. Towards seismic service.

17
High resolution marine seismic surveying of Holocene environments and tectonics in the Sudbury Basin, Ontario, Canada. (Zajch et al., 2015) The Sudbury Structure has been extensively studied for its associated economic mineral deposits and, more recently, the environmental impacts of mining. There has been little interest in exploring the Sudbury Basin during the Holocene as evidence is scarce and its uses less apparent. However, the occurrence of anomalous seismic activity/rockbursts and a heterogeneous stress field invite the question, are these present phenomenon products of natural, anthropogenic or a combination of, ongoing processes. High resolution marine seismic surveying was utilized in two Sudbury Basin lakes to survey for tectonic indicators preserved within the sediments. Figure 8: Seismic profiles collected from Fairbank Lake. (Top) Evidence of faulting is preserved within the GL and L1 facies. Shallow mixed sediments may be evidence of slumping eroded along with neighboring L1 and L2 sediment facies. (Bottom) Multiple instances of possible slumping was observed in steeply sloped areas as

18
either truncating chaotic sediments in downslope areas or slump scars in shallower perched sections. Contrasting the lake bottom stratigraphy with similar studies carried out in Ontario, a rudimentary chronology was established for the distinct acoustic facies. Using these interpretations, faulting activity was confined to late glacial sediments layers in both lakes, while slumping was observed throughout the sediment succession in the steeper Fairbank Lake. Prevalence of these features indicate ongoing neo-tectonic activity following the deglaciation (< 10500 BP) predicted to be the result of stress channeling and glacial loading/unloading. These findings reflect the importance of utilizing the proper geophysical method for an environmental study as the selective preservation of sediments in the lakes provided the most intact record of neo-tectonic activity. High resolution marine seismic surveying provided the optimal approach for investigating the evolution of Holocene environments to reveal continued neo-tectonic activity. These findings reflect the importance of utilizing the proper geophysical method for an environmental study as the selective preservation of lake sediments provided the most intact record of neo-tectonic activity. Evidence of ongoing neo-tectonic activity prior to anthropogenic influence demonstrates the need for further work to explore the evolution of stress and seismicity in the Sudbury Basin through the Holocene.

19
Staff and Students Faculty: Bernd Milkereit, Teck Chair in Exploration Geophysics
(since August 2001) Graduate Students (PhD)
Ramin Saleh (2011 – present), Co-superviser Q. Liu Ken Nurse (2011 – present) Maria Tibbo (2013-present), Co-superviser P.Young Dong Shi (2014-present)
Graduate Students (MSc) Alex Carey (2015-present) Anisa Kassam (2015-present) Summer Research Assistants: 2015: Maria Wu, Erica Veglio, Anisa Kassam, Alex Carey 2016: Erica Veglio, Camille Hébert, William McNeice Visiting Scientists: Prof. L(Flora) Sun, CUP Beijing, July-August 2015 Junfei Chai, visiting PhD Student, December 2015- present
Recent Graduations Ph.D. Completed
Leonardo Trivino (co-supervised with B.Mohanty) Study of Blast-induce Damage in Rock with Potential Application to Open Pit and Underground Mines (2012)
M. Sc. Completed Andrew Zajch ( 2014-2015) An Investigation of Holoscene environments,
Tectonic and paleochannel in the Southern region of the Sudbury Basin, Ontario, Canada.
Jianing Zhang (2014-2015) Seismic Monitoring: Organization of 3D/4D Seismic data from a Deep Mine, Department of Earth Sciences, University of Toronto, August 2015.
Na Wang (2014-2015) 3D Elastic/Visco-elastic Modelling of Full Waveform Sonic Data, Department of Physics, University of Toronto, August 2015.
Guo,K., (2013-2014) Towards 3D Direct Current Resistivity and Induced Polarization Imaging, Department of Earth Sciences, University of Toronto, September 2014.
Dong Shi.,(2013-2014) Seismic Exploration of Uranium deposits in the Athabasca Basin, Saskatchewan – A modelling study, Department of Earth Sciences, University of Toronto, September 2014
Sara Nicholson, (co-supervised with C.Bank) Near Surface Geophysical Imaging, Deep River, Department of Earth Sciences, University of Toronto, September 2014.
20
Laura Quigley (2011- 2013), Seismic Imaging of Shallow Carbonate and Shale hosted massive sulphide deposit; a feasibility study. Department of Earth Sciences, University of Toronto, September 2013.
Lin Zheng (2012-2013), Co-supervised (Q. Liu), Mapping Peak Particle Velocities and Accelerations for Surface Mining Models base upon Spectral-elements methods. Department of Physics, University of Toronto, September 2013.
Undergraduate Thesis Erica Veglio, Integration of Walk Magnetic and Airborne Magnetic Data, BSc
thesis report, Dept. of Earth Sciences, 42p., 2016
Publications (2014 – 2016) For earlier publications, please see previous Annual Reports archived at the “Exploration Geophysics” website. Scientific Journals and Books: Sun, L.F., Milkereit, B. and Tisato, N. Analysis of velocity dispersion using full-waveform multi-channel sonic logging data: a case study.Geophysical Prosperty, 64,1016-1029, 2016 Zheng, L., Zhao,Q., Milkereit,B., Grasselli,G., and Liu,Q., Spectral-element Simulations of Elastic Wave Propagation in Exploration and Geotechnical Applications, Earthquake Science, doi 10.1007/s11589-014-0069-9, 2014 Conferences Proceedings/Expanded Abstracts: Carey, A, Shi, D. and Milkereit, B., Deep Mine Wavefront Reconstruction using True 3D Sparse Data, EAGE Near Surface Conference, Barcelona, 2016, 4p, submitted.
Kassam, A., and Milkereit, B., Analysis and Visualization of Dynamic Elastic properties in 3D space for High Density Minerals, EAGE Near Surface Conference, Barcelona, 2016, 4p, submitted.
Milkereit,B., and Kassam, A., A Rock Physics Framework for High Density Crustal Rocks, SEG-AGU Workshop on Physical Propoerties of Crustal Rocks, July 2016.
Shi, D., Sun, L.F. and Milkereit,B., Seismic detection and delineation of a low Q structure. 78th EAGE Conference & Exhibition, 2016. Vienna, Austria 30 May – 2 June 2016.
21
Tibbo, M., Schmitt, D., Milkereit, B., Nasseri, M.H.B., Young, R.P. Experimental Measurement of In Situ Stress. EUG, Vienna, 2016. Shi, D., Sun, F.L., and Bernd Milkereit. Seismic Imaging in a low Q environment. Geo Convention Optimizing Resources, March 7th-11th, Calgary, Canada, 2016. Kassam, A., Milkereit, B., Gerrie, V. and Chris Drielsma. Linking Seismic and Geotechnical Parameters using the Velocity-Density Relationship.GeoConvention, Calgary, 2016,4p. Carey, A., Shi, D., and Milkereit, B., 3D wave-equation based wave front reconstruction using finite-difference reverse-time migration. GeoConvention, Calgary, 2016, 4p.
Tibbo, M., Kassam, A., Carey, A., Milkereit, B., Schmitt, D., Mohammed, T.E., Malemir, R., and Guo, K., Time-lapse Geophysical Data from a Stressed Environment. American Geophysical Union, Annual meeting, San Francisco, 2015. Shi, D. and Milkereit, B. Migration-induced noise reduction using fast discrete curvelet transform. Expanded Abstract. 4p. SEG 2015 Annual Convention, 2015b. Saleh,R., Milkereit,B., and Liu,Q., “Simulation of Seismic Wave Propagation in a Deep Mine”, Department of Earth Sciences, University of Toronto, GeoConvention 2015, Geo Sciences, Calgary, AB, May 4-8, 2015. Wang,N., Shi,D., and Milkereit, B., “Towards Modelling Elastic and Viscoelastic Seismic Wave Propagation in Boreholes”, Department of Earth Sciences, University of Toronto, GeoConvention 2015, Geo Sciences, Calgary, AB, May 4-8, 2015 Shi,D and Milkereit,B., “Seismic Signal Enhancement using 2D Fast Discrete Curvelet Transform- An Application to VSP and Common-Shot Gathers from a Hardrock Environment”, Department of Earth Sciences, University of Toronto, GeoConvention 2015, Geo Sciences, Calgary, AB, May 4-8, 2015a. Zajch, A., Milkereit,B., and Eyles,N., “High Resolution Marine Seismic Surveying in the Sudbuy Basin”, Department of Earth Sciences, University of Toronto, GeoConvention, Calgary, AB, May 4-8, 2015 Zhang,J. and Milkereit,B., “Organizing 4D Seismic Data from an Active Mine Site”, Department of Earth Sciences, University of Toronto, GeoConvention 2015, GeoScience, Calgary, AB, May 4-8, 2015 Wu, M. and Milkereit,B., “The Velocity-Density Relationship Revisited”, 3rd International Workshop on Rock Physics, Perth, Western Australia, April 13th -17th, 2015.

22
Shi, D., Milkereit,B., and Sun,F., “Elastic and Viscoelastic Modeling of Seismic Waves in the Athabasca Basin, Canada. Expanded Abstract. 4p. SEG 2014 Annual Convention, 2014. Wu, M. and Milkereit, B., "Hardrock Elastic Physical Properties: Birch’s Seismic Parameter Revisited", American Geophysical Union, annual meeting, 2014. Saleh, R., Chen, H., Milkereit, B. and Liu, Q., "Simulation Of Broadband Seismic Wave Propagation In A Deep Mine in Sudbury Ontario Canada", American Geophysical Union, annual meeting, 2014. Tibbo, M. , Young, P., Schmitt, D., and Milkereit, B., "Geophysical Properties of Hard Rock for Investigation of Stress Fields in Deep Mines", American Geophysical Union, annual meeting, 2014. Sun, L.F and Milkereit,B., Investigating Reservoir Charactersitics by Mapping P-wave velocity dispersion. EAGE, Amsterdam, 4p,2014. Guo, K., Qian, W., and Milkereit, B., Geometry factor for near Surface Borehole Resistivity Surveys: a Key to accurate imaging and monitoring, Geoconvention, Calgary, 4p, 2014 Saleh,R., and Milkereit,B., A Modelling Study of Broadband Seismic Wave Propagation in a Deep Mine, EAGE conference, Amsterdam, 2014,2p. Milkereit,B., Saleh,R., Huang,J., and Valley,B., In-Mine Seismic Imaging Revisited, Invited Workshop Contribution, EAGE, Amsterdam, 2014, 2p.

23
Field & Conferences
At the 2016 Geoconvention in Calgary: Anisa Kassam with her rock physics poster and group photo of U of T graduate students (Qi Zhao, Dong Shi, Alex Carey, Anisa Kassam, and Junfei Chai) all presenting at the conference.

24
Fieldwork in New Brunswick (August 2015): Erica Veglio and Anissa Kassam preparing GPR equipment (overburden mapping), Alex Carey running ground mag through dense bush, and Flora Sun enjoying NB lobster at the lodge.