
TechnoMental Commodity Report
53
TechnoMental Commodity Report 06/30/21 Andy Hecht
Transcript of TechnoMental Commodity Report

TechnoMental
Commodity Report
06/30/21
Andy Hecht

TechnoMental Commodity Report
2
The TechnoMental Commodity Report
As of the Close of Business on June 30, 2021
• Stocks moved higher since last week-The VIX edged lower-Bonds post a slight gain
• Bitcoin, Ethereum, and the asset class’s market cap rebound-Gold, silver, and platinum fall, palladium, and rhodium post gains-Copper turned in mixed results
• Oil and oil products slip, crack spreads move lower, while natural gas rallied to a new multiyear high-Ethanol unchanged-Coal rallies
• Corn and soybeans rebound, wheat falls-Hogs rebound-Cattle on either side of unchanged-FCOJ falls, while sugar, coffee, cocoa, and cotton post gains
• The dollar index edges higher to just above the 92 level
TechnoMental System Update The TechnoMental System provides subscribers with eight separate potential trend following portfolios in all of the sectors covered in the weekly report including:
• Stocks and Bonds
• Precious metals
• Base Metals
• Grains and Meats
• Soft Commodities
• Currencies
• Energy Subscribers can use any of the portfolios, all of them, or select the ones they wish to use for investment and trading purposes. Automatic execution is available for all of the portfolios for subscribers. The benefit of automatic execution is that buy and sell orders are compiled and executed as soon as the signals come out.

TechnoMental Commodity Report
3
Over the past week, the results of the futures portfolio as of the close of business on June 25 was:
Watch for daily emails on rolls and reversals.

TechnoMental Commodity Report
4
The ETF portfolio as of June 25 as follows:
Watch for daily emails on rolls and reversals.

TechnoMental Commodity Report
5
Summary On Thursday, June 24, stocks posted gains. The Russell 2000 led the way higher with a 1.31% gain. The DJIA was up 0.95%, and the NASDAQ gained 0.69%. The S&P 500 moved 0.58% to the upside. The VIX was lower to under the 16 level. The dollar index was sitting at the 91.795 level, and September US 30-Year Treasury bond futures were little changed at 159-28. Corn, soybeans, and wheat prices moved lower. Crude oil was higher with oil products, and crack spreads were steady. The EIA reported a lower than expected injection into natural gas storage, sending the energy commodity to a new high at $3.4420 on July futures and $3.46 on the August contract. Natural gas broke out to the upside above the late 2020 $3.396 high. Ethanol was unchanged on Thursday. Gold, silver, and copper moved lower, while platinum and palladium posted gains. Live cattle moved marginally lower while feeders rallied. Lean hog futures continued to fall and settled below the $1 level for the first time since April on the August contract. Sugar and FCOJ were higher, while coffee, cocoa, and cotton prices fell. Lumber continued to decline. Bitcoin futures were $2,025 higher to $34,925, and Ethereum rose $88.75 to the $2,008.75 level. On Friday, stocks were mostly higher. While the NASDAQ slipped only 0.06%, the DJIA rose 0.69%. The S&P 500 rose 0.33%, and the Russell 2000 was only 0.03% higher. The September 30-Year Treasury bond future fell 0-29 to the 159-01 level. The dollar index in September rose 0.049 to 91.844. Grain prices were mostly lower as the market anticipates a bearish planting and progress report early next week. November soybeans closed below the $12.70 level, while December corn was just under $5.20. September CBOT wheat was sitting at just over $6.40 per bushel. Grain and oilseed prices moved lower and far away from the recent multi-year highs in May. NYMEX crude oil settled at just over the $74 level, near the recent high. Product prices slipped, sending crack spreads lower. The oil-related stocks have lagged behind the energy commodity. Cracks and oil equities could be a warning sign of a correction in the energy commodity. Meanwhile, natural gas exploded to a new high, with the August contract closing at $3.52 per MMBtu, the highest price level since back in January 2019. What a difference a year has made in the natural gas market, which fell to a quarter-of-a-century low at $1.432 per MMBtu last year at this time. Ethanol and thermal coal are also trading at multi-year highs, with biofuel at the highest level since 2014 and coal at a decade high.

TechnoMental Commodity Report
6
Gold, silver, and platinum edged higher on Friday, while palladium was marginally lower. Copper slipped below the $4.30 level, with the July futures contract settling at $4.2920 per pound. August live and feeder cattle prices were higher, with the feeders leading the way on the upside. August lean hog futures were up over one cent but were just below the $1 per pound level. Sugar, coffee, cotton, cocoa, and FCOJ all posted gains, with coffee moving 4.4 cents higher and leading the sector on the upside. July lumber was $63 lower. The selling continued and pushed the price below the $780 per 1,000 board feet level. Bitcoin at the $33,050 level was $1,800 lower. Ethereum, at $1,847.75 per token, dropped $162.75 on the session. On Monday, the stock market was mixed with a 0.98% gain in the NASDAQ and a 0.23% gain in the S&P 500. Both indexes closed at new record highs. The DJIA fell 0.44%, and the Russell 2000 dropped 0.52%. The September US 30-Year Treasury bond futures gained 112 to the 160-04 level. The September dollar index futures contract edged only 0.032 higher to 91.876. New crop soybean, corn, and wheat futures posted impressive gains. Crude oil rose to a new high of $74.45 on the active month August NYMEX futures before putting in a bearish reversal on the daily chart. The August futures settled at the $72.91 level, down $1.14. Product prices declined. Gasoline cracks edged lower, while distillate refining spreads edged higher. August natural gas futures made a higher high at $3.653, the highest price since January 2019. They settled at $3.593 per MMBtu. Gold, silver, and palladium were higher, with palladium posting the most substantial gain. Platinum edged lower to below the $1,100 per ounce level. July copper edged 1.4 cents lower to settle at $4.2780 per pound. August live and feeder cattle futures fell, with feeders leading the way lower. August lean hogs rose the three cents limit, with the price moving back over a buck and settling at $1.02775 per pound. Cocoa was unchanged on the session, but sugar, coffee, and cotton posted gains. FCOJ declined. Lumber moved around $20 higher to the $800 per 1,000 board feet level. Bitcoin was at the $34,400 level, at around $2,200 per token. Ethereum gained $260 to around the $2,120 level. As Wednesday is the end of Q1, I will be posting the weekly report tomorrow, Tuesday, June 29. On Tuesday, the Russell 2000 declined by 0.56%, while the other leading indices posted marginal gains. The NASDAQ was 0.19% higher, the DJIA gained 0.03%, and the S&P 500 was up 0.03%. The September US 30-Year Treasury bond futures were up only 0-02 at the 160-04 level. September dollar index futures were 0.165 higher to the 92.041 level.

TechnoMental Commodity Report
7
Grain and oilseed markets were mostly quiet as corn edged slightly higher, while soybean and wheat futures posted marginal losses. Crude oil was only 7.0 cents higher to $72.98 per barrel on the nearby August NYMEX futures contract. Oil products moved higher and outperformed the energy commodity, pushing crack spreads higher on the session. Natural gas rose to a new high at $3.811 per MMBtu, the highest price since December 2018. Ethanol was unchanged. Gold, silver, platinum, and palladium prices fell on the session. Copper was slightly lower. The metals closed above the worst levels of the session. Live and feeder cattle and lean hog futures edged higher. Sugar, coffee, and FCOJ futures slipped, while cotton and cocoa edged higher. Lumber was trading at the $758 level, down $42 per 1,000 board feet on the July contract. Bitcoin was up around $1,900 to the $36,425 level. Ethereum gained $110 to the $2,235 level on Tuesday.

TechnoMental Commodity Report
8
Stocks and Bonds The stock market moved higher, the VIX drifted lower, and bonds edged higher since June 23. As we head into the heart of summer and Q3, the stock market is ignoring the potential for interest rate hikes. Even if the Fed tightens credit, rates remain at low levels encouraging the flow of capital into the stock market. The trend is always your friend in markets. In stocks, it remains higher. Over the past week, the S&P 500 rose 1.18%. The NASDAQ rallied1.80% over the past week, while the DJIA posted a 1.23% gain over the period. The VIX was at the 16.11 level, 1.77% below last week’s level, after failing at the 20 level. The bond market rallied in the aftermath of the Fed meeting; it moved lower since June 23. The bearish action in the US bond market since August 2020 reflected a robust economic rebound in the US, but the pressure of central bank buying, and liquidity caused the bond market to reach at least a bottom at the 153-29 level in March. The long bond ran out of upside steam above the 160 level. On June 25, the bonds put in a bearish reversal on the daily chart.
Source: CQG Time will tell if the bonds follow through on the downside in a continuation of the bearish price action since last August. So far, they moved higher since the bearish pattern. Rising US interest rates should put downward pressure on the bond market. Bonds were screaming that monetary and fiscal policies are highly inflationary in March.
TechnoMental Commodity Report
9
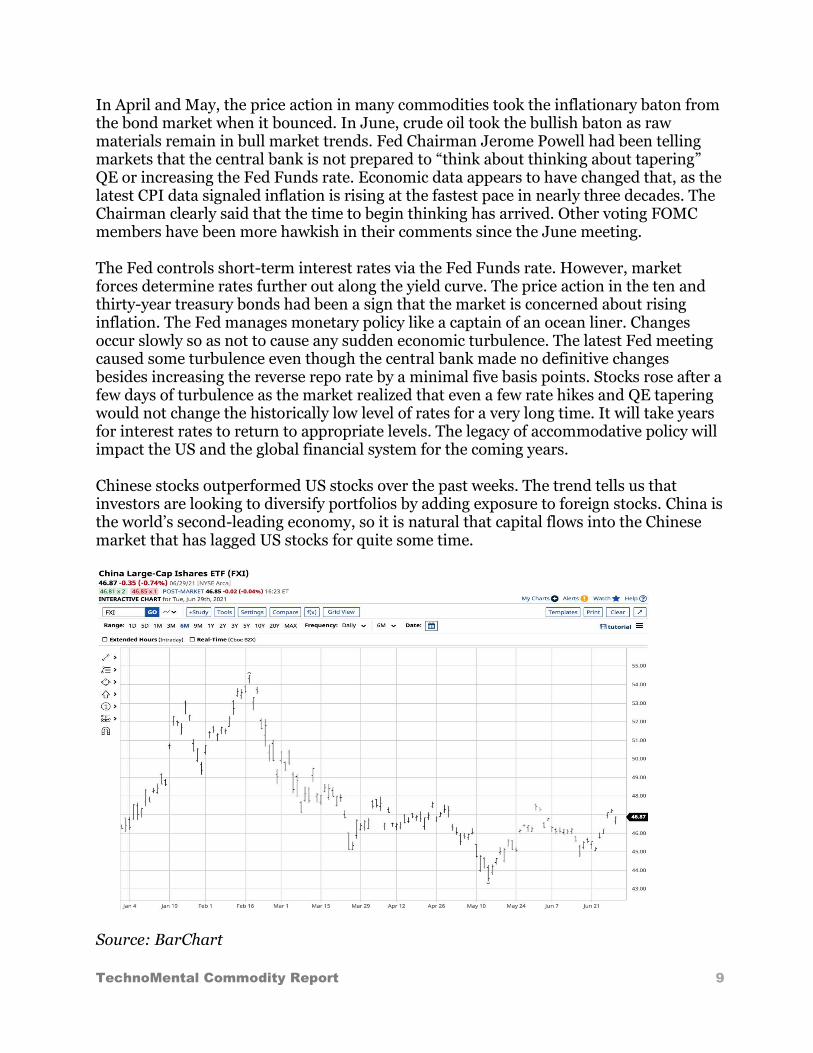
In April and May, the price action in many commodities took the inflationary baton from the bond market when it bounced. In June, crude oil took the bullish baton as raw materials remain in bull market trends. Fed Chairman Jerome Powell had been telling markets that the central bank is not prepared to “think about thinking about tapering” QE or increasing the Fed Funds rate. Economic data appears to have changed that, as the latest CPI data signaled inflation is rising at the fastest pace in nearly three decades. The Chairman clearly said that the time to begin thinking has arrived. Other voting FOMC members have been more hawkish in their comments since the June meeting. The Fed controls short-term interest rates via the Fed Funds rate. However, market forces determine rates further out along the yield curve. The price action in the ten and thirty-year treasury bonds had been a sign that the market is concerned about rising inflation. The Fed manages monetary policy like a captain of an ocean liner. Changes occur slowly so as not to cause any sudden economic turbulence. The latest Fed meeting caused some turbulence even though the central bank made no definitive changes besides increasing the reverse repo rate by a minimal five basis points. Stocks rose after a few days of turbulence as the market realized that even a few rate hikes and QE tapering would not change the historically low level of rates for a very long time. It will take years for interest rates to return to appropriate levels. The legacy of accommodative policy will impact the US and the global financial system for the coming years. Chinese stocks outperformed US stocks over the past weeks. The trend tells us that investors are looking to diversify portfolios by adding exposure to foreign stocks. China is the world’s second-leading economy, so it is natural that capital flows into the Chinese market that has lagged US stocks for quite some time.
Source: BarChart

TechnoMental Commodity Report
10
The China Large-Cap ETF product (FXI) settled at the $46.87 level on Tuesday, as it rose 2.45% since June 23. Technical support is at $44.72, the June 16 low, and $43.31, the May 13 low. The FXI product remains far below the all-time peak at $73.19 back in 2007. The most recent significant high came on February 17 at $54.52, the technical resistance level. China is the demand side of the equation for commodities as it is the world’s second wealthiest and most populous nation. Chinese stocks carry significant political risk given the government’s heavy hand and role in business and international investments. They had lagged US stocks over the past months. Over the past weeks, they went on a different path in a sign, investors are shifting towards foreign stocks because of the prospects for higher US rates. September US 30-Year bonds edged higher since June 23. The bond market faces opposing forces as inflation is rising and the Fed continues to purchase $120 billion in debt securities each month. The Fed Funds rate remains between 0% and 0.25%, but the central bank only determines short-term rates. Medium and long-term interest rates are a function of the supply and demand for bonds. The quantitative easing program attempts to push bond prices higher but rising inflationary pressures have had more of an effect, pushing bonds lower and interest rates higher. The trend in the bond market and technical break on the downside was a sign that the Fed is losing control of the market on longer-term interest rates. The FOMC said they are prepared to adjust monetary policy with market conditions, and there was finally some scent of tapering or tightening at the latest FOMC meeting. The bond market has rejected the central bank’s actions since last August by declining with each new debt security purchase. The latest inflation data was a warning sign for the Fed, and the central bank upgraded their view from “transitory” to “temporary.” The June FOMC meeting appears to signal the start of a shift in the central bank’s policy path. Time will tell how quickly and decisively they are willing to act. The Fed could outline its future plans in more detail at its August gathering in Jackson Hole, Wyoming. Last year the central bank changed its inflation target from 2% to an average of 2% in August, which seems to be the time of the year when the Fed becomes more transparent about its plans and the course of monetary policy. Even the most aggressive tax hikes in history will not pay for the trillion in stimulus and other initiatives over the past year and those coming before Congress in the immediate future. The US Treasury Secretary is working with other G-7 nations to establish a 15% minimum corporate tax structure. The initiative could be more about moving the US towards globalism than taxes. On Tuesday, June 29, the September long bond futures contract was at the 160-02 level as it edged 0.23% higher over the past week. The September 30-Year Treasury bonds futures made a low at 153-29 on May 13. Technical support is at the May 13 low. Technical resistance is now at 163-02, the June 21 high on the September futures contract. Bonds retreated from the recent high. Upward pressure on rates further out on the yield curve over the past months has been an inflationary signal for markets.

TechnoMental Commodity Report
11
The Fed now finds itself in a position where it will begin to raise the Fed Funds rate and taper its asset purchases. Ironically, the bonds rallied as the Fed signaled the start of the shift at first. The move was likely because of short covering in the futures market. With Chairman Jerome Powell at the head of the central bank and former Chair Janet Yellen, the Treasury Secretary, the doves have their hands firmly on the wheel of the US financial system. Do not expect them to move too fast, but as we learned last week, a switch in the central bank’s rhetoric is enough to move markets. The Fed stated it is prepared to tolerate rising inflation over the coming months, but the recent CPI data was a warning shot across the bow of the US economic ocean liner. The bond market has battled the Fed and Treasury over the past months. It is unprecedented that the level of economic growth in 2021 had not prompted an adjustment in monetary policy sooner. The Fed remains behind the eight ball when it comes to a monetary policy path that reflects economic conditions. The Fed was encouraging inflation, but up until recently, it ignored the evidence in raw material markets and other asset markets that could lead to a far larger dose of the economic condition than it is bargaining for over the coming months. Once a ball begins rolling, it could pick up momentum and becomes more challenging to stop. Energy, agricultural, metal, and mineral prices had been trending higher over the past months. Bull markets rarely move in a straight line. Commodities can be highly volatile; they rise higher than most believe possible, and corrections can take prices far lower than logical levels. However, the trends since the 2020 lows remain very bullish despite the recent corrections. Many commodities moved substantially higher over the past weeks and months, and the trend in the long bond remains lower since August. April and May were bullish months in the commodities sector, with more than a handful of raw materials rising to new multi-year highs and some reaching record levels. June has been a corrective month in most, but crude oil is bucking the trend. The tidal wave of liquidity and tsunami of stimulus comes with a price tag that will not be satisfied with a gradual shift towards tightening monetary policy. The stock market’s rise over the past year could be a mirage as it may reflect a decline in money’s purchasing power instead of bullish fundamentals for many companies. Meanwhile, even the most aggressive bull markets rarely move in a straight line. Periodic severe selloffs are the norm, not the exception. The trend in raw materials and other asset prices, including stocks, remains higher, a clear sign of inflationary pressures. When it comes to the prospects for rising taxes, corporations are likely to pass along hikes to consumers, adding to inflationary pressures. Global tax agreements are a move towards supranational governing. The US has enough problems breaching the divide between political policies on issues and initiatives. Cross-border agreements would raise far more cultural, political, and economic issues. What seems ideal to politicians is often unachievable in the practical world.

TechnoMental Commodity Report
12
A capital gains tax hike could eventually cause selling in the stock market as investors cash in on significant profits and need to sell more shares to pay the government more at tax time. Moreover, higher corporate taxes trickle down to the consumer, so all Americans from rich to poor will be paying more to the government either directly or indirectly. Higher inheritance taxes could increase selling. Over the past years, retirement accounts have provided the stock market with consistent and natural buying, making the path of least resistance for stocks higher. Rising taxes could interfere with the phenomenon and balance buying and selling or even create periods where selling overwhelms buying, adding to stock market volatility, and creating more significant downdrafts. The administration has been signaling that some of the tax hikes could be retroactive to at least part of 2021. US government remains divided even though Democrats have majorities in the House of Representatives and the Senate. However, the majorities are razor-thin, and the midterm elections are coming closer each day. Last week, a news story reported that investor Peter Theil turned his Roth IRA into a $5 billion tax-free savings account. Expect objections and pushback from progressives when it comes to future tax policy. The news story appears to have political goals. Open interest in the E-Mini S&P 500 futures contracts fell 0.25% since June 22. Open interest in the long bond futures moved 1.02% lower over the period. Over the long term, fighting the Fed has been a losing battle, but the last year has been an exception. The VIX at 16.11 on June 29 was down 1.77% since June 23 after trading to nearly 30 in May, over 20 this month in the wake of the June FOMC meeting. Taxes and regulations will increase, which is not bullish for the stock market. I expect price variance in the stock and bond market to increase eventually. We may have to wait for the fall, which is historically the time of the year for speedbumps in the stock market. I had been buying VIX-related products as they fall and selling them on rallies, trading for small profits while adjusting risk-reward expectations according to market conditions. I am currently on the sidelines in the volatility index. Commodities and bonds have been significant barometers of inflationary pressures over the past year. In 2021, the bond market told us that the Fed policies have significant inflationary side effects. A correction in stocks could cause bonds to bounce higher. Meanwhile, China is a substantial holder of US debt. As the tensions between Washington and Beijing remain elevated, any Chinese selling could push rates much higher further out along the yield curve. Financing the US debt through the bond market could cause the Treasury to issue bonds with longer maturities to pay for the trillions in stimulus packages, but they better hurry. Even though yields have increased, they remain historically low. Higher yields over the coming months and years could close a window of opportunity for one-hundred-year US debt securities to fund the deficit, which makes sense at today’s rates.

TechnoMental Commodity Report
13
Meanwhile, the increasing number of computer hacks could create problems for the stock market if they impact critical infrastructure areas. Moreover, the frenzy of speculation in GameStop, AMC, Bed Bath and Beyond, and other stocks in the crosshairs of the Reddit crowd is a bubblicious sign for the stock market. AMC exploded higher last week even though the company’s revenues are virtually nonexistent because of the lingering impact of the pandemic. The action in AMC stock allowed the company to take debt off its balance sheet, replacing it with equity, making it healthier. Some analysts believe there is a substantial change in investor and trader behavior, while others attribute the phenomenon to bubblicious activity in the stock market. I believe it is not a question of if the stock market will suffer a substantial decline, but when it will occur. The administration is looking to raise tax rates and take advantage of the growing wealth. Markets remain more than bubblicious. We are either in a bubble, or fiat currencies are losing value at an accelerating pace. Higher interest rates and rising taxes are not a bullish cocktail for the stock market. However, TINA or there is no alternative to stocks for capital growth, and tax-advantaged retirement accounts continue to push money into the stock market. As of June 29, the stock market is facing end-of-quarter window dressing. The price action tomorrow will likely reflect large pools of capital marking their risk positions to market at the end of the quarter, which is a time when they calculate performance fees that lead to compensation. Each tick higher for those holding long positions leads to higher paychecks. As I wrote over the past weeks, hedging stock portfolios at or near all-time highs could be the optimal approach given the uncertain future of markets. Markets reflect the economic and political landscapes, creating high odds for lots of volatility over the coming weeks and months. The price action on June 30 is likely to reflect more than a bit of price manipulation at the end of the quarter and the first half of 2021.

TechnoMental Commodity Report
14
Currencies The September dollar index futures contract edged higher over the past week in the wake of the Fed meeting and was at 92.041 on June 29, up 0.28% from the level in the previous report. The dollar index reached its highest level since early April on June 18. The index’s continuous contract made a high for 2021 on March 31 at 93.47 but fell to a low of 89.515 on May 25, just above the early January 2021, 89.165 low. Over the past weeks, it had been trading on either side of the 90 level before it broke higher after the June FOMC meeting. The dollar index made higher lows and higher highs from early January through early April. The world’s reserve currency switched back into the bearish trend that has gripped the dollar since March 2020. The prospects for higher interest rates created a higher low and pushed the dollar index higher. Technical support is at 91.505. Below there, it is at 89.515, 89.165, and 88.150, the continuous contract low from February 2018. The high at 92.395 on June 18 on the September contract and the March 31 continuous contract peak at 93.47 are the short-term technical targets and resistance levels. Open interest in the dollar index futures contract rose 0.19% over the past week. Higher US interest rates put upward pressure on the dollar’s value versus other leading world currencies from January through the end of March 2021. However, dovish monetary policy and stimulus that increase the money supply has been a bearish factor. A pivot towards tightening credit at the Fed is bullish for the US dollar. A selloff in stocks could cause buying in the dollar as it remains a safety net for capital. Daily historical volatility in the dollar index was 6.44% on Wednesday, slightly lower than the level on June 23. The weekly volatility measure stood at 5.92% on Wednesday, lower than last week. The February 2018 low at 88.15 is a critical support for the dollar index, but it moved away from long-term support over the past weeks as interest rates are likely to rise. Critical technical resistance stands at 93.47 on the continuous futures contract, the high from early March 2021. Selling in the stock market and other asset classes or rising US interest rates would likely lift the dollar as the US currency is the world’s reserve foreign exchange instrument and a haven for safety in troubled times. The dollar’s bullish price action ran out of steam at the 93.47 level during the week of March 29, 2021, creating lower highs in the dollar. The short-term chart broke out to the upside again over the past week, a move over the 93.47 level would end the pattern of lower highs that has been in place since March 2020. The September euro currency was 0.24% lower against the dollar. The euro is the other world reserve currency and accounts for 57.6% of the dollar index. Open interest in the euro futures rose 0.33% from June 22. Expectations for a more globalist approach to foreign policy by the Biden administration had been bullish for the euro.

TechnoMental Commodity Report
15
The euro versus the dollar currency relationship was at the $1.19200 level on the now active September futures. Support is at $1.18670, the June 18 low with resistance at $1.22415, the June 9 high. The September pound moved 0.80% lower against the dollar since the previous report as the pound underperformed the dollar and the euro over the past week. Open interest in the pound futures fell 1.78% over the past week. The US is likely to favor Europe over the UK as the Democrats support more globalist policies. All signs are that the Biden administration will embrace Europe over the coming months and years. The global corporate tax initiative is another sign that globalism is rising. All seemed very friendly between Europe’s leaders and US President Biden at the recent G-7 meeting. The dollar had been falling since March 2020, but the price action since early January threatened the bearish pattern. Currency markets rarely move in a straight line. Trends can continue for years with plenty of rebounds in bear markets or dips in bull markets. Governments manage the currency market via coordinated intervention to provide “stability.” Price spikes are rare, but trends can last for long periods. A correction in stocks and other markets could cause the dollar to move higher over the coming weeks and months. Treasury Secretary Yellen is likely to follow a strong dollar policy in a departure from the former administration. The dollar index’s critical medium-term level to watch on the upside is resistance 93.47 from March 31. The critical level on the downside remains at 88.15, the February 2018 low. The short-term trend in the dollar index is now higher, but the medium-term trend remains lower with lower highs. Meanwhile, the long-term trend dating back to 2008 is bullish, creating a confusing picture for the dollar’s future path. Since June 23, Bitcoin moved higher to $36,349.92 on June 29. The leading digital currency moved 9.10% higher over the past week after a nearly 14.5% decline last week. The leading cryptocurrency fell to a low of $28,800 on June 22 before recovering. However, it remains within striking distance of the low. Government’s control of the money supply remains the primary stumbling block facing Bitcoin and the cryptocurrency asset class. Christine Lagarde, the President of the European Central Bank, and Janet Yellen, the US Treasury Secretary, continue to express concerns about the nefarious uses of cryptocurrencies. However, both are most likely more concerned about Bitcoin and the other digital currencies because they reflect a rejection of central banks and governments’ control of the global money supply. While I believe in the future of the asset class, central banks and governments could cause lots of volatility in the cryptos as they seek to regulate the asset class. I have been writing the risk of regulation and rejection of digital currencies will rise with the token’s values. The comments from the ECB President and US Treasury Secretary in 2021 have been warning shots over the bow for the asset class. There is a distinction between digital currencies that governments will issue and cryptocurrencies reflecting a libertarian view of the global money supply.

TechnoMental Commodity Report
16
Passions run high in digital currencies. A few years ago, JP Morgan Chase CEO Jamie Dimon called Bitcoin a “fraud.” At the same time, Warren Buffett, one of the world’s preeminent value investors, said cryptocurrencies are “financial rat poison squared.” Charlie Munger, Mr. Buffet’s 97-year-old partner, doubled down and called cryptocurrencies “disgusting” and a threat to civilization in recent comments. Devotees of the asset class, who have become millionaires and billionaires, claim the Fintech trend has just started. Celebrities and high-profile technology founders and CEOs are embracing the burgeoning asset class. The struggle reminds me of the generational divide in the 1960s that gave way to a new era. It is hard to argue with the ascent of the digital currency asset class over the past months and years. In hindsight, the latest price action was more than bubblicious, but Bitcoin ushers in a new era of financial technology to be embraced rather than rejected. Blockchain technology is both revolutionary and evolutionary for finance. It is also a disruptive technology that threatens the status quo and institutions. Meanwhile, China is rolling out its digital currency, which could have a significant impact on the world’s foreign exchange markets. China is far ahead of the US and Europe, which could change the dynamics of reserve currencies over the coming years. China’s ban on Bitcoin is likely in anticipation of the digital yuan. Chairman Powell said that it is critical not to rush and get a digital dollar “right.” On May 3, the CME rolled out a new micro Bitcoin futures contract that is one-tenth the size of one token. The margin requirement for a micro Bitcoin future is around the $2,500 level. The micro could increase interest and trading in the Bitcoin futures arena as the volatility is a magnet for speculative interest. The larger standard contract experienced a 14.46% decrease in open interest over the past week as the price fell. Keep an eye on the total number of open long and shorts in the micros, which could evolve into a sign of critical mass in the futures arena. Gary Gensler, the SEC head, taught a course on Fintech after his stint at the head of the CFTC. He is likely to attempt to regulate the market with a pragmatic approach, which could cause broader acceptance of digital currencies. However, the philosophy of the asset class runs contrary to any government rules or controls, which creates a fundamental problem for the new head of the SEC. It is virtually impossible to pick tops in parabolic markets. The Coinbase listing was a huge success, but like many initial listings, the stock has dropped back below the $250 reference price after trading to nearly $430 per share. COIN was trading at $254.90 on Wednesday, up $28.89 since June 23. The platform’s stock reached a low of $208 on May 19, well below the pre-listing $250 per share reference price. COIN is likely to reflect the ups and downs in the cryptocurrency asset class as it could become the best proxy for the asset class’s market cap until other products emerge. In previous reports I wrote: “COIN could be a candidate to add to portfolios now that it is below the $250 reference price level as it is a pick-and-shovel play on the digital currency asset class.”

TechnoMental Commodity Report
17
COIN will profit from trading volume rather than prices. While bull markets tend to increase interest in markets, wild price swings can also lead to more speculative participation. In the previous, report I wrote: “I view COIN as a pick-andshovel play on the asset class and will look to buy shares on a scale-down basis below the $230 level.” COIN shares moved away from that level and I now rate the stock a hold as it is above the reference price. ETF products would increase the addressable market for the asset class, which could push prices to even higher highs. Futures on Bitcoin and Ethereum caused rallies in the cryptos. As the access to the market expands, the price action has been bullish. ETFs would likely turbocharge the asset class. Coinbase’s listing as the leading crypto exchange and future ETFs are likely to open the door for regulations, which would be a compromise between the asset class and the European and US governments. The US and Europe are likely to increase efforts to roll out digital dollars and euros, given China’s plans for a digital yuan. However, national digital currencies will still be different than the cryptocurrencies that embrace defi or decentralized finance. The ideological divide is a stumbling block for regulators looking to strike a balance for the asset class. The Colonial oil pipeline hack is a reminder that cybersecurity and hacking pose a threat to the asset class. Custody also remains a serious security issue. Tesla’s about-face on accepting Bitcoin makes carbon and energy requirements another of many stumbling blocks for coin mining. The volatile digital currency asset class’s market cap moved higher over the past week. Ethereum rose 13.96% since June 23 after nearly a 20% decline last week. Ethereum made a new all-time high at $4,406.50 on May 12. Ethereum was at $2,220.65 per token on June 29. The market cap of the entire asset class rose 10.93% over the past week. Bitcoin slightly underperformed and Ethereum outperformed the asset class since the previous report. Market participants had been looking for the next Bitcoin, Ethereum, or other tokens that have provided spectacular rewards. However, many will wind up as dust collectors in those wallets in cyberspace. The number of tokens increased by 115 to 10,710 since the previous report as the market remains hot. Some analysts believed the next milestone for Bitcoin is the $100,000 level or higher, while others are looking for it to drop to $10,000 or lower. Parabolic markets can reach highs few believe possible, but gravity is a potent force once the furious buying stops and sellers become more aggressive, as we learned in May. As we witnessed last month in Bitcoin, the risks of corrections rise with prices.

TechnoMental Commodity Report
18
On Wednesday, the market cap was around $1.475 trillion. The market cap means a severe selloff is unlikely to cause any systemic disturbance to markets, but that may not be the case over the coming years if it continues to grow at an exponential rate. President Biden’s proposed capital gains tax rate hike could have weighed on values as many newly minted crypto millionaires and billionaires could face a massive tax bill. The proposal more than doubles the rate from the current level. Short-term technical support for July Bitcoin futures are now at $28,840, the June 22 low, with resistance at $41,405, the June 15 peak on June futures. Continue to expect volatility in digital currencies, and you will not be disappointed. A robust US-based ETF product that addresses custody would continue to add even more bullish fuel to the asset class. The higher the Bitcoin price and market cap of the asset class rises, the more likely governments will seek to regulate and control or even ban the cryptos, which is the leading risk for digital currencies. Governments control the money supply, and digital currencies threaten that power, a warning and potential stumbling block after the recent explosive price action. So far, they are hoping that the market corrects, and they got their wish on Wednesday. Fighting an aggressive bull or bear has left more than a few market participants trampled over history. Be careful in the digital currency arena that has been one of the most aggressive bull markets in history. The asset class offers lots of opportunities, but risk is always a function of potential rewards. While the prices have moved higher with each innovation, we should expect events that trigger massive selling in the blink of an eye, so caution is critical when approaching the asset class. Only invest capital that you are willing to lose as risk is always a function of potential rewards. The Canadian dollar moved 0.70% lower since June 23. Open interest in C$ futures fell 3.59% since the previous report as market participants likely exited risk positions. The C$ is highly sensitive to commodity prices as Canada is a mineral-rich nation that produces significant quantities of energy and agricultural products. Keep an eye on the oil and grain futures market for clues about the Canadian dollar, as it often acts as a proxy for commodity prices. The Australian dollar is also a commodity-based currency with a high degree of sensitivity to China’s economy. The A$ fell 0.76% since June 23. Open interest in the A$ futures was 6.65% lower since June 22. The geographical proximity to China makes the Australian dollar sensitive to events in China. The A$ is a proxy for both China and raw material prices. Economic strength or weakness in China often determines the path of the Australian economy. Australia has had a rough time with vaccinations as the country did not secure enough earlier this year. The government shut down Sydney over the past week as the number of COVID-19 cases increased. Meanwhile, China has been threatening Australia, which could be weighing on its currency. In the long-term, the stimulus is bullish for commodities prices and both the Australian and Canadian currencies.

TechnoMental Commodity Report
19
Over the coming months and years, we could see significant gains in the C$ and A$ as commodity prices rise because of inflationary pressures caused by the increase in the global money supply. I believe the price action in 2020 in all markets was similar to 2008. In the years that followed, commodity prices soared because of the stimulus, taking the Australian and Canadian currencies appreciably higher against the US dollar because of their sensitivity to raw material prices. Over the long term, buying the A$ and C$ during periods of weakness could prove to be the optimal strategy. I have expressed a bullish opinion for the two currencies that I view as proxies for commodities prices over the past year. I had been writing: “I believe that any price weakness is a buying opportunity for the A$, and C$ over the coming weeks and months.” I continue to favor the commodity-sensitive currencies because of their implied backing by natural resources. Nothing changed my opinion since the previous reports. However, we could see a deeper correction if commodities continue to correct lower. While fiat currencies are likely to continue losing value, I view the A$ and C$ as unique cases. They have implied backing from raw materials produced in Australia and Canada and exported to the world. The two nations produce far more commodities than they need to sustain their citizens. As such, they are supermarkets to the world and should reflect the bullish trend in commodity markets. The A$ and C$ have been steadily rising over the past months, so the technical picture also supports the higher values against the US dollar. Both currencies remain in solid bullish trends, with the C$ leading the way. The A$ has Chinese risk exposure and problems with the virus, accounting for its lagging the C$ in appreciation over the past months. Over the past week, the volatile July Brazilian real futures contract edged 0.60% higher against the US dollar. The July Brazilian currency was trading at the $0.202350 level. The real is a critical factor when it comes to the commodities that the South American nation produces and exports to the world. Coffee, sugar, oranges, and a host of other markets are sensitive to changes in the direction of the Brazilian real. Brazil has seen a significant number of infections and fatalities because of coronavirus, which could weigh on its currency value. I am bullish for the real because of Brazil’s commodity production. The nation is a supermarket to the world for many products, just like Australia and Canada. However, Brazil has a far less stable political system and a poor economic track record given the many scandals over the past years and decades. The Brazilian currency is likely to continue to be far more volatile than the A$ and C$, but the same principles apply as raw material production underpins the value of the leading South American currency.

TechnoMental Commodity Report
20
Meanwhile, the US’s political shift should put pressure on the Bolsonaro government, which will find itself isolated from other countries because of policy and ideological differences. President Bolsonaro is up for reelection in 2022. He could face formidable opposition given the suffering created by COVID-19. Brazil’s response to the pandemic has been criticized because of the President’s controversial leadership. In the aftermath of the global pandemic, the price tag for liquidity and stimulus could cause inflationary conditions that would provide support for the A$, C$, and the Brazilian real. A rise in commodity prices helps to bolster the value of the real. I am a buyer of the real on weakness against the US dollar. Technical resistance is nearby at $0.2073, the June 2020 high, which is a critical target that could be a technical launchpad for the real. The US dollar index had been hugging the 90 level over the past weeks before pushing over the 92 level in the wake of the June Fed meeting. A move over 93.47 is necessary to shift the medium-term trend to a bullish position. The dollar index faced short-term bullish and medium-term bearish trends over the past weeks. Currency trends tend to be slow as governments manage the level of their foreign exchange instruments using coordinated intervention. Meanwhile, I continue to believe that all fiat currencies are losing value. Watching one currency against another often masks the strength or weakness of the currencies that derive value from the faith and credit of the countries that issue legal tender. The medium to long-term trend in the dollar remains lower until it can take out the 93.47 level, the resistance level on the continuous contract. Governments intervene and coordinate buying and selling in the currency markets to achieve stability, making the currency arena a highly manipulated asset class. The growing US national debt erodes the dollar’s value and position as the world’s reserve currency. Digital currencies and Fintech are likely to change the global nature of the foreign exchange market. However, regulators and governments will not capitulate until cybersecurity, custody, money supply, and carbon issues are addressed. Platinum, gold, and silver were lower since June 23, but palladium and rhodium posted gains.

TechnoMental Commodity Report
21
Precious Metals Rhodium and palladium moved higher since the previous report. Platinum, gold, and silver prices fell with losses coming on Tuesday, June 29. August gold settled at $1,763.60 on June 29, down 1.11% over the past week. The price traded down to a low of $1,750.10 in the weeks following the Fed meeting with the low coming on June 29. Technical resistance for June gold is at the $1,795.60 per ounce level, the high from June 23. Support is at Tuesday’s low. Gold ended the streak of quarterly gains in Q1 2021. The price needs to close above the $1,706.60 level on June 30 to post a gain for Q2. Support for July silver is now at $25.58, the June 21 low, with resistance at $28.445 per ounce, the June 11 and 14 double-top high. Silver put in a bearish reversal on the daily chart on June 3; it took the Fed to help it follow through on the downside. July silver settled at $25.872 on June 29, 0.92% below the price on June 23. If the price action from 2008 through 2011 is a guide, gold will eventually head for much higher prices, and silver should make higher highs. However, the road higher is rarely a straight line. Silver is a very different asset than a stock with a large short interest. However, the many conspiracy theories surrounding the silver market make the metal a logical target for the herd of traders and investors on social media platforms. They took the price to a new high at the start of February, but silver corrected the very next day. I continue to believe that price weakness is a buying opportunity for long-term investors. We could see the Reddit crowd and other speculators have another try at pushing silver higher over the coming weeks and months after wild success with AMC, GME, and other stocks. Gold and silver mining shares underperformed the metals since the previous report. The GDX was 1.95% lower and the GDXJ moved 3.68% to the downside. The SIL and SILJ silver mining ETF products that hold portfolios of producing companies moved 3.42% and 4.16% lower since June 23. The mining stocks fell with the metals on June 29. Gold slightly underperformed silver since the previous report. The silver-gold ratio edged lower since last week. The ratio reached a new modern-day high as risk-off selling hit the silver market last March, taking the price below the $12 per ounce level. The ratio moved steadily lower over the past months. I continued to add to long physical positions in gold, silver, and platinum during periods of price weakness. I will continue to trade leveraged derivatives and mining stocks on a short-term basis with tight stops. While gold mining stocks and derivatives follow the price of gold, they are not the metal and could experience significant periods of price deviation if risk-off conditions return to the stock market.

TechnoMental Commodity Report
22
I hold long core positions but will employ tight stops on any new positions that increase exposure to the two leading precious metals. July platinum was 1.75% lower since June 23 and was at the $1,067.50 level. Platinum rose to a new multi-year high in February 2021. The green Biden administration’s green agenda is supportive of platinum as its high melting point makes it a perfect metal for catalysts, but platinum fell in sympathy with all of the precious metals and many other commodities over the past week. The critical level on the upside stood at the August 2016 peak at $1,199.50. The move above that level sent July platinum futures to a high of $1,351.20 on February 16. Platinum corrected since the mid-February high. The recent decline to just over the $1,020 level pushed platinum to the lowest level of 2021. Support on the volatile July platinum futures contract is at $1,021.70, the June 21 low. Short-term resistance is at $1,174, the June 14 high. Platinum has the potential to explode if it follows the patterns in the palladium and rhodium markets over the past years. Rhodium is a byproduct of platinum, and the price of the metal had been in a bull market since early 2016. The price of rhodium rose to a midpoint price of $19,600 per ounce on June 29, up $1,700 per ounce or 9.50%. Rhodium lost over one-third of its value over the past weeks. Profit-taking likely hit the illiquid rhodium market. September palladium moved 1.93% higher since the previous report after hitting a new record high at $3,019 per ounce on May 4. Support is at $2,452.00 on the September contract, the June 18 low, with resistance at $2,843, the June 16 high. September palladium settled at the $2,681.20 per ounce level on Tuesday, June 29. Open interest in the gold futures market moved 0.93% lower over the past week. The metric moved 8.39% lower in platinum. The total number of open long and short positions was 0.97% lower in the palladium futures market. Silver open interest fell 7.02% since June 22. The prospects for higher interest rates likely prompted some long liquidation in precious metals. The silver-gold ratio moved a bit lower over the past week as gold underperformed silver.
Source: CQG
TechnoMental Commodity Report
23
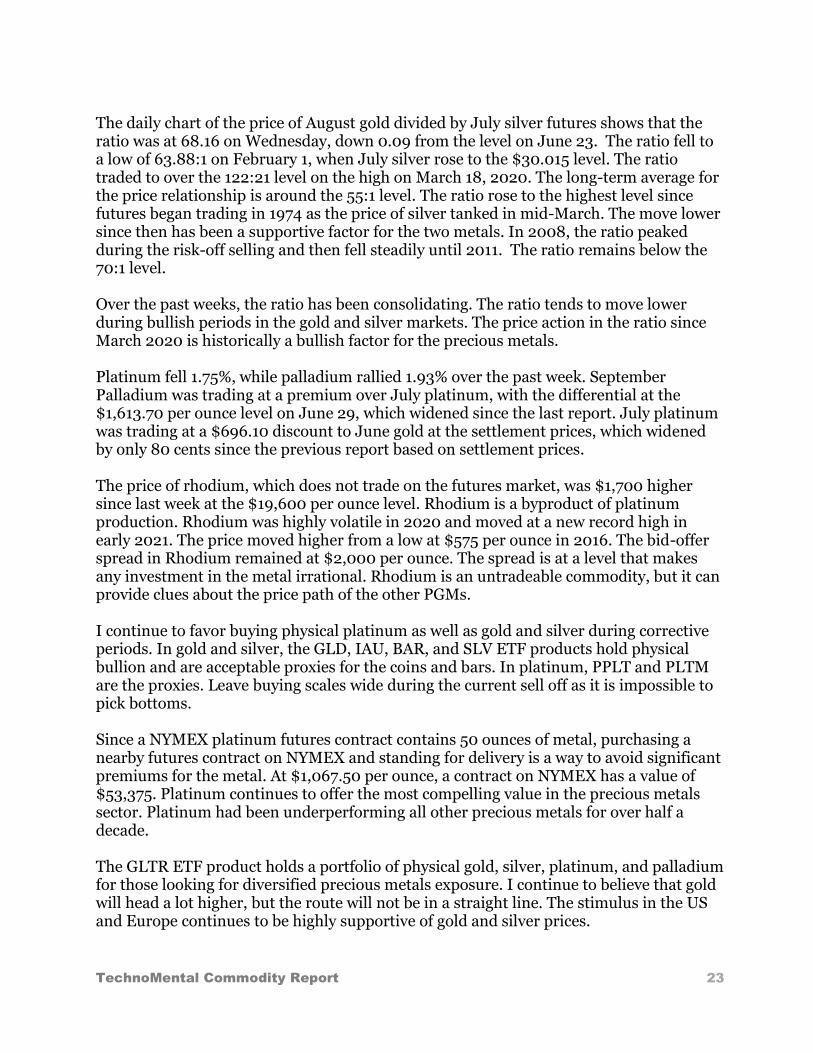
The daily chart of the price of August gold divided by July silver futures shows that the ratio was at 68.16 on Wednesday, down 0.09 from the level on June 23. The ratio fell to a low of 63.88:1 on February 1, when July silver rose to the $30.015 level. The ratio traded to over the 122:21 level on the high on March 18, 2020. The long-term average for the price relationship is around the 55:1 level. The ratio rose to the highest level since futures began trading in 1974 as the price of silver tanked in mid-March. The move lower since then has been a supportive factor for the two metals. In 2008, the ratio peaked during the risk-off selling and then fell steadily until 2011. The ratio remains below the 70:1 level. Over the past weeks, the ratio has been consolidating. The ratio tends to move lower during bullish periods in the gold and silver markets. The price action in the ratio since March 2020 is historically a bullish factor for the precious metals. Platinum fell 1.75%, while palladium rallied 1.93% over the past week. September Palladium was trading at a premium over July platinum, with the differential at the $1,613.70 per ounce level on June 29, which widened since the last report. July platinum was trading at a $696.10 discount to June gold at the settlement prices, which widened by only 80 cents since the previous report based on settlement prices. The price of rhodium, which does not trade on the futures market, was $1,700 higher since last week at the $19,600 per ounce level. Rhodium is a byproduct of platinum production. Rhodium was highly volatile in 2020 and moved at a new record high in early 2021. The price moved higher from a low at $575 per ounce in 2016. The bid-offer spread in Rhodium remained at $2,000 per ounce. The spread is at a level that makes any investment in the metal irrational. Rhodium is an untradeable commodity, but it can provide clues about the price path of the other PGMs. I continue to favor buying physical platinum as well as gold and silver during corrective periods. In gold and silver, the GLD, IAU, BAR, and SLV ETF products hold physical bullion and are acceptable proxies for the coins and bars. In platinum, PPLT and PLTM are the proxies. Leave buying scales wide during the current sell off as it is impossible to pick bottoms. Since a NYMEX platinum futures contract contains 50 ounces of metal, purchasing a nearby futures contract on NYMEX and standing for delivery is a way to avoid significant premiums for the metal. At $1,067.50 per ounce, a contract on NYMEX has a value of $53,375. Platinum continues to offer the most compelling value in the precious metals sector. Platinum had been underperforming all other precious metals for over half a decade. The GLTR ETF product holds a portfolio of physical gold, silver, platinum, and palladium for those looking for diversified precious metals exposure. I continue to believe that gold will head a lot higher, but the route will not be in a straight line. The stimulus in the US and Europe continues to be highly supportive of gold and silver prices.

TechnoMental Commodity Report
24
Platinum is inexpensive from a historical perspective compared to gold and palladium. Palladium and rhodium continue to trade in bullish patterns, but both are sensitive to global economic conditions. We should continue to see volatility in all of the precious metals with a bias to the upside. I continue to favor investing in physical gold, silver, and platinum on price weakness. I hold long core positions. When it comes to trading, I am going with the flow with very tight stops. As I have written in the past, the long-term ascent of gold marks the descent of fiat currencies that rely on the full faith and credit of the governments that print legal tender. Central banks and governments worldwide continue to hold and be net buyers of gold, which is the ultimate currency. The conditions creating a risk-off period are only likely to increase liquidity and stimulus levels in what could eventually be a vicious bullish cycle for gold and silver prices. The most bullish factor for precious metals is the loss of purchasing power for fiat currencies. While countries can print legal tender to their heart’s content, the gold stock can only increase by extracting more from the crust of the earth. If 2020 turns out to be anything like 2008, even higher highs in gold are on the horizon, and the precious metal has the potential to surprise and even shock market participants on the upside in the coming months and years. Gold moved to a record high in dollar terms, and it reached new highs in virtually all other currencies over the past two years. Silver broke a four-year resistance level over the past months. The price action in silver had been explosive after the metal created a blow-off low below $12 per ounce in March 2020. The trend is always your best friend in markets, and it is higher in the precious metals. I have been writing: “The odds of significant corrections rise with the prices, so be careful and remember to take some profits on the way up. I am a buyer on dips but would leave plenty of room as price swings could be wide.” I believe that prices will eventually shock analysts on the upside given the flood of liquidity from central banks, which is bearish for fiat currencies. Taking some profits in late July and early August left room to add to physical positions during the recent price weakness. Gold suffered a setback since June 16. The Fed and other central banks’ approach to monetary policy continue to weigh on currency values. As the value of the dollar, euro, and other currencies decline, it creates an almost perfect bullish storm for the world’s oldest means of exchange, gold, and silver. I would only buy or add to long positions during significant corrections. We could be in for a bumpy ride in precious metals, but the price action remains bullish, and higher highs are likely on the horizon.
TechnoMental Commodity Report
25
The economic impact of the coronavirus is prompting the Fed to add even more liquidity to the financial system and will encourage the US government is putting new stimulus programs in place. The increasing money supply is bullish for precious metals prices. The falling bond market had weighed on gold. Platinum corrected after its surge earlier this year. Production from South Africa declined because of platinum’s poor price performance over the past years. As I have written over the past months: “I continue to believe platinum is the metal that has the highest odds of a shocking price move to the upside.” I expect the precious metals bull to charge higher later this year, but it is likely to be a bumpy road, as we witnessed over the past weeks. The bull market in gold began at the start of this century and continues as we head into its twenty-first year. However, there have been long periods of price consolidations and occasional downdrafts. Bull markets often suffer severe selloffs on the route to higher prices. Silver is the barometer for investment demand as it attracts the most speculators, as we witnessed recently. Meanwhile, demand from electronics and solar panels for silver and green technologies for PGMs continues to provide industrial support for the prices. We have seen significant price appreciation in the digital currency asset class. Many “experts” believe that Bitcoin and other digital currencies are attracting investors that would typically purchase gold and silver. I continue to think that this is a short-term phenomenon. The sudden sentiment shift could produce rallies in the leading precious metals. Gold and silver have been a means of exchange for thousands of years, while cryptocurrencies have only been around for the past decade. Moreover, since the digital currency asset class threatens the central bank and governmental control of the money supply, the risk of investing in many of these products is elevated given the recent parabolic gains. While I believe in the future of digital currencies, they are likely to experience lots of volatility as central bankers like Christine Lagarde’s call for regulation to stop the “speculative” price action. US Treasury Secretary Janet Yellen’s comments are also cautionary for the asset class. In an environment where the faith in governments is declining along with creditworthiness, gold and silver are likely to continue to attract investment demand. PGMs clean toxins from the air. A greener policy path in the US and worldwide to address climate change increases the demand for platinum and palladium. I continue to hold precious metals and add to physical positions on price weakness. Look to buy on weakness and avoid paying up for the metals during rallies. Sudden price spikes tend to be selling opportunities.

TechnoMental Commodity Report
26
Meanwhile, I will retain a core long position for the long term. I believe gold will find a bottom sooner rather than later. Gold was in the buy-zone at the lowest price of 2021, below $1,700 per ounce. It failed at the $1,900 level. Critical support is all the way down at the $1,450.90 level, the 2020 low. I believe the long-term bull market trend will reawaken the gold and silver markets in 2021. Over the past weeks, I wrote: “I have begun buying more gold mining stocks via GDX and GDXJ as I believe they will eventually outperform gold when the price of the metal begins to climb. I am using wide scales but believe we will see gold and silver at higher prices over the coming weeks and months.” I remain bullish on precious metals, given the inflationary environment in markets across all asset classes. However, I will be using wide scales over the coming sessions. Every significant dip in gold has been a buying opportunity over the past two decades. I remain a committed and cautious precious metals bull. Watch out for window dressing on June 30 in the precious metal’s arena, which could reveal the market’s sentiment going into Q3. I view the current selloff as another buying opportunity. While I trade with trends, I am short the markets. However, I continue to buy and add to physical long positions on price weakness.

TechnoMental Commodity Report
27
Energy Crude oil edged lower since the last report, while oil products posted more significant losses, sending crack spreads lower. Natural gas remains a bullish beast, rising to the highest price since December 2018 on June 29. Ethanol was unchanged, while coal prices moved higher over the past week. Crude oil put in a new and higher high on June 28, when it put in a bearish reversal pattern on the daily chart.
Source: CQG The daily chart of August futures highlights the bearish reversal on June 29. Time will tell if crude oil follows copper, lumber, precious metals, and grains and corrects. Meanwhile, OPEC meets later this week to decide on production policy for the second half of 2021, which is likely to cause volatility in the crude oil futures arena. August NYMEX crude oil futures edged 0.14% lower since June 23 to settle at $72.98 per barrel after reaching a new short-term high at $74.45 on June 29. NYMEX crude oil has been making higher lows and higher highs since April 2020 and is at the highest level since 2018. Meanwhile, OPEC+ and US energy policy continue to support the oil price. OPEC+ is now in a position to squeeze US consumers as US energy policy shifts towards addressing climate change. The cartel will increase output as demand rises and US production declines to keep a healthy balance that favors the producers. After announcing they will taper the supply cuts over the coming months, the oil price moved higher in a sign that demand remains robust and is increasing. However, weakness in products and crack spreads is a cautionary sign for the energy commodity.

TechnoMental Commodity Report
28
The progress on vaccines has been welcome news for crude oil demand, which sparked the rally to over $60. OPEC and Russia seem likely to coordinate policy according to changes in the US regulatory environment. OPEC’s mission is to optimize returns for petroleum producers, which is bullish for the global petroleum markets. The Saudis warned the oil market to be “cautious” as uncertainty remains high. Tension in US-Saudi relations could push the Saudis closer to Russia and President Vladimir Putin. The Biden administration is taking a hard line against Crown Prince MbS, the heir to the Saudi throne, over the murder of a Saudi journalist in Turkey several years ago. Meanwhile, the Saudi oil minister told a CNBC reporter that “drill-baby-drill” in the US is dead. As I had been warning, the pricing power in the crude oil market has passed from the US to the oil ministers and Russia as the shift in US energy policy means less output from the country that was the world’s leading producer. The changes in global petroleum dynamics are a significant event with ramifications for the coming years. Rising tensions between President Biden and Russian President Putin only added to OPEC+’s desire to extract as much as possible from US consumers. President Biden called the Russian leader a “killer.” The US recently rolled out new sanctions on Russia. However, the two leaders met in Switzerland, and the rhetoric will likely cool down over the coming weeks and months. The potential for much higher prices remains a clear and present danger. An inflationary environment only increases the potential for higher oil prices. The administration ended oil and gas leases on federal lands in Alaska, which is not bearish for the prices of the traditional energy commodities. The bull continues to take the staircase higher in the oil market. While product prices could signal a correction on the horizon, US energy policy remains bullish for crude oil. Meanwhile, Iran elected a hardliner as President over the past weekend, which could cause problems with the US and in the Middle East. The US bombed Iranian-backed rebels on the Syria-Iraq border this week. The OPEC meeting this week is the next significant event for the oil market. August Brent futures outperformed August NYMEX WTI futures, as they moved 0.51% lower since June 23. The critical technical resistance levels in Brent stand at $76.60, the recent high, and $86.74, the October 2018 peak. Brent for August delivery was trading at the $74.76 level on Tuesday. August gasoline fell 1.25% to the $2.2415 per gallon level. The gasoline processing spread in August fell 4.64% since the previous report after rising almost 18% last week. The active month August gasoline crack spread was at $21.17 per barrel after trading to a high of $25.25 on May 10 on the back of the Colonial pipeline issues and shortages along the US east coast. The hack is a sign of what could happen to parts of the US’s infrastructure over the coming weeks, months, and years. Gasoline crack spreads tend to exhibit strength during the summer driving season in the US and weakness during the fall and winter months. As I wrote in earlier this year: “We are now moving towards the 2021 driving season, which could take the gasoline crack higher over the coming weeks and months.”

TechnoMental Commodity Report
29
Gasoline could eventually head for the $3 per gallon wholesale level with the shift in US energy policy. August heating oil futures declined 1.75% from the last report. The active month August heating oil crack spread was 7.54% below the June 23 level. Heating oil is a proxy for other distillates such as jet and diesel fuels. Economic growth and increasing air travel demand boosted distillate prices over the past months. The August distillate crack spread closed on Wednesday at $16.31 per barrel after reaching a high at $21.15 on May 12. Distillates received support from increased demand for air travel over the past weeks. The crack spreads are a real-time indicator of demand for crude oil as well as barometers for the earnings of refining companies that process raw crude oil into oil products. I pointed out that: “The crack spreads could be a significant indicator of demand over the coming weeks and months.” Meanwhile, the energy market remains highly sensitive to new outbreaks and hotspots in the US and worldwide. Vaccines are bullish. Stimulus and a stricter regulatory environment in the US under the Biden administration support the price of crude oil. The reaction to the one million bpd Saudi output cut in January was a sign that the international oil cartel has increased influence and pricing power in the petroleum market as US energy policy takes a greener path. The oil price rallied in the wake of OPEC+’s decision to increase output. When a market rallies on what should be bearish news, watch out. Crude oil and product prices suffered sharp pullbacks in mid-March but bounced back to make new and higher highs. OPEC+ and US energy policy are not bearish for the crude oil market. The measure of daily historical volatility in NYMEX crude oil was at 19.27% on June 29, marginally higher than the level on June 23. The price variance metric was at over 67% in March when the market corrected. Since crude oil tends to take the stairs higher and an elevator lower, volatility tends to move lower during bullish periods and vice versa. Daily historical volatility peaked at nearly 40% on May 24 and has more than halved since crude oil rose to a new multi-year high. US energy policy is the most significant factor in the oil market in 2021. Daily production reached an all-time peak of 13.1 mbpd in March 2020. A more restrictive regulatory environment is likely to make that peak unattainable over the coming months and years. As the vaccines create herd immunity to the coronavirus, the demand for crude oil is likely to rise. With OPEC and Russia in a more influential position when it comes to supplies, higher prices could be on the horizon. Worsening US-Saudi relations that push the KSA towards Russia could exacerbate the rift and drive oil prices higher. Brent and WTI failed at the March 8 highs, leading to the March 18 and March 23 selloffs. Both recovered, and Goldman Sachs is looking for higher highs and the $80 level over the coming months.

TechnoMental Commodity Report
30
The continuous NYMEX crude oil futures contract made higher lows and higher highs from late April 2020 until the end of August, when it moved into a consolidation pattern. On November 2, it fell to a low of $33.64 and broke some technical support levels. The vaccine news reversed the bearish price action. The close above $41.70 at the end of November on the continuous contract put in a bullish reversal on the monthly chart. The close above $43.78 on December 31 put in the same bullish pattern on the quarterly chart. Crude oil posted gains over the past four consecutive quarters. A close above $59.43 on June 30 would mark the fifth straight quarterly gain, which looks like a sure thing. Nearby futures have not traded below $50 since January 6. The price fell below $60 in March, and the level had become a pivot point for the energy commodity. Over the past weeks, it remained well above the $60 level, made a higher high, and is now over $70 per barrel, threatening to move to $80 per barrel. The last time the price of nearby NYMEX futures traded below $70 was on June 17. Meanwhile, the Middle East remains a potential flashpoint for the crude oil market. The area is home to more than half the world’s crude oil reserves. Any hostilities that cause supply concerns could send the price of crude oil for nearby delivery appreciably higher in the blink of an eye. The Middle East could provide surprises to the oil market, but global demand remains the primary factor for the price over the coming weeks. The Iranians could test the new US administration. Iran remains a turbulent factor in the area that is home to over half the world’s crude oil reserves. Recently, the US bombed Iranian-backed militia in Syria. Even though the Biden administration seeks to move back into the nuclear nonproliferation treaty with Iran, tensions between the two nations remain high. The new President could make relations even more of a challenge over the coming months. Meanwhile, the dramatic shift in US production policy increases OPEC and Russia’s influence in the crude oil market, which is ultimately bullish for the price of the energy commodity. Crude oil open interest moved 0.53% higher over the past week. The total number of open long and short positions declined during the pullback as speculators scrambled for the exit on March 18 as the price became a falling knife. The rise in the metric, together with the price increase over the past months, was a technical validation of the bullish trend. NYMEX crude oil moved 0.14% lower since the previous report. The energy shares far underperformed crude oil since June 23. The XLE dropped 2.53% since last week’s level. When it comes to the energy-related shares, we should continue to see consolidation in the oil business over the coming months. In previous reports, I wrote: “I would only consider those with the most robust balance sheets like XOM and CVX in the US. Exxon and Chevron could stand to pick up lots of production assets at bargain-basement prices over the coming months as the number of bankruptcies rises in the oil and gas sectors.

TechnoMental Commodity Report
31
Both companies pay substantial dividends and have yet to cut or eliminate payments to shareholders. XOM and CVX are the two leading US integrated oil companies. I would only purchase these companies during corrective periods using wide scales.” After buying the leading companies on weakness, I had begun taking profits on a scale-up basis. I will continue to cash in on the move as the prices move higher. I did no selling over the past weeks as I eventually expect higher highs in the oil stocks. If they decline, I may add to the long position. I made no trades over the past weeks. The spread between Brent and WTI crude oil futures in August moved lower to the $1.78 per barrel level with a premium for Brent on June 23, 28.0 cents lower since last week. The Brent premium tends to move higher during bullish periods in the oil market and vice versa. However, in the first months of 2020, it was the carnage in the price of WTI futures that drove the spread to higher levels. Brent crude can travel by ocean vessel to consumers around the globe, while WTI is a landlocked crude oil. The lack of storage capacity was responsible for the price action in the spread and outright prices in late April that took nearby NYMEX futures into negative territory. Meanwhile, any problems with Iran could cause the Brent premium to spike higher. A decline in US production could cause significant volatility in the Brent-WTI spread. Before 2010, WTI often traded at a $2 to $4 premium to Brent. The WTI grade has a lower sulfur content making it the preferable crude oil for processing into gasoline, the world’s most ubiquitous fuel. If US output continues to decline significantly and demand returns to the market, we could see it impact the Brent-WTI differential and cause periods where WTI returns to a premium to the Brent, which is better suited for refining into distillate products. The spread also reflects the political risk in the Middle East as the region uses the Brent price for its output. The USO and BNO ETF products replicate the short-term price action in WTI and Brent futures, respectively. While both do an adequate job tracking the futures in the short-term, neither are particularly effective for medium or long-term positions because of the volatility of the forward curves in both crude oil benchmarks. The path of least resistance of the oil market will be a function of the ups and downs of the global pandemic and the stock market over the coming months. Iran and the pandemic continue to be factors that could prompt price volatility. Term structure in the oil market experienced a significant shift as the price of crude oil tanked in March and April. The flip from backwardation to contango in the spread reflected the flood of supplies in the crude oil market. Oil traders filled tanks and storage all over the world to take advantage of the wide contango with financing rates at historic lows. Cash and carry trades in the oil market became one of the only profitable areas of the market as demand evaporated back in February through April. The cash and carry trade put upward pressure on freight and storage rates.

TechnoMental Commodity Report
32
The forward curve had moved to the widest contango in years. The contango caused the price of May futures to plunge to an incredible low of negative $40.32 per barrel. As prices moved higher since late April 2020, the contango declined and moved into backwardation. Since June 16, crude oil for delivery in August 2022, minus August 2021, moved from a backwardation of $7.91 to a backwardation of $7.77 over the period, loosening by 14.0 cents per barrel over the period. The backwardation traded at a new $9.30 high on June 21. In 2021, the August-August one-year spread had been in backwardation in a range from a $1.29 to $9.30 premium for the nearby contract. The backwardation was closer to the high than the low on June 29. Rising contango is a sign of a glut in the oil market, while falling contango and backwardation signifies tighter supplies. The capacity for crude oil storage around the globe fell dramatically as well-capitalized traders purchased nearby crude oil, put it in storage, and sold it for futures delivery. The widening backwardation likely triggered profit-taking on the spread, which opens up more capacity on the storage front. Falling production caused the spread to tighten. Production declines and declining inventories over the coming months would result in significant profits for well-capitalized crude oil traders who continue to store crude oil against deferred short positions. The rally in crude oil since the lows in early November drove the one-year spread into backwardation, which was a sign of tightening supplies. Any problems in the Middle East could cause lots of volatility in the term structure for crude oil as they would likely push nearby prices higher compared to deferred levels. Dominant market participants in the petroleum arena manage the forward structure to create backwardations, making consumers pay the highest possible price for the energy commodity. The number of rigs operating in the US was one lower over the past week. According to Baker Hughes, on June 25, the number of rigs in operation was at 372, 184 above the level last year at the same time. While US energy policy will cause drilling activities to decline, the number of rigs operating dropped precipitously last year as the pandemic caused industrial activity, mining, and drilling to grind to a halt. Higher prices are causing rig counts to rise in the US, but not at the same rate they would given the regulatory environment under the Biden administration. US daily production stood at 11.10 million barrels per day of output as of June 18, according to the Energy Information Administration. As of June 11, the API reported a decline of 7.199 million barrels of crude oil stockpiles, while the EIA said they fell by 7.60 million barrels for the same week. The API reported a rise of 959,000 barrels of gasoline stocks and said distillate inventories increased by 992,000 barrels as of June 18. The EIA reported that gasoline stocks fell by 2.90 million barrels and said distillate stockpiles moved 1.8 million barrels higher. The inventory data was bullish for the crude oil market. As of June 18, US production dropped by 2.00 million barrels per day or 15.3% since the March 2020 record high in output.

TechnoMental Commodity Report
33
OIH and VLO shares fell since June 23. OIH was down 4.30%, while VLO moved 4.86% lower over the period. OIH was trading at $217.83 per share level on Tuesday. I am holding a small position in OIH. We are long three units of VLO at an average of $63.81 per share. VLO was trading at $76.92 per share on Wednesday. The shares should follow the crude oil and stock market over the coming days and weeks. August NYMEX natural gas moved higher to $3.630 per MMBtu or 8.29% above the price on June 16. US energy policy considerations could cause price volatility over the coming weeks and months as a shift to address environmental concerns may limit production. Support in July natural gas futures is at $3.165 per MMBtu, the June 21 low. Technical resistance is at $3.811, the June 29 new multi-year high. August natural gas reached the highest price since December 2018 on Tuesday. Natural gas futures put in bullish reversals on the daily chart on April 22 and 26 and followed through on the upside. It put in another bullish reversal on June 4.
Source: CQG The weekly chart shows that natural gas put in a bullish reversal last week and followed through this week, reaching the highest level since late 2018 when. the energy commodity reached over $4.90 per MMBtu. The EIA reported another in a series of lower than expected increase in stocks for the week ending on June 18.

TechnoMental Commodity Report
34
Source: EIA The EIA said stocks rose by 55 bcf to 2.482 tcf for the week ending on June 18. Stocks moved 17.1% below last year and 5.8% below the five-year average. The EIA will report inventory data for the week ending on June 25 on Thursday, July 1. The market expects a 73 bcf injection into stockpiles as hot weather increases the demand for power. Stockpiles peaked at 3.958 tcf before the beginning of the peak season. Baker Hughes reported that a total of 98 natural gas rigs were operating in the US as of June 11, one higher than last week and 23 above last year’s level. LNG shipments to destinations outside the US are an expanding demand vertical for the natural gas market, pushing the number of operating rigs higher.
TechnoMental Commodity Report
35
However, US energy policy that increases regulations on fracking could weigh on further increases and supplies and support the price of the energy commodity. At the end of the 2019/2020 withdrawal season, stocks reached a low of 1.986 tcf. We declined below that level on February 19. The low in the 2020/2021 withdrawal season was 1.750 tcf, 236 bcf lower than the 1.986 tcf at the start of last year’s injection season. If production declines because of the regulatory environment in Washington, DC, we should expect injections to flow into storage at a slower pace in 2021 than in 2020, which could put upward pressure on the natural gas price. We have seen that trend develop over the past weeks. Open interest rose by 4.38% in natural gas over the past week. Price momentum and relative strength on the daily chart were rising towards an overbought condition on Tuesday. I continue to expect the natural gas market to reflect the shift away from fossil fuel production under the Biden administration. Lower production could lead to higher base prices for the energy commodity. The trend turned higher on January 22 and lower on February 18. The short-term trend turned higher again on April 6 at $2.647 per MMBtu on August futures and has not looked back. The price made the latest new high on Tuesday. The shift in US energy policy is clearly bullish for oil and gas. August ethanol prices were unchanged since June 23, with the price at $2.400 per gallon wholesale. Open interest was at two lonely contracts of open long and short positions, down 29 from the previous report, making the biofuel market is untradeable and pointing to a delisting. The futures contract has become nothing more than a pricing benchmark and is heading for delisting. The price of August thermal coal futures for delivery in Rotterdam moved 5.47% higher since last week after significant gains in previous reports. The demand for metallurgical coal for steel making had been robust over the past months. On Tuesday, June 29, the API reported that crude oil inventories fell by 8.153 million barrels for the week ending on June 25. The API said gasoline stockpiles rose by 2.418 million barrels, and distillates increased by 428,000 barrels for the week. On Wednesday, July 1, the EIA will report crude oil and product stockpiles for the week ending on June 25. The latest API report was bullish for the price of the energy commodity. However, the market is awaiting the policy decision from OPEC+ later this week. Weather, US energy policy, geopolitical events, the stock market, and the US dollar will guide the price action in the crude oil market over the coming weeks and months. Natural gas is in the injection season. While natural gas typically displays weakness during the injection season, changes in US energy policy could support the price as production will decline. US relations with Iran and Saudi Arabia could add to price volatility in the oil market over the coming months and years.

TechnoMental Commodity Report
36
I have been taking profits quickly and stopping losses looking for a 1:2 risk-reward ratio on forays into the crude oil futures market. UCO and SCO products can be helpful for those who do not trade futures. In natural gas, I have been using the BOIL and KOLD products, which offer some leverage on the long and short sides. We are holding a long position in PBR, Petroleo Brasileiro SA. At $12.06 per share, PBR was up 1.17% since June 23. I have a small position that I will hold as a long-term investment. PBR is under pressure as Brazil’s President Bolsonaro fired the state-run company’s CEO. As I wrote when the shares dropped below the $8 level: “I believe PBR is at a level that offers compelling value at below $8 per share.” PBR is likely receiving support from the rising Brazilian real. Tight stops continue to be the key when approaching energy commodities in the futures or ETF arena. When it comes to share prices, I have been a seller of the leading oil companies on price strength that I bought scale-down over the past weeks. I have sold 80% of the long positions that were in place when crude oil hit its low in early November. I bought the shares scale-down and am gently selling as share prices rise. Over the past week, I did no selling or buying. Energy powers the world, and demand is critical throughout the rest of 2020. A sudden drop in the US stock market would likely weigh on crude oil prices. I am trading natural gas from both sides of the market with very tight stops. I have only been trading in the crude oil and natural gas markets with very tight stops on futures and ETF products. I will work wide selling scales when taking profits in XOM, CVX, BP, RDS-B, and TOT. For the long-term, the stimulus, liquidity, and falling US dollar are bullish factors for crude oil as they erode the value of currencies. Keep an eye on events surrounding Iran as they could cause sudden price spikes. When taking risk positions home overnight or over weekends, keep the potential for Iranian retaliation in mind. The theocracy in Teheran may want to further test the US as they look for an edge in nuclear talks. When it comes to energy-related stocks, sector rotation can be influential, so my upside scales are gentle, but I remain a seller in the leading energy companies. As we found out on March 18, the risk of a correction increased with the oil price. Meanwhile, at over the $70 per barrel level, the medium and long-term trends over the last year remain higher. In natural gas, US energy policy could be the most influential factor in 2021. Warren Buffet made a $10 billion investment in natural gas infrastructure in mid-2020, which was a vote of confidence for the future price action. I believe the base price for natural gas will rise over the coming months and years. In the short term, it will trade with the weather conditions and the pressure of the offseason for demand. Rising inflationary pressures support the prices for all energy commodities.

TechnoMental Commodity Report
37
However, any risk-off periods in markets could cause a sudden correction in the oil market. I believe the move to new highs after probing below the $60 level was constructive, and we will see higher lows and higher highs in both crude oil and natural gas over the coming weeks and months. The bullish price action continued over the past week. However, the action in other commodities could cause sudden sympathy selling in the energy sector, which continues to face bullish and bearish factors with crude oil, natural gas, ethanol, and coal prices at new highs and in bullish trends. Expect the unexpected in the energy sector. Products, crack spreads, and energy-related stocks have lagged crude oil over the past week, which could be a sign that a correction is on the horizon. The trend remains bullish, but markets rarely move in a straight line. Look for lots of price variance around may OPEC+ announcements.

TechnoMental Commodity Report
38
Grains Soybeans edged higher, corn recovered, while wheat posted a loss since last week as fickle weather conditions will continue to cause high price variance in the grain and oilseed futures arena over the coming weeks. The USDA will publish its July WASDE report on July 12 at noon EST. November soybean futures fell since June 23 and were at $13.1250 per bushel on June 29. The price of new crop soybeans reached a new high of $14.80 on June 7. The continuous contract reached $16.7725 in May, an over eight-year high. Support on November futures stands at $12.4050, the June 17 low. Technical resistance at $14.80, $16.2350, $16.7725, and $17.9475 per bushel, the all-time 2012 high. Soybeans are now in the heart of the 2021 growing season in the northern hemisphere, where the weather conditions will dictate the path of prices. The USDA increased US and global ending stocks in the latest report, which weighed on the oilseed’s price. The weather conditions and Chinese demand will be the most significant factor for the soybean futures. The market is optimistic that the 2021 crop will satisfy worldwide demand as the new crop soybean futures price fell out of the teens before moving back over the $13 level. Open interest in the soybean futures market moved 9.75% lower since June 22. The metric rose to a new record high at over one million contracts in October 2020 but fell as the harvest season wound down. Daily price momentum and relative strength indicators crossed higher near oversold territory and were approaching neutral readings on Tuesday. The December synthetic soybean crush spread was 5.75 cents lower since June 23 to $1.4000. The December crush reached a high of $1.4950 on June 24 and a low of 91.25 cents on January 19, 2021. Volatile conditions in soybean futures translated to high price variance in the crush spread. Keep an eye on the processing spread as it is a barometer of demand for soybean products. Port and logistical issues in Brazil could be causing supply shortages. Chinese demand for soybeans and soybean products remains robust. Soybean oil futures reached a new record high on rising demand for biofuels and cooking oil in China. December corn futures were trading at $5.4850 per bushel on June 29, which was 2.38% higher since the previous report. Corn had been a bullish beast. The continuous corn futures contract rose to a new high of $7.75, which is a new chart point for the coarse grain. Open interest in the corn futures market fell 6.73% since June 22. Corn’s new high at $7.75 on May 7, was the highest price since October 2012. Expect lots of price volatility in the corn futures market over the coming weeks and months. While the weather is the primary factor driving corn prices, rising energy prices are bullish for corn.

TechnoMental Commodity Report
39
Technical metrics were crossing higher from oversold conditions in the corn futures market as of Tuesday. Support on December corn futures is at the $5.0025 level, the late May low. Resistance is at $6.2825 and $7.75 per bushel, the recent highs. Corn will continue to be sensitive to the price path of gasoline. Ethanol production in the US accounts for approximately 30% of the annual corn crop. The price of the illiquid August ethanol futures was unchanged since the previous report. August ethanol futures were at $2.400 per gallon on June 29. The spread between August gasoline and August ethanol futures was at 15.85 cents per gallon on Wednesday, with gasoline at a discount to ethanol. The spread rose 2.84 cents since June 23 as gasoline underperformed ethanol over the past week. The prospects for ethanol prices are a function of gasoline and crude oil prices as we move towards the 2021 planting period. July CBOT wheat futures rose to a new high at $7.6950 on April 27. The May futures reached $7.73 per bushel, the highest price since February 2013. September CBOT wheat futures fell 2.64% since June 23. The September futures were trading at the $6.4625 level on June 29. Open interest decreased by 8.75% over the period in CBOT wheat futures. Technical resistance on September is at $6.7650 per bushel, the June 22 high, $7.04, $7.73, and $9.4725, the 2012 peak. Support is at $6.37, the June 25 low. Price momentum and relative strength were below neutral readings and near oversold conditions on Wednesday. As of June 29, the KCBT-CBOT spread in September was trading at a 19.25 cents per bushel discount, with KCBT lower than CBOT wheat futures in the September contracts. The spread moved 23.75 cents lower since June 16. The long-term norm for the spread is a 20-30 cents premium for the Kansas City hard red winter wheat over the CBOT soft red winter wheat. The CBOT price reflects the world wheat price, and it is the most liquid wheat futures contract. The KCBT price is often a benchmark for bread manufacturers in the US who purchase the grain from suppliers. As I have been writing: “at a discount to CBOT, consumers are not hedging their requirements for KCBT, which is a sign that they continue to buy on a hand-to-mouth basis.” Any sudden problem in the wheat market that causes consumer hedging to increase could dramatically change the spread between the hard and soft winter wheat futures contracts. We may see consumer hedging increase if wheat prices move higher over the coming weeks. The potential for a continuation of even higher prices could cause consumers to hedge their requirements. Consumers tend to panic when the price moves higher. However, the correction could be causing an increase in consumer hedging after they watched wheat prices soar over the past weeks. The KCBT-CBOT spread moved substantially towards the long-term norm since last week. Keep an eye on the spread as it could be an excellent barometer of hedging activity and panic buying by consumers over the coming weeks and months. Wheat production from Russia and a new tax or even a ban on exports could push wheat higher this year.
TechnoMental Commodity Report
40
Deteriorating US-Russian relations could impact the wheat market over the coming weeks and months if the crops in the US or Russia provide an opportunity for one side to squeeze the other when it comes to exports. As always, the weather conditions will be the most influential factor during the 2021 crop year. President Biden and Putin met in Geneva on Wednesday in an effort to ease tensions and reach common ground on many issues. A deterioration in US-Russian relations could impact Russian wheat export policy. Spring MGE wheat was at $8.1450 per bushel on the September contract as hot and dry conditions in the Pacific Northwest have caused explosive price action. The rise of MGE wheat futures is an example of how the weather conditions can wreak havoc with the agricultural commodities during the critical growing season. I expect elevated volatility to continue over the coming weeks as the 2021 crop year is now in the all-important growing season. I had been a buyer of grains in the futures and ETF markets over the past months. Over the past months, I have written: “From the 2008/2009 lows through 2012, the prices exploded higher in the aftermath of the global financial crisis, which could be a model for 2020 and the coming years.” As always, the weather conditions determine supplies and are the most significant fundamental factor each year. Bull market corrections can be severe. I remain bullish and will be trading from the long side with tight stops in case the correction continues to take prices lower. The weather in July and August will be the most significant factor for the grain futures. Expect lots of volatility that come with the ever-changing weather reports. Approach the grains with a clear risk-reward plan on all positions over the coming week. The weather is far more significant for the grains than the USDA reports, which are only a snapshot of the supply and demand fundamentals, which will be ever-changing over the coming weeks and months. Mother Nature and the fickle nature of the weather conditions will create lots of excitement in grain and oilseed futures as prices remain at multi-year highs. A whiff of drought could cause explosive rallies in the current environment as we have seen in the MGE spring wheat futures market.

TechnoMental Commodity Report
41
Base Metals & Industrial Commodities COMEX copper prices edged lower since June 23, but all LME metals, including copper, posted impressive recoveries from June 22 through June 28. Nickel forwards led the way higher. Iron ore was lower while the BDI moved higher. Uranium moved to the upside and lumber prices continued to fall, moving under the $800 per 1,000 board feet level. COMEX copper declined by 1.25% since June 23. The red metal hit a new all-time peak on May 10 at $4.8880 on the July futures contract. The continuous contract reached $4.8985 on that day. July futures settled at $4.2765per pound on June 29 after trading to a low of $4.0880 on June 21. Three-month LME copper was 1.59% higher to $9,363.50 per ton on June 28. Open interest in the COMEX futures contracts was down 2.84% over the past week, as long liquidation caused the metric to drop over the past weeks. Short-term technical support for the copper market is at $4.0880, the June 21 low. The next level on the downside is $3.8760, the low from early March. Technical resistance remained at the $4.5950 level, the June 11 high. Chinese demand and output from South American producers will continue to be the most significant factors in the path of the price of copper over the coming weeks and months. Meanwhile, increased demand from green technologies is increasing copper requirements while supplies are not keeping pace. A US infrastructure program will increase copper demand. The trend in copper remains bullish, but as I wrote, when copper was on the way up, the risk of a correction rose with the red metal’s price. Goldman Sachs expects copper to rise to a new all-time high calling the metal the “new oil.”. Jeff Currie, Goldman’s commodity analyst, pointed out that the inflation-adjusted high in the LME copper forward market came in the 1960s at over $14,000 per ton. Goldman expects the price to rise to the $15,000 per ton level in 2025. The investment firm’s 2011 target is the $11,000 per ton level. Other analysts are calling for even higher prices for the red metal. Bull markets can take prices higher a lot faster than analysts believe possible, but they also suffer periodic corrections, which can be brutal, as we have witnessed over the past trading sessions. Catching a falling knife is dangerous. Copper is a leader in the base metals and industrial sector. The red metal is also a barometer for the global and Chinese economies. Copper’s ascent to new highs was a sign for all commodity prices. Inflationary pressures are bullish for the red metal and the asset class. Copper made higher lows and higher highs since March 2020. However, increasing interest rates makes the cost of carrying inventories higher and can weigh on the red metal’s price. Inventories of copper on the LME and COMEX moved in opposite directions over the past week in a continuation of the recent trend of rising LME stocks and falling COMEX inventories. LME stocks continued to rise a lot more than COMEX stocks are falling. LME stocks rose over 210,000 tons and to the highest level since 2020. Expect lots of volatility in the copper futures arena over the coming weeks.

TechnoMental Commodity Report
42
I remain bullish on the base metals and shares of producing companies, but as I wrote last week, I am taking a cautious approach after Wednesday’s Fed meeting. I view the Fed’s rhetoric as a buying opportunity but will be careful, employing tight stops on risk positions. If stopped, I will look to establish long positions at lower prices. The LME lead price moved 2.62% higher to $2,230.50 per ton on June 28. The rise in demand for electric automobiles around the world had been supportive of lead in the long term as the metal is a requirement for batteries. Since late April 2020, the prices of crude oil, gasoline, and lead moved higher. Meanwhile, a lead surplus has been building in China, but the price is rising because of the magnetic impact of copper and the other base metals that trade on the LME. $2,000 per ton was a pivot point for the three-month lead price. The price remains well above that level, but it could act as a magnet during a correction. The price of nickel forwards led the sector with a 3.74% gain since the previous report. Elon Musk encouraged nickel production as he issued a plea to “any mining company in the world to mine more nickel.” The message turned out to be a very bullish message for the volatile metal over the past months. Musk is working on a supply deal with BHP, the Australian commodity giant. He is also in negotiations with other Indonesian producers. Mr. Musk, one of the world’s wealthiest people, is looking for supplies of “clean” nickel. Do not discount the potential for him to purchase a nickel producer to guarantee supplies for his business as his Tesla and other franchises, including SpaceX and the Boring Company, grow. SpaceX received a contract from NASA. The nickel price continues to trend higher, but it is a highly volatile base metal. Mr. Musk’s net worth recently rose to a level that is higher than BHP, the Australian mining giant that is one of the world’s leading nickel producers. Growing nickel demand for both stainless steel and batteries is likely to continue to underpin the price of the nonferrous metal. Tin was 3.08% higher since June 22. Tin stocks continued to rise over the past week. Aluminum was 3.10% higher since the previous report as of June 28. The price of zinc moved 1.60% to the upside since June 22. Zinc was at the $2,898.50 per ton level on June 28. July lumber futures were trading at the $758.00 level on June 29, another 14.28% lower since the previous report, after reaching a new record high at $1,711.20 per 1,000 board feet on the May contract on May 10. The July lumber price ran out of upside steam at over the $1,700 level, plunged, more than halving in value. Lumber can be a leading economic indicator at times. Lumber began falling before selling hit other commodity markets. The potential for an infrastructure building project by the US government could support gains in lumber futures. Home improvement projects during the shutdown contributed to higher demand and prices for wood. Supplies have been a problem because of mill closures. The lumber futures market suffers from minimal liquidity, which makes it a highly volatile commodity.
TechnoMental Commodity Report
43
Lumber is often a leader and barometer for the commodities asset class. I never trade lumber but watch the price action like a hawk as it is a valuable guide for trends and trend reversals in the industrial commodity asset class. The winter months tend to be a weak period for the lumber market as construction activity declines, lowering the demand for wood. Lumber was very strong throughout the past winter season. The US infrastructure rebuilding package will likely support wood’s price. Lumber had been explosive over the past months. Before 2018, the all-time peak was $493.50. As I wrote over the past weeks: “The price action in lumber is a warning for all commodities that have experiencing substantial rallies.” Lumber sent a signal that turned out to be significant. The price of uranium was 0.31% higher since June 23 at $32.50 per pound. However, the yellowcake price was at $267.50, up 5.32% over the past week. In mid-April, when it was trading below $16 per share, I wrote: “Buying CCJ or other uranium companies on the dip could be the optimal approach to the commodity.” CCJ shares closed at the $19.14 level, down 2.84% since June 23. I continue to believe CCJ shares offer value but now rate the stock as a hold. The volatile Baltic Dry Index moved 6.57% higher since the previous report. The BDI was at the 3,324 level on June 29, on higher fuel prices. July iron ore futures moved 1.63% lower compared to the price on June 16. After trading below $185 a few weeks ago, iron ore recovered to over the $200 level. Supply shortages of iron ore from Brazil have supported the price for more than a year. Rising iron ore and metallurgical coal prices have been a sign of strength in the global economy. Open interest in the thinly traded lumber futures market rose 5.03% since the previous report as lumber continued to decline. The illiquid markets like lumber can become roach motels when a trend reverses, creating gaps that can cause significant financial pain for those on the wrong side of a move. Never trade lumber, just watch the price action. The rise in lumber is a sign of demand for framing wood, a primary ingredient in new home construction. The plans for rebuilding infrastructure will increase lumber demand. LME copper inventories rose 31.05% over the past week after double-digit percentage increases over the past weeks. LME stocks of the red metal stood at 210,925 tons as of June 28 and were 49,975 metric tons above the June 22nd level. LME copper inventories had been steadily declining over the past months until they reached bottom below the 75,000-ton level and began to climb. The amount of copper in LME warehouses made a new high for 2021. Copper stocks are often manipulated by dominant market participants.

TechnoMental Commodity Report
44
Since a Chinese company owns and operates the LME, the potential for manipulation to achieve price goals is always a factor for the red metal. I always view substantial and sudden changes in inventory data with a grain of salt. COMEX copper stocks fell 3.34% since June 22 and stood at 50,604 tons, which nowhere near compensates for the rise in the LME inventories. Lead stockpiles on the LME fell 4.23% after a huge build in March. Oversupply in the Chinese lead market has not weighed on the price of the toxic metal. Aluminum stocks were 2.32% lower after a massive increase of nearly 50% in March. Aluminum LME warehouse stocks stood at the 1,586,150-ton level on June 28. Zinc stocks dropped 1.65% since June 22 to 255,675 tons. Tin inventories were up 145 tons or 7.38% since June 22 at 2,110 metric tons. Nickel inventories were 1.36% lower compared to the level on June 22. Infrastructure rebuilding in the US and Chinese economic growth support the base metals. Stockpile data can reveal supply and demand trends, but traders often use the inventories to influence perception and prices. Rising interest rates could attract more metal into exchange warehouses. FXC fell sharply with copper but edged higher over the past week and was trading at $37.27 on Wednesday, up 9.0 cents per share or 0.24% since the previous report. I continue to maintain a long position in FCX shares. FCX tends to move higher and lower with the price of copper. FCX reached the highest price since February 2012, when it traded to $46.10. As I have been writing: “I remain long FCX at $11.37 and will use a stop on close above that level to protect capital. I would increase the level of the stop as FCX moves higher to protect profits.” This position is up over 227%, so I would move stops higher to guarantee a substantial profit while riding the trend higher for the potential of more gains. There is nothing wrong with selling half the position and riding the balance for free with no capital risk. I am working am stop on half the position at the $29 level. Keep stops tight on all positions in this sector that is highly sensitive to macroeconomic trends. In the medium to longer term, the stimulus and potential for a US infrastructure rebuilding program are bullish for industrial commodities. Short-term bouts of risk-off periods could cause sharp selloffs. A falling dollar is likely to support higher prices; a rising greenback has the opposite effect. We are long PICK, the metals and mining ETF product. We bought PICK at the $23.38 per share level, and it was trading at $45.20 on June 29, up $0.82 or 1.85% over the past week. PICK hit a new high of $52.39 on May 10, the highest level since February 2012. I continue to rate this metals and mining ETF that holds shares in the leading producing companies in the world a long-term hold.

TechnoMental Commodity Report
45
I would raise stops to guarantee a profit if a correction occurs as PICK has moved over 93% higher. Base metals and industrial commodities prices should continue to follow crude oil and stocks over the coming weeks. The strength in industrial commodity prices over the past months is a sign of inflationary pressures on the global economy. As I warned last week, Be cautious in the current environment. Keep those stops tight on short-term positions. Do not allow a short-term foray into the market to become a long-term investment. More stimulus early this year, and the potential for an infrastructure project in the US is bullish for industrial commodity prices. Protect profitable long positions with stops. As I wrote over the past weeks: “The bullish trend in the sector continues during the first months of 2021. The price action in base metals continues to be constructive, but the higher prices rise, the greater the potential for a correction.” Industrial commodity prices had been on bullish fire since March 2020 in a sign of rising inflationary pressures. After the dramatic rallies, there was room for substantial corrections that would not alter the long-term trends established over the past months. I remain bullish on the sector, but we could experience a bumpy ride after the latest Fed meeting. It is impossible to pick tops or bottoms in markets. Approach all risk positions with a plan for risk and rewards and stick to it! The price action over the past week that followed the Fed meeting continued to be a sign that buyers stepped into the base metals on the dip.

TechnoMental Commodity Report
46
Meats August live cattle drifted marginally lower while feeder cattle prices for the same month edged higher over the past week. August lean hog futures recovered after probing below the $1 per pound level. The USDA will report on the meat markets in the next WASDE report on July 12. August live cattle futures were at $1.219250 per pound level, down 0.77% from June 23. Technical resistance is at $1.25775 per pound on the August contract, the May 25 high. Technical support is at $1.172250 per pound level, the June 8 low. Daily price momentum and relative strength indicators were on either side of neutral readings on Tuesday. Open interest in the live cattle futures market edged 0.56% lower since the last report. The disconnect between cattle prices in the futures market and consumer prices at the supermarket created dislocations in the market in 2020. Beef and pork markets are now in the heart of the 2021 grilling season. Live cattle had made higher lows and higher highs from October 2020 until early April. Markets rarely move in a straight line. I was a buyer of cattle during the weak price over the past weeks. The recent price action has been positive in the beef futures. I remain cautiously bullish despite softer prices over the past week. I will be using trailing stops against long positions. August feeder cattle futures moved higher since June 23 as they rose by 1.09%. August feeder cattle futures were trading at the $1.57400 per pound level with support at $1.53600, the June 21 low, and resistance at the $1.60150 per pound level, the June 17 high on the August contract. Open interest in feeder cattle futures was 1.04% lower since the previous report. Sometimes live cattle prices lead feeder cattle prices, while at others, the opposite occurs. Price momentum and relative strength metrics were above neutral conditions on the daily chart on Tuesday. August lean hog futures rebounded to $1.03625 per pound on June 29, which was 2.88% above the level in the previous report. Price momentum and the relative strength index crossed higher in oversold territory and were rising after a bounce from 96.50 cents, the June 24 low. Short-term support on August hogs is at the June 24 low and 95.225 cents, the April 16 low. Technical resistance on the August futures contract is at the $1.20550 per pound level, the June 7 high. Open interest fell 5.26% since June 22. Lean hog futures traded at the highest level since August 2014 at $1.2360 per pound on the July contract on June 7 and 8, which is a double top in the pork futures arena and led to a substantial correction. The all-time high was in 2014 at $1.33875 per pound. Meanwhile, there are reports that African Swine Fever made a return in China, causing some supply concerns. If ASF destroys Chinese pigs, we could see an increase in the demand for US pork, which would push lean hog futures higher over the coming weeks and months. China is the world’s leading pork-consuming nation. At the recent G-7 meeting, leaders put additional pressure on the Chinese, which only exacerbates tensions with the US. The Chinese own the leading US hog processing company, Smithfield Foods.

TechnoMental Commodity Report
47
A Chinese company purchased the Virginia-based company in 2013. Smithfield could divert some of its pork and pork products to China if shortages develop over the coming weeks and months. China has faced substantial challenges with pork supplies over the past years. The long-term average for the spread between live cattle and lean hogs is around 1.4 pounds of pork for each pound of beef. The August spread fell over the past week as live cattle underperformed the lean hog futures.
Source: CQG Based on settlement prices, the spread was at 1.17660:1 compared to 1.21990:1 in the previous report. The spread fell 4.33 cents higher as live cattle fell, and lean hog futures rose over the past week. The spread continued to move towards the long-term average as pork became less expensive than beef over the past week. The April cattle-hog spread hit the high at 1.4971 on August 12, 2020. The spread made a new low at 0.9887:1 on June 1, with August live cattle’s price under August lean hog prices. Hogs dropped far more than cattle in 2020 during the pandemic and corrected, sending the spread well below the long-term average. Hogs remain historically expensive compared to cattle. AFS could cause export demand from the US to China to rise later this year. I had been a buyer of cattle futures on price weakness and a seller of hogs on strength into early June. From a historical perspective, beef remains cheap compared to pork. Any diseases or the lack of soybeans for feed could exacerbate the global pork shortage that occurred in 2019 on the back of the outbreak of African Swine Fever in China and neighboring countries. A return of ASF could be a significant event for the pork market at a time when grain prices are already high with the beans in the teens. At nearly $1.20 per pound, lean hog futures were at the highest price since 2014.

TechnoMental Commodity Report
48
Higher soybean prices could have the most substantial impact on animal protein prices over the coming months. Soybean meal is a primary ingredient in animal feed, and it soared over the past months. Soybean oil rallied as Chinese demand for cooking oil and worldwide requirements for biodiesel are rising. Soybeans and products fell over the past weeks. Over the past weeks, I wrote: “I continue to believe cattle prices are too low. I have built long positions on price weakness over the past weeks for the grilling season while taking some profits on long lean hog positions.” I believe the bullish price action we witnessed in corn, soybean, and wheat futures is making its way to other agricultural futures markets, and the cattle and hog arena are no exception. Even though grain and oilseed prices corrected from the highs, they are still expensive for ranchers and animal protein producers compared to prior years. The COW ETN is illiquid but can be an acceptable substitute for those who do not venture into the futures arena. I remain modestly bullish on the meats. As with all commodities, the higher prices climb, the more the risk of pullbacks becomes. Lean hogs are a perfect example. Protect those profitable positions when prices are rising, so profits do not turn into losses.

TechnoMental Commodity Report
49
Soft Commodities FCOJ fell, while the other four soft commodities posted gains since June 23. Coffee led the way higher, with sugar in second place. Cocoa and cotton futures moved slightly higher since the previous report. October sugar futures rose by 3.12% since June 23, with the price settling at 17.54 cents. The price had mostly made higher lows and higher highs over the past months, and the trend remains bullish. The high in 2021 came on February 23 when the expired March sugar reached 18.94 cents, the highest price since March 2017. The October contract reached a high of 18.23 cents on May 12 and a lower high at 17.94 cents on June 2. After reaching a continuous contract low of 9.05 cents in April 2020, the price nearly doubled at the most recent peak. Technical resistance on October futures stands at 17.94 cents, the early June high. The continuous contract 18.94 high is the upside target for the sweet commodity. Support sits at 16.44 cents on the now active month futures, the June 21, 2021 low. On that day, sugar put in a bullish reversal on the daily chart. The price action in the energy and agricultural products had supported gains in the sugar futures market over the past weeks and months. The mid-March correction in crude oil likely prompted selling in the sugar futures arena. A significant upside target on the monthly chart stands at the October 2016 peak of 23.90 cents per pound. In 2011, sugar reached a high of 36.08 cents. Sugar could not close above 15.50 on March 31, ending the streak of quarterly gains at three. However, the price moved aggressively higher throughout April and into early May. Sugar is slightly lower on the continuous contract in June. Sugar prices are also highly sensitive to the exchange rate between the US dollar and the Brazilian real. The value of the July Brazilian real against the US dollar was at the $0.202350 level against the US dollar on Wednesday, up 0.60% since the previous report. The July real futures traded to a low of $0.17165 on March 9 but has recovered and made higher lows and highs. Brazil leads in the production of sugar, coffee, and FCOJ; two of the three moved higher since June 23. The soft commodity futures could follow the Brazilian currency if it continues to rally. Meanwhile, Brazil remains a hotspot of the global pandemic, which could lead to supply chain problems for sugar, coffee, and oranges, as well as the other commodities produced by South America’s most populous nation and leading economy. Price momentum and relative strength on the daily sugar chart crossed higher and were above neutral readings and rising as of June 29. The metrics on the monthly chart were above neutral readings. The quarterly chart is above a neutral condition and rising. Sugar probed below the 15.00 cents area in late March and early April on the October futures contract and then rebounded and is now sitting just over the 16.50 cents level.

TechnoMental Commodity Report
50
The low at April 2020 continuous contract low of 9.05 sugar fell to the lowest price for sugar since way back in 2007. In 2007, the price of sugar fell to a low of 8.36 cents before the price exploded to over 36 cents per pound in 2011. At that time, a secular rally in commodity prices helped push the sweet commodity to the highest price since 1980. If the central bank and government stimulus result in inflationary pressures, we could see a repeat performance in the price action in the commodities asset class that followed the 2008 financial crisis. Sugar could become a lot sweeter when it comes to the price of the soft commodity in a secular bull market caused by a decrease in the purchasing power of currencies around the world. Meanwhile, since Brazil is a leading commodity producer, rising raw material prices could push the real’s value higher, leading to gains in the world sugar futures market. The action from late March in crude oil, gasoline, and most significantly ethanol prices are supporting sugar prices. Open interest in sugar futures moved 2.65% lower since the previous report. Without any specific fundamental input, sugar is likely to follow moves in the energy sector as well as the currency market when it comes to the exchange rate between the US dollar and the Brazilian real. Open interest had been gently rising as the sugar price rose over the past year, which is a technical validation of the bullish price action. Sugar can be a highly volatile soft commodity. I remain long and bullish on sugar. September coffee futures rallied 4.09% since June 23. September futures were trading at the $1.6020 per pound level. The short-term technical level on the downside is at the $1.4905 level on the September futures contract, the June 21 low. Below there, support is at around $1.2020 and $1.0215 on the continuous futures contract. Technical resistance is at $1.6865, the June 1, and $1.76, the November 2016 high. Coffee futures put in a bearish reversal on the daily chart on April 29 and drifted lower before exploding higher on May 5 and making a new high on May 6. The November 2016 $1.7600 high on the continuous futures contract is an upside target for the coffee futures market. After putting in a bullish reversal on the monthly chart in November 2020, coffee’s price posted gains in December but was lower in January. Coffee soared higher in February. In March, it gave back February’s gains. In April, the price exploded to a new and higher high. In May, the price moved even higher. After a new high in early June, the price is now lower than the May closing price. Coffee futures are only slightly lower in June as the end of the month comes tomorrow. Our stop on the long position in JO is at $27.99. JO was trading at $44.91 on Tuesday. I would move the stop higher to protect profits on the ETN. Open interest in the coffee futures market rose by 1.43% over the past week. I continue to hold a core long position in the coffee market. The upside target is the November 2016, high at $1.76 per pound. Price momentum and relative strength are above neutral readings. On the monthly chart, the price action was well above neutral readings and rising. The quarterly picture was rising and above neutral territory. Coffee can be a wild bucking bronco when it comes to the price volatility of the soft commodity.

TechnoMental Commodity Report
51
I expect volatility in coffee to continue, and I will look to trade on a short-term basis with a bias to the long side. Any new positions should have tight stops and defined profit objectives. The price of cocoa futures edged higher over the past week. On Tuesday, September cocoa futures were at the $2,390 per ton level, 0.89% higher since the previous report. Open interest was 4.34% higher since June 22. Relative strength and price momentum crossed higher from oversold readings as of June 29. The expired December 2020 futures rose to $3,054 per ton, which was a sign of tight supplies, rising demand, or both. Hershey’s buying in the futures market distorted prices and sent them to the highest price since August 2016. The cocoa market tends to display lots of volatility during roll periods because of deliveries. Avoiding the West African $400 per ton surcharge has caused some consumers to turn to the futures market for supply requirements. The trend is likely to continue to add volatility to the futures market so long as the Ivory Coast and Ghana impose the premium for their beans. The two countries supply over 60% of the world’s cocoa annually. We are long the NIB ETN product. NIB closed at $28.77 on Tuesday, June 29. The levels to watch on the upside are at $2,452, $2,552, and $2,754 per ton. On the downside, technical support levels are at $2,334, $2,278, and then at $2,137 per ton on the continuous contract. The long-term target on the upside is at $3,826 per ton, the all-time peak from 2011. I continue to favor the upside in the cocoa market. We are likely to see continued volatility in the cocoa futures arena in 2021. Cocoa prices can become very volatile as the weather and political conditions in West Africa are the most significant factor for the primary ingredient in chocolate confectionery products. December cotton futures were 0.74% higher since June 23. December cotton was trading at 87.58 cents per pound on June 29. On the downside, support is at 83.37, 77.12, and then at 48.35 cents per pound. Resistance stands at 88.50, 91.00, 92.95, and 96.50 cents. Open interest in the cotton futures market rose 2.72% since June 22. Daily price momentum and relative strength metrics were above neutral readings and rising on Tuesday. Cotton reached a bottom at the 77.12 cents level on the continuous futures contract in March. The most recent move to the upside took the October futures to 88.50 cents on June 11 before correcting. They were on the upswing again since June 17 when they made a higher low at 83.37 cents. I had been optimistic about the prospects for the price of cotton since the 50 cents per pound level, but as I wrote, as the price rose above the 90 cents per pound level, the risk increased with the price. I would continue to use tight stops on any long positions and a reward-risk ratio of at least 2:1. A softening in the tensions between the US and China under the new administration could support the price of the fiber futures.

TechnoMental Commodity Report
52
Cotton suffered selling pressure in 2008 that pushed the price to below 40 cents per pound. A decline in production and stimulative policies by central banks took cotton from the bottom end of its pricing cycle twelve years ago to an all-time high of $2.27 per pound in 2011. Cotton can be a highly volatile soft commodity that takes the stairs higher and elevator to the downside during corrections. September FCOJ futures were trading around $1.2000 per pound, down 1.44% since June 23. Short-term support is at $1.1830 level, the June 21 low. Technical resistance is at $1.3180 per pound, the June 9 peak. Open interest fell by 1.32% since June 22. Price momentum and relative strength indicators were below neutral readings on Tuesday. When FCOJ fell in late April and early May, I wrote: “I have begun nibbling at long positions below the $1.10 level with a stop under $1.05.” I sold my long positions in FCOJ and will look for other opportunities over the coming weeks as they arise. Soft commodity futures edged higher over the past week, led by the coffee market, which is probing above the $1.60 level. The rising Brazilian real against the US dollar is bullish for coffee, sugar, and FCOJ. Cotton depends on the weather in growing regions, while cocoa prices will be a function of West African crops.

TechnoMental Commodity Report
53
A Final Note
Happy Fourth of July holiday to everyone. I wish you all a safe and wonderful long weekend. Independence Day in the US in 2021 will be a far happier occasion than in 2020 when the US and the world were in the grips of the global pandemic, with the number of cases and the death toll rising daily. Vaccines and the rising herd immunity to the virus allow us to enjoy the long weekend with our family and friends. We have a lot to be thankful for this July 4th. Meanwhile, today’s report is coming to you one day earlier than usual. I will be working on and sending out the comprehensive second-quarter reports on the six commodity sectors and a general report over the coming week. I am hopeful that all seven reports will be available before July 7. Be careful in markets. Approach any risk positions with a plan. The price action on Wednesday, June 30, will likely reflect quarter-end window dressing. We could see markets quiet down for the upcoming holiday weekend. Enjoy your family and friends! I plan to increase the price of the report in the coming months. However, all of my current loyal subscribers will never experience an increase in their monthly or annual subscription rates. I will grandfather all subscribers at their current rates for as long as they maintain their subscriptions. Thank you for your support. Please keep safe and healthy in this environment. Until next week, Andy Hecht Any investment involves substantial risks, including, but not limited to, pricing volatility, inadequate liquidity, and the potential complete loss of principal. This document does not in any way constitute an offer or solicitation of an offer to buy or sell any investment, security, or commodity discussed herein, or any security in any jurisdiction in which such an offer would be unlawful under the securities laws of such jurisdiction.