Technology Validation: Fuel Cell Bus Evaluations
21
Technology Validation: Fuel Cell Bus Evaluations Leslie Eudy National Renewable Energy Laboratory June 7, 2017 Project ID # TV008 This presentation does not contain any proprietary, confidential, or otherwise restricted information.
Transcript of Technology Validation: Fuel Cell Bus Evaluations

Technology Validation: Fuel Cell Bus EvaluationsLeslie EudyNational Renewable Energy LaboratoryJune 7, 2017
Project ID # TV008
This presentation does not contain any proprietary, confidential, or otherwise restricted information.

2
Overview
• Project start: FY03• End: Project continuation and
direction determined annually by DOE
• FY16 DOE funding: $200K• FY17 planned DOE funding: $200K• Total DOE funds received to date:
$3.99M (15 years)
Additional funding: U.S. Department of Transportation (DOT) Federal Transit Administration (FTA)
• Lack of current fuel cell vehicle (bus) performance and durability data
• Lack of current H2 fueling infrastructure performance and availability data
Timeline and Budget Barriers
• Transit fleets: Operational data, fleet experience
• Manufacturers: Vehicle specs, data, and review
• Fuel providers: Fueling data and review
Partners

3
Relevance
Current Targetsa Units 2016 Target Ultimate Target
Bus lifetime years/miles 12/500,000 12/500,000
Powerplant lifetime hours 18,000 25,000
Bus availability % 85 90
Roadcall frequency(bus/fuel cell system)
miles between roadcall 3,500/15,000 4,000/20,000
Operation time hours per day/ days per week 20/7 20/7
Maintenance cost $/mile 0.75 0.40
Fuel economy miles per diesel gallon equivalent 8 8
• Validate fuel cell electric bus (FCEB) performance and cost compared to DOE/DOT targets and conventional technologies
• Document progress and “lessons learned” on implementing fuel cell systems in transit operations to address barriers to market acceptance
a Fuel Cell Technologies Program Record # 12012, Sept. 2012, www.hydrogen.energy.gov/pdfs/12012_fuel_cell_bus_targets.pdf

4
Approach
Data Collection/Analysis• NREL uses standard
protocol for collecting existing data from transit partners
• Provides a third-party analysis
• Includes comparisons to conventional-technology buses in similar service (diesel, CNG, diesel hybrid)
Individual Site Reports• Documents
performance results and experience for each transit agency
• Builds database of results
• Reports published and posted on NREL website
Annual FCEB Status Report (milestone)• Crosscutting analysis
comparing results from all sites
• Assesses progress and needs for continued success
• Provides input on annual status for DOE/DOT targets
CNG = compressed natural gas

5
Approach: Data Summary for 2017
ACT ZEBA
SL AFCB
Specifications for FCEBs included in data summaryFCEB Identifier ACT ZEBA SL AFCB UCI AFCBTransit agency AC Transit SunLine UCI
Location Oakland, CA Thousand Palms, CA Irvine, CA
Number of buses 13 4 1Bus OEM Van Hool ElDorado NationalBus length/height 40 ft / 136 in. 40 ft / 140 in.Fuel cell OEM UTC Power Ballard
Model PureMotion 120 Fcvelocity–HD6Power (kW) 120 150
Hybrid system Siemens ELFA, Van Hool integration BAE Systems HybriDrive
Design strategy Fuel cell dominant Fuel cell dominantEnergy storage – OEM EnerDel A123
Type Li-ion Nanophosphate Li-ionCapacity 17.4 kWh 11 kWh
Number of cylinders 8 8Capacity (kg)/pressure (bar) 40 / 350 50 / 350Technology readiness level 7 7
OEM = original equipment manufacturerACT ZEBA = AC Transit Zero Emission Bay AreaSL AFCB = SunLine American Fuel Cell BusUCI = University of California at Irvine
UCI AFCB

6
0
10
20
30
40
50
60
70
80
Num
ber o
f bus
es
OtherNew FlyerVan HoolAFCB
Accomplishments and Progress FCEB Numbers Expected to Grow
Currently in service: 25 FCEBsPotential FCEBs by end of 2018: 67
Entry into market of new design that is ‘Buy America’ compliant. Shares components with conventional bus design to reduce cost.

7
0
5,000
10,000
15,000
20,000
25,000
30,000
1 2 3 4 5 6 7 8 9 10 11 12 13 14 15 16 17 18
Tota
l Hou
rs
Accomplishments and Progress Top Fuel Cell Powerplant Exceeds 23,000 Hours
Total hours accumulated on each FCPP as of 2/28/17
Top fuel cell powerplant (FCPP) >23,800 hours, surpassing DOE/DOT 2016 target; 67% of FCPPs (12) more than 15,000 hours
In-service FCPPAverage: 14,332
DOE/DOT 2016 Target: 18,000
DOE/DOT Ultimate Target: 25,000
In-service FCPPs ACT ZEBA SL AFCB UCI AFCB

8
0
10
20
30
40
50
60
70
80
90
100Ja
n-15
Feb-
15
Mar
-15
Apr-1
5
May
-15
Jun-
15
Jul-1
5
Aug-
15
Sep-
15
Oct
-15
Nov
-15
Dec
-15
Jan-
16
Feb-
16
Mar
-16
Apr-1
6
May
-16
Jun-
16
Jul-1
6
Aug-
16
Sep-
16
Oct
-16
Nov
-16
Dec
-16
Avai
labi
lity
(%)
FCEB FC System only 2016 Target DOE/FTA Ultimate Target
Accomplishments and Progress Average Bus Availability Improves to 79%
Monthly bus availability
Availability = planned operation days compared to actual operation days
New Data
2016 SummaryAverage availability: 79%FCPP availability: 94%
2015 SummaryAverage availability: 75%FCPP availability: 86%

9
Accomplishments and Progress Availability Summary: 2016 Data
PM = preventive maintenanceDays Available79%
FC System6%
Hybrid Propulsion
5%
Battery Related0%
Bus Related7%
PM3%
Unavailable21%
FCEB Fleet Number %Available 4,967 79FC system 393 6Hybrid propulsion 310 5Traction batteries 25 <1Bus maintenance 411 7PM 157 3Total days 6,263 100
FC = fuel cellPM = preventive maintenance

10
0
5,000
10,000
15,000
20,000
25,000
Mile
s be
twee
n ro
adca
ll
FCEB Bus MBRC FCEB FC System MBRC
2016 FC System MBRC Target
Ultimate Bus MBRC Target
2016 Bus MBRC Target
Ultimate FC System MBRC Target
Accomplishments and Progress Reliability: Miles Between Roadcall (MBRC)
New Data
– FCEB reliability surpassed ultimate targets in early 2015– Maintenance staff becoming more familiar with system, applying new
tools to anticipate and fix issues before they fail in service

11
Accomplishments and Progress Maintenance Costs per Mile – 2016
0.00
0.20
0.40
0.60
0.80
1.00
1.20
FCEB Diesel CNG
Cos
t ($/
mi)
Scheduled Unscheduled
2016 Cost ($/mi) FCEB Diesel CNGScheduled 0.22 0.15 0.08Unscheduled 0.77 0.41 0.38Total 0.99 0.56 0.46
– All baseline buses and most FCEBs are out of warranty
– Costs tend to rise as buses age and pass warranty period
– Average miles for each bus type – FCEB: 118,900; Diesel: 196,800; CNG: 463,400
– FCEB costs include added labor for training (~$0.04/mi estimated for PMIs based on average time)
PMI = preventive maintenance inspection

12
Accomplishments and Progress Maintenance Costs per Mile by System – 2016
Systems with highest percent of costs
FCEB Propulsion system: 36.1% Air system: 18.7%Cab, body, access.: 18.0%PMI: 16.5%
DieselPropulsion system: 28.2%Cab, body, access.: 25.3%PMI: 14.3%
CNGPropulsion system: 44.3%Cab, body, access.: 22.4%PMI: 12.5%PMI = preventive maintenance inspection
0.00
0.20
0.40
0.60
0.80
1.00
1.20
FCEB Diesel CNG
Cos
t by
Syst
em ($
/mi)
Tires
General air systemrepairsAxles, wheels, anddrive shaftLighting
HVAC
Frame, steering,and suspensionBrakes
PMI
Propulsion-related
Cab, body, andaccessories

13
Accomplishments and ProgressMaintenance Cost per Mile by Propulsion Sub-System – 2016
Sub-systems with highest percent of costs
FCEB Fuel cell: 30.5% Electric drive: 29.5%Cooling: 16.6%
DieselExhaust: 37.2%Engine: 18.1%Cooling: 12.9%
CNGEngine: 53.6%Exhaust: 12.2%Cranking/charging: 12.0%0.00
0.05
0.10
0.15
0.20
0.25
0.30
0.35
0.40
FCEB Diesel CNG
Cos
t by
Syst
em ($
/mi)
Exhaust
Hydraulic
Electricdrive/TransmissionFuel System
Cooling
Air Intake
Cranking/Charging
Electrical
FC/Engine

14
Accomplishments and Progress Developed Maintenance Readiness Level Guideline
‒ Transition of knowledge to transit staff essential for commercialization
‒ Guideline helps fleet operators assess readiness for maintaining zero-emission vehicles
‒ Developed with fleet and OEM partner input
‒ Next step: present guideline at transit conference and coordinate with FTA-funded project to develop training curriculum

15
• Provide a comparison of maintenance cost per mile by system for baseline buses.o Slides are included to show overall maintenance cost per mile
by system for FCEBs, diesel buses, and CNG buses (Slides 13, 14).
• NREL should collect data on more buses.o Delays in project start are out of NREL control. We plan to begin
data analysis on new fleets as soon as they go into service. Several new projects are expected to begin in 2017.
• Lessons learned should be documented.o Lessons learned are documented in individual site reports.
Accomplishments and Progress Responses to Previous Year Reviewers’ Comments
16
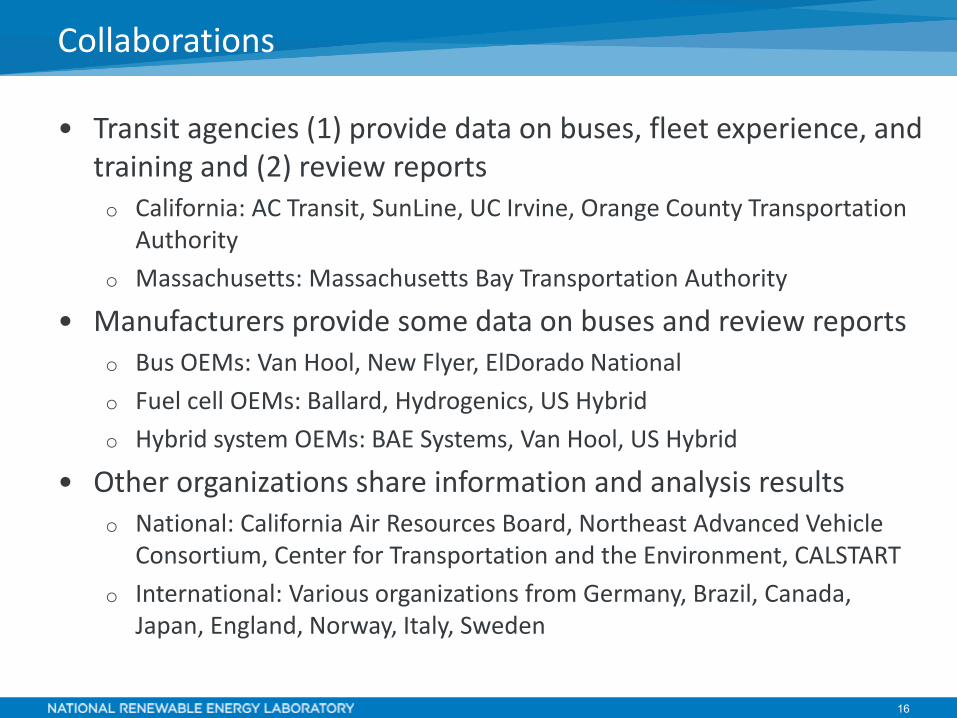
Collaborations
• Transit agencies (1) provide data on buses, fleet experience, and training and (2) review reportso California: AC Transit, SunLine, UC Irvine, Orange County Transportation
Authority o Massachusetts: Massachusetts Bay Transportation Authority
• Manufacturers provide some data on buses and review reportso Bus OEMs: Van Hool, New Flyer, ElDorado Nationalo Fuel cell OEMs: Ballard, Hydrogenics, US Hybrido Hybrid system OEMs: BAE Systems, Van Hool, US Hybrid
• Other organizations share information and analysis resultso National: California Air Resources Board, Northeast Advanced Vehicle
Consortium, Center for Transportation and the Environment, CALSTARTo International: Various organizations from Germany, Brazil, Canada,
Japan, England, Norway, Italy, Sweden

17
Remaining Challenges and Barriers
• For technology validation and data collection project:o Establish good relationships with additional transit agencies to allow
data collection for new FCEB designso Continue data collection to track progress of newer generation designs
• For industry to meet technical targets and commercialize FCEBs:o Increase durability and reliability of the fuel cell, battery system, and
other componentso Develop robust supply chain for components and parts to lower cost and
downtime– Multiple component suppliers to stabilize supply– Standardized with conventional bus components to lower cost
o Establish support centers for advanced technology componentso Increase learning curve for maintenance staff
– Develop training specific to FCEBs and incorporate in traditional classes– Provide tools to agencies for monitoring and troubleshooting issues
o Reduce cost, both capital and operating

18
Proposed Future Work
• Remainder of FY 2017o Complete the following data analyses/reports:
– SunLine AFCB Report, May 2017– AC Transit, ZEBA Report, June 2017– 2017 Annual Status Report, September 2017
o Begin data collection on FCEBs at MBTA, OCTA, SARTA: adds data from FCEBs in colder climates
o Provide feedback to DOE on technical issues with systems and components
• FY 2018o Kick off new FCEB evaluations as buses go into service –
target new designs from different OEMso Complete individual site reports as scheduledo Complete annual crosscutting analysis across sites
Any proposed future work is subject to change based on funding levels

19
Propos ed Fuel C ell E lec tric B us E valuationsB us 2016 2017 2018
Length 1 2 3 4 1 2 3 4 1 2 3 4ZE B A Demonstration C A Oakland 40 13 AC Trans it
C A T housand P alms 40 1 S unLineC A Orange C ounty 40 1 OC TAOH C anton, C leveland 40 2 S AR TA/GC R TA/OS UC A Irvine 40 1 UC I
AF C B (T IG G E R ) C A T housand P alms 40 3 S unLineMassachusetts AF C B MA B oston 40 1 MB TAB attery Dominant AF C B C A T housand P alms 40 1 S unLine
C A T housand P alms 40 5 S unLineOH C anton 40 8 S AR TAC A Oakland 40 10 AC Trans itC A Orange C ounty 40 10 OC TA
S unLine F C E B & H2 generation C A T housand P alms 40 5 S unLineAdvanced G eneration F C E B C A Oakland 60 1 AC Trans it
C olor coded by T echnology: F uel cell dominant electric
B attery dominant fuel cell electric
American F uel C ell B us (AF C B )
AF C B (Low-No)
F C E B C ommercialization C onsortium
Demons tration S tate C ity#
B us es
Proposed Future Work
Jun 2017
‒ Current data collection includes a total of 21 FCEBs at six transit sites‒ New sites would add 41 buses and four new designs
Any proposed future work is subject to change based on funding levels

20
Technology Transfer Activities
• Project provides non-biased evaluation of technology developed by industry
• Project documents performance results and lessons learned to aid market in understanding needs for full commercializationo Manufacturerso Transit agencieso Policymaking organizationso Funding organizations
• No technology (hardware/software) is developed through this project

21
Summary: Progress Toward Targets
Fleet Min
Fleet Max
Fleet Average
2016 Target
Ultimate Target Target Met
Bus lifetime (years) 1.3 6.4 4.7 12 12
Bus lifetime (miles) 32,485 167,352 118,989 500,000 500,000
Powerplant lifetimea
(hours) 3,589 23,423 13,801 18,000 25,000 2016
Bus availability (%) 44 93 76 85 90
Roadcall frequencyb (bus) -- -- 4,710 3,500 4,000 Ultimate
Roadcall frequency (fuelcell system) -- -- 20,705 15,000 20,000 Ultimate
Maintenance cost ($/mi) 0.46 1.61 1.03 0.75 0.40
Fuel economy (mpdge)c 5.66 7.22 6.51 8 8
Range (miles)d 215 274 247 300 300
a Fuel cell hours accumulated to date from newest FCPP to oldest FCPP. Does not indicate end of life.b MBRC: average for current designs.c Miles per diesel gallon equivalentd Estimated range based on fuel economy and 95% tank capacity. Transit agencies report lower real-world range.
Summary of FCEB Data through December 2016