TECHNOLOGY SPILLOVERS AND TRANSFER THROUGH MNCS: A …
491
TECHNOLOGY SPILLOVERS AND TRANSFER THROUGH MNCS: A CASE STUDY ON TURKISH AUTOMOTIVE INDUSTRY A THESIS SUBMITTED TO THE GRADUATE SCHOOL OF SOCIAL SCIENCES OF MIDDLE EAST TECHNICAL UNIVERSITY BY ALPER SÖNMEZ IN PARTIAL FULFILLMENT OF THE REQUIREMENTS FOR THE DEGREE OF DOCTOR OF PHILOSOPHY IN THE DEPARTMENT OF ECONOMICS SEPTEMBER 2012
Transcript of TECHNOLOGY SPILLOVERS AND TRANSFER THROUGH MNCS: A …

TECHNOLOGY SPILLOVERS AND TRANSFER THROUGH MNCS:
A CASE STUDY ON TURKISH AUTOMOTIVE INDUSTRY
A THESIS SUBMITTED TO
THE GRADUATE SCHOOL OF SOCIAL SCIENCES
OF
MIDDLE EAST TECHNICAL UNIVERSITY
BY
ALPER SÖNMEZ
IN PARTIAL FULFILLMENT OF THE REQUIREMENTS
FOR
THE DEGREE OF DOCTOR OF PHILOSOPHY
IN
THE DEPARTMENT OF ECONOMICS
SEPTEMBER 2012

Approval of the Graduate School of Social Sciences
______________________
Prof. Dr. Meliha Altunışık
Director
I certify that this thesis satisfies all the requirements as a thesis for the degree of
Doctor of Philosophy.
______________________
Prof. Dr. Erdal Özmen
Head of Department
This is to certify that we have read this thesis and that in our opinion it is fully
adequate, in scope and quality, as a thesis for the degree of Doctor of Philosophy.
______________________
Assoc. Prof. Dr. M. Teoman Pamukçu
Supervisor
Examining Committee Members
Prof. Dr. Ahmet Haşim Köse (AU, ECON) _____________________
Assoc. Prof. Dr. M. Teoman Pamukçu (METU, STPS) _____________________
Prof. Dr. Erol Taymaz (METU, ECON) _____________________
Prof. Dr. Erkan Erdil (METU, ECON) _____________________
Assist. Prof. Dr. İ. Semih Akçomak (METU, STPS) _____________________

iii
I hereby declare that all information in this document has been obtained and
presented in accordance with academic rules and ethical conduct. I also declare
that, as required by these rules and conduct, I have fully cited and referenced
all material and results that are not original to this work.
Name, Last name: Alper SÖNMEZ
Signature:

iv
ABSTRACT
TECHNOLOGY SPILLOVERS AND TRANSFER THROUGH MNCS:
A CASE STUDY ON TURKISH AUTOMOTIVE INDUSTRY
SÖNMEZ, Alper
Ph.D., Department of Economics
Supervisor: Assoc. Prof. Dr. M. Teoman Pamukçu
September 2012, 467 Pages
This thesis aims to provide evidence on whether FDI occurring in the Turkish economy has
any effect on domestic firms, especially whether and to what extent it leads to KTTs towards
domestic firms by paying attention to the role of MNCs. In order to do so, we firstly conduct
a series of econometric analyses to analyze the impact of FDI-related technology spillovers
on domestic firms’ productivity level in the Turkish manufacturing industry. Estimation
results produced positive evidence on horizontal and backward technology spillovers, while
negative evidence on forward spillovers. Secondly, we conduct a comprehensive empirical
research based on case study at firm-level in the Turkish automotive industry. By this study,
generally we aim to investigate the existence, nature and intensity of transfers, and what – if
any – kind of KTTs occur at both inter- and intra-firm level in the industry. For this aim, we
used two different research methods to collect detailed data and information from both
suppliers and AMMs at the firm-level. Our main findings in terms of KTTs at inter-firm
level can be summarized in this way: foreign suppliers are seen to dominate local suppliers
in terms of many indicators and absorptive capacity level; it seems that KTTs occur from
AMMs to their domestic suppliers mainly on providing documentations, assistances for
logistic management, quality control, know-how, R&D, co-design and co-development

v
activities, designing and cost reduction; compared to foreign suppliers, local suppliers tend
to be involved in those production-product-training related KTTs which are less knowledge-
intensive and of a lesser quality. Also, performing R&D activities is found as the most
important firm level factor which influences positively KTTs, strategic collaboration
activities with the AMMs, and many technology activities of the suppliers. The technology
policies on attracting more FDI flows should be reviewed under the findings and insights of
this study since it is a necessary condition – although not sufficient - to have an efficient
absorptive capacity level and/or skilled human capital stock in order to get benefit from these
flows.
Keywords: Turkish Automotive Industry, Technology Spillover, Technology Transfer,
Multinational Corporations, Foreign Direct Investment

vi
ÖZ
ÇUŞLAR YOLUYLA TEKNOLOJİ YAYILIMLARI VE TRANSFERİ:
TÜRKİYE OTOMOTİV SANAYİ ÜZERİNE BİR SAHA ÇALIŞMASI
SÖNMEZ, Alper
Doktora, İktisat Bölümü
Tez Yöneticisi: Doç. Dr. M. Teoman Pamukçu
Eylül 2012, 467 Sayfa
Bu tez ÇUŞ'ların rolüne dikkat çekerek Türk ekonomisinde Doğrudan Yabancı Yatırımların
(DYY) yurtiçi firmalara bir etkisinin olup olmadığı, özellikle yurtiçi firmalara yönelik bilgi
ve teknoloji transferlerine yol açıp açmadığı ve ne ölçüde bir etkisi olduğu üzerine bulgular
sunmayı amaçlamaktadır. Bunu yapabilmek için, ilk olarak, DYY ilişkili teknoloji
yayılımlarının Türk imalat sanayinde faaliyet gösteren firmaların verimlilik seviyeleri
üzerine bir etkisi olup olmadığını analiz etmek amacı ile bir dizi ekonometrik analiz
gerçekleştiriyoruz. Ekonometrik tahmin sonuçları yatay ve geriye doğru teknoloji yayılımları
açısından olumlu bulgular üretirken, ileri teknoloji yayılımları açısından negatif bulgular
üretmiştir. İkinci olarak, Türk otomotiv sanayiinde firma düzeyinde saha çalışmasına dayalı
kapsamlı deneysel bir araştırma gerçekleştiriyoruz. Bu çalışma ile genel olarak, sektörde
firma içi ve firmalar arası bilgi ve teknoloji transferlerinin varlığını, yoğunluğunu, doğasını
ve –eğer varsa- ne tür transferlerin gerçekleştiğini sorgulamayı amaçlıyoruz. Bu amaç için,
hem tedarikçiler hem de ana sanayi firmalarından firma düzeyinde ayrıntılı veri ve bilgi
toplamak için iki farklı araştırma yöntemi kullanılmıştır. Firmalar arası bilgi ve teknoloji
transferleri açısından başlıca bulgular şu şekilde özetlenebilir. Yabancı tedarikçiler birçok
gösterge ve massetme kapasitesi açısından yerel tedarikçilerden daha üstün gözükmektedir.

vii
Otomotiv ana sanayi firmalarından yurtiçi doğrudan tedarikçilerine transferler genel olarak
dokümantasyon sağlama, lojistik yönetimi, kalite kontrol, know-how, Ar-Ge, eş-tasarım/eş-
geliştirme faaliyetleri ve maliyet azaltma gibi konu başlıkları altında çeşitli yardımlar
şeklinde olmaktadır. Yabancı tedarikçiler ile karşılaştırıldığında, yerel tedarikçiler daha az
bilgi yoğun veya daha az kaliteli üretim-ürün-eğitim ile ilgili transferlere dâhil olmak
eğilimindedirler. Ayrıca, Ar-Ge faaliyetlerinde bulunmak, tedarikçilerin ana sanayi firmaları
ile stratejik işbirliği faaliyetlerini, çeşitli teknoloji faaliyetlerini ve transferleri pozitif yönde
etkileyen firma düzeyinde en önemli faktör olarak bulunmuştur. Daha fazla DYY çekmeye
yönelik teknoloji politikaları bu tezin bulguları ve çözümlemeleri ışığında gözden
geçirilmelidir, çünkü bu yatırımlardan fayda sağlamak için etkin bir massetme kapasitesi
ve/veya yetenekli beşeri sermaye stokuna sahip olmak –yeterli olmasa da- gerekli bir
koşuldur.
Anahtar Sözcükler: Türkiye Otomotiv Sanayi, Teknoloji Yayılımları, Teknoloji Transferi,
Çok Uluslu Şirketler, Doğrudan Yabancı Yatırım

viii
To My Parents
Gülser & İsmail Sönmez
&
My lovely wife Özlem

ix
ACKNOWLEDGEMENTS
First of all, I would like to express my greatest gratitude to my supervisor, Assoc. Prof. Dr.
M. Teoman Pamukçu, for his encouragement, untiring support, comments, critiques,
guidance and resolute belief in me throughout this dissertation. Also, I would like to thank
him for the valuable time that he has devoted to all the periods of my study, over four years.
I am equally grateful to my advisory committee members, Prof. Dr. Erol Taymaz and Prof.
Dr. Ahmet Haşim Köse, for their constant supports, suggestions, insightful comments,
encouragements, and constructive remarks. I should express my heartfelt gratitude to Prof.
Dr. Erkan Erdil for his encouragement, providing extremely valuable comments,
constructive critiques and helpful insights for the improvement of my study. I would also
like to thank Assist. Prof. Dr. İ. Semih Akçomak for serving on my examining committee
and offering many helpful insights.
I am also very grateful to Assoc. Prof. Dr. Garrick Blalock who accepted me as a “visiting
fellow” to the Applied Economics and Management (AEM) Department at Cornell
University, the USA for one year to conduct a part of my doctoral research. During that year,
Dr. Blalock helped me so much to improve my work, and I am indebted to him for all he has
done for me. Moreover, I would like to thank Prof. Dr. Loren Tauer, the director of AEM
Department of Cornell University, for inviting me to Cornell and providing me opportunities
to work on my dissertation when I was in Cornell.
My particular gratitude goes to the participating firms without whose cooperation this
dissertation would not have been possible. At various stages of this study, I benefited greatly
from the interviews with many top-executives of companies in Turkey automotive main
industry. My sincerest gratitude goes out to the people of these companies who devoted their
valuable time to express and to share their ideas and experiences with me. In this context, I
am especially grateful to Tülay Altay Akarsoy, Volkan Bayraktar, Ernur Mutlu, Dr. Orhan
Alankuş, Hakan Özenç, Ali Göktan, Ahmet Altekin, Turgut Cankılıç, Ali Çavuşoğlu, Dr.
Senem Erdem Albaş, Ferit Tam, and Önder Molva for helping me out arranging and
conducting interviews. I would also like to extend my thanks to all the managers of suppliers

x
who took time off from their busy schedules to participate and to answer my questionnaire
for providing valuable information for the study.
I would like to express my acknowledgements to the institutions provided financial supports
for this study, namely, TUBITAK (109K587) for the project entitled “Analysis of Knowledge
and Technology Transfer by Multinational Companies to Local Suppliers in the Turkish
Automotive Industry”, and Faculty Development Program (OYP) of METU (BAP-08-11-
DPT-2002K120510).
I want to express my thanks to Prof. Dr. Ercan Tezer (General Secretary of OSD), Celal
Kaya (President of TAYSAD) and Özlem Gülşen (General Secretary of TAYSAD) for their
professional supports especially for providing me letter of supports in order to conduct
interviews and questionnaire survey with their member firms.
I would like to express my sincere thanks to Prof. Dr. S. Nazli Wasti Pamuksuz from METU
for her valuable advices, comments, encouragement, and for sharing me her research
experiences in the field of automotive industry that contributed so much to the dissertation. I
would like to thank also to Prof. Dr. Michel Cincera for giving me the opportunity to discuss
and improve my study; to Dr. Kriengkrai Techakanont for sharing me his knowledge in the
field of technology transfer; and to Müfit Akyos for his valuable comments and helpful
insights for the improvement of my questionnaire form.
I would like to express my thanks to my colleagues of Department of Economics at METU
for their friendship during my stay as a graduate student and a research assistant.
I wish to thank my mother, Gülser, my dad, İsmail, and my brother, Ahmet, for their support,
patience and standing behind me in this difficult endeavor. Last but not the least, I want to
express my deepest gratitude to my wife Özlem who have shared the burden of my study
most, for her everlasting support and patience, encouragement and understanding, and for
sharing my difficult times.

xi
TABLE OF CONTENTS
PLAGIARISM ..................................................................................................................................... iii
ABSTRACT ......................................................................................................................................... iv
ÖZ ......................................................................................................................................................... vi
DEDICATION ................................................................................................................................... viii
ACKNOWLEDGEMENTS ................................................................................................................ ix
TABLE OF CONTENTS .................................................................................................................... xi
LIST OF TABLES .......................................................................................................................... xviii
LIST OF FIGURES ......................................................................................................................... xxii
LIST OF ABBREVIATIONS ......................................................................................................... xxiii
CHAPTER
1. INTRODUCTION ...................................................................................................................... 1
1.1. Motivation ............................................................................................................................ 1
1.2. Objectives of the Study and Main Research Questions ....................................................... 4
1.3. Data and Methodology ......................................................................................................... 6
1.4. Original Contribution ........................................................................................................... 7
1.5. Organization of the Study .................................................................................................... 8
2. TECHNOLOGY SPILLOVERS AND TRANSFER THROUGH MNCs:
THEORETICAL FRAMEWORK .............................................................................................. 10
2.1. Definitions of Basic Concepts ............................................................................................ 11
2.1.1. Types of Technology .............................................................................................. 11
2.1.2. Externalities, Spillovers and Linkages.................................................................... 11
2.1.3. Horizontal and Vertical Technology Spillovers ..................................................... 12
2.1.4. Technology Transfer and Diffusion ........................................................................ 13
2.1.5. Knowledge and Technology Transfer..................................................................... 14
2.1.6. Technological Capability and Learning .................................................................. 16
2.1.7. Global Production Networks and Global Supply Chain ......................................... 17
2.2. Technology Diffusion through FDI and Growth ................................................................ 18
2.3. MNCs and Technology Spillovers ..................................................................................... 21
2.4. Channels of Technology Spillovers ................................................................................... 27
2.5. Determinants of Technology Spillovers ............................................................................. 33
2.5.1. Absorptive Capacity and Technological Gap ......................................................... 33

xii
2.5.2. MNC Characteristics .............................................................................................. 36
2.5.3. Host Country Characteristics .................................................................................. 39
2.5.4. Firm Characteristics ................................................................................................ 42
2.6. Empirical Studies on Technology Spillovers and Transfer ................................................ 44
2.6.1. General Information ............................................................................................... 44
2.6.2. Evidence on Developed and Developing Countries ............................................... 47
2.6.3. Evidence on Turkey ................................................................................................ 49
2.6.4. Reasons for Failure of Realizing the Technology Spillovers or for their Negative
Effect on Firm Performance ............................................................................................. 56
2.7. Theoretical Framework for Case-Study Research.............................................................. 57
2.7.1. General Information ............................................................................................... 57
2.7.2. Technology Transfers at Intra- and Inter-Firm Level ............................................. 58
2.7.3. Forms of Technology Transfer at Intra- and Inter-Firm Level ............................... 60
2.7.4. Theoretical Framework........................................................................................... 62
2.7.5. Studies conducted for Foreign Countries................................................................ 63
2.7.6. Studies on Turkish Automotive Industry ................................................................ 65
3. TECHNOLOGY SPILLOVERS FROM FDI IN TURKISH MANUFACTURING
INDUSTRY: ECONOMETRIC ANALYSIS ............................................................................ 67
3.1. Introduction ........................................................................................................................ 67
3.2. Descriptive Analysis (1): A Picture of FDI Inflows in Turkey .......................................... 68
3.3. Data Sources and Description ............................................................................................ 71
3.3.1. Descriptive Analysis (2): A Picture of Foreign Firms in the Dataset by Sectors .... 73
3.4. Empirical Model ................................................................................................................ 78
3.4.1. Real Gross Output and Production Side Variables ................................................. 79
3.4.2. Control Variables .................................................................................................... 80
3.4.3. Proxies for Horizontal and Vertical Technology Spillovers ................................... 82
3.4.3.1. Horizontal Technology Spillover ................................................................ 82
3.4.3.2. Backward Technology Spillover ................................................................. 83
3.4.3.3. Forward Technology Spillover.................................................................... 83
3.4.3.4. Descriptive Analysis (3): Horizontal and Vertical Technology Spillovers
by Sectors ................................................................................................................. 85
3.5. Econometric Concerns ....................................................................................................... 88
3.6. Estimation Results ............................................................................................................. 90
3.6.1. Horizontal Technology Spillovers .......................................................................... 90
3.6.1.1. Horizontal Technology Spillovers with respect to
Different Foreign Shares .......................................................................................... 91
3.6.2. Vertical Technology Spillovers .............................................................................. 94
3.6.2.1. Vertical Technology Spillovers with respect to Full-versus-Partial Foreign
Ownership ................................................................................................................ 96

xiii
3.6.2.2. Vertical Technology Spillovers with respect to Export-versus-Domestic
Oriented Firms ......................................................................................................... 98
3.6.3. Technology Gap and Technology Spillovers .......................................................... 99
3.7. Robustness Checks ........................................................................................................... 102
3.8. Summary .......................................................................................................................... 104
4. A CASE STUDY ON TURKISH AUTOMOTIVE INDUSTRY:
RESEARCH METHODOLOGY AND DESIGN .................................................................... 121
4.1. Introduction ...................................................................................................................... 122
4.2. Automotive Industry in Turkey ........................................................................................ 123
4.2.1. Basic Economic Indicators ................................................................................... 124
4.2.1.1. World Automotive Production .................................................................. 124
4.2.1.2. Production and Place of Turkey in World ................................................. 126
4.2.1.3. AMMs in Turkey ...................................................................................... 126
4.2.1.4. Automotive Supply Industry in Turkey..................................................... 128
4.2.1.5. Total Employment of the Automotive Industry in Turkey ........................ 129
4.2.1.6. Foreign Trade of the Automotive Industry in Turkey ............................... 129
4.3. Scope of the Case Study................................................................................................... 131
4.4. The Purpose of the Study and Research Questions .......................................................... 133
4.5. Research Methodology .................................................................................................... 135
4.6. Data Collection Methods ................................................................................................. 136
4.6.1. Quantitative Data: Face-to-Face Questionnaire Survey with Suppliers ............... 136
4.6.1.1. Questionnaire Design ................................................................................ 137
4.6.1.2. Sample Selection ....................................................................................... 139
4.6.1.3. Pilot Testing .............................................................................................. 142
4.6.1.4. Designing the Final Questionnaire Form .................................................. 144
4.6.1.5. Application of Fieldwork .......................................................................... 145
4.6.1.6. Survey Results ........................................................................................... 149
4.6.1.7. The Main Reasons for Unrealized Sample ................................................ 151
4.6.1.8. Data Input and Missing Values ................................................................. 153
4.6.1.9. Representativeness .................................................................................... 154
4.6.1.10. Validity and Reliability Tests .................................................................. 157
4.6.1.11. Critique of the Questionnaire Survey Method......................................... 159
4.6.2. Qualitative Data: Face-to Face Interviews with AMMs ....................................... 160
4.6.2.1. Semi-structured Interview Method ............................................................ 160
4.6.2.2. Administration of Interview Process ......................................................... 163
4.6.2.3. Results of Interview Process ..................................................................... 164
4.6.2.4. Representativeness and Reliability of the Sample ..................................... 166
4.7. Descriptions of Some Concepts and Differences for the Firms
constructed and used in the Analyses ...................................................................................... 168

xiv
4.7.1. Automotive Industry, Automotive Main and Supply Industry ............................. 169
4.7.2. The Relationships of Automotive Main and Supply Industry .............................. 170
4.7.3. Domestic and Overseas Automotive Main Manufacturers (DAMM & OAMM) . 171
4.7.4. Domestic and Overseas Supply Industry .............................................................. 172
4.7.5. Domestic and Overseas Suppliers (DS and OS) ................................................... 172
4.7.6. Local and Foreign Firms (LF and FF) .................................................................. 173
4.7.7. Parent Company (PC) ........................................................................................... 174
4.7.8. Direct Supplier Firms (DSF) ................................................................................ 174
5. SURVEY FINDINGS (1): DESCRIPTIVE ANALYSIS ..................................................... 175
5.1. General Characteristics of the Surveyed Firms ................................................................ 176
5.1.1. Capital Structure ................................................................................................... 176
5.1.1.1. Origin of Foreign Capital .......................................................................... 177
5.1.2. Establishment Date (Age) ..................................................................................... 178
5.1.3. Number of Employees .......................................................................................... 178
5.1.4. Total Sales ............................................................................................................ 178
5.1.5. Market Orientation ............................................................................................... 180
5.1.6. Technology Level of the Firms............................................................................. 180
5.2. KTTs at Inter-Firm Level ................................................................................................. 182
5.2.1. Transfers related to Production Process................................................................ 182
5.2.2. Transfers related to Product .................................................................................. 185
5.2.3. Financial Transfers ............................................................................................... 188
5.2.4. Transfers through Training ................................................................................... 189
5.2.4.1. Types of Training ...................................................................................... 189
5.2.4.2. Modes of Training ..................................................................................... 190
5.2.5. The reasons for not making sufficient amount of KTT ........................................ 193
5.3. Market and Competition Structure ................................................................................... 194
5.3.1. Major Markets ...................................................................................................... 194
5.3.2. Main Competitors ................................................................................................. 195
5.3.3. Business Environment related to Competition and Relationship .......................... 196
5.4. Technology Capabilities related to Production and Design ............................................. 198
5.4.1. Production Capabilities......................................................................................... 198
5.4.2. International Quality Certificates ......................................................................... 199
5.4.3. Technology Agreements ....................................................................................... 201
5.4.4. Sources of Technologies acquired by Firms ......................................................... 202
5.4.5. Design Capabilities ............................................................................................... 204
5.4.6. Co-Design Activities related to Products and Partners ......................................... 205
5.4.6.1. Partners ..................................................................................................... 205
5.5. Supply Chain .................................................................................................................... 208
5.5.1. Management Structure and MNCs among Clients ............................................... 208

xv
5.5.2. Main Customers of Surveyed Firms ..................................................................... 209
5.5.3. Primary Sources of the Inputs .............................................................................. 211
5.5.4. Purchasing Strategies of Customers (being the sole supplier of the customer) .... 214
5.6. Cooperation ...................................................................................................................... 215
5.6.1. The Motivations for Cooperation Activities with other Firms (Why do suppliers
cooperate with other firms?) ........................................................................................... 215
5.6.2. Improvements in Production Capability as a result of Assistances received from
Customers ....................................................................................................................... 218
5.7. Direct Suppliers of the AMMs in Turkey ........................................................................ 220
5.7.1. How the Firms became a Direct Supplier ............................................................. 220
5.7.2. Cooperation Activities with AMMs ..................................................................... 221
5.7.3. Benefits of being a Direct Supplier ...................................................................... 224
5.8. R&D, Innovation Activities and Absorptive Capacity ..................................................... 226
5.8.1. R&D Activities (technological input) ................................................................... 226
5.8.1.1. Pioneers of R&D Activities ...................................................................... 228
5.8.2. Innovation Activities ............................................................................................ 229
5.8.2.1. Cooperation Level with Partners in Innovation Activities ........................ 230
5.8.2.2. Technological Product and Process Innovation Activities
(technological output) ............................................................................................ 232
5.8.2.3. Patents (technological output) ................................................................... 234
5.8.3. Absorptive Capacity ............................................................................................. 235
5.9. Performance and Future Projections ................................................................................ 238
5.9.1. Performance Increases: Improvements related to Production Capability ............. 238
5.9.2. Reasons for Performance Increases (improvements) in Production Capability .... 239
5.9.3. Future Projections related to Acquisition of New Technologies .......................... 242
5.10. Summary ........................................................................................................................ 243
6. SURVEY FINDINGS (2): ECONOMETRIC ANALYSIS ................................................. 248
6.1. Model ............................................................................................................................... 249
6.2. Explanatory Variables ...................................................................................................... 250
6.3. Factor Analysis (FA) ........................................................................................................ 257
6.4. Logistic Regression Analysis ........................................................................................... 258
6.4.1. Determinants of being a Direct Supplier of AMMs in Turkey ............................. 259
6.4.2. Determinants of Possessing a R&D Department .................................................. 260
6.4.3. Determinants of Innovation Activities .................................................................. 262
6.4.3.1. Determinants of Product Innovation Activities ......................................... 263
6.4.4. Determinants of Technology Agreements ............................................................ 264
6.4.5. Determinants of the Sources of Technologies acquired and/or used .................... 265
6.4.6. Determinants of the Co- Design Activities related to Products ............................ 268

xvi
6.4.6.1. Determinants of the Partners in Cooperation for the Co-Design Activities
related to Products .................................................................................................. 269
6.5. Ordinal Logistic Regression Analysis .............................................................................. 271
6.5.1. Determinants of the KTTs at Inter-Firm Level ..................................................... 272
6.5.1.1. Determinants of the KTTs related to the Production Process ................... 272
6.5.1.2. Determinants of the KTTs related to the Product ...................................... 277
6.5.1.3. Determinants of Training Activities provided by Customers .................... 278
6.5.1.4. Determinants of the Financial Transfers provided by Customers ............. 279
6.5.2. Determinants of the Technology Capabilities of the Suppliers ............................ 281
6.5.3. Determinants of the Inter-Firm Cooperation Activities (Why do suppliers cooperate
with other firms?) ........................................................................................................... 283
6.5.4. Determinants of the Improvements in Production Capability as a result of
Assistances received from Customers ............................................................................ 285
6.5.5. Determinants of the Benefits of being a Direct Supplier ...................................... 286
6.5.6. Determinants of the Cooperation Level with Partners in Innovation Activities ... 289
6.5.7. Determinants of the Performance Increases (improvements) related to Production
Capability ....................................................................................................................... 291
6.6. Summary .......................................................................................................................... 294
7. FINDINGS AND ANALYSIS OF THE INTERVIEWS WITH AMMs ............................ 315
7.1. Introduction ...................................................................................................................... 316
7.2. General Characteristics of the AMMs Interviewed .......................................................... 319
7.2.1. General Information ............................................................................................. 319
7.2.2. Production Structure ............................................................................................. 321
7.2.3. R&D, Innovation and Technology Activities ....................................................... 325
7.2.4. Domestic Input Rate and Major Sources of Inputs ............................................... 327
7.2.5. Patent Policy ......................................................................................................... 328
7.3. KTTs through Partners in Strategic Collaborations ......................................................... 328
7.4. Channels of KTTs from MNCs to AMMs operating in Turkey at Intra-Firm Level ...... 331
7.4.1. Via Collaboration Activities with MNCs ............................................................. 331
7.4.2. Via Production, Management and Quality Systems of MNCs ............................. 332
7.4.3. Via Auditing, Assessment and Awarding Activities of MNCs ............................ 334
7.4.4. Via Training and Education Activities of MNCs ................................................. 335
7.5. General Characteristics of the Direct Suppliers of the AMMs Interviewed ..................... 337
7.5.1. General Information about the Direct Suppliers ................................................... 337
7.5.2. Number and Origin of the Direct Suppliers of AMMs ......................................... 338
7.5.3. Capabilities of the Direct Suppliers ...................................................................... 340
7.5.4. Expectations from the Direct Suppliers ................................................................ 342
7.5.5. Supplier Selection Criteria of the AMMs ............................................................. 342
7.5.6. Location of the Direct Suppliers ........................................................................... 346

xvii
7.6. Channels of KTTs from AMMs to Direct Suppliers in Turkey at Inter-Firm Level ........ 347
7.6.1. Role of the being the Sole Supplier of AMMs ..................................................... 347
7.6.2. Via Joint Projects .................................................................................................. 348
7.6.3. Via Co-Design Activities ...................................................................................... 348
7.6.4. Via Auditing, Assessment and Awarding Activities ............................................ 350
7.6.5. Via Global Certificates of MNCs ......................................................................... 353
7.6.6. Via Traininig and Education Activities ................................................................ 354
7.6.7. Via Other Assistances by AMMs ......................................................................... 356
7.7. SWOT Analysis ............................................................................................................... 358
7.7.1. Strengths (Internal-Positive) ................................................................................. 359
7.7.2. Weaknesses (Internal-Negative) ........................................................................... 360
7.7.3. Opportunities (External-Positive) ......................................................................... 363
7.7.4. Threats (External-Negative) ................................................................................. 364
7.8. Summary .......................................................................................................................... 365
8. CONCLUSION ....................................................................................................................... 370
8.1. Introduction ...................................................................................................................... 370
8.2. Main Findings .................................................................................................................. 372
8.3. Policy Implications and Recommendations ..................................................................... 380
8.4. Implications for Further Research .................................................................................... 389
REFERENCES ................................................................................................................................. 390
APPENDICES
A: Data Cleaning and Transformation Procedures .................................................................... 420
B: Construction of Composite Price Indexes............................................................................. 422
C: Cover Letter for Face-to-Face Questionnaire Survey with Suppliers
in Turkey Automotive Industry ............................................................................................ 423
D: Cover Letter for Interview Request from AMMs in Turkey ................................................ 425
E: Letter of Support from OSD (in Turkish) ............................................................................ 427
F: Letter of Support from TAYSAD (in Turkish) .................................................................... 428
G: Fieldwork Instructions for the Questionnaire Survey........................................................... 429
H: Structure of the Questionnaire Form .................................................................................... 431
I: Questionnaire Form Applied to Suppliers in Turkey Automotive Supply Industry ............ 433
J: List of Domestic Automotive Main Manufacturers (DAMM) ............................................. 448
K: Semi-Structured Interview Guide used in Interviews with AMMs in Turkey ..................... 449
L: Summary Statistics for Key Indicators in the Survey according to Firm Descriptions ........ 451
M: Turkish Summary ................................................................................................................. 452
N: Curriculum Vitae .................................................................................................................. 465

xviii
LIST OF TABLES
TABLES
Table 2.1: Empirical Studies on Spillovers in Developing Countries .............................................. 48
Table 2.2: Empirical Studies on Spillovers for Turkey .................................................................... 55
Table 2.3: Forms of Technology Transfer at Intra- and Inter-Firm Level ........................................ 61
Table 3.1: Classification of Manufacturing Industries at 2-Digit NACE ....................................... 106
Table 3.2: Distribution of Firms with Foreign Capital, by 2-digit NACE and Year ...................... 107
Table 3.3: Shares of the Foreign Firms in the Sector Level Variables,
by 2-digit NACE and Year ........................................................................................... 108
Table 3.4: Additional Summary Statistics for Spillover Variables by Year (%) ............................ 109
Table 3.5: Values of Horizontal and Vertical Spillovers, by 2-digit NACE and Year, (%) ........... 109
Table 3.6: Summary Statistics for Explanatory Variables ............................................................. 110
Table 3.7: Horizontal Technology Spillover Test Results.............................................................. 111
Table 3.8: Horizontal Technology Spillover Test Results with Different Foreign Shares
by 2-digit NACE .......................................................................................................... 112
Table 3.9: Horizontal Technology Spillover Test Results with Different Foreign Shares
by 3-digit NACE .......................................................................................................... 113
Table 3.10: Horizontal Technology Spillover Test Results with Different Foreign Shares
by 4-digit NACE .......................................................................................................... 114
Table 3.11: Horizontal and Vertical Technology Spillover Test Results ........................................ 115
Table 3.12: Vertical Technology Spillovers Associated with Fully- versus
Partially-Owned Foreign Firms ................................................................................... 116
Table 3.13: Vertical Technology Spillovers Associated with Export- versus
Domestic-Market Oriented .......................................................................................... 117
Table 3.14: Technology Gap and Technology Spillovers (TGAPV.1
) ............................................. 118
Table 3.15: Technology Gap and Technology Spillovers (TGAPV.2
) ............................................. 119
Table 3.16: Technology Gap and Technology Spillovers (TGAPV.3
) ............................................. 120
Table 4.1: Share of AMMs in Total Capital, Capacity, Production and Sales
by Foreign Share (%) .................................................................................................. 127
Table 4.2: Distribution of Sample by Union, Province and Corporation Type ............................. 148
Table 4.3: Distribution of Survey Results by Union and Province ............................................... 150
Table 4.4: Distribution of Survey Results by Provinces and Unions ............................................ 151
Table 4.5: Distribution of Unrealized Sample by Union and Province ......................................... 152
Table 4.6: The Reasons for Unrealized Sample ............................................................................ 152
Table 4.7: Basic Indicators for Surveyed Firms and Automotive Supply Industry ....................... 154

xix
Table 4.8: Internal Reliability of the Scales .................................................................................. 158
Table 4.9: The list of the Interviewed AMMs ............................................................................... 164
Table 4.10: Share of Interviewed AMMs in Sector Level Variables (%) ....................................... 167
Table 5.1: Distribution of Surveyed Firms by Foreign Capital and Ownership Structure ............ 176
Table 5.2: Distribution of Foreign Firms by Origin and Ownership ............................................. 177
Table 5.3: General Characteristics of Surveyed Firms .................................................................. 179
Table 5.4: Distribution of Surveyed Firms according to the Technological Complexity of
Products Manufactured (%) .......................................................................................... 181
Table 5.5: Types of KTTs related to the Production Process ........................................................ 184
Table 5.6: Types of KTTs related to the Product .......................................................................... 186
Table 5.7: Types of Financial Transfers (assistances) ................................................................... 186
Table 5.8: Types and Modes of Training Activities provided by Customers ................................ 192
Table 5.9: The reasons for not making sufficient amount of KTT ................................................ 193
Table 5.10: Distribution of Surveyed Firms by Market Orientation (%) ........................................ 195
Table 5.11: Distribution of Surveyed Firms by Location of Their Main Competitors (%) ............. 196
Table 5.12: Perception of Competition and Relationship ................................................................ 196
Table 5.13: Distribution of Surveyed Firms by Production Capabilities ........................................ 198
Table 5.14: Distribution of Surveyed Firms by Quality Certifications ........................................... 200
Table 5.15: Distribution of Surveyed Firms by Technology Agreements Performed ..................... 201
Table 5.16: Distribution of Surveyed Firms by Technology Sources ............................................. 203
Table 5.17: Distribution of Surveyed Firms by Design Capability ................................................. 204
Table 5.18: Co-Design Activities related to Products and Partners of Surveyed Firms .................. 206
Table 5.19: Distribution of Surveyed Firms by Management Structure and MNCs among Clients ... 208
Table 5.20: Distribution of Surveyed Firms by Main Customers (%)............................................. 209
Table 5.21: Main Customers of Surveyed Firms by Origin of Foreign Capital .............................. 211
Table 5.22: Main Customers of Surveyed Firms by Foreign Ownership ........................................ 211
Table 5.23: Distribution of the Surveyed Firms according to Primary Sources of Inputs
by Importance Degree (%) ........................................................................................... 212
Table 5.24: Some Indicators of Surveyed Firms in terms of their Customers ................................. 214
Table 5.25: Why do Surveyed Firms Cooperate with Other Firms? ............................................... 216
Table 5.26: Improvements in Various Fields as a result of Assistances received from Customers
(For the last 3-years).................................................................................................... 219
Table 5.27: How the Firms became a Direct Supplier .................................................................... 221
Table 5.28: Cooperation Activities of the Direct Suppliers with the AMMs .................................. 222
Table 5.29: Benefits of being a Direct Supplier of the AMM in Turkey ........................................ 224
Table 5.30: Distribution of Surveyed Firms by R&D Activities ..................................................... 227
Table 5.31: Pioneers of R&D Activities.......................................................................................... 229
Table 5.32: Distribution of Surveyed Firms by Innovation Activities and Cooperation Level with
Partners ........................................................................................................................ 230
Table 5.33: Types of Innovation Activities (in the last three-years) ............................................... 233

xx
Table 5.34: Number of Patents Owned and Applied ....................................................................... 234
Table 5.35: Alternative Indicators of Absorptive Capacity ............................................................. 236
Table 5.36: Distribution of Surveyed Firms by Improvements in Production Capability
(in last 3-years) ............................................................................................................ 238
Table 5.37: Reasons for Performance Increases (improvements) in Production Capability ........... 240
Table 5.38: Future Projections related to Acquisition of New Technologies .................................. 243
Table 6.1: Summary of the Relationships between Supplier Characteristics and
Explanatory Variables .................................................................................................. 256
Table 6.2: Factor Analysis of Technology Agreements (TA) ....................................................... 264
Table 6.3: Factor Analysis for the Sources of Technologies ......................................................... 266
Table 6.4: Factor Analysis of Partners in Cooperation for the Co-Product Design Activities ...... 270
Table 6.5: Factor Analysis of KTTs related to the Production Process ......................................... 273
Table 6.6: Factor Analysis of KTTs related to the Product ........................................................... 277
Table 6.7: Factor Analysis of KTTs through Training .................................................................. 278
Table 6.8: Factor Analysis of Financial Transfers ........................................................................ 280
Table 6.9: Factor Analysis of the Technology Capabilities .......................................................... 282
Table 6.10: Factor Analysis of Inter-Firm Cooperation Activities .................................................. 284
Table 6.11: Factor Analysis of the Improvements in Production Capability .................................. 285
Table 6.12: Factor Analysis of the Benefits pertaining to being a Direct Supplier ......................... 287
Table 6.13: Factor Analysis of the Cooperation level with Partners in Innovation Activities ........ 289
Table 6.14: Factor Analysis of the Performance Increases (improvements) ................................... 292
Table 6.15: Description of the Explanatory Variables used in the Analyses .................................. 300
Table 6.16: Descriptive Statistics for Explanatory Variables .......................................................... 301
Table 6.17: Correlation Matrix ........................................................................................................ 302
Table 6.18: Determinants of being a Direct Supplier / Determinants of Possessing a separated R&D
Department: Logistic Regression Analysis .................................................................. 303
Table 6.19: Determinants of the Innovation / Determinants of the Product Innovation Activities:
Logistic Regression Analysis ...................................................................................... 304
Table 6.20: Determinants of the Technology Agreements (TA) / Determinants of the Sources:
Logistic Regression Analysis ...................................................................................... 305
Table 6.21: Determinants of the Co-Product Design Activities / Determinants of the Partners in
Cooperation for these Activities: Logistic Regression Analysis ................................. 306
Table 6.22: Determinants of the KTTs related to Production Process:
Ordinal Logistic Regression Analysis ......................................................................... 307
Table 6.23: Determinants of the KTTs related to Product, Training and Financial Transfers:
Ordinal Logistic Regression Analysis .......................................................................... 308
Table 6.24: Determinants of the Technology Capabilities related to Production, Design and R&D:
Ordinal Logistic Regression Analysis .......................................................................... 309

xxi
Table 6.25: Determinants of the Cooperation Activities with other Firms / Determinants of the
Improvements in Production Capability / Determinants of the Benefits of being a Direct
Supplier: Ordinal Logistic Regression Analysis.......................................................... 310
Table 6.26: Determinants of the Cooperation Level with Partners in Innovation Activities:
Ordinal Logistic Regression Analysis ......................................................................... 311
Table 6.27: Determinants of the Performance Increases (improvements) related to Production
Capability: Ordinal Logistic Regression Analysis ...................................................... 312
Table 6.28: Recapitulative Table of Logistic Regression Analyses ................................................ 313
Table 6.29: Recapitulative Table of Ordinal Logistic Regression Analyses ................................... 314
Table 7.1: Number of the Direct Suppliers of AMMs by Foreign Share of AMMs and
Origin of the Direct Suppliers ...................................................................................... 339

xxii
LIST OF FIGURES
FIGURES
Figure 2.1: Intra- and Inter-Firm Technology Transfers ................................................................. 59
Figure 3.1: Evolution of the FDI/GDP ratio in Turkey: 1999-2010 (%) ......................................... 70
Figure 3.2: Net FDI Inflows in Turkey (BoP Current US$) ............................................................ 70
Figure 3.3: Ranking of Turkey in the World in terms of Net FDI Inflows ..................................... 70
Figure 3.4: Share of the Foreign Firms in the Sector Level Variables by 2-digit NACE and Year 76
Figure 3.5: Change in the Share of Foreign Firms in Sector Level Variables
by 2–digit NACE, 2003-2006....................................................................................... 77
Figure 3.6: Share of the Foreign Firms in the Sector-Level Four Variables by 2-digit NACE,
Average Values for 2003-2006 .................................................................................... 78
Figure 3.7: Horizontal and Vertical Spillovers by 2-digit NACE, Average Values for 2003-2006 86
Figure 3.8: Change in the Horizontal Spillover Variable (2003-2006) ........................................... 87
Figure 3.9: Change in the Backward Spillover Variable (2003-2006) ............................................ 87
Figure 3.10: Change in te Forward Spillover Variable (2003-2006) ................................................. 87
Figure 4.1: World Motor Vehicle Production by Type and Year 1999-2010 (million ea.) ........... 125
Figure 4.2: Share of Countries in World Motor Vehicle Production by year 1999-2010 .............. 125
Figure 4.3: World Motor Vehicle Production by Country in 2010 ............................................... 125
Figure 4.4: Share of Turkey’s Motor Vehicle Production in World Production ........................... 130
Figure 4.5: Motor Vehicle Production of Turkey by year 1999-2010 (x1000) ............................. 130
Figure 4.6: Export and Import Values of Turkey’s Motor Vehicle Sector by year 1999-2010
(Million USA dollars) ................................................................................................ 130
Figure 4.7: Share of Turkey’s Motor Vehicles Sector in Total Foreign Trade by year 1999-2010 130
Figure 4.8: Evolution of Sector Shares in Total Exports of Turkey: 1996-2010 ........................... 131
Figure 4.9: Flowchart for the Questionnaire Survey ..................................................................... 137
Figure 4.10: Distribution of Sample by Provinces .......................................................................... 148
Figure 4.11: Distribution of Survey Results by Provinces .............................................................. 151
Figure 4.12: Share of Interviewed AMMs in Total Sales and Production in 2010
by Different Foreign Shares ....................................................................................... 167
Figure 4.13: The Automobile Production Circle ............................................................................. 168
Figure 4.14: Illustration of the Basic Structure of the Automotive Industry and
Concepts used in the Analyses ................................................................................... 169
Figure 5.1: Primary Input Sources of the Suppliers based on Main Customers ............................ 213
Figure 7.1: Share of the All and Interviewed AMMs in Total Production and Sales in 2010
by Different Foreign Ownership ................................................................................ 318

xxiii
LIST OF ABBREVIATIONS
AF All Firms
AMM Automotive Main Manufacturer
BTSO Bursa Chamber of Commerce and Industry (Bursa Ticaret ve Sanayi Odası)
CPI Composite Price Indexes
DAMM Domestic Automotive Main Manufacturers
DO Domestic Oriented
DOSAB Demirtaş Organized Industrial Zone (Demirtaş Organize Sanayi Bölgesi)
DS Domestic Suppliers
DSF Direct Supplier Firms
EO Export Oriented
EU European Union
FA Factor Analysis
FDI Foreign Direct Investment
FF Foreign Firms
FO Fully Owned
FS Foreign Share
GOSB Gebze Organized Industrial Zone (Gebze Organize Sanayi Bölgesi)
GMM Generalized Method of Moments
GPN Global Production Networks
ICOC Istanbul Chamber of Commerce (İstanbul Ticaret Odası)
ICI Istanbul Chamber of Industry (İstanbul Sanayi Odası)
IMF International Monetary Fund
IO Input Output
ISSS Industry and Service Statistics Survey
KOSGEB Small and Medium Enterprises Development Organization (Küçük ve Orta Ölçekli
İşletmeleri Geliştirme ve Destekleme İdaresi Başkanlığı)
KTT Knowledge and Technology Transfer
LEVPET Levinsohn and Petrin
LF Local Firms
METU Middle East Technical University
MITI Ministry of Industry and Trade
MNC Multinational Corporations
NACE Nomenclature Generale des Activites Economiques dans I`Union Europeenne
(General Name for Economic Activities in the European Union)

xxiv
NOSAB Nilüfer Organized Industrial Zone (Nilüfer Organize Sanayi Bölgesi)
OAMM Overseas Automotive Main Manufacturers
OECD Organization for Economic Cooperation and Development
OEM Original Equipment Manufacturer
OICA International Organization of Motor Vehicle Manufacturers
OP Olley and Pakes
OS Overseas Suppliers
OSD Automotive Manufacturers Association (Otomotiv Sanayi Derneği)
PC Parent Company
PCA Principal Components Analysis
PO Partial Owned
PPI Producer Price Index
R&D Research and Development
SANTEZ Industry Thesis Program (Sanayi Tezleri Programı)
SBSS Structural Business Statistics Survey
SPO State Planning Organization
TA Technology Agreements
TAYSAD Association of Automotive Parts and Components Manufacturers (Taşıt Araçları
Yan Sanayicileri Derneği)
TEYDEB Technology and Innovation Support Programmes (Teknoloji ve Yenilik Destek
Programları Başkanlığı)
TFP Total Factor Productivity
TGAP Technology Gap
TIM Turkish Exporters Assembly (Türkiye İhracatçılar Meclisi)
TPS Toyota Production System
TTGV Technology Development Foundation of Turkey (Türkiye Teknoloji Geliştirme
Vakfı)
TUBITAK Scientific and Technology Research Council of Turkey (Türkiye Bilimsel ve
Teknolojik Araştırma Kurumu)
TurkStat Turkish Statistical Institute
UIB Bursa Uludağ Exporter Union
UNCTAD United Nations Conference on Trade and Development
UNCTC United Nations Centre on Transnational Corporations
US United States of America
WCM World Class Manufacturing
WTO World Trade Organization
YASED International Investors Association of Turkey (Uluslararası Yatırımcılar Derneği)

1
CHAPTER 1
INTRODUCTION
“Scientia est potentia”
Francis Bacon
1.1. Motivation
Francis Bacon was the first person to express nearly 400 years ago that three major
technological inventions – printing in literature, gunpowder in warfare and compass in
navigation– had changed the world fundamentally (Bernard and Jones, 1996). The role
played by the technological developments, innovations and policies concerning science and
technology in the development process of the countries has gradually gained importance
with the phenomena of globalization in the 21st Century. Although globalization and
technological innovations are interrelated processes, it would not be wrong to argue that
globalization in general is affected more by science, technological discoveries and
innovations. It could be said that globalization has a certain effect on especially creating and
spillover of the technology. The role of the technological developments and innovations in
the productivity of the companies, rise of production and international competitive power on
the one hand, and in the employment rates of the countries, their industrialization and their
economic growth on the other hand has gradually increased in the 21st Century and become
a decisive factor.

2
Growth theories which have been developed since the time when Adam Smith suggest that
the growth had been realized upon increases in the productivity as a result of division of
labor and specialization, underline the fact that R&D, technology, innovation, productivity
and international trade is the key to economic growth. Technological innovation occupies a
highly important position in the modern growth theories. The importance of the concept of
innovation in the development of capitalism has been pointed out by Joseph A. Schumpeter
in his book “The Theory of Economic Development” (Schumpeter, 1934). The emphasis he
put on the role and contribution of the individual enterprise that is in the interaction with the
“creative destruction” process is important in explaining the economic growth of the
countries that are considered developed today (Ghosh, 2002). According to Krugman
“innovation is a process and new products are created within this process; technology
transfer is also a process where old products are transformed into new ones” (Krugman,
1979). Solow (1956) suggested that the productivity of the labor would increase with the
introduction of external technological innovation, which, in turn, led to economic growth in
the long term. Since 80s, studies concerning internal modeling of the spillover of knowledge
and technological innovations, arising from the physical and human capital investments
(Romer, 1986) or from the differences in the quality and variety of the inputs (Romer, 1990)
have been conducted (Lee, 2008), and works have been made on the policies to best ensure
the generation, transfer and use of the technology (Grosse, 1996).
With globalization, FDI flows realized worldwide by the MNCs have increased significantly.
In this new environment, the developing countries think that they could attain the available
knowledge and technology stock by attracting FDI to their countries, that the technologies
would be transferred to the local firms via the foreign firms operating in the country, by this
way their technological development level have increased in the long run and they will reach
and catch up with the developed countries in the end. For all these reasons, many developing
countries have started to implement a series of incentive policies in the last decade in order
to attract more FDI flows.
Especially today, the most important factor determining the existence, international
competitive power and status of the companies is their skills to develop new, competitive
technologies – products - and production processes and to follow closely the new
technologies and attain and adapt them. To this end, the companies today are increasingly
conducting innovation and R&D activities, and establishing collaborations with various
partners such as MNCs, customers, suppliers and universities, to obtain those technological
innovations. Although innovation and technology are major elements in economic growth

3
and development process of the countries, the interaction between the economic
development strategy and science and technology policies plays also a significant role in the
long-term economic growth. Many institutions (governments, various private organizations,
associations, companies, universities, etc.) come together in many developed and developing
countries and devise national science and technology policies in strategic sense, in order to
support such activities, and the interrelationships and activities of such institutions play an
important role in determining the effectiveness of those policies.
It is a common view that the direction and development of the world trade is determined by
the MNCs' R&D activities, inventions and KTTs they perform. However, there is a thin line
between the discovering of the significance of the international spillover of technology and
accepting that today’s technology is of global nature. According to Keller (2004), technology
today is actually not global and there is an imbalance between the technology bases of the
developed and developing countries. In our era during which we witness global
technological advancements, the developing countries remain dependent on the developed
countries to attain modern technologies. Most of the technological innovations,
advancements and inventions in the world are made, controlled and owned by a few MNCs
or developed countries. The technologies developed by the companies located in those
countries, on the other hand, could be used for industrialization of the developing countries.
Many countries that are considered developed now made use of the advanced technologies
existing during the time when they were in the development phase (Tanaka et. al. 2007).
In sum, today, technology creates a competition advantage for the companies. It plays a
major role in the success of the domestic and foreign companies, across a wide area ranging
from creating of new products to the knowledge and experience owned. Similarly, it is an
important base for economic growth and development, so governments work on policies to
optimize technology creation and use (Grosse 1996). It has been discovered that the effective
combination of economic development strategy and science & technology policy serves as
the key driver of long-term economic growth.
This thesis was motivated by the importance of knowledge and technology for economic
development especially in developing countries. It is obvious that science and technology
policies, innovation and transfer of technology have also a main importance in the process of
Turkey’s development, industrialization and in the race of being an industrialized country in
a developing country context. For gaining competition power in international arena and be
able to race with foreign firms, Turkish industry has to do enormous enterprises about

4
technological innovations. It is not seem possible that these enterprises are formed by the
own sources of Turkish industry without governmental supports, especially in the arena
where the big international companies have been supported by their countries’ technological
and industrial policies. In the lights of these, first of all Turkey has to determine the obstacles
in front of the technological development and produce alternative policies for abolish them
in the cooperation of public, universities and industry. Secondly Turkey has to make a long
term national program for technological development, innovation and transfer of technology
from developed countries in order to increase knowledge accumulation at home. In this
context, there is a need for the research on whether MNCs transfer technology to domestic
firms in Turkey or not. In addition, it is significant and important to analyze the company,
industry and country characteristics of this technology transfer.
1.2. Objectives of the Study and Main Research Questions
In the scope of the aforementioned discussions, this thesis aims to provide evidence on
whether FDI occurring in the Turkish economy has any effect on domestic firms, especially
whether and to what extent it leads to technology spillovers towards domestic firms by
ascribing special emphasis to the role of MNCs. In this context, the main objective of the
study is to investigate technology spillovers and transfer through MNCs in Turkey; and to
find out how the domestic firms have benefited directly or indirectly from these. Also, the
policies on attracting more FDI with advanced technology will be questioned. For these
aims, we want to find answers for the following questions guiding this study:
What are the effects of MNCs in Turkish manufacturing industry?
What – if any – kind of KTTs occurs at both inter- and intra-firm levels through
MNCs, and what is the nature and intensity of these transfers?
What are the main channels of KTTs from MNCs?
What are the determinant factors that affect KTTs from MNCs?
What is the role of domestic firm characteristics in this process?
Are there any differences between local and foreign firms in Turkey?
Does technological capability (R&D, innovation, production, absorptive capacity,
design etc.) of the domestic firms play a role in this process?
Do these KTTs have any effect on the performance level of the domestic firms?
What policies should Turkish government implement to attract more FDI with
advanced technology from developed countries?

5
In order to answer above questions, we firstly conduct a series of econometric analyses to
analyze the impact of FDI-related technology spillovers on domestic firms’ productivity
level through horizontal (intra-industry) and vertical linkages (inter-industry) with foreign
firms in the Turkish manufacturing industry by using firm-level panel data over 2003-2006.
We also investigate the role of technology gap in this process. Secondly, by going one step
further, we conduct a very detailed and comprehensive empirical research based on case
study at firm-level in the Turkish automotive industry in order to investigate the above
questions addressed. By this case study, we investigate KTTs at both inter- and intra-firm
level.
In terms of KTTs at inter firm level, we examine and look at our objectives from two
perspectives of these interactions: First one is from the suppliers’ perspective as a recipient
of these transfers by questionnaire survey method; and second one is from the customers’
perspective as a source of these transfers by in-depth interview method. Whether the FDI
flows in the Turkish automotive industry have resulted in the KKTs to the local supplier
firms; and if it has resulted in so, the intensity and relative importance of these transfers, as
well as analyzing their effect on the performance of the firms are the main questions that
inspire the case study and that constitute the study’s point of origin. Therefore, the main goal
of the case study is to investigate and review what kind of KTTs are provided via the MNCs
to the supplier firms operating in the Turkish automotive industry, in terms of products
(design, joint design, joint activities, various documentation, etc.), production processes
(various know-how, documentation, R&D, logistics, etc.), training and financial transfers. In
addition, the study also aims at revealing those characteristics of the suppliers that influence
the occurrence of such transfers; the place of the suppliers in the supply chain of MNCs; the
effect of the aforementioned transfers on the performance of the suppliers; collaboration
activities of the suppliers with their customers; their absorptive capacity, production, design
and technological capabilities; the volume and nature of innovation and R&D activities of
these suppliers will be explored as well.
In terms of KTTs at intra-firm level, by using the qualitative data obtained from the
interviews conducted with the AMMs in Turkey, we analyze the channels of the KTTs
realized by the MNCs to the AMMs, the characteristics of the AMMs; their cooperation
activities with the MNCs as their foreign partners (global AMMs); R&D and technology-
related activities.

6
Similar case studies based on questionnaire surveys/interviews are conducted regularly in
certain countries with a well-developed automotive sector, where intensive collaborations
among public, universities and the industry are witnessed, such as the USA, European
Union, South Korea, Thailand, Malaysia and China, and vital findings are obtained for the
sector to enable it to see what lies ahead. However, such studies have just begun to be
conducted in our country! Therefore, another object of the case study research is to fill the
gap to some extent; to contribute in the ability of the sector to adapt to the sustainable
competition environment; to prevent the leading role acquired in the sector from being lost to
other rival countries; and to provide a contribution to guide in the country’s becoming a
regional production and excellence base in near future. For these purposes, we develop some
policy implications and recommendations for the Turkish automotive industry.
This study was supported by a research grant from TUBITAK, and Faculty Development
Program of METU (OYP), and the professional supports of OSD and TAYSAD (two main
representatives of Turkish automotive industry) have played an instrumental role in the
success of the study.
1.3. Data and Methodology
In this thesis, we use a variety of data from different sources. In Chapter 3, the main data
used for the analysis of FDI-related technology spillovers in Turkish manufacturing industry
is obtained from TurkStat- 2003-2006 Annual Industry and Service Statistics Survey
Database. In order to construct the proxies for horizontal and vertical spillovers, we also use
2002-input-output table obtained from TurkStat, and various price indexes from different
sources to deflate the variables.
Detailed information and data are required at the firm level for the case study investigating
the KTTs at both inter- and intra-firm level. For that reason, we use two different research
methodologies (quantitative and qualitative) to collect primary data at firm level. Firstly,
face-to-face questionnaire survey, based on original and designated questionnaire form, is
conducted with the top level managers of the 166 suppliers in the Turkish automotive supply
industry in order to collect quantitative data. The validity and reliability of the scales in the
questionnaire is assessed by using internal consistency measured with Cronbach’s alpha (α).
The construct validity of the scales will also be tested by using Factor Analysis in Chapter 6
in order to determine correlated items in the scales and to reduce the number of related items.

7
Secondly, in-depth semi-structured interview method is used to collect qualitative data from
top-executives of the 11 AMMs operating in Turkey. The findings obtained from the
interviews are used for the quantitative results on surveyed suppliers in a complementary
way, and for the analysis of KTTs at intra-firm level.
1.4. Original Contribution
Our econometric investigation for the technology spillovers that analysis both horizontal and
vertical spillovers and the role of technology gap can be regarded as original contribution.
There are very few studies about this issue for Turkey and all of them focus on the pre-2001
period where FDI flows were rather low, and to the best of our knowledge no study,
however, has yet been conducted for the post-2001 period for the Turkish manufacturing
industry. We believe that this study would contribute to the literature and to provide some
valuable input for the discussions on technology spillovers in Turkey.
This thesis also contributes to the literature as one of the first empirical evaluations to
understand the types, main channels and determinants of KTTs at both inter- and intra-firm
level in the Turkish automotive industry, conducted with two separate field research.
Because of great methodological difficulties in addition to lack of data, a few studies
investigating the KTTs empirically in some countries including Malaysia, Thailand, South
Korea etc. appear in the literature. According to our knowledge, the interviews with the main
companies and survey conducted amongst suppliers in the industry, and the econometric
analysis conducted here using quantitative data collected via the questionnaire survey is the
first study of its kind for the industry. Here, our questionnaire form designed to collect firm-
level data from the suppliers can also be regarded as original contribution.
When it is considered that this kind of case-studies include very detailed, comprehensive and
confidential information on the firms, and requires a larger period of time, research team and
budget, and need very effort to be successful, it might be claimed that the study was carried
out with a notable success. To the best of our knowledge, in this context, this is the first
empirical research carried out successfully in national and international level on FDI-related
KTTs at both inter- and intra-firm level. We believe that the findings of the study would give
important clues to the Turkish automotive main and supply industry firms in maintaining
their current competitive status and determining the strategies they could follow in the
world’s markets that have become increasingly competitive. At the same time, we believe

8
that the study would contribute to the other studies conducted in this field in academic
literature and that it would constitute an important reference for the public institutions as
well as various private organizations and associations in Turkey (such as SPO, KOSGEB,
TUBITAK, OSD, TAYSAD) in order to create science and technology policies in supporting
the activities of the Turkish automotive industry’s innovation, R&D and technology transfer.
In sum, this study is an original contribution and is unique in terms of exploring the KTTs at
both inter- (between suppliers and their customers) and intra-firm level (between AMMs and
their foreign partner MNCs) through two separate field research carried out with suppliers
and main companies in Turkish automotive industry. We believe that our study could
contribute to more extensive, similar studies conducted for Turkey and other countries yet to
follow, setting an example for them.
1.5. Organization of the Study
This thesis is organized as follows: Chapter 2 provides a review of the theoretical and
empirical literature on FDI with an emphasis on the technology spillovers, MNCs, growth
and transfers especially by MNCs after a brief introduction on the definitions of the basic
concepts used in the study. This chapter, then, investigates the channels and determinants of
spillovers, and presents the evidences of empirical studies on the spillovers and transfer for
host economies and Turkey. Lastly, it summarizes the analytical framework for the case-
study research in Turkish automotive industry.
The Chapter 3 analyzes the quantitatively the FDI-related horizontal and vertical (backward
and forward) technology spillovers and the effects of technology gap in the Turkish
manufacturing industry. This chapter also presents a descriptive analysis of FDI flows to
Turkey and a picture of foreign firms in the dataset. In this chapter, the empirical estimation
is discussed in detail in terms of data sources, model, methodology and results.
The research methodology and design, adopted for the case study in order to collect primary
quantitative and qualitative data at firm-level in Turkish automotive industry, is discussed in
detail in Chapter 4. This chapter presents a detailed discussion of methodologies utilized for
data collection and data analysis in the research. Quantitative data are collected from the
suppliers in the automotive supply industry through face-to-face questionnaire survey, and
qualitative data from top-executives of the AMMs in Turkey through in-depth interviews. It

9
also presents some statistical information on Turkish automotive industry. Moreover, the
scope, the purpose and main research questions of the study are mentioned. Lastly, some
concepts and differences for the firms constructed and used in the analyses will be
descripted.
The Chapter 5 is devoted to a broad descriptive analysis of the primary quantitative data
collected through face-to-face questionnaire survey from the 165 suppliers in Turkish
automotive industry.
In the Chapter 6, econometric analyses are conducted by using quantitative survey data in an
attempt to identify the possible determinant factors impacting on different types of KTTs
realized by customers to suppliers through backward linkages at inter-firm level, and on
various characteristics and on activities of the suppliers. In this chapter, econometric model,
estimation methods, explanatory variables and factor analysis will be discussed in detail
together with the econometric findings.
The Chapter 7 will analyze the qualitative data obtained from the in-depth interviews
conducted with 11 AMMs operating in Turkey. It presents characteristics of the AMMs
interviewed, their cooperation activities with MNCs (global AMMs) as their foreign
partners; R&D and technology-related activities; and channels of the KTTs realized by
MNCs to the AMMs at intra-firm level. Moreover, the relations of the AMMs with their
direct suppliers operating in Turkey, the channels and determinants of the KTT at inter-firm
level realized by the AMMs to their direct suppliers through backward linkages will be
analyzed. Lastly, the results of SWOT analysis of the industry in terms of KTTs will be
presented. The findings obtained from these analyzes will be used also for the quantitative
survey results attained in Chapters 5 and 6 in a complementary way.
The last chapter summarizes what has been done in this thesis, the main findings and
conclusions derived from them. Moreover, it is devoted to policy implications and
recommendations for Turkish automotive industry, and guidelines for further researches.

10
CHAPTER 2
TECHNOLOGY SPILLOVERS AND TRANSFER
THROUGH MNCs:
THEORETICAL FRAMEWORK
In this chapter, we review mainly the theoretical and empirical literature on FDI with an
emphasis on the technology spillovers and transfer realized especially by MNCs. In the first
section, definitions of the basic concepts used in the study will be explained briefly. Then,
technology diffusion through FDI, growth and the relationship between spillovers and MNCs
will be presented in the second and third sections. Fourth section is devoted to the analysis of
the main spillover channels through which they transit identified in the literature. We then
examine the determinants of the spillovers in the section five. Theoretical and empirical
evidence on the technology spillovers and their effects on the host economies will be
presented in the sixth section. Review of the related literature on spillovers for Turkey
constitutes an important part of the study. The last section summarizes the theoretical
framework for the case-study research on both intra- and inter-firm technology transfers in
Turkish automotive industry, and reviews the literature on similar case-studies conducted on
both foreign countries and Turkey.

11
2.1. Definitions of Basic Concepts
2.1.1. Types of Technology
We define “technology” here is broadly including product and production process
technology as well as knowledge and skills including management, marketing, organization,
know-how, international markets, and global production networks. Some authors need to
narrow the scope of the technology and grouped it into two types, namely, “hardware” and
“software” technology (Techakanont, 2002; 12-13). The authors call the technology
embodied in physical goods as “hardware technology” (such as machinery, equipment,
blueprints and technical specifications), while they call the knowledge embodied in
workers’ experience and skills in terms of product and production process as “software
technology” (Teece, 1977; Cantwell, 1993; Kim, 2001). Moreover, some authors
differentiate these technologies as “explicit” and “tacit knowledge”. “Explicit knowledge” is
defined as a codified and transmittable knowledge; sources (MNCs) provide this kind of
knowledge to recipients (such as their affiliates or suppliers in host countries) through
machinery, blueprints, technical manuals, training handouts, technical specifications and
quality control methods (Kim, 2001). On the other hand, “tacit knowledge”, introduced
firstly by Polanyi (1962), is defined as knowledge related to “practical knowledge”, and it
cannot be easily expressed, solved, transferred or declared openly to another person. It is also
described as “know-how” or “embodied knowledge” and the sentence “we can know more
than we can tell” best describes the notion of “tacit knowledge”. In sum, our “technology”
term includes both explicit and tacit knowledge here. However, in our case study, we prefer
to use “knowledge transfer” term for the transfer of “tacit knowledge” and “technology”
term for the transfer of “explicit knowledge” in order to examine in detail both types of the
technology.
2.1.2. Externalities, Spillovers and Linkages
It is here necessary to point out the distinctions between “externalities”, “spillovers” and
“linkages” by using the definitions of Narula and Driffield (2012). “Externalities”, which are
simple the positive or negative benefits from presence of MNCs or from their actions, affect
local firms or host economies at no cost. On the other hand, “spillovers” are the indirect
effects of MNCs on host countries. In other words, they are externalities that accrue from

12
one firm (source) to another (recipient) through formal or informal relationships between the
firms. Recipient firms must put a learning effort to benefit from such spillovers. Also, all
“spillovers” are externalities, however all externalities are not spillovers. By the way,
“linkages” imply transactional associations between source and recipient firms, and these
may not give rise to spillovers. In other words, all spillovers are linkages but all linkages are
not spillovers. “Spillover” term has been generally used in “aggregate empirical analyses”
depends on “production function analysis”; while “linkages” term is preferred in studies
depend on individual firms or MNCs as the unit of analysis (see Narula and Driffield, 2012:
2-3 for further details).
2.1.3. Horizontal and Vertical Technology Spillovers
In the last few decades, FDI flows have played an important role in achieving economic
growth and development especially for developing economies. FDI may affect host country
economies directly through increased employment, foreign exchange earnings, capital
accumulation and also usage of more advanced equipment and technology. However,
especially in the last decade, it has been considered that the most important channel through
which FDI affects developing economies is situated on the technology front/side. Indeed the
most important contribution of FDI to a developing economy consists in fostering
technology transfer by bringing and diffusing new technologies, knowledge, and skills to the
recipient country. Transfer of these intangible technology-related elements unintentionally
from foreign to local firms is called “technology spillovers” based on FDI. In other words,
spillovers are referred to the indirect effects of FDI on domestic firms in host country. These
can be horizontal (intra-industry) or vertical spillovers (inter-industry) depending whether
they are disseminated within or outside the sector of activity of foreign firms that trigger
these spillovers. In other words, horizontal spillovers occur from foreign firms to local firms
operating in the same industry, while vertical spillovers occur from foreign firms to local
firms operating in vertically linkage (backward or forward) industries (see section 2.4 for
details). Vertical spillovers emerge upon interaction of the MNCs with the suppliers and
customers in the local market. The MNCs could provide technical assistance to the suppliers
in the local market in order to ensure the quality of the intermediate inputs they use, could
train the employees, and to help in purchasing the raw materials. We could assume that there
exist the backward spillovers here. The forward spillovers, on the other hand, emerge upon
the local manufacturers’ purchasing the intermediate or capital goods from the foreign
suppliers. Since the products of the foreign suppliers are technologically more superior than
13
the products of the local suppliers, the MNCs could provide the local firms with knowledge
to ensure that these inputs are used efficiently by the manufacturers. The econometric studies
analyzing the both horizontal and vertical spillovers together are very limited, and they have
generally produced significant positive vertical spillovers than horizontal ones (Pamukçu and
Taymaz, 2009: 9).
2.1.4. Technology Transfer and Diffusion
What it is meant by the “technology transfer” here is the process through which technology
is intentionally transmitted between countries or firms. In other words, we define here
“technology transfer” as the direct type of the spillovers that occurs voluntary from
technology source (such as MNCs or foreign firms) to recipient (such as local firms, affiliate
of MNC or suppliers in host country) by the way of embodied in the equipment supplied
(such as machinery, manual, equipment etc.) or disembodied in the forms of software,
patents, knowledge, or know-how and skills provided by training and education activities
(see Radosevic (1999) and Bennett (2002) for further details on technology and technology
transfer). In this process, there are three factors that play important role in technology
transfer; the source, the recipient and “the technology itself” (Techakanont, 2002). On the
other hand, “technology diffusion” is generally used to refer the unintentional transfer of
technology that may occur as a result of reverse engineering or imitation (Rath, 1994). This
type of technology transfer is also called “technology spillover” as a positive externality
effect in the literature and occurs through horizontal and vertical linkages by means of
various channels (see section 2.4).
Technology transfers through FDI have been through MNCs in a host country. MNCs
operating in host country have transferred its some technology in terms of product,
production process and organization to recipient firms which are generally affiliates or the
local suppliers of MNCs. However, today attracting MNC is not the only way to obtain
technology transfers; they can also be transferred through many ways. First one is
contractual agreements between source and recipient for the transfer of specific technologies
that include licensing and management arrangements, technological assistance agreements,
purchase of machinery-equipment-assembly apparatus, recruitment of the foreign specialists,
patents, brands etc. Second one is the transfer of skills, experiences, and knowledge through
technical assistances, know-how agreements, labor mobility, turnkey projects, service and
engineering agreements (UNCTC, 1994).

14
2.1.5. Knowledge and Technology Transfer
“Knowledge transfer” and “technology transfer” concepts are used interchangeably in
innovation and development literature. Nevertheless, while “technology transfer” involves
rather the transfer of capital goods such as machinery and equipment, “knowledge transfer”
includes mostly transfer of tacit knowledge such as know-how, management and technical
skills. Knowledge transfers seem to be more important than technology transfers since they
ensure learning of new information, technical and organizational skills (UNCTAD, 1997).
Knowledge transfers are realized from one company to the other; and its potential benefits
depend on the long-term relationships between the companies concerned, the level of the
knowledge transferred, and the abilities of the recipient company. The technology transfer
process – this term will hereinafter be used in a way to cover the transfer of both the explicit
and tacit knowledge as well – involves acquisition of the technology, absorption of the
technology, adaptation of it to local conditions, improving and developing it and spillover of
it to other companies (Tung, 1994; Eden et. al. 1996). Business literature generally refers to
three kinds of technology transfer (Grosse, 1996): Product (knowledge used in order to
produce any product), process (knowledge used in order to organize the inputs and operate
the machinery in production), and transfer of the management skills (knowledge used in
order to operate an enterprise). Techakanont and Terdudomtham (2004) clearly explain the
concept of technology transfer and its process as in the following:
“The term of technology transfer in its broadest sense defines the process of
creation of the knowledge, skills and experience by the recipient of the
technology, as a direct result of the contributions of the sources from where the
technology is provided. It could be said that the transferring process mentioned
above has been completed upon understanding the transferred technology well,
absorbing it, adapting it to the local conditions, ensuring its maintenance,
sustainment and effective use, by the recipient of the technology. In other words,
the technology transfer process is the process of internalization or learning of
the transferred technology-related knowledge and experience by the recipient.
Effective realization of the transfer process depends on two important factors:
(i) that the technology recipient has a certain basis of knowledge and (ii) the
intensity of the effort to develop the existing knowledge base. These factors are
vitally important in that they determine how fast and how successfully the
transferred technologies are internalized by the local suppliers. Especially
intensity of effort to develop the existing knowledge base is more important than

15
the existing knowledge base itself because the former creates that latter, but not
vice versa” (Techakanont and Terdudomtham, 2004:156-160).
The “efforts” emphasized in the last sentence of the citation above ensure that the recipient
company understand, implement, absorb and evaluate the new technologies better and
develop the accumulation of knowledge about them. Therefore, such efforts ensure success
of the technology transfer. A successful technology transfer would result in advancement of
the technological capabilities of the recipient company personnel playing a role in the
transfer, and also in increased productivity of the company's production process.
Recipients can assimilate the transferred “explicit knowledge” into products and production
processes by using their “tacit knowledge” (see Nelson and Winter, 1982; Lall, 1996; Kim,
1997; and McKelvey, 1998) on discussions about tacit knowledge). Therefore, it is necessary
for the recipients to have a certain level of “knowledge base” (tacit knowledge) to benefit
from the transferred technology. In other words, acquiring of the external knowledge by
recipients requires experienced and skilled human capital. Developing of the “knowledge
base” can be possible through specific ways such as extensive personnel contacts and regular
interactions with the personnel of foreign firms in host or home countries, mutual trust
between source and recipient firms, social networks, regular visits to the plants of foreign
customers in order to get on-the-job or off-the-job training activities provided by foreign
firms, various assistances of foreign firms in terms of quality control systems, production
process, and distribution etc. For instance, in certain periods, MNCs invite production and
management personnel of the local firms in host countries to visit their plants or
headquarters in home or host country. They show them how production systems, lines and
organization work by off-the-job training activities, and give them various on-the-job
training activities. Moreover, MNCs can send their own expert personnel to assist their local
suppliers in the solving of technical problems encountered in the application of MNC’s
production and engineering systems (a kind of tacit knowledge). Consequently, “knowledge
base” is based on experience and know-how of the personnel, and this can be accumulated
and acquired in many years through training, research and practice (see Ernst and Kim, 2002,
for further details). The creation of new technology and knowledge could also be possible by
interaction of the explicit and tacit knowledge categories (Wagner and Sternberg, 1985;
Collins, 2001; Goffin and Koners, 2011).

16
2.1.6. Technological Capability and Learning
According to Kim (2001), “technological capability” can be defined as an ability to make
efficient use of technological knowledge, that is gained from either internal or external
sources, in manufacturing, production process, R&D, design, engineering, and innovation. It
is expected that firms with higher technological capability can acquire, assimilate, and
improve new technologies more easily, and also they can deal with creating new
technologies. On the other hand, “technological learning” is the process through which
technological capability is improved, accumulated and formed. In developed countries, such
ability may be developed through “learning by research”, while imitative “learning by
doing” process in developing countries (Kim, 2001: 297).
Technological capability of a firm can be considered as a continuous process to acquire,
absorb, internalize the knowledge, and adapt into local conditions, and improve it. It is also
determined by accumulation of skills and knowledge, and by efforts to improve this. The
firm-level capabilities can be categorized as “investment capabilities” (the skills needed to
obtain new technologies for design, construct, equipment), “process and production
capabilities” (quality control, operation, monitoring, controlling, maintenance, research,
design and innovation) and “linkage capabilities” (the skills needed to transmit knowledge
and technology to, and receive them from various institutions, suppliers, customers) (Lall,
1992: 168). The complexity degree of these capabilities can be assessed by activities from
which these capabilities arise such as “experience”, “search” and “research”. Firms must
improve and develop their capabilities in order to internalize and get a new technology into
production. The factors that impact on the activities of the firms in developing their
capabilities can be summarized as the size of the firm; ability of the technologies from the
market; dealing with R&D and innovation activities; cooperation activities with other firms
in terms of design, product development etc.; high-quality human capital; “organizational
and managerial skills”; “ability to change structures to absorb new technologies”;
“access to appropriate embodied technology”; and “access to external technical
knowledge” from various sources (such as foreign firms, MNCs, local firms, special
engineering and consultancy firms, laboratories, testing facilities, standards institutions etc.)
(see Lall, 1992 for further details).

17
2.1.7. Global Production Networks and Global Supply Chain
Globalization process has changed all world economies. One of the most important effects of
the globalization has occurred in the choices of firms in their location choices for production,
R&D and innovation activities through “international foreign trade”, development of
“information and communication technologies”, and liberalization policies of the host
countries to attract high FDI flows. In this process, the global production networks (GPN)
have emerged due to increase in international competition and the need for “the organization
of international trade”. These networks have established by MNCs to integrate their supply,
technology, R&D, innovation, and production centers into GPN. They consist of hierarchical
layers such as “independent suppliers and subcontractors”, “joint-ventures”, “affiliates”,
“R&D alliances”, “subsidiaries” etc. and they have increased the knowledge diffusion among
such actors. Local suppliers in host countries of MNCs (lower-tier suppliers) are at the
bottom of these hierarchical layers. “Global supply chain” is also established in the result of
these networks in order to provide integrated intermediate goods and services to the firms in
GPN (based on Narula and Dunning, 2000).
These networks have played an important role in fostering the advanced technology and
knowledge diffusion across countries and firms in two ways.
By increasing their capabilities; MNCs demand high quality products at low cost and
to be delivered on-time. In other words, their working standards and technical
specifications are very high and these may put high pressures on local suppliers
especially in developing countries. If local suppliers could not fulfill the demands of
MNCs in terms of quality, cost, delivery, durability, and reliability, they may face the
threat of expulsion from the production and supply networks of MNCs. Therefore
MNCs are endeavoring to upgrade their suppliers’ capabilities and productivity.
MNCs as the final-user of the products supplied have provided new opportunities for
local firms to benefit from the knowledge diffusion. MNCs may provide financial and
technical assistances, knowledge and technology transfers (including engineering,
product and production process, on-the-job and/or off-the-job training activities,
various blueprints, machinery, raw material, managerial systems etc.) to the local
suppliers in the GPN in order to raise their technical capabilities in terms of
production and process because MNCs must be sure about the quality of the products
to be supplied (Narula and Dunning, 2000; Ernst and Kim, 2002 for further details).

18
2.2. Technology Diffusion through FDI and Growth
Developing countries consider that FDI by MNCs give rise to technology diffusion and a
major channel for gaining access to advanced technologies and knowledge of developed
countries (Borensztein et. al. 1998). In their study, Borensztein et. al. (1998) and Xu (2000)
verify this by showing that FDI is most important source of economic growth for developing
countries, and they reveal that FDI flows from developed countries are an important channel
through which technology transfers have been provided to local firms of developing
countries. Moreover, they show that technology transfer through FDI has a more positive
effect on economic growth than domestic investment when host countries have a sufficient
level of human capital. They suggest that the stock of human capital plays an important role
in the absorptive capacity by emphasizing the role of the education level in order to get
benefit from FDI. In a similar study, Blomström and Kokko (1997) also show that there is a
positive relationship between the benefits of FDI and technological capability level of
domestic firms. In addition, Romer (1986; 1990) in his “endogenous growth theory”
emphasized the role of human capital in order to acquire the foreign technologies and to
benefit from FDI in host countries by suggesting that human capital would lead to economic
growth by using new technologies and efficient production techniques.
The simple models in the neoclassical economic theory assume that technology is freely
available across countries, within countries and among all firms. This theory basically
assumes that technological knowledge is a public good and non-rivalry, when it is created
every person that is willing to pay the price of technology may benefit from it, in other
means, it is non-excludable. This view expresses itself best in this motto “free international
flows of capital and technology”. According to this view, all firms are considered to be
operating on the same production function and they decide how much labor and capital will
be used in accordance with their relative factor prices. In this process, developing countries
can transfer advanced technologies from developed countries, and adaptation and
assimilating of these technologies are not required, and technical efforts by firms in the
learning and absorbing of these technologies are not seen as important factors (see Lall,
1992). In other means, knowledge, capability, cost and tacit nature of technologies are not
seen important, it is assumed that they can be easily acquired by developing countries, and
there is no need for adaptation of such technologies to local conditions (Bell and Pavitt,
1997). In line with the neoclassical growth theory, Wang (1990) also conducted a model by
assuming that increase in “knowledge” used in the production is determined as a function of
FDI (Borensztein et. al. 1998). Even though neo-classical approach suggest that there is no

19
any obstacle to restrict the spillovers from MNCs to local firms and they occur efficiently,
findings and evidences on developing countries in the literature show that there are very
limited benefits from MNCs or negative spillovers (Narula and Marin, 2003)1.
On the other hand, “unconventional” approaches, inspired from “evolutionary theory”
developed by Nelson and Winter (1982) and explained in Dosi (1988), propose that
“indigenous technological efforts” of the firms in developing countries in adapting, learning
and improving of new technologies from developed ones play a deterministic role by
implying that markets are inefficient in the diffusion of technology (Lall, 1992). This
approach is mainly based on these assumptions; (i) knowledge and technology are not easily
available and fully transferrable across firms since they are created as a result of long R&D
and innovation activities at high costs; (ii) they are protected by creators in order to prevent
the diffusion of these technologies to other rival firms; (iii) the adaptation of these
technologies requires high technological capability and capacity, skilled and experienced
human capital, effort, investment and learning process by the recipient due to tacit character
of these technologies. These also explain why there are differences among firms in terms of
their technology levels, production processes and capabilities (based on Lall, 1992 and Pack
and Saggi, 1997). Therefore, the approach of “the evolutionary theory” seems more realistic
than the neoclassical approach.
In the traditional growth theory, the role of the technology was left as an unexplained
residual, whereas recent literature on growth revealed that state of the domestic technology
relative to that of the rest of the world plays an important role in the process of economic
development (Barro and Sala-i-Martin, 1995). According to this theory, economic
development of a backward country depends on its absorptive capacity, technological
capabilities, infrastructure, and human capital stock. In other means, economic development
and growth are explained by a “catch-up” process in the level of technology and it depends
on the extent of absorption, adaptation, acquisition and implementation of new technologies
and knowledge that are already in use in developed countries (Borensztein et. al. 1998).
Therefore, in modern economic growth theory, stock of knowledge, its intensity and
generation play a very important role and determine a country’s economic growth (Kuznets,
1966).
1 For instance, Haddad and Harrison (1993) for Morocco; Aitken and Harrison (1999) for Venezuela, Konings
(2001) for Bulgaria and Romania, Djankov and Hoekman (2000) for Czech Rebublic have found negative
evidences.

20
Today, technology is seen as a major determinant for industrial development and economic
growth. According to Pack and Westphal (1986), industrial development is a process through
which accumulation of knowledge and technology capabilities are conducted especially by
learning and translating them into new product and production process innovations. Studies
in terms of developed countries revealed that 50% of the long-term economic growth stems
from technological developments that improve R&D, innovation, productivity or lead to new
products, processes (Grossman and Helpman, 1991). One of the important examples is South
Korea that has achieved to transform its economy from agrarian to industrialized one during
the past four decades through technology and industrial development in its industry.
Therefore, many governments in developing countries nowadays have been studying and
examining the South Korea experience as a case study to be successful in their own countries
by applying true science and technology policies or strategies (see Kim, 1998).
Kim (1998) postulates that industrial development process of developing countries consists
of three stages: “acquisition”, “assimilation” and “improvement” of foreign technologies
from developed countries through technology transfers rather than relying entirely on foreign
sources. In the first stage, developing countries acquire technologies from advanced
countries through “assembly processes”, “product specifications”, “production know-how”,
“technical personnel”, “components and parts” because of insufficient technological
capabilities of local firms. In other words, firms in the developing countries try to imitate
foreign technologies and products through reverse engineering; therefore, this stage consists
of “assembly production” for “standard products” and requires only an “engineering”
capability. In the second stage of industrialization, “production” and “product design”
technologies are quickly improved by “assimilation of foreign technologies”. In this stage,
firms undertake “creative imitation” and try to produce differentiated products by using their
technical capabilities on “engineering” and “development”. In the last stage, after
successfully assimilation of foreign technology, local firms shift to “original innovation” and
they can undertake research, development and engineering activities by their increased
scientific, technological and engineering capability in order to improve and developed new
technologies and products. In these stages, if they successful, countries accumulate
knowledge and technology, and they increase their technological capabilities and in the end
they may candidate to be an advanced country (see Kim, 1998 and 2001 for further details).
Developing countries benefit from globalization process through liberalization of capital
flows and export orientated policies. These policies also provide them access to advanced
technologies and sophisticated products invented in developed countries, and these trigger

21
growth rates, thus they may have a chance to catch up these countries (Keller, 1996).
However, a small part of the technology can be obtained by these processes (blueprints,
manuals, specifications etc.) and they are not sufficient to catch up developed countries
successfully without adopting, assimilating and understanding the knowledge embodied in
these technologies. Therefore, it is also necessary to have an efficient absorptive capacity
level, skilled and experienced human capital stock (engineers, workers, and managers) in
order to get benefit from these technologies (see Grossman and Helpman, 1991; Pack, 1992;
Keller, 1994; Evenson and Westphal, 1995). For instance, in their study, Borenzstein et. al.
(1998) and Xu (2000) reveal that economic growth is positively affected by FDI in only
developing countries with a certain threshold level of absorptive capacity.
In sum, technology spillovers from FDI and the accumulation of knowledge are seen as a
key determinant factor for economic growth, and productivity of local firms in developing
countries. These can be increased by R&D and innovation activities, or by knowledge
diffusion from external sources. It is considered that FDI give rise to inflow of advanced
knowledge and technologies into the host countries, hence today knowledge diffusion from
FDI is to be very important factor especially for the developing countries to access the last
technologies. FDI can bring technology embodied in goods and services and knowledge as
intangible assets; however, to benefit from them is not an automotive process, and it requires
that recipient must have some capabilities to absorb, assimilate and adopt such technologies
(see Kinoshita, 2001 for details).
2.3. MNCs and Technology Spillovers
It is known that MNCs are the major players in global production, FDI flows, R&D and
innovation and they are the technology producers of the world. A significant part of the
R&D investments in the world are made by these companies (Borensztein et. al., 1998).
While producing technology, these companies also control the worldwide technology (Eden
et. al., 1996). Significant information and statistics on the production and technology
activities of those companies can be found in various publications and reports, published by
OECD and UNCTAD annually (such as main science and technology indicators, world
investment reports). For instance, according to UNCTAD (2011) statistics, the value added
generated by MNCs worldwide in 2010 was nearly US$ 16 trillion, about a quarter of global
GDP. Also, total sales/ (value added) generated by foreign affiliates of MNCs in the world
accounted for US$ 33 trillion/ (US$ 7 trillion) in 2010, respectively. They also conducted

22
more than US$ 6 trillion exports, about one-third of global exports. The trade volume of the
MNCs’ headquarters and their affiliates located in other countries is one-third of the total
world trade. 80% of the R&D activities in the OECD countries are performed by the MNCs
who have more than 10,000 employees. Again, 75-80% of the private R&D expenses
worldwide are made by the same MNCs. However, the majority of the technology
production and basic R&D activities are realized in the home country of these MNCs. For
example, USA-based MNCs conduct only 13% of their R&D research in other countries
(UNCTAD 1997: 2003). More than 65% of the global R&D research total is conducted only
in five countries. These countries are the USA (33%), Japan (13%), China (9%), Germany
(6%) and France (4%), respectively (OECD, 2009). When we add the next five countries, -
South Korea, England, Russia, Canada and Italy- this ratio increases to 80%. This situation
reflects that four-fifths of the world’s R&D is conducted by just 10 countries (OECD, 2009).
All statistics show that MNCs has become the predominant decision-makers in global
economic system, technology, innovation and R&D. For these reasons, MNCs are seen as
the creators, major sources and diffusers of new technologies for the host countries2.
Therefore, all studies that investigate the technology spillovers have focused on these
companies.
MNCs invest substantially in R&D, innovation, test facilities, design, advanced and
sophisticated new technological fields, and their products are recognized internationally.
These activities are much costly and risky, and require high budgets. Therefore, MNCs owe
their dominant position to these activities as the major producers and sources of advanced
technologies. Moreover, they have established their production, distribution and marketing
networks worldwide, by these networks they can operate in many locations of the world and
they can protect their strategic technologies through many ways (intellectual property rights,
patents, and other informal ways) (UNCTC, 1994).
In the last decades, together with globalization process, FDI accompanied by MNCs is
considered as a major factor for economic growth and development strategy. Hence, almost
all governments, particularly developing countries which do not want to reinvent the wheel,
compete with each other in order to attract more FDI flows by liberalizing their FDI
regulations, by creating favorable conditions and by offering incentives in a wide range for
MNCs3 (see UN, 1999; Narula and Dunning, 2000; Narula and Marin, 2003; Narula and
Driffield, 2012). Moreover, FDI is also being promoted by international institutions (WTO,
2 See Lenger (2004) on discussions and for further details.
3 For instance, special tax concessions, lower income taxes, exemptions from import duties, extension of tax
holidays, subsidies for infrastructure and direct subsidies.

23
OECD, IMF, EU, UN, UNCTAD, Washington consensus4 etc.) that they help countries
which want to attract more MNCs by giving them advice, training and various assistances
(Narula and Driffield, 2012). Because of these reasons, the relationships of the governments
with MNCs have gained high importance, and the role of the MNCs in developing countries
has significantly increased in their economies (UNCTAD, 1997 and 1998). Accordingly,
FDI flows by MNCs have increased significantly and it is seen as the most important
external source of technology for developing countries (UNCTAD, 2000). In sum,
developing countries rely on MNCs for their technological development and for transferring
of the advanced technologies.
According to the general view, it is considered that MNCs associated with FDI will bring
with them superior technologies (that includes modern and advanced technologies in terms
of product, production process, marketing, and distribution), know-how, skills (in terms of
organization / management / marketing), export contacts, well established and designed
systems for relationships with suppliers and customers above the inflow of physical capital
(Hymer, 1960; Caves, 1971; Kokko, 1996; Blomström and Kokko, 1998; Aitken and
Harrison, 1999). Host countries hope that they will have a chance to gain access to the
technology by inviting foreign investment, and they hope that they will acquire these in the
end. It is also considered that FDI will result in benefits for national income, employment,
capital formation, productivity, foreign trade and technology structure of the host country.
All of these will increase the technological capability and productivity level of the host
country firms by interacting with MNCs. In other means, they rely on FDI as a source of
technology and capital (Lall, 1997; UNCTAD, 1998). These kinds of benefits arise through
externalities mentioned above are called as “FDI productivity spillovers” (external effects) or
“technology spillovers”5, and it is considered as the most important benefit from FDI (see
Blomström and Kokko, 1998 for further details).
In the literature, technology spillovers are associated with the direct or indirect benefits of
MNCs and they generally occur when the entry of MNCs lead to productivity increases in
the local firms of host country. Direct benefits can be summarized as increases in physical
capital, employment, and usage of advanced machinery and equipment. On the other hand,
indirect benefits are the various technology spillovers from MNCs to local firms. According
to this view, technologies of MNCs is in the nature of public good to some extent and
4 The term was firstly used by the economist John Williamson in 1989. It refers to ten recommendations of three
institutions (the World Bank, the IMF and the US Treasury department) for developing countries based on neo-
classical economic theory to establish a more market oriented economy. 5 We will use the terms “productivity spillovers” and “technology spillovers” interchangeably throughout the
study to refer to the same concept.

24
generate positive externalities because they cannot be fully internalized by MNCs and local
firms of host country may benefit from these externalities. In other words, technology
spillovers are thus a matter of externalities being provided from foreign firms in host country
to local ones (see Blomström, 1986). These are considered as one of the most significant
channels for the diffusion of modern technology across countries, rather than formal
technology transfer arrangements (Romer, 1990).
Spillovers from MNCs impact also positively on human capital level in host country by
direct and indirect ways. Entry of a MNC into domestic market is expected to increase
directly employment level and also capability level of the domestic human capital by
providing on-the-job or of-the-job training and education, by “learning by doing” activities,
and by transferring their “technological knowledge” to their domestic workers (engineers,
R&D, production and management personnel). These education and training activities are
expected to increase quality and tacit knowledge level of the workers in host country. In
second way, local firms increase their own employment because of “increased economic
activity”, and it is expected that MNCs provide training and technical assistances to their
direct suppliers in host country. Direct suppliers of MNCs gain access to more productive
human capital stock through, employed and trained by MNCs, hiring workers who have
knowledge and technology of MNCs (see, Narula and Marin, 2003 for further details).
MNCs invest generally in overseas countries in the expectation of acquiring higher profits by
using their firm-specific advantages. These advantages of MNCs are associated with
technology (including economies of scale, patent, capital intensity, human capital,
innovation, R&D etc.), “managerial ability”, “organizational skills”, “the ability to
coordinate resources or supply chains, international distribution and production networks,
“access to finance”, and “the knowledge of markets” (Dunning, 1979; Narula and Driffield,
2012). Dunning (1993) explains potential sources of these advantages within “OLI model”
(stands for ownership - location and internalization advantages) that may impact on a firm’s
decision to become a MNC. According to this, “ownership advantages” (O) of MNCs allow
them to compete successfully in host countries due to their firm-specific advantages such as
better marketing techniques, export contacts, reputation, superior managerial, production and
technological capabilities, and so on. He uses “location advantages” (L) term in order to
refer benefits offering by host country to attract the MNC (investment and tax incentives,
special tariffs etc.) and to access the good infrastructure and production factors of host
country at low cost. Lastly, “internalization advantages” (I) refers to advantages of MNCs to

25
invest in a country rather than exporting, licensing or joint venture. According to Dunning,
determinants of MNCs activity abroad are influenced by these three factors.
MNCs generally establish an affiliate in overseas countries in order to produce and sell
goods. These affiliates use local inputs of capital, labor, and intermediate products.
Moreover, they provide new technologies to host countries by both developing through R&D
activities in host country and importing from its parent company in home country (Hines,
1995). According to the ‘industrial organization’ approach, affiliates of MNCs can compete
with local firms in host country because of their firm-specific intangible assets6 (see, Caves
1996). These assets are in the form of explicit technology (machinery, tools, equipment) and
tacit knowledge (capabilities, experience, know-how) about “organizational governance”
based on intra-firm hierarchies and on “the advantages of common governance” (Lall and
Narula, 2004). Due to less costly and easily transferring specifications of these assets, MNCs
prefer direct investment in host country rather than licensing these assets to local firms, and
they protect their advantages by this way (Aitken et. al. 1996). On the other hand, some
studies that analyzing why MNCs invest the host countries rather than directly exporting or
giving license of their products/technologies revealed that one of the reasons is to protect
these advantages due to market failures and non-existence of proprietary rights (see Caves,
1996; Markusen, 1995; Görg and Greenaway, 2004). Therefore, even if explicit technology
can be acquired by local firms, tacit knowledge cannot be easily acquired by such firms. The
only way that local firms can benefited from external benefits of MNCs is the technology
transfers from MNCs, however MNCs will not easily transfer the source of their advantages
to the local firms in host country.
Due to globalization process, MNCs have dominant role in the technology transfers, and they
play an important role in transferring of the advanced technologies across countries.
Technology transfer from developed countries through MNCs may provide increases in
knowledge base and technological capabilities, and may serve as a vehicle for technological
change and learning; however, experiences reveal that relying on fully-owned or joint-
venture MNCs are not necessarily an effective way to acquire foreign technologies. These
firms may transfer production technology, but they do not transfer their engineering,
innovation capabilities and their tacit knowledge when parent company used FDI to exploit
the local market. Therefore, these kinds of FDI as a means of technology transfer may lead
to foreign dependency (see Kim, 1998 for further details).
6 Such as trademark, technology, knowledge, skills in terms of organizational, marketing and managing, export
experiences and contacts worldwide, production methods and marketing advantages, coordinated strategic
relationships with suppliers and/or customers, distribution networks established in worldwide and reputation.

26
Technology spillovers depend on many factors. One of them is “the scope and competence”
of the MNC affiliate. According to this view, MNC affiliates with complex production
systems and advanced technology need high level of local capabilities, skilled human capital,
strong clusters, service firms, government incentives, substitutions and institutions. That is
one of the important reasons of why MNCs generally prefer to establish and to conduct their
basic R&D and design activities in their home countries. If countries can provide these, then
MNCs will establish high-tech affiliates in host country and quality of spillovers from these
affiliates also will be expected to be very good (Lall and Narula, 2004). In their study, Wang
and Blomström (1992) developed a model to analyze the international technology transfer
and they revealed that these were resulting from the strategic interactions between affiliates
of MNCs and local firms in host country. They also point out that learning efforts of local
firms have positive impact on such technology transfers provided by MNCs. On the other
hand, establishment structure of the affiliates also determines the quality of spillovers. For
instance, spillovers from an affiliate in the structure of sales office are limited than that of
manufacturing plants.
Consequently, in last decades, there has been a significant change in developing countries in
terms of openness and attracting more FDI flows. The main reasons for this change can be
summarized as globalized production networks, accessing easily to international markets and
production networks of MNCs, and need of acquiring advanced technologies of MNCs. In
this process, the role of the MNCs as the creators of the high technologies has grown in all
countries and they have become leader, and they are seen as the only source of the
technology creation and as dominant actors in international technology diffusion. However,
the MNCs that use high-technology generally prefer to invest in developing countries with
high level capabilities in terms of human capital, better infrastructure, and production. In
other means, liberalizing FDI policies is seen as a necessary condition for developing
countries but not sufficient to attract more MNC with high technology and to benefit from it,
besides it requires strong local technological capabilities that MNCs need (Lall, 1997; Lall
and Narula, 2004). In other words, there is no any reason to believe that FDI flows through
MNCs lead to an increase in exports, competition, capacity, productivity of local firms and
result in technology spillovers to local firms that they ultimately determine economic growth
in the long run. Conversely, it is necessary to have a certain “knowledge base”, “intensity of
effort”, and “technological capacity” in order to benefit from spillovers acquired through
MNC activities (Lall and Narula, 2004).

27
2.4. Channels of Technology Spillovers
In this section, we mention in detail about the major channels that earlier literature identified
through which spillovers from foreign firms to local firms can occur. There are number of
spillover channels identified in the literature, however we categorized these as FDI,
horizontal and vertical (backward and forward) linkages with foreign firms,
“demonstration/imitation”, “labor turnover (skill acquisition), “competition”, and “exports”
(see Wang and Blomström, 1992; Kokko, 1992; Blomström and Kokko, 1998; Kinoshita,
1999; Görg and Greenaway, 2004). In the literature, three of these channels - demonstration,
labor turnover and competition- are referred as horizontal ones.
Via FDI: It is known that FDI is generally the most important channel through which
superior technologies (capital, equipment, machines, skills and knowledge etc.) can be
transferred from developed countries to developing ones. Developing countries, where local
technologies and capabilities are very low, hope that MNCs by establishing plants in host
country may provide technology transfers to their suppliers and sub-contractors, and they
may also allow these firms to access their international networks. By this way, these
countries may upgrade their technologies and conduct high-tech activities, and local firms
may enhance their productivity (Glass and Saggi, 2002). Hence, FDI is seen as the largest
source of external financing of the development and growth for less developed countries. For
this aim, many governments have followed policies to ease restrictions on FDI and offered
special incentives to MNCs such as tax exemptions, free land for establishing plant,
subsidies for infrastructure etc. to attract foreign investment. The basic idea behind these
policies as mentioned before is to benefit from spillovers occurred from FDI through
technology spillover (Aitken and Harrison, 1999).
Via Vertical Linkages: Another important channel through which technology spillovers
occur is vertical linkages (backward and forward), the relationship between foreign and local
firms. The importance of this channel for host countries to benefit from FDI was introduced
to the literature by Lall (1980) and Mead (1984), and developed further by Markusen and
Venables (1999); Blomström and Kokko, (1999); and Pack and Saggi (2001). The spillovers
occur through these linkages are also referred as vertical spillovers (or inter-industry
spillovers). These spillovers occur through forward and backward linkages of MNCs with
local firms who become their suppliers and customers. According to general view, spillovers
associated with vertical linkages with foreign firms give rise to more advanced, better quality
and specific transfers to local firms, and more improvement in the productivity since MNCs

28
voluntarily share their firm-specific technologies only with their closer local suppliers
(backward linkages) and customers (forward linkages) for strategic reasons. Moreover,
foreign firms may need to assist their local suppliers or customers to raise the quality of
products supplied, and by this way local firms also improve their productivity.
Backward Linkages: In the case of backward linkages (selling output to foreign
customers), the entry of MNCs may impact positively local suppliers by increasing the
demand for local inputs. Moreover, local firms as suppliers or sub-contractors of
MNCs may be forced to produce output with higher quality standard and technical
specifications and by using more efficient technologies. Therefore, MNCs may
provide technical assistances or introduce new technologies for their suppliers in order
to raise the quality of the intermediate products produced according to technical
specifications specified by MNCs (supply side) (Moran, 2001). Furthermore, MNCs
may provide on-the-job or on-the-job training activities to both management and
production personnel of their suppliers to be sure about the organizational and
management structure, delivering time and producing standards of the products to be
procured. MNCs may help their local suppliers to set up production facilities by
providing technical assistances. In addition, MNCs may insist on using the high
quality standards and procedures of their own on the production processes, or they
may help their suppliers by giving materials-tools, or by providing some incentives or
financial assistances to upgrade their technologies (demand-side) (Lall, 1980;
Blomström and Kokko, 1999).
The spillovers and technology transfers provided by MNCs to their suppliers through
backward linkages mentioned in the preceding paragraph are well known practices especially
in the global automotive industry. Global automotive manufacturers provide various
technologies to their overseas affiliates or joint-ventures in host country in order to develop
their production technology, to increase efficiency, and to provide firm-specific benefits.
Foreign affiliates as the final users of the products being supplied by local firms assist to
their local suppliers in various ways as summarized in the preceding paragraph. The strategic
relationships between buyers and suppliers in this industry are very strong and depend on
mutual trust established in many years. Moreover, there are very close communication and
strategic relationships between such firms in every step of the production, and supplier firms
have actively participated to production and design processes of the products. These are also
the most important reasons of why we analyze the Turkish automotive industry as a case
study in this dissertation (see section 4.3).

29
Forward Linkages: In the case of forward linkages (local firms purchase intermediate
inputs from foreign suppliers), the most important benefit from MNCs is supply of
higher quality inputs at lower price to local firms (Markusen and Venables, 1999).
Furthermore, MNCs may provide various assistances (such as technical services,
manuals, training activities, seminars, courses etc.) to their local customers about
using the products supplied by MNCs more efficiently (Görg and Greenaway, 2004).
It must keep in mind that if increases in production quality lead to increases in prices,
and if absorptive capacity of the local firms is insufficient to benefit from this upgrade
of quality, they will be negatively affected by increased costs (Javorcik, 2004). This
situation is called negative forward spillovers and it may also help to explain our
negative findings on such spillovers in Chapter 3 (see section 2.6.4 for other reasons
of negative spillovers).
Because of the reasons mentioned above, vertical linkages are considered as one of the most
important channels to increase the technological capabilities of local firms (see Lall, 1980;
Rodriguez-Clare, 1996; Markusen and Venables, 1999; Lin and Saggi, 2004; Navaretti and
Venables, 2004). In addition, vertical spillovers are seen as more important than horizontal
ones (intra-industry spillovers) in terms of technology spillovers because of direct and close
strategic relationships between foreign and local firms (Moran, 2001).
Empirical studies for vertical spillovers have produced mixed results for each country. For
instance, Kugler (2001) finds positive horizontal (intra-industry) spillovers but no evidence
for vertical spillovers (inter-industry) in Colombia manufacturing industry. Javorcik (2004)
in her study for Lithuania and Blalock and Gertler (2003) for Indonesia find positive
productivity spillovers through backward linkages but no evidence for forward and
horizontal linkages. Moreover, the estimations of Driffield et. al. (2002) for UK show that
there are positive spillovers through forward linkages but not significant spillovers through
backward linkages. In other studies for UK, Harris and Robinson (2004) find that horizontal
spillovers are more important than vertical ones, and there are negative spillovers in many
sectors. Girma et. al. (2003) in their study for UK also find that export oriented domestic
firms are benefited more from vertical linkages than domestic orientated ones.
In sum, firm-specific technology of the foreign firms may spillover to local firms in host
country through vertical linkages. With these linkages, local firms are exposed to new
products, production and marketing techniques, and to more rigorous quality and working
conditions, and they may receive direct technical support and training activities from

30
upstream or downstream foreign firms. Moreover, foreign firms may also act as a stable
customer of the local firms for their inputs demands, and this give rise to maintain long-term
and mutual trust based on strategic relationships with foreign firms. In all these cases,
foreign firms would raise the productivity gains for local firms through vertical linkages (see
Aitken and Harrison 1999, for further details).
Via Demonstration/Imitation: “Demonstration” by MNCs or “imitation” by local firms is
probably the most evident spillover channel. Foreign technology embodied in FDI can be
acquired by observing foreign firms or by imitating of some technologies used by MNCs.
Local firms, by this ways, can improve their productivity and efficiency. For instance, when
a new MNC enters a market it introduce new technologies in terms of production, process,
quality control, distribution systems and organization into market and local firms may
improve their capabilities and production methods by adopting and copying these through
imitation or reverse engineering. These externalities are also called as “contagion” effects
(see Das, 1987; Cantwell, 1989; Wang and Blomström, 1992; Kokko, 1996; Blomström and
Kokko, 1998 for details). These are generally observed among firms operating in the same
industries so these are also referred as horizontal spillovers. A number of case studies have
identified the presence of spillovers through demonstration in various countries (see
Blomström and Kokko, 1997).
Via Labor Turnover (Skill Acquisition): One of the channels through which spillovers
occur to local firms is labor turnover. Training of the employees at the MNCs and
recruitment of this trained workforce by the local firms could enable the local firms, despite
indirectly, to access the production and management skills of the MNCs. According to this,
workers employed by MNCs acquire knowledge of its technology by training activities and
experiences, and this knowledge may move to local firms by labor turnovers. Role of labor
turnover as a channel of technology spillover was examined by Glass and Saggi (2002). It is
expected that labor turnover mostly occur among firms within same industries so it is also
referred as horizontal spillovers.
It is agreed that, as a result of having firm-specific intangible assets, MNCs demand highly
skilled and experienced workers from labor market. Moreover, when a worker joins the firm
they invest so much in regular training activities, and they train their employees continuously
in order to provide last technologies. Therefore, skills and knowledge of the domestic
workers employed and trained by MNCs may spillover to local firms when they set up their
own firms or when they are hired by local firms in host country (Kokko, 1996). Moreover,

31
hiring workers who have acquired knowledge and advanced technologies of MNCs is seen as
one of the important channels for the transfer of tacit knowledge in terms of management,
quality control, distribution, and marketing systems. On the other hand, it should be noted
that this channel also has a negative impact on local firms as MNCs may attract the skilled
workers away from domestic firms by offering higher salaries (Girma and Wakelin, 2001).
For theoretical discussion for the role of labor turnover in the technology transfers from
MNCs see Glass and Saggi (2002).
It is very difficult to measure and to analyze spillovers occur through this channel because it
is not possible to track employees, worked for MNCs and hired by local firms, and their
effects on local firms (Glass and Saggi, 2002). One of the methods to measure the spillovers
through labor turnover is “wage spillovers”. As a result of higher training investment
expenditures, it is expected that MNCs should put upward pressure on wages and often pay
higher wages to prevent the labor turnover, because marginal productivity of workers in the
plants are very high (Lipsey and Sjöholm, 2004). On the other hand, if local firms want to
attract skilled workers who have tacit knowledge of MNCs have to pay also higher wages
and to give more incentives than MNCs. In result of these, if they compete on the same labor
market, higher wages in foreign firms spillover to local firms, and this could be an indicator
for technology spillovers associated with higher “wage spillovers” to local firms. Therefore,
some studies which examine the impact of FDI on domestic wages hypothesized that rises in
equilibrium wages in response to increases in FDI may represent an evidence for technology
spillovers through labor turnover. In other means, high wage differentials may present the
lack of technology spillovers between foreign and local firms (see Aitken et. al., 1996;
Girma et. al., 2001; Lipsey and Sjöholm, 2001; Görg et. al., 2003 for further details and
testing of wage spillovers). The studies that examine wage spillovers are very limited7 and
they generally have adopted a regression framework as in the case of productivity spillovers:
wages paid in local firms are used as the dependent variable and some proxies for foreign
presence at both firm- or sector-level are added. Moreover, firm-specific (age, firm size,
export and capital intensity, share of skilled employees in the workforce, R&D expenditures
and so on) and sector-specific control variables are added as explanatory variables (see
Pamukçu and Taymaz, 2009 for further details).
Via Competition: Presence of MNCs increases competition in host countries and this is seen
as one of the major channels of spillovers. Entries of MNCs into domestic market should
7 See, Görg and Strobl (2001 and 2003) for details.

32
bring with them newer and advanced technologies; these force receivers to use their
available technology more efficiently or to improve or upgrade their technology in order to
be competitive and to get much benefit from these technologies. Moreover, this situation also
forces other local firms to use their existing technologies and sources more efficiently in
order to cope with the “competition”, to survive and to protect their market shares. In
addition, they have to search new technologies in order to use in the production process and
to increase their productivity levels. As a result of competition effect, acquiring and
adaptation process of new technologies will be also accelerated (see, Wang and Blomström,
1992; Dunning, 1993; Aitken and Harrison, 1997; Markusen and Venables, 1999;
Blomström and Sjoholm, 1999; Glass and Saggi, 1998 and 2002). Due to nature of
competition within intra- and inter-industries, this channel affects both horizontal and
vertical spillovers. However, it should be noted that this channel may also affect negatively
the productivity of local firms. If foreign firms entered into domestic market manufacture at
a lower marginal cost than local firms, they may steal some market share from local firms
and they may force them to manufacture on a less efficient scale. These give rise to higher
average costs for local firms and their productivity will be lower (Aitken and Harrison,
1999:607).
Via Exports: The last important channel through which spillovers occur is the exports
(export access). In other words, the spillovers occur when local firms have gain to access to
foreign markets because of the presence of MNCs with export oriented (Aitken et al., 1997;
Blomström and Kokko, 1998; Greenaway et. al. 2004). Local firms can benefit from the
MNCs’ knowledge on global markets by observing their production, management and
exporting activities and techniques (demonstration effects). MNCs may share their
information on foreign markets and may enable local suppliers to use their distribution
networks in foreign countries. In other words, local firms can increase their export shares by
learning from MNCs with export oriented and using their distribution networks since MNCs
have superior experience and knowledge on entering world markets, international marketing,
production, exporting, and they have strong networks in various countries. Therefore, the
collaboration between local firms and MNCs with export oriented may provide international
marketing channels for local firms. Furthermore, export competition with MNCs at host
country and in foreign markets may lead to productivity increases for local firms. In sum, in
the result of these effects, local firms may improve their export capabilities and may be
successful exporters, and they compete more successfully in export markets (Görg and
Greenaway, 2004: 194).

33
Several studies have revealed the positive impact of MNCs on the export capacity of local
firms (Aitken et al., 1997; Kokko et. al., 2001; Rhee, 1990). In addition, the local firms that
have linkages with MNCs may easily access to foreign markets or may reduce the entry costs
into foreign market by benefited from the knowledge and distribution networks of MNCs
(through imitation or collaboration). For instance, the backward linkages with MNCs may
provide knowledge about product and process technologies, foreign market conditions and
arrangements, and tastes of foreign consumers in terms of design, product quality, and
packaging (see Aitken et. al., 1997; Blomström and Kokko, 1998; Barrios et. al., 2003;
Greenaway et. al., 2004). For the empirical studies about the effects of exporting access on
spillovers, see Aitken et. al. (1997); Kokko et. al. (2001); Greenaway et. al. (2004); Banga
(2003); Barrios et. al. (2003).
Consequently, all of the above channels are seen important because they are complex and
connected to each other (Kinoshita, 2001). However, it is clear that how much benefiting
from these spillovers is dependent on the efforts and technology capabilities of local firms.
2.5. Determinants of Technology Spillovers
In this section, we mention briefly about the determinants of technology spillovers occur
through MNCs to local firms in host country. In the light of literature, key determinants can
be categorized under four headings: Absorptive capacity and technological gap, MNC, host
country, and firm characteristics, respectively.
2.5.1. Absorptive Capacity and Technological Gap
One of the most important factors that affect technology spillovers is the absorptive capacity
of both host country and local firms. Although, absorptive capacity is evaluated as firm
specific, it can be also associated with a country or location. For instance, the success of a
firm to absorb and to internalize efficiently transferred technology depend also on “the
institutional and organizational framework”, “infrastructure”, “the processes that create and
distribute scientific knowledge”, “cultural, political and financial structure of the host
country” (Lorentzen, 2005; Narula and Driffield, 2012).

34
Absorptive capacity is defined as an ability to internalize technology created by foreign firms
and “modifying it to fit their own specific applications, processes, and routines” (Narula and
Marin, 2003: 23). The results of the studies show that technology diffusion does not
automatically occur; it requires the recipient to have a certain “knowledge base” and
“technological capability” to collaborate successfully with source so that it can absorb and
adopt such technologies (Wang and Blomström, 1992; Kinoshita, 2001). In the literature, it
is agreed that “existing knowledge base” and “intensity of effort” are two important elements
of absorptive capacity in order to internalize and to assimilate new knowledge. Today, firms
learn new technologies by their “existing knowledge base”, and this also influences their
learning processes and their knowledge in the future. “Intensity of effort”, on the other hand,
refers to the activities of local firms to solve technical problems encountered in production,
and represents a firm’s physical energy and intellectual entrepreneurship to internalize and to
convert foreign technology (Cohen and Levinthal, 1990). Moreover, absorptive capacity of
the local firms determines the speed and duration of the internalizing process of the
transferred technology. In the literature, “knowledge base” is considered less important than
the “the intensity of effort” because the latter creates the former, but not vice versa (Ullrich,
1998; Techakanont and Terdudomtham, 2004).
“Technology gap” term is used to refer the absorptive capacity and it is simply defined as the
distance between source (home country or foreign firms) and recipient (host country or local
firms) in terms of technological competence and development level (Borensztein, et. al.,
1998; Xu, 2000). It can be measured in many ways, for instance, the difference between the
productivity of local firms and the average productivity of foreign firms in the sector, or the
ratio between the labor productivity of a firm and average productivity of the sector (see
section 3.6.3). Furthermore, it signals to MNCs about the recipient’s absorptive capacity
such as human capital, institutions, infrastructure, R&D capacity, distribution networks, and
technology capabilities and so on.
In the literature, there are two contradictory views about the effects of technology gap on
spillovers. Findlay (1978), in his pioneering contribution, introduced the role of “relative
backwardness” on technology spillovers. He proposed that the greater the technology gap
between two countries/(two firms) in terms of technological capability or development level
give rise to greater the opportunities for less developed country/(less developed firm). He
also suggested that higher technological gap accelerates the technology spillovers due to
greater pressure for change and more rapid adaptation of new technologies (see Sjöholm,
1999b; Castellani and Zanfei, 2002). In other words, technology gap will facilitate the

35
technology transfer processes through relationships between those who have the advanced
technology and knowledge (such as developed country or MNCs) and those who wished to
acquire, assimilate and absorb them (such as host country or local firms) (Narula and
Driffield, 2012). However, it is necessary to point out that Findlay does not completely
ignore the role of technological capability to benefit from spillovers by suggesting that the
gap must not be too wide or a threshold level of capability in term of scientific and technical
knowledge is necessary in order to use and to acquire technologies. In contradictory view,
some studies (Cantwell, 1989; Wang and Blomström, 1992; Kokko, 1994; Kokko et. al.,
1996; Kathuria, 1996; Perez 1997; Glass and Saggi, 1998; and Liu et al, 2000) reveal that
there is a negative relationship between technology gap and technology spillovers; the
greater technology gap means that the lower qualities of technology transferred and lower
the potential gains for spillovers. It is assumed that it is necessary to have a reasonable
technological gap with MNCs in order to benefit from technology spillovers associated with
MNCs. It is suggested that technology gap is higher for the local firms with low-tech level
and expected that technology spillovers may be lower for these firms because of their lack of
“absorptive capacity” (Kokko, 1996). In other words, a large technology gap is a signal to
MNCs about low absorptive capacity of domestic firms and decreases the gains from
spillovers by domestic firms.
It is clear that the second notion mentioned above is more rational than Findlay’s notion
because one of the conditions to be benefited from spillovers is that local firms must have
certain technological capabilities relative to their foreign counterparts. Meanwhile, it can be
claimed that the absorptive capacity of host country firms is more important than to be able
to access the technologies of MNCs and determine whether or not they benefit from FDI
(Görg and Strobl, 2003). Therefore, backwardness is not seen as an advantage for the
countries, actually it could be a disadvantage (Bell and Pavitt, 1997). The findings of the
studies also support the second claim. For instance, in their study for Tanzania, Portelli and
Narula (2004) find that larger technology gaps between local and foreign firms give rise to
fewer backward linkages and to lower quality technological spillovers. Narula (2004) also
show that countries with high absorptive capacity receive FDI flows include advanced and
high level technologies. In another study, Borensztein et al. (1998) revealed that higher
productivity growth from FDI depend on the level of absorptive capacity. In a similar way,
Narula and Marin (2003) confirm that only firms with high absorptive capacity are to benefit
from FDI spillovers. Xu (2000) also shows that skilled human capital stock of the host
country plays also an important role in order to get benefit from technology transfers.

36
In sum, absorptive capacity is seen by researchers as an important factor in order to
internalize benefits resulted from MNCs at both the firm and the host country level.
Moreover, according to FDI-assisted development view, local firms as collaborators and
suppliers of MNCs must have a certain level of technological capability to usefully
internalize spillovers, and to learn from MNCs, and to undertake specific duties assigned by
MNCs. Therefore, a specific threshold level of absorptive capacity required to benefit from
spillovers is seen as a key determinant on spillovers (Narula and Driffield, 2012).
2.5.2. MNC Characteristics
In this section we deal with the characteristics of the MNCs that impact on spillovers.
Motives of MNCs: According to Narula and Dunning (2000), the main motives of FDI
through MNCs whether to invest or not in a country (especially in developing countries) are
summarized in four ways: “resource seeking”, “market seeking”, “efficiency seeking (to
restructure existing foreign production through rationalization)” and “strategic asset seeking”
motives. They define these motives as follows:
“Resource seeking” motive is the motive to obtain resources and production factors at
lower costs8.
Motive for the “market seeking” is to invest in a country to supply goods to host
country or other neighbor countries. In other words, MNCs may invest in a country in
order to access to host country market9, to protect and to expand their market shares
by expanding their production bases.
“Efficiency seeking” motive for the MNCs is to invest in a country in order to increase
efficiency by using different production factors, market structures, experienced and
skilled domestic workers in host country, policies, customer preferences etc.
Lastly, “strategic asset seeking” is the motive to acquire and to benefit from the
strategic assets of host country such as “marketing”, “technology”, “marketing”,
“infrastructure”, investment policies, human capital stock etc. (see Narula and
Dunning, 2000; 150-152, for further details).
8 These could be in the form of natural or human resource-seeking.
9 Especially they invest in host countries where import substitution policies have restricted to import from the
foreign markets in developed countries.

37
It is stated that, MNCs aim to generate economic rent by using their advanced production
techniques and technologies in the first three motives, while they move and invest in a
country to acquire new assets that protect or enhance existing asset in the last motive. In
general, MNCs have generally moved with these four motives mentioned above to make an
investment decision in a country: using natural resources in host country; using cheap labor
stock; entering new markets and expanding market; improving production technologies;
developing new technologies; and obtaining “new strategic assets” (Narula and Dunning,
2000: 150-152). Until a few decades ago, majority of the MNCs engaged in first two motives
and invested in host countries; therefore developing countries received most of their FDI by
these motives. In other words, developing countries have generally attracted MNCs which
try to generate economic rent by using their “firm-specific intangible assets” (Lall and
Narula, 2004: 451). Today, however, we see that MNCs have changed their motives, and
majority of them have engaged in last two motives by managing and integrating their
activities across borders, by maximizing their cross-border efficiencies. These motives have
also a determinant role in the transfers and spillovers since they are also interrelated with
strategies of MNCs (Narula and Marin, 2003; Narula and Driffield, 2012). Henceforth, the
main motives of MNCs may affect the extent and quality of spillovers, and linkages with
local firms.
The Entry Mode of MNCs: The other important factor that affects occurrence of spillovers
is the entry mode of MNCs into host country. MNCs may enter into domestic market
through a “merger or acquisition” (M&A) -entering into market by purchasing or by joint
venture with an existing domestic firm- and “greenfield investment” -entering a market by
building a new firm. It is suggested that new technologies have been introduced to market
slowly in the case of M&A while they are instantaneous in greenfield investment mode.
According to this view, MNCs established in the form of M&A more integrate to domestic
market and source more locally than those established through greenfield investment. M&A
entry mode creates more linkages with local firms and thus it may give rise to more
spillovers. On the other hand, in greenfield investment mode, MNCs rely on their own
technologies and systems that differ from host country, and they import such inputs heavily
from their home country, this may restrict the spillovers (based on Crespo and Fontoura,
2007: 414). Moreover, affiliates of MNCs established in the form of greenfield investment
are expected to have weak linkages with local firms than those established in the form of
M&A investment (UNCTAD, 2000; Narula and Driffield, 2012). Therefore, it is expected
that MNCs established through M&A result in greater vertical spillovers than those
established through greenfield investment.
38
Foreign Ownership Structure: Although evidences from studies have produced mixed
results, another factor that may affect spillovers is “the ownership structure of the MNC
affiliates” established in host country. There are two contradictory views about the role of
foreign ownership in the literature (based on Blomström and Sjöholm, 1999): According to
one view, MNC affiliates with minority foreign ownership reduces the spillovers to local
firms because parent company may hesitate to transfer more advanced technology, know-
how and systems to its affiliate in host country due to its reduced control over the affiliate. In
other means, there is a positive relationship between technology spillovers and the degree of
foreign ownership. When the MNCs have the majority of the shares, it would bring along its
much newer technologies and its managerial skill along with it, since he would have a
control over the profit and the firm. Newer and more technology could mean more spillover
(Ramachandran, 1993). In contrary view, it is suggested that minority ownership MNC
affiliates may have more positive impact on benefiting from spillovers than those with
majority ownership. Because, it is expected that MNC affiliates with minority foreign
ownership need to create more linkages with their partners and local firms in host country by
transferring more advanced technologies in order to increase their advantages over domestic
market and to get high profits. These are expected to lead to more knowledge and technology
diffusion to local firms in host country. In other words, larger domestic ownership in MNC
affiliates is better to access to foreign technology because it may create more linkages with
the local firms and the parent firm cannot prevent leakage of technologies. For this reason,
some of the developing countries press on the foreign investors to make them establish joint
ventures with the local firms (Blomström and Sjöholm, 1999).
The Market Orientation Strategy of MNCs: It is one of the most important factors that
matter in spillovers. Export-oriented MNCs are expected to conduct less frequent linkages
with local firms since they purchase less locally than domestic oriented ones in order to
produce goods with higher quality requirements and technical specifications for export
markets. Moreover, if intermediate products are used intensively, and if costs of
communication are high between parent and affiliate, and if intermediate goods that
produced in home and host country are similar, it is expected that more linkages are created
by MNCs (Görg and Strobl, 2003; Lall and Narula, 2004; Narula and Driffield, 2012).
The Origin of MNC: It is the another factor that may also generate different spillovers to
local firms because of their different nationalities, cultures, technologies, different modes of
transfers, working conditions, and systems (see, Crespo and Fontoura, 2007 for details).

39
2.5.3. Host Country Characteristics
The literature on the determinants of technology spillovers reveals that the host country
characteristics play an important role in the decisions of MNCs about whether to invest or
not in the country, and impact on both the technology spillovers and the adaptation of new
technologies by local firms. The major characteristics identified by both econometric
analyses and case studies in the literature are summarized under four headings: (i) economic
development level, (ii) knowledge base or available skilled human capital stock, (iii)
infrastructure, and (iv) technological capability level of the host country. These also
determine the composition and quality of technology spillovers and the level of benefiting
from it. Further, foreign trade policy, foreign investment policy, intellectual property rights,
market size, competition level, investment incentives, policy stability or overall
macroeconomic outlook of the host country are other host country characteristics that may
determine the linkages with MNCs (based on Blomström and Kokko, 1997; Görg and
Greenaway, 2004). For instance, countries with larger market size, with larger capacity, with
better skilled human capital stock and higher technological capability are expected to attract
MNCs with advanced production technologies and knowledge, often with R&D and design
departments. Moreover, it is agreed that there is a positive relationship between the quality
of linkages created with MNCs and average technology level of the local firms in host
country.
Economic Development Level: Empirical findings related to developed and developing
countries show that there is a positive correlation between development level of host country
and benefiting from spillovers (Blomström et. al. 1994). The studies on developed countries
provide consistent results on positive spillovers, while studies on developing countries
produce mixed results (positive, negative or insignificant results). These studies support this
argument by suggesting that developed countries have better infrastructure, advanced
financial institutions, advanced technological equipment, high competitive sectors, local
firms with high technological capability, skilled human capital, better inter and intra-sectoral
linkages, and these give rise to more positive spillovers and to more benefiting from these.
Supply and Quality of the Human Capital Stock: It is the other most important factor and
used as a proxy for knowledge base because advanced technologies need skilled and
educated workers. MNCs may decide to invest a location if there is enough educated and
skilled human capital. Findings show that MNCs with high technology invest only in
countries with higher skilled human capital stock. Therefore, it is necessary to have certain

40
qualified human capital stock in order to get benefit from advanced technologies and to host
advanced foreign technology (see Keller, 1996: 2004). The quality of human capital may be
generated by host countries through formal education, formal training, on-the-job and off-
the-job training activities.
Infrastructure and Incentives: Spillovers may also depend on infrastructure of the host
country (such as communication, logistics etc.) and incentives given by host country for
R&D, innovation and investment. In a similar way in human capital stock, MNCs with high-
intensive technological manufacturing need high-tech and developed infrastructure.
Incentives by government to attract more FDI, to develop infrastructure and to increase
absorptive capacity of the local firms play an important role in promoting the spillovers.
Although individual firms are responsible to benefit from spillovers, it is clear that entire
economic system and infrastructure are very crucial to successfully absorb technologies, and
they affect positively individual firms (see Narula and Marin, 2003).
Technological Capability Level: The possibility of attracting MNCs with high-tech
production systems and advanced technologies, in order to acquire skill and technology from
them, is higher for the countries with higher technological capabilities. However, these
MNCs seek selective incentive public policies and special investment promotions conducted
by host countries so these are the other factors that impact positively on spillovers (Lall and
Narula, 2004). The major factors that impact the host country capabilities can be grouped as
“physical and human capital”, “infrastructure”, “technological effort”, FDI policies,
incentives for FDI, trade regime, institutions, financial markets (Lall, 1992).
Foreign Trade Policy: According to this argument, trade regime of the host country has an
impact on spillovers; however the direction of the relationship is not certain and varies
according to countries and host country policies. However, general view suggests that
export-orientated strategy is to attract more FDI flows than import substituting strategy.
According to this view, in import substituting strategy, size of domestic market is so small
for foreign firms and they do not need to use their best technologies, marketing and
international distribution networks to produce for only domestic market (Kokko et. al.,
2001). It is observed that MNCs prefer to transfer new and advanced technologies to their
affiliates in developing countries with export-market oriented and these create higher
technology diffusion to domestic firms (Dutz et al., 2005). Empirical findings on different
countries have produced mixed evidences on this argument. A number of studies find
positive spillovers for countries with export oriented policy, while others find positive
evidences for countries with domestic-oriented policy (Kokko et. al., 2001).

41
Intellectual Property Rights (IPR): The policies of the host country in terms of IPR are
also affecting the decisions of MNCs whether to invest or not in the host country, thus the
occurrence of spillovers. If there is no any protection about the IPR, MNCs generally prefer
not to invest in that country, or they prefer to bring with them low-technological level
product and production process technologies.
The Foreign Investment Policy: This argument suggest that foreign trade-related
investment measures and government policies such as foreign ownership restrictions,
incentives, substitutions, local content requirements, minimum export measures, duties etc.
impact on FDI inflows and thus the technology spillovers accompany those inflows
(Blomström et. al., 2001). With the accelerating globalization wave, government incentives
for foreign investment have become much more important to attract FDI and it is considered
as one of the important determinants of spillovers (Kokko, 2003).
The Structure of the Financial Sector: It is another key determinant factor. It is expected
that host countries with higher developed financial market facilitate the spillovers to local
firms. In this case, foreign or local firms who are in need of capital can be established by
barrowing from financial markets at relatively lower costs, and firms can focus on engaging
in their production activities (Alvaro et al. 2004).
Competition Level: According to results of some studies, competition level of the host
country may be a factor that affects spillovers from MNCs. However, findings could not find
consistent evidences. Some of the authors argue that competition level may negatively affect
spillovers due to high costs in order to obtain advanced technologies (Blomström et. al.
2001; Barry et. al., 2005), while others suggest that high competition level encourages
MNCs to transfer more advanced technologies and this enhance the spillovers to local firms
(Wang and Blomström, 1992; Kokko, 1996; Sjöholm, 1999a).
Location Advantage: Location advantages of host country where investment will be made
also determine the decision of a MNC whether to enter a given market or not, and its
interaction level with host economy and local firms. Moreover, quality of the FDI flows and
firm specific assets that will be brought by MNC depend on these advantages (Narula and
Marin, 2003). MNCs generally prefer to invest in countries where there is the opportunity to
export to neighboring countries, in other words, they invest in the host country in order to
use it as a production base for neighbor countries.

42
2.5.4. Firm Characteristics
Another important factor that affects the occurrence of spillovers is characteristics of the
firms in host country such as export intensity, size, age, human capital, ownership status,
R&D capability, and so on.
Export Orientation: It is argued that export orientated firms less benefit from spillovers
associated with foreign firms in host country because they already produce for foreign
markets and face significant competition in these markets. Therefore, it is expected that their
capabilities are very high and they do not need to create extensive linkages with MNCs in
host country (Blomström and Sjöholm, 1999). According to this view, non-exporting local
firms will be benefited more from technology spillovers.
Size: In a similar case, it is expected that firms with larger size (in terms of production,
turnover and employment) benefit more from spillovers because small firms do not have
enough capacity to compete with MNCs, and to imitate technologies and systems used by
MNCs. Aitken and Harrison (1999) in their study for Venezuela confirmed this hypothesis.
However, in the literature there are studies that find the opposite results. For instance, Girma
and Wakelin (2001) and Sinani and Meyer (2004) find that small-sized firms benefit more
from FDI spillovers.
Human Capital and R&D Capability: The other factors are the human capital and R&D
capability of the local firms. The studies point out that firms which have higher educated
employee or higher R&D capability benefit more from the presence of foreign firms (see
Blalock and Gertler, 2004; Kinoshita, 2001; Kathuria, 2000).
Technological Capability: As proposed in the literature, assimilating knowledge and
technology and benefiting from technology spillovers from MNCs depends on both “the
complexity of the technology transferred” and on the technological capability of recipient
firms that is measured by the absorptive capacity. Evidence for the absorptive capacity of the
firms can be interpreted and measured in many ways. Some of the proxies used to measure
“the technology gap” or “absorptive capacity” of the recipient firms can be summarized in
this way: the difference between the firm's labor productivity and the average labor
productivity of foreign firms in the sector; R&D expenditures; payments on patents; capital
intensity; export intensity; number of patents; number of engineers, educated and skilled
workers.

43
The studies on various countries have produced supporting results on positive relationship
between technology capability and spillovers. For instance, Kokko (1994), in his study for
Mexico, concludes that technology spillovers occur only in sectors in which technology gaps
between foreign and local firms are not too large. In another study for Uruguay, Kokko et al.
(1996) found that local firms with low technology gap with MNCs could benefit and absorb
the knowledge transfers from MNCs. In a similar way, Girma et al. (2001), using firm-level
panel data for UK, found evidence for spillovers to local firms with a small gap between
their productivity level and the industry productivity level. In another study for Spanish,
Barrios and Strobl (2002) showed that there were positive spillovers from foreign presence
to export orientated local firms but not to domestic-orientated local firms. In a similar study,
Blomström and Sjöholm (1999) also found that technology spillovers were restricted to non-
exporting local firms. They proposed that export orientated firms are using more advanced
technologies and also they exposed to international competition, therefore their technological
capabilities are high, and in result of these, they benefit more from positive spillovers than
non-exporters do. Kinoshita (2001), in his study for the Czech Republic, also found evidence
of positive spillovers for local firms with high R&D capability. In similar way, Keller and
Yeaple (2003) in their study for the USA showed the evidence of positive FDI spillovers for
the firms operating in high-tech sectors and conducting R&D activities. The studies once
more reveal that absorptive capacity matters for spillovers. Therefore, it can be hypothesized
that local firms, which have high technological capabilities and skilled human capital, with
lower technology gap with MNCs may absorb and assimilate the spillovers more easily from
MNCs (for more details, see Görg and Greenaway, 2004).
Geographic Location: Another characteristic that affects the technology spillovers may be
the geographic location of the firms. Several studies have investigated the role of geographic
dimension in order to benefit from spillovers. These studies hypothesize that spillovers from
foreign firms would be received firstly by their neighbor local firms and then they diffuse to
more distant local firms, therefore benefiting from spillovers is higher for the firms located
nearby MNCs (Audretsch and Feldman, 1996; Audretsch, 1998; Aitken and Harrison, 1991
and 1999). In other words, technology spillovers decrease with distance. Some of these
studies failed to find evidence of spillovers at the regional level (Sjöholm, 1999a, for
Indonesia), some found negative spillovers for the same sector in any region of the country
(Aitken and Harrison, 1996 and 1999 for Venezuela), and some found evidence for positive
spillovers in the same region and sector (Aitken and Harrison, 1991; Girma and Wakelin,
2001, for UK).

44
As can be seen from the studies in the literature, the determinants of technology spillovers
have produced contrary results and these make it difficult to reach a definite conclusion
about most of the determinant factors. However, the common result among them is the
importance of the absorptive capacity of both recipient firms and host country to benefit
positively from spillovers (Crespo and Fontoura, 2007: 420).
2.6. Empirical Studies on Technology Spillovers and
Transfer
2.6.1. General Information
In the literature, a number of surveys exists that review theoretical and empirical studies on
spillovers through FDI10
. These identify potential sources of spillovers, then present findings
of available econometric studies and discuss reasons that may explain the positive or
negative effects of spillovers on the productivity of local firms in host economies.
In the theoretical literature, the studies on the effects of FDI on the host countries of MNCs
date back to the early 1960s. The first authors that systematically mentioned about
technology spillovers as a consequence of FDI were MacDougall (1960), Corden (1967),
Caves (1971, 1974) for Australia, Globerman (1979) for Canada, Blomström and Persson
(1983) for Mexico, respectively. In these studies, the authors generally tried to understand
the costs and benefits of FDI on host countries by impacting on foreign trade, taxes, balance
of payments etc. and they have analyzed whether the foreign presence has any significant
impact on the productivity of domestic firms by using cross-section or panel data. Caves
(1974) show that there is a positive relationship between the foreign share and productivity
level of domestic firms by using the share of foreign firms in employment at manufacturing
sector level. Globerman (1979) also find positive evidence of spillovers on domestic firms in
Canada manufacturing industry by using labor productivity as a dependent variable. In their
study, Blomström and Persson (1983) using labor productivity as a measure of efficiency
and relate this to capital intensity, labor quality, scale of production, foreign participation
and using different degree of concentration indices (herfindahl index) provide also support
for positive spillovers in Mexican industries by using cross-section data from the 1970
10
See Blomström and Kokko (1998); Görg and Greenaway (2001 and 2004); Saggi (2002); Haskel et. al. (2002);
Crespo and Fontoura (2007) for detailed literature review and theoretical discussions on technology spillovers.

45
census. In this kind of studies, the authors define dependent variable as the total value added
per employee in domestic firms, and define key independent variable as foreign share in total
employment or value added in order to use as a proxy for spillovers together with other
independent variables.
The importance of technology spillovers has emerged with the results of empirical studies
rather than theoretical studies11
. The empirical studies on technology spillovers from FDI
that provide important evidence on the presence and pattern of spillover effects can be
summarized under three types12
(Blomström and Kokko, 1998).
The first type is the studies at micro level by analyzing the impact of spillovers on
firm productivity.
The studies in second type are at the macro level and analyze the effects of spillovers
on the economic growth of host country.
The third type studies are in the form of case studies specific to an industry and these
studies are conducted to obtain information and to reveal unknown details of the
issues that cannot be captured by empirical studies (see Temenggung, 2006)13
.
The first two type studies mentioned above are generally in the form of econometrical
analysis about the relation between foreign presence and productivity of local firms, or about
the effects of foreign presence on the host country. These studies generally estimate a
production function and focus on productivity dependent variable such as labor productivity
or value-added of local firms and regress this on a range of explanatory variables
(concentration ratio, factor inputs, skilled human capital, scale of the firm, foreign ownership
etc.) by using cross-section or panel data while controlling for other potentially important
factors. In the literature, the studies that use panel data are seen more appropriate, reliable
and informative than those using cross-section data due to firm and sector specific factors,
and time effects, and because it is expected that spillovers can be detected in long-term due
to its dynamic nature (Aitken and Harrison, 1999; Haddad and Harrison, 1993; Görg and
Strobl, 2001). In other words, it is difficult to control for industry- and firm-specific factors
in studies “using cross-section data where the time dimension is absent”. For example,
MNCs may invest in most productive sectors to be benefit from high productivity levels, and
11
For theoretical studies, see Findlay (1978), Das (1987), Wang (1990), Wang and Blomström (1992). For some
early empirical studies, see Dunning (1958), Safarian (1966), and Gabriel (1967). 12
See Görg and Strobl (2001) and Blomström and Kokko (1998) for the details on this literature. 13
These studies are generally employed by using interviews and mailing questionnaires. For instance, see
Hobday (1995) and Kim (1997).
46
this may produce positive productivity spillover effect although “foreign presence is the
result, not the cause of high productivity levels observed in the sector”. Therefore, the
findings of the econometric studies using cross-section data are hardly reliable (Pamukçu
and Taymaz, 2009: 8). In addition, a set of proxy variables are calculated to analyze the
effects of spillovers from MNCs such as share of foreign firms in total output, in total sales
or in employment in a given sector. The evidences from literature also show that factors
affecting the spillovers depend on the characteristics of host country, sector, and firm.
As it can be seen from Table 2.1 below, according to the literature available, the empirical
studies on the importance of technology spillovers through FDI between MNCs and local
firms have produced mixed results. Some studies find positive spillovers, it means that
foreign presence impacts positively on the productivity of local firms, while some reveal that
spillover effects on domestic productivity from FDI may not produce significant results or
find negative spillovers. For instance, Haddad and Harrison (1993) for Morocco is
insignificant; Aitken and Harrison (1999) for Venezuela is negative; Djankov and Hoekman
(1998 and 2000) for Czech Republic is negative; Okamoto (1999) for Japan is ambiguous;
Kathuria (2000) for India is ambiguous; Konings (2001) for Bulgaria and Romania is
negative and for Poland is ambiguous; Li et. al. (2001) for China is ambiguous.
The last type is the case studies focusing directly on spillovers that analyze linkages between
MNCs and their local suppliers by focusing on technology transfers (see Larrain et. al., 2000;
Hanson, 2001). First case studies that produced evidence on technology spillovers to local
firms are Germidis (1977), Mansfield and Romeo (1980), Rhee and Belot (1989), and Mody
et. al. (1991). Case studies show that presence of MNCs may give rise to technology
diffusion to local firms by direct knowledge and technology transfers. For instance,
according to Blomström and Kokko (1998);
MNCs may transfer their techniques, quality systems, standardization procedures to
their local suppliers in order to upgrade their capabilities and to be sure about the
quality of the products,
They force local suppliers to increase their managerial capabilities and to adopt
marketing techniques used by MNCs,
They may provide know-how by demonstrating new technologies and by training
workers of local suppliers,
47
They increase the efficiency and productivity of local firms by forcing them with
competition with other potential suppliers and by demanding lower prices for the
products supplied.
These case studies have given some important clues about spillovers from MNCs; however
they say little about how these spillovers occur, what are their intensity; channels and
determinants, and how important they are in general. To analyze these questions, an ideal
study of technology spillovers from MNCs would require a large number of detailed micro
data at firm level, both quantitative and qualitative, and would have to cover several years
since spillovers are not occur instantaneously so that it would be possible to make significant
conclusions (Blomström and Kokko, 1998). To the best of our knowledge, a few
comprehensive analyses of such studies have been made (see, Larrain et. al., 2000; Moran,
2001; and Keller, 2004). Therefore, we also focus on this type of study besides econometric
spillover analysis in this dissertation and we believe that future research should be focus on
this type studies.
2.6.2. Evidence on Developed and Developing Countries
It is seen that the empirical studies on developed countries generally have provided
consistent results that foreign presence positively affects the productivity of local firms, in
other words, they find positive spillovers (for instance, Caves (1974) for Australia;
Globerman (1979) for Canada; Nadiri (1991) for France, UK, Japan, and Germany; Griffith
(1999), Liu et al. (2000), Driffield (2001), Haskel et. al. (2002), Harris and Robinson (2003)
for UK; Barrios and Strobl (2002) for Spain; Görg and Strobl (2003) for Ireland; Keller and
Yeaple (2003) for USA). On the other hand, the studies on developing countries have not
produced consistent results; while a number of studies find positive spillovers, some find
negative or insignificant (ambiguous) results on spillovers (see Görg and Greenaway, 2004
for further details on productivity spillovers in developing, developed as well as in transition
economies).
Table 2.1 below based on information provided in Görg and Greenaway (2004) displays the
results of some empirical studies on spillovers conducted by various authors at firm or
industry level in manufacturing industries of developing countries in terms of country, period
covered, type of dataset used (cross-section or panel data), aggregation level (industry or
micro-level data) and the results obtained. For instance; Haddad and Harrison (1993) for

48
Morocco could not find any evidence of technology spillovers at micro or industry level by
using five years panel data for the period 1985-89; while Blomström and Sjöholm (1999) for
Indonesia find positive spillovers at micro level by using cross-sectional data on 1991.
Djankov and Hoekman (1998 and 2000) for Czech Republic find negative spillovers at micro
level by using four years panel data for the period 1993-96. Moreover, Aitken and Harrison
(1999) show that there are negative effects of foreign investment at micro level on
domestically owned plants in the Venezuelan manufacturing sector by using fourteen years
panel data for the period 1976-89. Kokko (1994 and 1996) studied for Mexico at industry
level by using cross-sectional manufacturing data for the period 1970. He finds evidence for
positive spillovers and suggests that the effects of technology spillovers on local firms are
conditional on the technology level of local firms. Kokko created three independent variables
in order to test spillovers which are average patent payments per employee, average capital
intensity of foreign firms, and labor productivity gap between local and foreign firms at
industry level.
Table 2.1: Empirical Studies on Spillovers in Developing Countries
Source: Extracted from Görg and Greenaway (2004: 177-178)
Note: Micro data may be firm-, establishment- or plant-level data.
Author Country Period Data Aggregation level Result
Blomström and Persson (1983) Mexico 1970 Cross-sectional Industry +
Blomström (1986) Mexico 1970-1975 Cross-sectional Industry +
Haddad and Harrison (1993) Morocco 1985/89 Panel Micro and Industry ?
Blomstrom and Wolff (1994) Mexico 1970-1975 Cross-sectional Industry +
Kokko (1994) Mexico 1970 Cross-sectional Industry +
Kokko (1996) Mexico 1970 Cross-sectional Industry +
Kokko et al., (1996) Uruguay 1990 Cross-sectional Micro ?
Blomström and Sjöholm (1999) Indonesia 1991 Cross-sectional Micro +
Sjöholm (1999a) Indonesia 1980-91 Cross-sectional Micro +
Sjöholm (1999b) Indonesia 1980-91 Cross-sectional Micro +
Chuang and Lin (1999) Taiwan 1991 Cross-sectional Micro +
Aitken and Harrison (1999) Venezuela 1976/89 Panel Micro -
Djankov and Hoekman (2000) Czech Rebublic 1993/96 Panel Micro -
Kathuria (2000) India 1976/89 Panel Micro ?
Kokko et al. (2001) Uruguay 1988 Cross-sectional Micro ?
Zukowska-Gagelmann (2000) Poland 1993/97 Panel Micro -
Kugler (2001) Colombia 1974/98 Panel Industry ?
Kinoshita (2001) Czech Rebublic 1995/98 Panel Micro ?
Bosco (2001) Hungary 1993/97 Panel Micro ?
Konings (2001) Bulgaria 1993/97 Panel Micro -
Poland 1994/97 ?
Romania 1993/97 -
Damijan et al. (2001) Bulgaria 1994/98 Panel Micro ? Or -
Czech Rebublic + only for
Hungary, Poland Romania
Romania, Estonia
Slovakia, Slovenia
Li et al. (2001) China 1995 Cross-sectional Industry +
Lopez-Cordova (2002) Mexico 1993/99 panel Micro -, ?
Görg and Strobl (2002) Ghana 1991/97 Panel Micro +
Javorcik (2004) Lithuania 1996/2000 Panel Micro ?

49
As it can be seen from the above Table, the effects of spillovers among countries are
different. In these studies, besides they refined and extended over time, same econometric
models and estimation techniques have been used; especially a regression with a proxy
variable of productivity used for dependent variable – labor, gross output or total factor
productivity – is regressed on an indicator of foreign presence at the sector level (foreign
share in total employment, in output, in sales etc.) and a number of control variables (share,
herfindahl index, scale, exports, size, age and so on) supposed to be correlated with the
dependent variable.
2.6.3. Evidence on Turkey
In this section, some of the empirical studies on spillovers for Turkish manufacturing
industry will be reviewed in detail. Empirical studies on spillovers for Turkey which have
started especially after 2000s are very limited and they all concern the pre-2001 period
where annual FDI flows to Turkey were rather low (see Table 2.2). It seems that there are
three important reasons for the limited studies on this issue. One of the important reasons is
due to fact that FDI flows to Turkey were very low till the end of the 1980s. According to
statistics, total FDI inflows to Turkey were nearly US$ 10,7B between 1974 and 2000,
corresponding to an annual average of US$ 400M for 26 years. The average annual FDI
inflows were nearly US$ 800M in 1990s, while US$ 200M in 1980s. However, FDI flows
into the country increased steadily after 2001; total cumulative net FDI inflows were reached
to nearly US$ 100B for the years 2001-2010 (see section 3.2). To the best of our knowledge,
no study, however, has yet been conducted for post-2001 period for Turkey and this points
the importance of conducting this dissertation on spillovers for the Turkish economy. The
second reason is the globalization polices in 1980s that encouraged all countries to
implement liberal policies. Therefore, Turkey has also started to liberalize its economy in
1980s by changing its policy to export-promoting industrialization and by opening its doors
to foreign investment. The last reason is the unavailability of appropriate data at the sector or
firm-level in order to study spillovers that the situation is still valid even in 2000s
(Aslanoğlu, 2000).
Aslanoğlu (2000) is seen as the first econometric study analyzing the effects of FDI on
Turkish manufacturing industry. He tried to analyze spillovers effects by using the cross
sectional data for the year 1993 from the survey data of Istanbul Chamber of Commerce

50
(ICOC) on the largest 500 industrial firms of Turkey14
. He constructed five single equation
econometric models. The aim of the first two models is to estimate the effect of foreign
presence15
on the productivity and competitiveness of domestic firms. The results show that
foreign presence increases competition in domestic industries, while it has no any significant
impact on the productivity of domestic firms. Other two models are constructed to analyze
the impact of technology gap between domestic and foreign firms on the productivity and
market growth of domestic firms. However, he could not find significant relation between
those variables. In final model, the impact of the initial technology gap on the change in
technology gap is analyzed, and a significant correlation is found between such variables.
In their study, Alıcı and Ucal (2003) examine the effect of liberalization process on
economic growth of Turkey by emphasizing the export led growth (ELG) strategy. The
authors aim to find a causal link between exports, FDI and output by conducting unit root
and the Granger non-causality tests from 1987-I to 2002-IV. For this aim, three variables are
utilized: export price index, industrial production index and FDI flows into Turkey. The data
for the first two variables come from TurkStat, and from Undersecretariat of Treasury for
FDI variable. The results neither produced significant positive spillovers from FDI to export
nor a kind of FDI-led export growth linkage. In other words, results do not confirm the
existence of FDI-growth relationship. They suggest that policies should focus on attracting
more FDI in order to gain the spillovers to output and FDI-led export growth.
In their empirical study, Taymaz and Lenger (2004) provide evidence in favor of negative
spillovers in Turkish manufacturing industry. The authors examine the productivity
spillovers from MNCs by using panel data from TurkStat at industry level over the period
1983-2000. The data consist of 28 industries in 3-digit level in various categories such as
public firms, and private small, medium and large sized firms in Turkey (Taymaz and
Lenger, 2004: 2). The study investigates the role of the size of the recipient firms, the
intensity of the R&D activities, the ownership structure, and whether spillovers change by
time or not. Although the results show that spillovers from MNCs differentiate with respect
to size of the recipient firms and by time, the study reveals the negative spillovers for the
domestic sectors.
14
He uses 1993 data for the analysis, however data of the year 1988 is also used for some independent variables
due to lack of data. 15
Various proxies are used in these models for foreign presence such as the share of foreign firms in total
employment, total sales, total value added and total net assets of an industry (Aslanoğlu, 2000: 1122).

51
Lenger and Taymaz (2006) also examine empirically the innovation and technology transfer
activities of local and foreign firms in Turkish manufacturing industry. The authors construct
a model for estimating the impacts of horizontal, vertical and labor spillovers on
technological activities of firms by taking into account two dummy variables: in-house
innovative activities and technology transfer from abroad. They also test whether foreign
firms are more innovative and/or whether they transfer technology mainly from abroad, and
whether they have any impact on the technology transfer decisions of local firms. The data
used for innovativeness dummy variable come from the two innovation surveys conducted
by TurkStat and cover the periods 1995-1997 and 1998-2000. On the other hand, the data for
technology transfer dummy variable come from the “Annual Structural Business Statistics”
survey conducted by TurkStat for the same periods. In the analysis, several proxies are used
for horizontal, vertical and labor spillovers. The three proxies for horizontal spillovers are
the market share of foreign firms, the ratio of foreign firms’ R&D expenditures to total
output in the province in which firm operates and at the industry level. The two variables
used as proxies for vertical spillovers are the proportion of firm’s inputs produced by foreign
firms and the proportion of firm’s output used by foreign firms. These proxies measure the
weighted average of foreign market share in supplier and user industries, respectively. In the
calculation of these proxies, the input (the one sector’s share in inputs used by another
sector) and output (the share of one sector in total consumption of another sector’s output)
coefficients of the sectors are also calculated by benefited from the 1996 Input-Output Table
of Turkish manufacturing industry. The last proxy used for labor turnover is the ratio of the
number of separations from foreign firms to the total number of employees in a given sector.
The authors find that foreign firms are more innovative than their local counterparts, and
transfer technology mostly from their parent firms in overseas. In addition, they show that
horizontal spillovers are insignificant, while vertical spillovers are ambiguous. The major
finding of the study is that labor turnover is the main channel of spillovers by emphasizing
the importance of tacit knowledge. Also, the findings confirm that technology cannot easily
be transferred through passive mechanisms such as demonstration effects, reverse
engineering, etc. (Lenger and Taymaz, 2006: 152).
In another study, Ayvaz and others (2006) analyze the effects of FDI on both labor
productivity and the relationship between capital efficiency and labor productivity by using
dummy variables regression model in Turkish manufacturing industry. The data used in the
study is obtained from “the largest 500 industrial firms of Turkey” report conducted in 2001
by the Istanbul Chamber of Industry (ICI). The sample consists of 199 firms in total,
specifically 19 foreign firms with full ownership, 159 local firm with no foreign ownership,

52
and 21 public firms. The authors find significant positive spillover of foreign capital on labor
productivity, and suggest that local firms should increase their capital and labor resources to
compete successfully with foreign firms. However, the study is seen very problematic since
it covers a very small sample to conduct this kind of analysis and also actually does not
examine spillover effects, only the difference between foreign and local firms in terms of
productivity efficiency is tested. Therefore, the findings of this study are not reliable enough
(Aksoy, 2008: 49).
Another empirical study analyzing the direct and indirect effects of foreign ownership on
productivity by using firm-level unbalanced panel data for the period 1990-1996 in the
Turkish manufacturing industry is the Taymaz and Yılmaz (2008a). The authors use the
Olley-Pakes production function estimates for productivity and OLS regression analyses to
test the horizontal and vertical linkages. The sample consists of firms with 25 or more
employee due to lack of key variables needed for the study in the 10-24-size group and
sample is limited only on private establishments. In the calculation of linkages, the authors
benefit from the sectoral output shares of foreign firms and Input-Output matrix in 1990 to
identify linkages across plants. Based on Olley-Pakes approach using total factor
productivity, they find that foreign firms are more productive than their local counterparts.
Also, majority foreign owned firms are more productive than minority foreign owned foreign
firms, and fully foreign owned firms are more productive compared to majority foreign
owned ones (Taymaz and Yılmaz, 2008a: 31). In addition, when industry based measures of
linkages are used, they find that productivity spillovers from foreign firms to local firms
occur through horizontal and vertical linkages. However, the authors argue that there is a
very high correlation between horizontal and vertical linkage measures so that the findings
may generate false results with industry based measures. Therefore, they use product-based
measures of linkages in order to overcome multicollinearity problem. In this case, the results
mostly lose their economic and statistical significance compared to industry based measures
of linkages, and they find positive significant spillovers occur through backward linkages
only.
In their paper, Bertinelli and others (2006) examine the impact of horizontal FDI spillovers
on firms’ productivity in Turkish manufacturing industry. Also, the author’s test the effect of
technology gap which is measured by the distance between local firms’ productivity and that
of the industry leader at the four-digit level (relative productivity). The study uses panel data
at firm-level obtained from the “Annual Surveys of Manufacturing Industry” of TurkStat and
covers the period 1983-1994. The authors estimate a productivity equation by using OLS as

53
well as FE methods. An index of total factor productivity in local firms is used as the
dependent variable in the productivity equation. Moreover, to analyze productivity
spillovers, four different proxies for spillovers based on the extent of foreign presence at the
sector level are constructed: the share of foreign enterprises in the number of employees or in
gross output at the four-digit sector level, and the indicators of foreign presence for
enterprises with foreign equity is at least 10% of their capital and for those with majority
owned foreign firms (at least 50%). Besides control variables, three firm-specific variables
are constructed in the study: the share of skilled labor in total employment (skill level); the
ratio of firm sales to total sales of its four-digit sector (market share); the ratio of a firm’s
gross output to that of sector-level average firm (scale). The authors also introduce two
sector level variables in the productivity equation to measure different aspects of the degree
of competition: “the share of imports in the domestic demand at the four-digit sector level to
domestic demand (import penetration)” and variables account for the market structure
prevailing at the four-digit sector of the firm by using two alternative indicators: the share of
the four largest firms in sales at the four-digit sector level (CR4) and the Herfindahl index of
concentration of sales (Herfindahl index). The findings show that foreign firms do not
generate any spillover that impact positively on local firms’ productivity levels. Conversely,
all four proxies for spillovers produce evidence of negative spillovers on local firms’
productivity levels.
Another attempt to investigate the horizontal technology spillovers through FDI in the
Turkish manufacturing industry is made by Aksoy (2008). The analysis on spillovers is
conducted over the period 1983-2001 at sector level by using the dataset of TurkStat
including sectoral level determinants of 89 different sectors. Sectoral market shares of the
foreign firms are used as proxies for horizontal spillovers. The author also divides the sample
into high-tech and low-tech industries in order to test spillovers. In the study, a production
function in the form of Cobb-Douglas is estimated by OLS and FE methods. The findings of
the study have produced positive evidences on horizontal spillovers in sectoral level.
In a similar study, Pamukçu and Taymaz (2009) examine empirically the existence of FDI-
related productivity and wage spillovers in the Turkish manufacturing industry by using the
panel dataset of TurkStat over the period 1983-2001. The study is carried out at firm-level,
and a production function approach in the form of Cobb-Douglas is adopted in order to
assess the impact of horizontal spillovers on firm-level total factor productivity. Firm-level
output measured by its gross output is used as dependent variable, while firm’s capital stock,
labor, raw materials and energy inputs are used as explanatory variables. Market share of

54
foreign firms at sector level and at the regional level are used as two proxies for horizontal
spillovers. Also, firm- and sector specific variables are added to equation in order to control
for the influence of other determinants of firm-level total factor productivity and to avoid an
omitted variable bias. In the estimation of productivity spillovers, FE estimation method is
preferred to use in order not to suffer from an omitted variable bias due to unobserved time-
invariant firm-specific factors. On the other hand, a dynamic wage bargaining model based
on McDonald and Solow (1981) is used in the econometric analysis of wage spillovers. This
wage model is empirically tested by using both FE method and Generalized Method of
Moments (GMM) a la Arellano-Bond (see Pamukçu and Taymaz, 2009: 57). The findings of
the study show that FDI related productivity spillovers exert a negative effect on the
productivity of domestic firms and to a significant and positive impact on the wages paid by
domestic firms.
Çetin (2009) also investigates the determinants of technology transfer decisions of firms in
Turkish manufacturing industries by using probit model. The dataset used in the study is
based on merged data set of both 2003 and 2004 “Structural Business Statistics” survey
conducted by TurkStat at enterprise level. The dependent variable is a dummy variable as the
firm’s decision to transfer technology, and the author uses the “expenditure on licenses,
patents and trademarks” as a proxy for such variable. If the expenditure of a firm on licenses,
patents and trademarks is positive then it is assumed that technology transfer decision equals
to one. The firm-level factors tested are size, skilled labor, capital intensity, expenditure on
R&D, and dummy variables for export and import intensity and foreign ownership of the
firms. Also, sector level variables are import penetration, herfindahl index, sectoral license
expenditure, share of foreign-owned firms’ output and sector dummies classified according
to technology levels. The findings of the study show that firm size, general skill level, export
behavior and capital intensity have significant effect of technology transfer decision of the
firm, while foreign ownership does not. Sectoral characteristics’ effects are also statistically
significant.
The effect of human capital on the productivity spillovers from FDI to domestic firms in
Turkish manufacturing industry is investigated by Köymen and Sayek (2010) over the period
1990-2001. In their paper, the role of human capital of local firms is analyzed in order to
reveal that through which channel of linkages (horizontal, backward or forward) it enhances
the local firms' total productivities and acts as an absorptive capacity. In the study, total
factor productivity (TFP) of the firms is estimated by using Levinsohn-Petrin methodology
based on firm-level unbalanced panel dataset obtained from TurkStat. Then, TFP is

55
regressed on three industry-based linkages such as backward, forward and horizontal to test
the spillovers from FDI. The findings of the study have produced evidence on positive
productivity spillovers through backward linkages, while no evidence on horizontal and
forward linkages that play a role in contributing to the productivities of local firms. One of
the important result of the study, although the study does not take into account the role of the
firm characteristics on spillovers, it proposes that such characteristics are important
determinants of spillovers from FDI and they should be taken into consideration in the
spillover analysis.
Table 2.2 below summarizes the empirical studies on spillovers for Turkish manufacturing
industry mentioned above. The Table provides a comparison of the studies in terms of period
covered, data used, aggregation level, estimation method and the result obtained. As can be
seen from the Table, the findings of previous studies on FDI-spillovers are pertaining to the
pre-2001 period.
Table 2.2: Empirical Studies on Spillovers for Turkey
Legend: Istanbul Chamber of Commerce (ICOC); Istanbul Chamber of Industry (ICI)
Author Period DataData
Source
Aggregation
level
Estimation
MethodResult
Aslanoğlu (2000) 1993Cross-
sectionalICOC Micro OLS ?
Alıcı and Ucal (2003) 1987/2002 Series TurkStat Industry
Granger non-
causality
analysis
No significant effect
Taymaz and Lenger (2004) 1983/2000 Panel TurkStat Industry
Arellano-Bond
type of GMM
estimation
-
Ayvaz et. al. (2006) 2001Cross-
sectionalICI Micro
Regression
Analysis+
Lenger and Taymaz (2006) 1995/2000 Panel TurksStat MicroOLS (binary
choice model)No significant effect
Bertinelli et. al. (2006) 1983/94 Panel TurkStat Micro OLS and FE -
Taymaz and Yılmaz (2008a) 1990/96 Panel TurkStat MicroOlley and
Pakes/OLS+ Backward Spillovers
Aksoy (2008) 1983/2001 Panel TurkStat Industry OLS and FE + Horizontal Spillovers
Pamukçu and Taymaz (2009) 1983/2001 Panel TurkStat Micro FE and GMM -
Çetin (2009) 2003-2004Cross-
sectionalTurkStat Micro Probit
Firm size, skill level,
export, and capital
intensity have
positive effect on
technology transfer
Köymen and Sayek (2010) 1990-2001 Panel TurkStat MicroLevinsohn-
Petrin+ Backward Spillovers

56
Consequently, empirical studies on whether the MNC-based technology spillovers have an
effect on the performance of the local firms, and if yes, the direction and dimension of the
effect, yields controversial results differing from each other. It is seen that empirical studies
produce mixed results that some provide negative results, while some produce positive
results either significant or significant. Therefore, we can say that there is no consensus on
the effects of spillovers from MNCs. The results vary depending on the different
econometric estimation methods adopted, type of the datasets used (cross sectional or panel),
aggregation levels at sector or firm level, various methodological problems, different proxies
used for spillovers, different foreign share variables, unidentified factors, country concerned,
sector specific factors, different time periods analyzed etc. in the empirical studies. For a
comprehensive evaluation of the econometric studies conducted on the effect of the MNC-
based technology spillovers on the performance of the firms, see Görg and Greenaway
(2004) and Smeets (2008). Although these empirical studies based on published formal data
have produced very important results in terms of the positive effects of FDI on host country
and existence of positive benefits from FDI, they are not able to provide sufficient
information about how these benefits take place, in what forms, and by which channels.
Therefore it is necessary to conduct more detailed case study researches as done in this
dissertation in order to questions and to understand the real situations at firm level and in
order to clarify the determinants, channels and dynamics of the technology spillovers that
take place.
2.6.4. Reasons for Failure of Realizing the Technology Spillovers or
for their Negative Effect on Firm Performance
The reasons why there is no technology spillover from the MNCs to the local firms in host
country or they are not adequate could be linked to many factors. The main reasons mainly
based on Aitken and Harrison (1999) could be summarized as follow:
The workforce circulation (labor turnover) among the local and foreign firms is
limited (especially due to high salaries in the MNCs),
There are only a few local firms to render sub-contracting/supply services from MNCs
(the MNCs' bringing along their own suppliers with them),
The local firms do not perform any R&D activities or that they are inadequate (may
hinder collaborations to be established with the MNCs),

57
Lack of experience of the local firms in the areas of production, manufacturing,
quality and engineering,
The MNCs are not so inclined favorably towards knowledge spillover to their local
rivals. They may apply specific policies in order to protect their advantages and to
prevent spillovers to local firms,
The market share of the local firms diminishes or their operation ceases due to their
failure to compete with the MNCs,
The local firms do not have the capability to absorb the potential technology spillovers
from the MNCs (especially due to the huge difference between the technological
capabilities of the local and foreign firms).
2.7. Theoretical Framework for Case-Study Research
2.7.1. General Information
The relevant literature contains a few studies conducted on the technology transfers. These
could be grouped under three main topics in terms of the method employed. The first is the
case studies that are didactic and illuminating in that they provide highly valuable, embedded
information if there is a lack of data and information on the subject being studied. The
second is the econometric studies conducted based on various data at the industry and firm
level. The last is the studies where the two above are used together in a complementary way
such as our study.
Recently, there has been a growing interest in the econometric analysis of the technology
transfers realized to the firms in the developing countries. When the international literature is
reviewed, it is seen that many studies conducted on the econometric estimations of the
technology transfers realized to the firms in developing countries are in general based on the
observations obtained from the manufacturing industry statistics published regularly or from
the annual industry reviews gathering input-output data. In general, the following results
have been obtained from these studies: If the local firms in developing countries conduct
more activities in the international markets, if the year of foundation of the MNC affiliates in
developing countries are recent, if the domestic market of the developing country is larger,
and if the share of the foreigners in the affiliation established in developing country is
higher; the technology transfers used by the local firms are more important (Grosse, 1996).

58
However, the findings obtained from such econometric studies are less illuminating than the
findings obtained from the substantial case studies.
Case studies provide important clues about the firms that will contribute to our
understanding the transfer process deeper and better, and especially help us to extract the
deep-buried information on the subject being studied, if there is a lack of econometric data
concerning the manufacturing industry, and help us to grasp the sector as the subject of the
study better (Pack, 2005). Such kinds of studies where the researchers collect the relevant
data by themselves ensure both that the complex subjects are understood better and that more
substantial data are generated (Bigsten et. al., 2002). When we look at the empirical studies
conducted on the technology transfer, we could see that most of the studies on certain sectors
have been conducted in the form of case studies, since there is no detailed data at micro level
regarding the firms. We also see that many of the micro- and significant data have been
obtained from the substantial case studies conducted on the firms (Pack, 2005). Case studies
are not only informative but also present a profound definition of the factors that determine
the international technology transfer. For instance, the question whether the FDI made by
Intel in Costa Rica in 1990s has brought along any technology transfer or not was analyzed
by Larrain et. al. (2000). This study is informative and illuminative in that the authors made
interviews with top managers of Intel and authorities of Costa Rica government and tried to
understand their ideas, concerns and motivations. Therefore, the information at the firm level
that will contribute to understanding better the findings on the details and processes of the
technology transfer are obtained by means of case studies. However, it is apparent that
supporting the studies conducted in the form of case studies - as is the case with Intel - with
econometric studies is important (Keller, 2004). In general, it could be said that the
econometric and case studies complement each other.
2.7.2. Technology Transfers at Intra- and Inter-Firm Level
In the literature, it is mentioned about many channels through which domestic firms may
benefit from technology transfers from MNCs. Some studies point out the two main channels
of international technology transfer: (i) joint venture partnership of local firms with foreign
firms and (ii) “contractual agreements” signed with foreign firms such as “licensing
agreements”, “turnkey contracts”, “technical, management or service contracts”,
“international subcontracting” etc. (see section 2.1.4) (Techakanont, 2002: 13; Pack and
Saggi, 2001). Furthermore, some studies specify three other main channels by emphasizing

59
the relationships between source and recipient: (i) “arm’s length trade of technology”, (ii)
intra-firm technology transfer and (iii) inter-firm technology transfer. Figure 2.1 shows the
inter- and intra-firm technology transfer channels that occur between source and recipient.
Figure 2.1: Intra- and Inter-Firm Technology Transfers
Source: By the author, based on ideas of Techakanont (2002:19-21)
Note: Lines with thicker dashes show intra-firm linkages between firms, while thinner ones show
inter-firm linkages between such firms.
First channel is the “arm’s length trade of technology” in which recipient acquires the
technology through agreements signed with the independent technology source and in
return make royalty payments for such technology (Techakanont, 2002).
Second one is the “intra-firm” technology transfer in which there are strategic
relationships between source and recipient which are interdependent (see Figure 2.1). In
this case, source has some equity partnership with the recipient in the form of joint
venture, or with foreign affiliate in host country (Techakanont, 2002: 19). In other words,
some equity of the recipient is owned by the source. In this case, source (MNC, foreign
firms or parent foreign company) provide various technology transfers and training
activities to local workers of the foreign affiliate in the host country because the affiliate
must be successful in order to get high profits, and this depends on the relationships
between such actors and the quality of the transfers provided (Hobday, 1995; Kim, 1997).
The third one is the “inter-firm” technology transfer in which the relationship is occurred
between buyer and supplier and there is no any equity partnership between such actors
which are independent (see Figure 2.1) (see Lall, 1980). This kind of relationship is also
called as buyer-supplier relationships. The relationship between such actors starts after
the supplier firm is evaluated according to buyer’s own criteria, and if the supplier is
in Turkey in World
Intra-Firm Transfers
Inter-Firm
Transfers
Inter-Firm Transfers
Geographic Boundary
MNCs (or global AMMs)
AMMs(or Affiliates of MNCs)
(100% owned, Joint venture or manufacturing under MNC licence)
Suppliers(no equity partnership)

60
selected and approved by the buyer than official relationship such as business contract
takes place (Techakanont, 2002: 20-24). To be selected by a buyer, supplier firms should
have some technological capabilities and skills in order to produce demanded products at
desired quality and cost level (see sections 7.5 and 7.6). In this case, buyers provide
various specific technologies to their suppliers without asking for money in order to
benefit from products supplied by demanding higher quality standards, improvements and
lower costs. Therefore, local suppliers may gain a chance to access such technologies,
and they must upgrade their capabilities according to specifications of buyers in order to
work together continuously.
As discussed above, it is expected that MNCs should provide more technology transfers at
intra-firm level relative to inter-firm level.
2.7.3. Forms of Technology Transfer at Intra- and Inter-Firm Level
Forms of technology transfers can be classified as formal and informal. MNCs actively
transfer technology to their suppliers in formal ways to ensure that products and services
supplied meet the technical specifications in terms of quality, cost, durability, and reliability.
Formal ways of the transfers can be summarized as FDI, the purchase of foreign machinery
and turnkey plants, foreign licenses, consultancies from special engineering firms, technical
services / assistances / specifications provided by foreign firms, technical licensing
agreements with foreign firms, providing of blueprints, and more generally mergers and
acquisitions (M&A) of low or high-tech foreign firms and so on. On the other hand, local
suppliers can try to increase their capabilities by using informal mechanisms in order to
supply competitive products to MNCs. Major informal forms for technology transfers are
OEM arrangements, international literature, labor turnover, observation, reverse engineering,
imitation etc. Although new technologies could be obtained only through formal channels,
informal technology transfers are seen most important in the literature for developing the
technology capabilities of local firms (see Kim, 2001; Ernst and Kim, 2002 for further
details).
Table 2.3 displays the forms of the technology transfers identified through case-studies
conducted in automotive, textile, and electrical machinery industries in ASEAN countries at
both intra- and inter-firm level (Techakanont, 2002: 22-24). Authors categorized the form of
technology transfers into three groups at intra-firm level: “operation technology”,

61
“improvement technology” and “development technology (means the creation of new
knowledge)”. As it can be seen from the Table, researchers also classify technology transfers
into nine and ten types depending on their observations (Techakanont, 2002: 23). Table also
shows the thirteen direct forms of technology transfers, occur from buyers to suppliers,
observed and identified in these studies at inter-firm level. Studies find that suppliers should
benefit from such transfers because of having formal relationship with buyers. MNCs send
their expert staff to give advice to their suppliers in host country about production, quality
control methods etc., and train local personnel of their suppliers. By these assistances,
suppliers improve their manufacturing technologies, quality control practices, design, R&D,
distribution and delivering methods. These kind of direct transfers (inter-firm transfers) have
occurred between firms and are not commonly observed. One of the aims of this dissertation
is to reveal the forms and intensity of technology transfers that are created between such
firms in terms of production, production process, and training.
Table 2.3: Forms of Technology Transfer at Intra- and Inter-Firm Level
Source: Extracted from Techakanont (2002: 24-26)
At Intra-Firm Level
Technology Level Yamashita (1991) Kuroda (2001)
1- Operation 1- Operation
2- Maintenance 2- Maintenance
3- Quality control 3- Quality control
4- Production management 4- Production control
5- Improved technology 5- Process improvement (Kaizen)
6- Molding 6- Development of mold/ die/ jig
7- Design 7- Development of equipment
8- Product development 8- New process technology
9- Engineering of new design
10- R&D of new products
At Inter-Firm Level (Wong, 1991)
- Advice on plant layout, equipment selection and operations planning
- Advice/training on quality management system and other “good manufacturing practices” (GMP)
- On-site audit of plant operation and troubleshooting of specific productivity problems
- Loaning of equipment and machinery, either temporarily or permanently
- Training of supplier staff through formal courses/seminars or informal consultations/visitations
- Product design specification and performance requirements
- Early supplier involvement in prototype development and value engineering stage
- Informal sharing of technical information and ideas among the technical staff of both companies
- Exposure to MNC system of managing and organizing manufacturing activities and observation of MNC
- Provision of a stable source of income to finance the investment .
- Sourcing of technical experts to solve specific technical problems encountered by the supplier
- Advanced indications on future quality/performance/features requirements and targets
- Testing and diagnostic feedback on quality and other dimensions of performance of supplier’s products
Operation
Improvement
Development 9- Equipment development

62
2.7.4. Theoretical Framework
It is pointed out that process of the technology transfer is completed when the recipient
internalizes, learns and transforms the technology transferred by source into their own
technology (or knowledge). In other words, it can be seen as the process of “the
internalization of knowledge” successfully from the source to their own. As a result of these
transfers, positive effects should be expected or observed on the recipient side such as
capability increases, performance increases or “productivity improvement” that “can take
any form of reduction of defect rate”, “delivery time”, “average costs” and “cycle time”
(Techakanont, 2002: 27-28) (see section 5.9). However, it is not so easy to reveal these
relationships at inter-firm-level because they are neither easily observable nor formal data or
information is available. This situation justifies our research design and methodology in this
field by conducting case-study approach for data collection at firm level. In the context of
the case study, we aim to analyze the technology transfers and their effects from two
perspectives:
One looks only at the suppliers in Turkish automotive industry as the recipient of the
technologies. In other words, we analyze the technology transfers in detail from
customers (AMMs in Turkey, MNCs in world, and other firms) to their suppliers at
inter-firm level (see Chapters 4, 5 and 6 and Figure 2.1). We conducted face-to-face
questionnaire survey with the suppliers in Turkey in order to collect firm-level
quantitative data. By this survey, we also want to reveal suppliers’ characteristics,
technology capabilities, competition structure, cooperated partners, R&D and
innovation activities etc. There is one caveat to this method; it can reveal technology
transfers occur from other customers not from a specific customer. This is rational
because suppliers have relationships with multiple customers so they expose
technology transfers from many customers. Therefore, it is not possible to analyze the
transfers provided by the selected specific customer (at least by this method).
Second perspective looks at the AMMs (as buyers or customers) operating in Turkish
automotive industry as the source of the technologies provided to suppliers at inter-
firm level. In this context, we also analyze the technology transfers from MNCs in
home country (global automotive manufacturers or parent companies) to their
affiliates (AMMs) in Turkey by taking into account first two types of channels
mentioned above at both intra-firm level (if AMM in Turkey is 100% owned by
MNCs or it is an affiliate of MNCs) and “arm’s length trade of technology” (AMMs
in Turkey manufactures under MNC license) (see Figure 2.1). For this aim, we

63
conducted in-depth semi-instructed interview method with the top-executives of
AMMs in Turkey to collect qualitative data (see Chapters 4 and 7). The interview
findings will be used also for the quantitative survey findings, obtained from
recipients in terms of inter-firm level technology transfers, in a complementary way.
2.7.5. Studies conducted for Foreign Countries
A few studies on technology transfer, that apply the data collection and analysis method
employed in this study to other countries, will be reviewed below.
Giroud (2003), reviewed in his study on Malaysia that whether the foreign main industry
companies operating in the electronics sector provide KTTs to the local firms through
backward linkages. In this study, both the questionnaire and personal interview methods
were used together to collect data and information at firm-level. 95 answers (a response rate
of 30%) were obtained by implementing questionnaire survey to 320 foreign companies in
the sector via mail in 1996. Also, in-depth interviews were made with 11 foreign companies
operating in the sector, based on their origin (4 American, 3 European, 2 Japanese, 1 Thai,
and 1 Singaporean). Unlike the path we have followed in our study, Giroud studied, by
means of implementing questionnaire survey via mail to the foreign companies in the sector,
what kind of transfers they made to their suppliers on products, production processes,
financial support and training, and how often. Under the same scope, he made the personal
interviews with 11 foreign companies he selected among the surveyed companies. In other
words, he studied the KTTs provided by the foreign companies operating in the main sector
to the local suppliers only from the viewpoint of the foreign companies realizing those
transfers, without contacting any local supplier firms. He tried to examine the questionnaire
and interview results for the study first of all through descriptive analysis, and then, by using
logistic regression analysis method, he reviewed the effects of the independent variables (age
of the firm, export rate, size of the firm, purchasing strategy, firm origin) determined based
on the data he obtained for 95 firms upon the KTTs. The results of the analysis showed that
the foreign companies realized KTTs to the local suppliers via training, but that those
transfers were inversely proportional to the duration for which the firms had been operating
in the sector. In addition, it was discovered that there existed a positive relationship between
export and transfers, and it was determined that the size of the firm, the origin of the foreign
companies and the characteristics of the products manufactured were the most important
factors explaining the transfers realized by the foreign companies. These findings are highly
64
consistent with our findings in the case study research for Turkish automotive industry that
will be mentioned later (see Chapters 5, 6 and 7).
Another studies – Techakanont (2002); Techakanont and Terdudomtham (2004) - analyzed
the evolution of the technology transfer between the main industry companies and local
suppliers in Thailand automotive sector. Also, they attempted to analyze the level of the
collaboration between the local firms and the main industry companies and the types of the
collaborations which the local firms needed to establish with the main companies so that
they developed their technical skills.
Techakanont (2002) used the case study and questionnaire methods in the study. He
conducted personal interviews with the top-level managers assigned in the Thai affiliate of a
Japan-origin global automotive manufacturer in 2000. Also, he implemented the
questionnaire survey to 26 supplier firms of this Japan automotive manufacturer that were
located in Thailand.
Techakanont and Terdudomtham (2004), on the other hand, attempted to analyze – by using
the same research method – what kind of developments were occurred in relationships
between the main companies and the suppliers in the Thai automotive sector. To this end,
during 2002 and 2003, personal interviews were made with the managers of five automotive
main industry companies that were Japan-origin and that were located in Thailand. They also
applied questionnaire survey to 100 firms that were the suppliers of these five companies
interviewed, and answers were obtained from 15 supplier firms. The study found out, as a
result of the analyses conducted in the form of case study, that the level of the technology
transfers between the firms was quite high both in content and in quality, that the difficulty
levels of the transfers were determined by the content of the technologies transferred, and
that the success of the transfers was directly proportional to the technological capabilities of
the suppliers.
Berger’s study (2005) reviewed the effects of the MNCs on the innovation and R&D
activities of the firms operating in manufacturing sector of Thailand. The study followed the
same method as us in collecting qualitative data and it constituted the basis for us to
formulate our questions on innovation and R&D. The author used the qualitative and
quantitative techniques together. The study employed the readily available quantitative data
obtained from the researches on R&D and innovation in 2000 and 2002 on the basis of
questionnaire surveys conducted – observing the OSLO and Frascati guides of OECD – by
65
the National Science and Technology Development Agency of Thailand. These surveys were
implemented on the firms that were operating in nine different sectors in the manufacturing
industry of Thailand and that had a turnover exceeding a certain limit. The survey in 2000
was implemented on 2166 firms and obtained 1019 answers while the survey in 2002 was
implemented on 3945 firms and obtained answers from nearly 1500 firms. Author rather
used the case study method and did not made logistics regression analysis. Semi-structured
personal interviews were conducted with the R&D managers, production managers and
general managers of totally 20 companies in the automotive and hard-disk sectors in the year
2003, and the results of the study were analyzed statistically via various variance analyses
and the interviews made with the companies were evaluated by means of case study method.
2.7.6. Studies on Turkish Automotive Industry
The number of the studies concerning Turkey, the main focus being on KTTs, is quite
limited in the international literature. However, there exist some studies conducted on the
productivity, MNC-based technology spillovers and automotive industry, using some
quantitative and qualitative methods16
. The number of the studies conducted concerning the
relationships between the automotive main and supply industry in our country is also few.
The available studies are rather based on certain areas of the automotive industry, such as
R&D or innovation, and most of the studies review the automotive sector not individually
but together with the other sectors. Due to the fact that quality and detailed data cannot be
obtained at the firm-level, the analyses are tried to be put forward in the form of case studies.
We observe that a large majority of the available studies in our country were realized during
the last decade. No empirical study examining the technological capabilities of the supply
industry firms and reviewing the types, intensity channels, and determinants of the KTTs
provided by MNCs to domestic firms at both inter- and intra-firm level qualitatively (case
study) and quantitatively (econometrical) in detail together, along with the topics mentioned
above, has been encountered yet; however, it has been observed that there are studies in the
national literature which are similar to our study in terms of method. These could be
summarized as follow.
Bedir (1999), in order to collect data, implemented questionnaire survey on the Turkish
automotive main and supply industry firms in his study where the main and supply industry
16
See Pamukçu (2003); Bertinelli et. al. (2006); Lenger and Taymaz (2006); Wasti et. al. (2006 and 2009);
Aksoy (2008); Pamukçu and Taymaz (2009); Dayar and Pamukçu (2011).

66
relationships were reviewed. Under this scope, questionnaire forms were sent to 16 main
industry companies and 120 supply industry firms (75 of them being TAYSAD member and
45 being other firms operating in the sector) via SPO in 1996. 12 of the main industry
companies responded to the questionnaires while 79 of the supply industry firms responded
to them. The findings obtained from the study were analyzed only descriptively.
Wasti et. al. (2006) used the questionnaire survey and personal interview methods in order to
collect data in his study he attempted to determine the types of the relationships between the
buyer and supplier in the Turkish automotive industry. In the study executed in 2002, 16
main industry companies as the members of OSD and all the supplier firms as the members
of TAYSAD were chosen as sampling. 10 main industry companies agreed to participate in
the study and the questionnaire survey was implemented by conducting semi-structured
personal interviews with totally 51 purchasing managers of those companies. 72 supplier
firms who were TAYSAD members agreed to participate in the study and only questionnaire
survey was applied to those firms. Anova and Scheffe tests were used in analyzing the data.
In another study, Wasti et. al. (2009) used the same data and attempted to determine the
probability of the relation-specific investments made by the main industry to the supply
industry in the Turkish automotive sector, by means of the multi-regression analysis method.
Çelikel (2009) employed the case study method in his study where he reviewed the factors
affecting the R&D collaborations between the automotive main companies in Turkey and
MNCs as their partners. In this context, case analysis studies were conducted with the
affiliates of the three MNCs that were operating in the Turkish automotive main industry
(Tofaş, Ford Otosan and Hyundai Assan) and their parent companies abroad, namely Fiat,
Ford and Hyundai. Çelikel obtained the data he used for the case analyses from the in-depth,
face-to-face interviews he conducted with totally 40 people (R&D managers, engineers and
top-level managers) from those six companies, and put forward his findings descriptively.
The Ekmekçi study (2009) where the factors determining the knowledge transfer from the
FDI flows in the Turkish automotive industry to the local supplier firms are analyzed is
another study which uses a similar case study method with Çelikel (2009). In the study, 7
main companies in Turkey and 7 ea. supply industry firms with 100% local capital, which
sell parts to at least one of these seven main companies, were interviewed face-to face in
order to gather data, descriptive analysis of the gathered data was performed.

67
CHAPTER 3
TECHNOLOGY SPILLOVERS FROM FDI
IN TURKISH MANUFACTURING INDUSTRY:
ECONOMETRIC ANALYSIS
In this chapter a series of econometric analyses are carried out to test for the presence of
FDI-related horizontal and vertical (backward and forward) technology spillovers in the
Turkish manufacturing industry over 2003-2006 period17
. We use a firm-level unbalanced
panel dataset involving 30,178 observations and a production function is estimated to this
end for the entire sample of all firms, for local firms, for export and domestic market
oriented firms. A number of alternative horizontal and vertical spillover proxies are derived
using input-output table for the year 2002. To the best of our knowledge this is the first
econometric study on FDI-related technology spillovers in the Turkish manufacturing
industry using firm-level data for the post 2001 period where FDI flows were rather high.
3.1. Introduction
The main objective of this chapter is to analyze of FDI-related technology spillovers on
domestic firms’ productivity level through horizontal (intra-industry) and vertical linkages
17
All analyses, statistics, cleaning process, construction and calculation of both the data and variables discussed
in this chapter were carried out by author within the premises of the data research center of TurkStat by using
STATA/SE 10.1 program in a period of one year. The database (ISSS) was used with the official authorization
granted by and through a protocol signed with the TurkStat due to data confidentiality issues.

68
(inter-industry) with foreign firms in the Turkish manufacturing industry by using firm-level
panel data. For this purpose, a Cobb-Douglas form production function is estimated at 2, 3
and 4-digit sector level with firm gross output as the dependent variable with a series of
independent production side variables (including capital, labor, materials, energy and foreign
equity share - to measure the foreign ownership effect on productivity), and with a wide
range of indicators of proxies for horizontal and vertical (backward and forward) spillovers
using foreign equity share-weighted output. Besides, an indicator of firm scale, herfindahl
concentration index and total sectoral intermediate demand are included as control variables
at the firm level. In addition, we will try to analyze the effects of absorptive capacity of the
firms to benefit from these spillovers with technological gap variable. All sector-level
variables and proxies for technology gap are derived at 2, 3 and 4-digit sector level except
total sectoral demand, backward and forward spillover proxies which can be computed only
at 2-digit level. Different specifications of the original model are estimated at 2, 3 and 4-digit
sector level for the entire sample of all firms, for local firms, and for export-oriented (EO)
and domestic orientated (DO) firms.
The next section below gives a picture of FDI inflows in Turkey. In the third section, main
data sources used in the analyses and description of the foreign firms in the dataset are
explained. Then, the basic empirical model adopted is defined together with production side
variables, control variables and proxies for horizontal and vertical spillovers. In the fifth
section, we mention briefly about the econometric concerns. The sixth section is devoted to
detailed analysis of the econometric findings based on the horizontal and vertical technology
spillovers, and technology gap in the Turkish manufacturing industry. Then, robustness
checks carried out are explained briefly. In the last section findings will be summarized.
3.2. Descriptive Analysis (1): A Picture of FDI Inflows in
Turkey
Although the first law on foreign capital was enacted in 1954, Turkey was a relatively closed
market to foreign investment until 1980. After pursuing inward-oriented economic policies
based on an import-substitution development strategy implemented through Five-Year
Development Plans since the 1960s, Turkey switched to outward-oriented policies after a
severe balance of payment crisis in the early 1980s. Liberalization of international capital
flows occurred in 1989. The signature of a Customs Union agreement with the European
Union in 1995 contributed to a further liberalization of its economy. The policies focused on

69
attracting foreign investment, promoting export and minimizing state intervention. Note that
efforts to open the Turkish economy to international markets were not enough to attract more
FDI. For instance, from 1950 to 1980 the cumulative authorized FDI had only reached US$
229M (Öniş, 1994). After the government initiated a stabilization program in 1980 that
paved the way to an open economy, the legislative background was also reorganized to
eliminate favoritism among foreign investors, local content requirements, minimum export
requirements and restrictions on transfer of capital and profits (Erdilek, 1986; Akpınar,
2001). In addition to changes in the regulatory framework, privatization of state economic
enterprises, liberalization of the financial system, elimination of restrictions on foreign
exchange, establishment of a stock exchange and heavy investment in telecommunications
technology all contributed to the development of a favorable environment for FDI
throughout the 1980s. However, in the following decade, two major economic crises in 1994
and 1999 as well as reliance on short term capital flows resulted in a relatively poor FDI
performance18
.
When we look at the 2000s, we see a much more favorable environment for foreign investors
with a strongly regulated financial system, a low inflation rate and the establishment of a
Coordination Council for the Improvement of the Investment Climate. Following the
enactment of the new foreign capital law in June 2003, minimum capital requirements and
permits were eliminated; the ownership of property by foreigners without any restrictions,
the right to international arbitration and employment of expatriates were granted. Partly as a
result of these measures a sharp rise occurred in FDI from 0.56% of GDP in 2003 to 3.8% in
2006 which was followed by a fall after 2006 (Figure 3.1).
Policies implemented since the early 1980s to open up Turkish economy were not enough to
increase the FDI inflows to Turkey. As it can be seen from Figure 3.2, until the year 2001,
annual FDI flows to Turkey were rather low (below US$ 1B) compared to other emerging
economies (see UNCTAD, 2005). Total cumulative net FDI inflows were nearly US$ 10,7B
between 1974 and 2000, corresponding to an annual average of US$ 400M. Moreover, the
place of Turkey was in the 35th rank by US$ 982M in 2000 in terms of FDI inflows among
all countries in the world (see Figure 3.3). From 2001 onwards there has been an important
increase in the FDI flows, total cumulative net FDI inflows were reached to nearly US$
100B between 2001 and 2010 (annual average of US$ 10B) especially after the Turkish
18
See Kepenek and Yentürk (2003), Öniş (1994), Erdilek (1986, 2003), Akpınar (2001), Alıcı and Ucal (2003).
Yılmaz (2006), Yılmaz and Barbaros (2005), Taymaz and Yılmaz (2007), Pamukçu and Taymaz (2009) for
detailed information on FDI flows in Turkey in terms of history background, obstacles, structure, discussions and
various statistical data.

70
government has started to liberalize its investment policy in 2004 (last stage of privatization
program). As illustrated in Figure 3.2, FDI inflows peaked in 2007 with US$ 22B. Moreover,
as seen from Figure 3.3, the ranking of Turkey in the world in terms of FDI flows for the
period 1999-2010, the rank of Turkey increased from 35 (in 2000) to 16 (in both 2006 and
2008 years) for the first time within all countries that attract most FDI flows in the world.
Figure 3.1: Evolution of the FDI/GDP ratio in Turkey: 1999-2010 (%)
Figure 3.2: Net FDI Inflows in Turkey (BoP Current US$)
Figure 3.3: Ranking of Turkey in the World in terms of Net FDI Inflows

71
3.3. Data Sources and Description
The main data source used in this chapter is a firm-level panel dataset covering the 2003-
2006 period19
, and come from the “Annual Industry and Service Statistics Survey” database20
(henceforth ISSS database) conducted yearly by the Turkish Statistical Institute (TurkStat)21
.
In the ISSS database, all “enterprises”22
and their “local units”23
are surveyed, and the
classification of the enterprises’ main activities is determined in accordance with “the
Statistical Classification of Economic Activities in the European Community” at NACE
Rev.1.1 level (henceforth NACE nomenclature is used); this is the highest disaggregation of
the industry classification. In addition, the statistical unit (also observation and analysis unit)
used in the ISSS database is "enterprise" and all data are collected at this level, and the ISSS
database covers all sectors in NACE (from C to K and from M to O) so in our dataset the
number of observations per year ranges from 77,000 in 2003 to 85,000 in 2006.
The dataset contains basic information on variables which are commonly used in the
estimation of firm level24
production functions such as the number of employees, sale
revenues, turnover, capital ownership structure (private, foreign, public), values of material
and energy inputs, gross fixed investment, changes in stocks, export and import values of the
firm and etc. Although this dataset contains only four year period, it has very important
19
The sample period starts in 2003 due to the changes in data collection methodology of TurkStat in 2002 according to principles set by EUROSTAT. The main reason of this is that TurkStat surveyed “establishments”
till year 2002, while “enterprises” were surveyed afterward, also matching of the statistical units before 2002 with
those surveyed after this period cannot be possible. Therefore, the data collected by TurkStat for the pre-2002
period are not compatible for the periods after 2002. Also, the latest firm level data available at TurkStat were for
2006, when the research was conducted. 20
The details about the database are from TurkStat`s web page; “onwards 2002, these statistics were produced
with regard to European Council decision No 58/97 accepted in 20/12/1996 (EC, Euratom). In the database, all
the enterprises and their local units, and also all provinces, district centers and municipalities irrespective of the
population size are covered. To produce information on the basis of local unit and enterprise, full enumeration
and sampling methods are used by TurkStat. Full enumeration method is used for the enterprises having more
than one local unit or having twenty or more employees, and sampling method is used for the enterprises having
single local unit. With respect to sampling framework business records are used”. For more details see
www.tuik.gov.tr. 21
This database is also known as “Structural Business Statistics Survey” (SBSS). 22
“Enterprise” term is defined by TurkStat in this way: “the enterprise is an organizational form that produces
goods and services using decision autonomy at first degree. An enterprise carries out one or more activities at one
or more locations. The relation between enterprise and legal unit is directly stated by this definition: An enterprise
corresponds to a legal unit or combination of legal units”. 23
“Local unit” is defined by TurkStat in this way: “local unit is a part of enterprise that has a geographically
defined address like center of the enterprise, office, store, canteen, factory, workshop, mine, construction site,
hotel, restaurant, café, school, hospital, depot. At or from this place economic activity is carried out for which one
or more persons work full time or part time for one and the same enterprise. The center of the enterprise is also a
local unit”. 24
The sampling and statistical unit in the database is enterprise, not a firm. However most of the enterprises in
Turkish manufacturing industries own only one local unit (Özler and Yılmaz, 2007), so we use the terms "firm"
and “enterprise” interchangeably.

72
specifications according to earlier datasets with respect to the higher number of foreign firms
and observations, more accurate and comprehensive data collection methods used.
In this study, we focus only on manufacturing firms in the sectors ranging from NACE 15
(food products) to NACE 37 (recycling) at 2-digit NACE, (see Table 3.1 for the
classification of manufacturing industries at 2-digit NACE) so this lowers the number of
observations to 31,000 (in 2003) to 34,000 (in 2006) per year in our dataset. Moreover, we
take only private establishments25
with 20 or more employees26
that appear in the dataset
consecutively at least three years, and the sector “recycling” (NACE 37) is excluded from
the dataset because of small number of firms in this sector27
. The number of observations in
our dataset is further reduced by detailed data cleaning and transformation procedures (see
Appendix A for details). Thus the final dataset used is unbalanced firm-level panel data for
the Turkish manufacturing industry with 193 sectors at 4-digit NACE level (there are 22
sectors at 2-digit and 92 sectors at 3-digit) over the period 2003-2006 and sample size varies
between 7,264 (in 2003) and 7,700 (in 2006) firms in a given year, adding up to 30,178
observations for the whole sample28
. On the other hand, we define foreign firms as firms if
foreign share (FS) is at least 10% or more in total capital of the firm29
, hence there are 1,489
observations for foreign-owned firms (nearly 5% of the total) and 28,689 observations for
local firms30
in the dataset (see Table 3.2 for the distribution of firms with foreign capital by
2-digit NACE and year).
This chapter draws on other three data sources. The first one is the Input-Output (IO) Table
of Turkish economy for the year 2002 indicating the inter and intra industry economic
transactions. The second data source is the producer price indexes (PPI) for the 2003-2006
periods at 2, 3 and 4-digit NACE level. These two data were obtained from TurkStat upon
request. Finally, the third one is the private fixed-capital investment deflators for
manufacturing industry at 2-digit NACE level released by State Planning Organization
(SPO) in Turkey for the 2003-2006 periods.
25
Firms with 50% or more with public share are excluded from the data. 26
Since full enumeration method is used (by TurkStat) for firms having 20 or more employees (see footnote 20). 27
In addition, if total number of the firms is less than ten at 4-digit NACE level, this makes it impossible to apply
Olley and Pakes method to these industries. 28
The number of the groups for all firms is 7690, for local firms is 7390, for export orientated firms is 1911, and
for domestic orientated firms is 7147. 29
At least 10% foreign share is taken in accordance with the OECD, UNCTAD and the IMF’s definitions. Also
see Javorcik (2004). 30
Foreign share is less than 10% or zero in total capital.

73
3.3.1. Descriptive Analysis (2): A Picture of Foreign Firms in the
Dataset by Sectors
We provide some descriptive statistics from the constructed and used ISSS unbalanced panel
dataset in order to draw a picture of foreign firms’ importance in the Turkish manufacturing
industry. Figures 3.4 through 3.6 present some statistics about foreign presence in
manufacturing industry related to below four variables constructed over the period 2003-
2006 for 2-digit NACE sectors31
, and we refer to these as sector level variables:
i. the share of foreign firms in the total number of firms,
ii. the share of foreign firms in the sector level employment,
iii. the share of foreign firms in the sector level gross output,
iv. the share of foreign firms in the sector level value added.
Figure 3.4 displays the share of foreign firms in these four sector level variables. Initially, it
can be seen that the share of foreign firms in the total number of firms (Figure i) is above 5%
in eight sectors over all periods and major ones according to last period are “chemical
products” (NACE 24) by 21.01%, “motor vehicles” (NACE 34) by 17.02% and “medical
instruments” (NACE 33) by 9.23%, respectively (for detailed values, see Table 3.3).
Secondly, when we look at the employment share of foreign firms (Figure ii), we see that it
is above 10% in nine sectors for each period and major ones according to year 2006 are
“motor vehicles” (NACE 34) by 55.41%, “chemical products” (NACE 24) by 39.34%, and
“radio, television and communication” (NACE 32) by 35.32%, respectively (see Table 3.3).
In the case of gross output shares (Figure iii), we see that the share of foreign firms is above
20% in nine sectors over all periods and major ones in 2006 are “motor vehicles” (NACE 34)
by 80.31%, “radio, television and communication” (NACE 32) by 51.29% and “chemical
products” (NACE 24) by 48.45%, respectively (see Table 3.3). Lastly, the share of foreign
firms in the sector level value added (Figure iv) is above 30% over four periods in seven
sectors and major ones in last year are “motor vehicles” (NACE 34) by 73.21%, “electrical
machinery” (NACE 31) by 57.85%, and “communication” (NACE 32) by 53.32%,
respectively (see Table 3.3).
31
The sectors “tobacco” (NACE 16), “leather products” (NACE 19), “petroleum products” (NACE 23) and
“office machinery and computers” (NACE 30) are not included in the figures because either the total number of
the firms in these sectors are less than ten or there is no foreign firms in these sectors (see Tables 3.2 and 3.3 for
details).
74
Average share of foreign firms in the four sector level variables for 2003-2006 is also
presented in Figure 3.4. As it can be seen from the Figure, general average share of foreign
firms is approximately 5% in the total number of firms, 15% in the total employment, 23%
in the gross output, and 24% in the value added for all the sectors. The “chemical products”
(NACE 24) sector has the largest average foreign presence (19.50%), and the “motor
vehicles” (NACE 34) sector has the highest average shares in the rest three sector variables;
(54.28% in employment, 76.03% in gross output, 71.92% in value added). These figures
point out the importance of foreign firms (especially MNCs) that they play a major role in
the Turkish automotive industry and choice the Turkey as a production base. Hence, this also
justifies the aim of this dissertation in terms of choosing the Turkish automotive industry as a
case study to analyze the KTTs provided by customers to suppliers through backward
linkages.
In Figure 3.5, change in the share of foreign firms in the four sector level variables is
presented between 2003 and 2006. It can be seen that the changes are positive for some
sectors and negative for the others. For instance, the share of foreign firms in the total
number of firms (Figure i) is changed positively more than 12% in four sectors (NACE 21,
29, 28, and 24) by largest positive change is observed in “pulp, paper and paper products”
sector (NACE 21) (36.36%); on the other hand it is changed negatively more than 10% in
other four sectors (NACE 17, 35, 26, and 18) by largest negative change is observed in
“textiles” sector (NACE 17) (26.63%). In the case of change in employment share (Figure
ii), seven sectors are experienced a positive change of over 10%, “radio, and television and
communication” sector (NACE 32) is leader (30.74%), on the other hand nine sectors
experienced a negative change of over 10%, and “textiles” sector (NACE 17) see the largest
negative change (51.28%). In terms of change in the gross output share (Figure iii), there are
six sectors that experienced more than 10% positive change and “medical instruments”
(NACE 33) is the leader (35.19%) and seven sectors that experienced more than 10%
negative change, the “textiles” sector (NACE 17) is again leader (54.05%). Lastly, value
added share of foreign firms (Figure iv) is changed positively more than 10% in eight
sectors, on the other hand it is changed negatively more than 10% in other four sectors.
Largest positive change in value added share is again observed in “pulp, paper and paper
products” sector (NACE 21) (40.74%), and largest negative change is again observed in the
“textiles” sector (NACE17) (60.54%). Generally, only five sectors achieved to increase their
shares in the four sector level variables; these are “food” (NACE 15), “radio, television and
communication” (NACE 32), “pulp, paper and paper products” (NACE 21), “chemical
products” (NACE 24) and “metal products” sectors (NACE 28), respectively. In other case,

75
there are three sectors that the share of foreign firms decreased in all sector variables; these
are “textiles” (NACE 17), “publishing” (NACE 22), and “rubber products” (NACE 25)
sectors, respectively.
Figure 3.6 displays the average values of each variable over the entire period of 2003 and
2006. According to this Figure, it can be said that foreign firms employ nearly three times
higher labor, and produce nearly four times higher gross product and value added relative to
their lower number in manufacturing industry. In that respect, most important sector is the
“motor vehicles” (NACE 34), share of foreign firms in this sector is 17% but this sector
employs nearly 55% of the labor, produce nearly 80% of the gross output and value added of
the sector. Second important sector is the “electrical machinery sector” (NACE 31), share of
foreign firms is 8% but this sector employs nearly 32% of the labor, and produce nearly 45%
of the gross output and 50% of the value added. Third important sector is the “radio,
television and communication sector” (NACE 32), foreign presence is 5% but this sector
employs 32% of the labor, and produce nearly 45% of the gross output and 50% of the value
added. This statistics is nearly same for all the sectors except a few ones.
In summary, although the number of the foreign firms operating in the Turkish
manufacturing industry is low (5%), these firms produce nearly 25% of the Turkish
manufacturing industry’s gross output and value added by using only 15% of the labor. This
means that foreign firms produce more efficiently than the local firms and this may be
explained mainly by the higher absorptive capacity, technological capabilities, capital and
technology intensive production of the foreign firms. This figures point to the importance of
foreign firms (especially MNCs) that they play a major role in the evolution of economic
activity in the Turkish manufacturing industry and therefore justify the aim of this
dissertation.

76
Figure 3.4: Share of the Foreign Firms in the Sector Level Variables by 2-digit NACE and Year
Source: Author calculations based on TurkStat`s ISSS Database
Notes: All series are arranged by year 2006. The numbers on Horizontal lines are 2-digit NACE (Rev 1.1) codes
(i)
(iii)
(ii)
(iv)

77
(i)
(iii)
(ii)
(iv)
Figure 3.5: Change in the Share of Foreign Firms in Sector Level Variables by 2–digit NACE, 2003-2006
Source: Author calculations based on TurkStat`s ISSS Database
Notes: %Change = ((i2006-i2003)/i2003)*100 where i=sector value. The numbers on Horizontal lines are 2-digit NACE (Rev 1.1) codes

78
Figure 3.6: Share of the Foreign Firms in the Sector-Level Four Variables
by 2-digit NACE, Average Values for 2003-2006
Source: Author calculations based on TurkStat`s ISSS Database
Notes: All series are arranged by value added share. The numbers on Horizontal lines are 2-digit
NACE (Rev1.1) codes.
3.4. Empirical Model
In order to analyze the impact of FDI-related horizontal and vertical (backward and forward)
technology spillovers on domestic firms’ productivity level, a Cobb-Douglas functional form
is assumed in the context of production function framework:
[3.1]
Where, Y is (real) gross output, K, L, M, and E are production side variables and stand for
capital stock, number of employees, intermediate materials and energy inputs, respectively;
and A is the baseline productivity level. After taking the natural logarithm of production
function we obtain the following equation 3.2. Although the variables in equation 3.2 will be
defined in detailed below, the ones other than production side variables are included to
model to capture their effect on total factor productivity of the firm32
.
32
Where coefficient estimates on the non-production side variables capture their contribution to total factor
productivity measured by the term in the equation after the logarithms are taken. This approach is adopted
from Haskel et al. (2002). The authors investigate whether FDI flows generate productivity spillovers for
domestic firms in the UK, and they suggest that coefficient estimates on the non-input regressors capture their
contribution to total factor productivity.

79
[3.2]
Where, i stands for firm, j for sectors at 2, 3 or 4-digit NACE level, and t for time.
In the analysis of the spillover effects we follow the earlier literature33
and estimate the
several variations of equation 3.2 at 2, 3 and 4-digit NACE level. Note that all monetary
variables are measured in real 2003 Turkish Liras.
3.4.1. Real Gross Output and Production Side Variables
Real gross output variable ( ) is constructed as the sum of the revenues from the annual
sales of the firm, minus (i) the revenues from sales of wholesale and retail goods (purchased
for resale in the same condition as received), (ii) received subsidies, and (iii) rental and
financial incomes of the firm. At later stage, the value of the stock of finished products at the
end of the year is added and the value of the stock of finished products at the beginning of
the year is subtracted. The resulting value is deflated by the relevant PPI at the 4-digit NACE
level34
. For a few sectors four-digit PPI were not calculated by TurkStat, so 3 or 2-digit PPI
were used respectively for these sectors depending on data availability.
In the calculation of the capital stock variable ( ), the data on the value of depreciation
and depletion allowances of firms are used as a proxy. The underlying reason is that detailed
investment series needed for capital stock calculation are not available in the data although
firm level data on "investment in tangible"35
and "investment in intangible fixed assets"36
are
available. Moreover, construction of the capital stock series by relevant methods (perpetual
inventory, investment and tangible asset series methods etc.) could not be possible due to
limitation of our dataset. The resulting value is deflated by 2-digit private fixed-capital
33
We partially followed the earlier literature in line with Aitken and Harrison (1999), Blalock (2001), Schoors
and Van der Tol (2001), Javorcik (2004), Jabbour and Mucchielli (2007) and Taymaz and Yılmaz (2008a). The
common point of these studies is that these authors performed their analyses at only 2-digit sector level. 34
These indexes are unpublished at 2, 3 and 4-digit NACE level and they were obtained from TurkStat upon
official request. 35
Like as investment in land, in existing buildings and structures, in construction and alteration of buildings, in
machinery and equipment, and in transportation equipment etc. 36
Like as investment in computer software, license, and patent etc.

80
investment deflators37
related to manufacturing industry because disaggregated investment
deflators are not available.
Labor variable ( ) is the number of paid employees of the firm38
. The detailed
classification of the employees according to skill or education level is not available in the
dataset39
. Although there are data on the classifications of employees those work in
production or administrative positions, these are not appropriate to use in the analyses due to
large number of zero observations.
Material input variable ( ) is constructed as the sum of (i) the value of purchases of
intermediate inputs except for the electricity and fuel, (ii) the value of the stock of work in
progress, and (iii) intermediate inputs at the beginning of the year, and minus (a) the value of
the stock of work in progress, and (b) intermediate inputs at the end of the year. The
resulting value is deflated by a composite (input) price indexes (CPI) constructed for each 2-
digit NACE level based on 2-digit IO matrix of year 2002. In the calculation of the
composite sector indexes, we take the six highest input coefficients for each sector (for
details on the calculation of sector indexes see Appendix B). Finally, the PPI for the relevant
2-digit NACE sectors is used for deflation.
Energy input variable ( ) is the sum of the values of electricity and fuel expenses (LPG,
natural gas, coal, gasoline, diesel oil, heat, steam, hot water etc.). Both electricity and fuel
expenses are deflated by their 2-digit own PPI.
3.4.2. Control Variables
We use control variables in order to isolate the factors that may affect the firm productivity
other than production side variables.
In the equation 3.2, foreign share ( ) is the share of foreign capital in firm’s total capital
and used to measure the foreign ownership effect on productivity.
37
These deflators are also unpublished and taken by request from SPO, one of the top governmental agencies in
Turkey. 38
In the database, the data are available in four months (February, May, August, November) for each year so we
take the average of these four months in each year. 39
It can generally be classified as education level of the employees, technical personnel, foreman, workers,
management employees, office employees etc.

81
The other control variable is the scale of the firm ( ) It is defined as a firm’s
production over the average production in its sector level. The firms that produce more than
the average of the sector (big firms) generally have more market power and this lead to more
efficient production so we expect a positive coefficient on this variable. It is calculated at 2,
3 and 4-digit NACE level in the following way:
∑
⁄ Where N = # of firms in the sector j [3.3]
The next control variable is the Herfindahl-Hirschman Index ( ). It is an
indicator about the competition level of any sector and defined as the sum of the squared
market shares of the firms in a given sector, and its value may range from 0 to 1, higher
values indicate a decrease in competition, whereas lower values indicate the opposite. Its
effects could be in two directions on productivity of firms: If there is a high competition
between firms in a given sector this can lead to more efficient production of firms in that
sector, on the other hand this can reduce the productivity of firms in that sector because they
cannot cope with high competition. This situation may be regarded as a spillover effects
from the foreign firms. To separate these effects from technology spillovers of the foreign
firms, variable is included as a proxy for the level of industry competition
(see Javorcik, 2004). The coefficient on this variable could be positive or negative depend on
the effect. It is calculated at 2, 3 and 4-digit NACE level in the following way:
∑ ( )
Where,
∑ [3.4]
The last control variable is the total demand for inputs ( ) variable. The entries of
the foreign firms in downstream sectors lead to increases for input demands and local
suppliers (as providers of inputs) benefit from this through various ways (scale economies,
increase in sales, revenues, productivity etc.). This situation also may be regarded as vertical
(backward or forward) spillover effects from the foreign firms. To separate this effect, we
include to regression the natural log of demand variable ( ), and it is calculated
only at 2-digit NACE in the following way40
:
(∑ ) [3.5]
40
Because of only available technical coefficients from the IO table at 2-digit-level.

82
Where is the technical coefficient calculated for each sector from the IO matrix and
indicates units of good j are needed in order to produce one unit of good k. is also
real gross output of sector k at time t. It is expected a positive correlation between demand
and firm productivity (Javorcik 2004).
3.4.3. Proxies for Horizontal and Vertical Technology Spillovers
3.4.3.1. Horizontal Technology Spillover
Proxy variable for FDI-related horizontal technology spillovers is constructed as the ratio of
foreign share-weighted output41
to the total output of the sector. It is calculated at 2, 3 and 4-
digit NACE level in the following way42
:
(∑ )
∑ [3.6]
The in the equation stands for foreign share of the firm i in sector j at time t43
. This
variable shows how much the share of a sector’s output is produced by foreign-presence. It is
also explained by Javorcik (2004) as “captures the extent of foreign presence in sector j at
time t and is defined as foreign equity participation averaged over all firms in the sector,
weighted by each firm’s share in sectoral output”. In other words, it captures the effect of
foreign firms on local firms in the same industry. A positive and statistically significant
coefficient on this variable means that the existence of foreign firms in the sector has a
positive impact on the productivity of firms in the same sector, in other words there are
horizontal technology spillovers from foreign firms in the same sector (through
demonstration effects, competition effects and labor turnover etc.) (Jabbour and Mucchielli,
2007). The value of the variable increases with (i) the output of the foreign firms and (ii) the
41
For robustness check, Horizontal variable was also calculated using foreign equity share-weighted labor
(∑ )
∑ at 2, 3 and 4-digit NACE level and tested in all estimations and models
stated in this chapter instead of output weighted horizontal variable. This definition is same to Aitken and
Harrison (1999) who use employment as weights. All tests and models yielded nearly same conclusions like as
output weighted horizontal spillovers. 42
This definition is same with Blalock (2001), Schoors and Van der Tol (2001) and also Javorcik (2004). These
authors used output as weights but only Javorcik took into account foreign share, Javorcik also defines foreign
firms which have at least 10% foreign share. In addition, these authors performed their estimations only at 2-digit
sector level. 43
In equation 3.6, FS equals zero if its value less than 10%.

83
share of foreign capital in these firms. This proxy is also time-varying and sector specific
variable.
3.4.3.2. Backward Technology Spillover
Two different indicators of FDI-related vertical technology spillover are also constructed
using horizontal technology spillover. First one is the backward spillover. This variable is a
proxy to capture the extent of potential contacts between local firms and foreign firms when
local firm is the input supplier of the latter. Also it measures foreign presence in the sectors
that purchases inputs from sector j. It is calculated at 2-digit NACE level in the following
way44
:
∑ [3.7]
The value of the backward technology variable increases with the foreign presence in sectors
supplied by industry j and the larger the share of inputs supplied to sectors with foreign
presence. It is expected a positive coefficient on this variable and this is evidence on the
existence of technology spillovers from foreign firm to their local suppliers.
3.4.3.3. Forward Technology Spillover
The second indicator of FDI-related vertical technology spillover is forward technology
spillover. This variable is a proxy to capture the extent of potential contacts between foreign
firms and local firms when foreign firm is the input supplier of the latter. A positive
coefficient on this variable is evidence on the existence of technology spillovers from foreign
suppliers to local firms. Also it measures foreign presence in the sectors that sell inputs to
sector j. It is calculated at 2-digit NACE level in the following way:
∑ [3.8]
In the equations 3.7 and 3.8, and are IO coefficients. is defined as the proportion
which shows how much of the sector j output (intermediate inputs for other sectors) is
44
This variable is also defined analogous to Blalock (2001), Schoors and Van der Tol (2001) and Javorcik
(2004).

84
supplied to sector k in total output of sector j, and is also defined as the proportion which
shows how much of the sector j inputs purchased from sector k in total inputs sourced by
sector j. These coefficients are calculated for each sector at 2–digit NACE level45
excluding
both (i) the products supplied for final consumption and (ii) the imports of intermediate
products46
from the 2002 IO matrix47
.
Moreover, in the calculation of vertical spillovers we include inputs supplied within the same
sector (the case where j=k)48
because most important proportion of the supplying
relationships occurs in the same sector, in other case (j≠k), their effect would be captured by
the horizontal variable and the coefficient on this variable would be biased (see, Jabbour and
Mucchielli, 2007)49
. These backward and forward variables are time-varying and sector-
specific variables since and coefficients taken from IO table remains fixed but
foreign share and firm output50
changes (see, Javorcik, 2004).
Note that, all variables in the equation 3.2 are computed at 2, 3 and 4-digit NACE level
except backward, forward and demand variables51
. These variables can only be computed at
2-digit NACE level because derivation of the 3 and 4-digit IO and technical coefficients
( ) are impossible due to only available 2-digit IO matrix52
.
45
There are 484 coefficients (22 sectors x 22 sectors at 2-digit NACE) for each one of
coefficients, in total 1452. 46
Imported intermediate inputs are excluded so coefficient includes only inputs supplied domestically. 47
Although it is preferred using multiple IO matrices in the calculation of the IO coefficients for each year, IO
matrices for later years are not available. However important changes in IO coefficients between sectors over a
short period are rather unusual. 48
On the contrary, Javorcik (2004) excluded the inputs puchased within the sector (j≠k) in her analyses. 49
For the robustness check, we also recalculated the vertical (backward and forward) spillovers by not including
the inputs supplied within the sector (the case where j≠k). In other means, we excluded the inputs supplied within
sector. All analyses and models stated in this chapter were performed for this case but we could not find any
significant spillover effects. 50
It is also true in the case of labor weighted horizontal spillover variable (see footnote 41). 51
FS, Horizontal, Scale, Herfindahl and Tgap variables are calculated at 2, 3 and 4-digit level. 52
Although we worked hard to derive 3 and 4-digit IO and technical coefficients (as a virtual)
from 2-digit IO matrix, they did not yield significant results in the analyses due to very high number of sectors at
both 3 and 4-digit NACE level.
85
3.4.3.4. Descriptive Analysis (3): Horizontal and Vertical Technology Spillovers
by Sectors
We present some statistics from the constructed horizontal and vertical (backward and
forward) spillover variables in order to show linkages with foreign firms across sectors in the
Turkish manufacturing industry.
According to additional summary statistics of the spillover variables derived from data by
year (see Table 3.4 for details), maximum value of horizontal variable ranges from 52.01%
in 2004 to 75.69% in 2006, and mean value of the variable increased from 12.20% in 2003 to
12.41% in 2006. In the case of backward variable, maximum value ranges from 50.08% in
2004 to 75.67% in 2006, and mean value of the variable increased from 13.98% in 2003 to
14.57% in 2006. Lastly, maximum value for forward variable ranges from 28.41% in 2004 to
35.60% in 2003, and mean value increased from 11.87% in 2003 to 12.09% in 2006.
Figure 3.7 also displays the average values of the horizontal and vertical technology
spillover variables at 2-digit NACE level for the period 2003-2006 (see Table 3.5 for
detailed values). Significant variation across sectors over all three variables is observed53
.
For instance, the maximum average value of horizontal spillover variable is nearly 50% in
“motor vehicles” sector (NACE 34), and nearly 15% in “food” sector (NACE 15) but it is
below 5% in other five sectors (NACE 17-18-20-22-27). Its value ranges from 50% in
“motor vehicles” to 0.81% in “wood products” (NACE 20). The sectors with the highest
average value are “motor vehicles” sector (NACE 34) (49%) in horizontal variable, and
again “motor vehicles” (45%) in backward variable and “chemical products” (NACE 24)
(27%) in forward variable, while the lowest ones are “wood products” (NACE 20) by 1% in
horizontal variable, “textiles” (NACE 17) by 4% in backward variable and “wearing
apparel” (NACE 18) by 4% in forward variable54
.
Figures 3.8 through 3.10 present changes in the value of horizontal and vertical technology
spillover variables in each 2-digit NACE level between 2003 and 2006. As it can be seen
from the Figures, the changes are positive and negative across sectors. It is very important
that ten sectors registered a rise, three of them experienced more than 38% points, (48% in
53
This variation is valid in each year for all three variables. On the other hand, there is no significant variation
across years in each sector for three variables. For instance, backward spillover values for “motor vehicles” sector
(NACE 34) are nearly 45%, 47%, 40% and 46% respectively between 2003 and 2006 years (see Table 3.5) and
these figures are nearly same in each sector for three variables. 54
As mentioned before in section 3.3.1 in footnote 31, four sectors (NACE 16, 19, 23 and 30) were excluded
from the figures so they were not included to descriptive analysis.

86
“wood products” (NACE 20), 39% in “wearing apparel” (NACE 18) and 38% in “medical
instruments” (NACE 33)), and others experienced between 10% and 3% rise, on the other
hand eight sectors registered a fall in the horizontal variable (Figure 3.8), the lowest one is in
“textiles” sector (NACE 17) (56%). When we look at the change in backward variable, it is
positive in thirteen sectors and negative in five sectors. The positive change ranges from
0.6% in “rubber and plastic” sector (NACE 25) to 24% in “wearing apparel” (NACE 18),
and the negative change ranges from 0.8% in “electrical machinery” to 17% in “other
transport equipment” sector (NACE 35) (Figure 3.9). In the case of forward variable,
thirteen sectors have positive changes while five sectors have negative changes. The positive
change ranges from 0.1% in “other transport equipment” (NACE 31) to 9% in “chemical
products” (NACE24), and negative change ranges from 0.8% in “publishing and printing”
(NACE 22) to 21% in “wearing apparel” (NACE 18) (Figure 3.10).
In sum, these Figures indicate that “motor vehicles” sector has the highest horizontal and
backward spillovers value, and also it has the third highest value in forward spillover value
across all manufacturing sectors in Turkey. Moreover, it corresponds to the finding in section
3.3.1 in terms of the importance of foreign presence (MNCs) in the motor vehicles sector
(NACE 34) over all sectors. In other means, foreign firms in this sector have a very
important spillover effects on local firms through horizontal and vertical linkages. Especially
the backward spillover variable points out the importance of the relations between suppliers
and foreign customers (MNCs) in terms of technology acquisition or spillovers as well as
horizontal variable. Hence, this also again confirms our aim for choosing the automotive
industry as a case study to analyze the KTTs provided by customers to suppliers through
backward linkages.
Figure 3.7: Horizontal and Vertical Spillovers by 2-digit NACE
Average Values for 2003-2006

87
Figure 3.8: Change in the Horizontal Spillover Variable (2003-2006)
Figure 3.9: Change in the Backward Spillover Variable (2003-2006)
Figure 3.10: Change in te Forward Spillover Variable (2003-2006)
88
3.5. Econometric Concerns
In this section, several econometric concerns in terms of the analyses will be addressed. The
first concern is the omission of unobserved variables. There may be specific factors to firm
and sector known by only firm itself that affects the correlation between productivity and
spillovers55
. Hence, we included a full set of year and sector dummies ( ) to model in
equation 3.2 at 2, 3 and 4-digit sector level for controlling these unobservable variables56
.
We estimate our model alternatively on two samples: the first one with all the firms and the
second one with only local firms so as to isolate a possible spillover effect on local firms.
Foreign and local firms may have different technological capabilities (actually we assume
that foreign firms have better technological capabilities, see sections 5.1.6, 5.2.5, 5.4, 5.7.2,
5.8 and 5.10). Moreover, foreign investors generally invest in successful, bigger and
technologically more advanced firms, and these firms can have or/and can easily create more
linkages with other foreign firms than local ones in Turkey. For these reasons we estimate
our model on a sample of local firms (foreign share is less than 10% in the capital of the
firm). Furthermore, we assume that export oriented (EO) firms have weaker relationships
with foreign firms in Turkey than domestic oriented (DO) ones because EO firms must have
higher technological capabilities in order to meet the production standards of customers
abroad (see sections 5.1.5, 5.3.3, 5.5, 5.8.3) so their linkages with these customers can be
high than with foreign firms in Turkey. In sum, EO firms may benefit less from foreign firms
through spillovers in Turkey. To test this hypothesis, we alternatively estimate our model
also on a sample of both EO (exporting more than 50% of their output) and DO firms
(exporting 50% or less of their output). If we do not take into account these conditions the
estimation results could be biased.
In the estimation of the equation 3.2, fixed effect (FE) and random effect (RE) methods are
used in order to overcome a possible bias due to an unobservable time-invariant firm-specific
effect which is included among explanatory variables. Indeed, in the equation 3.2, the error
term can be decomposed into two elements : Where, ui accounts for any
unobservable firm specific time-invariant effect (hiring skilled employee, better
management, purchasing new technological machineries etc.) not included in the regression
55
These specific factors could be macroeconomic shocks, new production methods, new machines/technologies,
hiring experienced employee, high quality management, public subventions specific to sector, R&D incentives,
better infrastructure of the sector etc. 56
The numbers of the sector dummies included to regressions are 21 at 2-digit, 91 at 3-digit and 192 at 4-digit
NACE level.
89
but correlated with firm productivity. On the other hand, varies over firms, sectors and
time, and is assumed to be normally distributed with mean zero and variance and
assumed not to be correlated across sectors, firms, or time. If we use the OLS method, it does
not take into account a possible unobservable heterogeneity problem take the same
value for all firms) and this will lead to problem of heterogeneity bias. In the case of using
FE method, it will produce consistent (best and unbiased) estimates if there are other
variables affecting firm’s productivity not included in the model (assumed that are
correlated with the explanatory variables). On the other hand, using the RE method will
produce biased estimates, since it is assumed that error term is uncorrelated with the
regressors (Cameron and Trivedi, 2005; Greene, 2008 and Verbeek, 2008). Also to
discriminate between FE and RE methods, we carried out the Haussmann test57
.
As Moulton (1990) shows, regressions performed on micro units with aggregated sector
variables lead to serious downward bias in the errors from OLS, hence we also corrected
standard errors for clustering within firms.
In the literature argued that the use of OLS method could be inappropriate when estimating
productivity because this method treats inputs as exogenous variables and leads to biased
coefficients. Griliches and Mairesse (1995) stated that firms chose their inputs according to
their productivity so they should be taken as endogenous. Another problem with OLS is the
selection bias. To overcome these two problems several methods are suggested. The
important ones are Olley and Pakes (1996) (OP from here on)58
and Levinsohn and Petrin
(2003) (Levpet method from here on) semiparametric estimation procedures. We worked
hard to apply and test these procedures in our analysis but it could not be possible because of
unavailable capital stock series (it is necessary for OP method) and the short time duration of
the panel. In addition, we take the firms that appear in the dataset consecutively at least three
periods so we cannot determine a firm exits the sample59
(it is necessary for OP method).
Another concern is the multicollinearity among the explanatory variables. To assess the
multicollinearity problem, we conducted correlation analysis. In the result of this analysis,
some of the correlations are found significant but they are below +/- 0.3 and most are below
57
Haussmann test opted always in favor of the FE method in all estimations. 58
OP method use investment series as a proxy to eliminate the relationship between productivity shocks and
variable inputs. Also it takes into account entry-exit decisions of the firms to overcome selection bias. On the
other hand, an alternative to OP method, Levpet suggested using the material inputs as a proxy due to both large
number of zero observations in investment series and monotonically not increasing investment in productivity. 59
In other means, we did not take the firms that appear in the dataset one or two periods or not consecutively
three periods.

90
0.15. According to these results, multicollinearity problem between explanatory variables
will not occur; thereby it will not affect both the coefficients and interpretation of the results.
Summary statistics for explanatory variables used on the sample of all and local firms are
provided in Table 3.660
.
3.6. Estimation Results
The several variations of the model in equation 3.2 were estimated on a sample of all, local,
EO and DO firms at 2, 3 and 4-digit NACE level. FE and RE estimation procedures were
followed for the econometric analyses and Haussmann test was performed for which method
is the best. The results are exhibited in Tables 3.7 through 3.16, respectively61
.
3.6.1. Horizontal Technology Spillovers
Table 3.7 indicates horizontal spillover test results; firstly, we analyze the coefficients on
input and control variables. According to this table all the coefficients on input variables (K,
L, M and E) and Scale, at all digit estimates, are highly statistically significant (most of those
significant at 1‰ level) and positive as expected, on the other hand we get different results
for Foreign Share and Herfindahl variables. The coefficient on Foreign Share (0.115) is
significant (at 5% level) and positive when regression is only performed on a sample of DO
firms at 2-digit, and the coefficients on Herfindahl are positive and significiant (at 5% level)
when regressions are only performed on a sample of all (1.128) and local firms (1.276) at 2-
digit. The coefficients on Herfindahl turn into negative and statistically significant at 5%
level when regressions are performed on a sample of all firms (-0.311) at 3-digit, and on a
sample of all (-0.277), local (-0.288), and DO firms (-0.299) at 4-digit level. These results
mean that a firm’s production over average product in sector level affects positively its
productivity (scale effect), foreign equity in the capital of a firm does not affect productivity
(Foreign Share) (except DO firms at 2-digit level), and high competition level at 2-digit
sector level affects positively firm productivity but it affects negatively at both 3 and 4–digit
60
Summary statistics on the sample of EO and DO firms are not shown in the results because of space
restrictions. 61
One important caveat is that all variables are included to regression models by one by and tested, however,
they are presented in one column (last stage that all variables are included the model) in most of the Tables
because of space restrictions.

91
sector level (Herfindahl), in other means, competition level in the subsectors negatively
affects firm productivity.
The estimation results show that there are horizontal technology spillovers from foreign
firms to local firms that operate in the same sector62
. There are positive and highly
significant (at 1‰ level) horizontal technology spillovers for sample of all, local and DO
firms at all digit levels. However, the coefficient on Horizontal variable for EO firms is
statistically significant (at 5% level) only at 4-digit level. If we compare the coefficients
when estimation is performed on sample of all and local firms, irrespective of digit level,
coefficients on Horizontal variable appear be larger when estimation is performed on only
local firms. This means that local firms benefited more from the foreign presence in same
sectors. In the case estimation is performed on sample of EO and DO firms, coefficients on
Horizontal variable are highly significant for only DO firms at 2 and 3-digit levels. On the
other hand, at 4-digit level, coefficients on Horizontal variable are positive and significant
for both EO and DO firms but coefficient for DO firms is more significant (at 1‰) than
coefficient for EO firms (at 5%).
In sum, these results show that local and DO firms have more benefited from the foreign
presence in the same sector (through like as demonstration, competition or labor turnover
effects).
3.6.1.1. Horizontal Technology Spillovers with respect to Different Foreign
Shares
Showing the significant impact of horizontal technology spillovers on productivity in the
previous section, next we focus on different weighted output shares of foreign firms. To
analyze whether or not the degree of foreign share in the capital of the firm is important for
the generation of horizontal spillovers, we use four different measures of foreign
participation in ownership63
.
62
The coefficients on variables implies that a one percentage point increase in the variable is associated with a X
percent increase in the productivity of local firms, here X stands for estimated coefficient related to variable. 63
In line with Taymaz and Yılmaz (2008a).

92
a) In the first one, we do not impose any restriction on foreign share (FS)
(Horizontal_No Res, FS>0).
b) In the second one, foreign firms are defined as those firms if FS is at least 10% in
total capital of the firm (Horizontal_FS≥10%).
In the last two measures we use different degrees of foreign shares to capture the
impact of different degrees of foreign ownership.
c) In the first one, to analyze the impact of minority and majority-owned joint
ventures, we take three degrees of FS in firms;
i. between 10% and 49%, (Horizontal_10%≤FS≤49%)
ii. higher than 49% but less than 100%, (Horizontal_50%≤FS≤99%)
iii. full foreign ownership firms, (Horizontal_FS=100%)
d) Lastly we divide foreign firms into four groups;
i. FS between 10% and 39%, (Horizontal_10%≤FS≤39%)
ii. between 40% and 69%, (Horizontal_40%≤FS≤69%)
iii. between 70% and 99%, (Horizontal_70%≤FS≤99%)
iv. equal to 100% (Horizontal_FS=100%)
Different specifications of the original model are estimated using FE and RE methods64
, and
Tables 3.8 through 3.10 report regression results capturing defined four measures of FS
weighted horizontal spillover effects of foreign firms for the entire sample of all firms, for
local firms, for EO and for DO firms at 2, 3 and 4-digit level65
.
Sign and significance level of the coefficient estimates on Scale and Herfindahl are same or
very close to what are obtained for the original regression in Table 3.7 at all digit level
estimates for all samples on which regressions are estimated (all, local, EO or DO firms).
According to this, the coefficients on Scale are positive and highly significant (most of those
significant at 1‰ level) at all digit levels for all samples. The coefficients on Herfindahl are
only significant (at 5% level) and positive at 2-digit level for samples of all, for local and DO
firms (see Table 3.8). On the other hand, they are significant (at 5% level) and negative at
both 3 and 4-digit level for samples of all, local and DO firms (see Tables 3.9 and 3.10), we
could not find significance effect of Herfindahl for EO firms at any digit level.
64
In this case, Foreign Share variable is not included to models as an explanatory variable due to
multicollinearity problem with Horizontal variables. Besides, for robustness check we derived Foreign Share
variables for these groups, added and tested them in all models for same samples, but we could not find any
significant correlation between Foreign Share variables and productivity. 65
In all regressions, the models include constant and input variables (K, L, M and E) as explanatory variables
which all are significant at the 1‰ level, but not shown in the results for space reasons.

93
In the case of first two measures, (a) Horizontal variables with no restriction on FS
(Horizontal_NoRes) and (b) FS is higher than 10% (Horizontal_FS≥10%), highly
statistically significant (at 1‰ level) and positive coefficients are found at all digit levels for
all samples except for EO firms (significant only at 4-digit level for Horizontal_NoRes), and
these results are also same or very close to what obtained for original regression (see Table
3.7). In addition, these two variables have nearly same coefficients with regard to size and
significance level in all regressions. These results mean that whether or not putting a 10%
restriction on FS in the capital of the firm does not give rise to different significant results in
the generation of horizontal spillovers.
When we look at the regression results with respect to minority and majority foreign
ownership measures for sample of all and local firms at all digit levels (see Tables 3.8, 3.9
and 3.10), we obtain positive and highly significant coefficients on horizontal spillovers both
for majority (FS higher than 50% or 70%) (significant at least at 1% level) and full
ownership firms (FS is 100%) (at 1‰ level). Moreover, size of the coefficients on
Horizontal variables is larger when FS is higher, it is maximum in the case of full foreign
ownership, and hence there is a positive relationship between FS and horizontal spillovers.
On the other hand, we find negative and significant coefficients (at least at 5% level) on
horizontal spillovers at 2-digit level with minority joint venture (FS less than 50% or 40%),
and at 3-digit level for only local firms (FS less than 50%). Also when compared to all and
local firms, coefficients on Horizontal values appear be larger for local firms. In sum, these
figures indicate that local firms more benefited from foreign presence in the same sector but
especially more when FS is higher. The results also confirm that horizontal spillovers from
foreign firms with majority or full foreign ownership are more important and stronger than
the spillovers accruing from foreign firms under minority foreign ownership control.
When we look at the results for EO firms with respect to minority and majority foreign
ownership measures at all digit levels (see Tables 3.8, 3.9 and 3.10), we obtain positive and
significant coefficients (at least at 5% level) on horizontal spillovers only for full ownership
firms (FS is 100%) at both 3 and 4-digit level, on the other hand, we obtain negative and
significant coefficient only for minority joint venture (FS less than 39%) at 2-digit level.
This means that EO firms are more benefited from foreign presence in the same sector
especially when the FS is full ownership, and negatively affected when the FS is minority
ownership. In the case of DO firms, regression results confirm our first findings; we could
not find any positive and significant coefficients on horizontal spillovers with minority joint
venture foreign ownership (FS less than %50 or 40% at 2-digit, FS less than %50 or 70% at

94
both 3 and 4-digit ) at all digit levels, but we find positive and significant coefficients on
horizontal spillovers with majority joint venture (FS higher than 50% or 40% at 2-digit, FS
higher than 50% or 70% at both 3 and 4-digit) and full foreign ownership control (FS is
100%) at all digit levels. When compared to EO and DO firms, the significance level of the
coefficients on Horizontal variables for DO firms are higher than for EO firms at all digit
levels. Moreover, the size of the coefficients for DO firms is higher than for EO firms at 2-
digit level while they are smaller than for EO firms at both 3 and 4-digit levels. This means
that DO firms’ linkages with the foreign firms have very strong effect on their productivity.
In contrast to findings of earlier studies on Turkish manufacturing industry, the most
important result of this analysis is that we could not find any positive and significant
coefficients on horizontal spillovers with minority joint venture foreign ownership; on the
contrary, we found negative and significant coefficients on horizontal spillovers with
minority joint venture foreign ownership at 2-digit level. On the other hand, we found
positive and significant coefficients on horizontal spillovers with majority joint venture and
full foreign ownership control. These results again show that local and DO firms have more
benefited from the foreign presence in the same sector.
3.6.2. Vertical Technology Spillovers
Table 3.11 shows estimation results on horizontal and vertical technology spillovers66
at 2, 3
and 4-digit levels. It can be seen from the Table that when Backward, Forward and
lndemand variables are added to regression with Horizontal spillover variable, the
coefficients and significance level of the Foreign Share, Scale and Herfindahl variables have
not changed very importantly according to only horizontal spillover test results (see Table
3.7). These results confirm our first findings related to these variables. Firstly, there is no any
significant correlation between Foreign Share and productivity level of the firms at all digit
levels for all samples again (except only at 2-digit level for DO firms). Further, positive and
significant coefficients on the Scale are again found at all digit levels for all samples, and
again we find negative correlation between competition level (Herfindahl) and firm
productivity at both 3 and 4-digit level (except for EO firms at 4-digit level). In this case, the
only difference with regard to Herfindahl is that we could not find positive and significant
coefficient at 2–digit level for all and local firms compared to findings at Table 3.7.
66
The calculation of these spillover variables was explained in the previous section.

95
When we look at the new added lndemand variable, a highly significant and positive
correlation between lndemand and firm productivity is found at all digit levels for all
samples as expected (most of those significant at 1‰ level). When we compare the
coefficients of lndemand and Scale variables, we see that coefficients on the lndemand
variable are nearly three times larger than on the Scale variable. It means that increases in
the demand for inputs in sector level are more important than the firms’ output over the
average output of the sector for the productivity of firm.
The findings in Table 3.11 confirm that there is strong evidence again for horizontal
technology spillovers from foreign firms. We get same results with regard to first horizontal
test results (see Table 3.7), the coefficients are highly significant (at 1‰ level) at all digit
levels for sample of all, local and DO firms, and significant (at 5% level) and positive for EO
firms at only 4-digit level.
In the case of vertical spillovers, we get negative results for forward spillovers at each digit
level but get different results for backward spillovers. The coefficients on forward spillovers
are negative and highly significant (at 1‰ level) at all digit levels for all, local and DO
firms. In the case of backward spillovers, the coefficients are negative and significant (at
least at 5% level) at 2-digit level for all, local and DO firms, on the other hand, they are
positive and highly significant at both 3 and 4-digit level for same samples. In addition, we
could not find any significant effect of backward and forward spillovers for EO firms at all
digit levels. According to these results, the effects of backward and forward spillovers are in
the same way (negative) on the productivity of firms at 2-digit level, but they are in the
opposite direction at both 3 and 4-digit level (negative for forward and positive for
backward).
When we compare the samples of all and local firms at both 3 and 4-digit level, we see that
the size of the coefficients on vertical spillovers is larger (in absolute terms) in the case of
the sample of local firms only. This means that local firms benefited more from the foreign
presence in sectors they supply, while they more affected negatively from the foreign
presence in sectors they purchase inputs. Moreover, local firms are negatively affected from
both forward and backward spillovers at 2-digit level (negative effect of forward spillover is
higher than that of backward spillover).
Consequently, regression results yield different results for vertical spillovers according to
digit levels. At both 3 and 4-digit levels, positive and highly significant coefficients on the

96
proxies for spillovers through horizontal and backward linkages can be found for all, local
and DO firms but negative and significant coefficients on forward linkages for same
regressions (see section 3.6.3 about the possible explanation of the negative forward
spillovers). At 2-digit level, we find positive evidence of horizontal spillovers but negative
evidence of vertical spillovers (backward and forward) for the sample of all, local and DO
firms. On the other hand, when estimations are performed on EO firms, we find that the
coefficients on horizontal and vertical spillovers do not appear to be statistically significant;
this means that EO firms’ linkages with the foreign firms are very weak and not any effect
on their productivity.
3.6.2.1. Vertical Technology Spillovers with respect to Full-versus-Partial
Foreign Ownership
In this section, we want to analyze that how vertical spillover effects may differentiate with
respect to the degree of foreign ownership. In the earlier literature, it was assumed that,
mainly inspired from Javorcik (2004) and Jabbour and Mucchielli (2007), vertical linkages
associated with partially foreign owned firms lead to greater spillovers than linkages
associated with fully owned foreign firms. To test this hypothesis two new proxy variables
(fully and partially-owned) are calculated for each one of the backward and forward
spillovers in the following way:
∑ [(∑ )
∑ ] [3.9]
∑ [(∑ )
∑ ] [3.10]
Where FO is a dummy variable for fully-owned firms (full foreign ownership firms), and it
is equal to one for firms if FS is at least 99% in the capital of the firm. The other two
measures of Backward and Forward variables are calculated in the same way with a dummy
variable of PO for partially-owned firms (PO is defined as it is equal to one for firms if FS is
between 10% and 98% in the capital of the firm).
We estimated the equation 3.2 with included new variables in order to capture the vertical
spillovers with fully and partially-owned firms for samples of all and local firms at 2, 3 and

97
4-digit level (Table 3.12). In the estimation procedure, firstly we included partially and fully-
owned Backward variables (column 1) to the model, and then only partially and fully-owned
Forward variables (column 2) and lastly all of them were added together to the model
(column 3).
The estimation results (Table 3.12) give similar results and generally confirm our earlier
findings in Table 3.11 in terms of control variables (Foreign Share, Scale, Herfindahl and
lndemand), horizontal and vertical spillovers (negative effect of both backward and forward
at 2-digit, positive effect of backward and negative effect of forward at both 3 and 4-digit
level).
The estimation results show that backward spillovers through fully-owned firms have a
negative and significant effect (at least at 5% level) on the productivity of domestic firms (all
and local firms) at 2-digit level whereas backward spillovers through partially-owned firms
have a positive and highly significant effect (at least at 5% level) on the productivity of local
firms at both 3 and 4-digit level. Moreover, the size of the coefficients on backward
spillovers through partially-owned firms is larger at both 3 and 4-digit level, whereas it is
smaller (in absolute terms) at 2-digit level. This means that the backward linkages through
partially-owned firms have more positive effect on the productivity of the domestic firms
than through fully owned ones.
Forward spillovers through both partially and fully-owned firms have a negative effect on
the productivity of domestic firms but with different effects at each digit level. Forward
spillovers through partially-owned firms have a negative and highly significant effect (at 1‰
level) on the productivity of domestic firms at 2, 3 and 4-digit level, whereas forward
spillovers through fully-owned firms have a negative and significant effect only (at least 5%
level) at both 2 and 3-digit level (no significant at 4-digit level). Moreover, the size of the
coefficients on forward spillovers through partially-owned firms are larger (in absolute
terms), this means that the forward linkages through partially-owned firms have more
negative effect on the productivity of the domestic firms than through fully owned ones.
In summary, at both 3 and 4-digit estimation level, spillovers through partially-owned firms
give rise to positive effect for backward and to negative effect for forward spillovers on the
productivity of domestic firms. On the other hand, at 2-digit level, backward and forward
spillovers through both fully and partially-owned firms have negative effects on the
productivity. These findings overlap our earlier findings in previous section 3.6.2.
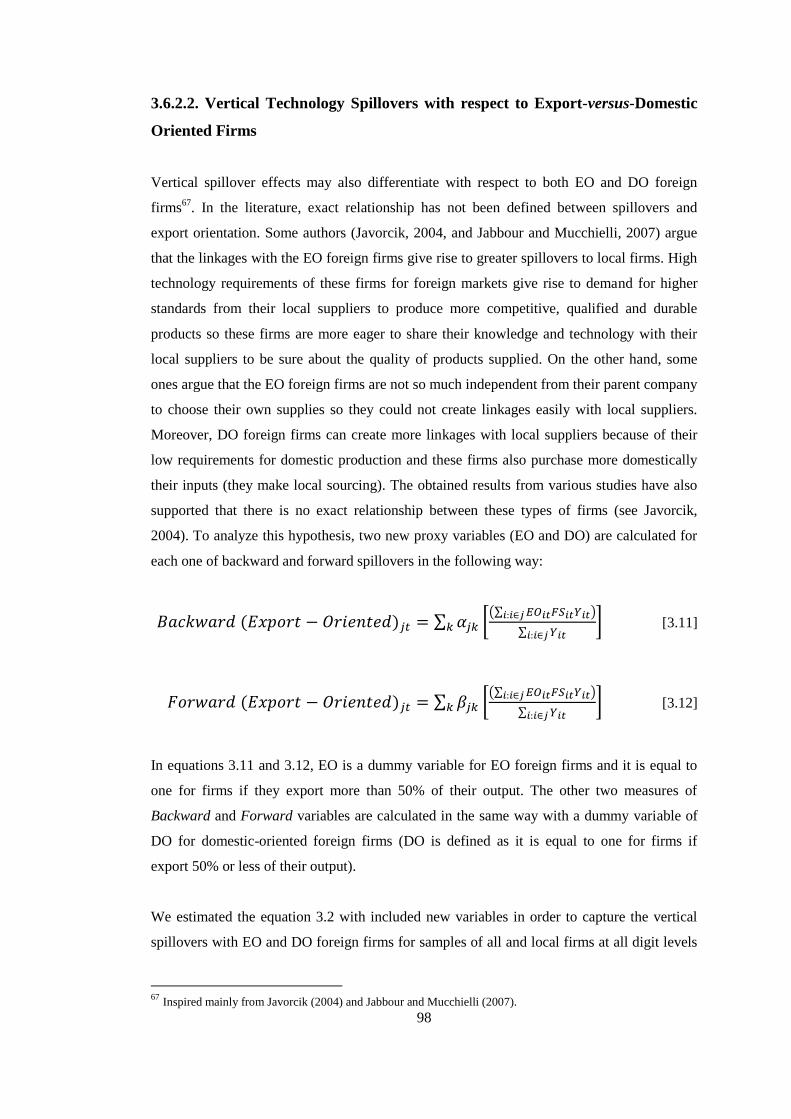
98
3.6.2.2. Vertical Technology Spillovers with respect to Export-versus-Domestic
Oriented Firms
Vertical spillover effects may also differentiate with respect to both EO and DO foreign
firms67
. In the literature, exact relationship has not been defined between spillovers and
export orientation. Some authors (Javorcik, 2004, and Jabbour and Mucchielli, 2007) argue
that the linkages with the EO foreign firms give rise to greater spillovers to local firms. High
technology requirements of these firms for foreign markets give rise to demand for higher
standards from their local suppliers to produce more competitive, qualified and durable
products so these firms are more eager to share their knowledge and technology with their
local suppliers to be sure about the quality of products supplied. On the other hand, some
ones argue that the EO foreign firms are not so much independent from their parent company
to choose their own supplies so they could not create linkages easily with local suppliers.
Moreover, DO foreign firms can create more linkages with local suppliers because of their
low requirements for domestic production and these firms also purchase more domestically
their inputs (they make local sourcing). The obtained results from various studies have also
supported that there is no exact relationship between these types of firms (see Javorcik,
2004). To analyze this hypothesis, two new proxy variables (EO and DO) are calculated for
each one of backward and forward spillovers in the following way:
∑ [(∑ )
∑ ] [3.11]
∑ [(∑ )
∑ ] [3.12]
In equations 3.11 and 3.12, EO is a dummy variable for EO foreign firms and it is equal to
one for firms if they export more than 50% of their output. The other two measures of
Backward and Forward variables are calculated in the same way with a dummy variable of
DO for domestic-oriented foreign firms (DO is defined as it is equal to one for firms if
export 50% or less of their output).
We estimated the equation 3.2 with included new variables in order to capture the vertical
spillovers with EO and DO foreign firms for samples of all and local firms at all digit levels
67
Inspired mainly from Javorcik (2004) and Jabbour and Mucchielli (2007).

99
(see Table 3.13). In the estimation procedure, firstly we included EO and DO Backward
variables (column 1) to the model, and then only EO and DO Forward variables (column 2)
and lastly all of them were added together to the model (column 3).
The estimation results (see Table 3.13) show similar patterns and confirm our earlier
findings in Tables 3.11 and 3.12 in terms of both control variables (Foreign Share, Scale,
Herfindahl and lndemand) and horizontal spillovers.
The estimation results (Table 3.13) show that backward spillovers through EO foreign firms
have negative and highly significant effects (most of those significant at 1‰ level) on the
productivity of domestic firms (all and local firms) at all digit levels, whereas backward
spillovers through DO foreign firms have positive and significant effects (at least at 5%
level) on the productivity of domestic firms at both 3 and 4-digit levels. Moreover, backward
linkages through both EO and DO foreign firms have negative effect on productivity at 2-
digit level (column 1); this result is compatible to our previous findings at 2-digit level (see
Tables 3.11 and 3.12). In sum, these results mean that backward linkages through DO
foreign firms offer greater opportunities for productivity increases than through EO ones at
both 3 and 4-digit levels. However, the backward linkages through both EO and DO foreign
firms give rise to negative effect on the productivity at 2-digit level. Contrary to backward
spillovers, we find positive and highly significant coefficients (at least at 5% level) on
forward spillovers through EO foreign firms for domestic firms, whereas we find negative
and highly significant correlation between productivity and forward spillovers through DO
foreign firms at all digit levels. These results mean that forward linkages through EO foreign
firms offer greater opportunities for productivity increases than through DO ones.
3.6.3. Technology Gap and Technology Spillovers
In the literature assumed that local firms must have a certain absorptive capacity to benefit
from technology spillovers from foreign firms. It is clear that benefiting from the technology
spillovers does not happen spontaneously and directly, it is required to have certain
technological capabilities and efforts in order to benefit and to absorb the foreign
technology. Therefore, absorptive capacity of the firms (or the technological gap with
foreign firms) has a deterministic role in the generation of horizontal and vertical technology
spillovers arising from foreign firms.

100
In this study, we will try to measure the absorptive capacity of the firms with “technological
gap” (TGAP) variable. If TGAP is high between local and foreign firms this means that
absorptive capacity of the local firms is low, and vice versa. It is clear that it is necessary to
have a certain absorptive capacity to benefit from horizontal spillovers. For backward
spillovers, if the TGAP between local suppliers and foreign buyers are high, foreign buyers
may not prefer to work with these suppliers, if they prefer, in this case, local suppliers could
not be benefited from these backward spillovers. In the case of forward spillovers, similarly,
high TGAP between local firms and foreign suppliers most probably give rise to not
utilization of local firms from the highly technological inputs of foreign firms due to not
absorbing the technology embedded in the product purchased (Jabbour and Mucchielli,
2007). In fact, the last situation may be the explanation of the negative forward spillovers
found in the previous sections. In summary, we want to examine whether the TGAP or the
absorptive capacity may affect the horizontal and vertical technology spillovers.
In this study, in order to analyze the impact of TGAP on technology spillovers according to
different threshold levels, three versions of TGAP have been defined in the following way at
firm-level:
(
)
[3.13]
[3.14]
[3.15]
In the above versions of TGAP, in the equations 3.13 and 3.14 is the total factor
productivity (TFP) of the local firm i in sector j in time t; (
) is the average
of the TFP of foreign firms in sector j at time t. In the equations 3.14 and 3.15,
is the 90th percentile of the TFP of the firms in sector j at time t, and in
the equation 3.15 is the TFP of the firm i in sector j in time t68
.
In the construction of three version of TFP, it is aimed to analyze in which ways each one
affects the technology spillovers. In the first version (equation 3.13), TGAP is the difference
between the TFP of the local firms and average of the TFP of foreign firms in the same
68
In the calculation of the TFP for each firm i in sector j at time t, we assumed constant returns to scale (CRS),
and we weighted each production factor by their own share in real output.

101
sector69
, in the second one, it is the difference between the TFP of the local firm and that of
90th percentile firm in the same sector, and lastly it is the difference between the TFP of a
firm and that of 90th percentile firm in the same sector. (
) and
are calculated at 2, 3 and 4-digit NACE so each version of TGAP is also calculated at 2, 3, 4-
digit level. For versions of both 1 and 2 of TGAP, we define a positive TGAP dummy
variable that take the value one if , and we interact this dummy with horizontal
and vertical technology spillovers (Backward and Forward)70
. On the other hand, in version
3, we interact TGAP value directly with such spillover variables. The estimations are
performed with our original variables (production side variables, control variables,
Horizontal, Backward and Forward variables) in each version of TGAP for samples of all,
local, EO and DO firms at all digit levels. It is expected a negative effect of TGAP interacted
spillover variables on the productivity level of the firms because of aforementioned
reasons71
.
Even in the presence of TGAP, estimation results (see Tables 3.14 through 3.16) confirm our
earlier findings and show similar patterns related to the signs and significant levels of the
coefficients in terms of control variables72
, Horizontal and vertical (Backward and Forward)
spillover variables in each version of TGAP at all digit levels.
When we analyze the estimation results in terms of TGAPV.1
(equation 3.13), it is found that
the coefficients on TGAP interacted with Forward (Tgap*Forward) are negative and highly
significant at all digit levels (except EO firms at both 3 and 4-digit levels) (see Table 3.14).
These figures indicate that local firms with low absorptive capacity have been benefited less
from forward spillovers at all digit levels, in other words, highly technological firms benefit
more from these spillovers. This fact may be the explanation of the negative forward
spillovers found in the previous sections. Although we could not find any significant
evidence on TGAP variables interacted with Horizontal (Tgap*Horizontal) and Backward
spillovers (Tgap*Backward) at all digit levels, the size and signs of the coefficients show
similar patterns with Horizontal and Backward spillover variables (positive for
Tgap*Horizontal at all digit levels, negative at 2-digit and positive at both 3 and 4-digit level
for Tgap*Backward variable).
69
It was defined similar to Jabbour and Mucchielli (2007), but they constructed the variable only at 2-digit level. 70
We derived all variables including TFP and TGAP dummy at 2, 3 and 4-digit levels except Backward,
Forward and lndemand because of only available 2-digit IO matrix. The details were discussed already in the
section 3.4.3.3. 71
In other means, it is expected a negative correlation between TGAP interacted spillovers and productivity. 72
Foreign Share, Scale, Herfindahl and lndemand

102
In the case of other two versions of TGAP (TGAPV.2
and TGAP
V.3 in the equations 3.14 and
3.15), estimations produced similar results with regard to TGAP variables interacted with
Horizontal, Backward and Forward (see Tables 3.15 and 3.16). We could not find any
significant evidence on TGAP variables interacted with Horizontal (Tgap*Horizontal) and
Backward spillovers (Tgap*Backward) at both 3 and 4-digit levels. On the other hand, most
important finding is that the coefficients on TGAP variable interacted with Backward
(Tgap*Backward) are negative on all samples at 2-digit level (except for the sample of EO
firms), whereas the coefficients on TGAP variable interacted with Horizontal
(Tgap*Horizontal) are positive and significant for all samples at 2-digit level. The
coefficients on TGAP interacted with Forward (Tgap*Forward) once again are negative and
significant at all digit levels for all the samples at each version of TGAP.
Consequently, the results confirm the importance of absorptive capacity of the firms to
benefit from spillovers but produce different results for both horizontal and vertical
spillovers. According to this, we found negative evidence on TGAP interacted with Forward
spillovers at each version of TGAP at all digit levels. By the way, we could not find such
evidences on TGAP interacted with Horizontal and Backward spillovers at all digit levels of
TGAPV.1
, and at both 3 and 4 digit-levels of both TGAPV.2
and TGAP
V.3. On the other hand,
TGAP interacted with Backward are negative, whereas TGAP interacted with Horizontal are
positive at 2-digit level of both TGAPV.2
and TGAP
V.3.
3.7. Robustness Checks
In this section, we describe additional extensions and robustness checks that carried out in
the context of the analyses in order to assess the robustness of the estimation results.
Firm characteristic variables that alternatively studied and tested
o Share of export in total sales,
o Share of imported machinery and equipment in total machinery and equipment
stock,
o R&D expenditure share and R&D employment share,
o Amount spent on imported license purchases relative to total sales,
o Firm size dummies measured by number of employees (50-100 low-sized, 100-
250 medium sized, 250 and higher large-sized firms).
One and two period lagged spillovers were used for horizontal, backward and forward
variables in order to test the endogeneity problem,

103
Alternatively, standard errors were not clustered, and clustered for all observations in
the same industry and year for each digit level,
Foreign dummy variable was alternatively used for the firms with at least 10% foreign
share instead of the foreign share variable,
Foreign equity share-weighted labor (L) was alternatively used for horizontal,
backward and forward variables instead of weighted output (Y),
Share of the firms in sector level was used instead of scale variable,
In the calculation of forward variable, to take into account net domestic gross output
of the firm, exports of the firm was excluded from the gross output73
,
Alternative models were estimated by using three different proxies for dependent
variable: Logarithm of value added , value added per employee (or labor
productivity) ⁄ ) and production revenue at firm level were
alternatively tested as a dependent variable instead of logarithm of gross output
variable ),
One and two period time differencing method was used for the variables to test the
omission of unobserved variables,
The vertical (backward and forward) spillovers were recalculated and tested by not
including the inputs supplied within the sector (the case where j≠k). In other means,
we excluded the inputs supplied within sector,
In the estimation of the models, “OP”, “LevPet”, “dynamic panel data”, “GMM
estimation” and “Arrelano and Bond dynamic panel GMM” estimation methods were
alternatively tested.
All analyses and models stated in this chapter were performed for the above cases. None of
these alternative specifications affected the results, they exhibited similar patterns as those
reported in this chapter or we could not find any significant effects; therefore they were not
included in the section.
73 ∑
(∑ )
∑ , X is export
104
3.8. Summary
In this chapter, a series of econometric analyses were conducted to test for the presence of
technology spillovers taking place through horizontal and vertical spillovers. The main
findings can be summarized as follows:
Our findings generally suggest that there are horizontal technology spillovers accruing from
foreign to local firms that operate in the same industry:
When we compare the DO and EO firms, horizontal linkages of EO firms with foreign
firms operating in Turkey seem to be rather weak, resulting in a statistically
insignificant impact of FDI-related spillovers on their productivity. In sum, these
results show that local and DO firms have more benefited from the foreign presence in
the same sector in contrast to firms producing mainly for the export market.
When minority or majority foreign ownership are taken into account, horizontal
spillovers seem to originate from foreign firms with majority or under full foreign
ownership while no such effect is associated with minority foreign ownership firms.
These figures indicate that domestic firms more benefited from foreign presence in the
same sector especially when foreign ownership is higher in the foreign firms.
These findings are in contrast to those of earlier studies on Turkish manufacturing
industry on the same issue which found either a negative significant or a non-
significant effect of FDI-related horizontal technology spillovers on firm performance.
In the case of horizontal and vertical spillovers, our results show that horizontal spillovers
are again positive and highly significant, on the other hand forward spillovers (linkages
between foreign suppliers of inputs and their local customers) have negative effects on the
productivity of local firms. With respect to backward spillovers (linkages between foreign
firms and their local suppliers), our findings suggest that local firms are negatively affected
at 2-digit level, but positively affected at both 3 and 4-digit level. This means that local firms
benefited more/(less) from the foreign presence in sectors they supply at both 3 and 4-digit
level/(at 2-digit level), while they more affected negatively from the foreign presence in
sectors they purchases inputs.
We find that only DO firms benefit from horizontal and backward linkages compared
to EO firms. This means that EO firms’ horizontal and vertical linkages with the
foreign firms are very weak and not any effect on their productivity.

105
In addition, vertical linkages associated with partially and fully-owned foreign firms
give rise to negative effects on the productivity of domestic firms at 2-digit level. On
the other hand, backward linkages through partially-owned firms have positive effects,
while forward linkages through partially-owned firms have negative effects on the
productivity of the domestic firms.
When vertical linkages associated with EO and DO are taken into account, backward
spillovers associated with EO foreign firms negatively impact on the productivity
level of the domestic firms, while forward spillovers positively impact on that. In the
case of vertical linkages associated with DO foreign firms, we found positive effects
for backward spillovers and negative effects for forward spillovers. In sum, we can
say that forward linkages through EO foreign firms and backward linkages through
DO firms offer greater opportunities for productivity increases.
Estimation results on the TGAP have also showed the significance of absorptive capacity of
the firms in order to utilize from the vertical technology spillovers. Especially, the findings
on the TGAP variable interacted with forward spillover reveal that local firms with low
absorptive capacity have been benefited less from forward spillovers, in other words, highly
technological firms benefit more from these spillovers. In a similar way, TGAP variable
interacted with backward spillover gives rise to same conclusion. However, TGAP variable
interacted with Horizontal spillover produced opposite results. According to this, firms with
low absorptive capacity benefit more from horizontal technology spillovers.

106
Table 3.1: Classification of Manufacturing Industries at 2-Digit NACE
Source: Based on TurkStat ISSS database
Nace Code
(Rev.1.1)Industry
15 Manufacture of food products and beverages
16 Manufacture of tobacco products
17 Manufacture of textiles
18 Manufacture of wearing apparel; dressing and dyeing of fur
19 Manufacture of leather and leather products
20 Manufacture of wood and wood products
21 Manufacture of pulp, paper and paper products
22 Publishing, printing and reproduction of recorded media
23 Manufacture of coke, refined petroleum products and nuclear fuel
24 Manufacture of chemicals and chemical products
25 Manufacture of rubber and plastic products
26 Manufacture of other non-metallic mineral products
27 Manufacture of basic metals
28 Manufacture of fabricated metal products, except machinery and equipment
29 Manufacture of machinery and equipment n.e.c.
30 Manufacture of office machinery and computers
31 Manufacture of electrical machinery and apparatus n.e.c.
32 Manufacture of radio, television and communication equipment and apparatus
33 Manufacture of medical, precision and optical instruments, watches and clocks
34 Manufacture of motor vehicles, trailers and semi-trailers
35 Manufacture of other transport equipment
36 Manufacture of furniture; manufacturing n.e.c.

107
Table 3.2: Distribution of Firms with Foreign Capital, by 2-digit NACE and Year
Source: Author calculations based on TurkStat’s ISSS database
* Foreign share is at least 10% of total capital
NACE
Codes at
two-digit
Firms
with
Foreign
Capital*
Share of
Firms with
Foreign
Capital in
the sector
(%)
All
Firms
Firms
with
Foreign
Capital*
Share of
Firms with
Foreign
Capital in
the sector
(%)
All
Firms
Firms
with
Foreign
Capital*
Share of
Firms with
Foreign
Capital in
the sector
(%)
All
Firms
Firms
with
Foreign
Capital*
Share of
Firms with
Foreign
Capital in
the sector
(%)
All
Firms
Number
of
Foreign
Firms
Number
of Firms
15 43 5.33 807 46 5.50 837 42 5 840 46 5.72 804 177 3288
16 5 50 10 3 30 10 3 30 10 5 55.56 9 16 39
17 23 1.86 1235 21 1.68 1251 17 1.37 1238 16 1.37 1171 77 4895
18 31 2.83 1095 31 2.80 1108 33 2.95 1120 26 2.55 1018 121 4341
19 0 0 180 1 0.53 188 0 0 186 0 0 169 1 723
20 2 1.85 108 2 1.77 113 2 1.80 111 2 1.87 107 8 439
21 11 6.59 167 13 7.60 171 12 7.10 169 15 8.98 167 51 674
22 3 2.04 147 2 1.30 154 2 1.30 154 3 2.01 149 10 604
23 1 10 10 1 9.09 11 1 9.09 11 1 11.11 9 4 41
24 52 18.57 280 57 19.59 291 55 18.84 292 58 21.01 276 222 1139
25 26 5.87 443 26 5.69 457 23 5.05 455 24 5.58 430 99 1785
26 23 4.56 504 20 3.85 519 23 4.47 514 20 4.05 494 86 2031
27 14 4.76 294 13 4.32 301 13 4.39 296 13 4.48 290 53 1181
28 18 3.54 508 20 3.83 522 16 3.01 531 20 4.06 493 74 2054
29 20 3.21 623 26 4.06 641 26 4.06 641 25 4.11 608 97 2513
30 0 0 5 0 0 5 0 0 5 0 0 5 0 20
31 18 7.66 235 16 6.56 244 19 7.66 248 17 7.42 229 70 956
32 2 4.26 47 2 4.17 48 2 4.26 47 2 4.65 43 8 185
33 6 8.96 67 7 10.29 68 4 5.88 68 6 9.23 65 23 268
34 49 16.72 293 52 17.57 296 49 16.84 291 48 17.02 282 198 1162
35 7 8.43 83 6 7.06 85 6 6.74 89 6 7.41 81 25 338
36 17 4.56 373 16 4.21 380 18 4.69 384 18 4.93 365 69 1502
Total 371 4.94 7514 381 4.95 7700 366 4.75 7700 371 5.11 7264 1489 30178
2003 2004 2005 2006 Total

108
Table 3.3: Shares of the Foreign Firms in the Sector Level Variables,
by 2-digit NACE and Year*
(i) Share of Foreign Firms
in Total Number of Firms by year (%)
(ii) Share of Foreign Firms
in Total Employment by year (%)
(iii) Share of Foreign Firms in
Total Gross Output by year (%)
(iv) Share of Foreign Firms
in Total Value Added by year (%)
Source: Author calculations based on TurkStat’s ISSS database
* Foreign share is at least 10% in the capital
Ave.: Average
NACE 2003 2004 2005 2006
15 5.33 5.50 5.00 5.72
16 50 30 30 55.56
17 1.86 1.68 1.37 1.37
18 2.83 2.80 2.95 2.55
19 0 0.53 0 0
20 1.85 1.77 1.80 1.87
21 6.59 7.60 7.10 8.98
22 2.04 1.30 1.30 2.01
23 10.00 9.09 9.09 11.11
24 18.57 19.59 18.84 21.01
25 5.87 5.69 5.05 5.58
26 4.56 3.85 4.47 4.05
27 4.76 4.32 4.39 4.48
28 3.54 3.83 3.01 4.06
29 3.21 4.06 4.06 4.11
30 0 0 0 0
31 7.66 6.56 7.66 7.42
32 4.26 4.17 4.26 4.65
33 8.96 10.29 5.88 9.23
34 16.72 17.57 16.84 17.02
35 8.43 7.06 6.74 7.41
36 4.56 4.21 4.69 4.93
Ave. 7.80 6.88 6.57 8.32
NACE 2003 2004 2005 2006
15 14.19 13.77 14.08 16.24
16 68.49 36.18 54.55 71.03
17 3.58 3.06 2.20 1.74
18 5.69 5.06 5.66 4.67
19 0 0.18 0 0
20 1.92 1.62 1.56 1.18
21 14.25 15.41 15.62 17.21
22 1.68 1.20 0.56 1.51
23 11.88 12.98 12.93 13.87
24 33.51 35.10 33.31 39.34
25 19.67 18.78 17.67 17.29
26 6.23 6.08 5.05 5.39
27 7.74 6.58 6.46 9.56
28 4.76 5.25 3.97 5.43
29 10.63 12.04 11.95 11.93
30 0 0 0 0
31 33.73 30.07 32.08 29.73
32 27.01 29.72 32.75 35.32
33 8.83 9.83 5.25 6.73
34 57.57 56.82 47.32 55.41
35 20.40 18.60 16.43 17.20
36 9.62 9.53 9.36 9.56
Ave. 16.43 14.90 14.94 16.83
NACE 2003 2004 2005 2006
15 20.37 21.18 21.77 23.67
16 88.93 61.43 66.63 88.54
17 3.59 3.97 3.28 1.65
18 5.79 6.48 7.01 6.56
19 0 0.03 0 0
20 0.96 0.82 0.84 0.81
21 25.96 29.88 29.59 30.76
22 3.69 3.34 0.38 3.13
23 13.83 11.43 15.76 10.94
24 40.18 42.86 45.11 48.45
25 32.80 30.49 27.85 27.91
26 13.43 12.93 11.34 14.28
27 13.58 11.07 10.50 10.45
28 13.18 14.66 10.42 13.73
29 21.32 21.44 20.97 21.02
30 0 0 0 0
31 46.60 46.49 45.01 38.22
32 45.61 43.68 47.14 51.29
33 11.19 11.66 7.42 15.13
34 81.27 82.40 60.16 80.31
35 24.85 23.22 21.20 25.15
36 16.15 14.74 12.29 11.37
Ave. 23.79 22.46 21.12 23.79
NACE 2003 2004 2005 2006
15 26.92 29.83 33.43 30.49
16 83.62 59.83 65.55 89.52
17 3.94 4.85 4.31 1.55
18 5.41 6.52 6.86 6.55
19 0 0 0 0
20 1.27 0.95 0.51 1.04
21 25.80 35.15 35.40 36.32
22 2.57 2.66 0.65 1.96
23 9.37 38.39 30.87 0.52
24 36.18 44.76 44.35 49.50
25 39.73 41.06 37.81 38.98
26 11.73 11.22 9.20 12.44
27 16.60 9.86 10.07 12.56
28 10.71 12.39 10.52 12.04
29 17.85 19.22 22.37 20.59
30 0 0 0 0
31 45.92 44.66 47.76 57.85
32 40.18 43.91 45.98 53.32
33 11.62 14.28 6.89 12.34
34 79.01 79.56 55.90 73.21
35 17.69 16.39 14.95 16.89
36 22.58 20.70 16.60 21.00
Ave. 23.12 24.37 22.73 24.94

109
Table 3.4: Additional Summary Statistics for Spillover Variables by Year (%)
Source: Author calculations based on TurkStat’s ISSS database
*FS is at least 10%, and at 2-digit NACE level
Table 3.5: Values of Horizontal and Vertical Spillovers,
by 2-digit NACE and Year, (%)
Source: Author calculations based on TurkStat’s ISSS database. Ave. means Average
Year Obs. Min. Max. Mean Std.Dev. Min. Max. Mean Std.Dev. Min. Max. Mean Std.Dev.
2003 7514 0 74.83 12.20 11.73 1.86 74.81 13.98 10.09 3.95 35.60 11.87 6.47
2004 7700 0 52.01 12.44 11.99 2.04 50.08 14.22 10.18 4.40 28.41 12.28 6.53
2005 7700 0 53.88 11.78 11.27 2.17 53.86 13.53 8.97 4.28 29.34 11.94 6.43
2006 7264 0 75.69 12.41 12.17 2.34 75.67 14.57 10.24 3.11 35.49 12.09 7.03
Horizontal* Backward* Forward*
NACE 2003 2004 2005 2006 Ave. 2003 2004 2005 2006 Ave. 2003 2004 2005 2006 Ave.
15 14.07 13.83 14.02 15.87 14.45 14.30 14.11 14.30 16.09 14.70 15.53 15.35 15.30 16.66 15.71
16 74.83 50.09 53.88 75.69 63.62 74.81 50.08 53.86 75.67 63.61 35.60 28.41 29.34 35.49 32.21
17 2.43 2.90 2.69 1.06 2.27 3.65 4.07 4.08 3.35 3.79 7.21 7.93 7.85 6.58 7.39
18 3.58 4.01 4.54 4.97 4.28 4.94 5.33 5.72 6.10 5.52 3.95 4.40 4.28 3.11 3.94
19 0.00 0.03 0.00 0.00 0.01 1.86 2.04 2.17 2.34 2.10 5.50 5.74 5.71 5.57 5.63
20 0.65 0.64 1.00 0.96 0.81 8.34 7.84 7.12 7.19 7.62 9.87 10.31 10.51 10.57 10.31
21 22.22 21.14 21.27 21.60 21.56 18.73 17.10 16.87 19.12 17.95 20.71 20.54 20.70 20.82 20.69
22 3.61 3.43 0.38 3.20 2.66 13.16 13.57 12.12 13.54 13.10 19.71 19.30 18.94 19.56 19.38
23 5.74 6.37 7.57 4.83 6.13 10.51 11.02 11.11 10.55 10.79 8.66 9.33 10.07 8.24 9.08
24 32.82 35.87 37.01 37.07 35.70 17.98 18.63 18.45 18.61 18.42 25.06 26.72 27.07 27.20 26.51
25 21.05 19.40 17.62 17.97 19.01 23.00 22.78 21.30 23.14 22.55 23.28 24.17 23.99 24.20 23.91
26 9.14 9.60 7.67 9.33 8.94 12.40 12.82 11.54 12.79 12.39 13.39 13.99 12.99 13.90 13.57
27 4.29 4.19 3.99 4.65 4.28 15.59 15.99 14.66 15.94 15.55 5.98 6.05 5.74 6.39 6.04
28 10.55 11.54 8.66 10.29 10.26 26.04 27.02 24.10 26.46 25.91 8.41 8.58 8.05 8.72 8.44
29 14.04 14.18 15.81 15.19 14.81 15.36 15.03 15.29 16.04 15.43 11.45 11.56 11.51 11.85 11.59
30 0.00 0.00 0.00 0.00 0.00 16.22 15.04 14.91 16.61 15.70 17.05 17.14 17.08 17.91 17.29
31 36.05 36.78 37.89 34.58 36.33 29.53 30.04 30.70 29.31 29.90 19.13 19.38 19.04 18.73 19.07
32 23.99 23.70 24.97 26.97 24.91 22.73 22.56 23.69 25.17 23.54 20.25 20.10 20.53 21.33 20.55
33 10.11 8.68 5.17 13.93 9.47 25.41 25.62 23.97 27.28 25.57 15.13 15.17 14.53 15.84 15.17
34 49.16 52.01 43.34 50.78 48.82 44.83 47.32 39.71 46.26 44.53 21.79 22.56 19.31 21.90 21.39
35 9.86 7.82 7.25 7.39 8.08 11.26 9.55 8.90 9.35 9.76 13.55 13.86 12.85 13.56 13.45
36 11.56 10.34 8.48 8.25 9.66 9.99 9.71 8.97 9.14 9.45 8.84 8.78 8.13 8.08 8.46
Ave. 16.35 15.30 14.69 16.57 15.73 19.12 18.06 17.43 19.55 18.54 15.00 14.97 14.71 15.28 14.99
Horizontal Backward Forward

110
Table 3.6: Summary Statistics for Explanatory Variables
Source: Author calculations based on TurkStat’s ISSS database
Note: The statistics for the Herfindahl, Scale, Horizontal and TGAP interacted variables calculated
and used also at both 3 and 4-digit are given at 2-digit NACE
Obs. Mean Std. Min. Max. Obs. Mean Std. Min. Max.
Dev. Dev.
Ln Y 30,178 15.47 1.43 8.16 22.34 28,689 15.38 1.37 8.16 22.34
Ln K 30,178 11.76 2.09 0.12 19.34 28,689 11.67 2.04 0.12 19.34
Ln L 30,178 4.27 0.96 3.00 9.19 28,689 4.22 0.93 3.00 9.19
Ln M 29,761 14.79 1.67 0.04 21.91 28,292 14.70 1.62 0.04 21.89
Ln E 29,773 11.80 1.76 0.01 18.98 28,292 11.73 1.73 0.01 18.98
Foreign Share (%) 30,178 3.58 16.98 0 100 - - - - -
Scale 30,178 1.00 3.35 0.0002 183.62 28,689 0.87 3.04 0.0002 183.62
Herfindahl (%) 30,178 2.89 3.89 0.49 36.17 28,689 2.84 3.84 0.49 36.17
lndemand 30,178 23.629 1.018 20.77 25.41 28,689 23.632 1.019 20.77 25.41
Horizontal (%) 30,178 12.20 11.79 0 75.69 28,689 11.72 11.31 0 75.69
Backward (%) 30,178 14.07 9.88 1.86 75.67 28,689 13.75 9.61 1.86 75.67
Forward (%) 30,178 12.04 6.62 3.11 35.60 28,689 11.83 6.49 3.11 35.60
Backward_(Partially-Owned) (%) 30,178 6.78 5.19 0.65 42.71 28,689 6.63 5.02 0.65 42.71
Backward_(Fully-Owned) (%) 30,178 7.29 5.18 0.81 35.31 28,689 7.13 5.08 0.81 35.31
Backward_(Export Oriented) (%) 30,178 2.19 1.89 0.53 50.44 28,689 2.13 1.65 0.53 50.44
Backward_(Domestic Oriented) (%) 30,178 12.03 8.66 1.72 43.12 28,689 11.76 8.45 1.72 43.12
Forward_(Partially-Owned) (%) 30,178 5.38 2.58 1.39 17.86 28,689 5.30 2.53 1.39 17.86
Forward_(Fully-Owned) (%) 30,178 6.67 4.62 1.60 20.35 28,689 6.53 4.53 1.60 20.35
Forward_(Export Oriented) (%) 30,178 1.26 0.72 0.44 14.79 28,689 1.23 0.67 0.44 14.79
Forward_(Domestic Oriented) (%) 30,178 10.78 6.03 2.65 24.69 28,689 10.59 5.93 2.65 24.69
Horizontal_No Res (%) 30,178 12.26 11.78 0 75.69 28,689 11.78 11.30 0 75.69
Horizontal_10% ≤ FS ≤ 49% (%) 30,178 1.52 2.32 0 12.87 28,689 1.46 2.22 0 12.87
Horizontal_50% ≤ FS ≤ 99% (%) 30,178 5.75 5.42 0 52.69 28,689 5.56 5.25 0 52.69
Horizontal_10% ≤ FS ≤39% (%) 30,178 0.72 0.98 0 5.65 28,689 0.69 0.94 0 5.65
Horizontal_40% ≤ FS ≤ 69% (%) 30,178 2.69 3.75 0 26.97 28,689 2.60 3.63 0 26.97
Horizontal_70% ≤ FS ≤ 99% (%) 30,178 3.86 4.36 0 52.69 28,689 3.74 4.18 0 52.69
Horizontal_FS=100% (%) 30,178 4.93 6.20 0 30.47 28,689 4.70 5.97 0 30.47
Tgap*Horizontal (%) 30,178 9.49 10.90 0 75.69 28,689 9.98 10.96 0 75.69
Tgap*Backward (%) 30,178 11.07 9.92 0 75.67 28,689 11.65 9.84 0 75.67
Tgap*Forward (%) 30,178 9.57 7.46 0 35.60 28,689 10.06 7.32 0 35.60
Tgap*Horizontal (%) 30,178 4.63 10.85 0 91.76 28,689 4.87 11.08 0 91.76
Tgap*Backward (%) 30,178 5.83 9.14 0 75.67 28,689 6.13 9.27 0 75.67
Tgap*Forward (%) 30,178 5.09 7.46 0 35.60 28,689 5.35 7.56 0 35.60
Tgap*Horizontal (%) 30,178 6.65 9.84 0 75.69 28,689 6.99 9.98 0 75.69
Tgap*Backward (%) 30,178 7.70 9.37 0 75.67 28,689 8.10 9.44 0 75.67
Tgap*Forward (%) 30,178 6.90 7.71 0 35.60 28,689 7.26 7.74 0 35.60
Version 2
Version 3
All Firms Local Firms
Version 1

111
Table 3.7: Horizontal Technology Spillover Test Results
Source: Author calculations based on TurkStat’s ISSS database
Notes: ***, **, * denote significance level at 1‰, 1%, and 5%, respectively, and in all regressions Prob > F 0.0000. Robust standard errors in parentheses
corrected for within-firm clustering. In all regressions the dependent variable is lny (firm i's real output at sector j in time t). All regressions are estimated using
FE method, and include year include year (3) and sector dummies (21 at 2 digit, 91 at 3 digit, and 192 at 4-digit NACE). Scale, Herfindahl and Horizontal
variables are computed at 2, 3 and 4-digit NACE level.
All FirmsLocal
Firms
Export
Oriented
Firms
Domestic
Oriented
Firms
All FirmsLocal
Firms
Export
Oriented
Firms
Domestic
Oriented
Firms
All FirmsLocal
Firms
Export
Oriented
Firms
Domestic
Oriented
Firms
Ln K 0.018*** 0.018*** 0.012* 0.018*** 0.017*** 0.017*** 0.012* 0.017*** 0.017*** 0.017*** 0.011* 0.017***
(0.002) (0.002) (0.006) (0.002) (0.002) (0.002) (0.006) (0.002) (0.002) (0.002) (0.006) (0.002)
Ln L 0.338*** 0.338*** 0.276*** 0.338*** 0.321*** 0.319*** 0.258*** 0.321*** 0.316*** 0.314*** 0.254*** 0.316***
(0.015) (0.017) (0.036) (0.018) (0.014) (0.015) (0.036) (0.016) (0.014) (0.015) (0.036) (0.016)
Ln M 0.294*** 0.292*** 0.325*** 0.279*** 0.281*** 0.280*** 0.314*** 0.266*** 0.277*** 0.276*** 0.312*** 0.263***
(0.014) (0.015) (0.032) (0.016) (0.014) (0.014) (0.033) (0.015) (0.014) (0.014) (0.033) (0.015)
Ln E 0.056*** 0.057*** 0.048*** 0.056*** 0.055*** 0.055*** 0.047*** 0.054*** 0.054*** 0.054*** 0.047*** 0.053***
(0.005) (0.006) (0.011) (0.006) (0.005) (0.005) (0.011) (0.006) (0.005) (0.005) (0.011) (0.006)
Foreign Share 0.047 -0.072 0.115* 0.036 -0.052 0.077 0.034 -0.053 0.069
(0.039) (0.084) (0.048) (0.040) (0.090) (0.047) (0.041) (0.090) (0.047)
Scale 0.084*** 0.094** 0.078*** 0.086* 0.147*** 0.160*** 0.118*** 0.161*** 0.164*** 0.173*** 0.123*** 0.175***
(0.024) (0.033) (0.017) (0.035) (0.016) (0.020) (0.028) (0.023) (0.018) (0.021) (0.028) (0.025)
Herfindahl 1.128* 1.276* 2.438 1.089 -0.311* -0.281 -0.002 -0.297 -0.277* -0.288* 0.039 -0.299*
(0.513) (0.549) (1.850) (0.570) (0.147) (0.160) (0.420) (0.176) (0.121) (0.131) (0.386) (0.136)
Horizontal 0.481*** 0.575*** 0.040 0.690*** 0.276*** 0.287*** 0.459 0.273*** 0.357*** 0.374*** 0.430* 0.366***
(0.140) (0.153) (0.356) (0.165) (0.058) (0.060) (0.286) (0.062) (0.058) (0.062) (0.212) (0.063)
Constant 8.531*** 8.483*** 8.390*** 8.706*** 5.938*** 9.427*** 8.843*** 6.049*** 9.749*** 9.633*** 8.820*** 9.868***
(0.228) (0.253) (0.448) (0.265) (0.617) (0.368) (0.477) (0.634) (0.282) (0.275) (0.474) (0.315)
Obs. (N) 29,388 27,927 4,652 24,736 29,388 27,927 4,652 24,736 29,388 27,927 4,652 24,736
F 243.62 239.81 88.42 196.64 1,323 1,582 103.38 217.63 467.16 413.32 40.37 143.67
r2 (%) 55.06 55.07 54.75 54.66 57.06 57.07 56.32 56.88 57.78 57.76 56.59 57.59
Hausmann Test FE FE FE FE FE FE FE FE FE FE FE FE
2 Digit 3 Digit 4 Digit

112
Table 3.8: Horizontal Technology Spillover Test Results with Different Foreign Shares by 2-digit NACE
Source: Author calculations based on TurkStat’s ISSS database
Notes: ***, **, * denote significance level at 1‰, 1%, and 5%, respectively, and in all regressions Prob > F 0.0000. Robust standard errors in parentheses corrected
for within-firm clustering. In all regressions the dependent variable is lny (firm i's real output at sector j in time t) and all models include constant and lnk, lnl, lnm
and lne as explanatory variables which all are significant at the 0.001 level, but not shown in the results for space reasons. All regressions are estimated using FE
method, and include year (3) and sector dummies (21). Scale, Herfindahl and all Horizontal variables are computed at 2-digit NACE level.
Scale 0.084*** 0.084*** 0.084*** 0.084*** 0.094** 0.094** 0.094** 0.094** 0.078*** 0.078*** 0.078*** 0.079*** 0.086* 0.086* 0.087* 0.087*
(0.024) (0.024) (0.024) (0.024) (0.033) (0.033) (0.033) (0.033) (0.017) (0.017) (0.017) (0.017) (0.035) (0.035) (0.035) (0.035)
Herfindahl 1.119* 1.135* 1.163* 1.013 1.258* 1.276* 1.306* 1.175* 2.433 2.436 2.448 1.773 1.086 1.105 1.138* 1.016
(0.512) (0.513) (0.515) (0.517) (0.548) (0.549) (0.551) (0.553) (1.848) (1.849) (1.865) (1.876) (0.568) (0.568) (0.571) (0.573)
Horizontal_No Res 0.468*** 0.549*** -0.002 0.680***
(0.139) (0.153) (0.354) (0.163)
Horizontal_ 0.490*** 0.575*** 0.004 0.706***
FS ≥ 10% (0.140) (0.153) (0.355) (0.164)
Horizontal_ -0.389* -0.424* -0.378 -0.298
10% ≤ FS ≤ 49% (0.181) (0.200) (0.554) (0.201)
Horizontal_ 0.519** 0.656*** -0.053 0.790***
50% ≤ FS ≤ 99% (0.182) (0.193) (0.489) (0.208)
Horizontal_ -2.767*** -2.354*** -8.807*** -1.745**
10% ≤ FS ≤39% (0.636) (0.656) (2.138) (0.670)
Horizontal_ 0.323* 0.334 0.164 0.388*
40% ≤ FS ≤ 69% (0.162) (0.179) (0.498) (0.184)
Horizontal_ 0.380* 0.513** 0.030 0.649**
70% ≤ FS ≤ 99% (0.174) (0.189) (0.449) (0.200)
Horizontal_ 1.037*** 0.925*** 1.131*** 1.019*** 0.333 0.214 1.311*** 1.208***
FS=100% (0.177) (0.174) (0.188) (0.187) (0.476) (0.461) (0.203) (0.200)
Obs. (N) 29,388 29,388 29,388 29,388 27,927 27,927 27,927 27,927 4,652 4,652 4,652 4,652 24,736 24,736 24,736 24,736
F 253.00 253.05 239.46 231.21 239.75 239.81 226.69 217.86 94.62 94.57 133.04 169.26 203.84 203.91 194.35 186.66
r2 (%) 55.05 55.05 55.18 55.22 55.06 55.07 55.19 55.2 54.73 54.73 54.77 55.43 54.63 54.63 54.79 54.78
Hausmann Test FE FE FE FE FE FE FE FE FE FE FE FE FE FE FE FE
All Firms Local Firms Export Oriented Firms Domestic Oriented Firms
2 Digit

113
Table 3.9: Horizontal Technology Spillover Test Results with Different Foreign Shares by 3-digit NACE
Source: Author calculations based on TurkStat’s ISSS database
Notes: ***, **, * denote significance level at 1‰, 1%, and 5%, respectively, and in all regressions Prob > F 0.0000. Robust standard errors in parentheses corrected for
within-firm clustering. In all regressions the dependent variable is lny (firm i's real output at sector j in time t) and all models include constant and lnk, lnl, lnm and lne
as explanatory variables which all are significant at the 0.001 level, but not shown in the results for space reasons. All regressions are estimated using FE method, and
include year (3) and sector dummies (91). Scale, Herfindahl and all Horizontal variables are computed at 3-digit NACE level.
Scale 0.147*** 0.147*** 0.147*** 0.147*** 0.160*** 0.160*** 0.160*** 0.160*** 0.118*** 0.118*** 0.117*** 0.119*** 0.162*** 0.162*** 0.162*** 0.162***
(0.016) (0.016) (0.016) (0.016) (0.020) (0.020) (0.020) (0.020) (0.028) (0.028) (0.028) (0.028) (0.023) (0.023) (0.023) (0.023)
Herfindahl -0.311* -0.311* -0.352* -0.377* -0.282 -0.281 -0.324* -0.344* 0.002 -0.000 0.016 -0.026 -0.297 -0.297 -0.342 -0.377*
(0.147) (0.147) (0.149) (0.149) (0.160) (0.160) (0.162) (0.162) (0.421) (0.421) (0.421) (0.421) (0.176) (0.176) (0.178) (0.179)
Horizontal_No Res 0.282*** 0.290*** 0.464 0.281***
(0.058) (0.060) (0.288) (0.062)
Horizontal_ 0.280*** 0.287*** 0.447 0.279***
FS ≥ 10% (0.058) (0.060) (0.288) (0.062)
Horizontal_ -0.528 -0.671* -0.372 -0.607*
10% ≤ FS ≤ 49% (0.282) (0.327) (0.895) (0.301)
Horizontal_ 0.230*** 0.249*** 0.156 0.269***
50% ≤ FS ≤ 99% (0.066) (0.070) (0.310) (0.070)
Horizontal_ 0.228 0.248 -4.079 0.274
10% ≤ FS ≤39% (0.325) (0.345) (2.091) (0.336)
Horizontal_ -0.191 -0.196 -0.177 -0.194
40% ≤ FS ≤ 69% (0.129) (0.142) (0.369) (0.144)
Horizontal_ 0.283*** 0.302*** 0.260 0.323***
70% ≤ FS ≤ 99% (0.072) (0.075) (0.377) (0.075)
Horizontal_ 0.339*** 0.377*** 0.343*** 0.380*** 0.993** 1.011** 0.316*** 0.355***
FS=100% (0.061) (0.064) (0.063) (0.066) (0.341) (0.369) (0.066) (0.068)
Obs. (N) 29,388 29,388 29,388 29,388 27,927 27,927 27,927 27,927 4,652 4,652 4,652 4,652 24,736 24,736 24,736 24,736
F 856.53 427.30 814.43 803.49 1,582 1,582 1,547 1,523 108.91 108.34 99.76 120.14 266.20 198.90 402.40 213.97
r2 (%) 57.06 57.06 57.1 57.11 57.07 57.07 57.11 57.12 56.31 56.31 56.66 56.75 56.87 56.87 56.91 56.93
Hausmann Test FE FE FE FE FE FE FE FE FE FE FE FE FE FE FE FE
3 Digit
All Firms Local Firms Export Oriented Firms Domestic Oriented Firms

114
Table 3.10: Horizontal Technology Spillover Test Results with Different Foreign Shares by 4-digit NACE
Source: Author calculations based on TurkStat’s ISSS database
Notes: ***, **, * denote significance level at 1‰, 1%, and 5%, respectively, and in all regressions Prob > F 0.0000. Robust standard errors in parentheses corrected for
within-firm clustering. In all regressions the dependent variable is lny (firm i's real output at sector j in time t) and all models include constant and lnk, lnl, lnm and lne
as explanatory variables which all are significant at the 0.001 level, but not shown in the results for space reasons. All regressions are estimated using FE method, and
include year (3) and sector dummies (192). Scale, Herfindahl and all Horizontal variables are computed at 4-digit NACE level.
Scale 0.164*** 0.164*** 0.164*** 0.164*** 0.173*** 0.173*** 0.173*** 0.173*** 0.124*** 0.124*** 0.124*** 0.125*** 0.175*** 0.175*** 0.175*** 0.175***
(0.018) (0.018) (0.018) (0.018) (0.021) (0.021) (0.021) (0.021) (0.028) (0.028) (0.028) (0.028) (0.025) (0.025) (0.025) (0.025)
Herfindahl -0.278* -0.278* -0.299* -0.301* -0.287* -0.288* -0.306* -0.308* 0.043 0.040 0.037 0.040 -0.300* -0.301* -0.328* -0.331*
(0.121) (0.121) (0.121) (0.122) (0.131) (0.131) (0.132) (0.132) (0.386) (0.386) (0.387) (0.387) (0.136) (0.136) (0.137) (0.137)
Horizontal_No Res 0.363*** 0.375*** 0.429* 0.376***
(0.058) (0.062) (0.216) (0.063)
Horizontal_ 0.362*** 0.374*** 0.415 0.375***
FS ≥ 10% (0.058) (0.062) (0.216) (0.063)
Horizontal_ -0.092 -0.216 0.182 -0.215
10% ≤ FS ≤ 49% (0.245) (0.288) (0.710) (0.271)
Horizontal_ 0.338*** 0.355*** 0.340 0.361***
50% ≤ FS ≤ 99% (0.063) (0.067) (0.241) (0.067)
Horizontal_ 0.374 0.365 -1.935 0.459
10% ≤ FS ≤39% (0.296) (0.315) (1.193) (0.313)
Horizontal_ 0.135 0.137 0.465 0.100
40% ≤ FS ≤ 69% (0.136) (0.147) (0.317) (0.149)
Horizontal_ 0.360*** 0.380*** 0.398 0.389***
70% ≤ FS ≤ 99% (0.067) (0.071) (0.275) (0.070)
Horizontal_ 0.403*** 0.422*** 0.410*** 0.432*** 0.568* 0.598* 0.406*** 0.430***
FS=100% (0.062) (0.064) (0.066) (0.068) (0.256) (0.267) (0.067) (0.068)
Obs. (N) 29,388 29,388 29,388 29,388 27,927 27,927 27,927 27,927 4,652 4,652 4,652 4,652 24,736 24,736 24,736 24,736
F 470.64 469.48 319.66 1,023 619.45 413.32 333.03 744 42.12 42.11 38.85 37.67 123.76 122.68 196.90 98.90
r2 (%) 57.77 57.77 57.79 57.79 57.76 57.76 57.78 57.78 56.59 56.58 56.61 56.7 57.58 57.58 57.61 57.61
Hausmann Test FE FE FE FE FE FE FE FE FE FE FE FE FE FE FE FE
All Firms Local Firms Export Oriented Firms Domestic Oriented Firms
4 Digit

115
Table 3.11: Horizontal and Vertical Technology Spillover Test Results
Source: Author calculations based on TurkStat’s ISSS database
Notes: ***, **, * denote significance level at 1‰, 1%, and 5%, respectively, and in all regressions Prob > F 0.0000. Robust standard errors in parentheses corrected for
within-firm clustering. In all regressions the dependent variable is lny (firm i's real output at sector j in time t) and all models include constant and lnk, lnl, lnm and lne
as explanatory variables which all are significant at the 0.001 level, but not shown in the results for space reasons. All regressions are estimated using FE method, and
include year (3) and sector dummies (21 at 2 digit, 91 at 3 digit, and 192 at 4-digit NACE). Scale, Herfindahl and Horizontal variables are computed at 2, 3 and 4-digit
NACE level but Backward, Forward, and lndemand can be computed only at 2-digit NACE level because of only available 2-digit IO table.
All FirmsLocal
Firms
Export
Oriented
Firms
Domestic
Oriented
Firms
All FirmsLocal
Firms
Export
Oriented
Firms
Domestic
Oriented
Firms
All FirmsLocal
Firms
Export
Oriented
Firms
Domestic
Oriented
Firms
Foreign Share 0.042 -0.070 0.107* 0.033 -0.039 0.069 0.031 -0.041 0.061
(0.039) (0.084) (0.047) (0.040) (0.091) (0.047) (0.041) (0.092) (0.046)
Scale 0.086*** 0.096** 0.079*** 0.087* 0.150*** 0.162*** 0.121*** 0.163*** 0.166*** 0.175*** 0.127*** 0.177***
(0.024) (0.033) (0.017) (0.036) (0.017) (0.021) (0.029) (0.023) (0.018) (0.021) (0.029) (0.025)
Herfindahl 0.895 0.959 2.327 0.746 -0.362* -0.330* -0.038 -0.356* -0.292* -0.299* 0.006 -0.313*
(0.526) (0.561) (1.920) (0.580) (0.147) (0.160) (0.421) (0.175) (0.119) (0.130) (0.386) (0.135)
lndemand 0.435*** 0.439*** 0.269* 0.419*** 0.480*** 0.489*** 0.333** 0.467*** 0.475*** 0.483*** 0.335** 0.464***
(0.040) (0.042) (0.119) (0.046) (0.039) (0.041) (0.119) (0.045) (0.039) (0.041) (0.120) (0.045)
Horizontal 1.983*** 1.944*** 0.999 2.059*** 0.250*** 0.255*** 0.551 0.243*** 0.343*** 0.354*** 0.470* 0.347***
(0.338) (0.356) (1.250) (0.370) (0.059) (0.062) (0.319) (0.063) (0.059) (0.062) (0.227) (0.063)
Backward -1.342** -1.084* -1.444 -1.036* 0.730** 0.999*** -0.614 1.153*** 0.591* 0.843** -0.731 1.009***
(0.421) (0.461) (1.535) (0.476) (0.252) (0.278) (0.721) (0.303) (0.250) (0.275) (0.690) (0.301)
Forward -1.982*** -2.278*** 1.092 -2.578*** -1.717*** -2.092*** 0.684 -2.151*** -1.511** -1.888*** 1.140 -1.894***
(0.489) (0.509) (1.430) (0.566) (0.473) (0.501) (1.394) (0.544) (0.468) (0.494) (1.406) (0.537)
Obs. (N) 29,388 27,927 4,652 24,736 29,388 27,927 4,652 24,736 29,388 27,927 4,652 24,736
F 233.80 228.67 2,476 187.13 551.38 1,380 321.06 360 252.81 378.22 51.62 785.42
r2 (%) 55.70 55.69 55.10 55.26 57.68 57.69 56.78 57.46 58.38 58.37 57.07 58.15
Hausmann Test FE FE FE FE FE FE FE FE FE FE FE FE
2 Digit 3 Digit 4 Digit

116
Table 3.12: Vertical Technology Spillovers Associated with Fully- versus Partially-Owned Foreign Firms
Source: Author calculations based on TurkStat’s ISSS database
Notes: ***, **, * denote significance level at 1‰, 1%, and 5%, respectively, and in all regressions Prob > F 0.0000. Robust standard errors in parentheses corrected for
within-firm clustering. In all regressions the dependent variable is lny (firm i's real output at sector j in time t) and all models include constant and lnk, lnl, lnm and lne as
explanatory variables which all are significant at the 0.001 level, but not shown in the results for space reasons. All regressions are estimated using FE method, and include
year (3) and sector dummies (21 at 2 digit, 91 at 3 digit, and 192 at 4-digit NACE). Scale, Herfindahl and Horizontal variables are computed at 2, 3 and 4-digit NACE level
but Backward, Forward, and lndemand can be computed only at 2-digit NACE level because of only available 2-digit IO table.
Foreign Share 0.041 0.041 0.042 0.032 0.035 0.033 0.030 0.032 0.032
(0.039) (0.039) (0.039) (0.040) (0.040) (0.040) (0.041) (0.040) (0.041)
Scale 0.086*** 0.086*** 0.086*** 0.096** 0.096** 0.096** 0.150*** 0.150*** 0.149*** 0.162*** 0.162*** 0.162*** 0.166*** 0.166*** 0.166*** 0.175*** 0.175*** 0.175***
(0.024) (0.024) (0.024) (0.033) (0.033) (0.033) (0.017) (0.017) (0.017) (0.021) (0.021) (0.021) (0.018) (0.018) (0.018) (0.021) (0.021) (0.021)
Herfindahl 1.122* 0.435 0.776 1.211* 0.614 0.844 -0.337* -0.369* -0.384** -0.304 -0.342* -0.354* -0.287* -0.298* -0.303* -0.294* -0.308* -0.311*
(0.522) (0.514) (0.534) (0.557) (0.549) (0.570) (0.147) (0.147) (0.148) (0.160) (0.161) (0.161) (0.119) (0.120) (0.120) (0.130) (0.130) (0.131)
lndemand 0.406*** 0.460*** 0.434*** 0.404*** 0.459*** 0.438*** 0.455*** 0.457*** 0.477*** 0.457*** 0.458*** 0.485*** 0.453*** 0.456*** 0.472*** 0.454*** 0.457*** 0.479***
(0.040) (0.039) (0.040) (0.041) (0.041) (0.042) (0.039) (0.038) (0.039) (0.040) (0.040) (0.041) (0.039) (0.039) (0.039) (0.040) (0.040) (0.041)
Horizontal 1.793*** 1.173*** 1.904*** 1.755*** 1.301*** 1.864*** 0.230*** 0.258*** 0.250*** 0.233*** 0.267*** 0.254*** 0.335*** 0.351*** 0.344*** 0.345*** 0.365*** 0.355***
(0.333) (0.204) (0.339) (0.352) (0.216) (0.356) (0.059) (0.059) (0.059) (0.062) (0.061) (0.062) (0.059) (0.059) (0.059) (0.062) (0.062) (0.062)
Backward_(Partially-Owned) -2.180*** -1.180* -2.104*** -0.965 -0.222 0.977** -0.165 1.192*** -0.286 0.799* -0.238 1.025**
(0.410) (0.483) (0.438) (0.511) (0.180) (0.321) (0.199) (0.343) (0.179) (0.319) (0.197) (0.340)
Backward_(Fully-Owned) -1.622*** -1.429** -1.426** -1.147* 0.329 0.367 0.492* 0.649 0.263 0.252 0.402 0.495
(0.418) (0.450) (0.458) (0.507) (0.209) (0.315) (0.234) (0.357) (0.210) (0.312) (0.233) (0.351)
Forward_(Partially-Owned) -2.781*** -2.517*** -3.036*** -2.798*** -1.407*** -2.638*** -1.566*** -2.968*** -1.357*** -2.373*** -1.525*** -2.746***
(0.474) (0.609) (0.486) (0.630) (0.326) (0.576) (0.348) (0.599) (0.323) (0.571) (0.344) (0.593)
Forward_(Fully-Owned) -1.925*** -1.391* -2.065*** -1.639** -0.221 -0.854 -0.287 -1.189* -0.186 -0.659 -0.259 -0.981
(0.521) (0.558) (0.537) (0.586) (0.361) (0.549) (0.391) (0.588) (0.355) (0.538) (0.383) (0.574)
Obs. (N) 29,388 29,388 29,388 27,927 27,927 27,927 29,388 29,388 29,388 27,927 27,927 27,927 29,388 29,388 29,388 27,927 27,927 27,927
F 234.52 233.83 220.64 229.95 229.34 215.88 536.70 537.51 530.07 172.50 1,376 1,350 511.54 533.48 751.31 709.20 347.12 434.78
r2 (%) 55.67 55.69 55.72 55.65 55.70 55.71 57.66 57.69 57.71 57.66 57.69 57.72 58.37 58.40 58.41 58.34 58.38 58.40
Hausmann Test FE FE FE FE FE FE FE FE FE FE FE FE FE FE FE FE FE FE
4 Digit
All Firms Local Firms
3 Digit
All Firms Local Firms
2 Digit
All Firms Local Firms

117
Table 3.13: Vertical Technology Spillovers Associated with Export- versus Domestic-Market-Oriented
Source: Author calculations based on TurkStat’s ISSS database
Notes: ***, **, * denote significance level at 1‰, 1%, and 5%, respectively, and in all regressions Prob > F 0.0000. Robust standard errors in parentheses corrected for
within-firm clustering. In all regressions the dependent variable is lny (firm i's real output at sector j in time t) and all models include constant and lnk, lnl, lnm and lne as
explanatory variables which all are significant at the 0.001 level, but not shown in the results for space reasons. All regressions are estimated using FE method, and include
year (3) and sector dummies (21 at 2 digit, 91 at 3 digit, and 192 at 4-digit NACE). Scale, Herfindahl and Horizontal variables are computed at 2, 3 and 4-digit NACE
level but Backward, Forward, and lndemand can be computed only at 2-digit NACE level because of only available 2-digit IO table.
Foreign Share 0.046 0.044 0.045 0.039 0.036 0.038 0.037 0.034 0.036
(0.039) (0.039) (0.039) (0.040) (0.040) (0.040) (0.040) (0.041) (0.041)
Scale 0.086*** 0.086*** 0.085*** 0.096** 0.096** 0.096** 0.150*** 0.150*** 0.149*** 0.162*** 0.162*** 0.162*** 0.166*** 0.166*** 0.166*** 0.175*** 0.170*** 0.175***
(0.024) (0.024) (0.024) (0.034) (0.033) (0.033) (0.017) (0.017) (0.017) (0.021) (0.021) (0.021) (0.018) (0.018) (0.018) (0.021) (0.022) (0.021)
Herfindahl 1.118* 0.544 0.842 1.187* 0.696 0.910 -0.339* -0.357* -0.371* -0.307 -0.327* -0.341* -0.291* -0.294* -0.302* -0.300* -0.336** -0.310*
(0.521) (0.511) (0.530) (0.556) (0.547) (0.565) (0.147) (0.147) (0.147) (0.161) (0.160) (0.160) (0.119) (0.119) (0.120) (0.130) (0.125) (0.131)
lndemand 0.407*** 0.462*** 0.419*** 0.403*** 0.461*** 0.422*** 0.455*** 0.459*** 0.460*** 0.453*** 0.459*** 0.467*** 0.453*** 0.458*** 0.455*** 0.451*** 0.466*** 0.459***
(0.040) (0.039) (0.040) (0.042) (0.041) (0.042) (0.039) (0.038) (0.039) (0.040) (0.040) (0.041) (0.039) (0.039) (0.039) (0.041) (0.041) (0.041)
Horizontal 1.696*** 1.255*** 1.742*** 1.685*** 1.364*** 1.753*** 0.238*** 0.265*** 0.251*** 0.241*** 0.273*** 0.256*** 0.343*** 0.355*** 0.349*** 0.353*** 0.330*** 0.360***
(0.345) (0.206) (0.352) (0.368) (0.215) (0.372) (0.059) (0.059) (0.059) (0.062) (0.061) (0.062) (0.059) (0.059) (0.059) (0.062) (0.058) (0.062)
Backward_(Export Oriented) -2.042*** -4.445*** -2.013*** -4.023*** -0.569** -3.380*** -0.695* -3.137*** -0.675*** -3.518*** -0.818* -3.407***
(0.384) (0.811) (0.426) (0.857) (0.200) (0.780) (0.350) (0.823) (0.202) (0.767) (0.357) (0.810)
Backward_(Domestic Oriented) -1.585** 0.377 -1.536** 0.433 0.545* 2.696*** 0.605* 2.823*** 0.515* 2.574*** 0.550* 2.717***
(0.496) (0.628) (0.544) (0.670) (0.234) (0.419) (0.267) (0.447) (0.232) (0.419) (0.264) (0.446)
Forward_(Export Oriented) -3.289*** 9.989*** -2.424 9.179** -0.934 11.688*** -0.489 11.149*** -1.194 11.769*** -0.575 11.679***
(0.978) (2.977) (1.281) (3.151) (0.683) (2.926) (0.946) (3.142) (0.680) (2.879) (0.952) (3.093)
Forward_(Domestic Oriented) -2.234*** -4.756*** -2.717*** -4.884*** -0.805* -5.034*** -1.084* -5.241*** -0.672 -4.815*** -1.018* -5.122***
(0.502) (0.833) (0.560) (0.874) (0.390) (0.806) (0.435) (0.847) (0.387) (0.805) (0.436) (0.848)
Obs. (N) 29,388 29,388 29,388 27,927 27,927 27,927 29,388 29,388 29,388 27,927 27,927 27,927 29,388 29,388 29,388 27,927 27,927 27,927
F 233.19 233.36 219.97 228.07 228.44 214.43 536.12 553.44 533.84 1,375 1,376 1,523 548.58 869.90 1,103 354.91 161.30 452.74
r2 (%) 55.66 55.68 55.75 55.64 55.68 55.73 57.66 57.66 57.76 57.65 57.66 57.76 58.37 58.37 58.46 58.34 58.15 58.44
Hausmann Test FE FE FE FE FE FE FE FE FE FE FE FE FE FE FE FE FE FE
Local Firms
3 Digit
All Firms Local Firms
4 Digit
All Firms Local Firms
2 Digit
All Firms

118
Table 3.14: Technology Gap and Technology Spillovers (TGAPV.1
)
Source: Author calculations based on TurkStat’s ISSS database
Notes: ***, **, * denote significance level at 1‰, 1%, and 5%, respectively, and in all regressions Prob > F 0.0000. Robust standard errors in parentheses corrected for
within-firm clustering. In all regressions the dependent variable is lny (firm i's real output at sector j in time t) and all models include constant and lnk, lnl, lnm and lne
as explanatory variables which all are significant at the 0.001 level, but not shown in the results for space reasons. All regressions are estimated using FE method, and
include year (3) and sector dummies (21 at 2 digit, 91 at 3 digit, and 192 at 4-digit NACE). Scale, Herfindahl, Horizontal and Tgap variables are computed at 2, 3 and
4-digit NACE level but Backward, Forward, and lndemand can be computed only at 2-digit NACE level because of only available 2-digit IO table.
All FirmsLocal
Firms
Export
Oriented
Firms
Domestic
Oriented
Firms
All FirmsLocal
Firms
Export
Oriented
Firms
Domestic
Oriented
Firms
All FirmsLocal
Firms
Export
Oriented
Firms
Domestic
Oriented
Firms
Foreign Share -0.022 -0.125 0.036 -0.011 -0.054 0.016 0.008 -0.057 0.030
(0.040) (0.082) (0.050) (0.041) (0.090) (0.048) (0.041) (0.090) (0.047)
Scale 0.085*** 0.095** 0.079*** 0.087* 0.148*** 0.160*** 0.121*** 0.161*** 0.165*** 0.175*** 0.127*** 0.176***
(0.024) (0.033) (0.017) (0.035) (0.017) (0.021) (0.029) (0.023) (0.018) (0.021) (0.029) (0.025)
Herfindahl 0.739 0.797 2.330 0.575 -0.352* -0.324* -0.052 -0.340 -0.305* -0.312* -0.010 -0.321*
(0.523) (0.557) (1.901) (0.576) (0.146) (0.159) (0.420) (0.174) (0.119) (0.130) (0.385) (0.135)
lndemand 0.432*** 0.436*** 0.265* 0.417*** 0.472*** 0.480*** 0.326** 0.460*** 0.475*** 0.482*** 0.330** 0.464***
(0.040) (0.042) (0.118) (0.046) (0.039) (0.041) (0.120) (0.045) (0.039) (0.041) (0.120) (0.045)
Horizontal 1.683*** 1.619*** 0.704 1.761*** 0.291*** 0.307*** 0.515 0.301*** 0.362*** 0.379*** 0.480* 0.381***
(0.354) (0.375) (1.332) (0.388) (0.067) (0.070) (0.334) (0.071) (0.065) (0.070) (0.234) (0.069)
Backward -1.179** -0.892 -1.378 -0.874 0.577* 0.848** -0.714 1.017*** 0.524* 0.791** -0.871 0.954**
(0.435) (0.480) (1.650) (0.487) (0.255) (0.284) (0.739) (0.304) (0.254) (0.280) (0.691) (0.303)
Forward -1.455** -1.712*** 1.785 -2.056*** -1.245** -1.586** 1.111 -1.731** -1.247** -1.620** 1.528 -1.661**
(0.495) (0.517) (1.446) (0.572) (0.480) (0.510) (1.433) (0.548) (0.471) (0.498) (1.397) (0.537)
Tgap*Horizontal 0.162 0.169 0.672 0.134 0.030 0.023 0.092 0.002 0.018 0.010 0.128 -0.019
(0.117) (0.121) (0.471) (0.122) (0.052) (0.054) (0.196) (0.056) (0.051) (0.053) (0.190) (0.050)
Tgap*Backward -0.031 -0.024 -0.474 0.002 0.061 0.067 0.082 0.063 0.025 0.022 0.032 0.047
(0.119) (0.122) (0.519) (0.120) (0.080) (0.082) (0.317) (0.085) (0.084) (0.085) (0.273) (0.086)
Tgap*Forward -0.714*** -0.738*** -0.944* -0.689*** -0.523*** -0.532*** -0.517 -0.486*** -0.325** -0.316** -0.561 -0.300**
(0.126) (0.130) (0.449) (0.134) (0.106) (0.109) (0.375) (0.111) (0.100) (0.103) (0.340) (0.104)
Obs. (N) 29,388 27,927 4,652 24,736 29,388 27,927 4,652 24,736 29,388 27,927 4,652 24,736
F 216.15 210.82 7,319 172.65 551.72 1,334 305.54 289.88 491.60 1,695 47.92 5,554
r2 (%) 56.17 56.19 55.79 55.72 57.97 57.99 56.92 57.76 58.50 58.49 57.30 58.27
Hausmann Test FE FE FE FE FE FE FE FE FE FE FE FE
2 Digit 3 Digit 4 Digit

119
Table 3.15: Technology Gap and Technology Spillovers (TGAPV.2
)
Source: Author calculations based on TurkStat’s ISSS database
Notes: ***, **, * denote significance level at 1‰, 1%, and 5%, respectively, and in all regressions Prob > F 0.0000. Robust standard errors in parentheses corrected for within-firm
clustering. In all regressions the dependent variable is lny (firm i's real output at sector j in time t) and all models include constant and lnk, lnl, lnm and lne as explanatory variables which
all are significant at the 0.001 level, but not shown in the results for space reasons. All regressions are estimated using FE method, and include year (3) and sector dummies (21 at 2 digit,
91 at 3 digit, and 192 at 4-digit NACE). Scale, Herfindahl, Horizontal and Tgap variables are computed at 2, 3 and 4-digit NACE level but Backward, Forward, and lndemand can be
computed only at 2-digit NACE level because of only available 2-digit IO table.
All FirmsLocal
Firms
Export
Oriented
Firms
Domestic
Oriented
Firms
All FirmsLocal
Firms
Export
Oriented
Firms
Domestic
Oriented
Firms
All FirmsLocal
Firms
Export
Oriented
Firms
Domestic
Oriented
Firms
Foreign Share -0.064 -0.159 0.006 -0.068 -0.127 -0.038 -0.050 -0.104 -0.032
(0.041) (0.089) (0.051) (0.044) (0.101) (0.052) (0.044) (0.102) (0.051)
Scale 0.085*** 0.095** 0.080*** 0.087* 0.148*** 0.160*** 0.120*** 0.162*** 0.165*** 0.174*** 0.125*** 0.176***
(0.024) (0.033) (0.017) (0.036) (0.017) (0.021) (0.029) (0.023) (0.018) (0.021) (0.029) (0.025)
Herfindahl 0.717 0.781 2.101 0.578 -0.356* -0.325* -0.047 -0.350* -0.293* -0.296* -0.008 -0.312*
(0.526) (0.560) (1.931) (0.579) (0.145) (0.158) (0.420) (0.173) (0.118) (0.129) (0.385) (0.133)
lndemand 0.430*** 0.434*** 0.262* 0.415*** 0.472*** 0.480*** 0.330** 0.460*** 0.469*** 0.475*** 0.331** 0.458***
(0.040) (0.042) (0.118) (0.046) (0.039) (0.041) (0.119) (0.045) (0.039) (0.041) (0.120) (0.045)
Horizontal 1.494*** 1.402*** 0.358 1.561*** 0.161 0.164 0.193 0.1860* 0.274** 0.283** 0.189 0.308***
(0.361) (0.386) (1.364) (0.397) (0.090) (0.101) (0.407) (0.094) (0.086) (0.099) (0.369) (0.088)
Backward -0.883* -0.531 -0.956 -0.561 0.660* 0.950** -0.693 1.117*** 0.508 0.780* -0.972 0.949**
(0.442) (0.491) (1.662) (0.501) (0.270) (0.311) (0.775) (0.322) (0.267) (0.307) (0.763) (0.318)
Forward -1.500** -1.782*** 2.042 -2.198*** -0.996* -1.316* 1.839 -1.549** -0.892 -1.230* 2.310 -1.346*
(0.494) (0.518) (1.476) (0.572) (0.486) (0.520) (1.427) (0.555) (0.478) (0.512) (1.454) (0.545)
Tgap*Horizontal 0.420** 0.434** 0.222 0.472** 0.098 0.098 0.411 0.063 0.082 0.080 0.339 0.048
(0.147) (0.161) (0.564) (0.153) (0.079) (0.088) (0.343) (0.080) (0.074) (0.083) (0.322) (0.072)
Tgap*Backward -0.369* -0.380* -0.039 -0.459** 0.101 0.091 0.136 0.061 0.118 0.104 0.351 0.090
(0.157) (0.171) (0.613) (0.157) (0.130) (0.144) (0.416) (0.135) (0.130) (0.143) (0.440) (0.133)
Tgap*Forward -0.717*** -0.733*** -1.190 -0.569** -0.873*** -0.885*** -1.487* -0.708*** -0.770*** -0.765*** -1.480* -0.660***
(0.165) (0.176) (0.614) (0.174) (0.170) (0.185) (0.578) (0.175) (0.161) (0.175) (0.634) (0.162)
Obs. (N) 29,388 27,927 4,652 24,736 29,388 27,927 4,652 24,736 29,388 27,927 4,652 24,736
F 217.52 212.59 9,242 173.96 659.40 1,278 291.78 294.94 428.76 140.66 46.39 697.17
r2 (%) 56.10 56.11 55.67 55.61 58.03 58.05 57.30 57.75 58.66 58.65 57.48 58.41
Hausmann Test FE FE FE FE FE FE FE FE FE FE FE FE
2 Digit 3 Digit 4 Digit

120
Table 3.16: Technology Gap and Technology Spillovers (TGAPV.3
)
Source: Author calculations based on TurkStat’s ISSS database
Notes: ***, **, * denote significance level at 1‰, 1%, and 5%, respectively, and in all regressions Prob > F 0.0000. Robust standard errors in parentheses corrected for within-firm
clustering. In all regressions the dependent variable is lny (firm i's real output at sector j in time t) and all models include constant and lnk, lnl, lnm and lne as explanatory variables which
all are significant at the 0.001 level, but not shown in the results for space reasons. All regressions are estimated using FE method, and include year (3) and sector dummies (21 at 2 digit,
91 at 3 digit, and 192 at 4-digit NACE). Scale, Herfindahl, Horizontal and Tgap variables are computed at 2, 3 and 4-digit NACE level but Backward, Forward, and lndemand can be
computed only at 2-digit NACE level because of only available 2-digit IO table.
All FirmsLocal
Firms
Export
Oriented
Firms
Domestic
Oriented
Firms
All FirmsLocal
Firms
Export
Oriented
Firms
Domestic
Oriented
Firms
All FirmsLocal
Firms
Export
Oriented
Firms
Domestic
Oriented
Firms
Foreign Share 0.041 -0.064 0.104* 0.032 -0.023 0.063 0.029 -0.024 0.054
(0.039) (0.085) (0.047) (0.040) (0.091) (0.047) (0.041) (0.089) (0.047)
Scale 0.082*** 0.093** 0.075*** 0.085* 0.146*** 0.157*** 0.119*** 0.159*** 0.163*** 0.172*** 0.125*** 0.174***
(0.023) (0.032) (0.017) (0.034) (0.016) (0.020) (0.029) (0.023) (0.018) (0.021) (0.029) (0.025)
Herfindahl 0.688 0.757 1.905 0.592 -0.392** -0.361* -0.128 -0.384* -0.306** -0.315* -0.053 -0.325*
(0.520) (0.554) (1.801) (0.576) (0.143) (0.156) (0.404) (0.172) (0.118) (0.129) (0.371) (0.134)
lndemand 0.397*** 0.399*** 0.234* 0.385*** 0.454*** 0.459*** 0.292* 0.447*** 0.452*** 0.458*** 0.284* 0.448***
(0.040) (0.042) (0.115) (0.046) (0.039) (0.041) (0.118) (0.045) (0.039) (0.041) (0.120) (0.045)
Horizontal 1.769*** 1.666*** 0.743 1.835*** 0.159* 0.167* 0.279 0.179* 0.296*** 0.308*** 0.400 0.312***
(0.352) (0.373) (1.306) (0.377) (0.070) (0.073) (0.340) (0.073) (0.067) (0.072) (0.234) (0.071)
Backward -1.294** -0.954* -1.927 -0.893 0.845** 1.131*** -0.659 1.340*** 0.643* 0.912** -1.049 1.125***
(0.433) (0.476) (1.573) (0.476) (0.266) (0.291) (0.770) (0.311) (0.263) (0.288) (0.723) (0.310)
Forward -0.805 -1.082* 3.129* -1.516** -1.287** -1.653*** 1.463 -1.817*** -1.165* -1.536** 2.071 -1.633**
(0.492) (0.513) (1.481) (0.565) (0.470) (0.498) (1.437) (0.534) (0.466) (0.494) (1.430) (0.531)
Tgap*Horizontal 0.253*** 0.260*** 0.679* 0.229*** 0.038 0.035 0.155 0.022 0.026 0.023 0.082 0.017
(0.069) (0.073) (0.266) (0.065) (0.025) (0.026) (0.099) (0.025) (0.022) (0.023) (0.091) (0.021)
Tgap*Backward -0.159* -0.160* -0.286 -0.152* -0.007 -0.005 0.029 -0.015 0.029 0.031 0.081 0.026
(0.070) (0.073) (0.255) (0.064) (0.052) (0.055) (0.157) (0.053) (0.051) (0.053) (0.152) (0.051)
Tgap*Forward -0.601*** -0.599*** -1.251*** -0.531*** -0.421*** -0.424*** -0.655** -0.371*** -0.377*** -0.381*** -0.596** -0.345***
(0.079) (0.081) (0.278) (0.085) (0.073) (0.076) (0.230) (0.074) (0.068) (0.071) (0.210) (0.069)
Obs. (N) 29,388 27,927 4,652 24,736 29,388 27,927 4,652 24,736 29,388 27,927 4,652 24,736
F 229.12 222.94 437.39 183.23 308.97 421.69 32.49 360.43 515 371.09 56.57 649.03
r2 (%) 57.52 57.46 58.17 56.92 58.79 58.8 57.98 58.52 59.22 59.2 58.13 58.96
Hausmann Test FE FE FE FE FE FE FE FE FE FE FE FE
2 Digit 3 Digit 4 Digit

121
CHAPTER 4
A CASE STUDY ON
TURKISH AUTOMOTIVE INDUSTRY:
RESEARCH METHODOLOGY AND DESIGN
Although findings of Chapter 3 have the benefits to understand their occurrence and show
the importance of horizontal and vertical technology spillovers through FDI by their impacts
on the productivity level of the domestic firms, they are not sufficient to uncover the
mechanisms behind the results obtained. For instance, it is not possible to understand the
complex nature of these spillovers, in which ways these occur, what are these spillovers,
what are the factors that give rise to spillover effects between firms, what is the role of the
firm characteristics and strategic collaborations between firms in these spillovers etc.
Instead, econometric analyses conducted only indicate the possibility that foreign presence
impacts on the productivity level of the domestic firms through horizontal and vertical
linkages not the quality and intensity of these relationships. Therefore, in the next chapters,
by going one step further we conducted a very detailed and comprehensive empirical
research based on case study at firm-level in the Turkish automotive industry in order to
investigate the existence of technology spillovers (henceforth knowledge and technology
transfers, KTTs)74
at intra- and inter-firm level, to uncover what causes spillover effects or
lack of it, and their impact on the domestic firms.
74
From here on, “technology spillovers” and “knowledge and technology transfers” (KTTs) terms are used
interchangeably throughout the case study in order to analyze spillovers quantitatively through backward linkages
and to see what kinds of transfers are provided from customers to suppliers. We preferred to question firms by
asking “what kind of KTTs are provided from your customers” instead of “what kind of technology spillovers are

122
4.1. Introduction
From here on, as stated before, we analyze the Turkish automotive industry as a case study
to understand mainly the complex nature, dynamics and determinants of KTTs at both inter-
firm (occurring through backward linkages from customers75
to their suppliers) and intra-
firm level (occurring to AMMs in Turkey from MNCs as their partners). In addition, we
want to reveal characteristics, technology capabilities, innovation and R&D activities of the
suppliers, their place in global value chain and cooperation activities with other partners.
Moreover, we will try to analyze the effects of such activities and characteristics of the
suppliers on such KTTs. Finally, we want to analyze the effects of these on the performance
level of the suppliers. We examine and look at our objectives from two perspectives; one is
from suppliers’ perspective as a recipient of these transfers by questionnaire survey method
(Chapters 5 and 6) and second one is from customers’ perspective as a source of KTTs by
interview method (Chapter 7). To the best of our knowledge, this is the first empirical
research in this context carried out successfully. To collect both detailed data and
information at the firm level, these two methods have been used: firstly, a detailed
questionnaire survey has been designed to collect quantitative data from the suppliers and its
application is conducted by face-to-face interviews with top-executives of the 166
automotive suppliers operating in Turkey. The database of supplier firms is established from
mainly TAYSAD members and various industry unions (BTSO, DOSAB, UIB, GOSB, and
NOSAB). Secondly, semi-structured in-depth interviews are conducted with 19 top
executives of 11 AMMs in Turkey to collect qualitative data from customers.
This study was supported by a research grant from both TUBITAK under 1002-short term
R&D funding programme (Grant, No: 109K587) and Faculty Development Program (OYP)
(BAP-08-11-DPT-2002K120510) of METU. Moreover, the professional supports of OSD
and TAYSAD two main representatives of Turkish automotive industry have played an
instrumental role in the success of the questionnaire survey application (see Appendix E and
F for their letters of support).
occurred from your customers”, because what you mean by “technology spillovers” term is a very complicated
and unknown among surveyed firms. Therefore, “knowledge transfer” term is preferred to use for the tacit
transfers such as training, know-how, assistances etc., on the other hand “technology transfer” term is preferred to
use for the explicit transfers such as documents, machinery, equipment, manuals, blueprints etc. 75
We will use the four terms “customers”, “buyers”, “AMMs” and “MNCs” interchangeably throughout the
study to refer to the same concept since approximately all of the AMMs operating in Turkey are MNC affiliates
and/or they are manufacturing under foreign license/brand of global automotive main manufacturers, by the way,
majority of the surveyed firms are direct suppliers of at least one AMM in Turkey and they carry out most of their
sales to these customers so these four terms are used interchangeably (see sections 4.2.1.3, 4.7, 5.5, and Appendix
J for details).

123
This chapter before presenting the findings and econometric results in the next chapters
(Chapters 5, 6 and 7) describes mainly the research methodology and design of the study in
very detail. For the beginning, the next section includes some information about the
automotive industry in Turkey which includes basic economic indicators such as production,
foreign trade, sales, capacity, employment, place of industry in world, AMMs and supply
industry in Turkey. In the third and fourth sections, the scope, the purpose and main research
questions of the study will be mentioned. Then, research methodology will be justified. In
the sixth section, the basic research methods adopted for data gathering will be explained in
detail. Lastly, some concepts and differences for the firms constructed and used in the
analyses will be descripted.
4.2. Automotive Industry in Turkey
Automotive industry in Turkey was established in the mid-1950s as an assembly industry. A
number of MNCs set up majority joint ventures with Turkish partners and entered into the
market in the late 1960s. Until the 1980s, the share of the automotive industry in Turkey’s
total exports was nearly zero due to the policy of import substitution development strategy.
However, with the change in industry policy through outward-oriented industrialization in
1980, the share of the industry in total exports started to increase and reached to 1% on
average for 1980-1990. Moreover, after the full capital account liberalization in 1989 and
following the signature and formation of the Customs Union agreement between Turkey and
the EU in 1996, three global AMMs from Japan and South Korea invested and launched
production in the mid of 1990s in Turkey (Toyota 1994, Honda 1997, Hyundai 1997)76
.
Turkish automotive industry has passed significant steps since 1960s; these are basically
summarized in five main headings (MITI, 2011):
In the 1960s, assembly manufacturing of tractors and commercial vehicles for “import
substitution”,
In the 1970s, “localization” and “manufacturing of passenger car” for producing some
components and parts in domestic market,
In the 1980s, capacity and technology investments in the sector,
In the 1990s, restructuring and integration with the global industry for global
competition,
76
See Şenses and Taymaz (2003), Taymaz and Yılmaz (2008b), SPO (2007) and MITI (2010 and 2011) reports
on automotive industry in Turkey for detailed information about the sector.

124
In the 2000s, entrance to “sustainable global competitive process” by creating higher
value added design and manufacturing for world markets.
4.2.1. Basic Economic Indicators
4.2.1.1. World Automotive Production
Figure 4.1 displays the total world motor vehicle production by the type of vehicles produced
over the period 1999-2010. As it can be seen from the Figure, total production was nearly
70M units in 1999, and 50M of that were personal car and 20M were commercial vehicles.
In 2010, total production increased nearly 14% according to 1999 and reached to 80M units,
by the way it seems that production of commercial vehicle was remained constant in 20M
units, and this increase was occurred only in personal cars by 20%. This shows that the total
demand for personal cars are very strong than commercial vehicles.
Figure 4.2 shows the share of countries in world motor vehicle production over the period
1999-2010 and Figure 4.3 displays the first largest twenty countries’ production units in total
motor vehicle production in 2010. According to these, 65% of the world total production in
2010 is carried out by only six countries. It seems that China has the biggest share in total
world production by nearly 24% (two times bigger than the nearest rival country) with more
than 18M units in 2010. This country is followed by Japan (12%), USA (10%), Germany
(8%), South Korea (6%) and India (5%). The most striking finding is that shares of the major
automotive countries (USA, Japan, Germany, France, and Spain) declined over the period;
on the other hand China had increased her share at increasing rate. This situation is a result
of the transferring production bases by manufacturers from developed countries to China and
also reflects that China is the new production base of the world for the global AMMs. In this
process, two countries come to the fore: India and South Korea. South Korea was in the
seventh place in 1999 by 5%, and she had succeeded in preserving its place in terms of
production share and today she is the fifth biggest country in terms of production in the
world by passing France, Spain and Canada. On the other hand, India was in the twelfth
place in 1999 by 1.5% share; however she had increased her share nearly three times and
today she is the sixth biggest country by 4.6% share in total world production. Combined
with previous finding about China, we can say that world motor vehicle production has
shifted from the West to the Asian countries.

125
Figure 4.1: World Motor Vehicle Production by Type and Year 1999-2010
(million ea.)
Figure 4.2: Share of Countries in World Motor Vehicle Production
by year 1999-2010
Source: Author Calculations based on OICA Statistics
Figure 4.3: World Motor Vehicle Production
by Country in 2010
Source: Author Calculations based on OICA Statistics

126
4.2.1.2. Production and Place of Turkey in World
Figures 4.4 and 4.5 display the share of Turkey’s motor vehicle production in world and total
production units respectively according to personal cars and commercial vehicles categories
over the period 1999-2010. In terms of number of units produced, Turkey was ranked 24th in
world with total amount of nearly 298,000 vehicle production (222,000 personal cars and
76,000 commercial) corresponding to a total share of 5‰ in 1999. Moreover, Turkey was
ranked 10th among European countries for the same year. In the last decade, Turkey managed
to increase triple her share (1.41%) and rose to 16th place in world with nearly 1.1 million
units produced (603,394 personal cars and 491,163 commercial vehicles) in 2010 (see Figure
4.3). Turkey became the 5th largest producer among European countries after Germany,
Spain, France and UK, respectively. Besides, Turkey’s share has risen to a larger extent in
commercial vehicles than in cars. In the world ranking in 2010, Turkey is at the 9th position
in the personal car production and 17th rank in commercial vehicles production with the
shares being equal to 1% and 2.5%, respectively (see Figure 4.4).
4.2.1.3. AMMs in Turkey
Today, there are fifteen AMMs operating in Turkey and these are also the members of OSD.
Entire list of the AMMs together with their geographic locations, establishment dates and
their statistics in terms of sales, capacity, production, foreign capital structures can be seen in
Appendix J.
When the foreign capital structure of the AMMs are analyzed, two of the firms consisted of
100% foreign capital (Toyota and Honda) firms while five of them are completely local-
capital (FS=0%) firms. Four of the remainder firms are foreign capital firms (joint venture
with minority foreign ownership) with ratios ranging between 29% and 42% and four of
them are foreign capital firms (joint venture with majority foreign ownership) with ratios
ranging between 51% and 99% (see Table 4.1 and Appendix J). Moreover, the most striking
characteristic of the AMMs is that approximately all of them are MNC affiliates or
manufacture under foreign license independent of local or foreign capital structure77
(see
Appendix J); therefore, the terms AMMs and MNCs are used interchangeably throughout
this study to refer to the same concept.
77
It was detected from the interviews that two AMMs (B.M.C and Türk Traktör) which are not seen that
manufacturing under foreign license in Appendix J also use foreign license to manufacture some parts and/or
import their powertrain parts and components from MNCs.

127
When we look at the types of vehicles manufactured by firms, we see that light, medium, and
heavy commercial vehicles (such as bus, minibus, midibus, pick up, truck and farm tractor)
are generally produced by five local ownership firms (FS=0%). Manufacture of personal cars
is performed by five firms which has partnership with MNCs as joint venture. The firms
manufacturing personal cars are respectively Tofaş (FS=37.8%), Oyak-Renault (FS=51%),
Hyundai (FS=70%), Toyota and Honda (FS=100%) according to their foreign capital ratios.
When the province in which firms operate is analyzed, four of them operate in Kocaeli, three
of them operate in Bursa, three in Sakarya, two in Ankara and remainder three firms operate
in Istanbul, Izmir and Tekirdag. It has been observed that firms manufacturing personal cars
are located in Kocaeli, Bursa and Sakarya; firms manufacturing commercial vehicles such as
bus and truck are mainly located in Ankara, Istanbul, Izmir and Eskisehir.
Establishment dates of the local-capital firms (except for Hattat and Temsa) were in early-
and mid-60s. It is observed that personal car manufacturers TOFAŞ and Oyak-Renault firms
with respectively 37.8% and 51% foreign-capital were established in 1971, the other three
foreign-capital AMMs were established in 1994 (Toyota) and 1997 (Honda and Hyundai).
Table 4.1 presents a number of indicators pertaining to share of AMMs in total capital,
capacity, production and sales according to their foreign share classification.
Table 4.1: Share of AMMs in Total Capital, Capacity, Production
and Sales by Foreign Share (%)
Source: Author calculations based on OSD statistics, see Appendix J
According to this;
Total sales of the fifteen AMMs for 2010 were approximately TL 28B, 47% of it was
realized by six firms of which foreign capital is above 50%, 45% of it was realized by
four firms of which foreign capital ranges between 29% and 42% and only 8% was
realized by the five local firms (FS=0%).
When the capital structure of these firms is analyzed, their total capital sum is TL
3.1B, the share of the firms of which foreign capital is more than 50% is 39% in total
capital, the share of the firms of which foreign capital ranges between 29% and 42% is
30% and capital share of the local firms is 31%.
NCapital
(TL)
Capacity
(2011)
Production
(2010)
Sales (TL)
(2010)
FS > 50% 6 38.70 43.36 44.74 47.29
29% < FS < 42% 4 29.99 47.85 52.08 44.76
FS = 0% 5 31.31 8.79 3.18 7.94
Total 15 100 100 100 100

128
The Table 4.1 also shows the shares of the firms in total capacity and total production.
Total capacity of the firms was 1.6M pcs in 2011; total production amount was 1.1M
pcs in 2010. As can be observed from the Table, four AMMs whose foreign capital
ranges between 29% and 42% had the highest rates regarding the last two indicators
(48% for capacity and 52% for production), firms whose foreign capital is more than
50% followed them (43% for capacity and 45% for production).
In summary, although capital ratios of the local and foreign-capital AMMs seem to be
approximately equal, the foreign-capital AMMs have capacity (91%) nine times bigger than
the local-capital AMMs (9%); they realize 97% of the total production and 92% of the total
sales. This is significant for indicating the importance of the foreign capital (MNCs) in
automotive main industry in Turkey and superiority of it in the industry. This situation also
explains once more why we use the “MNCs” and “AMMs” terms interchangeably in the
study for the main companies in Turkey (see sections 4.7, 7.1 and 7.2 for more details on the
AMMs).
4.2.1.4. Automotive Supply Industry in Turkey
Automotive supply industry produces finished goods, semi-finished goods, components,
systems, OEM parts directly or indirectly for the AMMs operating in domestic and overseas
markets and/or for the replacement market. The suppliers in this industry generally conduct
these activities in accordance with the technical documents specified by AMMs. There is not
reliable statistical information on the number of firms which operate in the automotive
supply industry. According to the various reports regarding the industry, it is estimated that
number of suppliers in supply chain is about 1100 and the number increases to 2000-3000
with sub-sectors (see Table 4.7 for details). However, it is predicted that the number of the
direct suppliers that produce parts directly for the AMMs is much more less and about 300-
35078
(see section 7.5.2 for the exact numbers in terms of AMMs interviewed). These
suppliers are largely clustered in Marmara, Aegean and Central Anatolia regions in parallel
with the AMMs (see sections 4.6.1.2 and 7.5.6 for more details). Main production groups
manufactured by domestic automotive supply industry may be summarized as complete
engine and engine parts, internal and external tires, powertrain mechanisms, brake systems
and parts, hydraulic and pneumatic mechanisms, suspension parts, safety mechanisms,
rubber and tire parts, frame mechanism and parts, forged and cast parts, electrical equipment
and lighting systems, accumulators, car glasses, seats and plugs.
78
TUBITAK (report for 2023 vision); SPO (2007); and MITI reports (2010 and 2011).

129
4.2.1.5. Total Employment of the Automotive Industry in Turkey
The automotive main industry in Turkey employs about 50K people in 2010 according to
OSD statistics. On the other hand, it is estimated that supply industry employs nearly 200K
and this number reaches to 500K people together with sub-sectors, distribution, marketing,
service and sales networks.
4.2.1.6. Foreign Trade of the Automotive Industry in Turkey
According to TurkStat statistics
79, export of automotive sector which was about US$ 181M
in 1991 increased 13.8% in 2008 compared to 2007 (US$ 17B) despite the significant
decrease in the last quarter of 2008 due to the global crisis and broke a historical record by
rising approximately to US$ 20B in 2008 (see Figures 4.6, 4.7 and 4.8). This is very
significant for indicating that the export of automotive sector in 2008 has increased 110
times compared to 1991. According to same data, personal cars ranked 1st among automotive
export items with US$ 7.5B in 2008. Figure 4.8 shows the evaluation of the shares of five
largest industries in total exports of Turkey’s. According to this, the share of the automotive
industry in total exports was only 4% in 1996 and then continued to rise continually, and
from 2000 onwards it increased at an increasing rate and finally by passing three major
industries (basic metals, textile and food) it ranked 1st among all industries by 13% with US$
15B exports value in 2010. In contrast to export values, the share of the industry in total
imports of Turkey changed between 5% (2001) and 12% (2004) and became 9% on average
over the period 1999-2010. These figures point out that Turkish automotive industry
acquired a very important place in the world motor vehicle sector and performed very well in
terms of exports. Moreover, it has experienced significant performance, output and
productivity growth during last decade and has enhanced its competitiveness on global
markets transforming it today into one of the most dynamic, successful and important sectors
in Turkey.
79
Author calculations based on TurkStat foreign trade statistics database, NACE 34 ISIC Rev.3 for motor vehicle
industry, BEC 51 for personal cars.

130
Figure 4.4: Share of Turkey’s Motor Vehicle Production
in World Production
Figure 4.5: Motor Vehicle Production of Turkey
by year 1999-2010 (x1000)
Source: Author Calculations based on OICA statistics
Figure 4.6: Export and Import Values of Turkey’s Motor Vehicle Sector
by year 1999-2010 (Million USA dollars)
Figure 4.7: Share of Turkey’s Motor Vehicles Sector in Total Foreign
Trade by year 1999-2010
Source: Author Calculations based on TurkStat Statistics

131
Figure 4.8: Evolution of Sector Shares in Total Exports of Turkey: 1996-2010
Source: Author calculations based on TurkStat
In summary, figures presented above point to the excellent performance of the Turkish
automotive industry at least since the 1990s. However, this performance will be very
difficult to sustain due to the increase observed in the number of competitors on the world
market and the emergence of new low-cost locations to which MNCs will certainly be
attracted. Therefore, if Turkey wants to its automotive industry to continue to be a major
engine of economic growth and important source of employment creation, she will have to
upgrade it from being solely a production base to an “excellence center” providing high-
quality services in terms of R&D, design, test and innovation. The role of KTTs and
collaboration activities with MNCs, undoubtedly, will play an important role in this
transition.
4.3. Scope of the Case Study
In general, the main reason for analyzing the automotive industry is that it is one of the
industrial sectors in which globalization process is realized in the fastest way among the
current industrial sectors in the world. Although there are a few global AMMs left due to
take-overs and mergers worldwide, these firms highlight their global production networks by
making production in different regions and countries around the world, compete with each
other on high level and realize the great deal of R&D and innovation activities when
compared with other industrial sectors. Besides, the relations between AMMs and their
suppliers are considerably strategic and intense compared to other sectors.

132
The case-study will target only Turkish automotive industry. The main reasons behind the
choice of this specific sector can be summarized in this way: It was chosen as a case-study
because it accounts for a significant share of GDP and exports of Turkey. It is among the
largest recipients of FDI and is dominated by MNCs. Moreover, it is highly competitive on a
global scale and is also targeted by the Turkish governments. The most important reason for
the analysis of Turkish automotive industry as mentioned in previous section is the
significant place of this industry in Turkish economy which has been achieved in time. It has
become one of the primary industries in Turkey by making a fast progress especially in the
last ten years (as of 2000), thus having a strategic importance today. This situation reveals
itself with an important share in total export of manufacturing industry, R&D expenditures
and employment of Turkey. Moreover, in Chapter 3, the statistical findings also revealed that
automotive industry (NACE 34) is in the first place among all industries in Turkish
manufacturing industry (see section 3.3.1) in terms of the share of the foreign firms in the
production, gross output, value added and all firms. In addition, backward technology
spillovers are highest for the “motor vehicles” sector as well as horizontal spillovers (see
section 3.4.3.4). Many foreign firms operating in the industry, presence of strong strategic
relations between these firms and local firms, intense R&D and innovation activities in the
industry and incentive policies of the government towards the industry may be indicated as
factors playing an important role in this process. The industry is also highly supported by the
governments for strategic purposes besides being a sector drawing most FDI.
The current state of the Turkish automotive industry can also be summarized with the
information available in the website of TAYSAD as follows80
:
Annually 1.5M ea. production capacity,
Second bus producer, first light commercial vehicle producer, third biggest truck
market in the European Union,
Sixteenth biggest automotive producer of the world in 2010,
Sixth automotive producer in EU and the presence of light commercial vehicle market
bigger than the total of eight EU member states (Czech Republic, Romania, Slovenia,
Poland, Hungary, Slovak Republic, Estonia, Latvia, Lithuania).
Due to the above-mentioned reasons, it may be assumed that MNCs regard Turkey as the
production base for Europe and Middle East in the recent years.
80
Source: http://taysad.support.com.tr/altmenu.asp?AnaId=1411&def_dil_id=149

133
Following issues can also be added to the reasons for analyzing the Turkish automotive
industry:
Turkey’s transformation into an automotive production base with 15 automotive
factories due to the fact that many AMMs have globally preferred Turkey as
production base for their Middle East and Europe markets,
Turkey’s being the third biggest vehicle manufacturer of the Eastern Europe,
The presence of many MNCs making production in the industry and the production of
these firms being on a global scale,
High level of innovativeness and competitiveness of the firms in the sector,
Realization of cooperation activities in terms of R&D and innovation for strategic
purposes between AMMs and direct suppliers.
4.4. The Purpose of the Study and Research Questions
In line with the main purposes of the thesis mentioned before (see section 1.2), the purpose
of the case-study is basically to examine the complex nature of KTTs at inter-firm level
occurring through backward linkages from customers to their suppliers in Turkey’s
automotive industry, and to explore the firm-related factors that affect these transfers.
However, it is not limited to these; it also aims to explore suppliers’ major markets;
technology capabilities related to design; R&D and production; position in the global value
chain; cooperation activities with other firms; benefits of being direct suppliers; R&D and
innovation activities and performance levels. Furthermore, it aims to obtain a detailed
summary of the story and to look at these events in terms of the AMMs, especially to reveal
the AMM and supplier relationships. Also, we want to investigate KTTs at intra-firm level
occurring from MNCs as foreign partners to their affiliates in Turkey. Hence, research
questions are formulated from two sites: for suppliers and AMMs. In summary, it is
specifically aimed to obtain important information and to find answers for the following
questions:
For Supplier Firms:
What are the general characteristics of the suppliers?
What types of KTTs have been provided through backward linkages from customers to
their suppliers at inter-firm level? And what is the frequency or intensity of these
transfers?

134
What is the market and competition structure of the suppliers?
What is the level of technological capabilities of the suppliers related to production and
design?
What is the position of suppliers in global supply chain?
What are the reasons for collaborating with customers and other firms?
What are the importance and benefits of being a direct supplier of AMM?
What are the R&D and innovation activities of the suppliers? And absorptive capacity of
the suppliers?
What are the effects of the assistances received from customers on the performance level
of the suppliers?
What characteristics of the suppliers (such as age, size, export intensity, foreign
ownership, being a direct supplier, possessing R&D department, carrying out innovation
activities, technology capabilities etc.) have played an important role in all above
mentioned activities especially in KTTs? In other means, what are the determinant factors
that played an important role in all these activities especially in KTTs?
For AMMs:
What are the general characteristics of AMMs in terms of production, R&D, innovation
and technology?
What are the critical technologies and sources of these technologies (explicit or tacit)
used in the production?
What kind of technology activities do AMMs carry out with other partners?
Have KTTs been provided to AMMs by their partners (MNCs or global AMMs as foreign
partners, parent companies, other MNCs)? If yes, what are the channels of KTTs realized
by MNCs as foreign partners to the AMMs in Turkey at intra-firm level?
Who are the direct suppliers of AMMs?
What are the criteria to be supplier of an AMM?
What are the strategic relationships of AMMs with direct suppliers?
Do AMMs provide any kind of KTT to these suppliers? If yes, what are the channels of
KTTs realized by AMMs at inter-firm level?
What is the role of AMMs in the development of automotive industry in Turkey?
What is the role of government in the activities of AMMs especially related to KTTs and
collaboration with local firms?

135
What policies can be implemented to attract more KTTs from AMMs and to increase
local suppliers’ technological capabilities and competitiveness level compared to other
rival countries?
This study provides answers to these questions.
4.5. Research Methodology
In this study, we analyze the Turkish automotive industry as a case study to understand
mainly the complex nature of KTT occurring through backward linkages from AMMs to
their suppliers. Case study is defined in the encyclopedia of survey research methods like in
this way: “it is an in-depth analyses and intensive description of a single individual, group,
firm and organization based on collected data and information from a variety of sources
(observations, questionnaires, interviews, documents, direct observation, participant-
observation, and archival records etc.)” (Lavrakas, 2008). It is also defined by Yin in more
formal way: “an empirical inquiry that investigates a contemporary phenomenon within its
real-life context; when the boundaries between phenomenon and context are not clearly
evident; and in which multiple sources of evidence are used” (Yin, 1989; 23).
Case studies have been frequently used by researchers especially in social sciences for the
purpose of getting comprehensive and detailed picture of the research problem that is under
investigation, and it contributes to knowledge of this problem (Hancock and Algozzine,
2006). Actually, it is a method of qualitative research approach. As defined, it aims to
explore a number of factors that may affect a situation, or to explore possible sources of the
problem. This generates very valuable, rich and useful information about the phenomenon
under investigation especially when there is no any data and knowledge about the problem or
little is known about the issue being studied. It can be a guide for quantitative study later and
it can illuminate the new ideas or build a new knowledge base for further researches.
However, it requires more time and resources to collect data, to analyze and to present the
results compared to other methods81
.
In order to answer the previously raised research questions, it is necessary to investigate the
specified problem and such questions at firm level; however there is no any data and
81
See Bailey (1987); Hamel et. al. (1993); Gomm et. al. (2000); Carson et al. (2001); Travers (2001); Yin,
(2003); George and Bennett (2005); Anfara and Mertz (2006); Hancock and Algozzine (2006); Ellet, (2007);
Gerring (2007); Lavrakas (2008); Creswell (2009); Merriam (2009); Mills et al. (2009); Sekaran and Bougie,
(2009) for detailed information on research methodologies in terms of case-study.

136
information on that at national or international level. Moreover, the topic is too complex, the
problem and variables are not well known and not specified in the literature. They need
further in-depth exploratory research to analyze and to explain the full picture and factors
that affect the KTTs to suppliers. Therefore, the study, as the scope and nature of that,
requires the collection of detailed data and information at the firm level about the suppliers
and AMMs operating in Turkish automotive industry. Hence, the research methodology of
this study adopted is mixed-methods research design based on the nature of the problem,
purpose of the study and research questions. This research design uses a combination of both
quantitative (questionnaire survey) and qualitative (in-depth interviews) research
methodologies for data collection, analysis and addresses the proposed research questions82
.
Moreover, qualitative data based on face-to face interviews with the top-executives of
AMMs in Turkey will be used in a complementary way.
4.6. Data Collection Methods
In this study, only primary firm-level data, which was collected from the suppliers and
AMMs, were used. As defined it was collected by both quantitative and qualitative research
methods. The quantitative data were obtained from suppliers through face-to-face
questionnaire survey; on the other hand, the qualitative data were obtained from AMMs
through face-to-face semi-structured in-depth interviews. In this section, we will analyze
these data collection methods and give detailed information about the steps of data gathering
procedures.
4.6.1. Quantitative Data: Face-to-Face Questionnaire Survey with
Suppliers
This section provides detailed information mainly on questionnaire design, sample selection
and sampling procedure. Moreover pilot study, application of fieldwork, survey results and
response rates will be explained. Lastly, it presents information on data input, the
representativeness of the sample, validity and reliability tests of the data.
82
See Bailey (1987); Tashakkori and Teddlie (1998; 2010); Thomas (2003); Neuman (2006); Greene (2007);
Bergman (2008); Teddlie and Tashakkori (2008); Creswell (2010) and Biber (2010) for details on research
methods in social sciences.
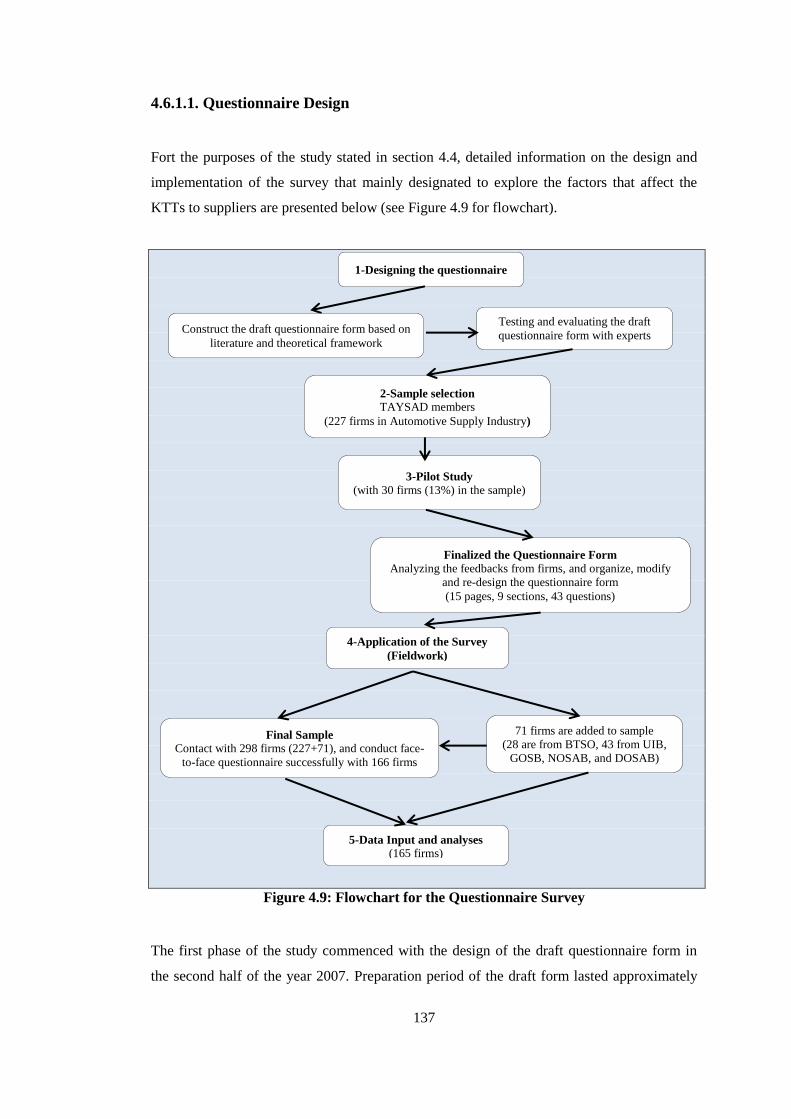
137
4.6.1.1. Questionnaire Design
Fort the purposes of the study stated in section 4.4, detailed information on the design and
implementation of the survey that mainly designated to explore the factors that affect the
KTTs to suppliers are presented below (see Figure 4.9 for flowchart).
application
Figure 4.9: Flowchart for the Questionnaire Survey
The first phase of the study commenced with the design of the draft questionnaire form in
the second half of the year 2007. Preparation period of the draft form lasted approximately
1-Designing the questionnaire
3-Pilot Study
(with 30 firms (13%) in the sample)
Testing and evaluating the draft
questionnaire form with experts
2-Sample selection
TAYSAD members
(227 firms in Automotive Supply Industry)
Finalized the Questionnaire Form
Analyzing the feedbacks from firms, and organize, modify
and re-design the questionnaire form
(15 pages, 9 sections, 43 questions)
5-Data Input and analyses (165 firms)
4-Application of the Survey
(Fieldwork)
71 firms are added to sample
(28 are from BTSO, 43 from UIB,
GOSB, NOSAB, and DOSAB)
Final Sample
Contact with 298 firms (227+71), and conduct face-
to-face questionnaire successfully with 166 firms
Construct the draft questionnaire form based on
literature and theoretical framework

138
two years in total since there weren’t any similar studies conducted previously on the studied
issue and industry. The first version of the questionnaire form was generated by being
inspired from many resources following an in-depth scientific literature survey which lasted
for almost one year. Another objective of the study is to enable the econometric analyses in
the light of the data to be acquired from the above-mentioned questionnaire survey.
Therefore, the content of the questionnaire was planned in a way to enable econometric
analyses. The questionnaire form was also generated by keeping to the information acquired
from the many studies conducted before on the automotive industry or different sectors and
theoretical framework. The main and important sources benefited in the construction of some
sections and items in the questionnaire form are presented below:
Giroud (2003) for the KTTs related to product, production process, financial
assistances and training activities,
Berger (2005) on external collaboration for R&D and innovation activities,
Techakanont (2002) for design, performance, technology agreements and technology
sources,
Lorentzen et. al. (2003); Mollgaard and Lorentzen (2004) for supply chain, market and
competition structure,
Akarsoy (2005) for future projections on technology acquisition.
After draft questionnaire form was completed, experts, technology consultants and
academicians who have knowledge about the industry and conducted studies on the industry
previously were interviewed in order to consider both the characteristics of automotive
industry of Turkey and accurate comprehension of questions by the people who will respond
to the questions. Furthermore, evaluations regarding the issues such as difficulties to be
encountered during the application, what can be done in order to enhance response rate and
having of preliminary information about the industry were also made with those people83
. As
a consequence of the feedbacks acquired from those evaluations, the form was reviewed, and
modified upon recommended alterations and revisions. This period lasted six-month and the
draft questionnaire form was finalized in order to be used in pilot study at the end of total
two years period84
.
83
The author participated in the workshop titled as “main industry and supplier relations” held in Bursa by UIB
in the last week of October in 2008 and had the chance to meet with top-executive representatives of the AMMs
and suppliers. As a result of the interviews and evaluations made with these people, some very important ideas
regarding the study and survey were obtained, and the questionnaire form was also evaluated and reviewed
accordingly. Furthermore, the opportunity for closely observing buyer and supplier relations was obtained in
these meetings. 84
The number of the version of draft questionnaire form prepared during the design of questionnaire is
approximately 10. Many modifications regarding the general structure, sections, questions and items of

139
Majority of the questions in the questionnaire are formed according to closed-ended multiple
choice, yes/no, Likert scale, ranking questions etc.85
Most important reasons also indicated in
the literature for using close-ended multiple-choice questions in the survey are as follows;
The demand for gathering quantitative data and suitability of the data for statistical
analyses electronically,
Non-interpretable quality of the questions in the sense of respondents,
Possibility for a mutual comparison between firms,
Possibility for applying it to many firms simultaneously
Shorter completion duration for respondent and researcher,
Firms deeming it more proper regarding its format,
Higher privacy compared to the open-ended questions by the firms and high rate of
responses.
Before proceeding to the general application phase of the survey, sampling was made by
selecting the firms for which the questionnaire would be applied, and pilot study was carried
out with the firms selected from the sample in order to perform the pre-test of the draft
questionnaire form and detect the problems which were not anticipated by the researcher
regarding the application. Finally, draft questionnaire form was revised according to
feedbacks acquired from the pilot study and finalized.
4.6.1.2. Sample Selection
As stated in previous pages, our questionnaire survey will target suppliers in Turkish
automotive supply industry as a target population. Analysis of suppliers playing an important
role in Turkish automotive sector, being the direct suppliers of the AMMs, pioneering the
development of the sector and integrated to global economic system and manufacturing with
an international quality was aimed within the framework of the main purposes of the study.
questionnaire form were made during this process. The reasons for the finalization and design process of
questionnaire form taking such long time are as follows in brief; (i) many firms discontinued production in the
sector due to 2008-2009 global financial crisis and/or many top-executives who were requested to be interviewed
could not be accessed in the application period due to this crisis, (ii) quantitative questions which would be asked
to the firms for a specific year were re-organized permanently due the effects of the crisis, (iii) difficulties were
encountered during finding Turkish equivalents which will express the same meaning in the most appropriate
way of the English terms (jargons) which have been used in the international literature, (iv) the questionnaire was
tested in order to ensure that it is comprehended similarly by the people who will answer them, (v) the
questionnaire form was continuously revised according to the methods to be followed in order to obtain the
confidential information regarding the firms in a most appropriate way and reach a high rate of response. 85
“Others” and “no response” options were also added to items and questions to give a chance to respondents to
express their opinions on issues.

140
Thereby, the survey concentrates on medium and large-sized firms86
, institutionalized
manufacturing firms, export oriented firms, firms that produce OEM parts and especially
direct suppliers of AMMs. Furthermore, it is anticipated that such firms attach more
importance to the study due to their professional, international management and organization
structures.
In the context of the above mentioned sample framework, in the application of the survey,
we believe that survey all firms in Turkish automotive supply industry as a target population
will not be correct in terms of purpose and scope of the study87
. The main reasons of this can
be summarized as follows:
In Turkish supply industry;
The number of firms making production on a small-scale (less than 50 employees)
being quite high: According to the 2008 statistics of TurkStat88
, the ratio of the small-
scale enterprises in automotive supply industry is approximately 90% (see Table 4.7).
The number of firms producing with institutional quality being low and/or a lot of
firms being family corporation with low institutionalization level.
Realization an important section of sales in different sectors (defense, white
appliances, electrical and electronic sector etc.) by some firms despite the fact that
they appear as operating in automotive sector.
Great majority of firms operating for replacement market.
The majority of the firms producing and operating for raw material and services.
Low number of firms performing R&D and innovation activities.
Low number of firms producing according to internationally-acceptable quality
standards.
Low number of firms producing for international market (exports).
Pretty low number of direct supplier firms producing OEM parts for AMMs (see
section 7.5.2).
Low number of firms performing cooperation activities with AMMs.
In brief, although it is expected that more than 2000 firms operate in the automotive supply
industry (see section 4.2.1.4, Table 4.7 and section 4.6.1.9 for details), it is believed that the
number of firms which have acceptable production standards, manufacture original parts
86
We take into account employee number as an indicator of firm size. 87 One of the important reasons for not applying the survey on all firms operating in the sector is that a study on
such a scale requires a larger period of time, project team and budget. 88
Author calculations based on annual ISSS database, 2008, TurkStat.

141
directly to the AMMs and export by competing in international markets is approximately
300-350 (it is also proved by findings of interviews with AMMs, see section 7.5.2). Other
firms mostly constitute small-scale production facilities as summarized above and they
generally make production for the replacement market (TUBITAK, report for 2023 vision;
SPO, 2007; and MITI, 2010). Due to these reasons, member firms of TAYSAD were
selected as main sample among the suppliers operating in the automotive supply industry for
the purpose of collecting quantitative data and information. Main reasons for including
TAYSAD members in the study scope can be summarized as follows (August, 2009)89
:
TAYSAD was established in 1978, and it is sole and most important representative of
the Turkish automotive supply industry.
with 259 members, TAYSAD represents 65% of the output for the automotive supply
industry and 70% of the industry’s exports.
In 2008, 29 members were in “Turkey’s Top 500 Industrial Enterprises” with
approximately total TL 8.5B sales value from production, 41 members were in
“Turkey’s Top 1000 Exporting Firms” with approximately US$ 3.2B export value, 18
members are in “Biggest Companies in Bursa Research” with TL 4.2B sales value
from production90
.
Members employ nearly 80,000 people and with sub-suppliers this figure reaches
approximately 125,000 people.
58 members are in the status of foreign firm in various foreign ownership status.
Majority of the members are direct suppliers of AMMs operating in Turkey.
Moreover, almost all of the important and large firms operating in the automotive supply
industry of Turkey and the direct suppliers of the AMMs and the foreign-capital firms are
gathered in Istanbul, Bursa, Kocaeli and Izmir provinces where automotive main industry
firms are located. When analyzed regionally, 75% of suppliers are located in Marmara
Region, 13% are located in Aegean Region, 7% are located in the Central Anatolia Region
and 5% are located in other regions (SPO, 2007 and TUBITAK, report for 2023 vision). In
other words, Marmara region is the main land of the Turkish automotive industry. Thus, 227
firms which are the members of TAYSAD and operate in these four provinces or Marmara
region were taken as the basis in making sampling for suppliers and other 32 member firms
89
Source: TAYSAD’s web page; http://www.taysad.org.tr/www/en/default.asp?x=hakkinda. 90
These three research reports are conducted and published yearly by The Istanbul Chamber of Industry (ICI),
Turkish Exporters Assembly (TIM) and Bursa Chamber of Commerce and Industry (BTSO), respectively.

142
of TAYSAD were excluded from the survey91
. One of the important reasons for excluding
these firms is that it is detected by contacting with these firms on the telephone that they are
small-scale firms, generally make production for replacement market and produce raw
material and service activities etc. within the framework of the above-mentioned criteria.
Another important reason is that since excluded firms operate in totally fourteen different
provinces, greater budget, team and time are required for face-to-face interviews with these
firms.
4.6.1.3. Pilot Testing
Pilot study was carried out by the author in a two-month period between August and
September 2009. Thirty (13%) firms were selected randomly from the sample (227)
composed of TAYSAD members operating in four provinces for the pilot study of the
questionnaire.
In pilot study, preliminary information was primarily given to the selected firms on the
telephone and the contact information of the top-executives who may participate in the
questionnaire survey was obtained. Then, the top-executives of the firms were contacted and
detailed information regarding the objective, scope and method of the study was conveyed.
Cover letter summarizing objective, scope and method of the study (see Appendix C),
support letter of OSD (see Appendix E) and draft questionnaire form were sent both to the e-
mail addresses of the concerned persons and firm addresses within special envelopes
organized for their names by cargo following the phone interviews. It was emphasized both
during the phone interviews and in cover letters sent to the firms that all the firm-specific
information requested within the scope of the study is subject to the privacy principle.
As is known, quality and success of a study is closely related to its design and application
method. Importance attached to the questionnaire and research by the firms and top-
executives bears great significance for acquiring reliable information at the end of the study.
Therefore, special emphasis was laid on the application methods of the questionnaire in
order to enhance feedback rate and prove for the firms that the study is really professional;
and great importance was attached to the preparation of questionnaire form, cover letter,
91 The excluded 32 members of TAYSAD are in 14 different provinces: Aksaray (1), Ankara (4), Düzce (1),
Eskişehir (1), Hatay (1), Konya (5), Kütahya (1), Manisa (5), Mersin (1), Sakarya (2), Samsun (1), Sivas (1),
Tekirdağ (7) and Trabzon (1).

143
envelopes and other documents. For this purpose envelopes of best quality were used,
contact information of the individuals was printed on address labels prepared in the
electronic environment and affixed onto the envelopes. Colored print-outs of the cover letter
and support letters were obtained and questionnaire form was printed on a blue-color, high-
quality A4 paper. Furthermore, a pen with METU logo was added into the envelope as a gift
to extend our sincere thanks for their participation in the survey, and a stamped self-
addressed return envelope which is ready to be sent was also added into the envelope.
Additionally, web site including the online version of the questionnaire was prepared in
order to enable the application of the survey in a more effective way and shorter time and
test the performance of it through Internet. Online ID address specific to each firm was given
and the online access of the firms to the questionnaire form was achieved by these addresses
in order to provide privacy for the firms.
Top-executives were called two weeks after envelopes were sent by cargos to firms in order
to make reminding about the questionnaire. In the first four weeks, five firms provided
feedback. One of the firms preferred to fill the questionnaire form by performing a face-to-
face interview with the author. Individuals who did not provide feedback were contacted
again and reminded of the survey. Although the individuals stated that they would participate
in the survey during the phone calls, they told that they could not allocate time for or
complete the survey due to their tight schedule, being on vacation, abroad or participating in
a meeting etc. and requested additional time. Complete feedback was received from totally 8
firms (Bursa 3, Istanbul 3, Kocaeli 2) and 27% response rate was obtained at the end of the
period allocated for pilot study92
.
At the end of the pilot study, it was figured out that questionnaire application by means of
cargo, e-mail and online methods would not be very efficient in terms of response rate and
could take a long time. Therefore, it was decided that application of the questionnaire via
face-to-face interviews with authorized staff of the firms would be more effective and
important for both the success and quality of the research. Another important deduction is
that quantitative data of the firms regarding 2009 was negatively affected from the global
financial crisis that began at the end of 2008. Although the questionnaire would be applied in
2010, it was decided that quantitative data about the firms to be gathered would be
concerning 2008 for this reason. Data regarding the employee figures of the firms was asked
separately for 2007 in order to test whether crisis affected data of 2008 or not. However, any
92
It was determined during the pilot study that unpaid leave was applied and production of many firms was
ceased in the sector in this period due to effects of 2008-2009 global financial crisis, so these are the most
important causes for low response rate.
144
finding indicating that data of 2008 was affected negatively from the crisis was not obtained
during analysis of the data regarding the 2007-2008 employee years at the end of the general
questionnaire application, and the data concerning 2008 was used in the analyses.
4.6.1.4. Designing the Final Questionnaire Form
Following the pilot study, the questionnaire form was reviewed again in the light of the
feedbacks obtained from the firms and the data collected. Some questions and items were
excluded from the questionnaire, parts which were understood partially or misunderstood
were re-organized and replaced, new questions and items were added to some sections and
structure of the questionnaire form was re-built within this scope and finalized.
Final version of the questionnaire form which was re-designed following the pilot study is
composed of 15 pages, 9 sections and 43 questions. Sixteen of the questions are closed-
ended multiple choice, eleven are numerical, eight are on an integer Likert scale, six are
binary (yes/no) and two are ranking (see Appendix I for the survey questionnaire).
The questionnaire form is generally designed to reveal what type of KTT and how often is
provided by customers to suppliers, common characteristics of suppliers, production,
technology and design capabilities of them, the partners of suppliers in various collaboration
activities, benefits received from being direct supplier, the R&D and innovation activities of
the suppliers, suppliers’ place in the global supply chain and their performances (see
Appendix H for a detailed-questionnaire plan).The structure of the questionnaire form is
summarized under nine main sections, each dealing with diverse aspects of the KTT process:
• Section 1: General information on the characteristics of suppliers including number of
employees, total sales (turnover), foreign ownership, establishment date, share of
export etc.
• Section 2: Types of KTT (related to product and production process) and also
financial transfers (assistances) provided to suppliers by their customers.
• Section 3: Types and modes of training activities provided to suppliers by their
customers.
• Section 4: Market and competition structure of suppliers.
• Section 5: Technology capabilities of suppliers related to production and design.
• Section 6: Information on supply chain, input sources of suppliers.

145
• Section 7: Cooperation activities of suppliers with their customers.
• Section 8: R&D and innovation activities of suppliers.
• Section 9: Performance and future projections of the suppliers.
4.6.1.5. Application of Fieldwork
Fieldwork of the questionnaire survey was performed via face-to-face interviews with firms
during a period of seven months between February and August 2010. As is known, such
questionnaire surveys are applications which are generally challenging, time-consuming and
require greater budgets financially. Especially face-to-face interviews with the top-
executives of the firms are more difficult both for providing the participation of them to the
survey, getting appointments on proper dates and request of firm-specific private data within
the scope of the research. Other difficulties may be sorted as follows:
Application of the questionnaire to many firms,
Operation of the firms to which questionnaire will be applied in many provinces and
locations,
Time-consuming process during the contact with the top-executives of the firms and
getting an appointment from them.
When the above-mentioned difficulties are considered, taking professional assistance
becomes obligatory in order to access many firms within a specific time and perform face-to-
face interviews. Thus, a professional research company located in Istanbul and having
relevant experience was cooperated for application of the questionnaire93
.
In the first phase of the fieldwork, in February 2010, meetings were held in the office of the
cooperated company located in Istanbul with authorities and pollsters of the company which
would perform questionnaire survey. In these meetings, participants were initially informed
in detail by the author about the objective, scope, method of the study and who would be
interviewed and how they would be interviewed and explanations thereof were made.
Secondly, questionnaire form and application methods were mutually evaluated and
93
The company that provided cooperation for the questionnaire application is a research enterprise (incorporated
company, Co.Inc.) which has been engaged in many national and international projects; and a specialist and
pioneer in this field. Supplier firms which were surveyed were additionally informed about this company.
Nevertheless, confidentiality agreement was signed with this cooperated company due to data privacy committed
by us to the firms.

146
discussed with the participants. Furthermore the duration of the survey, the list of the firms
to participate in the questionnaire, and the number and qualities of the pollsters were
specified. Since the people who would be interviewed face-to-face are top-executives, great
importance was attached to the phases of questionnaire application. For instance, many
issues such as the arrangement of appointments, attendance to the appointments on the
specified date and time, informing the firm beforehand in case of delays, pollsters to attend
in the appointments being granted the degree of Master of Arts and at least Bachelor of Arts
and being experienced, appearance of pollsters in the interviews were taken into account.
Application phases of the questionnaire and the way of communication with the firms were
realized by adhering to the instructions specified by the author previously. Questionnaire
application with the firms was consisting of the following steps in summary:
1. The firms were briefly informed on the telephone and the names, positions and e-mail
addresses of the authorized individuals were learned (R&D manager, production
manager, general manager etc.). Furthermore, it was verified whether the main
operation field of the firm was automotive sector, along with the addresses and contact
information of the firms.
2. Authorized individuals whose contact information and names were obtained in the
first phase were called and more detailed information regarding the objective and
method of the study was provided and an appointment was requested. Cover letter,
support letters of OSD and TAYSAD were sent to the e-mail addresses of these
people, as well (see Appendices C, E and F).
3. Contacted authorized individuals were called again on the pre-defined date, and an
appointment on an appropriate date and time was taken.
4. The relevant firm was visited by the pollster on the appointment date and authorized
individuals were interviewed face to face and questionnaire was applied94
(see
Appendix G for detailed instructions).
Firstly, 227 firms which are the members of TAYSAD and operate in Istanbul, Kocaeli,
Bursa and Izmir were contacted during the application phase of the questionnaire95
. The need
for increasing the number of sample firms arose due to the fact that some firms rejected the
94
As is the case in international studies, it was guaranteed to the managers contacted for questionnaire survey
that all kinds of information and data provided for survey would certainly be kept confidential and both the names
of the interviewed people and the title of the firm would never be cited in publications such as in a report or
article taking into account the concerns of the firms regarding their competitors and competition environment.
Therefore, information regarding the interviewed firms and managers were not released. 95
Contact information and address of the firms were obtained from TAYSAD.

147
survey and main operation field of some firms deviated from the automotive industry during
the upcoming phases (in February and March 2010) of the fieldwork. In this context,
following sources were utilized respectively in order to enhance the number of sample firms:
“250 Large Firms Research” report in 2008 published by Bursa Chamber of
Commerce and Industry (BTSO)96
(65 firms),
“Performance sequential member list of motor vehicles and supply industry exporters
association” in Bursa Uludağ Exporter Unions’ (UIB) (period of January-December
2009)97
(2489 firms),
Lists of the member firms located in Nilüfer Organized Industrial Zone (NOSAB)
(290 firms) and Demirtaş Organized Industrial Zone (DOSAB) (383 firms) in Bursa,
List of the member firms located in Gebze Organized Industrial Zone (GOSB) (127
firms) in Kocaeli.
More than 3000 firms in these lists were separately scanned by author via various media
such as corporate web pages and telephones of the firms for their compliance to the survey98
.
The automotive suppliers were evaluated based on the various factors such as not being a
member of TAYSAD, being medium or large-scale, having high institutionalization level,
falling in the automotive industry for main operation field, being export-oriented, being
direct supplier, having foreign partner or being foreign firm, sustaining the operation within
this scope. At the end of these evaluations, a total of 71 firms were added to the sample as 28
firms from the list of BTSO, 43 firms from the other lists (see Table 4.2). The total number
of firms in the sample is 298 after adding these firms (227+71=298).
The number and distribution of the firms in the sample are shown in Table 4.2 and Figure
4.10 in detail. Accordingly, 76% of the firms in the sample are composed of TAYSAD
members and remainder 24% are composed of members of other five unions. Furthermore,
80% of the firms are incorporated company (Co. Inc.) and 20% are limited liability
companies (LLC). When the distribution of the firms according to the provinces is analyzed,
32% of them are located in Kocaeli, 31% are located in Istanbul, 28% are located in Bursa
and 9% are located in Izmir (Figure 4.10).
96
In this report there are 14 different sectors; automotive sector is in the 1st row with 65 firms. The turnover of
these 65 firms is TL 15.8B and export value is US$ 7.6B. However, these firms include two AMMs, TOFAŞ and
Oyak-Renault, the turnover and export value of these TL 10B and US$ 5.8B, respectively. 97
In this list, there are 2489 members from 42 different provinces in Turkey. This list also includes TAYSAD
members, AMMs and firms from various industrial zones. 98
Firstly, the web pages of the firms were checked and up-to-date information such as organization structure,
sales, productions, references, quality certificates, customers were used. When the required information was not
available or when deemed necessary, firms were called and information was obtained.

148
Table 4.2: Distribution of Sample by Union, Province and Corporation Type
Source: Author calculations based on survey results
*Incorporated Company, **Limited Liability Company (LLC)
Figure 4.10: Distribution of Sample by Provinces
Source: Author calculations based on survey results
The author was continuously in touch with the firms and pollsters applying the questionnaire
survey and closely monitored the survey during the application phase. Many of the top-
executives who were contacted within the scope of the questionnaire survey requested to
directly meet with the author and obtain information regarding the research. Notification
explaining that “author may always be contacted during each phase of the research regarding
all problems and questions of the firms” played an important role in this situation. Thereby,
author had the chance to interview with top-executives who were the respondents of the
questionnaire by phone and acquired qualified information which could not be obtained with
the questionnaire regarding the survey within the scope.
Co. Inc.* Ltd. Co.**
Kocaeli 69 20 89 29.87
Istanbul 61 18 79 26.51
Anatolia 33 12 45 15.10
Europe 28 6 34 11.41
Bursa 34 3 37 12.42
Izmir 19 3 22 7.38
Total 183 44 227 76.17
Bursa 14 5 19 6.38
Istanbul 9 5 14 4.70
Anatolia 5 3 8 2.68
Europe 4 2 6 2.01
Izmir 3 2 5 1.68
Kocaeli 5 - 5 1.68
Total 31 12 43 14.43
General Total 238 60 298 100
Share in
Total (%)
9.40
Union
28
Corporation Type
TAYSAD
BTSO
UIB
NOSAB
DOSAB
GOSB
Bursa 24 4
Province Total

149
Since the questionnaire form consisted of more than one section (quantitative data such as
turnover, number of employees, export etc., qualitative data such as technology transfers,
market structure, technology capabilities, cooperation activities, R&D and innovation
activities etc.), some firms stated that it was more convenient to interview also with
authorities responsible for that relevant section in order to answer these sections. Therefore,
more than one executive manager in charge of the different departments of some firms was
interviewed face-to-face to give answers to those sections. The titles of the interviewees of
the surveyed firms are general director, production manager, factory manager, R&D
manager, sales or marketing manager, deputy managers, product development manager and
firm owner. Interviews for answering the questionnaire lasted between 60 and 90 minutes on
average.
It wasn’t an easy process to access the firms and arrange the interviews during the survey.
Firms were called many times in order to arrange the appointments, the set appointment
dates were postponed to a later date due to the unavailability of those to be interviewed.
Although it was assured by us that all kinds of information regarding the firms and
respondents would be kept confidential, some firms were considerably hesitated about the
issue. Although some top-executives stated that they were willing to participate in the
survey, they had to obtain permission from the senior management due to the confidential
information included in the survey regarding the firms. Some firms also requested additional
time in order to decide whether to participate in the survey or not due to the firm policy and
confidential information. Despite all these difficulties, attention attached by the top-
executives played an important role in the success of the survey. All top-executives who
participated and did not participate in the survey cited that they were closely interested in the
study and regarded it as an original and important research about the sector. Some firms
explained that they were closely interested in the results of the study and they wanted to
participate in the survey in order to obtain these results.
4.6.1.6. Survey Results
At the end of seven-month fieldwork, 298 sample firms were contacted and face-to-face
questionnaires were made successfully with the top-executives of 166 firms in total, and
55.70% response rate was obtained (Table 4.3). Response rate of the questionnaire is
significantly high when compared to the studies carried out in national and international
level on the industry considering the both available and above-mentioned difficulties

150
regarding the questionnaire surveys. Moreover, when it is considered that questionnaire form
includes questions with detailed, comprehensive and confidential information on the firms, it
might be claimed that the study was carried out with a notable success. Professional methods
followed in the application phase of the questionnaire survey, attention paid to the survey by
the top-executives of the firms, individual contacts of academicians who were closely
interested in the sector, face-to-face interview method, supports of TUBITAK and two
important representatives of the sector, OSD and TAYSAD, played important role in the
success of the survey.
Table 4.3: Distribution of Survey Results by Union and Province
Source: Author calculations based on survey results
*Incorporated Company, **Limited Liability Company (LLC)
Table 4.3 shows distribution of response rate regarding the survey results according to union
and province, while Table 4.4 shows the rate according to province. Accordingly, 82% of the
166 surveyed firms are members of TAYSAD, 18% are the members of other unions. When
the corporation types of the surveyed firms were analyzed, 15% were Ltd. Co., 85% were
Co. Inc. Participation rate of the firms which fall into the classification of Co. Inc. (59%)
was higher than the firms that were regarded as Ltd. Co. (42%). When the response rate is
analyzed on the basis of provinces, the highest rate belongs to Izmir (74%), respectively
Bursa (68%), Kocaeli (49%) and Istanbul (46%) followed it (Table 4.4). In addition, Figure
4.11 presents the distribution of surveyed firms according to provinces. Accordingly, 34% of
the firms are located in Bursa, 28% in Kocaeli, 26% in Istanbul and 12% in Izmir.
Co. Inc.* Ltd. Co.**
Izmır 18 2 20 22 90.91
Bursa 24 3 27 37 72.97
Istanbul 36 7 43 79 54.43
Anatolia 22 5 27 45 60
Europe 14 2 16 34 47.06
Kocaeli 35 11 46 89 51.69
Total 113 23 136 227 59.91
Bursa 12 0 12 19 63.16
Istanbul 0 0 0 14 0
Anatolia 0 0 0 8 0
Europe 0 0 0 6 0
Izmir 0 0 0 5 0
Kocaeli 0 0 0 5 0
Total 12 0 12 43 27.91
General Total 141 25 166 298 55.70
UIB
NOSAB
DOSAB
GOSB
Bursa
TAYSAD
TotalCorporation Type
Realized Sample
Union ProvinceTotal
Sample
Response
Rate
(%)
28 64.29BTSO 16 2 18

151
Table 4.4: Distribution of Survey Results by Provinces and Unions
Source: Author calculations based on survey results
*The realized sample (166) consists of TAYSAD members except 30 firms in BURSA
Figure 4.11: Distribution of Survey Results by Provinces
Source: Author calculations based on survey results
4.6.1.7. The Main Reasons for Unrealized Sample
Tables 4.5 shows the distribution of the reasons for unrealized sample of 132 firms (44%)
who were contacted but could not be applied the questionnaire under three categories (non-
quota, reject and cancel) according to union and province. Accordingly, 22 (7%) firms were
excluded by us under non-quota category due to the fact that they did not meet the specified
criteria (see section 4.6.1.2) in the application phase of the survey. Other 25 (8%) firms
which fall into reject category stated that they could not participate in the survey due to the
reasons summarized below in Table 4.6. Cancel category indicates 85 firms (29%) which
stated that they would participate in the survey and continuously contacted during the survey
process however could not finalize the questionnaire survey due to the reasons summarized
below in Table 4.6.
TAYSAD BTSOUIB, NOSAB
DOSAB, GOSB
Total
Sample
Realized
Sample
Response
Rate (%)
Izmir 22 - 5 27 20 74.07
Bursa 37 28 19 84 57 67.86
Kocaeli 89 - 5 94 46 48.94
Istanbul 79 - 14 93 43 46.24
Anatolia 45 - 8 53 27 50.94
Europe 34 - 6 40 16 40.00
Total 227 28 43 298 166 55.70
Province
Union

152
Table 4.5: Distribution of Unrealized Sample by Union and Province
Source: Author calculations based on survey results
The main reasons for unrealized sample identified during the survey process can be
summarized as follows in Table 4.6:
Table 4.6: The Reasons for Unrealized Sample
Non-
Quota
(7%)
Main operation field of the firm is not automotive sector.
Firm is closed down and/or ceased its activities, it has only office.
Firm sells only raw material.
It provides after-sales service, quality control, etc. but do not make production.
Reject
(8%)
Firms state that they do not want to participate in the survey directly or due to
company policy.
Firms do not participate in the study indicating that they have a tight schedule.
Firms deem it inconvenient to share the information regarding the firms due to foreign
linkages and competition.
Firms deem it inconvenient to participate since the survey includes confidential
information regard to firm.
Cancel
(29%)
Foreign firms state that they should initially consult to the main firm located abroad
and this process is significantly time-consuming.
Firms with foreign partners want to consult their partners and this process is
significantly time-consuming.
Firms state that the permission of the administrative board must be taken firstly in
order to provide the confidential information regarding the firm and this process is
significantly time-consuming.
Although contacted top-executives are interested in the survey, they have to obtain the
permission of the board of directors and this process is significantly time-consuming.
While some top-executives are interested in the survey previously, lack of interest in
them in the later stages.
Failing to arrange a proper appointment date since the people to be interviewed are
continuously engaged in meetings, they are abroad or they are out of the city during
the survey process and/or continuous postponement of the appointments by firms.
Union Province Non-quota Reject Cancel TotalShare in
Total (%)
Kocaeli 7 12 24 43 32.58
Istanbul 11 6 19 36 27.27
Anatolia 4 3 11 18 13.64
Europe 7 3 8 18 13.64
Bursa 0 5 5 10 7.58
Izmir 0 0 2 2 1.52
Total 18 23 50 91 68.94
Istanbul 0 0 14 14 10.61
Anatolia 0 0 8 8 6.06
Europe 0 0 6 6 4.55
Bursa 0 1 6 7 5.30
Izmır 1 0 4 5 3.79
Kocaeli 0 0 5 5 3.79
Total 1 1 29 31 23.48
General Total 22 25 85 132 100
7.58
UIB
NOSAB
DOSAB
GOSB
10
TAYSAD
BTSO 3 6Bursa 1

153
Accordingly, the ratios of the firms falling in categories of cancel, reject and non-quota were
respectively 64%, 19% and 17% within the unrealized sample (132). The rate of the firms
who accepted to participate in the survey but could not be applied the questionnaire due to
above-mentioned reasons under cancel category is 29% (85 firms) among the total sample
(298). The high rate regarding the cancel category may be interpreted as a positive indicator
for quality and success of the survey as well as showing that firms (top-executives) who
wanted to participate in the survey but could not be applied the questionnaire due to above-
mentioned reasons notably supported and they were interested in the study.
4.6.1.8. Data Input and Missing Values
In September 2010, data collected at the end of the questionnaire survey were organized and
clarified, and then recoded and transformed in order to make them compatible for the use in
statistical software (STATA) and analyses, and transferred into the electronic environment.
Data were also re-checked and examined in order to detect whether there was an error in data
and data input. Then, 166 cases of which data input was carried out were analyzed case by
case and evaluated in terms of missing values. It was detected that the one of the cases
includes very much missing data in KTTs questions for the analyses to be carried out in
further phases and it was decided to exclude the case from the scope of the analysis99
. It was
detected that there were a few missing values in the items or questions regarding the other
analyzed cases but they did not have any potential to pose a problem for the further analyses
to be performed. It was not preferred that a new data was calculated instead of the missing
values in cases and it was deemed proper to leave it in the same way. Consequently, analysis
sections of the survey were conducted based on 165 cases (firms).
After data input and analysis procedures, it was detected that 132 (80%) of the 165 surveyed
firms were direct suppliers of one or more than one AMMs operating in automotive industry
of Turkey and furthermore, there was foreign capital in 45 firms (27%) with a minimum rate
of 10% (see section 5.1.1). When the previously-mentioned objectives and difficulties of the
study are assessed together, these rates may be also accepted to be notably successful.
99
The said firm (case) refused to respond the questions regarding the KTTs.

154
4.6.1.9. Representativeness
Automotive industry is divided into three sub-sectors as 341 (manufacture of motor
vehicles), 342 (manufacture of bodies (coachwork) for motor vehicles; manufacture of
trailers and semitrailers) and 343 (manufacture of parts and accessories for motor vehicles
and their engines) according to NACE (Rev. 1.1) classification. NACE 341 covers AMMs
and generally represents automotive main industry. On the other hand, NACE 342 and
NACE 343 represent automotive supply industry. In line with the aim and scope of the study
that mentioned before, we specifically focused on the relatively most developed suppliers in
the automotive supplier industry (NACE 342 and NACE 343 sectors) by using our sample
frame (see section 4.6.1.2). Therefore, as a result of the judgement sample method used,
surveyed firms consist of generally medium and large-sized firms, first-tier supplier firms,
firms export by competing in the international market, have high level of technology, possess
various quality certificates, perform R&D and innovation activities, have a high level of
efficiency, have high level of cooperation with MNCs, manufacture OEM parts directly to
the automotive main industry and pioneer the sector (see Table 4.7 and section 5.1).
Table 4.7: Basic Indicators for Surveyed Firms and Automotive Supply Industry
Source: Statistics were calculated by author from survey results and TurkStat’s Annual Industry and
Service Statistics Survey database (ISSS database) in 2008 for †NACE 342 (manufacture of bodies
(coachwork) for motor vehicles; manufacture of trailers and semitrailers) and ¥NACE 343
(manufacture of parts and accessories for motor vehicles and their engines) (Rev. 1.1). Data for the
2009 and 2010 years were not yet published by TurkStat.
Notes: The number of the observations are 161 for employment (a), and 143 for turnover (b) due to
missing values in surveyed sample (see Appendix J for details)
In Table 4.7 surveyed firms were compared with the NACE 342 and NACE 343 sectors,
which are target population, according to some indicators. When the number of surveyed
firms is compared with the target population, it represents 13% of the firms included in
NACE 342 sector (column V), 7% of the firms included in NACE 343 sector (column VI)
and 4.4% of the automotive supply industry when taking the two sectors (NACE 342&343)
together (column VII). On the other hand, when the number of main sample is considered
(298 firms), the rates approximately double the amount and equal to 8% of the automotive
I II III IV V VI VII
Indicators
Surveyed Firms
(2008)
NACE 342†
(2008)
NACE 343¥
(2008)(II+III) I/II I/III I/IV
Number of Firms 165 1225 2525 3750 0.13 0.07 0.04
Total Employment 47366a 10839 75556 86395 4.37 0.63 0.55
Total Turnover (TL) 8,871,695,911b 1,605,652,768 11,929,854,438 13,535,507,206 5.53 0.74 0.66

155
supply industry. On the other hand, if we take into account total employment and total
turnover of the supply industry, the representation rate of my sample is much higher, and
successfully represents 55% of the total employment (column VII), and 66% of the turnover
(column VII) of the automotive supply industry, respectively.
It must be pointed out here that focusing on such a limited number of firms (298 firms) does
not affect negatively the quality of our study. On the contrary, it can be claimed that the
survey has a successful rate having a high representation percentage regarding the sample
formed in line with the previously-mentioned objectives of the study due to many reasons
summarized as follows:
Small-sized enterprises (less than 50 employees) were significantly widespread in
automotive supply industry of Turkey (see section 4.6.1.2). According to the 2008
statistics of TurkStat, the ratio of the small-sized enterprises in automotive supply
industry is approximately 90%100
. The statistics in Table 4.7 that firms operating in
NACE 342 and NACE 343 sectors employ respectively 9 and 30 people on average
confirm also this hypothesis. On the other side, 91% of the surveyed firms within the
scope of the questionnaire are at least medium (50-250 employees) and large-sized
firms (250 and more employees) and employ 294 people on average, 13 times bigger
than that of the sector (see section 5.1 for details on surveyed sample).
More than 90% of the firms included in automotive supply industry have the
characteristics specified in section 4.6.1.2 and they are not convenient for the analyses
to be carried out within the scope of the study due to the reasons specified also in the
same section.
We can say that all the members of TAYSAD were surveyed. 82% of the 166
surveyed firms are the members of TAYSAD. As indicated previously (section
4.6.1.2), members of TAYSAD represent 65% of the automotive supply industry
output and 70% of the export. To that end, 227 firms which are members of TAYSAD
and operate in four provinces were contacted and questionnaire survey was carried out
successfully with 136 of them, representation of the TAYSAD members with 60% in
the survey was realized. Moreover, it was communicated with the other 32 members
of the TAYSAD located in other fourteen provinces; however it was identified that
these firms did not already have the desired characteristics within the scope of the
study.
100
Author calculations based on annual ISSS database, 2008, TurkStat.

156
According to TAYSAD statistics, foreign capital was available in 58 of the TAYSAD
members in varying rates; the rate of the foreign firms in total members of TAYSAD
(259) is 22%. On the other hand, there are 45 foreign firms among the surveyed firms
included within the scope of our questionnaire; their rate in total surveyed firms is
27%.
As mentioned before, there is not reliable statistical information and resources on
firms which operate in the automotive industry regarding the number of the large-
sized firms, direct supplier firms, developed firms, firms produced OEM parts to
AMMs and firms that manufacture on international level. However according to the
various reports, studies regarding the sector and information acquired from OSD and
TAYSAD, it is predicted that number of supplier firms which have international
manufacturing standards in automotive supply industry of Turkey, manufacture OEM
parts directly to the AMMs and export by competing in the international market is
about 300-350 (TUBITAK, report for 2023 vision; SPO, 2007; and MITI, 2010). As
will be described in a more expanded way in Chapter 7, it was also detected by author
that the number of the suppliers (average 338, see section 7.5.2 and Table 7.1) having
the above-mentioned qualifications was approximately equal to the figure provided
above as a consequence of the interviews carried out with the AMMs. Majority of the
other firms has small-sized production facilities and they generally produce for
replacement market and have the characteristics specified in section 4.6.1.2.
We also think that non-response bias is minimal because of above mentioned reasons.
Moreover, we surveyed the firms located at the Marmara Region which is the main
land of the Turkish automotive industry.
In summary, while the surveyed firms represent relatively a small percentage (between min
4.4% and max 13%) of the Turkish automotive supply industry (NACE342 and NACE343)
in terms of total number of the firms, the representation rate of the surveyed sample is much
higher in terms of total employment and turnover of the sector, and it successfully represents
more than half of the target population considering aim and scope of the study along with the
reasons specified above.

157
4.6.1.10. Validity and Reliability Tests
In this section, the validity and reliability of the scales used in the survey to measure the
various concepts are examined.
In this study, we take into account two types of the validity: content and construct validity. It
is considered that our questionnaire has content validity because, as mentioned in detail
before, survey was constructed based on in-depth review of the literature, advices and
reviews of the experts and academicians, characteristics of Turkish automotive industry, and
pilot testing (see Yin, 1989). The construct validity101
of the scales will also be tested by
using Factor Analysis (or principle component analysis) as described in Chapter 6 in detail
(see Hair et al., 2006).
The reliability of the scales in the questionnaire is assessed by using internal consistency
measured with Cronbach’s alpha (α). Internal consistency estimates whether several items
that constructed to measure the same concept generate similar scores. In other words, it is an
indicator of how well the various items measuring the same issue (Giroud, 2003). It is
generally measured by Cronbach’s alpha which is a coefficient of reliability and ranges from
zero to one; higher alpha values indicate higher reliability (Cronbach, 1951; George and
Mallary, 2003). As a rule of thumb, alpha coefficient of a scale above 0.70 is seen sufficient
by researchers, although 0.8 is more preferable (Nunnally, 1978; Nunnally and Bernstein,
1994; Devellis, 2003). Coefficients could be sensitive to the number of items in the scale and
it is common to find low values for short scales (Pallant, 2007: 95). In this case Briggs and
Cheek (1986) recommend that it would be better to use the mean inter-item correlation
statistics since it is not affected by the number of items that make up the scale. According to
them, optimal mean inter-item correlations should be between 0.2 and 0.4.
The Cronbach alpha coefficients of the scales tested together with contents of the scales are
presented in the questionnaire form in Appendix I. In addition to alpha coefficients, the mean
inter-item correlations with both min and max statistics for the items were also calculated
for the scales with fewer than 10 items and presented only in Appendix I.
A summary of the Cronbach’s alpha and mean inter-item correlations of the fifteen scales
used in both Chapter 5 for descriptive analyses and Chapter 6 as a dependent variable for
econometric analyses are shown in Table 4.8. The results indicate that most of the alpha
101
It refers to whether a scale measures the theoretical construct for which the scale is designed (Sekaran, 2003).

158
coefficients are generally high or have a mean inter-item correlation of between 0.2 and 0.4.
Coefficients are ranging from 0.712 to 0.951 indicating satisfactory internal consistency. On
the other hand, the mean inter-item correlations for the short scales are ranging from 0.234
to 0.627. Although Cronbach’s alpha coefficients achieved the acceptable scores above 0.7,
mean inter-item correlations for the three scales are beyond the optimal range 0.4. According
to Briggs and Cheek (1986) this situation indicates that these three scales may be redundant,
however it is decided to retain these scales.
Table 4.8: Internal Reliability of the Scales
Source: Author calculations based on survey results
† The scales 5 and 15 did not yield significant results as a dependent variable and therefore they
weren’t analyzed in Chapter 6.
Mean Inter-Item
Correlation
(if # of items < 10)
6.5.1.1 1- KTTs related to Production Process 0.853
6.5.1.2 2- KTTs related to Product 0.785 0.422
6.5.1.4 3- Financial Transfers 0.712 0.389
6.5.1.34- Training Activities provided by
customers
0.835 0.627
† 5- Training Modes 0.721 0.234
6.5.2 6- Technology Capabilities related to
Design, R&D and Production
0.751
6.4.4 7- Technology Agreements 0.726
6.4.5 8- The Sources of Technologies acquired
and/or used
0.779
6.4.6.1 9- Partners in Cooperation for
the Co-Design Activities related to
Products
0.730
6.5.3 10- Inter-Firm Cooperation Activities 0.925 0.58
6.5.4 11- Improvements in Production
Capability
0.929
6.5.5 12- Benefits of being a Direct Supplier 0.951
86.5.6 13- Cooperation Level with Partners in
Innovation Activities
0.718 0.336
6.5.7 14- Performance Increases related to
Production Capability
0.745 0.379
†15- Factors Affecting Production and/or
developing New Technologies
0.7959
Section in the
Q uestionnaire
Form
ScalesCronbach's
Alpha (α)
2
3
5
7
Analyzed as
a Dependent
Variable in
Section

159
4.6.1.11. Critique of the Questionnaire Survey Method
It is necessary to specify and consider the following disadvantages regarding the
questionnaire surveys, whether included in the literature or not, for the criticism of the
present survey:
One of the most important points is the reliability of the data collected through
questionnaire. Questionnaire surveys are based on the personal evaluations of the
respondents. Therefore, there is always the possibility of the information to be
manipulated intentionally or unintentionally.
Since the questionnaires are responded generally by a person, data may be dependent
on the professional position in the firm, personal opinions and evaluations of that
person.
Despite the fact that confidentiality of the data is guaranteed, firms may provide
misleading information due to competition and rival firms or respondents may have a
tendency to give excessively positive responses regarding their firms.
In spite of the fact that questionnaire is tested and designed carefully, it may not be
comprehended similarly due to the backgrounds (reasons such as educational and
cultural levels, department they are in charge, professional background, experience
etc.) of the respondents or the forms may be regarded to be very scientific.
It may be possible that various questions or items are not described clearly or
described deficiently in the questionnaire. There may be items which are not added to
the categories of the questions but regarded necessary by the industry.
It is possible that respondents wanted to complete the questionnaire as soon as
possible or responded quickly without thinking about the questions due to time
limitations.
The concerns that we tried to summarize above constitute the leading criticism for such kind
of surveys including the questionnaire surveys made by the public authority. As the
questionnaire application process was tried to be explained in detail as of the beginning of
this section, it is anticipated that such kind of criticisms and problems in the present survey
will be negligible. Following issues might be among the most important reasons for this
situation:
Questionnaires were carried out by means of face-to-face in-depth interviews in order
to eliminate misunderstandings regarding the questions, ensure that accurate people
answer the questions and collect reliable information.

160
Questionnaire form was designed by receiving the opinions of the experts of the sector
and academicians studied on sector following a time-consuming and detailed literature
research and tested by carrying out pilot study.
Respondents are composed of top-executives of the firms, they are highly-trained and
educated since they both work in the firm for a long time and therefore they are
experienced and they are closely acquainted with the industry. The importance of the
accuracy and reliability of information and data regarding the success of the survey, to
be provided by them is known by the respondents but this situation was also reminded
to them during the individual interviews. Attention paid by these people for the study
was already on a high level and the attention became the main criterion in the success
of the study. Due to these reasons, it is claimed that information is notably reliable and
they were obtained from first-hand.
It was specified and guaranteed that all kind of data and information provided for the
survey would be kept confidential.
“Other” options were added due to the possibility that there may be items which were
not identified and added by us within the scope of the questions in the questionnaire
forms.
4.6.2. Qualitative Data: Face-to Face Interviews with AMMs
In addition to the questionnaire based quantitative data, the author conducted semi-structured
interviews with nineteen top level executives of the eleven AMMs in Turkey between March
and August 2010. The qualitative data based on these interviews is also used in a
complementary way with quantitative data based on survey. In this section, we describe the
semi-structured in-depth interview process conducted, manufacturers to be interviewed,
interview process, results and representativeness of the interviewed sample.
4.6.2.1. Semi-structured Interview Method
The second phase of the study for collecting data and information was composed of semi-
structured face-to-face interviews with the top-executives of AMMs operating in Turkey
within the previously-mentioned scope of study. This method is qualitative research method
carried out by means of face-to-face interviews with the participants. The method plays an

161
important and complementary role in order to analyze the issues thoroughly, reveal
embedded information, and cover the deficiencies to emerge in the questionnaire survey,
acquire the in-depth data and information which could not be obtained via questionnaires.
Furthermore, it is possible to discuss each question thoroughly with the participants with this
method102
. Considering these qualifications, it was suggested that semi-structured interview
method with top-executives of AMMs would contribute significantly to the research and
therefore it was preferred.
It was also planned that interviews in addition to the questionnaire survey would be made
with the supplier firms within the scope of the research. A box was added at the end of the
questionnaire form for this purpose, it was explained to the respondents that if they wished to
share their opinions and recommendations regarding the study with the author on a proper
date via an additional interview, they could put a tick in this box. At the end of the
questionnaire survey, it was detected that 50 firms (30%) accepted additional interview.
However, the application of additional and comprehensive supply industry interview was
abandoned since the questionnaire survey was already time-consuming and due to the time
and budget limitations. A positive factor playing a role here is that data collected in the
questionnaire survey was comprehensive and obtained successfully.
In the interviews with top level executives of the AMMs, pre-designed open-ended and
semi-structered manuel was used (see Appendix K). The main reasons for using semi-
structured manual regarding in such kind of surveys for the researcher may be summarized
as follows:
Giving an opportunity for those interviewed to freely express their opinions regarding
the sector or firms,
Gathering information about the issues that the researcher is unfamiliar with and that
can’t be anticipated previously but arise during the interview,
Possibility to make comparisons between the firms on a common basis by using a
common manual,
Ensuring that the persons to be interviewed are pre-informed about the questions.
102
See Carson et al. (2001); Wengraf (2001); Drever (2003); Rubin and Rubin (2004); Seidman (2006); Kvale
and Brinkmann (2008); Marshall and Rossman (2010); King and Horrocks (2010) for details on qualitative
survey methods.
162
Furthermore, top-executives of the firms requested the sending of the manual to them in
order to be previously-informed about the interview questions and assess the compatibility of
the questions with the company policy and confidentiality and to get prepared for the
questions before the interview.
Headings and questions of the manual which was used in the interviews were determined
within the framework of the research objectives specified in section 4.4 (see Appendix K for
the semi-structured interview guide). Manual is composed of 28 questions under five main
sections.
First section includes the general questions in terms of AMMs,
The second section questions the technological activities of the AMMs, the critical
technologies used in manufacturing and the technology resources,
The third section is composed of questions intended for understanding the strategic
cooperation of the AMMs with the other firms in terms of R&D and innovation, and
the KTTs provided to AMMs by their parent companies or partners.
Fourth section is composed of questions investigating the relations of the AMMs with
the supplier firms, the number of their suppliers, criteria sought for the direct
suppliers, cooperation activities performed with the suppliers, KTTs to the suppliers.
In the last section, opinions and recommendations regarding the effects of public
policies, the technological capabilities and competition levels of the suppliers and
enhancing KTTs from MNCs as well as predictions and strategies of the AMMs in
terms of industry are included.
The manual used was prepared and tested following the examination and revision of the
academicians and experts who make studies on the sector, as is the case in the design process
of the questionnaire form (see section 4.6.1.1). While the questions used in the manual
specify the general framework, comprehensive opinions and recommendations of the
participants about the issues to which they want to contribute were acquired in the
interviews.

163
4.6.2.2. Administration of Interview Process
It was aimed to make individual interviews with all the AMMs operating in Turkey. As
stated before, there are fifteen AMMs operating in Turkish automotive industry and these are
also the members of OSD (SPO, 2007) (see Appendix J for the entire list of contacted
AMMs).
The in-depth interviews with the AMMs were arranged and conducted by the author in a
time period of approximately 6 months between March and August 2010. Support of two
most important organizations as OSD and TAYSAD and contributions of TUBITAK as well
as individual contacts of people working in universities and various state institutions (SPO,
KOSGEB, TUBITAK, TTGV etc.) played important roles in accessing top-executives of the
AMMs and having a successful interview with them.
Top-executives of the fifteen AMMs were contacted separately in order to make face-to-face
interview for the survey in March 2010 within the scope of the second phase of the study.
Following steps were followed briefly in this phase:
(i) Relevant departments (general directorate, human resources and relations etc.) of the
AMMs were called by phone, authorities were kept in touch and preliminary
information regarding the study was provided for them.
(ii) Cover letter summarizing the objective, scope and method of the study and including
appointment request, OSD, TAYSAD support letters and interview guide were sent to
the e-mail addresses of the individuals contacted in the first phase (see Appendices D,
E, F and K).
(iii) Some of the AMMs called us back and obtained additional information and/or
scheduled an appointment depending on the methods preferred by the firms. Some of
the AMMs were called again by us in order to make reminding about the study on the
specified date, and an appointment was requested. It was not easy to access top-
executives of the AMMs, it was required to contact with and inform many people
repeatedly.
Responses obtained from the contacted firms may be summarized as follows:
They will convey the issue to the authorities and respond as soon as possible,
They will primarily assess the issue in the board of directors and respond then,
It will be determined who would be interviewed for the research, then they will
respond,

164
Due to private and confidential information included in the study, the
compatibility with the company policy and confidentiality will be assessed by
the authorities, then they will respond,
It is necessary to consult and acquire the approval of the parent company
located abroad and then they will respond,
Since it is a public corporation, it is necessary that the issue is primarily
analyzed by the authorities.
(iv) Names, positions and contact information of the top-executives to be interviewed were
obtained from the AMMs which accepted to participate in the study.
(v) These people were contacted, brief information in this respect was given and an
appointment was requested for face-to-face interview on a further proper date.
(vi) Top-executives of the eleven AMMs which accepted to participate in the study were
visited by the author on the appointment dates and face-to-face interviews regarding
the study were conducted.
4.6.2.3. Results of Interview Process
Eleven AMMs were interviewed by the author between March and August 2010 in six
different provinces (Ankara, Bursa, Istanbul, Izmir, Kocaeli and Sakarya). These interviews
were conducted with total 19 top level executives of AMMs. The titles of the respondents are
R&D directorate, R&D manager, R&D and technical coordination manager, product
development manager, purchasing program and systems manager, purchasing manager,
production manager, production engineering manager, development manager, supplier
development manager, logistics manager and organizational development manager. Six
interviews were conducted with only one respondent, while the rest ones were conducted
with at least two respondents. The interviewed AMMs are shown in the following Table 4.9.
Table 4.9: The list of the Interviewed AMMs
1- ANADOLU ISUZU 7- OYAK RENAULT
2- B.M.C 8- TEMSA GLOBAL
3- FORD OTOSAN 9- TOFAŞ
4- M.A.N TÜRKİYE 10- TOYOTA
5- MERCEDES-BENZ TÜRK 11- TÜRK TRAKTÖR
6- OTOKAR

165
Other four AMMs contacted did not accept to participate in the study due to following
reasons103
:
The company policy,
Parent foreign company does not permit participating in such researches,
It’s not regarded as convenient to participate since the study includes confidential
information,
Lack of interests in the study.
Interviews were carried out in various meeting halls of administrative departments located in
the main plants of the AMMs. It was observed that the possibility of accessing the plants
from outside was quite limited. It was possible to access the departments in company with
authorized people following the comprehensive security checks in each plant. It was figured
out according to the information obtained from the authorities later that only limited number
of previously-assigned authorized individuals might enter and exit these departments via
identity checks, and the entry and exit of the communication media such as mobile phones
and laptops (even they belong to those authorized people) were not permitted due to any kind
of industrial espionage. Furthermore, it was explained that communication devices used
therein were equipped with special hardware and under permanent control in order to prevent
information leakage. It was determined that only few people from outside, like the author,
were allowed to enter these units where interviews were held, and it was stated during the
interview conducted in R&D department of one of the AMMs that the first person to enter
the department from outside was the author.
Interviews were carried out over open-ended and semi-structured guide that was sent in order
to inform the relevant individuals about the research previously. Interviews were conducted
in a mutual conversation environment with questions and answers and took between 60 and
120 minutes for each person interviewed. While the interviews were carried out over a guide,
some other issues were also mentioned and the issues important in terms of the industry were
also discussed depending on the respondents. Thus, more detailed information regarding the
specific issues about the industry which couldn’t be identified in the literature surveys and
similar written resources was obtained and buyer-supplier relations were comprehended in a
better way.
103
Two of the AMMs not accepted to participate the survey are manufacturing personal car, pick up and minibus
with 100% and 70% FS respectively, while other two ones are manufacturing truck, pick up, minibus, midibus,
bus and farm tractor with no FS.

166
In addition to taking notes, the use of tape recorder was preferred during the interviews
depending on the approval of the respondent. The main reason for using tape recorder is that
it allows the researcher to participate in the interviews actively and provides the possibility
of studying more freely and comfortably. Furthermore, it prevents the researcher from
missing the important points by focusing on taking notes, and ensures the easy analysis of
issues which are not observed during the interview but attached importance later on. The
above-mentioned reasons for using the tape recorder were explained to the respondents, and
it was added that tape recorder would not be used if it became inconvenient due to reasons
like confidentiality and/or if the people thought they couldn’t express their ideas freely. It
was also guaranteed that if the tape recorder was used, the records would be kept
confidential and certainly would not be shared with the third parties in a way to reveal the
identity of respondents and names of the firms. Only three of the respondent firms rejected
the use of the tape recorder. In other interviews in which tape recorder was used, respondents
stated that they were accustomed to it and wouldn’t be disturbed.
Conversations made after the interviews were examined and analyzed by the author in order
to prevent information loss. Conversations were analyzed case by case in detail under titles
considered to be important in order to make a common comparison between the AMMs.
However, responses were categorized and presented in Chapter 7 as a whole in order to keep
the information regarding the firms confidential.
4.6.2.4. Representativeness and Reliability of the Sample
According to Table 4.10, the AMMs interviewed represent 73% of the total population.
Moreover, as can be observed from the Table, the shares of the firms regarding total capital,
capacity, production and sales in the sector are respectively 80%, 83%, 89% and 91%. It
indicates that the representation rates of the interviewed AMMs are much higher. When
assessed in terms of foreign capital, eight (80%) of the ten AMMs with foreign capital
(FS>29%) and three (60%) of the five AMMs with local capital could be interviewed.
Moreover, as it can be seen from Figure 4.12, the shares of the interviewed AMMs in total
sales and production in 2010 by different foreign ownership status are also very high. The
AMMs with minority foreign ownership are represented fully, and ones with majority
foreign ownership and with full ownership are represented by 85% in total sales and 81% in
total production. The AMMs with no foreign capital are also represented by 72% in total

167
sales and 25% in total production as well. When previously-mentioned difficulties of the
study are considered, these rates may be accepted as notably successful.
Table 4.10: Share of Interviewed AMMs in Sector Level Variables (%)
Source: Author calculations based on OSD statistics and interview results, see Appendix J
Respondents are composed of highly-educated and experienced top-level executives who
have been on duty in various positions for years in the AMMs and have detailed information
on the history of the firm and the relations with the suppliers. These people are also the
leaders in the industry who are well-informed about the automotive industry at both national
and international level and who performed cooperation with the MNCs. Moreover, attention
attached to the study by these people played an important role in the success of the study.
Therefore, it may be claimed that the collected data and information are very reliable first-
hand information.
Figure 4.12: Share of Interviewed AMMs in Total Sales and Production in 2010
by Different Foreign Shares
Source: Author calculations based on OSD statistics and interview results, see Appendix J
N %Capital
(TL)
Capacity
(2011)
Production
(2010)
Sales (TL)
(2010)
Interviewed AMMs 11 73.3 79.92 82.75 88.96 90.61
Not Interviewed AMMs 4 26.7 20.08 17.25 11.04 9.39
Total 15 100 100 100 100 100

168
4.7. Descriptions of Some Concepts and Differences for the
Firms constructed and used in the Analyses
In this section, some of the concepts related to firms constructed by author and used in the
analyses in next Chapters (5, 6 and 7) will be explained. For this aim, a basic structure of the
automotive industry and relationships among the concepts used in the analyses are
summarized in Figures 4.13 and 4.14.
Figure 4.13: The Automobile Production Circle
Source: Dicken, 2007, p.279
*Added to original table by author
Design Distribution Consumption
Rubber
Electronics
Plastic
Glass
Textiles
Flows of materials and products
Flows of information
(including customer orders)
Variation by
income, age,
tastes and
preferences
Independent
distributors
Final
assembly
Tied outlets of car
manufacturers
1st-tier suppliers
2nd-tier suppliers
3rd-tier suppliers
Components
Engines and powertrains
Manufacture of wheels, tyres, seats,
windscreens, exhaust systems etc.
Manufacture of mechanical and
electrical components (e.g.
İnstruments, steering components,
carburettors, braking systems etc.)
Forging and casting of engine and
powertrain components
Machining and assembly of engines
and powertrains
0.5-tier suppliers*
Major
Supplying
Industries
Components Manufacture
Steel and
other Metals
Bodies
Manufacture and stamping of body
panels
Body assembly and painting

169
Figure 4.14: Illustration of the Basic Structure of the Automotive Industry
and Concepts used in the Analyses
Source: Constructed by author
Notes: Lines with thicker dashes show possible intra-firm linkages between firms, while thinner ones
show possible inter-firm linkages between such firms. “Other suppliers” are those at lower tier-levels.
AMMs are classified in three categories according to ownership status: affiliate of MNC, joint-venture
with MNCs and domestic ownership. AMMs in domestic ownership category are also referred as
“independent local assemblers” although they are manufacturing under MNC license. DSF can be the
affiliates of global-mega suppliers, they have an equity partnership with such suppliers, or they can be
independent local suppliers with domestic ownership.
4.7.1. Automotive Industry, Automotive Main and Supply Industry
The terms automotive industry, automotive main and supply industry are described as
follows in the “Report of Automotive Industry Specialization Commission” prepared within
the framework of 2007-2013 9th development plan of SPO: “Motor road vehicles are
vehicles with four or more rubber wheels which are driven with one combustion or explosion
motor and manufactured in order to carry load or passenger and run on road traffic
according to a specific technical legislation. The industry manufacturing these vehicles is
called "Main Industry". “Automotive Supply Industry” is the industry branch producing
original and equivalent products, semi-finished products, module and system through
domestic or foreign manufacture, directly or indirectly to replacement market in compliance
with the technical documents specified by the main industry. The term “automotive industry”
includes all of the two sub-sectors” (SPO, 2007). Primary products manufactured by the
automotive main industry are personal car, bus, midi-bus, minibus, truck, pick-up and
tractors.
Automotive DAMM
Main or OAMM
Industry AMMs
(15 AMMs)
Automotive
Supply DS OS
Industry
Geographic Boundary
Overseas
Turkish Automotive Industry
Domestic
Global Automotive Industry
MNCs(OEM Producers)
Global-Mega Suppliers
Other Suppliers
Affiliate of MNCs (5)Joint-Venture with MNCs (5)
Domestic Ownership (5)
Other Suppliers
LF FF
DSF (1st-tier)
LF FF

170
4.7.2. The Relationships of Automotive Main and Supply Industry
In fact, automotive industry is an industry branch in which thousands of components
manufactured with various characteristics by many manufacturers are assembled and
installed. The center of the automotive manufacturing circle (see Figure 4.13) consists of
complex network of relations between main industry (main manufacturers) and component
suppliers. There are primarily three processes prior to the phase in which the final
installation is performed: manufacturing of car bodies, components, engines and powertrains
equipment. The manufacturing of these components is carried out by the main industry and
main suppliers. However, the tendency of the main industry in the last decade has been also
transferring completely the manufacturing and responsibility of these components from the
main industry to the suppliers (Dicken, 2007). In other words, main industry specifies the
outlines and standards (design, quality etc.) of these components and leaves their
manufacturing phase to the suppliers. In a global sense, the automotive industry consists of
the global AMMs (see the definition of OAMM) and many suppliers in different tiers104
.
According to the Figure 4.13, there are four tiers of suppliers, however there can be more.
The hierarchy between the main industry and suppliers may be summarized as follows.
Global mega suppliers: Global mega suppliers rank first among the suppliers. They directly
supply major system components to the main manufacturers. They have strategic and close
relationships with the main manufacturers. They follow the main manufacturers who
globally take decisions for making investments in various countries and they also invest as
main suppliers besides manufacturers in these countries. They manufacture main system
components within the framework of their own R&D, innovation, design and product
development methods in line with the advanced technologies; they supply the components to
more than one main manufacturer. While their number is very few globally, they have
transformed in main MNCs by exceeding many automotive main manufacturers in terms of
turnover and size such as Siemens, Bosch, Delphi, Voleo, Magna, Autoliv etc. The suppliers
are also called as “0.5-tier" suppliers due these characteristics they possess.
First-tier suppliers: They are the firms directly supplying major components to the main
manufacturers. Some of them have transformed into global mega suppliers in the course of
time. These firms are suppliers with significant R&D, innovation, design, design
104
In the last years, as result of global competition and crises, it has been observed that many manufacturers
began to take stakes in other automotive manufacturers. Therefore the number of the automotive manufacturers
decreased globally. In addition, many cooperation activities are observed among these manufacturers.

171
verification, product development and test competences105
. However they do not have as
close relationships with the main manufacturers as mega suppliers and their global
manufacture is more limited compared to the mega suppliers. In other words, the suppliers
cannot follow the main manufacturers investing in other countries and their global facilities
are limited.
Second-tier suppliers: They are the suppliers manufacturing components according to the
design characteristics specified by the first-tier suppliers, global mega suppliers or main
manufacturers. These firms are dependent on process engineering capabilities in order to
meet cost and flexibility criteria specified by customers. They must also enhance the
capabilities in order to exist in the market, meet required quality conditions and obtain
important quality certificates (ISO9000 and QS9000).
Third-tier suppliers: They generally manufacture simple components compared to second
and third-tier suppliers. In many cases, basic engineering capabilities are sufficient for these
firms. Investment, training, technology and skill levels of these firms are considerably low. It
may be claimed that the firms in this tier compete with each other in terms of price in the
market.
Source: Based on Humphrey and Memedovic (2003:22) and Dicken (2007)
4.7.3. Domestic and Overseas Automotive Main Manufacturers
(DAMM and OAMM)
The term “Domestic Automotive Main Manufacturers” (DAMM) for firms manufacturing
within the borders of Turkey in automotive main industry (see Appendix J), and “Overseas
Automotive Main Manufacturers” (OAMM) for firms manufacturing beyond the borders of
Turkey are used in the questionnaire form and analyses by keeping to the descriptions
provided above (Figure 4.14). The sole factor used in the classification is the manufacturing
performed in Turkey or abroad (geographical factor) independently of the capital structure
(local or foreign capital). The AMMs which were specified in detail previously, interviewed
individually within the scope of the research independent of their capital structure, and
whose results will be analyzed in Chapter 7 fall into "DAMM" category. On the other hand,
105
Due to these reasons, we put a special emphasis on the fact that supplier firms used in the survey are 0.5 and
1st-tier suppliers.

172
the global AMMs (Toyota Motor Co., General Motors Co., Volkswagen Group AG, Hyundai
Motor Group, Ford Motor Co., Daimler AG etc.) fall into “OAMM” category, and we also
call them MNCs. Also, AMMs in Turkey are classified in three categories according to
ownership status: affiliate of MNC, joint-venture with MNCs and domestic ownership.
AMMs in domestic ownership category can be also referred as “independent local
assemblers” although they are manufacturing under MNC license.
4.7.4. Domestic and Overseas Supply Industry
In the dissertation, the term “Domestic Supply Industry” is used for the supply industry firms
making production within Turkish borders in the automotive industry, and the term
“Overseas Supply Industry” is used for the supply industry firms making production beyond
Turkish borders by keeping to the definitions specified by SPO (Figure 4.14). The sole factor
used in the classification is the manufacturing performed in Turkey or abroad (geographical
factor) independently of the capital structure (local or foreign capital). The sample, which
was specified in detail previously, surveyed within the scope of the study independent of the
capital structure and of which results will be analyzed in Chapters 5 and 6 is “Domestic
Supply Industry”.
4.7.5. Domestic and Overseas Suppliers (DS and OS)
The “Domestic Suppliers” (DS) term is used for the firms operating within the borders of
Turkey and providing raw material and inputs for various sectors and similarly “Overseas
Suppliers” (OS) term is used for firms located beyond the border of Turkey in the
questionnaire form and analyses independent of capital structures (local or foreign) (Figure
4.14). While these supplier firms may conditionally operate in automotive sector, they may
also operate in another sector apart from the automotive sector, providing inputs for
automotive sector. For instance, when the surveyed firms are requested to specify the
resources of technologies acquired (see section 5.4.4) in the next Chapter regarding the
findings of the survey, by the used items of “DS” and “OS” (see section 5, question 4 in
Appendix I) the firms providing inputs-raw material to the domestic automotive supply
industry (iron-steel, petroleum chemistry, aluminum, plastic, glass etc.) and operating in
various sectors in Turkey (DS) or overseas (OS) were intended. On the other side, in case of
“DS” and “OS” items used when the information is requested regarding the main customers

173
of the suppliers surveyed (see section 1, question 4 in Appendix I), it is clear that these main
customers are domestic and overseas suppliers in automotive supply industry on a higher tier
(as the customer of the supplier being on 0.5 tier or 1st tier according to tier of the surveyed
suppliers)106
. In other words, each automotive supplier is a supplier however each supplier is
not automotive supplier.
In terms of DAMM, all domestic and overseas suppliers (including the domestic automotive
suppliers) providing inputs for them are “supplier firms”.
4.7.6. Local and Foreign Firms (LF and FF)
Descriptions of the firms according to their capital structure were also provided in the
questionnaire form and analyses. As specified previously, the firms of which foreign capital
share (FS) is 10% or more were accepted as “foreign firm” (FF) and the firms of which
foreign capital share is lower than 10% were accepted as “local firm” (LF). Firms in
surveyed sample of “Domestic Supply Industry” were defined as local (LF) and foreign
firms (FF) according to foreign capital structure.
Apart from the above-mentioned classification, domestic and overseas classification cannot
be made for the other “foreign” term in the questionnaire form. For instance the item of
“KTTs from foreign manufacturers” which will be mentioned later is present among the
factors causing increase in production capabilities of the surveyed firms (see section 5.9.2).
What is intended with the “foreign manufacturers” term used within this item is the firms
located in Turkey or overseas and whose capital is controlled by foreign people. While these
firms may operate in automotive industry, they may also operate in another industry
providing service or raw material-inputs to the automotive industry. Especially in the last ten
years, domestic supply industry has been receiving professional assistance from domestic
and overseas foreign-capital engineering, consultancy and design firms in order to participate
in various projects or enhance the capabilities. Likewise, foreign firms which do not operate
in the automotive industry but manufacture robots, machinery and equipment to be used in
production line of the automotive industry are in an intensive interaction with domestic
automotive main and supply industry. Thus, firms of domestic supply industry which are in
interaction with the foreign firms were asked whether they made KTTs from the foreign
manufacturers.
106
When it is taken into consideration that the main activity of the surveyed domestic automotive supplier firms
is manufacturing for the automotive sector, it is anticipated that supplier firms which are the main customer of
these firms (either domestic or overseas) are supplier firms operating in automotive sector on a higher tier.

174
4.7.7. Parent Company (PC)
What is meant with the parent company (PC) in the dissertation and questionnaire is the
affiliation with the domestic or overseas main company (conglomerate, MNC etc.) in terms
of administration or execution independent of the capital structure of the surveyed firm.
These are the companies located at domestic or overseas and they directly or indirectly
control all and any commercial activities, management and/or capital structure of the
surveyed firms. A significant part of the surveyed foreign firms (84%) operating in domestic
supply industry is the affiliate (subsidiary) of another foreign main company (MNC) located
at overseas. Local firms falling into this category are generally one of the group companies
affiliated to a domestic conglomerate (see section 5.5.1). By the way, the parent company
may operate in automotive industry or another industry. In a similar way, some AMMs
operating in Turkey (such as TOYOTA, HONDA, M.A.N) are the affiliates of global AMMs
located at overseas; therefore we also use “PC” term to refer these parent companies at
overseas.
4.7.8. Direct Supplier Firms (DSF)
They are the firms directly supplying parts to the AMMs in Turkey (DAMM) or they are the
1st-tier suppliers of DAMM. The sample of “Domestic Supply Industry” surveyed was also
analyzed in terms of DSF as well as LF and FF difference in Chapter 5. DSF are composed
of local and foreign firms but a classification according to the capital was not performed due
to both space reasons and the small number of the firms. Moreover, the DSF can be the
affiliates of global-mega suppliers, they have an equity partnership with foreign firms, or
they can be independent suppliers (Figure 4.14).

175
CHAPTER 5
SURVEY FINDINGS (1):
DESCRIPTIVE ANALYSIS
This chapter is devoted to a broad descriptive analysis of the survey data collected through
the questionnaire. Results of the survey will be presented and analyzed according to three
groups of surveyed firms categorized by local firms (LF), foreign firms (FF) and direct
supplier firms (DSF)107
, respectively, and last column in the tables concerns all firms (AF)
included in the sample (for a detailed description of the firms, see section 4.7). This
distinction will be maintained in all the tables, and it will enable us to test for the
significance of the equality of the mean of different variables between LF versus FF as well
as between DSF versus non-DSF by using Mann-Whitney U108
test, Pearson’s Chi-Square
test (from here on chi-square test) or t-test depending on both the type of variable (ordinal,
categorical and continuous) and the number of observations available. Survey results will be
analyzed under nine main headings within the framework of the study referred in Chapter 4.
107
Data on non-DSF will not be presented in the tables due to both space reasons and the small number of the
firms in this category (33 firms). 108
Mann-Whitney U test (also called the Mann–Whitney–Wilcoxon (MWW) test) is a non-parametric test and
used for comparing two independent samples. It does not require the assumption that the dependent variable is a
normally distributed interval variable (it is assumed at least ordinal). Null hypothesis of the test is that two
samples have identical distribution (see Pallant, 2007: 210).

176
5.1. General Characteristics of the Surveyed Firms109, 110
5.1.1. Capital Structure
Table 5.1 indicates foreign capital structure of the suppliers. We define foreign firms as
firms with a foreign share (FS) 10% or more111
. According to this definition, foreign firms
accounted for 27% (45 firms) of all firms, while local firms accounted for 73% (120 firms).
Generally, about one-quarter of the firms in our sample is composed of foreign firms.
Therefore, collected data and information is very suitable for analyzing in terms of local and
foreign firms112
.
Table 5.1: Distribution of Surveyed Firms
by Foreign Capital and Ownership Structure*
Source: Author calculations based on survey results
* FS: Foreign share defined as the share of foreign partner in firm equity.
Legend: DSF (Direct Supplier Firms)
109
Turkish economy and especially firms in Turkish automotive industry were negatively affected by the global
financial crisis, which started by the end of 2008, through 2009 together with world economies and global
automotive industry. As a result of this crisis, it was expected that economic indicators of the firms were not so
good through 2009. Our pilot testing for the questionnaire survey also confirmed this situation, as well (see
section 4.6.1.3). Therefore, although the questionnaire would be applied in 2010, all quantitative statistics (total
sales, number of employees, share of export in total sales, R&D expenditures or share of R&D expenditures in
total sales) were asked to firms related to year 2008 in the application of the questionnaire survey to prevent the
bias in these indicators. In addition, number of employee statistics was also asked related to year 2007 to compare
and to test that whether there was significant difference between 2007 and 2008. As a result, any significant
difference was not obtained between 2007 and 2008 years related to these statistics. Hence, we used only
statistics related to 2008 in the analyses. 110
Appendix L provides summary statistics for key indicators in the survey according to firm descriptions. 111
In accordance with Chapter 3, we here also define foreign firms as firms if FS is at least 10% or more in total
capital of the firm in accordance with the OECD, UNCTAD and the IMF’s definitions. 112
There are some countries in which significant portion of direct suppliers are composed of foreign firms: See
Bernard and Ravenhill (1995); Giroud (2003).
N % N %
Local Firms (FS < 10%) 120 72.73 93 70.45
Foreign Firms (FS ≥ 10%) 45 27.27 39 29.55
Minority Ownership (10% ≤ FS ≤ 39%) 3 1.82 2 1.52
Joint Venture (40% ≤ FS ≤ 69%) 16 9.7 15 11.36
Majority Ownership (70 % ≤ FS ≤ 99%) 4 2.42 2 1.52
Full Ownership (FS = 100%) 22 13.33 19 14.39
Total 165 100 132 100
All Firms DSF

177
When we analyze the ownership status of foreign firms within all firms, we see that 13% of
the firms are full ownership (FS=100%), 9.7% are joint venture (FS is between 40% and
69%), 2.4% are majority ownership (FS is between 70% and 99%) and finally 2% are
minority ownership status (FS is between 10% and 39%). In other words, nearly 50% of the
foreign firms are in the status of full ownership, 36% are in the joint venture and 9% are in
the majority ownership. Therefore, we can say that foreign investors prefer wholly full
ownership and joint ventures to minority ownership, because they want to have full control
over their firm. In sum, these findings also confirm that foreign firms are under the full
control of foreign capital.
In addition, 132 firms out of 165 firms (80%) in the sample are direct suppliers (first-tier
suppliers) of one or more AMMs in Turkey. This confirms that most of the surveyed firms
(80%) are direct suppliers. Share of the local and foreign firms in direct suppliers are 70%
and 30%, respectively. With respect to foreign ownership status, same pattern is observed
with all firms. Furthermore, the share of the direct suppliers in foreign firms (87%) is higher
than that in local firms (77%).
5.1.1.1. Origin of Foreign Capital
When we look at the origin of foreign capital, we see that there are fourteen countries with
different ownership status (between minority and full ownership) in surveyed firms (Table
5.2). The origin of the many firms is Germany (29%) with 13 firms; this is followed by USA
(13%) and France (11%) with 6 and 5 firms, respectively. Especially, German firms have a
large weight and they dominate the foreign firms in sample. Moreover, half of the full
ownership firms are Germany (7) and Japan (4), and only Japan firms prefer full ownership
status.
Table 5.2: Distribution of Foreign Firms by Origin and Ownership
Source: Author calculations based on survey results
†England (2), Belgium (2), S. Korea, Taiwan, India, Hungary, Finland and Switzerland
Ownership
Status
Minority Ownership 1 0 0 0 1 0 1 3 7
Joint Venture 4 3 2 0 1 2 4 16 35
Majority Ownership 1 1 0 0 1 0 1 4 9
Full Ownership 7 2 3 4 1 1 4 22 49
N 13 6 5 4 4 3 10 45
% 29 13 11 9 9 7 22 100
%
Origin
Germany USA France Japan Italy Spain Other† N

178
5.1.2. Establishment Date (Age)
Distribution of the surveyed firms by establishment year is presented at Table 5.3. According
to this, 83% of the all firms were established after the year of 1970, and most of the foreign
firms (36%) were established 2000 onwards. Mean age for foreign firms is 19 years, while
for local firms it is 29 years (see Appendix L for detailed summary statistics). This means
that foreign firms are significantly younger than local firms in sample and also there is a
statistically significant difference at 1% level (chi-square test). With respect to direct
suppliers, we observe same pattern with all firms, majority of the firms (33%) were
established in 1970s and mean age for these firms is 26 years.
5.1.3. Number of Employees
Table 5.3 displays that 51% of the surveyed firms are medium-sized (50-250 employees) and
40% are large-sized (250 and more employees), while only 9% of the firms are small-sized
firms (less than 50 employees). Mean number of employees is 294 for all firms (median113
:
200), minimum and maximum numbers are 15 and 3011, respectively (for details see
Appendix L). Majority of the foreign firms are large-sized firms (48%) and this is followed
by medium-sized firms (45%). Mean number (404) (median: 236) for foreign firms is
significantly higher than local firms (mean: 255, median: 195). When we look at the direct
suppliers, we see that 50% are in medium-sized and 43% are in large-sized firms. Moreover,
mean number are much higher (325) (median: 210) than non-direct suppliers (mean: 168,
median: 100) and there is a statistically significant difference between these two group of
firms at the 10% level (chi-square test).
5.1.4. Total Sales
Table 5.3 displays distribution of the surveyed firms according to total sales (turnover) in
2008. Irrespective of the firm classification (LF, FF, DSF and AF), most of the firms (in
varying rates of 22% and 29%) have yearly total sales value of between TL 50M and TL
100M. Total sales value of the 143 respondent firms is nearly TL 9B with mean value of TL
62M per firm (median TL 32M), and minimum value is TL 800K while maximum is TL
488M (for details see Appendix L). In the meantime, only 10% of the firms have less than
TL 5M total sales value. Foreign firms have nearly two times higher sales value than local
113
The median is given as a measure of central tendency, because it is less affected by outliers.

179
firms, the median and mean values for foreign firms are TL 53.5M and TL 97M, whereas for
local counterparts they are TL 29M and TL 49M, respectively (statistically significant at the
1% level) (chi-square test). In addition, direct suppliers have also higher sales values than
local firms (but lower than foreign firms): the median and mean values are TL 38M and TL
67M, respectively.
Table 5.3: General Characteristics of Surveyed Firms
Source: Author calculations based on survey results
Notes: ***, **, * denote significance level at the 1%, 5% and 10%, respectively (chi-square, 2-sided).
Fisher’s Exact test has been used if one or more cells have an expected count ≤ 5.
Legend: LF (Local Firms); FF (Foreign Firms); DSF (Direct Supplier Firms); AF (All Firms)
N % N % N % N %
Establishment *** ***
1930s 1 0.83 - - 1 0.76 1 0.61
1940s 2 1.67 - - 1 0.76 2 1.21
1950s 9 7.50 1 2.22 8 6.06 10 6.06
1960s 13 10.83 2 4.44 12 9.09 15 9.09
1970s 39 32.50 13 28.89 43 32.58 52 31.52
1980s 27 22.50 4 8.89 25 18.94 31 18.79
1990s 20 16.67 9 20.00 23 17.42 29 17.58
2000 onwards 9 7.50 16 35.56 19 14.39 25 15.15
Total 120 100 45 100 132 100 165 100
Employment *
10 - 19 2 1.68 1 2.38 2 1.55 3 1.86
20 - 49 9 7.56 2 4.76 6 4.65 11 6.83
50 - 99 22 18.49 10 23.81 21 16.28 32 19.88
100 - 249 41 34.45 9 21.43 44 34.11 50 31.06
250 - 499 34 28.57 10 23.81 39 30.23 44 27.33
500 - 999 8 6.72 6 14.29 10 7.75 14 8.70
1000 + 3 2.52 4 9.52 7 5.43 7 4.35
Total 119 100 42 100 129 100 161 100
Total Sales * *
less than 5 mTL 12 11.43 2 5.26 10 8.77 14 9.79
5 - 9.9 mTL 18 17.14 3 7.89 15 13.16 21 14.69
10 - 19.9 mTL 9 8.57 5 13.16 10 8.77 14 10.49
20 - 29.9 mTL 14 13.33 2 5.26 14 12.28 16 10.49
30 - 39.9 mTL 12 11.43 2 5.26 9 7.89 14 9.79
40 - 49.9 mTL 7 6.67 3 7.89 8 7.02 10 6.99
50 - 99.9 mTL 23 21.90 11 28.95 29 25.44 34 23.78
100 - 199.9 mTL 4 3.81 3 7.89 7 6.14 7 4.90
200 mTL + 6 5.71 7 18.42 12 10.53 13 9.09
Total 105 100 38 100 114 100 143 100
% of Export in Total
Sales* *
0 8 6.67 6 13.33 12 9.09 14 8.48
1 - 10 28 23.33 4 8.89 25 18.94 32 19.39
11 - 20 17 14.17 5 11.11 21 15.91 22 13.33
21 - 40 19 15.83 8 17.78 20 15.15 27 16.36
41 - 50 15 12.50 4 8.89 17 12.88 19 11.52
51 - 70 19 15.83 7 15.56 19 14.39 26 15.76
71 - 90 12 10 7 15.56 15 11.36 19 11.52
90 - 100 2 1.67 4 8.89 3 2.27 6 3.64
Total 120 100 45 100 132 100 165 100
in 2008LF FF AFDSF

180
5.1.5. Market Orientation
Table 5.3 displays also distribution of the firms according to their share of export in total
sales (export intensity). It can be seen from the table that most of the firms (92%) are
exporters (less than 9% of the firms do not export their products), 32% are also engaged in
export-oriented production (export at least 50% of their sales). Exports accounted for 44%
(mean) of sales for foreign firms (median: 40%) and only 35% for local firms (median: 26%)
(for details see Appendix L), and the difference between these two groups are statistically
significant at 10% level (chi-square test). Moreover, most of the foreign firms are in the class
of 21-40%, while local counterparts are in the 1-10% class. Therefore, foreign firms (40%)
are mainly more export-oriented than local counterparts (28%). With respect to direct
suppliers, we see that they have same pattern with local firms. The mean share of export for
direct suppliers is 35% (median: 25%) and most of them (19%) are in the class of 1-10%.
5.1.6. Technology Level of the Firms
Table 5.4 below shows the distribution of the surveyed firms according to their technology
levels (high-, medium- and low-tech). In the technological classification, the technological
complexity levels of the major products manufactured/assembled by the firms have been
considered. According to this, mainly three major products and their shares in total sales
have been analyzed case by case114
(see section 1 question 7 in the questionnaire form
presented in Appendix I). Accordingly,
Initially, the first product specified by the firms was taken as the basis in the
technological classification (since it’s assumed as the most important product
manufactured/assembled by the firms). If specified by the firms, the shares of the
second and third major products in the total sales respectively and whether they are of
the same product type with the first product were evaluated, as well. As a result of the
evaluation, it was realized that the products specified in the second and third order had
less share in the sales and/or these products were almost in the same categories as the
products specified in the first order (the firms generally manufacture/assemble similar
product types).
Secondly, the specialist engineers in this field (those employed by the AMMs and/or
supply industry) were consulted in the classification of the technology levels involved
114
The number of the firms specified only one, only two or only three products are 26, 17, and 122, respectively.

181
in the products. Accordingly, a technological classification has been made by taking
into consideration four factors:
i. The knowledge and technology level involved in the product,
ii. Whether it's a standard product,
iii. The level of difficulty in its manufacture,
iv. Its place in the production chain (primary, secondary, raw material, etc.)115
.
Table 5.4: Distribution of Surveyed Firms according to
the Technological Complexity of Products Manufactured (%)
Source: Author calculations based on survey results
Notes: ***, **, * denote significance level at the 1%, 5% and 10%, respectively (Mann-Whitney U
test, 2-sided).
Legend: LF (Local Firms); FF (Foreign Firms); DSF (Direct Supplier Firms); AF (All Firms)
As seen in the table, more than 50% of the surveyed firms (AF) manufacture at high-
technology level. Yet the rate of the foreign firms manufacturing at the high-technology
level (69%) is more than the rate of the local firms manufacturing at the same level (45%). In
addition, while the rate of the local firms manufacturing at medium and low technology
levels is 55%, the rate of the foreign firms manufacturing at the same levels is 31%. This
indicates that foreign firms manufacture at a higher technology level, and highly statistically-
significant difference has been detected between the local and foreign firms at 1% level.
When we examine the table in terms of the direct suppliers, 56% of these firms manufacture
at high technology level, 31% at medium and 13% at low technology level. In sum, direct
suppliers manufacture at a higher technology level than local firms but not than foreign
firms. Moreover, a statistically-significant difference has also been detected between the
direct suppliers and non-direct suppliers (at 1% level) (Mann-Whitney U test).
115
E.g. the parts/components as motor, gear box, suspension, braking system, safety systems, and so on (in
primary product class) were classified in the high-technology category; the parts as various automotive fasteners,
headlight, ventilation ducts, damper, seat, internal trim materials and such in the medium-technology category,
and the parts as mudguard, seat cover, indicator, signal arms, mirror and exhaust silencer in the low technology
category.
LF*** FF*** DSF*** AF
N 119 45 131 164
High-Technology 45.38 68.89 55.72 51.83
Medium-Technology 35.29 20 31.30 31.1
Low-Technology 19.33 11.11 12.98 17.07
Total 100 100 100 100

182
5.2. KTTs at Inter-Firm level
In this section, various types of KTTs at inter-firm level accruing from customers to their
suppliers in the automotive industry in Turkey will be examined, especially those (i) related
to “production processes” (ii) “product” (iii) achieved - albeit in an indirect manner- through
“financial assistances, and (iv) implemented through “trainings” given/provided to suppliers
by their customers. A thorough analysis of these various channels of KTT and their relative
importance will shed a light on the importance and the nature of linkages occurring in the
Turkish automotive industry between customers (buyers) and suppliers.
5.2.1. Transfers related to Production Process
Table 5.5 presents how often (frequently, rarely, never)116
thirteen KTT types pertaining to
the production process are provided to the firms by the customers117
. These transfers
regarding the production process are primarily as “provide documentations”, “know-how”
and assistances118
for “R&D activities” - “logistic management” - “quality control methods”
and “design”.
When the items are examined according to the “frequently” transfer degree and in terms of
all firms, the “provide documentations” item chosen by 33% of the firms comes in the first
rank (36% for LF, 24% for FF and 33% for DSF). This item is followed by “assistance for
logistic management” with 15%, “assistance for quality control methods” with 14% and
“know-how” and “assistance for R&D activities” items each being 10%. Other eight items
were chosen with a rate ranging from minimum 2% (assistance for business management) to
maximum 9% (supply of raw material) of the firms. When the items are examined in terms
of local and foreign firms, it is found out that higher-quality KTT types were being provided
to the foreign firms at higher rates (know-how, assistance for R&D activities, send expert
staff, assistance for productivity-related problems, patent and/or license rights granted,
assistance for business management). The transfers to the local firms are provided mostly in
fields such as “provide documentations”, “assistance for logistic management” and “supply
116
Frequency of provided KTT types (items) related to production process, product, financial transfers and
training is measured using a three-point frequency Likert scale constructed from five-point Likert scale
(frequently, occasionally, rarely, very rarely, never). 117
Information on “never” category has not been identified in table for space reasons but can be obtained for
each item by summing the proportions of answers given to “frequently” and “rarely” categories and then
subtracting from 100%. 118
The implied meaning of the “assistance” used in items related to production process transfers (assistance
related to R&D activities - logistic management - business management - quality control methods - design -
productivity problems) is every help that is provided by customers such as providing technical support - training -
advice - KTT etc.

183
of raw material”. When the items are examined in terms of direct suppliers, it is found out
that “supply of raw material”, “assistance for design” and “send expert staff” items were
being provided to the direct suppliers at higher rates. This is an important point for the direct
suppliers to show that they implement common activities with the AMMs. Otherwise, it’s
observed that direct suppliers bear the same characteristics as the local firms.
If the items are examined according to the “rarely” transfer degree and in terms of all firms,
the rate of nine items appears over 40%, and ranges from minimum 14% (patent and/or
license rights granted) to maximum 62% (assistance for quality control methods). While the
“assistance for quality control methods” item comes in the first rank in terms of local (65%)
and direct supplier firms (64%), “know-how” and “assistance for design” items come first
for the foreign firms (62%). This once again verifies that the higher-quality transfers are
provided to the foreign firms at a higher rate in terms of the quality of the transfers.
When the transfer degrees are examined together as both “frequently” and “rarely”, the rate
of six items is obtained as higher than 60%, ranging from minimum 17% (patent and/or
license rights granted) to maximum 89% (provide documentations). The most important six
items are respectively “provide documentations” (89%), assistances for “logistic
management” (73%) – “quality control methods” (76%) –“R&D activities” (64%), “know-
how” (64%) and “design” (61%).
In sum, the degree of the transfers provided according to the results summarized in Table 5.5
has been detected as “rarely” for each item. The rate of the firms specified that transfers
were provided “rarely” according to “frequently” transfer degree for each item ranges
between minimum two and maximum thirteen times. Another conclusion is that the rate of
“never” providing transfer for “assistance for productivity-related problems”, “assistance for
design”, “assistance for R&D activities” and “know-how” items including an important level
of knowledge transfer is very high as being 46%, 39%, 36% and 36%, respectively.
A significant difference has been detected in terms of “provide documentations”, “assistance
for logistic management” and “know-how” items each significant at 10% level between local
and foreign firms. A significant difference has also been found in terms of “assistance for
logistic management” (at 10% level), “assistance for design” (at 5% level), “customer
assigned its expert staff in the establishment of production process of the plant” (at 5%
level), “patent and/or license rights granted” (at 5% level) and “assistance for business
management” (at 10% level) items between the direct suppliers and non-direct suppliers
(Mann-Whitney U test).

184
Table 5.5: Types of KTTs related to the Production Process
Source: Author calculations based on survey results
Notes: ***, **, * denote significance level at the 1%, 5% and 10%, respectively (Mann-Whitney U test, 2-sided). The items do not add up to 100% because the
questionnaire included a further category called “Never”, but has not been identified in table for space reasons. However, information on “Never” category can be
obtained for each item by summing the proportions of answers given to “Frequently” and “Rarely” categories and then subtracting from 100%. Items are arranged by
both “All Firms” (AF) and “Frequently” transfer degree.
Legend: LF (Local Firms); FF (Foreign Firms); DSF (Direct Supplier Firms); AF (All Firms)
LF FF DSF AF LF FF DSF AF LF FF DSF
% % % % % % % % N N N
Provide documentations 35.83* 24.44* 32.58 32.73 55.83* 57.78* 57.58 56.36 120 45 132
Assistance for logistic management 17.5* 8.89* 15.91* 15.15 58.33* 55.56* 59.85* 57.58 120 45 132
Assistance for quality control methods 14.17 13.33 13.64 13.94 65 53.33 64.39 61.82 120 45 132
Know-how 9.32* 13.33* 12.31 10.43 50* 62.22* 50 53.37 118 45 130
Assistance for R&D activities 9.17 13.33 11.36 10.30 53.33 53.33 54.55 53.33 120 45 132
Supply of raw material 10 8.89 10.61 9.70 29.17 37.78 32.58 31.52 120 45 132
Customer sent its expert staff to stay at your
plant for a certain period of time for assistance
in solving problems in the production process
5.83 8.89 7.58 6.67 50.00 51.11 50.76 50.30 120 45 132
Assistance for design 6.67 6.67 8.33** 6.67 51.67 62.22 56.82** 54.55 120 45 132
Supply of machinery, tools and equipment 4.17 8.89 6.82 5.45 40 40 40.15 40 120 45 132
Assistance for productivity-related problems 4.17 8.89 6.82 5.45 50.83 42.22 49.24 48.48 120 45 132
Customer assigned its expert staff in the
establishment of production process of the
plant
5.83 4.44 6.82** 5.45 29.17 31.11 31.82** 29.70 120 45 132
Patent and/or license rights granted 2.52 4.44 3.82** 3.05 14.29 13.33 16.79** 14.02 119 45 131
Assistance for business management 1.67 4.44 2.27* 2.42 30.83 35.56 35.61* 32.12 120 45 132
Frequently
Types of knowledge and technology transfer
related to production process
Rarely

185
5.2.2. Transfers related to Product119
Table 5.6 shows how often (frequently, rarely, never) five KTT types pertaining to the
product are provided to the firms by the customers. These five factors with respect to the
product are the provision of “assistance related to product designs”120
, “joint operation
related to product”, “joint design activity related to product”, “product specifications” and
“technical specifications, original design or technical drawings for the products”.
When the items are examined according to the “frequently” transfer degree and in terms of
all firms, the “technical specifications, original design or technical drawings for the
products” item (49%) comes in the first rank (55% for LF, 31% for FF and 47% for DSF).
This item is followed by “joint operation related to product” (26%), “product specifications”
(26%), “joint design activity related to product” (15%) and “assistance related to product
designs” (12%) items. The items which are of higher quality in terms of the knowledge and
technology included (assistance related to product designs and joint design activity related
to product) are provided less to the firms by the customers. When the items are examined in
terms of local and foreign firms, we can observe that the firms have similar rates regarding
the items. An important finding is that the transfers including higher quality knowledge and
technology are provided more to the foreign firms compared to the local firms (assistance
related to product designs and joint operation related to product). When the items are
examined in terms of direct suppliers, they are observed to have almost the same distribution
as the local firms; however, “joint design activity related to product” (17%) item is higher
both than the foreign and the local firms. This is an important point for the direct suppliers to
show that they implement common product design activities with the AMMs.
119
The transfers provided by customers with respect to the product were asked to the executives of the supplier
firms as to the most important product/s manufactured. Although there is a possibility that transfers with respect
to the products might change for each firm depending on the manufactured product or the type of the part, when
the fact that survey application and study purposes as well as supplier firms are specialized in one product group
(see section 5.1.6) is taken into consideration no product or part classification has been made for the transfers
with respect to the product. 120
The implied meaning of the “assistance” used in item related to product transfers (assistance related to
product designs) is every help that is provided by customers like as providing technical support – training - advice
- KTT etc.

186
Table 5.6: Types of KTTs related to the Product
Table 5.7: Types of Financial Transfers (assistances)
Source: Author calculations based on survey results.
Notes: ***, **, * denote significance level at the 1%, 5% and 10%, respectively (Mann-Whitney U test, 2-sided). The items do not add up to 100% because the
questionnaire included a further category called “Never”, but has not been identified in table for space reasons. However, information on “Never” category can be
obtained for each item by summing the proportions of answers given to “Frequently” and “Rarely” categories and then subtracting from 100%. Items are arranged by
both “All Firms” (AF) and “Frequently” transfer degree.
Legend: LF (Local Firms); FF (Foreign Firms); DSF (Direct Supplier Firms); AF (All Firms)
LF FF DSF AF LF FF DSF AF LF FF DSF
% % % % % % % % N N N
Technical specifications, original design or
technical drawings for products 55.46*** 31.11*** 46.97 48.78 31.93*** 40*** 36.36 34.15 119 45 132
Joint operation related to product 25.21 28.89 27.27 26.22 53.78 57.78 54.55 54.88 119 45 132
Product specifications 27.73 22.22 25.76 26.22 38.66 55.56 43.18 43.29 119 45 132
Joint design activity related to product 15.13 13.33 16.67** 14.63 54.62 60 57.58** 56.10 119 45 132
Assistance related to product designs 10.17 15.56 12.21* 11.66 52.54 51.11 54.96* 52.15 118 45 131
Frequently Rarely
Types of knowledge and technology transfer
related to product
LF FF DSF AF LF FF DSF AF LF FF DSF
% % % % % % % % N N N
Pre-financing of machinery, equipment and tools 8.55* 17.78* 13.18*** 11.11 39.32* 42.22* 44.19*** 40.12 117 45 129
Prepayment for orders before delivery 7.56 6.67 7.63 7.32 36.13 31.11 32.06 34.76 119 45 131
Loans with low interest rates 1.69 0 1.54 1.23 6.78 2.22 4.62 5.52 118 45 130
Contribution to risk capital 0.85 0 0.77 0.61 4.24 0 3.85 3.07 118 45 130
Unilateral financial aid 0 0 0 0 7.69 4.44 7.75 6.79 117 45 129
Frequently Rarely
Types of financial transfer

187
If the items are examined according to the “rarely” transfer degree and in terms of all firms,
the rate for four items appears over 40%, and ranges from minimum 34% (technical
specifications, original design or technical drawings for the products) to maximum 56%
(joint design activity related to product). “Joint design activity related to product” item
comes in the first rank in terms of three groups of firms (LF, FF and DSF). This points out
that the level of cooperation between the customers and suppliers in terms of the “joint
design activities for the product” is high. This is also the result of the fact that the customers
wish to guarantee the quality, defect rate and on-time delivery of the products used in the
production and provided from the suppliers and thus not to have any problems in the
production lines. Another finding is that transfers with respect to the product are provided
more the foreign firms (compared to both LF and DSF).
When the transfer degrees are evaluated together as both “frequently” and “rarely”, the rate
of the items exceeds 64%, the highest rate being “technical specifications, original design or
technical drawings for the products” item with 83%. This item is followed by “joint
operation related to product” with 81%, “joint design activity related to product” with 71%,
“product specifications” with 69% and “assistance related to product designs” item with
64% in the last place121
. According to the results summarized in Table 5.6, the transfer
degree of the four items other than “technical specifications, original design or technical
drawings for the products” item (detected as “frequently” with 49%) with the highest
percentage has been detected as “rarely”.
A significant difference has been found in terms of “technical specifications, original design
or technical drawings for products” item between local and foreign firms (at 1% level). A
significant difference has also been found in terms of “assistance related to product designs”
(at 10% level) and “joint design activity related to product” (at 5% level) items between the
direct suppliers and non-direct suppliers (Mann-Whitney U test).
121
In other words, “never” transfer degree of the “assistance related to product designs” item requiring an
important level of knowledge and skills has the highest rate with 36% {100% - 12% (frequently) – 52% (rarely) =
36%}.

188
5.2.3. Financial Transfers122
Table 5.7 above shows how often five types of financial transfers (assistances) are provided
to the firms by the customers. These transfer types are: “unilateral financial aid”, “loans
with low interest rates”, “contribution to risk capital”, “pre-financing of machinery,
equipment and tools”, and “prepayment for orders before delivery”.
When the items are examined according to the “frequently” transfer degree and in terms of
all firms, the “pre-financing of machinery, equipment and tools” item chosen by 11% of the
firms comes in the first rank (9% for LF, 18% for FF and 13% for DFS). This item is
followed by “prepayment for orders before delivery” with 7%, “loans with low interest
rates” with 1% and “contribution to risk capital” item with 0.6%. The item with the lowest
rate is “unilateral financial aid” with 0%. When the items are examined in terms of local and
foreign firms, it is observed that “loans with low interest rates” and “contribution to risk
capital” items are not provided with “frequently” transfer degree to the foreign firms. The
fact that foreign firms are generally the affiliates of the MNCs abroad (see section 5.5.1) and
therefore have stronger capital structure can be marked as the possible reason behind this.
This is also verified by the data regarding the size of the surveyed foreign firms. On the other
hand, “pre-financing of machinery, equipment and tools” item is provided two times more to
the foreign firms than the local firms. This indicates the fact that foreign firms set up more
extensive relations with their customers. When we take a glance upon the items from the
direct supplier’s point of view, the distribution of the items show the same properties as the
local firms: the most important difference is that “pre-financing of machinery, equipment
and tools” item is nearly two times higher compared to local firms.
If the items are examined according to “rarely” transfer degree and in terms of all firms, the
rates pertaining to the items range between 3% (contribution to risk capital) and 40% (pre-
financing of machinery, equipment and tools). A significant conclusion according to the
“frequently” transfer degree is that the “unilateral financial aid” item in the last place with
0% rises to 7% at “rarely” transfer degree and thus reaches to the third rank by exceeding
“contribution to risk capital” and “loans with low interest rates” items.
When the transfer degrees are examined together as both “frequently” and “rarely”, the
transfer with the highest rate is again the “pre-financing of machinery, equipment and tools”
122
Foreign literature and findings of the earlier case studies conducted on various sectors showed that financial
transfers to the suppliers were so minimal and not preferred so much by the cooperated customers (Giroud, 2003).

189
item with 51%. This item is followed by “prepayment for orders before delivery” with 42%,
“loans with low interest rates” with 7%, “unilateral financial aid” with 7% and
“contribution to risk capital” item with 4%. Furthermore, when the items are examined
individually, the degree of the transfers made is detected as “rarely” for each item.
A significant difference is found for both test groups in terms of only “pre-financing of
machinery, equipment and tools” item between foreign and local firms at 10% level and
direct suppliers and non-direct suppliers at 1% level (Mann-Whitney U test).
Consequently, it has been detected that customers do not generally prefer making financial
assistances to supplier firms; but if they do, these assistances are generally made in the form
of “pre-financing of machinery, equipment and tools” and/or “prepayment for orders before
delivery”. This finding is consistent with the findings of earlier studies conducted in other
countries.
5.2.4. Transfers through Training
Table 5.8 below presents three different types of trainings provided by the cooperating
customers and the modes of these as visual (visits to customers’ plants), off-the-job (via
seminars and courses) and on-the-job training (learning by doing / theoretical and/or applied
training) according to the degrees.
5.2.4.1. Types of Training
Three different types of trainings provided by the customers are: “training on technologies
used in production”, “training of production/operation staff” (engineers, technicians etc.)
and “training of management staff” (Table 5.8).
When the degree of training provision is examined according to “frequently” degree, it can
be seen that training types are provided to foreign firms at higher rates (compared to both LF
and DSF). When we examine the rates of the trainings provided by the customers in terms of
“production” and “management personnel” employed by the firms, “training of
production/operation staff” has the highest rates in the three groups of firms (LF, FF and

190
DSF). In addition to that, direct suppliers have higher rates than local firms but lower rates
than foreign firms for three training types.
When the table is examined according to “rarely” transfer degree, “training on technologies
used in production” is given more to the direct suppliers with 38%, “training of
production/operation staff” more to the local firms with 54% and “training of management
staff” more to the foreign firms with 53%. Another finding is that while the “training of
management staff” is provided to the foreign firms at higher rates than “training of
production/operation staff” item, it is vice versa for the local firms and direct suppliers.
When the training provision degrees are examined together as both “frequently” and
“rarely”, “training on technologies used in production” rate becomes 48%, “training of
production/operation staff” 62% and “training of management staff” 56%. The highest
transfer degree for these three items has been identified as “rarely”.
No significant difference has been found with respect to the training types between local and
foreign firms. But a significant difference has been detected in terms of “training on
technologies used in production” (at 10% level) and “training of production/operation staff”
items (at 5% level) between the direct suppliers and non-direct suppliers (Mann-Whitney U
test).
5.2.4.2. Modes of Training
When the training modes are examined according to “frequently” transfer degree, off-the-job
training (learning by seminars and courses) comes in the first rank (Table 5.8). This kind of
training is provided “at supplier’s plant” (in-house) (46%), “at other private specialized
institutes” (22%) and “at customers’ plants” (7%) respectively. A similar distribution is
observed among three groups of firms in terms of this training mode (LF, FF and DSF). The
second training mode is “visits to customers’ plants” (learning by visual). In this training
mode, the personnel of the supplier firms visits the factories of the customers for a certain
period of time within a pre-planned program and take visual training via expert personnel
regarding the product and production process. We have realized that this mode of training is
given more to local firms (21%), direct suppliers (19%) and foreign firms (13%),
respectively. The fact that this visual mode of training is given less to the foreign firms
indicates that their technological capability level is very high compared to other firms. The

191
third training mode is on-the-job training (learning by doing / theoretical and/or applied).
When we take a look at where this mode of training is given, “the plants of the supplier
firms” (in-house) come first with 7%. This is followed by “customers’ plants in Turkey”
(4%) and “factories abroad” (1%). On the other hand, the foreign supplier firms take higher
amount of training at their own factories (in-house).
When the modes of training are examined according to “rarely” degree or together with both
“frequently” and “rarely” degree, the above mentioned results do not change much, and the
most important difference results from the fact that foreign firms have higher rates at both
degrees (compared to LF and DSF). When we examine the degrees of the items concerning
training modes, “rarely” has been detected as the degree with the highest percentage for each
item (except “at supplier’s plant” item for LF).
A significant difference has been found in terms of giving training “at other private
specialized institutions” (at 5% level) and “at customers’ plants” (at 10% level) related to
off-the-job training, and “at customers’ plant abroad” (at 5% level) in terms of the on-the-
job training between local and foreign firms. A significant difference has also been detected
in terms of giving training “at customers’ plants” (at 10% level) for the off-the-job training
between the direct suppliers and non-direct suppliers (Mann-Whitney U test).
In summary, various activities regarding the training are being provided intensively for the
firms by the cooperating customers, and much more importance is attached particularly to
the training of the “production personnel”. As it has been mentioned above, we can claim
that it results from the fact that the customers wish to increase the quality level of the
products supplied and not to have any trouble in the production line by means of increasing
the capabilities and technology levels of their suppliers (quality, on-time delivery, low defect
rate and cost, etc.). It is also the result of new product development, improvements related to
production process and cooperative activities for joint design between the customers and
suppliers. Besides, the fact that training activities are provided more to the foreign firms
points out that the cooperation between these firms and the customers are stronger compared
to the local firms.

192
Table 5.8: Types and Modes of Training Activities provided by Customers
Source: Author calculations based on survey results.
Notes: ***, **, * denote significance level at the 1%, 5% and 10%, respectively (Mann-Whitney U test, 2-sided). The items do not add up to 100% because the
questionnaire included a further category called “Never”, but has not been identified in table for space reasons. However, information on “Never” category can be
obtained for each item by summing the proportions of answers given to “Frequently” and “Rarely” categories and then subtracting from 100%. Items are arranged by
both “All Firms” (AF) and “Frequently” transfer degree.
Legend: LF (Local Firms); FF (Foreign Firms); DSF (Direct Supplier Firms); AF (All Firms)
LF FF DSF AF LF FF DSF AF LF FF DSF
% % % % % % % % % % N N N
Types of training
9.24 15.56 12.98* 10.98 36.97 37.78 38.17* 37.20 119 45 131
7.56 17.78 12.98** 10.37 53.78 46.67 52.67** 51.83 119 45 131
5.83 11.11 9.09* 7.27 47.50 53.33 50* 49.09 120 45 132
Modes of training
20.83 13.33 18.94 18.79 60.83 71.11 63.64 63.64 120 45 132
B) Off-the-job training
(via seminars and courses)
at supplier's plant 47.06 42.22 47.33 45.73 44.54 51.11 46.56 46.34 119 45 131
20.17** 26.67** 22.14 21.95 64.71** 73.33** 69.47 67.07 119 45 131
6.67* 6.67* 6.82* 6.67 61.67* 77.78* 68.94* 66.06 120 45 132
On-the-job training
at supplier's plant 5.88 11.36 8.46 7.36 42.02 38.64 40.77 41.10 119 44 130
4.17 4.44 4.55 4.24 35 44.44 39.39 37.58 120 45 132
1.69** 0** 1.54 1.23 22.03** 40** 29.23 26.99 118 45 130
Training on technologies used in production
Training of management staff
Training of production/operation staff
(engineers, technicians etc.)
(learning by visual)
(learning by doing / theoretical and/or applied training)
Frequently Rarely
A) Visits to customers’ plants
at other private specialized institutes
at customers’ plants
at the costumers' plant
In Turkey
Abroad

193
5.2.5. The reasons for not making sufficient amount of KTT
A significant amount of the firms almost 75% (124 firms) thinks that customers do not
provide sufficient amount of KTT (82% for FF, 73% for LF and 75% for DSF) (Table 5.9).
The firms thinking in such way have identified “realizing our own R&D activities” (48%)
and “realizing co-designer and/or our own design activities” (44%) items as the most
important two underlying reasons. This indicates that the firms regard their own
technological capabilities superior in terms of R&D and design and therefore do not need
KTTs much. On the other hand, other three items following these items were also specified
as the reason with a high rate (reluctance of foreign firms in KTT with 39%, reluctance of
AMMs in KTT with 31% and technologies are strictly confidential with 31%). These three
items point out that another important reason for not providing transfers is because
customers are not keen on transfers to their suppliers and want to prevent spillover by means
of keeping their technology confidential. The last two items which are regarded as important
by 19% of the firms were specified as “not working with AMMs” and “needed technologies
can be obtained by using reverse engineering methods”. This is important in terms of
regarding working with the AMMs as a significant way of transferring knowledge and
technology (23% for LF, 8% for FF).
Table 5.9: The reasons for not making sufficient amount of KTT
Source: Author calculations based on survey results
Notes: ***, **, * denote significance level at the 1%, 5% and 10%, respectively (chi-square, 2-sided).
Fisher’s Exact test has been used if one or more cells have an expected count ≤ 5.
Legend: LF (Local Firms); FF (Foreign Firms); DSF (Direct Supplier Firms); AF (All Firms); AMM
(Automotive Main Manufacturers)
Distributions regarding the items show almost the same patterns for three groups of firms
(LF, FF and DSF). An important finding is that foreign firms have higher rates for the first
LF FF DSF AF
% % % %
72.50 82.22 75 75.15
Realizing our own R&D activities 48.28 48.65 47.47 48.39
Realizing Co-designer and/or our own design activities 42.53 48.65 46.46 44.35
Reluctance of foreign firms in knowledge and technology transfer 37.93 40.54 42.42* 38.71
Reluctance of AMM in knowledge and technology transfer 33.33 27.03 31.31 31.45
Technologies are strictly confidential 33.33 24.32 34.34* 30.65
Not working with AMM 22.99* 8.11* - 18.55
Needed technologies can be obtained by using reverse
engineering methods21.84 10.81 19.19 18.55
N 87 37 99 124
Reasons
Enough knowledge and technology are not transferred (165 firms)

194
two items yet lower rates for the fourth and fifth items (compared to both LF and DSF).
While the situation regarding the first two items reflects the superior technological
capabilities of the foreign firms, the situation concerning the fourth and fifth items points out
that foreign firms have stronger and more strategic relations with the AMMs.
A significant difference has been found in terms of “not working with AMMs” item (at 10%
level) between local and foreign firms. A significant difference has also been detected in
terms of “reluctance of foreign firms in KTT” (at 10% level) and “technologies are strictly
confidential” (at 10% level) items between the direct suppliers and non-direct suppliers (chi-
square test).
5.3. Market and Competition Structure
5.3.1. Major Markets
The firms were asked to prioritize their major markets from 1 to 5 (1>2>3>4>5).
Accordingly, Table 5.10 shows the major markets of the firms according to the first three
importance degrees. As seen in the table, there are similar distributions in terms of all three
groups of the firms. “Domestic market” is the first in ranking with 58% and “European
Union” second with 37% among the markets which are attached first degree of importance
by 165 surveyed firms. The total amount of the both markets is 95%, and it is concluded that
the major markets in which production and export is made is domestic and countries of the
European Union (EU), respectively. “European Union” is the first with 52% and “domestic
market” second with 27% among the markets which are attached second degree of
importance by the 155 firms. The total amount of both markets is 79%, and they preserve the
second importance degree, as well. Therefore, the major market of the firms is the domestic
and it is followed by the EU countries123
. Major EU countries stated by the firms are
Germany (23%), France (17%), England (14%), Italy (9%) and Spain (7%), respectively. As
to the markets attached with the third degree of importance by the firms, “Middle East”
comes in the first rank with 31%. It is followed by “Asia” with 24% and “USA” with 23%.
The total amount of three markets is 78%, and these markets are regarded as the third
important markets by the firms.
123
The rate of the firms whose main customers are at domestic (DAMM: 45.96% plus DS: 12.42%) given in
Table 5.20 (58.38%) are very close to the rate of the supplier firms making production for the domestic markets
given in Table 5.10 (58.18%).

195
Table 5.10: Distribution of Surveyed Firms by Market Orientation (%)
Source: Author calculations based on survey results
Notes: ***, **, * denote significance level at the 1%, 5% and 10%, respectively (Mann-Whitney U
test, 2-sided).
Legend: LF (Local Firms); FF (Foreign Firms); DSF (Direct Supplier Firms); AF (All Firms).
† Germany (23%), France (17%), England (14%), Italy (9%), Spain (7%) and remaining 21 EU
members (30%).
* Brazil (40%), Russia (17%), China (12%), Japan (6%) and 6 other countries (25%).
A significant difference has been detected in terms of “Middle East” market between local
and foreign firms (at 10% level). A significant difference has also been detected in terms of
“European Union” (at 10% level) and “USA” markets (at 10% level) between the direct
suppliers and non-direct suppliers (Mann-Whitney U test).
5.3.2. Main Competitors
Table 5.11 shows the distribution of the firms according to location of their main
competitors. Accordingly, similar distribution in terms of three groups of the firms is
observed. Most of the firms (67%) stated that their main competitors were both “abroad” and
“in Turkey”. This is followed by “abroad” (19%) and “in Turkey” (13%), respectively.
Furthermore, foreign firms have higher rates (27%) than other firms among the firms which
have specified that their main competitors are at “abroad”, while the rate of the local firms is
higher (15%) than the other firms among the firms which have specified that their
competitors are “in Turkey”.
A significant difference has been found in terms of “abroad” between local and foreign
firms (at 10% level). A significant difference has also been detected in terms of “abroad” (at
10% level) and “in Turkey” (at 10% level) between the direct suppliers and non-direct
suppliers (chi-square test).
Major Markets LF FF DSF AF LF FF DSF AF LF FF DSF AF
N 120 45 132 165 115 40 127 155 85 30 94 115
Domestic Market 60.83 51.11 60.61 58.18 24.35 35 27.56 27.10 8.24 6.67 6.38 7.83
European Union† 35 42.22 34.85** 36.97 53.91 47.50 55.12** 52.26 2.35 6.67 4.26** 3.48
Middle East 1.67* 4.44* 3.03 2.42 7.83* 0* 1.57 5.81 32.94* 26.67* 32.98 31.30
Asia 0.83 2.22 0.76 1.21 4.35 10 6.30 5.81 23.53 26.67 23.40 24.35
USA 1.67 0 0.76* 1.21 6.09 7.50 7.87* 6.45 24.71 20 23.40* 23.48
Africa 0 0 0 0 1.74 0 0.79 1.29 2.35 6.67 3.19 3.48
Other Countries* 0 0 0 0 1.74 0 0.79 1.29 5.88 6.67 6.38 6.09
Total 100 100 100 100 100 100 100 100 100 100 100 100
1st 2nd 3rd
Degree of Importance

196
Table 5.11: Distribution of Surveyed Firms
by Location of Their Main Competitors (%)
Source: Author calculations based on survey results
Notes: ***, **, * denote significance level at the 1%, 5% and 10%, respectively (chi-square, 2-sided).
Fisher’s Exact test has been used if one or more cells have an expected count ≤ 5. All columns add up
to 100%.
Legend: LF (Local Firms); FF (Foreign Firms); DSF (Direct Supplier Firms); AF (All Firms).
5.3.3. Business Environment related to Competition and
Relationship
The firms were asked to evaluate to what extent they agree with three items concerning the
business environment on a five-point Likert scale ranging from 1 (strongly disagree) to 5
(strongly agree). These three items are “domestic competition is intense”, “global
competition is intense” and “relationships between customers and suppliers are strong”
items. When the items are examined individually, the median of each is obtained as 4, the
lowest mean as 3.57 and the highest mean 4.33. Therefore, those evaluated at the level of 4
or 5 were handled in “agree” category (4≥), those evaluated at the level of 3 in “neither
agree nor disagree” category (=3) and those evaluated at the level of 1 or 2 were handled in
“disagree” category. In Table 5.12, the distribution of the firms whose answers for the items
were in “agree” category (4≥) was examined.
Table 5.12: Perception of Competition and Relationship
Source: Author calculations based on survey results
Notes: ***, **, * denote significance level at the 1%, 5% and 10%, respectively (Mann-Whitney U
test, 2-sided). The items do not add up to 100% because the questionnaire included a further
categories called “1–Strongly disagree, 2-Disagree and 3-Neither agree nor disagree”, but have not
been identified in table. 4≥: Responses indicating the degree of agreeing as being “agree” (4) or
“strongly agree” (5) are presented here.
Legend: LF (Local Firms); FF (Foreign Firms); DSF (Direct Supplier Firms); AF (All Firms).
LF FF DSF AF
N 120 45 132 165
Both 68.33 64.44 66.67 67.27
Abroad 16.67* 26.67* 21.97* 19.39
In Turkey 15 8.89 11.36* 13.33
Total 100 100 100 100
LF FF DSF AF LF FF DSF
Agree % % % % N N N
Global competition is intense 4≥ 85.71 100 92.42 89.63 119 45 132
Domestic competition is intense 4≥ 72.27* 65.91* 68.94 70.55 119 44 132
Relationships between customers and
suppliers are strong 4≥ 57.98 57.78 60.31 57.93 119 45 131

197
Each firm group’s point of view for the intensity of the global and domestic competition
corresponds with each other. Most of the firms specified the “global competition is intense”
are at the first rank (90%). The rate of the firms who agree that “domestic competition is
intense” is 71% with the second rank. These findings match with the section in which we
have examined where the main competitors of the firms are located (section 5.3.2). At the
same time, mostly the local firms (72%) / (the least foreign firms, 66%) agree that domestic
competition is intense whereas mostly the foreign firms (100%) / (the least local firms, 86%)
agree that global competition is intense. The most important reason for this is that most of
the foreign firms are export-oriented124
(see section 5.1.5) and make their production for
global markets which are generally more competitive. The fact that foreign firms regard the
domestic market less competitive means they consider less the domestic firms as their
competitors. This may be explained by the fact that foreign firms are larger scale firms
(number of employees and total sales, etc.) (see sections 5.1.3 and 5.1.4) and have superior
capabilities in terms of technology (see sections 5.1.6 and 5.4) compared to local firms.
The rate of local and foreign firms that agree that “the relations between the customers and
suppliers are strong” is 58%; the rate of the direct suppliers for the same is 60%. That the
direct suppliers have a higher rate for this item indicates they have more extensive
cooperation with the AMMs as to the product, production process, training and similar
activities.
A significant difference has only been found in terms of “domestic competition is intense”
item between local and foreign firms (at 10% level). But between the direct suppliers and
non-direct suppliers, no significant difference has been found with regard to the items
between two groups (Mann-Whitney-U test).
124
The foreign firms carry out almost half of their production to abroad whereas local firms export two fifth of
the production to the abroad markets (see Tables 5.3, 5.10 and 5.20).

198
5.4. Technology Capabilities related to Production and
Design
5.4.1. Production Capabilities
The firms were asked to evaluate their own capabilities for production activities when
compared with other rivalry or leader firms in the industry on a five-point Likert scale
ranging from 1 (low) to 5 (high). When the items are examined individually, the median of
nine out of ten items is obtained as 4 and the lowest mean as 3.29 (co-designer capability).
Therefore, the items evaluated at the level of 4 or 5 were handled in “high” category (4≥),
the items evaluated at the level of 3 in “medium” category (=3) and the items evaluated at the
level of 1 or 2 were handled in “low” category. Table 5.13 shows the distribution of the firms
that specified the level of their capabilities in “high” category (4≥).
Table 5.13: Distribution of Surveyed Firms by Production Capabilities
Source: Author calculations based on survey results
Notes: ***, **, * denote significance level at the 1%, 5% and 10%, respectively (Mann-Whitney U
test, 2-sided). The items do not add up to 100% because the questionnaire included a further
categories from 1 to 3 (1 and 2 = Low Capability, 3=Middle Capability), but have not been identified
in table. 4≥: Responses indicating the technological degree of capabilities as being “High” are
presented here.
Legend: LF (Local Firms); FF (Foreign Firms); DSF (Direct Supplier Firms); AF (All Firms).
†CAD (Computer Aided Design); CAM (Computer Aided Manufacturing); CAE (Computer Aided
Engineering)
“On-time delivery” by 93% is the field in which the firms regard themselves as the most
capable, and it is followed by “quality control capability” (87%) and “testing and analytical
capability” (87%). The field in which the firms consider themselves as the least capable is
LF FF DSF AF LF FF DSF
High % % % % N N N
On-time delivery 4≥ 92.50 93.33 95.45* 92.73 120 45 132
Quality control capability 4≥ 86.67 88.89 89.39 87.27 120 45 132
Testing and analytical capability 4≥ 85.83 88.89 87.88 86.67 120 45 132
Design capability 4≥ 70 68.89 71.97 69.70 120 45 132
Product improvement capability 4≥ 62.50 68.89 65.91 64.24 120 45 132
Expertness on CAD-CAM-CAE† 4≥ 64.17 57.78 65.15* 62.42 120 45 132
R&D capability 4≥ 58.33* 64.44* 63.64 60 120 45 132
Automation level in production process 4≥ 52.50 60 53.79 54.55 120 45 132
Co-Designer capability 4≥ 51.67 57.78 56.82* 53.33 120 45 132
Reach to lower prices 4≥ 52.50 46.67 51.52 50.91 120 45 132

199
“reach to lower prices” with 51%. When these items are examined in terms of three groups
of firms, the ranking of the firms as to the items are almost similar. Yet the capability level
of the firms for each item is different. It can be observed that local firms are more capable in
“reach to lower prices”, foreign firms in “testing and analytical capability”, “product
improvement capability”, “R&D capability”, “automation level in production process”, “co-
designer capability” items and direct suppliers in “on-time delivery”, “quality control
capability”, “design capability”, “expertness on CAD-CAM-CAE” items. While the foreign
firms consider themselves more capable in fields requiring higher technology, more
specialization and knowledge, the direct suppliers consider themselves more capable as to
the features required by the AMMs for the suppliers (quality control, on-time delivery,
design and expertness on various engineering software).
A significant difference has been found in terms of “R&D capability” item between local
and foreign firms (at 10% level). A significant difference has also been detected in terms of
“on-time delivery”, “expertness on CAD-CAM-CAE” and “co-designer capability” items
between the direct suppliers and non-direct suppliers (at 10% level) (Mann-Whitney U test).
5.4.2. International Quality Certificates
Table 5.14 presents the distribution of the firms according to international quality
certifications. 82% of the firms have ISO/TS16949125
quality certificate (93% for FF, 84%
for DSF and 77% for LF). This quality certificate which was developed by the major
manufacturers (BMW, DaimlerChrysler, Fiat, Ford, GM, PSA) and national trade unions
(USA, Germany, England, Italy, France, Japan) in global automotive industry specifies the
conditions required for the quality systems to be owned by the global suppliers. The fact that
a very high number of the firms (82%) have this certificate shows that the surveyed supplier
firms carry out production for AMMs at global level and possess high-quality capabilities.
This quality certificate is followed by ISO9001 (quality management system) with 60% and
ISO14001 (environmental management systems) with 53%, respectively. The certificate
which is least owned by the firms is ISO9002 (quality assurance in production, installation
and servicing) with 9% (10% for LF, 5% for FF and 8% for DSF).
125
“ISO/TS16949 (quality management systems for automotive production and relevant service part
organizations) has been used by the major automotive manufacturers to approve more than 35,000 organizations
worldwide that produce and supply parts for the sector” (www.iso.org). “It has been developed by the industry,
the International Automotive Task Force (IATF), to encourage improvement in both the supply chain and the
certification process. In fact, for the majority of leading vehicle manufacturers, certification to this specification is
a mandatory requirement for doing business” (www.bsigroup.com).

200
Table 5.14: Distribution of Surveyed Firms by Quality Certifications
Source: Author calculations based on survey results
Notes: ***, **, * denote significance level at the 1%, 5% and 10%, respectively (chi-square, 2-sided).
Fisher’s Exact test has been used if one or more cells have an expected count ≤ 5.
Legend: LF (Local Firms); FF (Foreign Firms); DSF (Direct Supplier Firms); AF (All Firms); AMM
(Automotive Main Manufacturers).
† TS8646, ISO18001, QONE, TAI, TÜV CERT, GIO, ABS, RINA, DNV, Valeobin, SQBP, IRIS,
Ekotoks, CE, ISO10002, Lloyds register, Germanischer Lloyd, OHSAS.
The firms have also certificates specific to the AMMs (49% for DSF, 41% for FF and 40%
for LF). That the direct suppliers have these certificates a lot more than (49%) the other firms
is the result of being direct suppliers of AMMs, and at the same time it indicates that they not
only meet the requirements of these manufacturers but also have high quality levels. One of
the most important certificates in this respect is the Q1 certificate of Ford (Q1) which is one
of the MNCs. 19% of the direct suppliers stated to have this certificate.
A significant difference has been found in terms of ISO/TS16949 (at 5 % level), ISO 9001 (at
10 % level), ISO14001 (at 1% level), ISO18000 (at 5% level) and QS9000 (at 5% level)
between local and foreign firms. A significant difference has also been detected in terms of
ISO/TS16949 (at 1% level), ISO14001 (at 5% level), specific certificates of AMM (at 1%
level) and QS9000 (at 5% level) between the direct suppliers and non-direct suppliers (chi-
square test).
LF FF DSF AF
% % % %
ISO/TS 16949 77.31** 93.18** 84.85*** 81.60
ISO 9001 63.87* 50* 58.33 60.12
ISO 14001 47.06*** 70.45*** 56.82** 53.37
Specific Certificates of AMM 39.50 40.91 49.24*** 39.88
Q1-FORD 14.29 18.18 18.94 15.34
ISO 18000 12.61** 27.27** 16.67 16.56
ISO 14000 13.45 15.91 14.39 14.11
QS 9000 10.08** 22.73** 15.91** 13.50
ISO 9002 10.08 4.55 8.33 8.59
Others† 19.33 6.82 6.82 15.95
N 119 44 132 163
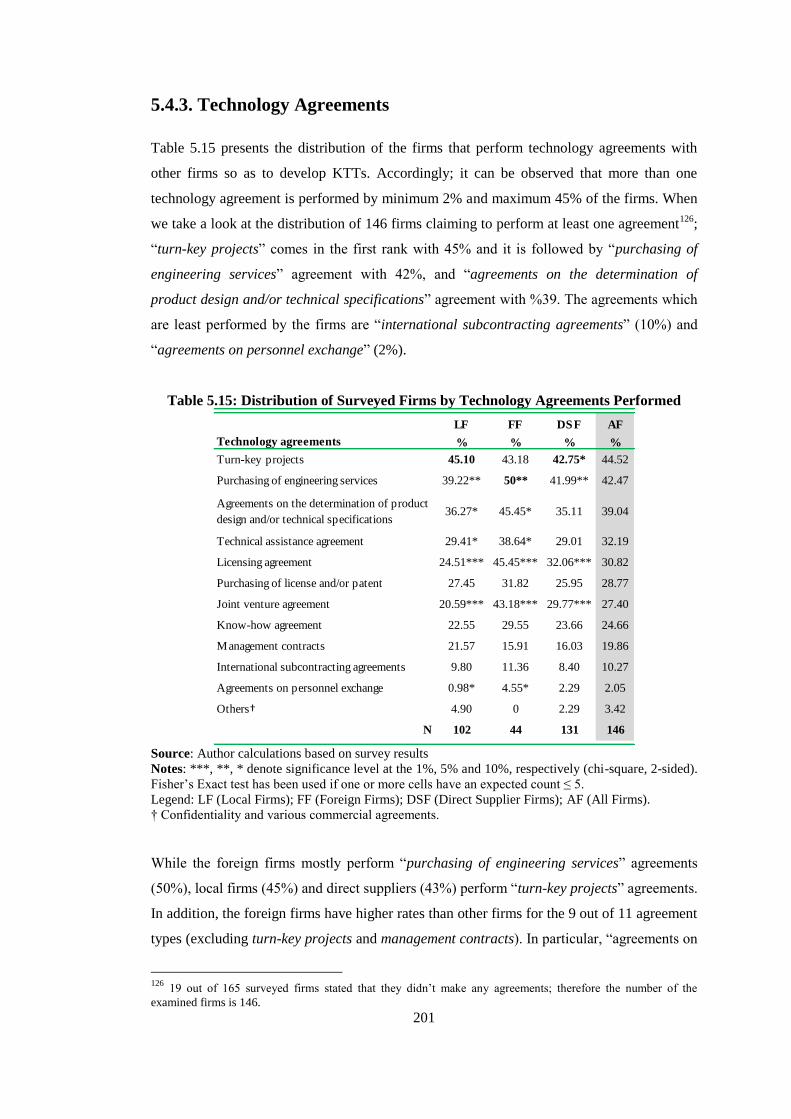
201
5.4.3. Technology Agreements
Table 5.15 presents the distribution of the firms that perform technology agreements with
other firms so as to develop KTTs. Accordingly; it can be observed that more than one
technology agreement is performed by minimum 2% and maximum 45% of the firms. When
we take a look at the distribution of 146 firms claiming to perform at least one agreement126
;
“turn-key projects” comes in the first rank with 45% and it is followed by “purchasing of
engineering services” agreement with 42%, and “agreements on the determination of
product design and/or technical specifications” agreement with %39. The agreements which
are least performed by the firms are “international subcontracting agreements” (10%) and
“agreements on personnel exchange” (2%).
Table 5.15: Distribution of Surveyed Firms by Technology Agreements Performed
Source: Author calculations based on survey results
Notes: ***, **, * denote significance level at the 1%, 5% and 10%, respectively (chi-square, 2-sided).
Fisher’s Exact test has been used if one or more cells have an expected count ≤ 5.
Legend: LF (Local Firms); FF (Foreign Firms); DSF (Direct Supplier Firms); AF (All Firms).
† Confidentiality and various commercial agreements.
While the foreign firms mostly perform “purchasing of engineering services” agreements
(50%), local firms (45%) and direct suppliers (43%) perform “turn-key projects” agreements.
In addition, the foreign firms have higher rates than other firms for the 9 out of 11 agreement
types (excluding turn-key projects and management contracts). In particular, “agreements on
126
19 out of 165 surveyed firms stated that they didn’t make any agreements; therefore the number of the
examined firms is 146.
LF FF DSF AF
% % % %
Turn-key projects 45.10 43.18 42.75* 44.52
Purchasing of engineering services 39.22** 50** 41.99** 42.47
Agreements on the determination of product
design and/or technical specifications36.27* 45.45* 35.11 39.04
Technical assistance agreement 29.41* 38.64* 29.01 32.19
Licensing agreement 24.51*** 45.45*** 32.06*** 30.82
Purchasing of license and/or patent 27.45 31.82 25.95 28.77
Joint venture agreement 20.59*** 43.18*** 29.77*** 27.40
Know-how agreement 22.55 29.55 23.66 24.66
Management contracts 21.57 15.91 16.03 19.86
International subcontracting agreements 9.80 11.36 8.40 10.27
Agreements on personnel exchange 0.98* 4.55* 2.29 2.05
Others† 4.90 0 2.29 3.42
N 102 44 131 146
Technology agreements

202
“personnel exchange”, “joint venture”, “know-how”, and “technical assistance” concerning
the knowledge and technology acquisition and development are performed more by the
foreign firms.
A significant difference has been detected in terms of “purchasing of engineering services”
(at 5% level), “agreements on the determination of product design and/or technical
specifications” (at 10% level), “technical assistance agreement” (at 10% level), “licensing
agreement” (at 1% level), “joint-venture agreement” (at 1% level), and “agreements on
personnel exchange” (at 10% level) between local and foreign firms. A significant difference
has also been observed in terms of “turn-key projects” (at 10% level), “purchasing of
engineering services” (at 5% level), “licensing agreement” (at 1% level) and “joint-venture
agreement” (at 1% level) between the direct suppliers and non-direct suppliers (chi-square
test).
5.4.4. Sources of Technologies acquired by Firms
Table 5.16 shows the sources of the technologies acquired and/or used by the firms.
Accordingly, the firms acquire technology from more than one source and the most
important three sources are “domestic suppliers” (DS) with 50%, “overseas suppliers” (OS)
with 49% and “domestic automotive main manufacturers” (DAMM) with 47%, respectively.
“Overseas automotive main manufacturers” (OAMM), however, is in the fourth rank with
36%. These are followed by “private engineering and consultancy firms” (33%) and “parent
company” (PC)127
(27%), respectively. The firms specified “universities” (25%) in the last
rank as the source of the technologies acquired.
The major technology sources of the local, foreign and direct supplier firms are different.
The foreign firms specified “PC” in the first rank with 69% as the source of the
technologies acquired. Other important technology sources of the foreign firms are
“OS” (40%), “DAMM” and “OAMM” (each being 38%), respectively. The fact that the
foreign supplier firms in our country are the affiliates (subsidiaries) of the MNCs
results in the dependence on the parent companies for the technology sources. That
127
These are the firms located at domestic or overseas (abroad) and they directly or indirectly control all and any
commercial activities, management and/or capital structure of the supplier firms. A significant number of the
surveyed foreign suppliers consist of the subsidiaries (affiliates) of another foreign parent company located at
overseas. Local suppliers in this category are generally one of the group companies affiliated to a holding (see
section 4.7.7).

203
other most important technology sources of these foreign firms are “DAMM” and
“OAMM” might be resulting from the fact that they are the global suppliers of the
global AMMs.
The local firms specified the sources of the technologies acquired as “DS” with 58%,
“OS” with 52% and “DAMM” with 50% respectively. It can be deducted accordingly
that local firms make more cooperation with their suppliers (second or low level-tier
suppliers) for technology acquisition and try to acquire these technologies particularly
through the purchase of new machinery-equipment etc.
The direct suppliers specified “DAMM” with 52% in the first rank as the source of the
technologies they acquired (the firms who specified “DAMM” the most are direct
suppliers). This can be interpreted as the cooperation between the direct suppliers and
DAMM is high and technology transfer is conducted. On the other hand, that the 52%
of the direct suppliers specified “DAMM” as the source of the technology they
acquired does not mean the dependence of the supply industry on the external sources
for the technology acquisition is low. Because an important number of the DAMM is
MNC affiliates operating in Turkey (see Appendix J). The transfer of technology from
these firms to the supplier firms doesn’t mean that they have lost the monopoly of the
technology they have. Furthermore, it’s a very significant whether direct suppliers will
be able to eliminate the current dependency by using the transferred technologies yet it
is out of this dissertation’s scope.
Table 5.16: Distribution of Surveyed Firms by Technology Sources
Source: Author calculations based on survey results
Notes: ***, **, * denote significance level at the 1%, 5% and 10%, respectively (chi-square, 2-sided).
Fisher’s Exact test has been used if one or more cells have an expected count ≤ 5.
Legend: LF (Local Firms); FF (Foreign Firms); DSF (Direct Supplier Firms); AF (All Firms); DS
(Domestic Suppliers); OS (Overseas Suppliers); DAMM (Domestic Automotive Main
Manufacturers); OAMM (Overseas Automotive Main Manufacturers); PC (Parent Company)
LF FF DSF AF
% % % %
DS 57.5*** 28.89*** 49.24 49.70
OS 51.67 40 43.18*** 48.48
DAMM 50 37.78 52.27*** 46.67
OAMM 35.83 37.78 36.36 36.36
Private engineering and consultancy firms 34.17 31.11 37.12** 33.33
PC 10.83*** 68.89*** 29.55* 26.67
Universities 24.17 28.89 25 25.45
N 120 45 132 165
Technology Sources
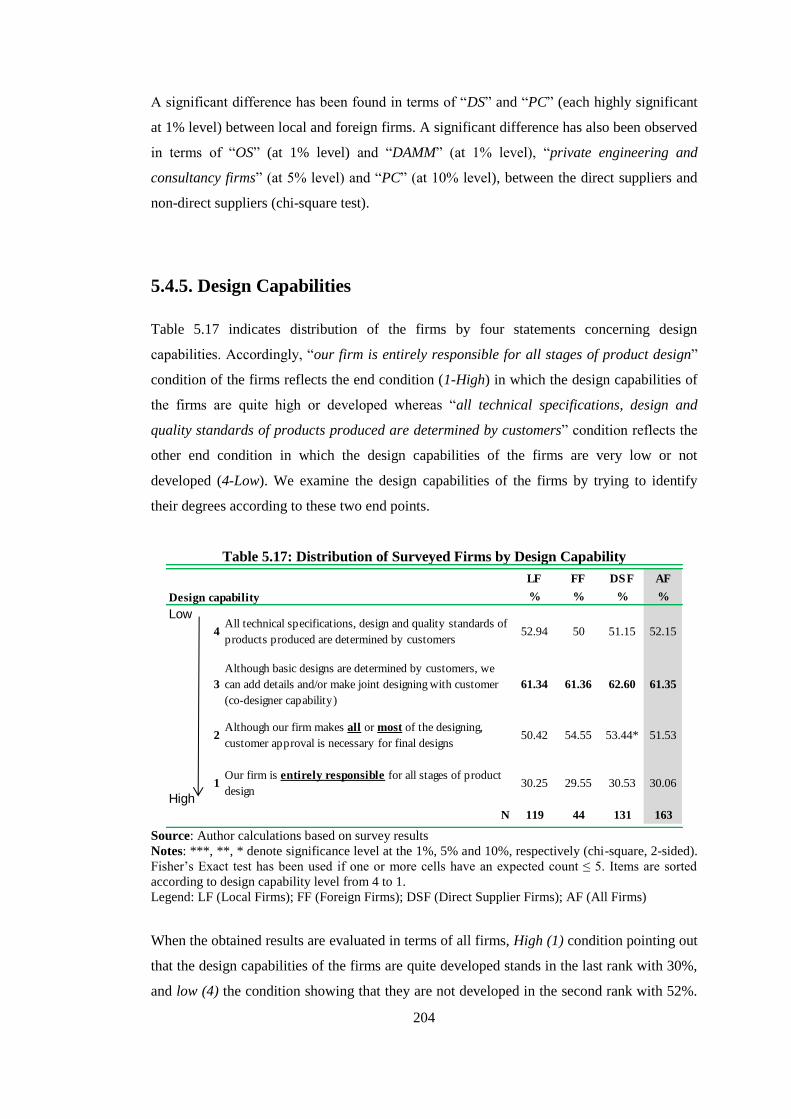
204
A significant difference has been found in terms of “DS” and “PC” (each highly significant
at 1% level) between local and foreign firms. A significant difference has also been observed
in terms of “OS” (at 1% level) and “DAMM” (at 1% level), “private engineering and
consultancy firms” (at 5% level) and “PC” (at 10% level), between the direct suppliers and
non-direct suppliers (chi-square test).
5.4.5. Design Capabilities
Table 5.17 indicates distribution of the firms by four statements concerning design
capabilities. Accordingly, “our firm is entirely responsible for all stages of product design”
condition of the firms reflects the end condition (1-High) in which the design capabilities of
the firms are quite high or developed whereas “all technical specifications, design and
quality standards of products produced are determined by customers” condition reflects the
other end condition in which the design capabilities of the firms are very low or not
developed (4-Low). We examine the design capabilities of the firms by trying to identify
their degrees according to these two end points.
Table 5.17: Distribution of Surveyed Firms by Design Capability
Source: Author calculations based on survey results
Notes: ***, **, * denote significance level at the 1%, 5% and 10%, respectively (chi-square, 2-sided).
Fisher’s Exact test has been used if one or more cells have an expected count ≤ 5. Items are sorted
according to design capability level from 4 to 1.
Legend: LF (Local Firms); FF (Foreign Firms); DSF (Direct Supplier Firms); AF (All Firms)
When the obtained results are evaluated in terms of all firms, High (1) condition pointing out
that the design capabilities of the firms are quite developed stands in the last rank with 30%,
and low (4) the condition showing that they are not developed in the second rank with 52%.
LF FF DSF AF
Design capability % % % %
Low
4All technical specifications, design and quality standards of
products produced are determined by customers 52.94 50 51.15 52.15
3
Although basic designs are determined by customers, we
can add details and/or make joint designing with customer
(co-designer capability)
61.34 61.36 62.60 61.35
2Although our firm makes all or most of the designing,
customer approval is necessary for final designs50.42 54.55 53.44* 51.53
High
1Our firm is entirely responsible for all stages of product
design30.25 29.55 30.53 30.06
N 119 44 131 163
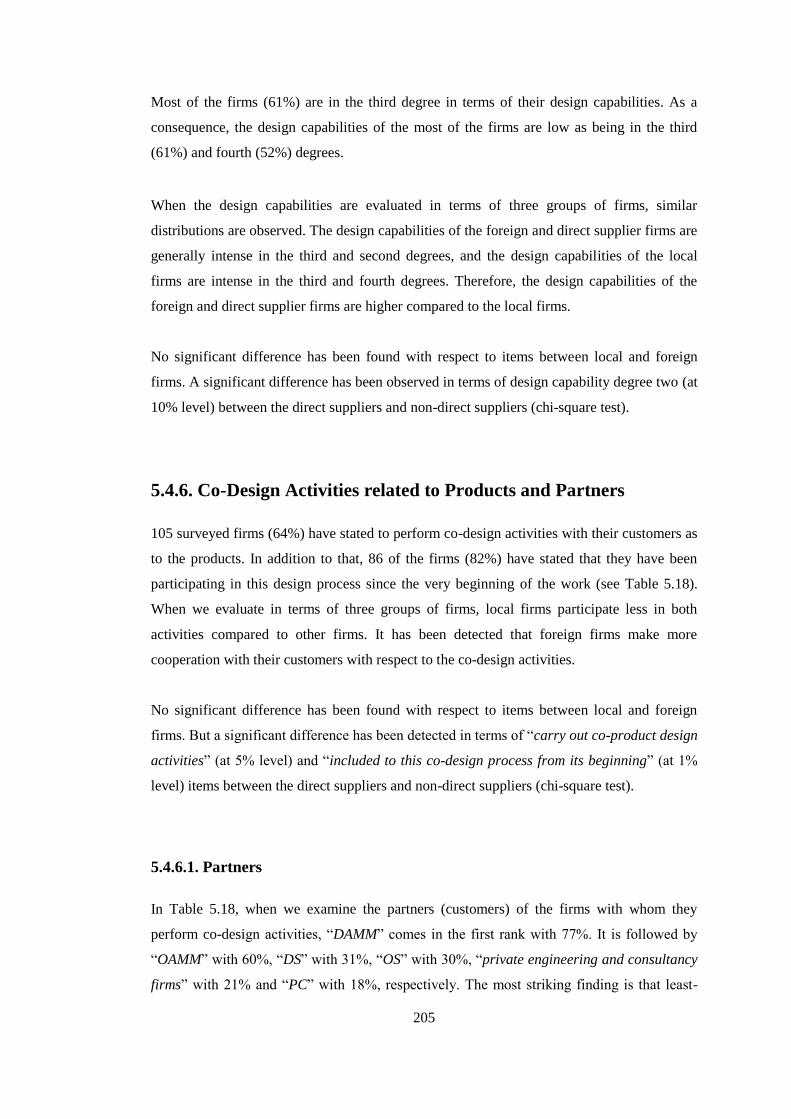
205
Most of the firms (61%) are in the third degree in terms of their design capabilities. As a
consequence, the design capabilities of the most of the firms are low as being in the third
(61%) and fourth (52%) degrees.
When the design capabilities are evaluated in terms of three groups of firms, similar
distributions are observed. The design capabilities of the foreign and direct supplier firms are
generally intense in the third and second degrees, and the design capabilities of the local
firms are intense in the third and fourth degrees. Therefore, the design capabilities of the
foreign and direct supplier firms are higher compared to the local firms.
No significant difference has been found with respect to items between local and foreign
firms. A significant difference has been observed in terms of design capability degree two (at
10% level) between the direct suppliers and non-direct suppliers (chi-square test).
5.4.6. Co-Design Activities related to Products and Partners
105 surveyed firms (64%) have stated to perform co-design activities with their customers as
to the products. In addition to that, 86 of the firms (82%) have stated that they have been
participating in this design process since the very beginning of the work (see Table 5.18).
When we evaluate in terms of three groups of firms, local firms participate less in both
activities compared to other firms. It has been detected that foreign firms make more
cooperation with their customers with respect to the co-design activities.
No significant difference has been found with respect to items between local and foreign
firms. But a significant difference has been detected in terms of “carry out co-product design
activities” (at 5% level) and “included to this co-design process from its beginning” (at 1%
level) items between the direct suppliers and non-direct suppliers (chi-square test).
5.4.6.1. Partners
In Table 5.18, when we examine the partners (customers) of the firms with whom they
perform co-design activities, “DAMM” comes in the first rank with 77%. It is followed by
“OAMM” with 60%, “DS” with 31%, “OS” with 30%, “private engineering and consultancy
firms” with 21% and “PC” with 18%, respectively. The most striking finding is that least-

206
cooperated partner is “universities” (10%). The data acquired hereunder match with the data
obtained in the previous section (see section 5.4.4) under the title of technology sources.
Table 5.18: Co-Design Activities related to Products and Partners of Surveyed Firms
Source: Author calculations based on survey results
Notes: ***, **, * denote significance level at the 1%, 5% and 10%, respectively (chi-square, 2-sided).
Fisher’s Exact test has been used if one or more cells have an expected count ≤ 5. The first two items
do not add up to 100% because the questionnaire included further categories called “No”, but have not
been identified in table. However, information on these categories can be obtained by subtracting the
stated proportion from 100%. The partners are arranged by all fırms.
Legend: LF (Local Firms); FF (Foreign Firms); DSF (Direct Supplier Firms); AF (All Firms); DS
(Domestic Suppliers); OS (Overseas Suppliers); DAMM (Domestic Automotive Main
Manufacturers); OAMM (Overseas Automotive Main Manufacturers); PC (Parent Company)
When the partners performing co-design activities are examined in terms of three groups of
firms, similar distributions are observed. An important discovery is that foreign firms (52%)
perform high amount of co-design activities with their parent companies compared to other
firms. The foreign firms also perform high amount of co-design activities with “OAMM”
(60%) and “OS” (30%). 87% of the direct suppliers designated “DAMM” in the first rank as
the cooperated partner. This shows that the level of cooperation between the AMMs and
their suppliers pertaining to joint product development activities is high. As it might be seen
in the table, another important finding is that the rate of the foreign firms who specified
cooperation with the “universities” (3%) and “private engineering and consultancy firms”
(10%) in Turkey is very low compared to both local and direct suppliers.
In summary, the most important partner of the firms with whom co-design activities are
performed is generally AMMs in domestic or overseas (since DAMM in the first rank and it
is followed by OAMM).
LF FF DSF AF LF FF DSF
% % % % N N N
Carry out co-design activities related to
products - YES (105 firms)61.67 68.89 68.94** 63.64 120 45 132
Firm is included to this co-design process
from its beginning - YES (86 firms)78.38 90.32 86.67*** 81.90 74 31 90
The Partners
DAMM 78.38 74.19 86.67*** 77.14
OAMM 58.11 64.52 63.33** 60
DS 32.43 29.03 27.78 31.43
OS 29.73 32.26 30 30.48
Private engineering and consultancy firms 25.68 9.68 22.22 20.95
PC 4.05*** 51.61*** 21.11* 18.10
Universities 13.51 3.23 10 10.48
N 74 31 90 105

207
The difference between the rate of the positive answers to the questions including a
statement concerning co-designer capability of the firms in Tables 5.17 and 5.18 (in order of
61.35% as third degree in Table 5.17 and 63.64% for carrying out co-design activities in
Table 5.18) and the rate of the positive answers to the “frequently” option of the question
“joint design activity related to product” in Table 5.6 (14.63%) is very striking. There might
be two significant reasons for the firms to give different answers to two similar questions.
Firstly, the questions in Table 5.6 are for understanding to what extent the assistance
provided by the customers to the supplier firms regarding the product-related KTTs
concerns “joint product design”. Yet the questions in Table 5.17 and 5.18 are for
detecting the design capabilities of the supplier firms and intended for understanding
the contribution of the customers (here, execution of the design entirely by the
supplier firms and the determination of anything for the design by the customer are
two different end points.) Participation in joint product design activity is only an
intermediate stage. Therefore, the issues highlighted by two questions and the answers
given might be different.
Secondly, when “frequently” and “rarely” options in the answers of “joint design
activity related to product” question in Table 5.6 are examined together, the rate of
giving positive answer is about 70%. This rate is closer to the rates in Tables
5.17/5.18. At the same time, if we evaluate these two questions in Table 5.6 and
Tables 5.17/5.18 together, we can interpret the high rate of positive answers in the last
two tables as many firms do not conduct the co-design activities with the customers
regularly. Due to these two reasons, we do not think that this means the firms gave
different answers to two similar questions.
A highly significant difference has been detected in terms of “PC” item at 1% level between
local and foreign firms. A significant difference has also been detected in terms of “DAMM”
(at 1% level), “OAMM” (at 5% level) and “PC” (at 10% level) between the direct suppliers
and non-direct suppliers (chi-square test).

208
5.5. Supply Chain
5.5.1. Management Structure and MNCs among Clients
The answers given by the firms to three different questions concerning management
structures are presented in Table 5.19. Accordingly, 77% of the foreign firms are a part of
the MNCs, and they are the subsidiaries (affiliates) of any overseas (84%) and domestic
(39%) firm/group/holding, respectively. That the rate of being a subsidiary of an overseas
and domestic firm/group/holding exceeds 100% for the foreign firms is because some
foreign firms are “joint-ventures” and therefore dependent on both domestic and overseas
parent companies. This finding confirms our expectations that majority of the foreign firms
in the Turkish automotive industry are the subsidiaries of MNCs. On the other hand, only
36% of the local firms are the subsidiaries of a domestic firm/group/holding. When we
evaluate the table in terms of direct suppliers, it is observed that 42% and 25% of the firms
are the subsidiaries of the domestic and overseas firms/groups/holdings, respectively; and
23% are a part of the MNCs. Moreover, according to Table 5.19, 140 of the firms (86%)
stated that there are MNCs among their clients (93% for FF, 83% for LF and 87% for DSF)
(significant at 10% level between local and foreign firms). This situation is very important
because it indicates that survey firms are a part of global production networks and also very
capable to produce for MNCs.
Table 5.19: Distribution of Surveyed Firms by Management Structure
and MNCs among Clients
Source: Author calculations based on survey results
Notes: ***, **, * denote significance level at the 1%, 5% and 10%, respectively (chi-square, 2-sided).
Fisher’s Exact test has been used if one or more cells have an expected count ≤ 5. The items do not
add up to 100% because the questionnaire included a further category called “No”, but have not been
identified in table. However, information on these categories can be obtained by subtracting the stated
proportion from 100%.
Legend: LF (Local Firms); FF (Foreign Firms); DSF (Direct Supplier Firms); AF (All Firms)
LF FF DSF AF LF FF DSF
% % % % N N N
Are there MNCs among your customers? 83.19* 93.18* 87.02 85.89 119 44 131
Is your firm a subsidiary (affiliate) firm
dependent on any domestic firm/group/holding? 35.83 38.64 41.99*** 36.59 120 44 131
Is your firm a subsidiary (affiliate) firm
dependent on any overseas firm/group/holding?0*** 84.09*** 25.19* 22.56 120 44 131
Is your firm part of a MNC? 0*** 76.74*** 23.08 20.86 120 43 130
YES

209
A highly significant difference has been detected in terms of being a part of MNC and being
a subsidiary firm dependent on any overseas firm/group/holding (at 1% level) between local
and foreign firms. A significant difference has also been found in terms of being a subsidiary
firm dependent on any domestic (at 1% level) and overseas (at 10% level)
firm/group/holding between the direct suppliers and non-direct suppliers (chi-square test).
5.5.2. Main Customers of Surveyed Firms
Table 5.20 displays the distribution of surveyed firms according to their main customers. In
the calculation of main customers, distribution of each firm’s total sales according to their
customers was analyzed by one by, and we defined the customer as a main customer if firms
carry out highest share of their total sales to this customer. According to this, 133 firms
(83%) carry out more than 50% of their total sales to only one customer, while the rest 28
firms (17%) carry out most of their total sales to only one customer in various rates between
minimum 30% and maximum 45%.
Table 5.20: Distribution of Surveyed Firms by Main Customers (%)
Source: Author calculations based on survey results
Legend: LF (Local Firms); FF (Foreign Firms); DSF (Direct Supplier Firms); AF (All Firms); DAMM
(Domestic Automotive Main Manufacturers); OAMM (Overseas Automotive Main Manufacturers);
DS (Domestic Suppliers); OS (Overseas Suppliers); PC (Parent Company); OC (Other Customers)
†Other affiliates of parent company and retailers.
Table 5.20 presents that main customers of surveyed firms are generally AMMs, 65% of the
firms sell their products mainly to “DAMM” (46%) and “OAMM” (19%), respectively. The
next main customers of the firms are higher level-tier suppliers128
in automotive industry,
23% of the firms sell their products mainly to “DS” (12%) and “OS” (11%). Therefore, the
main customers of the firms are DAMM, OAMM, DS, OS and PC, respectively.
128
Higher level-tier suppliers can be DS or OS. As explained in section 4.7, these firms are the suppliers of
AMMs and operate in the automotive industry. If a surveyed firm’s main customer is DS or OS, this means that
surveyed firm is a low-tier supplier depends on the tier of this DS or OS. i.e. if DS is a 1st-tier supplier of any
automotive manufacturer then supplier of this DS is 2nd-tier supplier.
LF FF DSF AF
117 44 129 161
DAMM 47.86 40.91 54.26 45.96
OAMM 11.97 36.36 18.60 18.63
DS 13.68 9.09 8.53 12.42
OS 12.82 4.55 9.30 10.56
PC 2.56 4.55 3.10 3.11
OC† 11.11 4.55 6.20 9.32
Total 100 100 100 100
Main Customers N

210
Main customers of the 60% of the local firms (117 firms) are AMMs (48% for DAMM, 12%
for OAMM), and 27% are other higher level-tier suppliers (14% for DS and 13% for OS). On
the other hand, 77% of the foreign firms (44 firms) carry out most of their sales to AMMs
(41% for DAMM, 36% for OAMM), and 14% to other suppliers (9% for DS and 5% for OS).
Therefore, foreign firms carry out their production mainly to AMMs than both direct
suppliers (73%) and local counterparts (60%) do. This situation can be interpreted that
foreign firms are the global suppliers of AMMs and they are more capable than both direct
suppliers and local counterparts to produce for these firms. In addition, main customers of
the 36% of foreign firms are “OAMM” so that this confirms our comments and also
correspond to our findings related to more export-orientation of foreign firms because it is
assumed that technological capability is very important to produce for AMMs and especially
for OAMM since global markets are more competitive (see sections 5.1.5, 5.1.6, 5.3, 5.4 and
5.8.3). In terms of direct suppliers (129 firms), main customers of 73% are AMM as
expected (54% for DAMM and 19% for OAMM) and main customers of 18% are other
higher level-tier suppliers (9% for OS and 9% for DS). On the other hand, parent companies
are the main customers of 3% of the firms (5% for FF and 3% for both DSF and LF).
When we evaluate the first four groups of main customers (DAMM, OAMM, DS and OS)
together as a main customer and called to this group automotive industry, we determine that
91% of foreign firms and 87% of local firms sell mainly to this industry. In summary, these
statistics show that major customers of the firms are in the automotive industry. Furthermore,
this confirms our expectations related to analysis that major customers of the firms are
AMMs, in other means, these findings indicate that most of the firms in the sample are first-
tier suppliers (or direct suppliers) of AMMs since majority of the firms carry out their total
sales to only one customer. The share of the firms that their main customers are “OAMM”
and “OS” is 29% in all firms, and this rate is not so much different than the firm rate for
exporting more than 50% of their sales (30%) in Table 5.3.
In addition, the statistics related to main customers of the firms according to their origin
(Table 5.21) and ownership status (Table 5.22) can be also seen in the following Tables. The
most striking finding in terms of foreign ownership status is that major customers of the full
foreign ownership firms are “OAMM” whereas those of joint venture ownership firms are
“DAMM”.

211
Table 5.21: Main Customers of Surveyed Firms by Origin of Foreign Capital
Source: Author calculations based on survey results
Legend: DAMM (Domestic Automotive Main Manufacturers); OAMM (Overseas Automotive Main
Manufacturers); DS (Domestic Suppliers); OS (Overseas Suppliers); PC (Parent Company); OC
(Other Customers)
δ England (2), Belgium (2), S. Korea, Taiwan, India, Hungary, Finland and Switzerland
† Other affiliates of parent company and retailers
Table 5.22: Main Customers of Surveyed Firms by Foreign Ownership
Source: Author calculations based on survey results
Legend: DAMM (Domestic Automotive Main Manufacturers); OAMM (Overseas Automotive Main
Manufacturers); DS (Domestic Suppliers); OS (Overseas Suppliers); PC (Parent Company); OC
(Other Customers)
† Other affiliates of parent company and retailers
5.5.3. Primary Sources of the Inputs
The firms were asked to prioritize the primary sources of the inputs (raw material and/or
intermediate good)129
used in the production of the major products (1>2>3>4>5).
Accordingly, the primary input sources of the surveyed firms according to the first three
degrees of importance are shown in Table 5.23.
129
Raw material: Rubber, plastic, sponge, steel, aluminium, etc.; Intermediate goods: Various parts and
components that previously produced and used in the production of another good.
DAMM 56 4 1 2 2 2 2 5 74 46
OAMM 14 5 4 2 1 1 1 2 30 19
DS 16 1 0 0 1 1 0 1 20 12
OS 15 0 0 1 0 0 0 1 17 11
PC 3 2 0 0 0 0 0 0 5 3
OC† 13 0 1 0 0 0 0 1 15 9
N 117 12 6 5 4 4 3 10 161
% 72.67 7.45 3.73 3.11 2.48 2.48 1.86 6.21 100
N %Main Customers
Local
Origin
Germany USA France Japan Italy Spain Otherδ
DAMM 56 1 12 1 4 74 46
OAMM 14 0 3 2 11 30 19
DS 16 2 0 0 2 20 12
OS 15 0 0 1 1 17 11
PC 3 0 0 0 2 5 3
OC† 13 0 1 0 1 15 9
N 117 3 16 4 21 161
% 72.67 1.86 9.94 2.48 13.04 100
Main CustomersN %
Ownership Status
LocalMinority
Ownership
Joint
Venture
Majority
Ownership
Full
Ownership

212
Table 5.23: Distribution of the Surveyed Firms according to Primary Sources of Inputs
by Importance Degree (%)
Source: Author calculations based on survey results
Notes: ***, **, * denote significance level at the 1%, 5% and 10%, respectively (Mann-Whitney U
test, 2-sided). Legend: LF (Local Firms); FF (Foreign Firms); DSF (Direct Supplier Firms); AF (All
Firms); DS (Domestic Suppliers); OS (Overseas Suppliers); DAMM (Domestic Automotive Main
Manufacturers); PC (Parent Company); OAMM (Overseas Automotive Main Manufacturers)
†Other affiliates of parent company, licensor firm and various machine manufacturers.
At each degree, almost same distributions are observed in terms of three groups of firms.
When the first degree sources are examined, “DS” comes in the first rank with 57% and
“OS” with 31% in the second rank. This indicates that the most important input sources of
88% of the surveyed firms are domestic and overseas other low-tier supplier firms. In
addition to that, while 10% of the local firms specified “DAMM” in the first rank as the
primary source, the 9% of the foreign firms designated “PC” for the same. There was no
firm to specify “OAMM” firms as the first degree primary input source. When the second
degree sources are examined, “OS” comes in the first rank with 51% and “DS” with 33% in
the second rank. The total amount of both input sources is 84%, and the most important input
sources in the second degree are domestic and overseas supplier firms130
. An important
detection here is that 7% of the firms (each being nearly 7% for three group of firms)
specified “OAMM” as the most important input source.
In sum, the most important two input sources of the firms are “DS” and “OS”, and as the
third source, they are followed by “DAMM” for the local firms and “PC” for the foreign
firms. That the “DAMM” provided input for the supplier firms might be pointing out a
cooperation covering KTT between these firms. However, the main purpose of this input
transfer might rather be non-interruption of routine production activities and it may not
include any significant knowledge and technology.
130
This situation shows us that the firms that chose DS (OS) in the first degree chose OS (DS) in the second
degree.
Input LF FF DSF AF LF FF DSF AF LF FF DSF AF
Sources N 116 44 126 160 98 44 117 142 39 29 61 68
DS 56.03 59.09 56.35* 56.88 34.69 29.55 34.19* 33.10 7.69 10.34 8.20* 8.82
OS 31.03 29.55 30.95 30.63 51.02 50 49.57 50.70 12.82 10.34 11.48 11.76
DAMM 10.34 2.27 7.94** 8.13 5.10 0 4.27** 3.52 33.33 13.79 26.23** 25
PC 0*** 9.09*** 3.17** 2.50 2.04*** 11.36*** 4.27** 4.93 15.38*** 51.72*** 34.43** 30.88
OAMM 0* 0* 0** 0 7.14* 6.82* 6.84** 7.04 5.13* 0* 3.28** 2.94
Other† 1.72*** 0*** 1.59*** 1.25 0*** 2.27*** 0.85*** 0.70 20.51*** 13.79*** 16.39*** 17.65
Total 100 100 100 100 100 100 100 100 100 100 100 100
1st 2nd 3rd
Degree of Importance

213
A significant difference has been observed in terms of “PC” (at 1% level), “OAMM” (at 10%
level) and “other” (at 1% level) between local and foreign firms. There is also a significant
difference in terms of “DS” (at 10% level), “DAMM” (at 5% level), “PC” (at 5% level),
“OAMM” (at 5% level) and “other” (at 1% level) between the direct suppliers and non-direct
suppliers (Mann-Whitney U test).
Figure 5.1 displays also the distribution of the primary input sources of the surveyed firms
based on their main customers (see sections 5.5.2 and 5.5.3). According to this, major input
source of the firms is domestic suppliers (DS) regardless of their main customers. Nearly
60% of the firms receive their inputs from “DS”, and it is followed by overseas suppliers
(OS). The firms that their main customers are “OS” use only two input sources: “DS” (59%)
and “OS” (41%), respectively. Moreover, it is seen that firms also receive their inputs from
“DAMM”. The 11% of the firms that their main customers are “DAMM” receive their inputs
from “DAMM”. This rate is also 10% for the firms that their main customers are “DS”. In
summary, these show that the primary input sources of the firms are “DS”, “OS” and
“DAMM”, respectively. Moreover, it shows that the firms that their major main customers
are DAMM (11%), DS (10%), and OAMM (3%) respectively are being supplied by DAMM.
Figure 5.1: Primary Input Sources of the Suppliers based on Main Customers
Source: Author calculations based on survey results
Legend: DAMM (Domestic Automotive Main Manufacturers); OAMM (Overseas Automotive Main
Manufacturers); DS (Domestic Suppliers); OS (Overseas Suppliers); Other (Parent Company and
other firms)

214
5.5.4. Purchasing Strategies of Customers (being the sole supplier of
the customer)
The firms were asked to specify the purchasing strategies of their most important customers
(being mainly AMMs, see section 5.5.2). They were asked if the customers preferred to work
with only one supplier or more suppliers per item purchased. According to Table 5.24, 49%
of the foreign firms and 38% of the local firms stated that their customers preferred to work
with only one supplier (not significant, chi-square test). These firms thus become the sole
supplier of their most important customers, as well.
Table 5.24: Some Indicators of Surveyed Firms in terms of their Customers
Source: Author calculations based on survey results
Notes: ***, **, * denote significance level at the 1%, 5% and 10%, respectively (chi-square, 2-sided
for 1st item, and two independent samples t-test, 2-sided for 2
nd and 3
rd items). Fisher’s Exact test has
been used if one or more cells have an expected count ≤ 5. The first item does not add up to 100%
because the questionnaire included a further category called “customer prefers to study with many
suppliers per item purchased”, but has not been identified in table. However, information on this
category can be obtained by subtracting the stated proportion from 100%. The min and max values for
2nd item are 1 and 55, 0% and 100% for 3rd item.
Legend: LF (Local Firms); FF (Foreign Firms); DSF (Direct Supplier Firms); AF (All Firms)
The customers attach so much importance to the production and technological capabilities of
their suppliers (manufacturing, quality, engineering, design, just-in-time, defect rate, cost
etc.), therefore it's very important to be the sole supplier of the customers in one product
group when it's considered that a slightest fault in the supply process will cause the
production line to come to a halt. In terms of sole supplier firms, being the sole supplier of
the customer in one group of product also shows that:
The level of cooperation with the customers for the products is very high,
The supplier firm makes high technology production in the field and has high
technology capabilities,
When the number of supplier firms operating in domestic and overseas markets and
high level of competition is taken into account, the supplier firm has superiority as to
the product or this product has no alternatives.
LF FF DSF AF LF FF DSF
N N N
Customer prefers to study with only one
supplier per item purchased (%)38.46 48.89 43.85 41.36 117 45 130
Duration of working together with the most-
intensive cooperated customer (year)18.12 15.80 18.59 17.48 118 45 131
Share of Subcontracting Contracts in Total
Contracts (%)13.17 9.45 12.16 12.17 113 42 125
Mean

215
Working with only one supplier might have the following reasons in terms of the customers:
The desire to procure the product from the cooperated supplier firm who was also
assisted in the product development,
Purchasing the product with lower prices by means of procuring it from a sole supplier
instead of dividing it among more than one supplier firms (reduction in the supplier's
costs due to the economies of scale),
The product to be procured requires a high cooperation with the supplier firm since
being a strategic or new product and customers desire to keep the related technologies
confidential.
Because of these reasons, it's seen very important to be the sole supplier of the customers in
one product group supplied.
5.6. Cooperation
5.6.1. The Motivations for Cooperation Activities with other Firms
(Why do suppliers cooperate with other firms?)
The firms were asked to evaluate the motivations for cooperating with other firms on a five-
point Likert scale ranging from 1 (very unimportant) to 5 (very important). When the items
are examined individually, the median of eight out of nine items is obtained as 4 and the
median of only one is 3. Furthermore, the lowest mean is 2.95 (know-how transfer) and the
highest mean is 3.95 (improving product quality). Therefore, the items evaluated at the level
of 4 or 5 were handled in “important” category (4≥), the items evaluated at the level of 3 in
“neither important nor unimportant” category (=3) and the items evaluated at the level of 1
or 2 were handled in “unimportant” category. Table 5.25 shows the distribution of the firms
whose answers for the items were in “important” category (4≥).
As it can be seen from the Table 5.24 in the previous section, the mean duration of the
working together with the most intense cooperated customer is higher for the direct supplier
firms (nearly 19 years) than foreign (18 years) and local firms (16 years). This confirms that
direct suppliers conducted more collaborative relationships with AMMs, and also mutual
trust is very important in buyer–supplier relationships.

216
Table 5.25: Why do Surveyed Firms Cooperate with Other Firms?
Source: Author calculations based on survey results
Notes: ***, **, * denote significance level at the 1%, 5% and 10%, respectively (Mann-Whitney U test, 2-
sided). The items do not add up to 100% because the questionnaire included further categories called “1–
Very unimportant, 2-Unimportant, 3-Neither important nor unimportant”, but have not been identified in
table. 4≥: Responses indicating the degree of importance as being “important” (4) or “very important” (5)
are presented here. Legend: LF (Local Firms); FF (Foreign Firms); DSF (Direct Supplier Firms); AF (All
Firms)
When we examine the items in terms of all firms, the first three items are considered
important by at least 70% of the firms. These are respectively “improving product quality”
(79%), “learning about new technologies” (71%) and “opening up global markets” (71%).
Other items were evaluated as important by at least 48% (know-how transfer) and maximum
68% (entering new technology fields) of the firms. In addition, similar distribution in terms
of three groups of the firms is observed.
One of the most important detections in terms of KTT is that although 49% of the firms
specified “know-how transfer” item as important as the motivation for cooperation, this item
is the last in ranking when other items are considered131
. This relatively low rate can be
explained in two different ways:
i. The “know-how transfer” made to the supplier firms to improve the product quality
was covered in the first option in Table 5.25 by these firms, but not covered in
“know-how transfer” option,
ii. If the “know-how transfer” option in the table is concerned more with the KTT for
the production process, we can explain why other options in the table are dominant
by taking into consideration a generally-accepted detection suggesting that
production capability in Turkish automotive supply industry is more advanced
compared to the design and innovation capability.
131
In other words, the rate of the firms considering “know-how transfer” as “unimportant” (1 and 2 points) is in
the first rank with 32%.
LF FF DSF AF LF FF DSF
% % % % N N N
Improving product quality 4≥ 79.17 77.78 79.55 78.79 120 45 132
Learning about new technologies 4≥ 75** 60** 71.97 70.91 120 45 132
Opening up global markets 4≥ 73.33* 64.44* 71.97 70.91 120 45 132
Entering new technology fields 4≥ 74.17* 53.33* 67.42 68.48 120 45 132
Reducing/sharing production costs/risks 4≥ 65.83 53.33 63.64 62.42 120 45 132
Carrying out R&D activities 4≥ 60.83 46.67 56.82 56.97 120 45 132
Establishing long-term strategic partnership 4≥ 52.50 62.22 54.55 55.15 120 45 132
Replacing technologically phased out products
with the new ones 4≥ 54.17 44.44 53.03 51.52 120 45 132
Know-how transfer 4≥ 50.83 42.22 50.76 48.48 120 45 132
Important

217
We can assess the items affecting the cooperation of the firms with the other firms as
follows:
The design capabilities of the firms must be developed for “improving product
quality” item; the fact that firms specify this in the first rank as the item affecting
cooperation might be an indicator of their design capabilities.
“Learning about new technologies” and “entering new technology fields” might be an
indicator of an attempt to access the explicit/tacit technologies that cannot be sold in
the domestic market or the world market or, even if it was sold, couldn’t be used
efficiently by the supplier firms due to the complexity by means of establishing
relations with the AMMs.
“Opening up global markets” and “reducing/sharing production costs/risks” might
indicate that supplier firms avoid the risks of specific markets and try to benefit from
the scale economies.
“Carrying out R&D activities” is a very costly process besides requiring knowledge.
In addition to that, it may require taking technical support from one firm or many
firms due to embodying commercial and technical risks. Furthermore, when a
new/improved product was released if it has a buyer, such risks will be reduced and
supplier firms will be prompted to decide for implementing R&D activities with other
firms. “Establishing long-term strategic partnership” target may be evaluated in the
same context.
“Replacing technologically phased out products with the new ones”, on the other
hand, might indicate that the firms can not anymore compete in the market with these
products and look for a new/improved product.
A significant difference has been detected in terms of “learning about new technologies” (at
5% level), “opening up global markets” (at 10% level) and “entering new technology fields”
(at 10% level) items between local and foreign firms. But between the direct suppliers and
non-direct suppliers no significant difference has been found with regard to the items (Mann-
Whitney U test).

218
5.6.2. Improvements in Production Capability as a result of
Assistances132
received from Customers
In this section, improvements in the production capability of the surveyed firms as a result of
KTTs from customers will be used as a proxy for the performance increases in the
production capability of the supplier firms.
The firms were asked to evaluate what kind of improvement (increase) and/or deterioration
(decrease) had been caused in certain fields by the assistances provided by their customers
for the last three years on a five-point Likert scale ranging from 1 (very decreased) to 5 (very
increased). When the items are examined individually, the median of six out of ten items is
4, the median of the remaining is 3, the lowest mean is 2.57 (profitability) and the highest
mean is 3.67 (improvement in quality control methods). Therefore, the items evaluated at the
level of 4 or 5 were handled in “increased” category (4≥), the items evaluated at the level of
3 in “neither increased nor decreased” category (=3) and the items evaluated at the level of
1 or 2 were handled in “decreased” category. Table 5.26 below shows the distribution of the
firms whose answers for the items were in “increased” category (4≥).
The ranking concerning items in terms of three groups of firms shows similarity. The rate of
the firms who specified there had been an increase on six out of ten items is minimum 51%.
The most important item which was specified to provide increase as a result of customers’
assistances is “improvement in quality control methods” item with 73%. It is followed by
“improve production process and/or capability to find solutions for production problems”
with 68%. Other items were specified as “increased” by minimum 23% and maximum 58%
of the firms. The two items with minimum increase are “reach to lower output prices” (38%)
and “profitability” (23%) items. That the rate of the firms which specified that the
assistances provided by the customers increased “profitability” item is in the last rank133
may
indicate that some firms were not able to use these assistances efficiently in short term or had
to make additional investments.
Local firms stated that greater increase was achieved in all the items except for the last two
items (reach to lower output prices and profitability) compared to other firms. The reason
behind this is local firms are affected more positively by these assistances rather than the
132
The implied meaning of the “assistance” is every help such as providing technical support – training – advice
- KTT etc. 133
In other means, the rate of the firms which specified the “profitability” item as “decreased” category (1 and 2
points) is in the first rank with 25%.

219
other firms not being capable of absorbing these assistances (the local firms are assumed to
have less-developed technology and capability levels compared to other firms, see section
5.1.6). This is also confirmed by the fact that other two groups of the firms (FF and DSF)
have higher rates than the local firms in the last two items.
Table 5.26: Improvements in Various Fields as a result of Assistances
received from Customers (For the last 3-years)
Source: Author calculations based on survey results
Notes: ***, **, * denote significance level at the 1%, 5% and 10%, respectively (Mann-Whitney U
test, 2-sided). The items do not add up to 100% because the questionnaire included further categories
called “1–Very decreased, 2-Decreased, 3-Neither increased nor decreased”, but have not been
identified in table. 4≥: Responses indicating the degree of improvements as being “increased” (4) or
“very increased” (5) are presented here.
Legend: LF (Local Firms); FF (Foreign Firms); DSF (Direct Supplier Firms); AF (All Firms)
The rate of the firms indicating “decreased” (1 or 2 points) for the other nine items except
“profitability” (25%) item is ranging from 5% to 7% though this is not evaluated in the table.
The negative effect of the assistances (regarding KTT) on the firms may have been a result
of the subjective evaluations not reflecting the truth or imply that some supplier firms lack
the capability of absorbing the assistances conveyed by the customers or the cooperated
customer is quite selective when providing the assistance.
A significant difference has been detected in terms of “improvement in quality control
methods” (at 5% level), “engineering capability related to product” (at 10% level), “design
capability” (at 10% level), “learning about new technologies and production processes” (at
5% level), “productivity” (at 10% level) and “profitability” (at 10% level) items between
LF FF DSF AF LF FF DSF
% % % % N N N
Improvement in quality control methods 4≥ 77.5** 60** 71.21 72.73 120 45 132
Improve production process and/or capability to
find solutions for production problems 4≥ 71.67 60 70.45 68.48 120 45 132
Engineering capability related to product 4≥ 63.33* 44.44* 60.61** 58.18 120 45 132
Design capability (design new products and
processes) 4≥ 61.67* 42.22* 59.85** 56.36 120 45 132
Learning about new technologies and production
processes 4≥ 60** 42.22** 56.06 55.15 120 45 132
Productivity 4≥ 57.5* 35.56* 53.79 51.52 120 45 132
Improvement in business management 4≥ 47.50 33.33 40.15 43.64 120 45 132
Performance on export 4≥ 45.83 33.33 41.67 42.42 120 45 132
Reach to lower output prices 4≥ 35.83 42.22 39.39 37.58 120 45 132
Profitability 4≥ 22.5* 24.44* 23.48* 23.03 120 45 132132
Increased

220
local and foreign firms. A significant difference has also been detected in terms of
“engineering capability related to product” (at 5% level), “design capability” (at 5% level)
and “profitability” (at 10% level) items between the direct suppliers and non-direct suppliers
(Mann-Whitney U test).
5.7. Direct Suppliers of the AMMs in Turkey
In this section, the relations between the AMMs in Turkey and their direct suppliers are
examined. Direct suppliers of AMMs make high technology manufacture, and meet the
various quality and manufacturing standards regarding the products and make closer
technological cooperation with the AMMs. As mentioned in section 5.1.1, the number of the
direct suppliers of one or more than one AMMs in Turkey is 132 (80%) in the sample, and
93 of them are local (FS<10%) and 39 of them are foreign firms (FS≥10%). The analysis of
the items will be made in terms of local and foreign direct suppliers in this section.
5.7.1. How the Firms became a Direct Supplier
Table 5.27 presents how the surveyed firms have become the direct suppliers of the AMMs
in Turkey. Accordingly, “supplier firm attempted and asked for order” comes in the first
rank (56%) and “supplier applied exhaustive and long-term program to work with AMMs” in
the second rank (45%). These are followed by “AMMs attempted and offered business plan”
(37%) and “through advices and introduces of our other customers” (31%) items,
respectively.
The items in the first two ranks in Table 5.27 show the own efforts of the firms to be direct
suppliers, and are complementary. On the other hand, the last two items show the effect of
the items other than the own efforts of the supplier firms. Since the being the direct supplier
of AMMs requires technology capabilities for the product and production process such as
manufacturing, engineering, design, creativity and being superior in technology indicators,
the first two items reflect that the firms lacking these properties need to develop these
aspects and apply to the AMMs by their own efforts. On the other hand, the last two items
point out that the firms relatively having these characteristics can more easily become direct
suppliers with the help of AMMs and their business environment. Therefore, the first two
items are selected by a higher amount of firms whereas the last two items might be selected

221
by fewer firms (assumed that all of the firms generally do not have the characteristics
required for being direct suppliers). The fact that local direct suppliers have higher rates as to
the items indicates that they spend more effort (compared to foreign direct supplier firms) in
order to become direct suppliers.
Table 5.27: How the Firms became a Direct Supplier
Source: Author calculations based on survey results
Notes: ***, **, * denote significance level at the 1%, 5% and 10%, respectively (chi-square, 2-sided).
Fisher’s Exact test has been used if one or more cells have an expected count ≤ 5.
Legend: DSF (Direct Supplier Firms)
A statistically significant difference has been found in terms of “our firm attempted and
asked for order” (at 10% level) and “through advices and introduces of our other customers”
(at 10% level) items between local and foreign direct suppliers (chi-square test).
5.7.2. Cooperation Activities with AMMs
Table 5.28 shows the distribution of the direct suppliers who answered “Yes” to seven
questions pertaining to the cooperation activities with the AMMs. According to this, 86% of
the firms stated that they had to provide “detailed information to the AMMs about
production and/or quality control processes” (88% for Local DSF and 79% for Foreign
DSF). At the same time, 82% of the firms specified that “AMM arrange regular visits to
evaluate the firm about quality, cost and on-time delivery etc.” (83% for local DSF and 79%
for foreign DSF). AMMs’ criteria for working with suppliers are very high; furthermore,
they monitor and evaluate its suppliers continuously according to certain written procedures
so as to prevent any interruptions in the production lines. This is verified by the high rates of
these two items. On the other hand, less number of “Yes” answers to these questions by the
foreign firms shows that some firms are exempted from these supervision items. The
possible underlying reasons are that (i) these firms are more capable in terms of technology;
Local
DSF
Foreign
DSF
ALL
DSF% % %
Our firm attempted and asked for order 64.13* 38.46* 56.49
Our firm applied exhaustive and long-term program to
work with AMMs47.83 38.46 45.04
AMM attempted and offered business plan 39.13 30.77 36.64
Through advices and introduces of our other customers 36.96* 17.95* 31.30
N 92 39 131

222
(ii) they are the global suppliers of the AMMs134
; (iii) these supervisions are not required due
to a long time of working together with the AMMs. For instance, direct suppliers who are the
global system supplier of more than one AMM under the scope of MNC such as Bosch,
Delphi, Siemens, Voleo, Magna, Autoliv etc. are also exempted from these supervisions.
Table 5.28: Cooperation Activities of the Direct Suppliers with the AMMs
Source: Author calculations based on survey results
Notes: ***, **, * denote significance level at the 1%, 5% and 10%, respectively (chi-square, 2-sided).
Fisher’s Exact test has been used if one or more cells have an expected count ≤ 5. The items do not
add up to 100% because the questionnaire included a further category called “No”, but has not been
identified in table. However, information on these categories can be obtained by subtracting the stated
proportions from 100%
Legend: DSF (Direct Supplier Firms); AMM (Automotive Main Manufacturer)
64% of the firms stated that “AMM sends its expert staff to the supplier firm for giving
support or assistance about various topics” (67% for Local DSF and 59% for Foreign DSF),
and 63% “AMM transfers any knowledge and technology related to product/production
process/design” (61% for Local DSF and 67% for Foreign DSF). High number of “Yes”
answers given by the firms as to both items is a sign of extensive cooperation between the
firms. The fact that the AMMs send their personnel to local direct suppliers at higher rates
134
The global supplier firms and AMMs make extensive cooperation on strategical subjects such as R&D,
innovation, design, quality, etc. generally at their main headquarters instead of other (host) countries in which
they made investment or their factories are located (see section 7.2).
Local
DSF
Foreign
DSF
ALL
DSF
Local
DSF
Foreign
DSF
% % % N N
Does your firm have to provide detailed information to
AMM(s) about production and/or quality control processes?88.17 79.49 85.61 93 39
Does AMM arrange regular visits to evaluate your firm about
quality, cost and on time delivery etc.?82.80 79.49 81.82 93 39
Does AMM sent its expert staff to your firm for giving
support or assistance about various topics? 66.67 58.97 64.39 93 39
Does AMM transfer any knowledge or technology related to
product/production process/design?61.29 66.67 62.88 93 39
Does AMM make regular management and/or governance
meetings? 56.99 56.41 56.82 93 39
Does AMM provide regular training activities for your staff? 26.88 20.51 25.00 93 39
Did AMM give any support in the establishment process of
your firm? (cooperation in capacity and production planning,
in purchasing machines, in technical organization etc.)
6.67 12.82 8.53 90 39
YES

223
(compared to Foreign DSF) shows when these firms encounter problems, they need more
assistance and support for their solution. Greater amount of KTTs to foreign direct suppliers
confirms the abovementioned statement that the foreign firms have higher technological
capabilities. This can also be affected by the fact that foreign firms produce more
technological products and can absorbing these transfers more easily.
57% of the firms stated that “AMM make regular management and/or governance meetings”.
The most significant aim of these meetings is to increase the coordination and cooperation
between the AMMs and suppliers. The main topics in such meetings cover discussing
various problems regarding production, making previous plans for the new models to be
produced, informing the suppliers of the new developments, giving training on different
subjects, etc.
25% of the firms stated that “AMM provide regular training activities for their staff” (27%
for Local DSF and 21% for Foreign DSF). This rate is close to the total training given to the
“production” and “management” staff and the average of the “off-the-job training” types in
the section of “frequent” transfers via training (see section 5.2.4 and Table 5.8). As to this
item, we can observe that local direct suppliers gave a higher number of “Yes” answers. This
also indicates that the personnel of these firms need more training compared to the foreign
direct suppliers.
A very low amount of the firms (9%) said “Yes” to the question of “whether the AMM
assisted the firm in the establishment stage”. This is because the AMMs prefer working with
currently-operating firms in the market who have also proven themselves at domestic and
overseas. When a new product not available in the market and/or within the framework of
the new models to be developed will be manufactured, AMMs prefer the previously-
cooperated supplier firms to manufacture it. In this case a new production line is set up for
this product, supplier firms are assisted by AMMs in a variety of situations like planning
production and capacity, machinery procurement and technical organization since this
product involves risks, the supplier firm does not have sufficient sources and equipment, and
so on. That the foreign direct suppliers gave two times more “Yes” answers (13%) to this
question (compared to Local DSF, 7%) confirms our abovementioned remarks about the
characteristics of the foreign direct suppliers (to be global supplier, to conduct more
technological production, to have more absorptive capacity etc.). In order to examine any
significant differences between the local and foreign direct suppliers as to these seven
questions, chi-square test was applied yet no significant difference was found between these
two groups.

224
5.7.3. Benefits of being a Direct Supplier
The firms were asked to evaluate the benefits of being direct suppliers based on their
experience in this field on a five-point Likert scale ranging from 1 (very unimportant) to 5
(very important). When the items are examined individually, the median of thirteen out of
fourteen items is obtained as 4 and the median of one as 5. The lowest mean is 3.71
(reducing risks involved with making decision to invest in new technology and/or machines)
and the highest average is 4.47 (good reputation and familiarness in sector). Therefore, the
items evaluated at the level of 4 or 5 were handled in “important” category (4≥), the items
evaluated at the level of 3 in “neither important nor unimportant” category (=3) and the
items evaluated at the level of 1 or 2 were handled in “unimportant” category. In Table 5.29,
the distributions of the firms whose answers for the items were in “important” category (4≥)
are examined.
Table 5.29: Benefits of being a Direct Supplier of the AMM in Turkey
Source: Author calculations based on survey results
Notes: ***, **, * denote significance level at the 1%, 5% and 10%, respectively (Mann-Whitney U
test, 2-sided). The items do not add up to 100% because the questionnaire included further categories
called “1–Very unimportant, 2-Unimportant, 3-Neither important nor unimportant”, but have not been
identified in table. 4≥: Responses indicating the degree of importance as being “important” (4) or
“very important” (5) are presented here. Legend: DSF (Direct Supplier Firms)
Local
DSF
Foreign
DSF
ALL
DSF
Local
DSF
Foreign
DSF
% % % N N
Good reputation and familiarness in sector 4≥ 97.85** 92.31** 96.21 93 39
Developing new business relationships with other firms 4≥ 96.77*** 82.05*** 92.42 93 39
Stable trade 4≥ 91.40 92.31 91.67 93 39
Better understand the customers’ blueprint and technical
specifications4≥ 90.32* 92.31* 90.91 93 39
Improvement in testing and analyzing capabilities/techniques 4≥ 87.10** 87.18** 87.12 93 39
Learning/improving new quality control methods 4≥ 87.10*** 76.92*** 84.09 93 39
Learning/improving new production processes 4≥ 80.65*** 71.79*** 78.03 93 39
Attendance to early stage in the design activities and
developing prototype4≥ 77.42* 71.79* 75.76 93 39
Learning about new technologies 4≥ 79.57** 61.54** 74.24 93 39
Increase in design capability 4≥ 76.34** 69.23** 74.24 93 39
Access to international developed markets 4≥ 76.34* 69.23* 74.24 93 39
Increase in productivity 4≥ 77.42** 66.67** 74.24 93 39
Improving in ability and knowledge about identifying and
finding solutions to problems encountered in the production 4≥ 70.97 74.36 71.97 93 39
Reducing risks involved with making decision to invest in
new technology and/or machines 4≥ 63.44 74.36 66.67 93 39
Important

225
When the items are examined, we can observe that items are regarded as “important” by
minimum 67% (reducing risks involved with making decision to invest in new technology
and/or machines) and maximum 96% (good reputation and familiarness in sector) of the
firms. The first four items which are regarded as important by at least 90% of the firms point
out the indirect/external benefits rather than the direct benefits (positive effects) of the
AMMs on the suppliers. Here, we can assume that being a successful direct supplier has also
a kind of “social capital” function. Probably, it also has positive effects on not only
sustaining the activities in automotive supply industry (market share) but also taking
technical/financial support from AMMs. On the contrary, other ten items which are regarded
as important between 67% and 87% reflect the direct benefits gained by the firms with
respect to the developments in test, analysis, engineering, design, quality control,
manufacture. In other words, these items reflect the positive effects of being direct supplier
in fields of product, production process, design, etc.
In sum, that even the item in the last rank was regarded as important by 67% of the firms
shows that being a direct supplier has a lot of positive effects on the firms. Yet it’s important
to underline that the criteria required by the AMMs to be a direct supplier are quite high, and
it’s necessary to always achieve new targets in the fields specified by the AMMs after being
a direct supplier (quality improvement, defect rate reduction, delivery time reduction, cost
reduction, etc.). In addition to that, the AMMs ask their suppliers to have their own quality
certificates and/or some internationally-recognized quality certificates. The supplier firms
must fulfill these requirements demanded by the AMMs within a certain calendar period, and
those fail to do so are warned. The firms who fail to meet these requirements for a long
period of time are dismissed from being a direct supplier in the end. Due to such reasons, the
positive effects concerning the items are achieved by the assistance of the AMMs and also
by the efforts spent by supplier firms in order not to lose their position as direct suppliers;
however, most probably both factors play a role in this process.
When we examine the items in terms of local and foreign supplier firms, local direct
suppliers attach more importance to nine out of fourteen items compared to the foreign direct
suppliers, and the difference as to the items (between the local and foreign direct suppliers)
range from 6% to 18%. Four items in which the difference between the local and foreign
direct suppliers is more than 10% are;
i. “Learning about new technologies” (18% difference),
ii. “Developing new business relationships with other firms” (15% difference),
iii. “Increase in productivity” (11% difference),
iv. “Learning/improving new quality control methods” (10% difference), respectively.

226
Foreign direct suppliers attach more importance to the remaining five items and the
difference between foreign and local direct suppliers for these items range between 0.1% and
11%. These items are;
i. “Reducing risks involved with making decision to invest in new technology and/or
machines” (11% difference)
ii. “Improving in ability and knowledge about identifying and finding solutions to
problems encountered in the production” (3% difference)
iii. “Better understand the customers’ blueprint and technical specifications” (2%
difference)
iv. “Stable trade” (1% difference)
v. “Improvement in testing and analyzing capabilities/techniques” (0.1% difference),
respectively.
The above situations confirm that strategic relationships/collaborations between foreign
direct suppliers and AMMs are most strong and foreign direct suppliers are benefited much
more from the technological activities compared to local direct suppliers. Moreover, it
confirms again that foreign direct suppliers are more capable in terms of technology and
their absorptive capacity is higher than local counterparts (see sections 5.1.6, 5.4, 5.7.2,
5.8.3).
There is a significant difference in terms of all other items except for three items (see Table
5.29) (stable trade, improving in ability and knowledge about identifying and finding
solutions to problems encountered in the production, reducing risks involved with making
decision to invest in new technology and/or machines) between local and foreign direct
supplier firms at significance levels changing between 1% and 10% (Mann-Whitney U test).
5.8. R&D, Innovation Activities and Absorptive Capacity
5.8.1. R&D Activities (technological input)
Table 5.30 shows the distribution of the firms that answered “Yes” to the questions
concerning R&D activities. It was found out that 133 of the 165 firms (81%) in the sample
conducted R&D activities. 99 of these firms are local (83%) and 34 are foreign firms (76%).
More, the number of firms that are direct suppliers and conduct R&D activities is 109 (83%).

227
Table 5.30: Distribution of Surveyed Firms by R&D Activities
Source: Author calculations based on survey results
Notes: ***, **, * denote significance level at the 1%, 5% and 10%, respectively (chi-square, 2-sided).
Fisher’s Exact test has been used if one or more cells have an expected count ≤ 5. The items do not
add up to 100% because the questionnaire included a further category called “No”, but have not been
identified in table. However, information on these categories can be obtained by subtracting the stated
proportions from 100%.
Legend: LF (Local Firms); FF (Foreign Firms); DSF (Direct Supplier Firms); AF (All Firms)
It was found out that there was a separate R&D department in 99 (74%) of the firms
conducting R&D activities (133 firms) and these activities were performed in this
department. This can be interpreted as many of the firms conducting R&D activities prefer to
have a separate incorporated R&D department.
The total R&D expenditures of the firms in the sample conducting R&D activities in 2008
year are TL 180M, and mean value for each firm is TL 1.32M. Furthermore, the mean rate of
the R&D expenditures in the total sales (R&D intensity) is 2.64%, and foreign firms make
nearly three times more R&D expenditures (mean; TL 2.56M) than the local firms (mean;
TL 913K) (for details see Appendix L).
51% of the firms stated that they got financial support related to R&D from the government
or various institutions (KOSGEB-TUBITAK-TEYDEB-TTGV-EU, etc.). When we take a
look at the firm groups that get the most support, direct suppliers come in the first rank with
56%, and this is followed by local (53%) and foreign firms (44%). Such projects promote
especially cooperation and common activities among more than one firm. In this context, it’s
expected that direct suppliers and AMMs undertake more common projects and get more
support. The main reasons behind this are to increase the cooperation among the firms and in
this way ensure coordination between the personnel of the firms and reduce R&D risks and
LF FF DSF AF LF FF DSF
% % % % N N N
Does your firm carry out R&D activities? 82.50 75.56 82.58 80.61 120 45 132
Is there a separated R&D department in your firm? 60 60 62.12 60 120 45 132
Does your firm get any support from government or
various institutions related to R&D (KOSGEB –
TÜBİTAK – TEYDEB – TTGV - EU etc.)?
53.33 44.44 56.06** 50.91 120 45 132
Are joint R&D activities being carried out with other
customers? 44.17 43.18 45.04 43.90 120 44 131
Do your customers help or support your firm related
to R&D and design?45.83 36.36 42.75 43.29 120 44 131
If your firm is a direct supplier of automotive main
manufacturer, are joint R&D activities being carried
out with these manufacturer(s)?
41.89 45.46 52.27*** 42.86 117 44 132
YES

228
costs, as well. A finding we obtained from the interviews with the AMMs is that they
participate in quite a lot of projects with their suppliers for the purposes of R&D, product
development, innovation, etc. When the fact that government and various institutions
provide these supports primarily to the local firms is considered, it becomes clear why the
foreign firms are the last in ranking.
The number of firms who are direct suppliers (132 firms) and make joint R&D with the
AMMs is 69 (52%). It is found out that foreign firms (45%) conduct more R&D activities
with their AMMs compared to local firms (42%). When we examine the joint R&D activities
performed by the firms with other customers but not the AMMs, direct suppliers once again
become first in ranking with 45%, and they are followed by local (44%) and foreign (43%)
firms. When the AMMs and other customers are compared, it’s figured out that local firms
perform more joint R&D activities with other customers whereas foreign and direct suppliers
with AMMs.
The rate of the firms who specified that apart from the joint R&D activities, the customers
also provide assistance and support for R&D and design is 43% (46% for LF, 43% for DSF
and 36% for FF). This rate is closer to the rate of the firms who specified to perform joint
R&D activities with both AMMs and other customers.
No significant difference has been found with respect to items between local and foreign
firms. A significant difference has been found in terms of “get any support from government
or various institutions related to R&D” (at 5% level) and “R&D activities being carried out
with AMMs” (at 1% level) items between the direct suppliers and non-direct suppliers (chi-
square test).
5.8.1.1. Pioneers of R&D Activities
Table 5.31 displays who led the firms to start R&D activities. As the first in ranking, 84% of
the local firms stated it was their “own choice”, and it was “DAMM” (32%) and “OAMM”
(20%) as the second and third in ranking, respectively. 62% of the foreign firms specified
“PC” in the first rank, and their “own choices” (50%) and “DAMM” (21%) in the second and
third rank, respectively. If we do not consider the “own choices” of the firms and the effects
of the affiliated parent companies, it is concluded that AMMs are an important factor
affecting R&D activities of the firms.
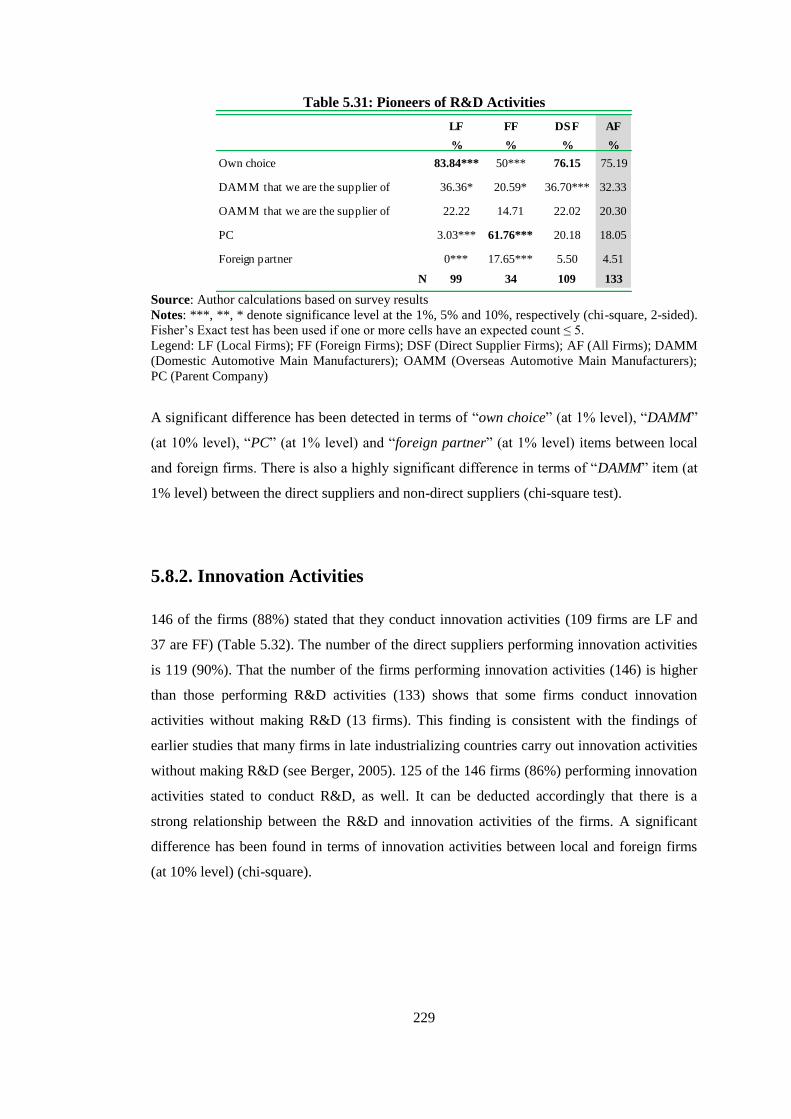
229
Table 5.31: Pioneers of R&D Activities
Source: Author calculations based on survey results
Notes: ***, **, * denote significance level at the 1%, 5% and 10%, respectively (chi-square, 2-sided).
Fisher’s Exact test has been used if one or more cells have an expected count ≤ 5.
Legend: LF (Local Firms); FF (Foreign Firms); DSF (Direct Supplier Firms); AF (All Firms); DAMM
(Domestic Automotive Main Manufacturers); OAMM (Overseas Automotive Main Manufacturers);
PC (Parent Company)
A significant difference has been detected in terms of “own choice” (at 1% level), “DAMM”
(at 10% level), “PC” (at 1% level) and “foreign partner” (at 1% level) items between local
and foreign firms. There is also a highly significant difference in terms of “DAMM” item (at
1% level) between the direct suppliers and non-direct suppliers (chi-square test).
5.8.2. Innovation Activities
146 of the firms (88%) stated that they conduct innovation activities (109 firms are LF and
37 are FF) (Table 5.32). The number of the direct suppliers performing innovation activities
is 119 (90%). That the number of the firms performing innovation activities (146) is higher
than those performing R&D activities (133) shows that some firms conduct innovation
activities without making R&D (13 firms). This finding is consistent with the findings of
earlier studies that many firms in late industrializing countries carry out innovation activities
without making R&D (see Berger, 2005). 125 of the 146 firms (86%) performing innovation
activities stated to conduct R&D, as well. It can be deducted accordingly that there is a
strong relationship between the R&D and innovation activities of the firms. A significant
difference has been found in terms of innovation activities between local and foreign firms
(at 10% level) (chi-square).
LF FF DSF AF
% % % %
Own choice 83.84*** 50*** 76.15 75.19
DAMM that we are the supplier of 36.36* 20.59* 36.70*** 32.33
OAMM that we are the supplier of 22.22 14.71 22.02 20.30
PC 3.03*** 61.76*** 20.18 18.05
Foreign partner 0*** 17.65*** 5.50 4.51
N 99 34 109 133

230
5.8.2.1. Cooperation Level with Partners in Innovation Activities
The firms performing innovation activities were asked to evaluate how intense is their
cooperation with the external cooperated parties for these activities on a five-point Likert
scale ranging from 1 (no cooperation) to 5 (very intense). When the items are analyzed
individually by exempting both 0 (no response) and 1 (no cooperation) choices, the median
of five items is 4, the median of one is 3.5 and the median of two is 3, the lowest mean value
is 3 (universities) and the highest is 4.11 (parent company). Therefore, the items evaluated at
the level of 4 or 5 were handled in “intense” category (4≥), the items evaluated at the level of
3 in “medium” category (=3) and the items evaluated at the level of 2 were handled in “low”
category (=2). In Table 5.32, the distributions of the firms whose answers for the items were
in “intense” category (4≥) are examined135
.
Table 5.32: Distribution of Surveyed Firms by Innovation Activities and
Cooperation Level with Partners
Source: Author calculations based on survey results
Notes: ***, **, * denote significance level at the 1%, 5% and 10%, respectively († chi-square, 2-
sided, δ Mann-Whitney U test, 2-sided). The item for innovation activities does not add up to 100%
because the questionnaire included further category called “No”, but has not been identified in table.
However, information on this category can be obtained by subtracting the stated proportion from
100%. The items for innovation partners do not add up to 100% because the questionnaire included
further categories called “1-No cooperation, 2-Little, 3–Middle” for partners, but have not been
identified in table. 4≥: Responses indicating the degree of intense as being “intense” (4) or “very
intense” (5) are presented here.
Legend: LF (Local Firms); FF (Foreign Firms); DSF (Direct Supplier Firms); AF (All Firms); DS
(Domestic Suppliers); OS (Overseas Suppliers); DAMM (Domestic Automotive Main
Manufacturers); OAMM (Overseas Automotive Main Manufacturers); PC (Parent Company)
135
Furthermore, when the items are examined together, on average 10% of the firms chose 0 (no response), 35%
1 (no cooperation), and 55% a scale between 2 and 5 {25% 2 (low) or 3 (medium), 30% 4 (intense) or 5 (very
intense)}.
LF FF DSF AF LF FF DSF
% % % % N N N
Carry out Innovation Activities?-YES† (146 firms) 90.83* 82.22* 90.15 88.48 120 45 132
Innovation Partners-Intense Cooperationδ
DS 4≥ 37.61 37.84 38.66 37.67 109 37 119
OS 4≥ 36.70 32.43 33.61 35.62 109 37 119
DAMM 4≥ 36.70 27.03 40.34*** 34.25 109 37 119
OAMM 4≥ 26.61 35.14 32.77*** 28.77 109 37 119
PC 4≥ 9.17*** 75.68*** 29.41 26.03 109 37 119
R&D institutions 4≥ 21.10 8.11 19.33** 17.81 109 37 119
Private engineering and consultancy firms 4≥ 22.02* 5.41* 18.49 17.81 109 37 119
Universities 4≥ 15.60 16.22 17.65 15.75 109 37 119

231
When the evaluations pertaining to the items are examined in terms of all firms, it's found
out that minimum 16% (universities) and maximum 37% (DS) of the firms conduct very
intense cooperation with more than one external party for innovation activities. The first
three external parties with whom the firms cooperate very intensively are “DS” (38%), “OS”
(36%) and “DAMM” (34%), respectively. Here, it is observed that the cooperation in the
innovation field is very intense with “DAMM” as it is with “DS” and “OS”136
. Therefore,
geographical location and the distinction between supply/main industries don’t matter much
for these three categories. If we remember that a large part of the DAMM is composed of
foreign-ownership or affiliates of MNCs, it can be observed that MNCs137
play an important
role in the cooperation of the supplier firms operating in the supply industry with respect to
innovation activities. The least-cooperated external party with whom the firms cooperate
very intensively is “universities” (16%).
When we examine the cooperated external parties in terms of local firms, the first three
parties with whom intense cooperation is made are “DS” (38%), “OS” (37%) and “DAMM”
(37%), and the least-cooperated ones are the affiliated “PC” (9%) and “universities” (16%).
When the items are examined in terms of foreign firms, the most important external party
with whom intense cooperation is made is detected as “PC” with 76%. It is followed by
“DS” (38%) and “OAMM” (35%), respectively. The least-cooperated party with whom
intense cooperation is made is “private engineering and consultancy firms” with 5%.
Furthermore, the number of foreign firms that have extensive relations with “OAMM” is
higher than that of foreign firms that have extensive relations with “DAMM”. These findings
(more relations with parent companies and OAMM, fewer relations with R&D institutions
and various private engineering-consulting institutions) seem to confirm our previous
findings in terms of foreign supplier firms that foreign supplier firms are generally the
affiliates of MNCs in Turkey; they are the global suppliers of the AMMs; they have high
production and technological capabilities; they realize basic innovation and R&D activities
in their headquarters and therefore they are dependent on parent companies.
The most-cooperated external party with whom direct suppliers cooperate very intensively is
“DAMM” (40%) as expected, and the least-cooperated party is “universities” (18%).
136
Here, the OS providing machinery-equipment and intermediate goods to the survey firms are concerned. 137
DAMM, OAMM and foreign suppliers.

232
One of the most important findings here is while most of the foreign firms (76%) make very
intensive cooperation with parent companies for innovation activities; only 10% of the local
firms make cooperation with parent companies. This is because the relations of local and
foreign firms with parent companies are structurally different. That is to say, most of the
local firms affiliated to the parent company (holding) are generally one of the group firms
who are affiliated to this parent company in terms of management. At the same time, these
group firms operate in different industries and therefore each firm acts independently of
other group firms in a variety of fields (production, R&D, innovation, etc.). The parent
companies here serve as the supervisory, regulatory and the most authorized decision making
body in terms of management. On the other hand, foreign firms are mostly the affiliates of
the MNCs, as we mentioned above. All basic technological activities (R&D, innovation,
design etc.) of these firms are carried out at the main headquarters of the affiliated MNC.
Therefore, the local firms are affiliated to the parent companies only in terms of management
whereas the foreign firms are affiliated to the parent companies in terms of not only
management but also any commercial activities such as R&D, production, innovation etc.
A significant difference has been detected in terms of “PC” (at 1% level) and “private
engineering and consultancy firms” (at 10% level) between local and foreign firms. A
significant difference has also been found in terms of “DAMM” (at 1% level), “OAMM” (at
1% level) and “R&D institutions” (at 5% level) between the direct suppliers and non-direct
suppliers (Mann-Whitney U test).
5.8.2.2. Technological Product and Process Innovation Activities138
(technological output)
The firms were asked whether they had developed or put on the market any technological
innovations in various fields (production process, product, services and logistic) in the last
three years139
. Table 5.33 shows the distributions of the firms that said “Yes” to these
questions concerning innovation activities. Similar distributions are observed among three
138 “Technological product and process (TPP) innovation activities are all those scientific, technological,
organizational, financial and commercial steps which actually, or are intended to, lead to the implementation of
technologically new or improved products or processes. A technologically new product is a product whose
technological characteristics or intended uses differ significantly from those of previously produced products. A
technologically improved product is an existing product whose performance has been significantly enhanced or
upgraded. Technological process innovation is the adoption of technologically new or significantly improved
production methods, including methods of product delivery” (see OECD, 1997, pp.32-39). 139
The questions and items are derived based on definitions from OECD’s Oslo and Frascati manuals, and also
technological innovation questionnaire form used by TurkStat in the innovation survey (OECD, 1997; 2002;
2005).

233
groups of firms with respect to the innovation activities. Accordingly, the most important
field in which the firms performed innovation activities is “production process” with 91%.
Other two important fields following that are “product innovation” (73%) and “supporting
activities related to processes” (71%). The fields in which the least innovation activities are
performed by the firms are “service innovations” (45%) and “innovations for logistics,
delivery, and distribution” (42%). This table shows that firms perform more innovation
activities with respect to the “production process” and are more successful at making
technological innovations compared to the non-technological innovation activities (logistics,
distribution and delivery). Another important finding is that foreign firms perform more
innovation activities with respect to logistics, distribution and delivery methods compared
with other firms.
Table 5.33: Types of Innovation Activities (in the last three-years)
Source: Author calculations based on survey results
Notes: ***, **, * denote significance level at the 1%, 5% and 10%, respectively (chi-square, 2-sided).
Fisher’s Exact test has been used if one or more cells have an expected count ≤ 5. The items do not
add up to 100% because the questionnaire included a further category called “No”, but have not been
identified in table.
Legend: LF (Local Firms); FF (Foreign Firms); DSF (Direct Supplier Firms); AF (All Firms)
A significant difference has been detected in terms of “innovations for logistics, delivery,
and distribution” (at 10% level) between local and foreign firms and “innovation activities
for product” (at 5% level) between the direct suppliers and non-direct suppliers (chi-square
test).
LF FF DSF AF LF FF DSF
% % % % N N N
New or significantly improved methods for
production process(es)90.76 91.11 90.91 90.85 119 45 132
New or significantly improved product(s) 72.27 75.56 77.27** 73.17 119 45 132
New or significantly improved supporting activities
related to processes (maintenance systems, and
operations for purchasing, accounting, and
computing)
72.27 68.89 72.73 71.34 119 45 132
New or significantly improved service(s) 45.30 44.44 42.75 45.06 117 45 131
New or significantly improved logistics, delivery,
and distribution methods 38.46* 51.11* 42.31 41.98 117 45 130
Innovation actvities-YES
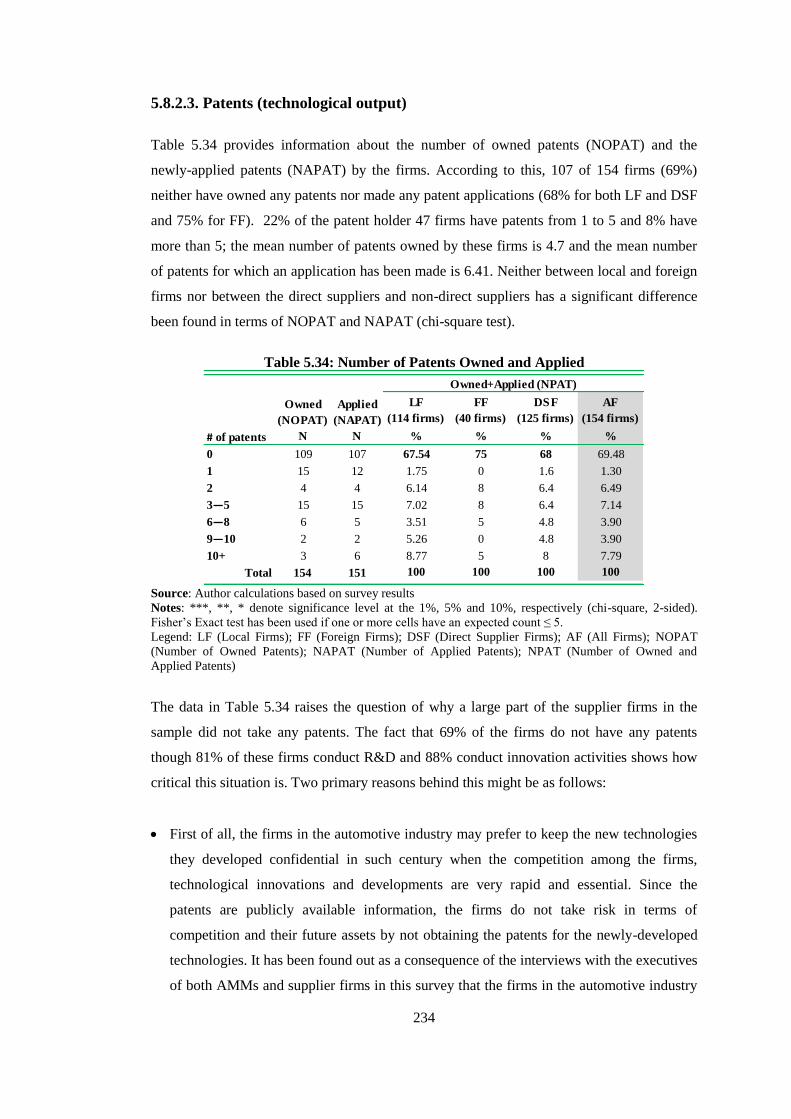
234
5.8.2.3. Patents (technological output)
Table 5.34 provides information about the number of owned patents (NOPAT) and the
newly-applied patents (NAPAT) by the firms. According to this, 107 of 154 firms (69%)
neither have owned any patents nor made any patent applications (68% for both LF and DSF
and 75% for FF). 22% of the patent holder 47 firms have patents from 1 to 5 and 8% have
more than 5; the mean number of patents owned by these firms is 4.7 and the mean number
of patents for which an application has been made is 6.41. Neither between local and foreign
firms nor between the direct suppliers and non-direct suppliers has a significant difference
been found in terms of NOPAT and NAPAT (chi-square test).
Table 5.34: Number of Patents Owned and Applied
Source: Author calculations based on survey results
Notes: ***, **, * denote significance level at the 1%, 5% and 10%, respectively (chi-square, 2-sided).
Fisher’s Exact test has been used if one or more cells have an expected count ≤ 5.
Legend: LF (Local Firms); FF (Foreign Firms); DSF (Direct Supplier Firms); AF (All Firms); NOPAT
(Number of Owned Patents); NAPAT (Number of Applied Patents); NPAT (Number of Owned and
Applied Patents)
The data in Table 5.34 raises the question of why a large part of the supplier firms in the
sample did not take any patents. The fact that 69% of the firms do not have any patents
though 81% of these firms conduct R&D and 88% conduct innovation activities shows how
critical this situation is. Two primary reasons behind this might be as follows:
First of all, the firms in the automotive industry may prefer to keep the new technologies
they developed confidential in such century when the competition among the firms,
technological innovations and developments are very rapid and essential. Since the
patents are publicly available information, the firms do not take risk in terms of
competition and their future assets by not obtaining the patents for the newly-developed
technologies. It has been found out as a consequence of the interviews with the executives
of both AMMs and supplier firms in this survey that the firms in the automotive industry
Owned
(NOPAT)
Applied
(NAPAT)
LF
(114 firms)
FF
(40 firms)
DSF
(125 firms)
AF
(154 firms)
N N % % % %
0 109 107 67.54 75 68 69.48
1 15 12 1.75 0 1.6 1.30
2 4 4 6.14 8 6.4 6.49
3―5 15 15 7.02 8 6.4 7.14
6―8 6 5 3.51 5 4.8 3.90
9―10 2 2 5.26 0 4.8 3.90
10+ 3 6 8.77 5 8 7.79
Total 154 151 100 100 100 100
Owned+Applied (NPAT)
# of patents

235
in Turkey are not willing to take the patents of the technologies they developed with
respect to the products and processes. The most important reason was specified by the
firms as they did not want to reveal with the patent the confidential information
concerning the technologies which were developed with the long studies and high costs in
such an important field as automotive. A second important reason for the firms was it was
a waste of time and sources to apply many countries so as to take a patent.
Secondly, the fact that 69% of the surveyed firms do not have patents although a
significant part of them perform R&D and innovation activities indicates that they don’t
perform these activities at advanced level. As we are going to mention in the Chapter 7
and conclusion section, it has been observed that the domestic R&D departments of these
firms generally work on the partial modifications, improvements of the products, and
making them appropriate for the production line140
. Otherwise, the most important reason
for foreign firms for not having any patents (or having a few patents) is because they are
the affiliates of MNCs and therefore perform advanced level innovation and R&D
activities to take patent at their main headquarters. Conversely, this might indicate that
the firms are dependent on external sources for the technologies in which the possibility
of taking patents for the automotive supply industry is high, and this dependency
somewhat accounts for the low patent-taking tendency of the supplier firms.
5.8.3. Absorptive Capacity
Six alternative indicators were formed in order to get informed about the absorptive capacity
of the surveyed firms (Table 5.35). These are respectively;
Share of engineers in total employment,
Share of white-collar personnel in total employment,
Share of R&D expenditures in turnover (R&D intensity),
Share of export in turnover (export intensity),
Number of patents obtained,
Sales per employee.
First two indicators show the quality level of the firms regarding human capital, third
indicator R&D potentials as a technological input, fourth indicator export-oriented level
140
According to a study analysing the R&D activities of the firms with foreign capital operating in Turkish
manufacture industry, the firms in automotive main industry trust their brands rather than patents to protect the
innovations: See Erdil et. al. (2011).

236
(assumed that export-oriented firms have higher capabilities), fifth indicator the number of
patents obtained as an output of the technological capabilities and the last indicator
productivity levels. The absorptive capacities of the firms will be reviewed by analyzing
these indicators.
Table 5.35: Alternative Indicators of Absorptive Capacity
Source: Author calculations based on survey results
Notes: ***, **, * denote significance level at the 1%, 5% and 10%, respectively (two independent
samples t-test, 2-sided). Equal variances are assumed between groups.
Legend: LF (Local Firms); FF (Foreign Firms); DSF (Direct Supplier Firms); AF (All Firms); TE
(Total Employment)
The data on the human capital structure show that foreign firms employ more highly-
qualified personnel than local firms. The mean (median) rates of both the engineers
(significant at 1% level) and the white collar workers (significant at 5% level) in the total
employees are higher in foreign firms (t-test). Having a high amount of highly-skilled work
force is an important indicator of technological capabilities. Because the most important
requirement of operating with complex and developed production technologies and
performing R&D and innovation activities is to have highly-skilled human capital.
When we take a look at the rate of R&D expenditures of the firms in the total sales (R&D
intensity), the foreign firms spend more money on R&D activities than the local firms on
average. Moreover, the median value indicates that at least 50% of the foreign firms spend
2% of their total sales on R&D whereas local firms spend 1%. This indicates that foreign
LF FF DSF AF
N 119 42 129 161
Mean 6.79*** 11.33*** 8.41 7.98
Median 5.26 7.60 6.25 5.78
N 119 42 129 161
Mean 16.6** 20.9** 17.35 17.72
Median 14.84 16.16 14.9 15.03
N 104 35 111 139
Mean 2.55 2.91 2.77 2.64
Median 1 2 1.17 1
N 120 45 132 165
Mean 34.53* 43.78* 35.30 36.83
Median 26.50 40.00 25.00 30.00
N 114 40 125 154
Mean 1.56 0.83 1.51 1.37
Median 0 0 0 0
N 104 37 113 141
Mean 178318** 318480** 199768 215097
Median 136833 183200 153440 148734
Share of Engineers in TE (%)
Share of White-Collar Personnel
in TE (%)
Sales per Employee (TL)
Export Intensity (%)
R&D Intensity (%)
# of Patents Owned

237
firms make more investment on R&D. It is also the result of having more highly-skilled
human capital.
Foreign firms are mainly more export-oriented than local counterparts (significant at 10%
level) as we examined in section 5.1.5 (t-test). The nearly half of the sales of the foreign
firms on average is made to the overseas markets. In other means, at least 50% of the foreign
firms export 40% of their total sales to overseas markets (median 40%). The overseas
markets require the capability of dealing with a more competitive market as well as the high
technological production capabilities pertaining to the products and production processes
(quality control, low defect rate, high quality, testing and design capability etc.). Therefore, it
can be suggested that the foreign firms who make more production for the overseas markets
possess higher amount of these technologies.
Highly-qualified human capital, innovation and R&D activities are technological
development inputs of the firms and patents are the outputs of this development. Local firms
seem to have more patents than the foreign firms on average. Yet this doesn't mean that the
local firms are more successful at converting the technological innovations into patents than
the foreign firms due to the reasons mentioned in section 5.8.2.3. In addition, one of the main
reasons for the local firms to have a higher average of patents in the sample is that a few of
them (only three firms) have high number of patents and thus increase the average.
The average total sales per person (productivity) for the foreign firms are almost twice as
much as the local firms (significant at 5% level) (t-test). This indicates that foreign firms
manufacture quite productively when compared with the local firms. The most significant
effect of the human capital quality, the level of R&D and innovation activities, in other
words the technological capabilities of the firms shows itself in the productivity level and the
foreign firms are quite more capable than the local firms according to this indicator.
In sum, we can assume that foreign firms have higher absorptive capacity than the local
firms depending on these six indicators.
When these six indicators are examined in terms of the direct suppliers, five indicators not
including “the number of patents owned” have higher mean rates than the local firms but
lower mean rates than the foreign firms. This is an important point for showing that the
absorptive capacity of the direct suppliers is lower than that of the foreign firms.
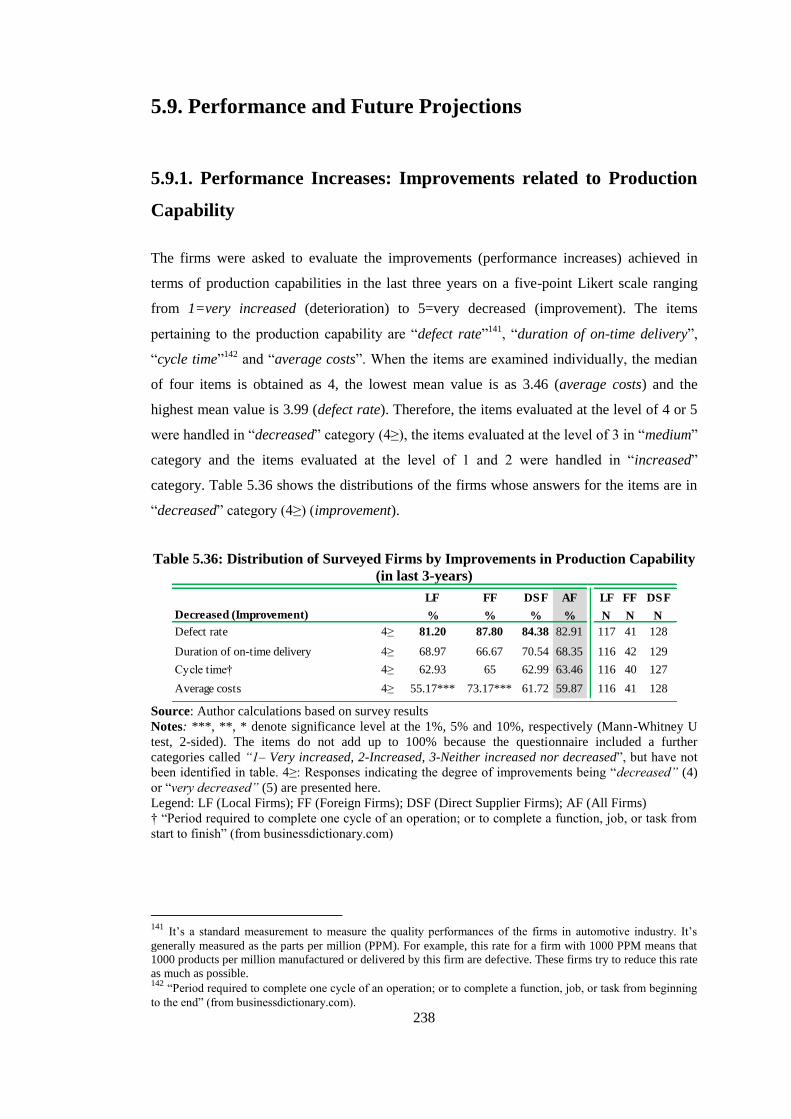
238
5.9. Performance and Future Projections
5.9.1. Performance Increases: Improvements related to Production
Capability
The firms were asked to evaluate the improvements (performance increases) achieved in
terms of production capabilities in the last three years on a five-point Likert scale ranging
from 1=very increased (deterioration) to 5=very decreased (improvement). The items
pertaining to the production capability are “defect rate”141
, “duration of on-time delivery”,
“cycle time”142
and “average costs”. When the items are examined individually, the median
of four items is obtained as 4, the lowest mean value is as 3.46 (average costs) and the
highest mean value is 3.99 (defect rate). Therefore, the items evaluated at the level of 4 or 5
were handled in “decreased” category (4≥), the items evaluated at the level of 3 in “medium”
category and the items evaluated at the level of 1 and 2 were handled in “increased”
category. Table 5.36 shows the distributions of the firms whose answers for the items are in
“decreased” category (4≥) (improvement).
Table 5.36: Distribution of Surveyed Firms by Improvements in Production Capability
(in last 3-years)
Source: Author calculations based on survey results
Notes: ***, **, * denote significance level at the 1%, 5% and 10%, respectively (Mann-Whitney U
test, 2-sided). The items do not add up to 100% because the questionnaire included a further
categories called “1– Very increased, 2-Increased, 3-Neither increased nor decreased”, but have not
been identified in table. 4≥: Responses indicating the degree of improvements being “decreased” (4)
or “very decreased” (5) are presented here.
Legend: LF (Local Firms); FF (Foreign Firms); DSF (Direct Supplier Firms); AF (All Firms)
† “Period required to complete one cycle of an operation; or to complete a function, job, or task from
start to finish” (from businessdictionary.com)
141
It’s a standard measurement to measure the quality performances of the firms in automotive industry. It’s
generally measured as the parts per million (PPM). For example, this rate for a firm with 1000 PPM means that
1000 products per million manufactured or delivered by this firm are defective. These firms try to reduce this rate
as much as possible. 142
“Period required to complete one cycle of an operation; or to complete a function, job, or task from beginning
to the end” (from businessdictionary.com).
LF FF DSF AF LF FF DSF
% % % % N N N
Defect rate 4≥ 81.20 87.80 84.38 82.91 117 41 128
Duration of on-time delivery 4≥ 68.97 66.67 70.54 68.35 116 42 129
Cycle time† 4≥ 62.93 65 62.99 63.46 116 40 127
Average costs 4≥ 55.17*** 73.17*** 61.72 59.87 116 41 128
Decreased (Improvement)

239
60% to 83% of the firms stated that important improvements had been achieved with respect
to these items for the last three years. When the items are examined, the most important
improvement is the reduction in “defect rate” with 83% (131 firms). This item is followed by
the improvements (reductions) in “duration of on-time delivery” with 68% (108 firms),
“cycle time” with 63% (96 firms) and “average costs” with 60% (94 firms). Apart from
“average costs” item, similar distributions are observed among three groups of the firms for
other three items. The percentage of the foreign firms (73%) specifying a reduction in the
costs in the last three years is considerably higher than the local (55%) and direct suppliers
(62%). This also indicates that foreign firms make more efficient manufacture.
A significant difference has been detected only in terms of “average costs” (at 1% level)
between local and foreign firms. However between the direct suppliers and non-direct
suppliers, no significant difference has been found (Mann-Whitney U test).
5.9.2. Reasons for Performance Increases (improvements) in
Production Capability
In this section, improvements in the production capability of the surveyed firms as a result of
KTTs from customers will be used as a proxy for the performance increases of the supplier
firms as sections 5.6.2 and 5.9.1.
The firms which achieved improvement in their production capabilities and/or developed
new technologies concerning the product or production process in the last years were asked
to evaluate the items affecting their performances in this respect on a five-point Likert scale
ranging from 1 (very ineffective) to 5 (very effective). When the items are evaluated
individually, the median of six out of ten items is 4, the median of three is 3 and the median
of only one is 2, the lowest mean value is 2.32 (hiring skilled-specialist employees from
other firms) and the highest is 3.95 (acquisition of new software, hardware, equipment and
tools). Therefore, the items evaluated at the level of 4 or 5 were handled in “effective” (4≥)
category, the items evaluated at the level of 3 in “neither effective nor ineffective” category
and the items evaluated at the level of 1 and 2 were handled in “ineffective” category . In
Table 5.37, the distribution of the firms whose answers for the items were in “effective”
category (4≥) is examined.
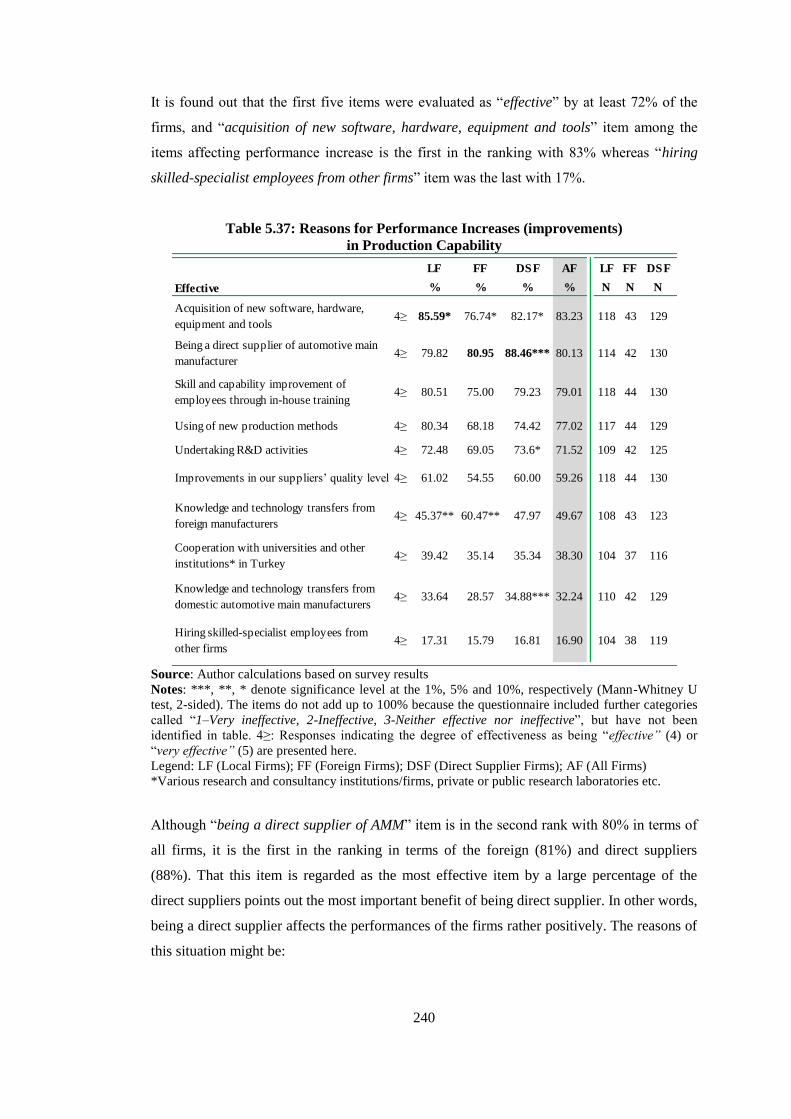
240
It is found out that the first five items were evaluated as “effective” by at least 72% of the
firms, and “acquisition of new software, hardware, equipment and tools” item among the
items affecting performance increase is the first in the ranking with 83% whereas “hiring
skilled-specialist employees from other firms” item was the last with 17%.
Table 5.37: Reasons for Performance Increases (improvements)
in Production Capability
Source: Author calculations based on survey results
Notes: ***, **, * denote significance level at the 1%, 5% and 10%, respectively (Mann-Whitney U
test, 2-sided). The items do not add up to 100% because the questionnaire included further categories
called “1–Very ineffective, 2-Ineffective, 3-Neither effective nor ineffective”, but have not been
identified in table. 4≥: Responses indicating the degree of effectiveness as being “effective” (4) or
“very effective” (5) are presented here.
Legend: LF (Local Firms); FF (Foreign Firms); DSF (Direct Supplier Firms); AF (All Firms)
*Various research and consultancy institutions/firms, private or public research laboratories etc.
Although “being a direct supplier of AMM” item is in the second rank with 80% in terms of
all firms, it is the first in the ranking in terms of the foreign (81%) and direct suppliers
(88%). That this item is regarded as the most effective item by a large percentage of the
direct suppliers points out the most important benefit of being direct supplier. In other words,
being a direct supplier affects the performances of the firms rather positively. The reasons of
this situation might be:
LF FF DSF AF LF FF DSF
% % % % N N N
Acquisition of new software, hardware,
equipment and tools4≥ 85.59* 76.74* 82.17* 83.23 118 43 129
Being a direct supplier of automotive main
manufacturer 4≥ 79.82 80.95 88.46*** 80.13 114 42 130
Skill and capability improvement of
employees through in-house training 4≥ 80.51 75.00 79.23 79.01 118 44 130
Using of new production methods 4≥ 80.34 68.18 74.42 77.02 117 44 129
Undertaking R&D activities 4≥ 72.48 69.05 73.6* 71.52 109 42 125
Improvements in our suppliers’ quality level 4≥ 61.02 54.55 60.00 59.26 118 44 130
Knowledge and technology transfers from
foreign manufacturers 4≥ 45.37** 60.47** 47.97 49.67 108 43 123
Cooperation with universities and other
institutions* in Turkey 4≥ 39.42 35.14 35.34 38.30 104 37 116
Knowledge and technology transfers from
domestic automotive main manufacturers4≥ 33.64 28.57 34.88*** 32.24 110 42 129
Hiring skilled-specialist employees from
other firms4≥ 17.31 15.79 16.81 16.90 104 38 119
Effective

241
They are to comply with continuously-updated quality improvement, cost reduction,
defect rate reduction etc. plans by the AMMs,
The AMMs continuously monitor and evaluate the firms,
Various KTTs and training activities concerning product and production process by
the AMMs,
Competition with other supplier firms in both the domestic and overseas markets,
Strategic cooperation activities with the AMMs,
Conducting joint R&D and design activities or projects for the development of product
and production process with the AMMs.
An important finding is that “KTTs from foreign manufacturers” item (50% for all firms) is
considered more important than “KTTs from DAMM” item (32% for all firms) for the
performance increase in terms of three groups of firms. This can be interpreted as the
supplier firms make more cooperation with the foreign firms (foreign ownership firms at
domestic or overseas markets) in order to obtain new technologies concerning product and
product development. As indicated by our previous findings, the supplier firms procure new
machinery, software, hardware, equipment and tools especially from the foreign firms and
foreign firms provide training, consulting and engineering services in this respect.
On the other hand, that “KTTs from DAMM” item is considered efficient in the ninth rank by
32% of the firms might be interpreted positively or negatively as follows:
The fact that it’s chosen by one third of the firms can be regarded as positive in terms
of indicating the KTTs to the firms and their positive effects on the performances.
On the other hand, it can be interpreted negatively since the rest of the firms did not
choose this item; the AMMs are not keen on KTTs and are stricter in this respect and
only make these transfers to certain suppliers. It can also be interpreted negatively
because the performance increase by these transfers is dependent on the technological
capabilities, absorption, internalization and comprehension level of the firms taking
these transfers, and the supplier firms have less capability in this respect and this item
was chosen by fewer firms.
A last finding is that the rate of the firms choosing “cooperation with universities and other
institutions in Turkey” item is in the eighth rank with 38%. This is important in terms of
pointing out that the cooperation between the firms and institutions, particularly with the
universities, is still not at a satisfactory and sufficient level.

242
A significant difference has been detected in terms of “acquisition of new software,
hardware, equipment and tools” (at 10% level) and “KTTs from foreign manufacturers” (at
5% level) items between local and foreign firms. A significant difference has also been
detected in terms of “acquisition of new software, hardware, equipment and tools” (at 10%
level), “being a direct supplier of AMM” (at 1% level), “undertaking R&D activities” (at
10% level) and “KTTs from DAMM” (at 1% level) items between the direct suppliers and
those which are not direct suppliers (Mann-Whitney U test).
5.9.3. Future Projections related to Acquisition of New Technologies
Table 5.38 shows the distribution of the firms in terms of their future projections for new
technology acquisition. Similar distributions are observed in terms of three groups of the
firms. The two most important items specified by 83% of the firms are “get training” and
“undertake R&D activities and/or improve existing R&D activities”. These items are
followed by “analyze rival products and processes” (60%), “make joint R&D activities with
AMM” (59%), “get consultancy from universities” (32%), “get consultancy from domestic”
(29%), “get consultancy from abroad” (25%), “bring experts from abroad” (17%) and “sign
agreements to provide skill and knowledge transfer” (16%) items. “Hiring expert staff from
AMM”, however, was chosen only by 5% of the firms and thus last in the ranking.
As it can be seen in the table, the items other than “make joint R&D activities with AMM”
item were chosen by a higher percentage of the local firms. This indicates more efforts of the
local firms to acquire new technologies but it also reflects that foreign firms do not prefer
these items since they make more technological production compared to local firms. This is
verified by the fact that higher amount of foreign firms chose “make joint R&D activities
with AMM” item which requires high technology.
A significant difference has been detected in terms of “get training”, “undertake R&D
activities and/or improve existing R&D activities” and “get consultancy from universities”
(each at 10% level) between local and foreign firms. A significant difference has also been
detected in terms of “undertake R&D activities and/or improve existing R&D activities” (at
1% level), “make joint R&D activities with AMM” (at 1% level) and “sign agreements to
provide skill and knowledge transfer” (at 10% level) items between the direct suppliers and
non-direct suppliers (chi-square test).

243
Table 5.38: Future Projections related to Acquisition of New Technologies
Source: Author calculations based on survey results
Notes: ***, **, * denote significance level at the 1%, 5% and 10%, respectively (chi-square, 2-sided).
Fisher’s Exact test has been used if one or more cells have an expected count ≤ 5.
Legend: LF (Local Firms); FF (Foreign Firms); DSF (Direct Supplier Firms); AF (All Firms)
5.10. Summary
Major findings of this chapter can be summarized under nine headings in the following way:
General characteristics of the surveyed firms
o More than one quarter of the firms (27%) in the sample is foreign firms and they are
under the full control of foreign capital. Especially German firms dominate the
foreign firms.
o Most of the firms in the sample are medium (51%) and large-sized (40%) firms
according to number of employees. Moreover, the share of the firms that their sales
are higher than TL 10M is 76%. Foreign firms are large-sized firms in terms of the
number of employees and sales, and they are also younger (most of them were
established after year of 2000) compared to local counterparts.
o Large majority (80%) of the firms in the sample are direct suppliers of AMMs in
Turkey. The statistics related to firm-size (large average firm-size measured by the
number of employees or by total sales) also confirms our expectations related to
higher number of direct suppliers in the sample.
LF FF DSF AF
% % % %
Get training 86.55* 75.56* 84.09 83.54
Undertake R&D activities and/or improve
existing R&D activities 85.71* 75.56* 87.12*** 82.93
Analyze rival products and processes 63.87 51.11 59.09 60.37
Make joint R&D activities with automotive
main manufacturers 58.82 60 64.39*** 59.15
Get consultancy from Universities 35.29* 22.22* 31.82 31.71
Get consultancy from domestic 30.25 24.44 30.30 28.66
Get consultancy from abroad 25.21 24.44 26.52 25
Bring experts from abroad 17.65 15.56 18.94 17.07
Sign agreements to provide skill and
knowledge transfer 17.65 11.11 13.64* 15.85
Hiring expert staff from automotive
manufacturer(s) 6.72 2.22 6.82* 5.49
N 119 45 132 164

244
o Large majority (92%) of the firms are exporters. Generally, the statistics show that
number of the firms (14) that produce goods for only domestic market is very low in
the sample; most of them probably produce goods for global production networks of
which they are probably a part. However, foreign firms have higher export shares
and they are more export-orientated compared to local firms. One of the explanations
of this situation could be that they are incorporated into global production networks.
This could also be the reflection of their high competition level because global
markets are more competitive than domestic markets. Lastly, major market of the
42% is overseas countries.
o More than half of the firms (52%) in the sample manufacture high-tech (high-
technology level) products, but technology level of the foreign firms are higher than
both the direct suppliers and local firms.
o 21% of the firms are part of a MNC and 86% of them have MNCs among their
customers.
o The statistics related to direct suppliers are generally following same pattern with all
firms but they possess lower values than foreign firms, while possess higher values
than local firms.
KTTs related to production process, product, financial and training activities
o It is found that various types of the transfers have been provided to suppliers mostly
at “rarely” degree by their customers. However, transfers related to production
process are provided more often than both product and financial transfers. These
confirm that relationships between customers and suppliers are based on strategic
production policies.
o One important finding is that higher quality transfer types are being provided more
to the foreign firms at higher rates compared to direct suppliers and local firms.
Direct suppliers generally bear the same characteristics as local firms.
o Financial transfers have less frequency among these transfers. Consumers generally
do not make financial transfers to the suppliers, but if they do they prefer making
pre-financing of machinery and equipment and/or prepayment before delivery.
Financial transfers are also more provided to foreign firms at higher rates.
o Various training types and modes are being also provided to personnel of suppliers
by customers. Training activities are mostly given to “production/operation staff” in
the mode of “off-the job training”. However, foreign firms get more training
activities than local firms. This situation does not mean that foreign firms need more
training because of lower capability of their human capital; on the contrary,
customers prefer to work mostly with foreign firms because of high technological

245
capabilities and absorptive capacity level. These kinds of activities are generally
provided by customers on the basis of new product development process. Therefore,
this confirms that strategic relationships between foreign firms and AMMs
(customers) are very strong and it reflects that it is necessary to have very qualified
personnel to be benefited from these activities. The findings that more visual
trainings are provided to local firm compared to foreign firms confirm this situation.
Market and competition
o Major market of the firms is the domestic and it is followed by the European
countries (Germany, France and England are the first three markets in EU). Major
third market of the firms is Middle East.
o Main competitors of the local firms are in Turkey and they also agree that domestic
competition is very intense. On the other hand, main competitors of the foreign firms
are at abroad and they also agree that global competition is very intense. This means
that foreign firms consider less the domestic firms as their competitors since they are
larger scale firms and have superior capabilities in terms of technology.
Technology capabilities
o Firms seem to have high technology capabilities especially related to production
such as on-time delivery, quality control, design, testing and analytical capability.
However, foreign firms have better capabilities in most of the factors requiring
higher technology and knowledge. This situation explains why they have more
industrial quality certifies and they conduct more technology agreements in terms of
knowledge and technology acquisition and development than local counterparts. On
the other hand, direct suppliers have better capabilities as to the features required by
AMMs for the suppliers and have high quality levels compared to other firms.
o Firms have acquired technologies from many sources. However, the most important
source is different between three groups of the firms. Accordingly, DS is the most
important technology source for local firms, PC for foreign firms and DAMM for
direct suppliers. Universities are seen in the last rank by the firms as a technology
source.
o Most of the firms (61%) are in an intermediate position in terms of their design
capabilities. In other words, design capabilities of the majority of firms are rather
weak. However, direct suppliers perform better design capability compared to
foreign and local firms.
o Majority of the firms carry out co-design activities related to product with their
customers and also they are included to this process from its beginning. The most
important partner in these activities is DAMM and followed by OAMM. This points

246
out that the most important partner of the firms in co-design activities is AMMs in
domestic or overseas. On the other hand, the least cooperated partner is universities.
Supply chain
o Majority of firms (86%) produce goods for MNCs and this shows that firms are a
part of global production networks and also they are capable to produce for MNCs.
o Majority of the firms (83%) carry out their total sales mainly to only one customer,
and 40% of the firms become the sole supplier of their most important customers
(AMMs).
o Majority of the foreign firms (84%) are subsidiaries of MNCs and global suppliers of
the AMMs as expected. On the other hand, minority of the local firms (36%) are
dependent on domestic firm/group/holding.
o Main customers of the firms are AMMs at domestic (46%) and overseas (19%). This
confirms that most of the firms in the sample are first-tier suppliers of AMMs.
However, foreign firms (77%) carry out more production for AMMs than both direct
suppliers (73%) and local firms (60%) do.
o Most two important input sources of the firms are DS and OS, respectively. They are
followed by DAMM for local firms and PC for both foreign firms and direct
suppliers.
Cooperation
o The firms engage in cooperation activities with various external parties and majority
of them evaluates these activities as important to improve their technological and
production capabilities. However, strategic collaborations between foreign direct
suppliers and AMMs are most strong and foreign direct suppliers are benefited much
more from these activities compared to local direct suppliers.
o In the result of assistances received from customers, firms achieved very important
developments in many areas such as quality control, production process,
engineering, design, productivity, export, profitability etc. However, local firms are
affected more positively by these assistances. This indicates that local firms are not
being enough capable of absorbing these assistances.
Direct suppliers
o 80% of the firms in the sample are the direct suppliers of the AMMs in Turkey.
o Firms generally apply to the AMMs by their own efforts to be direct supplier;
however, local firms spend more effort in order to be direct supplier.
o Firms are extensively benefited from the assistances of AMMs in fields of product,
production process, design etc. However, foreign direct suppliers are more benefited

247
from these assistances as a result of having higher technological capabilities and
absorptive capacity.
R&D, innovation activities and absorptive capacity
o The rate of the firms that conduct innovation activities (88%) is higher than that of
the firms conducting R&D activities (81%). Majority of the firms (60%) prefer to
conduct these R&D activities in a separated R&D department. AMMs are also an
important factor affecting R&D activities of the firms.
o Foreign firms make three times more R&D expenditures compared to local
counterparts. Direct suppliers get more financial support for R&D from government
or various institutions.
o Firms conduct cooperation with external parties in terms of innovation and MNCs
play an important role in this process. Direct suppliers conduct innovation activities
more with AMMs, whereas foreign firms with parent company and local firms with
domestic suppliers. However, least cooperated external party is the universities.
o Firms are more successful at making technological innovation activities especially in
the field of production process; however, they do not prefer to get patents.
o According to indicators formed in order to get informed about the absorptive
capacity of the surveyed firms, foreign firms have higher absorptive capacity than
both the direct suppliers and local firms.
Performance and future projections
o Majority of the firms had been achieved performance increases in terms of
production capabilities in the last three years. However, foreign firms performed
more performance than both direct suppliers and local firms.
o Being a direct supplier of AMM is regarded as the most effective reason by both the
direct suppliers and foreign firms for performance increases. Moreover, cooperation
with the universities is not seen at a satisfactory and sufficient level for performance
increases by the firms.
o Local firms are seen to make more efforts to acquire new technologies since they
make less technological production compared to foreign firms.
In conclusion, foreign firms are seen to dominate local firms in terms of many indicators and
absorptive capacity level (such as KTT, technological capabilities, size, export intensity,
qualified human capital, producing high-tech and complex products, performing R&D and
innovation activities, productivity). In the conclusion of these capabilities, foreign firms set
up more extensive relations with their customers and benefited more from these.
Furthermore, within the three groups of firms direct supplier firms perform better than local
firms related to above mentioned indicators but not better than foreign firms.
248
CHAPTER 6
SURVEY FINDINGS (2):
ECONOMETRIC ANALYSIS
In this chapter, an econometric analysis will be conducted by using gathered survey
quantitative data in an attempt to identify the determinant factors impacting on different
types of KTTs provided by customers to suppliers at inter-firm level, on various
characteristics and on activities of the suppliers discussed in the previous Chapter 5 on nine
main headings143
. The chapter is organized as follows: in first two sections, econometric
model and explanatory variables introduced in the regressions will be examined. In third
section, Factor Analysis (FA) method used as a data reduction technique for the scales in the
construction of the dependent variables will be presented. Then, in sections fourth and fifth,
logit and ordinal logit estimation methods will be examined; econometric findings will be
presented and analyzed in detail, respectively. Lastly, findings will be summarized.
143
All analyses and estimations were performed by using STATA/SE 10.1 program.

249
6.1. Model
In order to analyze the determinant factors impacting on various characteristics and activities
of the surveyed suppliers and on different types of KTTs provided by customers to suppliers
discussed in the previous chapters, logit and ordinal logit regression analyses will be used
depending on the nature of the dependent variable.
The following topics will be examined by applying logistic regression analysis to survey
data:
Factors affecting being a direct supplier of AMMs in Turkey,
Determinants of R&D and innovation activities (related to product) of the suppliers
(Almeiada and Fernandes, 2008; De Negri and Turchi, 2007; Evenson and Westphal,
1995; Pamukçu, 2003),
Determinants of technology agreements, acquisition and sources (Braga and
Willmore, 1991; Basant, 1997; Evenson and Westphal, 1995; Katrak 1989, 1990 and
1997),
Determinants of the co-design activities related to products and the partners in
cooperation for such activities.
Then, the following topics will be examined by using ordinal regression analysis:
Determinants of the KTTs provided by customers to suppliers at inter-firm level
related to production process, product, training activities and financial assistances
(Berger, 2005; Giroud, 2003; Techakanont, 2002; Techakanont and Terdudomtham,
2004),
Determinants of the technology capabilities of the suppliers in terms of production and
design,
Factors that affect the cooperation activities of the suppliers with other firms (Berger,
2005; Giroud, 2003; Techakanont, 2002; Techakanont and Terdudomtham, 2004;
Wasti et. al. 2006 and 2009),
Determinants of the improvements in production capability as a result of assistances
(support, advice or knowledge transfer) received from customers (Berger, 2005;
Giroud, 2003; Techakanont, 2002; Techakanont and Terdudomtham, 2004),
Factors that affect the benefits of being a direct supplier,

250
Determinants of the cooperation level with partners in innovation activities,
Determinants of the performance increases/improvements in last three years related to
production capability.
The basic model to be estimated is as follows:
3 4 5
6 7 8 9
10 11 12 13
14 15
0 1 2Y + FIRMAGE + FIRMSIZE + EXPINT + FOREIGN+ DIRECTSUPP
LOCALGROUP+ CLIENTMNC RDDEPT + PRODUCTINNO+
SENGPER HIGHTECHPROD+ HIGHDESCAP+ ONESUPP+
SSUBCONT RDSUB e
Where, Y indicates the dependent variable which is binary (for logistic regression) or ordinal
(for ordinal logistic regression). In the analyses, we estimate the several variations of the
above model. The definitions of explanatory variables will be defined in detailed below. The
brief descriptions of the explanatory variables, descriptive statistics and correlation matrix
are provided in Table 6.15, Table 6.16 and Table 6.17, respectively.
6.2. Explanatory Variables
Based on the collected primary survey data at firm-level, fifteen indicators related to various
characteristics, activities, technology capabilities and customer relationships of the supplier
firms have been constructed to be used as explanatory variables in the regressions144
. In this
section, it will be presented how to create these variables and their expected impacts on the
dependent variables. These variables include the followings:
I. FIRMAGE, age of the firm, is the natural logarithm of the age of supplier firm. It has
been constructed by subtracting the establishment year of the supplier from 2010,
which is the year when the survey was conducted (see section 5.1.2). FIRMAGE may
indicate its experience in the automotive sector in terms of production and proxy the
extent to which it might have trust-based relationships with its customers. The higher
the trust between both partners, the lesser the transactions costs incurred and the
144
Total number of the explanatory variables constructed from survey data was 27. In the result of the data
analyses, it was detected that 12 of them were not appropriate to use in the analyzes because of high number of
missing values, high correlation rates with other variables, yielding insignificant results etc. so remaining 15
variables were used in the analyses. These 12 unused variables are TURNOVER, FOREIGNGROUP,
PARTMNC, RDEXP, WORKTGT, RDINT, PRODUCTIVITY, INNO, RD, MC, TECHPROD, and
DESCAPAB. Please see next footnotes for the description of these variables.

251
higher will be the probability to experience KTT-related activities with customers.
And they can easily establish relationships with customers or attempt in this direction.
Moreover, experienced suppliers may have more business networks and strategic
relationships with customers compared to new established suppliers. On the other
hand, more recently established suppliers may act more aggressively in contradiction
to the older suppliers, which may show signs of rigidity and cannot adapt to a
changing environment. Also, they may have some disadvantages such as financial
support, lack of information, market experience, technology capabilities etc.
II. FIRMSIZE145
, size of the firm, is measured as the logarithm of the total number of
employees (see section 5.1.3). FIRMSIZE may proxy a host of variables potentially
affecting KTTs, technology capabilities, R&D and innovation activities of the
suppliers. It may be an indicator that reflects intra-firm institutionalization, scale and
scope economies in the production process, cost and availability of financial
resources, and extent of the labor division within the firm. On the other hand, it may
affect negatively KTT-related activities of suppliers since large suppliers may be self-
sufficient and demand less KTT from customers. However, increasingly, even the
human and financial resources of the largest firms cannot be sufficient for conducting
R&D and innovation activities, leading them to collaborate with other firms. In
addition, it is also admitted that firm size may act as a proxy for production
capabilities since it is related to the production capacity or scale of firm. Moreover,
interviews with the AMMs showed that they tend to consider strong production
capability as a necessary condition for the establishment of KTT-related activities with
suppliers.
III. EXPINT, export intensity, is measured as the ratio of exports to total sales (see section
5.1.5). In recent years, especially onwards 2000, AMMs as well as suppliers in Turkey
increased the proportion of their sales sold on global world markets. The intense
competition prevailing on abroad may oblige supplier firms to cooperate with their
customers in order to improve the quality of their products, receive know-how
pertaining to the production process in order to increase its efficiency and to carry out
design-related activities. In some instances, these KTT-related activities may be
conducted with the help of customers abroad. Therefore, the impact of this variable
depends also on the position of supplier firms in the supply chain of MNCs. Moreover,
145
It was preferred to use this variable instead of “the logarithm of the total sales value” variable (TURNOVER),
since latter one includes high number of missing values.

252
this variable may be an indicator of the level of the absorptive capacity of suppliers,
since as mentioned in detail in section 5.8.3, export markets require high technological
capability dealing with a more competitive market.
IV. FOREIGN146
, foreign firm, is a dummy variable and shows that a supplier firm is
owned by foreign agents (see section 5.1.1). It takes the value of 1 if the share of firm
equity owned by foreigners equals at least to 10%, 0 otherwise147
. Foreign suppliers
may possess a number of intangible proprietary assets that enable them to compete
with domestic suppliers without any need of KTTs. On the other hand, these same
proprietary assets may enable them to pursue advanced KTTs with their customers,
which may operate in Turkey or abroad, especially if they are asked by their
customers to manufacture technologically sophisticated parts and components.
Conversely, these can serve as an obstacle for the foreign firm in the cooperation
activities with other firms in the country in which it operates. If it is an affiliate of a
MNC, it might transfer KTT from its parent firm (see section 5.8.2.1). Hence, the
effect of this variable on KTTs remains an empirical issue.
V. DIRECTSUPP, direct supplier, is a binary variable and takes the value of 1 if a firm
declares being the direct supplier of at least one AMM operating in Turkey, 0
otherwise (see sections 5.1.1 and 5.7). By direct supplier, we mean the first-tier
suppliers working directly with the AMMs. This close relationship may be associated
by the production of the relatively sophisticated part and components for customers
and hence more prone to KTTs. By definition, the likelihood of lower-tier suppliers
(such as second and third-tier) to benefit from such an advantage is extremely low.
Having a good reputation in the sector, benefiting from a stable demand and being part
of design activities in its early stages are other – potential – advantages of being a
direct supplier which may exert a positive influence on KTT-related activities (see
section 5.7.3). Moreover, for the same reasons mentioned above it shows that
absorptive capacity of the supplier is high.
146
It was found a high correlation rates between FOREIGN dummy variable and these two dummy variables
constructed from survey: “Dependent on any overseas firm/group/holding” (FOREIGNGROUP) (0.88) and
“being a part of MNC” (PARTMNC) (0.85). In addition, the correlation coefficient between these two last
variables was equal to 0.83. Therefore, these two variables were not used in the regression analysis to avoid the
problem of multicollinearity. 147
In accordance with the previous chapters, we here also define foreign firms as firms if FS is at least 10% or
more in total capital of the firm.

253
VI. LOCALGROUP, being part of a group in Turkey, is a dummy variable and it informs
us whether a supplier firm is part of a larger group, a parent company or holding (see
section 5.5.1). Being part of a group can bring many advantages related to financial
structure, R&D and innovation activities, market structure, business network etc. Such
a membership may be conducive to financial and training assistances and KTTs in
case the supplier firm works for a manufacturer itself part of the larger group, since
this can reduce transaction costs and build trust between both firms. On the other
hand, such a status may exert a negative effect on KTTs since the role attributed to the
supplier within its group may not be conducive to such relationships. This negative
effect may also be the result of the formal technology transfer channels used by the
group –i.e. technology licenses – which reduce the need of KTTs.
VII. CLIENTMNC, MNC among clients, is also a binary variable indicating whether a
supplier firm has a MNC among its customers (see section 5.5.1). If this is the case,
then MNCs can impact positively on KTTs of suppliers by being more stringent on
issue such as delivery time, quality, and cost and also by selecting among its suppliers
those capable ones to act as co-designer for it. In this context, KTTs can take place
from same MNCs and/or various collaborations can be established with other firms.
Of course, the position of suppliers in the supply chain of MNCs is also important for
the final outcome. In summary, it may affect positively the technology, innovation,
production and design capabilities of the suppliers. This assumption has been tested by
introducing this binary variable in the regressions.
VIII. RDDEPT148
, possessing a R&D department, is a binary variable indicating whether
supplier has a separate R&D department or not (see section 5.8.1). It indicates that
R&D activities are carried out by suppliers and they have also been made at an
advanced level. These activities also show that supplier firm has a specific background
related to production and especially in technology fields. This can increase the firms’
self-sufficiency in the field of technology and reduce the need of KTTs from outside
the firm. Moreover, this variable is an indicator of the level of the absorptive capacity
of suppliers. A higher absorptive capacity may signal to AMMs the higher potential of
a supplier in such innovative activities as co-design, product quality improvement,
148
It was preferred to use this variable instead of “carrying out R&D activities” variable (RD), since latter one
could not yield any significant results in the regression analyses. Although, we wanted to use “logarithm of the
R&D expenditures” variable (RDEXP) and “share of the R&D expenditures in the total sales” variable (or R&D
intensity (RDINT)) in the analyses, they included so many missing values and had high correlation rates with
SENGPER variable.

254
product development, etc. and therefore foster cooperation between the two parties
and give rise to KTTs.
IX. PRODUCTINNO149
, carrying out innovation activities related to product, is also a
dummy variable indicating whether supplier carries out innovation activities related to
product (see section 5.8.2.2). This variable is an indicator of the level of the
innovation activities in terms of technology and design capabilities of the suppliers. A
higher product innovation activity may signal to AMMs the higher potential of a
supplier in such activities. As an indicator, this variable may also be play an important
role related to strategic relationships in terms of new product development between
AMMs and suppliers. Therefore, this can increase KTTs from AMMs to suppliers.
Moreover, it could be an indicator for the absorptive capacity of the supplier firms.
X. SENGPER150
, share of engineers in total employment, is measured as the ratio of
engineers to total employment. This variable is an indicator for the high-skilled human
capital level of the suppliers. Besides, a high amount of highly-skilled work force is an
important indicator of advanced technological capabilities. This variable is also used
as an alternative indicator to measure the absorptive capacity of suppliers. Because the
most important requirement of operating with complex and developed production
technologies and performing R&D and innovation activities is an advanced absorptive
capacity at the firm-level (see section 5.8.3).
XI. HIGHTECHPROD151
, manufacturing high-tech products, is a dummy variable
indicating that supplier manufactures high-technological products. Manufacture
technologically complex or high-tech products could be an indicator for the
technological level of the supplier (see section 5.1.6). Because, firms involved in high-
tech production need to deal with developed production processes and innovation
activities. Therefore, firms can lead to the search of KTTs for these activities.
Moreover, manufacturing high-tech products may foster cooperation between AMMs
and suppliers.
149
It was preferred to use this variable instead of “carrying out innovation activities” variable (INNO), since
latter one includes high number of missing values, has high correlation with RDDEPT, and could not yield any
significant results in the regression analyses. 150
Moreover, we want to use productivity variable, “logarithm of the total sales per employee”
(PRODUCTIVITY) in the analyses, however, they include so many missing values and have high correlation
rates with SENGPER. 151
It was preferred to use this binary variable instead of “technological complexity level of the manufactured
product” ordinal variable (TECHPROD) as (1) low, (2) medium and (3) high, since latter one could not yield
significant results in the regression analyses.

255
XII. HIGHDESCAP152
, own a high-design capability, is a dummy variable indicating that
design capability of the supplier is quite high or developed (see section 5.4.5). Design
capability could be an important indicator for the supplier’s technology capability and
innovation activities related to products. It may also play an important role in the
supplier selection process, in the development of new products and in various
cooperation activities with other firms (especially with AMMs). Moreover, to become
a direct supplier, own a high design capability is seen as important criteria by AMMs
(see sections 7.4.3 and 7.4.5). Lastly, to be capable of high design may foster
cooperation and increase the probability of KTTs from customers.
XIII. ONESUPP153
, being the sole supplier of the most important customer, is a dummy
variable indicating that supplier is the sole supplier of the most important customer per
item purchased. For the reasons that mentioned in detail in sections 5.5.4 and 5.7, the
effect of this variable will be analyzed.
XIV. SSUBCONT154
, share of subcontracting contracts in total contracts, is measured as
the ratio of subcontracting contracts to total contracts (section 6, question 5 in the
questionnaire, see Appendix I). These agreements are signed to perform some tasks in
order to lower costs and share risks between suppliers and AMMs. It could also be
indicator for the cooperation level between these firms in automotive supply industry
since these activities are regularly performed with the same firms. Hence, these allow
suppliers to further develop their skills and technology capabilities, and may give rise
to KTTs to suppliers.
XV. RDSUB, R&D subsidy from government or various institutions, is a dummy variable
indicating that supplier gets R&D support from various institutions such as KOSGEB
– TUBITAK – TEYDEB – TTGV - EU (see section 5.8.1). It is expected that these
kinds of subsidies show a positive effect on firms’ R&D activities. Hence, the effect of
this variable will be analyzed only on possessing a R&D department (RDDEPT)
dependent variable as an indicator of performing R&D activities.
152
It was preferred to use this binary variable instead of “design capability level of the supplier” ordinal variable
(DESCAPAB) from 1 (low) to 4 (high) since latter one could not yield significant results in the regression
analyses. 153
It was preferred to use this variable (ONESUPP) instead of “main customer of the supplier firm” ordinal
variable (MC) as 1 (DAMM), 2 (OAMM), 3 (DS) and 4 (OS) since latter one could not yield significant results in
the analyses. 154
It was preferred to use this variable instead of “logarithm of the duration of the working together with the
most important customer” variable (WORKTGT) (section 6, question 4 in the questionnaire, see Appendix I)
since latter one could not yield significant results and had high correlation with the FIRMAGE variable.

256
Table 6.1 shows the summarized relationships between supplier characteristics and
explanatory variables as a hypothetical based on literature and previous empirical studies.
These variables may act as a proxy for supplier characteristics, in other means they may be
an indicator for the level of the supplier firm capabilities.
Table 6.1: Summary of the Relationships between Supplier Characteristics and
Explanatory Variables
Supplier Characteristics Explanatory Variables
General Characteristics
- FIRMAGE
- FIRMSIZE
- FOREIGN
- DIRECTSUPP
- LOCALGROUP
Production Capability
- EXPINT
- RDDEPT
- SENGPER
- HIGHTECHPROD
- HIGHDESCAP
Innovative Capability
- RDDEPT
- PRODUCTINNO
- HIGHDESCAP
Absorptive Capacity
- EXPINT
- DIRECTSUPP
- RDDEPT
- PRODUCTINNO
- HIGHDESCAP
- SENGPER
Buyer- Supplier Relationship
- DIRECTSUPP
- CLIENTMNC
- ONESUPP
- SSUBCONT
Summary statistics on the explanatory variables are provided in Tables 6.16 and Appendix L.
Moreover, a correlation matrix containing simple correlation coefficients between
explanatory variables is given in Table 6.17. As it can be seen from the table some of the
correlations are significant, however they are below +/-.40 and most are below .20, therefore
multicollinearity between explanatory variables will not occur and will not affect the
interpretations of the analysis results.

257
6.3. Factor Analysis (FA)
Before proceeding to regression analyses, it is aimed to combine a number of interrelated
items in the scales. Therefore, some of the dependent variables before using them in the
regression analyses are constructed from the scales to reduce the number of related items (or
the number of dependent variables) in such scales included in the survey. For this aim, items
are subjected to FA or Principal Components Analysis (PCA)155
. By using FA method as a
data reduction technique, individual items in the scales are grouped or refined to form a
smaller number of items.
In the literature, there are so many recommendations on sample size to run FA: a sample size
from 100 to 300 observations (Froman, 2001; Hair et al., 2006; Meyers et al., 2006), at least
150 observations (Tabachnick and Fidell, 2007) or ten observations for each item in the scale
(Nunnally, 1978). In our study, a sample size of 165 is considered sufficient to conduct FA.
The suitability of data for the application of FA is assessed by both Kaiser-Meyer-Olkin
Measure of Sampling Adequacy (hereinafter KMO measure) (Kaiser 1970, 1974) and
Bartlett's Test of Sphericity156
(hereinafter Bartlett’s chi-square) (Bartlett 1954) statistics. For
a good FA, KMO measure value should be at least 0.6 (Pallant, 2007) and Bartlett’s chi-
square should be statistically significant (p<0.05) (Tabachnick and Fidell, 2007). These two
statistics are provided at the end of each table of FA presented in each section. In the FA,
PCA is used as an extraction method and Oblimin with Kaiser Normalization is used as a
rotation method.
Number of factors157
was extracted using eigenvalue and loading factor of 0.4. By these
methods, eigenvalues of the factors are analyzed and the number of the factors is accepted
according to their eigenvalues with more than one by using Kaiser’s criterion (Hair et al.,
2003). In the selection of items, a cut-off loading of 0.4 has been used to screen out items
(Hair et al., 2006; Stevens, 2002); in other means factor loadings less than 0.4 are removed
from the scale to improve the scale. In addition, after conducting the FA, the reliability tests
(Cronbach alpha tests) are again conducted to ensure that the new scales are statistically
reliable (see section 4.6.1.10 for details) and reported together with the results of FA in each
155
These two terms (FA and PCA) are often used interchangeably by researchers in the literature but we prefer to
use FA. 156 In this test we want to reject the null hypothesis that the correlation matrix is an identity matrix. 157
Actually PCA yields components but it is preferred to use “factor” term for referring to the group of related
items.

258
section. Finally, in the computation of the dependent variables, a replacement method is
applied to the items in each factor. Moreover, in the labeling of the factors, we looked for the
highest loading items on each factor.
In the remaining part of this section, we will analyze the dependent and explanatory
variables to explore the association between them (identified in section 6.2 and Table 6.1) on
the basis of the theoretical discussions in the literature and previous empirical studies;
thereby findings of the econometric estimations will be presented and examined.
6.4. Logistic Regression Analysis
In this section, logistic regression analysis, also called a logit model, will be conducted in an
attempt to identify factors impacting on various characteristics and activities of suppliers
discussed in the previous chapter158
. Some points about the logistic regression model are
worth mentioning.
All the dependent variables used in the analyses are binary variables (0 or 1).
It is a nonlinear regression model and estimated by maximum likelihood (ML).
Although ML estimation works well in small samples, it is not recommended to use it
with sample size less than 100. In the literature, there is not any consensus on the
sufficient number of observation to conduct ML, however, it is considered that at least
10 observations per parameter is sufficient to produce reasonable and robust results,
therefore, we think that our sample of 165 cases is enough to use the ML estimation
(Long, 1997)159
.
Due to our cross-sectional data, a statistically significant relationship between
explanatory and dependent variables will indicate an association between these
variables rather than a causal relationship.
The estimated coefficients obtained by logit model do not give any information about
the change in the possibility of occurrence of dependent variable associated with the
impact of a one unit change in the explanatory variable (marginal effect). Instead, they
represent the change in the log-odds of the dependent variable associated with a unit
158
For details on the logistic models, see Amemiya (1981), Maddala (1983), McFadden (1984), Liao (1994),
Long (2001), Greene (2008) and Verbeek (2008). 159
In addition, we remark that a limited number of the observations (165) that we have can be effective in the
calculation of the standard errors of the coefficients. In other words, an explanatory variable that would be
statistically significant in a situation of high number of observations can be insignificant at 10% level in our study
259
change in the explanatory variable, for instance, it tells how the log of the odds in
favour of being a direct supplier change as firm age changes by a unit, given that all
of the other explanatory variables in the model are held constant160
.
The formula used for the marginal effects differs from the formula used to estimate the
coefficients, and it is a nonlinear function of all explanatory variables. In our study, it
is not possible to use marginal effects because of many dummy variables included in
the model161
. However, the sign of a coefficient is the same as the sign of its marginal
effect, and significance levels are very close to each other162
. Therefore, we shall
interpret the results over the signs of the coefficients. In other words, the results of the
regression analyses will be examined below with an emphasis on the interpretation of
the coefficients estimated.
6.4.1. Determinants of being a Direct Supplier of AMMs in Turkey
Findings of the logistic regression analysis on the determinants of being a direct supplier of
at least one of the AMMs operating in Turkey are given in Table 6.18. As mentioned in detail
in section 5.1.1 and 5.7, 132 firms out of 165 firms (80%) stated that they are the direct
suppliers of one or more AMMs in Turkey. Dependent variable takes the value of 1 if the
firm is a direct supplier, 0 otherwise. Explanatory variables have been included to logit
model in three stages to determine the problem of a possible multicollinearity: There are first
eight variables in column one (Model I), then three variables are added, SENGPER,
HIGHTECHPROD and HIGHDESCAP (Model II), lastly ONESUPP and SSUBCONT
variables are added to the model (Model III).
Three explanatory variables exert a positive and significant effect on the probability of being
a direct supplier of AMMs in Turkey: FIRMAGE (significant at 10% level), FIRMSIZE
(significant at least at 5% level) and SENGPER (significant at 5 % level). In other words,
this finding shows that probability of being a second or third- tier supplier (versus being
160 When interpreting the findings concerning some of the variables, we will remark that the coefficients showing
the direction of the effects of an explanatory variable are calculated for a situation that other explanatory
variables in the regression model are constant – ceteris paribus –. 161
Since the derivative used for marginal effect is not so appropriate to apply the dummy variables included to
model as if they were continuous variable. In this case, the results are not so accurate and it might be optimistic to
rely on these results (Greene, 2008). 162
Coefficients also provide information about the relative marginal effect of two variables. In other words, if the
coefficient of X variable is higher than that of Y variable, the marginal effects of X will be higher than that of Y.
See Liao (1994), Greene (2008) and Verbeek (2008) about the computation of marginal effects and their relations
with the coefficients.

260
direct supplier) increases with being a younger firm / with a decrease in total employment /
with a decrease in the share of engineers in total employment, ceteris paribus163
.
A significant (at 5% level) and negative association exists between EXPINT and dependent
variable, ceteris paribus. The finding may be explained by the fact that supplier firms
establish intense relations with the firms operating abroad with the increase of export share
in their turnover and therefore the possibility for being direct supplier of domestic main
industry decreases (the main firm to which they supply directly may be located abroad),
ceteris paribus.
Four dummy explanatory variables have also a statistically significant and positive effect on
the probability of being a direct supplier: FOREIGN (at 5% level), LOCALGROUP (at 5%
level), PRODUCTINNO (at least at 10% level) and HIGHTECHPROD (at 10% level). In
other words, probability of being a direct supplier of the AMMs is higher for the firms / with
foreign ownership, / dependent on a local group, / carrying out product innovation activities
or / manufacturing high-tech products, ceteris paribus164
. These findings may indicate that
technological competence of foreign firms operating in the field of automotive supply
industry is superior to local firms; this case can be explained by the advantages provided by
the intangible assets of MNCs to their associates. Additionally, being involved in product
innovation activities and manufacturing products of high technology indicate that some
competences which should be present in direct supplier firms are available in the firms
engaged in these activities according the viewpoint of AMMs. Higher possibility of firms
affiliated to a local group to be the direct supplier is similarly the result of these firms having
greater, more technological and more developed business networks.
6.4.2. Determinants of Possessing a R&D Department
Estimation results on the determinants of possessing a separated R&D department are
presented in Table 6.18. Dependent variable takes the value of 1 if the firm has a R&D
department, 0 otherwise. As discussed in detail in section 5.8.1, 133 firms out of 165 firms
(81%) stated that they perform R&D activities, and 99 of them (60%) also possess a
163
In other words, for a one unit increase in FIRMAGE / FIRMSIZE / SENGPER, the log odds of being direct
supplier increases by 0.59 / 0.893 / 0.076 given that all of the other variables in the model are held constant (see
Table 6.18). 164
The coefficients for dummy variables are interpreted in a slightly different way. For instance, being a foreign
firm (versus non-being) increases the log odds of being direct supplier by 1.328 (see Table 6.18).
261
separated R&D department. Possessing R&D department bears greater importance with
regards to the fact that these activities are carried out on an advanced level as well as
indicating that R&D activities are performed; therefore the issues determining the possession
of R&D department will be analyzed. In addition, regression analyses we generated by using
dependent variable of performing R&D activities did not yield significant results and
therefore regression analyses regarding the issues determining the possession of R&D
department were made.
It is found significant and positive association between two explanatory variables
(FIRMSIZE (at 10% level) and SENGPER (at 5% level)) and possessing a R&D department
dependent variable. The higher either the firm size or the share of engineers in total
employment, the higher the probability of owning R&D department is observed. The
possibility of conducting R&D activities throughout the manufacturing industry and in many
sub-sectors increases in line with the size of the firm as pointed out in literature review
carried out in Cohen (2010). Greater possibility for firms having a greater share of engineers
in total employees to possess R&D department when compared with the firms not having
such a share may be associated with the relatively higher technological capabilities and
absorption capacity of firms ranking in this category. Furthermore, the effect of these two
explanatory variables on the possibility of being direct supplier was also found positive and
statistically significant (see section 6.4.1); therefore the effects between these variables can
be interpreted similarly.
The estimated coefficients of the four dummy variables are also statistically significant and
exert a positive effect on the probability of owning R&D department: LOCALGROUP (at
10% level), PRODUCTINNO (at 1% level), HIGHDESCAP (at least at 5% level) and
RDSUB (at 1% level). It should be noted that two dummy variables, LOCALGROUP and
PRODUCTINNO, have also significant and positive effect on the probability of being a
direct supplier (see section 6.4.1). In other means, the probability of being a direct supplier
or owning a R&D department is higher for the firms dependent on a local group and
conducting product-innovation activities, ceteris paribus. Similarly, having a high design
capability also increases the probability of owning a R&D department. Moreover, R&D
subsidies are highly significant and have an important positive effect on the firms’ R&D
activities.
In sum, these findings are important in terms of indicating that firms having higher design
capabilities and manufacturing high quality and innovative technological products possess
R&D departments. Besides, they may indicate that firms operating in supply industry

262
manufacture high quality products for AMMs in global production chains. Also, an
important discovery regarding R&D incentives is that the incentives which were put into
effect in 1990s but has become widespread since mid-2000s have had positive effects on
R&D activities of automotive supply industry.
6.4.3. Determinants of Innovation Activities
Estimation results pertaining to the determinants of innovation activities of suppliers are
displayed in Table 6.19. Dependent variable takes the value of 1 if the firm conducts
innovation activities, 0 otherwise. As mentioned in detail in section 5.8.2, 146 out of 165
firms (88%) stated that they conduct innovation activities. Explanatory variables have been
included to logit model in three stages: There are first seven variables in column one (Model
I), then two variables are added HIGHTECHPROD and HIGHDESCAP (Model II), lastly
the CLIENTMNC variable is added to the model (Model III).
The impact of the three variables is statistically significant on the probability of carrying out
innovation activities: While EXPINT (significant at least at 5% level) and CLIENTMNC
(significant at 10% level) explanatory variables exert positive impact on this probability;
FOREIGN variable (significant at least at 10% level) exerts negative impact. Either an
increase in the share of export in total sales or presence of MNC among customers –
compared to those without – increases the possibility of conducting innovation activities,
ceteris paribus. This indicates that firms manufacturing for export market or MNC customers
both meet the required conditions (technology, design, quality, delivery, defect rate etc.)
regarding their products and re-design these products according to the conditions of the
export markets carry out technological innovation activities in terms of international
competition. The negative effect of being a foreign-capital firm is that foreign firms have a
lower possibility of making innovations when compared with the local firms, ceteris paribus,
which was confirmed with a series of studies on the developing countries165
. This finding
may point out that MNC affiliates (assumed that foreign firms are the affiliates of MNCs) are
equipped with the technology and knowledge of the main firm and thus either they do not
carry out innovation activities in the host countries or they perform “incremental
innovation” in order to adapt their products to local conditions. Standardization of consumer
preferences and emergence of the “world products” phenomenon in 21st century may affect
the innovation/R&D activities of foreign firms negatively. Moreover, we found that
165
UNCTAD (2005) and references in there, see Pamukçu (2003); Dayar and Pamukçu (2011) for Turkey.

263
FOREIGN variable exerts also negative impact on the probability of possessing R&D
department in section 6.4.2 but it is not significant (see Table 6.18). These findings overlap
with our survey findings in section 5.8.2.1 that foreign firms realize basic innovation and
R&D activities in their headquarters.
6.4.3.1. Determinants of Product Innovation Activities166
Results of the regression analysis on the determinants of product innovation activities are
given in Table 6.19. Dependent variable takes the value of 1 if the firm said “Yes” to the
question concerning to perform product innovation activities, 0 otherwise. As mentioned in
detail in section 5.8.2.2, 120 firms out of 164 firms (73%) stated that they perform product
innovation activities. Explanatory variables have been included to logit model in three
stages: There are first seven variables in column one (Model I), then two variables are added,
HIGHTECHPROD and HIGHDESCAP, (Model II), lastly the CLIENTMNC variable is
added to the model (Model III).
EXPINT explanatory variable exerts positive and significant impact on the probability of
performing product innovation activities (significant at 5% level) as well as on the
probability of innovation activities (see section 6.4.3). The finding as interpreted in the
possibility of performing innovation activities confirms that firms manufacturing for global
markets carry out various innovation activities regarding their products.
Two dummy variables, DIRECTSUPP and RDSUB (each one significant at 10% level),
impact also positively and significantly on the possibility of performing product innovation
activities. Being a direct supplier – compared to those without – increases the possibility of
conducting product-innovation activities, ceteris paribus. As explained previously (see
section 5.7), this finding is the result of the fact that the firms which are the direct suppliers
of AMMs make high technology manufacture, and meet the various quality and
manufacturing standards regarding the products and make closer technological cooperation
with the AMMs. The increasing possibility for conducting product innovation activities of
the firms receiving R&D incentive when compared with the firms not receiving these
incentives is important in terms of the fact that such incentives affect R&D activities
positively (see section 6.4.2) and increase the possibility of the firms for performing
innovation activities.
166
We also tested the determinants of innovation activities related to production process, supporting activities,
service, logistics, delivery and distribution (see Table 5.33); however, regression analyses did not yield
significant results.

264
6.4.4. Determinants of Technology Agreements
In this section, we examine the determinants of the technology agreements (TA) that
performed by suppliers with other firms so as to develop KTTs. Before proceeding to
regression analysis, FA is conducted for technology agreements scale. The details of the FA
including the reliability of the factors (Cronbach’s alpha) are shown below in Table 6.2.
According to these results, eleven types of the technology agreements were combined in two
factors (groups). The first factor was labeled as “low-advanced technology agreements”
(Factor 1), and second one as “advanced technology agreements” (Factor 2)167
.
Table 6.2: Factor Analysis of Technology Agreements (TA)
Source: Author’s calculations based on survey data
Notes: Table shows the factor loadings of each item above 0.4. The item 11 does not fit well with the
other items or it shows lowest loading on factors, therefore it was removed from the analysis.
Extraction method: Principal component analysis; Rotation method: Oblimin with Kaiser
Normalization. P-value is in bracket.
Legend; TA (Technology Agreements)
Estimation results on the determinants of the technology agreements performed by the
supplier firms are presented in Table 6.20. Dependent variables take the value of 1 if firm
performs technology agreements with other firms, 0 otherwise 168
.
Four explanatory variables exert a significant and positive influence on the probability of
performing “low-advanced technology agreements” (listed under Factor 1 in Table 6.2):
167
The reliability of the factors is also high, with a high Cronbach’s alpha value over 0.7. 168
As mentioned in detail in section 6.3, a replacement method is applied to the items in each factor in the
computation of the dependent variables for technology agreements (TA).
Factor 1 Factor 2
ItemsLow-Advanced
TA
Advanced
TA
1. Turn-key projects 0.559
2. Management contracts 0.671
9. Technical assistance agreement 0.513
3. Licensing agreement 0.505
4. Know-how agreement 0.610
5. Purchasing of engineering services 0.469
6. Joint venture agreement 0.653
7. Purchasing of license and/or patent 0.632
8. Agreements on personnel exchange 0.534
10. International subcontracting agreements 0.443
11. Agreements on the determination of product
design and/or technical specifications
Cronbach's
Alpha (α)
N=165, KMO Measure = 0.650, Bartlett’s chi-square = 203.32 (0.0000)
0.737
0.793

265
FIRMSIZE (significant at 5%), DIRECTSUPP (significant at 5%), RDDEPT (significant at
10%) and SENGPER (significant at 5%). On the other hand, four explanatory variables have
a statistically significant impact at 10% level on the probability of performing “advanced
technology agreements” (listed under Factor 2 in Table 6.2): SENGPER, SSUBCONT and
PRODUCTINNO variables impact positively these kinds of agreements, while
LOCALGROUP variable impacts negatively.
These findings reveal that the possibility for making such kind of technology agreements
regarding complex and advanced technology which includes KTT, increases according to the
technology level of the firms (RDDEPT, SENGPER, PRODUCTINNO), the increase in the
share of subcontracting agreements (SSUBCONT) and the size of the firm (FIRMSIZE).
Moreover, being direct supplier (DIRECTSUPP) increases the possibility of making such
kind of technology agreements compared to the firms which are not direct suppliers. The
negative effects of being a part of local group (LOCALGROUP) may be that such kind of
agreements are mostly realized by the group to which the firms are affiliated or the processes
which are subject to the agreements are mostly carried out by the affiliated main group firms
rather than the third party firms. However, negative effects of being a part of the local group
are open to discussion.
6.4.5. Determinants of the Sources of Technologies acquired and/or
used
In this section, we examine the determinants of the sources of the technologies acquired
and/or used by the firms (see section 5.4.4). Firstly, FA is conducted for the sources of
technologies scale. The results of the FA including the reliability of the factors are shown
below in Table 6.3. According to the results, seven types of the sources of technologies were
combined in three factors (groups). The first factor was labeled as “AMMs” (Factor 1), and
second one as “lower-tier suppliers” (Factor 2), and the last one as “universities and other
firms”169
(Factor 3).
Estimation results on the determinants of the technology sources acquired and/or used by the
suppliers are displayed in Table 6.20. Dependent variables take the value of 1 if a firm
acquires the technology from that source, 0 otherwise.
169
Private engineering and consultancy firms.

266
Table 6.3: Factor Analysis for the Sources of Technologies
Source: Author’s calculations based on survey data
Notes: Table shows the factor loadings of each item above 0.4. The item 5 does not fit well with the
other items or it shows lowest loading on factors, therefore it was removed from the analysis.
Extraction method: Principal component analysis; Rotation method: Oblimin with Kaiser
Normalization. P-value is in bracket.
Legend: DAMM (Domestic Automotive Main Manufacturers); OAMM (Overseas Automotive Main
Manufacturers); DS (Domestic Suppliers); OS (Overseas Suppliers); PC (Parent Company)
It is found a significant relationship between FIRMAGE explanatory variable and the AMMs
dependent variable (Factor 1) at 10% level. A similar result is also obtained for the
FIRMAGE variable on the universities and other firms (Factor 3) dependent variable (at
10% level). Accordingly, operating in automotive supply industry for a long time affects the
possibility of obtaining technology resources from the AMMs positively and the possibility
of obtaining these resources from both the universities and other firms negatively. In other
words, ceteris paribus, that is the more experience a firm has in the field of automotive
supply industry, the higher is the possibility of working with the AMMs (for technology
acquisition) and the lower is the possibility of working with both the universities and the
other firms. While the positive effect of operating in automotive supply industry for a long
time on this possibility can be regarded as a statement of the relations and competence
established with the AMMs, negative effect can be perceived as an indicator of efforts of
mostly new firms to acquire technology mainly from the universities and other resources.
FIRMSIZE exerts positive and significant impact at 10% level on the probability of
acquiring of the technologies from the AMMs dependent variable (Factor 1). A similar result
is also obtained for this variable on the universities and other firms (Factor 3) dependent
variable (highly significant at 1% level). This finding shows that the probability of acquiring
the technologies from the AMMs or universities and other firms increases with firm size.
FOREIGN dummy variable exerts negative and significant impact on the probability of
acquiring of the technologies from the lower-tier suppliers (Factor 2) dependent variable
Factor 1 Factor 2 Factor 3
Items AMMsLower-tier
suppliers
Uni. and
other firms
1. DAMM 0.887
2. OAMM 0.869
3. DS 0.738
4. OS 0.844
6. Universities 0.736
7. Private engineering and consultancy firms 0.861
5. PC
Cronbach's
Alpha (α)
N=165, KMO Measure = 0.570, Bartlett’s chi-square = 238.22 (0.0000)
0.735
0.813
0.546

267
(significant at 5% level). In other words, firms with foreign capital reduce the probability of
acquiring of the technologies from the lower-tier suppliers compared to those without
foreign capital, ceteris paribus. This dummy variable has also negative impacts on the
probability of acquiring of the technologies from the AMMs (Factor 1) and universities and
other firms (Factor 3) dependent variables. Moreover it exerts negative impact on
“domestic” and “overseas” dependent variables explained later below, however it is not
statistically significant. When we focus on the negative effect of being a foreign-capital firm,
the negative effect points out that being a foreign-capital firm, ceteris paribus, affects
negatively technology acquisition from “domestic” and “overseas” sources, this situation
suggests the question of in what way foreign firms acquire technology. These findings may
indicate that foreign-capital firms acquire technology from the MNCs they are affiliated
which may point out that the foreign affiliate is dependent on the main firm in terms of the
technology.
LOCALGROUP dummy variable exerts significant impact at 10% level on the AMMs
dependent variable (Factor 1). A similar result is also obtained for this variable on the
universities and other firms (Factor 3) dependent variable (significant at 10% level).
According to this finding, being part of a local group – compared to those without – affects
negatively the probability of acquiring of the technologies from the AMMs, while it affects
positively from the universities and other firms. The preference of the firms affiliated to a
local group for their technology suppliers may depend on the fact that they have privileged
relations with the parent company or the subsidiaries of the conglomerate or they benefit
from the network relations in the company.
SENGPER variable has a significant and negative influence on the probability of acquiring
of the technologies from the lower-tier suppliers (Factor 2) (significant at 10% level). This
finding shows that, an increase in the skilled human-capital level of the supplier gives rise to
a decrease in the possibility of acquiring of the technologies from the lower-tier suppliers.
On the other hand, effects of this variable on the other dependent variables are positive but
not statistically significant.
Technology acquisition resources were divided into two groups as “domestic” 170
and
“overseas”171
and tested as dependent variables. It is seen that regression results confirm the
findings of the first three columns. According to the regression findings in the last two
170
DAMM and DS 171
OAMM and OS

268
columns of Table 6.20 (columns 4 and 5), there are three variables having significant effect
on the “domestic” technology resources: being a foreign-capital firm (FOREIGN) affects the
usage of domestic technology resources negatively (significant at 5% level), being a direct
supplier (DIRECTSUPP) (at 10% level) and presence of MNC among customers
(CLIENTMNC) (at 5% level) affect them positively (column 4). The three variables having
significant effect on the “overseas” technology resources are: firm size (FIRMSIZE), being a
direct supplier (DIRECTSUPP) and manufacturing high technology products
(HIGHTECHPOD) (column 5). Variables of firm size and manufacturing high technology
products affect overseas technology resources positively; being a direct supplier affects
them negatively. Especially the finding specifying that being a direct supplier affects usage
of “domestic” technology resources positively but the usage of “overseas” technology
resources negatively is important. This finding points out that the important resources of the
technology acquired by the direct supplier firms are especially AMMs operating in Turkey
(DAMM), and followed by domestic suppliers (DS).
6.4.6. Determinants of the Co- Design Activities related to Products
Findings of the regression results on the determinants of co-design activities of the suppliers
with the customers pertaining to the products are presented in Table 6.21. As examined in
detail in section 5.4.6, 105 out of the 165 firms (64%) stated that they perform co-design
activities with their customers as to the products. Dependent variable takes the value of 1 if
the firm performs co-design activities with their customers, 0 otherwise. Explanatory
variables have been included to logit model in three stages: There are first eight variables in
column one (Model I), then PRODUCTINNO variable is added (Model II), lastly the more
three variables are added to the model: SENGPER, HIGHTECHPROD and HIGHDESCAP
(Model III).
Findings show that five explanatory variables exert statistically significant and positive
impact on the probability of performing co-design activities with the customers as to the
products: FIRMSIZE (at 10% level), EXPINT (at 10% level), RDDEPT (at least 10% level),
PRODUCTINNO (at 5% level) and DIRECTSUPP (at least at 10% level). Enhancement of
the possibility of performing co-design activities related to product by an increase in the
export rate – ceteris paribus – indicates that the design of the products manufactured should
be revised as the importance of the foreign markets increases in the turnover and this

269
revision is realized in cooperation with the customers172
. The positive effects of possessing a
R&D department (or conducting R&D activities) and performing product innovation
activities underlines the requirement of having some technological threshold competences
for joint product design. The positive effect of the firm size may refer to effect of “threshold
scale” for joint product design. Consequently, the positive effect of being a direct supplier
(being the supplier of at least one of AMMs located in Turkey) on the joint product design
may refer to the fact that the firms (direct supplier firms) are engaged in more strategic
relationships with the AMMs or they get involved in the product development phase in the
beginning (from the design phase).
6.4.6.1. Determinants of the Partners in Cooperation for the Co-Design
Activities related to Products
FA is conducted for the partners in cooperation for the co-design activities related to
product scale. The results of the FA including the reliability of the factors are given below in
Table 6.4. According to the results, partners in cooperation for the co-product design
activities were combined in three factors (groups). The first factor was labeled as “AMMs”
(Factor 1), and second one as “lower-tier suppliers” (Factor 2), and the last one as
“universities and other firms” 173
(Factor 3).
Findings of regression analysis on the determinants of the partners in cooperation for the co-
product design activities are given in Table 6.21. Dependent variables take the value of 1 if
the firm performs co-design activities with the partner, 0 otherwise. Analyses in this section
are performed on 105 firms stated to perform co-design activities with the customers
(partners).
The only variable that exerts highly significant and positive impact on the probability of
performing cooperation with the AMMs for co-product design activities dependent variable
(Factor 1) is DIRECTSUPP (at 1% level). In other words, being a direct supplier firm –
compared to those without – increases the likelihood of performing co-product design
activities with the AMMs. This finding is an indicator of strategic alliances between the
AMMs and direct suppliers. On the other hand, this variable has a negative impact on the
172
Which customers are more cooperated in these activities is also analysed in the next section 6.4.6.1. 173
Private engineering and consultancy firms.

270
other two dependent variables (Factor 2 and Factor 3); however they are not statistically
significant.
Table 6.4: Factor Analysis of Partners in Cooperation for
the Co-Product Design Activities
Source: Author’s calculations based on survey data
Notes: Table shows the factor loadings of each item above 0.4. The item 5 does not fit well with the
other items or it shows lowest loading on factors, therefore it was removed from the analysis.
Extraction method: Principal component analysis; Rotation method: Oblimin with Kaiser
Normalization. P-value is in bracket.
Legend: DAMM (Domestic Automotive Main Manufacturers); OAMM (Overseas Automotive Main
Manufacturers); DS (Domestic Suppliers); OS (Overseas Suppliers); PC (Parent Company)
It could not be find any variable that exerts significant impact on the probability of
performing cooperation with lower-tier suppliers for co-product design activities dependent
variable (Factor 2).
There are four variables that exert significant impact on the probability of performing
cooperation with universities and other firms for co-product design activities dependent
variable (Factor 3): FIRMAGE (at 5% level), FIRMSIZE (highly significant at 1% level),
FOREIGN (highly significant at 1% level) and RDDEPT (at 10% level). Findings show that,
an increase in firm size or owning a R&D department – compared to those without –
increases the likelihood of performing co-product design activities with universities and
other firms. On the other hand, being a firm with foreign ownership – compared to those
without – or being an older firm reduces this probability, ceteris paribus.
Factor 1 Factor 2 Factor 3
Items AMMsLower-tier
suppliers
Uni. and
other firms
1. DAMM 0.773
2. OAMM 0.843
3. DS 0.831
4. OS 0.749
6. Universities 0.815
7. Private engineering and consultancy firms 0.718
5. PC
0.706
0.716
0.695
Cronbach's
Alpha (α)
N=105, KMO Measure = 0.634, Bartlett’s chi-square = 236.86 (0.0000)

271
6.5. Ordinal Logistic Regression Analysis
In this section, firstly we will attempt to analyze determinants of KTTs accruing from
customers to their suppliers in Turkey automotive industry with ordinal logistic regression
model based on the variables constructed from raw data. Surprisingly, there seems to be very
few studies investigating factors that influence KTTs accruing from customers to their
suppliers in the automotive industry of emerging economies174
. The quantitative study
conducted in this section aims at filling the gap in this domain especially for Turkey.
Secondly we will analyze the factors impacting on various characteristics and activities of
suppliers discussed in the previous chapter. Although it shows similar characteristics with
logit model, a few points about the ordinal logistic model are worth mentioning.
All KTT-related and other dependent variables constructed from the survey
questionnaire are categorical but ordered variables - categorical variables with a sense
of ordering -.
The estimated coefficient of an explanatory variable in this model inform us about the
change in the log of odds of being in a higher level of the dependent variable, given
that all the other variables in the model are held constant. For instance, Verbeek
(2008) points out that for an ordinal dependent variable comprised of three categories
with increasing intensity, a positive coefficient associated with an explanatory variable
indicates that if this variable increases, the probability that the most intense category
occurs will increase while the probability of the least intense category will decrease.
The impact on the probability of the occurrence of the intermediate category is
ambiguous since its probability might increase or decrease175
.
When using this regression model, the parallel regression assumption is maintained,
meaning that the relationship between each pair of categories included in an
explanatory variable does not change. This last point will be illustrated below section
6.5.1.1 while examining the results of our econometric analysis.
174
Giroud (2003), Techakanont (2002), Techakanont and Terdudomtham (2004). 175
The probability of occurrence of the intermediate category may increase for some values of an explanatory
variable and decrease for others: see Long (2001).
272
6.5.1. Determinants of the KTTs at Inter-Firm Level
In this section, we will examine the impacts of the explanatory variables on the KTTs at
inter-firm level accruing from customers to their suppliers in automotive industry in Turkey,
especially those (i) related to production processes, (ii) product, (iii) trainings and (iv)
financial assistances discussed in detail in the section 5.2.
6.5.1.1. Determinants of the KTTs related to the Production Process
In this section, an econometric analysis will be conducted in an attempt to identify factors
impacting on KTTs related to production process. Before proceeding to analysis, FA is
conducted on the thirteen items that make up the KTTs related to production process. The
details of the FA including the reliability of the factors are shown below in Table 6.5.
According to these results, thirteen types of the KTTs related to production process were
combined in three factors (groups). The first factor was labeled as production process
transfers at “high-technological level” (HTL) (Factor 1), second one as those at “medium-
technological level” (MTL) (Factor 2), and last one as those at “low-technological level”
(LTL) (Factor 3)176
.
Estimation results on the determinants of KTTs related to production process are presented
in Table 6.22. Dependent variables conducted by FA and used in the regression analyses are
in the nature of ordinal and they take the value of 0 (never), 1 (rarely) and 2 (frequently)
according to transfer degree. Explanatory variables have been included to ordinal logit model
in two stages. There are first twelve variables in column one (Model I), then two variables
are added, ONESUPP and SSUBCONT (Model II).
A significant and negative association exists between FIRMAGE and the frequency of
production process-related KTTs at high-technology level (Factor 1), which is significant at
10%. In similar way, there is also negative and significant association between FIRMAGE
and those transfers at medium-technology level (Factor 2) at 5% level. Alternatively, a one
year increase in the age of a supplier reduces by 0.545 points the log of odds of being in a
higher level of the KTTs at high-technology level and reduces by 0.657 points those transfers
at medium-technology level, i.e. in the “frequently” category compared to the combined
“rarely and never” category or in the combined “frequently and rarely” categories compared
176
The reliability of the factors is also high, with a high Cronbach’s alpha value over 0.7

273
to the “never” category177
. In other words, KTTs related to production processes at either
high or medium-technology level reduce with the level of experience of the suppliers, ceteris
paribus. This may simply indicate that many experienced suppliers in the Turkish automotive
industry do possess a high level of production capabilities which makes unnecessary the
frequent high and medium-technology level production process transfers from their
customers.
Table 6.5: Factor Analysis of KTTs related to the Production Process
Source: Author’s calculations based on survey data
Notes: Table shows the factor loadings of each item above 0.4. The item 10 does not fit well with the
other items or it shows lowest loading on factors, therefore it was removed from the analysis.
Extraction method: Principal component analysis; Rotation method: Oblimin with Kaiser
Normalization. P-value is in bracket.
A positive and significant association exists between FIRMSIZE and the frequency of
production process-related KTTs at medium-technology level (Factor 2), which is significant
at the 10% level. In other words, an increase in FIRMSIZE impacts positively the likelihood
of occurrence of production process transfers at medium-technological level, ceteris paribus.
Alternatively, we would say that for a one unit increase in FIRMSIZE, the odds of the
“frequently” category of production process related KTTs at medium-technology level versus
177
As mentioned earlier, the value of the estimated coefficient implies that being a more experienced firm
reduces the probability of more frequent KTTs at either high or medium technology level (frequently) while it
increases the probability of non-use (never) of this type of KTT.
Factor 1 Factor 2 Factor 3
Items
High-
Technology
Level
Medium-
Technology
Level
Low-
Technology
Level
1. Assistance for R&D activities 0.861
2. Assistance for logistic management 0.468
3. Provide documentations 0.620
4. Know-how 0.603
11. Assistance for design 0.739
7. Customer sent its expert staff to stay at your plant for a
certain period of time for assistance in solving problems in
the production process
0.536
8. Assistance for business management 0.620
9. Assistance for quality control methods 0.718
12. Assistance for productivity-related problems 0.794
13. Consumer assigned its expert staff in the establishment
of production process of the plant 0.754
5. Supply of machinery, tools and equipment 0.633
6. Supply of raw material 0.799
10. Patent and/or license rights granted
Cronbach's
Alpha (α)
0.779
0.758
0.797
N=162, KMO Measure = 0.872, Bartlett’s chi-square = 605.18 (0.0000)

274
the “rarely” and “never” categories of those KTTs are 0.482 times greater, given that the
other variables in the model are held constant. Because of the parallel regression assumption,
the same increase, 0.482 times, is found between combined categories of “frequently” and
“rarely” production process related KTTs at medium-technology level and the “never”
category of those transfers. This points out that the probability of benefit from these process-
related KTTs is high for the suppliers reached a certain scale compared to those without.
A significant and negative association exists between EXPINT and the frequency of
production process-related KTTs at medium-technology level (Factor 2), which is significant
at 10% level. A similar effect is also observed for KTTs at low-technology level (Factor 3)
dependent variable at least at 5% level. In other words, an increase in EXPINT reduces the
probability of frequent occurrence of production process transfers at either medium or low-
technological level, ceteris paribus.
It is found a negative association between FOREIGN dummy variable and production
process-related KTTs at high-technology level (Factor 1) (significant at 10% level). Presence
of the foreign capital in the firm – compared to those without - reduces the probability of
frequent occurrence of production process transfers at high-technological level, ceteris
paribus, compared to local firms. Alternatively, for FOREIGN variable, we would say that
for a one unit increase in FOREIGN, i.e., going from 0 to 1, the odds of “frequently”
provided production process-related KTTs at high-technology level versus the combined
“rarely” and “never” categories are 0.807 times lower, given that all of the other variables in
the model are held constant. Likewise, because of the parallel regression assumption, the
odds of the combined “frequently” and “rarely” categories versus “never” is 0.807 times
lower, given that all of the other variables in the model are held constant. This finding may
indicate that foreign-capital firms do not need high amount of transfers from domestic at
high-technology level related to the production process since they manufacture products of
advanced technology. It may also indicate that the KTTs have already been provided from
the parent company (MNC) located abroad before the investment is made in Turkey and /or
while the manufacturing process is in progress after the investment (assumed that suppliers
with foreign ownership are the affiliates of MNCs in abroad). This situation confirms that
foreign ownership firms import technologies from their parent companies rather than the
AMMs operating in Turkey178
. On the other hand, this dummy variable impacts negatively
the probability of frequent occurrence of production process transfers at medium-
178
This finding consistent with the findings in the report prepared for YASED (see Erdil et. al., 2011).
275
technological level, while it impacts those positively at low-technological level but both of
them are not statistically significant.
There is a significant and negative association between LOCALGROUP dummy variable
and production process-related KTTs at high-technology level dependent variable (Factor 1)
(significant at 10% level). In other words, being part of a local group – compared to those
without – exerts a negative impact on the probability of frequent occurrence of production
process transfers at high-technological level, ceteris paribus. A finding similar to the above-
mentioned was obtained for foreign firms that their headquarters located at abroad and
operating in the field of automotive supply industry in Turkey. Therefore, the negative
relation between the variable of LOCALGROUP and these transfers may be interpreted in a
similar way - the sole difference here is the substitution of the foreign firm with the local
firm. This dummy variable impacts also negatively the probability of frequent occurrence of
production process transfers at either the medium or low-technological level but not
statistically significant.
CLIENTMNC dummy variable has a significant and negative influence on the production
process-related KTTs at low-technological level (Factor 3) at 10% level given that all the
other variables in the model are held constant. This means that presence of at least one MNC
among customer reduces the probability of frequent occurrence of production process
transfers at low-technological level, ceteris paribus. This finding indicates that MNCs do not
provide KTTs at low-technology level regarding the production process of the supplier firms
operating with MNCs. The most important reason is that transfers on such level may be
performed by MNCs which are the customers of the suppliers. On the other hand, this
dummy variable impacts positively the probability of frequent occurrence of production
process transfers at either high or low-technological level but not statistically significant.
It is found positive and significant association between RDDEPT dummy variable and
production process-related KTTs at the high-technological level (Factor 1) at 10% level.
Presence of R&D department in the firm – compared to those without – increases the
probability of occurrence of production process transfers at the high-technological level,
ceteris paribus. The presence of R&D department in supplier firms indicates that these firms
conduct R&D activities seriously and intensively and have a minimum level of technological
background and competence. Therefore it might be declared that making transfers at high-
technology level regarding the production process requires an advanced level of technology.
This dummy variable also impacts positively the probability of frequent occurrence of
production process transfers at either medium or low-technological level but not significant.

276
HIGHDESCAP dummy variable impacts negatively and significantly on the probability of
occurrence of production process transfers (i) at high-technological level (highly significant
at 1% level) (Factor 1) and (ii) at low-technological level (significant at least at 5% level)
(Factor 3). In other words, firms that have high design capability – compared to those
without – affect negatively the probability of occurrence of production process transfers at
either high or low-technological level, ceteris paribus. Since high design capability requires
significantly advanced technological manufacturing capabilities, it may be assumed that
supplier firms having this characteristic do not need to acquire these transfers from their
customers. This dummy variable also impacts negatively the probability of frequent
occurrence of production process transfers at medium-technological level but not
statistically significant.
It is found positive and significant association between ONESUPP dummy variable and
production process related KTTs at low-technological level (Factor 3) at 10% level. This
means that probability of occurrence of production process transfers at low-technological
level is higher for the firms that are the sole suppliers of the customers per item purchased –
compared to those without –, ceteris paribus. This is important for indicating that KTTs are
provided to the firms by the customers of whom they are the sole supplier.
SSUBCONT has positive and significant impact on the production process related KTTs at
medium-technological level (Factor 2) at 5% level. In other means, an increase in
SSUBCONT variable impacts positively the probability of occurrence of production process
related KTTs at medium-technological level. This dummy variable also impacts positively
the probability of frequent occurrence of production process transfers at either high or low-
technological level but not statistically significant.
There are four explanatory variables that have not any significant effects on the production
process related-KTTs provided by customers to suppliers. These are DIRECTSUPP,
PRODUCTINNO, SENGPER and HIGHTECHPROD variables. It is known that being a
direct supplier of AMM has superiorities in many areas including the KTTs. Similarly,
conducting product innovation activities, having high level of skilled employees and the
capability of manufacturing high technology products also show that the firm is superior in
terms of technological competence. It is interesting that these superiorities are not reflected
on the KTTs related with the production processes in automotive supply industry.

277
6.5.1.2. Determinants of the KTTs related to the Product
In this section, an econometric analysis will be conducted in an attempt to identify factors
impacting on KTTs related to product. Before proceeding to regression analysis, FA is
conducted for the product transfers scale. The results of the FA are presented below in Table
6.6. As it can be seen from the Table, types of the KTTs related to product were combined in
only one factor. The factor was labeled as “product related-KTTs” (Factor 1).
Table 6.6: Factor Analysis of KTTs related to the Product
Source: Author’s calculations based on survey data
Notes: Extraction method: Principal component analysis; Rotation method: Oblimin with Kaiser
Normalization. P-value is in bracket. See Appendix I for the Cronbach’s alpha value of the scale.
Estimation results on the determinants of KTTs related to product are presented in Table
6.23. Dependent variable conducted by FA and used in the regression analysis is in the
nature of ordinal and they take the value of 0 (never), 1 (rarely) and 2 (frequently) according
to transfer degree.
RDDEPT (at 10% level), PRODUCTINNO (at 5% level) and ONESUPP (at 5% level)
dummy variables have a significant and positive impact on the probability of frequent
occurrence of product related-KTTs dependent variable. This means that each one of the
variables, presence of R&D department / conducting product-innovation activities / being
sole supplier of the customer – compared to those without – increases the probability of
occurrence product related KTTs provided by customers to suppliers, holding all other
variables constant.
HIGHDESCAP dummy variable exerts a significant and negative impact on the probability
of frequent occurrence of product related-KTTs dependent variable at 5% level. In other
means, being a firm with high design capability – compared to those without – impacts
negatively the likelihood of occurrence of product related-KTTs, ceteris paribus. This
situation may point out that firms with high design capability do not need product related-
KTTs.
Factor 1
Product KTT
1. Assistance related to product designs 0.720
2. Joint operation related to product 0.831
3. Joint design activity related to product 0.789
4. Product specifications 0.681
5. Technical specifications, original design or technical drawings for products 0.642
N=163, KMO Measure = 0.787, Bartlett’s chi-square = 226.45 (0.0000)
Items

278
There are ten explanatory variables that have not any significant effects on the probability of
occurrence of product related-KTTs dependent variable. It is quite interesting that of these
variables especially DIRECTSUPP, FIRMSIZE, EXPINT, SENGPER and
HIGHTECHPROD explanatory variables do not have any impact on product related-KTTs.
We mentioned earlier the superiorities of being a direct supplier. It is also known that large
firms have many advantages and superiorities compared to medium and small-sized firms.
The other three variables also show that firms are superior in terms of technological
competence and competitiveness in global markets. It is interesting and no obvious to
interpret that these superiorities of the firms not reflected on product related-KTTs in the
automotive supply industry.
6.5.1.3. Determinants of Training Activities provided by Customers
In this section, an econometric analysis will be conducted in an attempt to identify factors
impacting on training activities provided by the customers to the suppliers. It is clear that
training activities provided by the cooperating customers could be an indicator of KTTs from
customers. As mentioned in detail in section 5.2.4, training could be in the mode of visits to
customer plant, seminars, and courses or applied training given by the expert staff of the
customers. These kinds of activities enable the exchange of tacit knowledge especially from
customers to suppliers. In addition, they increase technological capabilities of the suppliers.
Before proceeding to regression analysis, FA is conducted for the training scale. The details
of the FA are presented below in Table 6.7. According to these results, KTTs through
training were combined in one factor. The factor was labeled as “training” (Factor 1).
Table 6.7: Factor Analysis of KTTs through Training
Source: Author’s calculations based on survey data
Notes: Extraction method: Principal component analysis; Rotation method: Oblimin with Kaiser
Normalization. P-value is in bracket. See Appendix I for the Cronbach’s alpha value of the scale.
Factor 1
Items Training
1. Training on technologies used in production 0.851
2. Training of production/operation staff (engineers, technicians etc.) 0.870
3. Training of management staff 0.879
N=164, KMO Measure = 0.722, Bartlett’s chi-square = 189.92 (0.0000)

279
Findings of the regression analysis on the determinants of KTTs through training are given
in Table 6.23. Dependent variable conducted by FA and used in the regression analysis is in
the nature of ordinal and they take the value of 0 (never), 1 (rarely) and 2 (frequently)
according to transfer degree.
Both DIRECTSUPP (at 5% level) and FOREIGN (at 10% level) dummy variables have a
significant and positive influence on the probability of frequent occurrence of training
activities. In other means, either being a direct supplier or being a foreign firm – compared
to those without – impacts positively the likelihood of frequent occurrence of training
activities provided to suppliers, ceteris paribus. These findings are important to show that
likelihood of benefit from such activities is much higher for the direct suppliers or foreign
firms than other firms. This also may suggest that customers choose amongst their direct
suppliers or foreign suppliers in order to provide the aforementioned training activities.
Being a direct supplier especially suggest that close relationships between suppliers and
customers increase the probability of frequent trainings given to their personnel. In another
way, this finding indicates that not being the first-tier supplier reduces the probability of
occurrence of KTTs through training provided by customers.
SSUBCONT dummy variable exerts a statistically significant and positive impact on the
probability of frequent use of training activities (significant at 10% level). An increase in
SSUBCONT variable impacts positively the probability of frequent use of training activities
provided by customers to suppliers.
Other explanatory variables have no any statistical significant impact on the training
activities dependent variable.
6.5.1.4. Determinants of the Financial Transfers provided by Customers
Other assistance that is made by the customers to the suppliers is direct or indirect financial
transfers (supports). Although these assistances are not directly connected to the KTTs
arising from customers, it is clear to ensure the effective use of these transfers. In addition,
these could be an indicator of the strategic relationships between suppliers and customers
related to production so they also may indicate KTTs. Lastly, suppliers can continue to
operate or they make R&D activities related to products easier through financial assistances
provided by customers.

280
Before proceeding to regression analysis, FA is conducted for financial transfers scale. The
details of the FA including the reliability of the factors are shown below in Table 6.8.
According to these results, financial transfers were combined in two factors. These two
factors were labeled as financial transfers for “strategic relationship” (Factor 1) and those
for “procurement” (Factor 2)179
.
Table 6.8: Factor Analysis of Financial Transfers
Source: Author’s calculations based on survey data
Notes: Extraction method: Principal component analysis; Rotation method: Oblimin with Kaiser
Normalization. P-value is in bracket.
Estimation results on the determinants of the financial transfers are presented in Table 6.23.
Dependent variables conducted by FA and used in the regression analyses are in the nature
of ordinal and they take the value of 0 (never), 1 (rarely) and 2 (frequently) according to
transfer degree.
It should be specified at this point that 151 (93%) of the firms never benefit from the
“unilateral financial aid” of the customers and 11 firms (7%) rarely benefit from these aids.
The number of the firms having stated that they never benefit from the “loans with low
interest rates” is 152 (93%) (9 firms expressed that they rarely benefit from the loans, 2
firms stated that they frequently benefit from the loans). Similarly, 157 firms (96%)
answered “never” for the question of how often the customers contributed to “risk capital”,
(5 firms specified that they rarely benefited, 1 firm declared that it frequently benefited). The
inequality in the distribution of the responses given for these questions is greater than the
other questions in the survey.
FIRMSIZE exerts a statistically significant and positive impact on the frequency of provision
of financial transfers related to strategic relationship at 5% level (Factor 1). This finding
means that likelihood of the provision of financial transfers increases with the firm size. It
179
The reliability of the factors is also high, with a high Cronbach’s alpha value over 0.7
Factor 1 Factor 2
Itemsfor Strategic
Relationship
for
Procurement
1. Unilateral financial aid 0.774
2. Loans with low interest rates 0.741
3. Contribution to risk capital 0.685
4. Pre-financing of machinery, equipment and tools 0.623
5. Prepayment for orders before delivery 0.650
0.771
0.812
Cronbach's
Alpha (α)
N=161, KMO Measure = 0.696, Bartlett’s chi-square = 95.12 (0.0000)

281
may be due to the fact that being a larger supplier with significant production capabilities
may reduce risks associated with the reimbursement of the loan granted. However, it can be
considered as a reflection of the shortcomings in the capital markets.
FOREIGN dummy variable impacts negatively the probability of occurrence of financial
transfers related to strategic relationship (Factor 1), which is significant at 5% level.
Presence of foreign ownership in the firm – compared to those without – impacts the
probability of occurrence of these transfers in a negative way, ceteris paribus. This finding
indicates that foreign-capital firms do not require financial transfers on high levels since
they have stronger financial structures. It may also indicate that the foreign-capital firms
receive more financial assistance from the foreign parent company located at abroad.
HIGHDESCAP exerts a significant and negative impact on the frequency of provision of
financial transfers related to procurement at 5% level (Factor 2). In other means, having a
high design capability reduces the probability of provision of those transfers, ceteris paribus.
This situation points out that firms with high design capability do not need these kinds of
financial assistances.
A positive and significant association exists between ONESUPP and the frequency of
provision of financial transfers related to procurement (Factor 2) dependent variable, which
is significant at 10% level. The probability of the provision of those transfers is higher for
the firms that are the sole supplier of the customers per item purchased – compared to those
without –, ceteris paribus. This situation is important since it indicates that such transfers are
provided by customers to their sole suppliers.
6.5.2. Determinants of the Technology Capabilities of the Suppliers
In this section, we examine the technology capabilities of the supplier firms for production
activities when compared with other rivalry or leader firms in the industry. Before
proceeding to regression analysis, FA is conducted for the technology capabilities scale. The
details of the FA including the reliability of the factors are shown below in Table 6.9.
According to results, ten types of the technology capabilities were combined in two factors.
The first factor was labeled as technology capabilities related to “design and R&D” (Factor
1) and second one was labeled as those related to “production” (Factor 2)180
.
180
The reliability of the factors is also high, with a high Cronbach’s alpha value over 0.7.

282
Table 6.9: Factor Analysis of the Technology Capabilities
Source: Author’s calculations based on survey data
Notes: Table shows the factor loadings of each item above 0.4. The items 2 and 9 do not fit well with
the other items or it shows lowest loading on factors, therefore they were removed from the analysis.
Extraction method: Principal component analysis; Rotation method: Oblimin with Kaiser
Normalization. P-value is in bracket.
Estimation results on the determinants of the technology capabilities of the suppliers related
to “design and R&D” and “production” are presented in Table 6.24. Dependent variables
conducted by FA and used in the regression analyses are in the nature of ordinal and they
take the value between 1 (low) and 5 (high) on a five-point Likert scale according to their
specified capability level. Explanatory variables have been included to ordinal logit model in
two stages. There are first thirteen variables in column one, then SSUBCONT variable is
added.
Four dummy variables exert positive and significant impact on the technological capability
level of the suppliers related to design and R&D (Factor 1) dependent variable:
CLIENTMNC (at 5% level), RDDEPT (at 5% level), PRODUCTINNO (at 10% level) and
HIGHDESCAP (at 10% level). Presence of MNC among customers / having a R&D
department / conducting product innovation activities / having high design capability –
compared to those without – affects positively the likelihood of the increases of
technological capability levels of the suppliers related to design and R&D, ceteris paribus.
When we examine the impacts of these four dummy variables on the technological capability
level of the suppliers related to production (Factor 2) dependent variable, we see that
RDDEPT variable impacts negatively, while other three ones impacts positively, however,
none of them are statistically significant. It is a reasonable finding that these three dummy
variables positively affect more advanced competences such as design and R&D rather than
Factor 1 Factor 2
Items
Design and R&D
Capabilities
Production
Capabilities
1. R&D capability 0.733
3. Expertness on CAD-CAM-CAE 0.604
4. Co-designer capability 0.650
7. Design capability 0.858
8. Product improvement capability 0.822
5. Quality control capability 0.887
6. Testing and analytical capability 0.820
10. On-time delivery 0.642
2. Reach to lower prices
9. Automation level in production process
N=165, KMO Measure = 0.715, Bartlett’s chi-square = 424.46 (0.0000)
0.824
0.766
Cronbach's
Alpha (α)

283
capabilities regarding production such as logistics, delivery on time, quality control and
testing capability. In sum, these findings indicate that KTTs are provided to suppliers by
cooperated MNC customers and the suppliers with developed technological capabilities are
more benefited from these transfers.
It is found significant and negative association between LOCALGROUP and the
technological capability level of the suppliers related to design and R&D (Factor 1)
dependent variable (significant at 5% level). Being dependent on any local group-firm-
holding – compared to those without – affects negatively the likelihood of the increases of
technological capability levels related to design and R&D, ceteris paribus. On the other
hand, the effect of this variable on the technological capability level of the suppliers related
to production (Factor 2) is positive but not statistically significant. Underlying factors behind
this finding should be examined in another study.
ONESUPP dummy variable also exerts significant and negative association on both the
technological capability level of the suppliers related to design and R&D (Factor 1) and
related to production (Factor 2) dependent variables (significant at 5% level). In other
means, being the sole supplier of the most important customer per item purchased –
compared to those without – affects negatively the likelihood of the increases of
technological capability levels-related to both design and R&D and also production, ceteris
paribus.
The factors underlying behind these findings that LOCALGROUP and ONESUPP dummy
variables affect negatively the technology capability levels of the suppliers should be
examined specifically in another study.
6.5.3. Determinants of the Inter-Firm Cooperation Activities (Why
do suppliers cooperate with other firms?)
In this section, we examine the determinants of the motivations of suppliers for cooperating
with other firms. Firstly, FA is conducted for the inter-firm cooperation activities scale. The
results of the FA are shown below in Table 6.10. According to results, nine types of the
motivations for cooperating with other firms were combined in one factor. The factor was
labeled as “cooperation with other firms” (Factor 1).

284
Table 6.10: Factor Analysis of Inter-Firm Cooperation Activities
Source: Author’s calculations based on survey data
Notes: Extraction method: Principal component analysis; Rotation method: Oblimin with Kaiser
Normalization. P-value is in bracket. See Appendix I for the Cronbach’s alpha value of the scale.
Estimation results on the determinants of the motivations of the supplier activities in
cooperation with other firms are given in Table 6.25. Dependent variable constructed by FA
and used in the regression analysis is in the nature of ordinal and they take the value between
1 (very unimportant) and 5 (very important) on a five-point Likert scale according to
importance degree.
The coefficient associated with FOREIGN dummy variable is negative and highly significant
at the 1% level. This point out that likelihood of motivations of the foreign suppliers in
cooperation activities with other firms (Factor 1) is lower compared to local firms, ceteris
paribus. In other words, being a foreign ownership firm exerts a negative impact on the
degree of importance attached by suppliers to the motives for inter-firm collaboration
activities explained in detail in Table 6.10. The possible explanation of the negative effect is
that foreign suppliers operating in the automotive supply industry in Turkey do not feel
required to cooperate with other domestic firms in order to carry out the activities specified
in Table 6.10 compared to local firms. The main reasons behind this are possibly that these
firms have superior capabilities in terms of technology compared to local firms and they
acquire the information regarding the activities such as KTTs, product development and
R&D from parent MNCs located in the headquarters abroad.
A highly significant and positive association exists between RDDEPT and cooperation
activities with other firms at 1% level. In other words, presence of R&D department
(RDDEPT) affects positively the degree of importance attached by suppliers to all inter-firm
Factor 1
ItemsCooperation with
other Firms
1. Carrying out R&D activities 0.802
2. Know-how transfer 0.723
3. Reducing/sharing production costs/risks 0.759
4. Replacing technologically phased out products with the
new ones 0.794
5. Establishing long-term strategic partnership 0.731
6. Improving product quality 0.840
7. Opening up global markets 0.785
8. Entering new technology fields 0.863
9. Learning about new technologies 0.840
N=165, KMO Measure = 0.896, Bartlett’s chi-square = 1028.82 (0.0000)

285
collaboration motives given in Table 6.10, ceteris paribus. This positive effect shows the
importance of innovation capabilities beyond production capabilities for inter-firm
collaborations to occur, and also points to the role played by the absorptive capacity in this
process. Moreover, this finding that a supplier has a R&D competence shows a positive
signal to enter into cooperation for other firms.
6.5.4. Determinants of the Improvements in Production Capability
as a result of Assistances181
received from Customers
In this section, we analyzed the determinants of the improvements (increases) related to
production capability of the suppliers by the assistances provided by their customers for the
last three years. Before proceeding to regression analysis, FA is conducted for the
improvements in production capability scale. The results of the FA are presented below in
Table 6.11. According to results, ten types of the improvements were combined in one
factor. The factor was labeled as “improvements in production capability” (Factor 1).
Table 6.11: Factor Analysis of the Improvements in Production Capability
Source: Author’s calculations based on survey data
Notes: Extraction method: Principal component analysis; Rotation method: Oblimin with Kaiser
Normalization. P-value is in bracket. See Appendix I for the Cronbach’s alpha value of the scale.
Estimation results on the determinants of the improvements (increases) in production
capability of the suppliers during the last three years are presented in Table 6.25. Dependent
181
It is every support, advice, knowledge or technology transfers etc.
Factor 1
ItemsImprovements in
Production Capability
1. Productivity 0.774
2. Profitability 0.703
3. Design capability (design new products and processes) 0.784
4. Engineering capability related to product 0.835
5. Improve production process and/or capability to find solutions for
production problems 0.862
6. Improvement in quality control methods 0.844
7. Improvement in business management 0.812
8. Performance on export 0.683
9. Reach to lower output prices 0.748
10. Learning about new technologies and production processes 0.845
N=165, KMO Measure = 0.920, Bartlett’s chi-square = 1180.92 (0.0000)

286
variable conducted by FA and used in the regression analysis is in the nature of ordinal and
they take the value between 1 (very decreased) and 5 (very increased) on a five-point Likert
scale according to improvement degree.
LOCALGROUP dummy variable has a significant and negative impact on the degree of
improvements in production capabilities of the suppliers (significant at 10% level).
Depending on any local group- firm-holding – compared to those without – reduces the
probability of increases in improvement degree of the suppliers in certain fields related to
production capability (10 items stated in Table 6.11), ceteris paribus.
HIGHDESCAP exerts a statistically significant and positive impact on the degree of
improvements in production capabilities of the suppliers (significant at 10% level). In other
words, having a high design capability – compared to those without – affects in a positive
way the probability of increases in improvement degree of the suppliers in certain fields
stated in Table 6.11 in a positive way. This is important for underlying the fact that firms
having advanced design capability internalize such assistances and it gives rise to increase in
their production capabilities.
6.5.5. Determinants of the Benefits of being a Direct Supplier
In this section, we analyze the determinants of the benefits of being a direct supplier of the
AMM in Turkey based on suppliers’ experience in this field. Before proceeding to regression
analysis, FA is conducted for the benefits of being a direct supplier scale. The details of the
FA including the reliability of the factors are presented below in Table 6.12. According to
results, fourteen types of the benefits were combined in two factors. The first factor was
labeled as benefits related to “production technology” (Factor 1) and second one was labeled
as benefits related to “design and business relationships” (Factor 2)182
.
Estimation results on the determinants of the benefits received from being a direct supplier of
at least one of the AMMs in Turkey are presented in Table 6.25. As mentioned in detail in
section 5.1.1 and 5.7, 132 firms out of 165 firms (80%) stated that they are the direct
suppliers of the one or more AMMs in Turkey; therefore, analyses in this section are
performed on these 132 direct supplier firms. Dependent variables conducted by FA and
used in the regression analyses are in the nature of ordinal and they take the value between 1
182
The reliability of the factors is also high, with a high Cronbach’s alpha value over 0.7.

287
(very unimportant) and 5 (very important) on a five-point Likert scale according to
importance degree.
Table 6.12: Factor Analysis of the Benefits pertaining to being a Direct Supplier
Source: Author’s calculations based on survey data
Notes: Extraction method: Principal component analysis; Rotation method: Oblimin with Kaiser
Normalization. P-value is in bracket.
It is found a negative and significant association between FOREIGN dummy variable and
the benefits related to production technology dependent variable (Factor 1) at 10% level. The
ceteris paribus effect of being foreign firm is estimated to be negative on the probability of
increases in importance degree of the benefits (see Factor 1) received from being a direct
supplier. This variable also has a negative effect on the benefits related to design and
business relationships dependent variable (Factor 2), but not statistically significant. The
possible explanation of this negative effect is that foreign direct suppliers do not regard the
benefits of being direct supplier (items specified in Table 6.12) as very important –
compared to local direct supplier firms – since their capabilities are really advanced in terms
of production technology, design and business relationships and they probably acquire these
benefits from the parent MNCs located in the headquarters abroad.
Factor 1 Factor 2
ItemsProduction
Technology
Design and
Business
Relationship
4. Learning/improving new production processes 0.815
5. Learning/improving new quality control methods 0.640
7. Improvement in testing and analyzing capabilities/techniques 0.465
11. Improving in ability and knowledge about identifying and
finding solutions to problems encountered in the production0.619
12. Increase in productivity 0.827
13. Reducing risks involved with making decision to invest in new
technology and/or machines 0.645
14. Learning about new technologies 0.662
1. Developing new business relationships with other firms 0.600
2. Good reputation and familiarness in sector 0.871
3. Stable trade 0.666
6. Better understand the customers’ blueprint and technical
specifications0.688
8. Attendance to early stage in the design activities and developing
prototype0.822
9. Increase in design capability 0.811
10. Access to international developed markets 0.441
N=132, KMO Measure = 0.853, Bartlett’s chi-square = 738.38 (0.0000)
0.732
0.856
Cronbach's
Alpha (α)

288
SENGPER explanatory variable exerts a significant and negative impact on the benefits
related to production technology (Factor 1) dependent variable at 5% level. An increase in
SENGPER reduces the probability of increases in importance degree of the benefits stated in
Table 6.12 under the title of Factor 1, ceteris paribus. This variable also has a negative effect
on the benefits related to design and business relationships (Factor 2) dependent variable,
but not statistically significant. The main reason of the negative effect is that direct supplier
firms which have highly skilled employees do not assess the benefits of being direct supplier
(specified in Table 6.12) as very important compared to the firms lacking highly skilled
employees.
HIGHDESCAP dummy variable exerts highly significant and positive impact on the degree
of importance of the benefits related to design and business relationships (Factor 2)
dependent variable at 1% level. In other means, the ceteris paribus effect of having a high-
design capability – compared to those without – affects positively the likelihood of
increases in improvement degree of the benefits related to design and business relationships
stated in Table 6.12 under the title of Factor 2. This dummy variable also has a positive
effect on the benefits related to production technology (Factor 1) dependent variable, but not
statistically significant. This finding reflects that direct supplier firms with advanced design
capability evaluate the benefits specified in Table 6.12 as highly important based on their
experience in being direct supplier.
SSUBCONT explanatory variable affects positively and significantly both the degree of
importance of the benefits related to production technology (Factor 1) and those related to
design and business relationships (Factor 2) dependent variables at 5% level. In other means,
an increase in SSUBCONT increases the probability of increases in importance degree of the
benefits stated in Table 6.12 under the titles of both Factor 1 and Factor 2, ceteris paribus.
This means that direct supplier firms signed subcontracting agreements with the AMMs to
perform some tasks assess the benefits of being direct supplier as very important. The main
reason of the positive effect is that cooperation level between these firms in automotive
supply industry allows suppliers to further develop their skills and technology capabilities,
and may give rise to KTTs to suppliers. Therefore, they regard the benefits of being direct
supplier (items specified in Table 6.12) as very important.

289
6.5.6. Determinants of the Cooperation Level with Partners in
Innovation Activities
In this section, we examine the determinants of cooperation level of the suppliers with
external partners in innovation activities. Before proceeding to regression analyses, FA is
conducted for the partners in innovation activities scale. The results of the FA including the
reliability of the factors are shown below in Table 6.13. According to the results, eight types
of the partners in innovation activities were combined in three factors (groups). The first
factor was labeled as “AMMs” (Factor 1), and second one as “lower-tier suppliers” (Factor
2), and the last one as “universities and other firms”183
(Factor 3).
Table 6.13: Factor Analysis of the Cooperation level
with Partners in Innovation Activities
Source: Author’s calculations based on survey data
Notes: Table shows the factor loadings of each item above 0.4. The item 5 does not fit well with the
other items or it shows lowest loading on factors, therefore it was removed from the analysis.
Extraction method: Principal component analysis; Rotation method: Oblimin with Kaiser
Normalization. P-value is in bracket.
Legend: DAMM (Domestic Automotive Main Manufacturers); OAMM (Overseas Automotive Main
Manufacturers); DS (Domestic Suppliers); OS (Overseas Suppliers); PC (Parent Company)
Estimation results on the determinants of cooperation level of the suppliers with external
partners in innovation activities are presented in Table 6.26. As mentioned in detail in
section 5.8.2, 19 firms out of 165 firms (12%) stated that they do not conduct innovation
activities; therefore, analyses in this section are performed on 146 innovative firms.
Dependent variables conducted by FA and used in the regression analyses are in the nature
of ordinal and they take the value between 1 (no cooperation) and 5 (very intense) on a five-
point Likert scale according to intensity level of the cooperation. Explanatory variables have
183
Private engineering and consultancy firms, R&D institutions.
Factor 1 Factor 2 Factor 3
Items AMMsLower-tier
suppliers
Uni. and
other firms
1. DAMM 0.811
2. OAMM 0.917
3. DS 0.836
4. OS 0.870
6. R&D institutions 0.725
7. Universities 0.748
8. Private engineering and consultancy firms 0.773
5. PC
0.691
0.667
Cronbach's
Alpha (α)
0.772
N=146, KMO Measure = 0.614, Bartlett’s chi-square = 249.33 (0.0000)

290
been included to ordinal logit model in two stages. There are first twelve variables in column
one (Model I), then two variables are added, ONESUPP and SSUBCONT (Model II).
Being a direct supplier, DIRECTSUPP, exerts highly significant and positive impact on the
cooperation level of the suppliers in innovation activities with both the AMMs (Factor 1) (at
1% level) and the universities and other firms (Factor 3) (at 10% level) dependent variables.
On the other hand, this variable affects negatively the cooperation level of the suppliers with
lower-tier suppliers (Factor 2) (at 10% level). Being a direct supplier of AMM – compared
to those without – increases the probability of intensity in cooperation level of the suppliers
with either the AMMs or universities and other firms, while it reduces the probability of
intensity in cooperation level of the suppliers with the lower-tier suppliers. These findings
are important since they indicate that direct suppliers carry out intensive cooperation
activities with the AMMs related to innovation.
A significant and negative association exists between FIRMAGE and the cooperation level
of the suppliers with the universities and other firms (Factor 3) related to innovation
activities dependent variable (at 10% level). The probability of increases in cooperation level
of the suppliers with the universities and other firms reduces with firm experience and
maturity, ceteris paribus. In other means, to cooperate with the universities and other firms
in innovation activities is more important for younger firms compared to older firms.
There is a significant and negative association between CLIENTMNC dummy variable and
cooperation level in innovation activities with the lower-tier suppliers (Factor 2) dependent
variable at 10% level. Presence of at least one MNC among customers reduces the
probability of increases in cooperation level of the suppliers with the lower-tier suppliers,
ceteris paribus. This variable also exerts positive impact on the probability of increases in
cooperation level of the suppliers with the universities and other firms (Factor 3), while it
affects negatively that with the AMMs (Factor 1), but not statistically significant.
Both RDDEPT (highly significant at 1% level) and HIGHTECHPROD (significant at least at
10% level) dummy variables exert positive and significant impact on the cooperation level of
the suppliers in innovation activities with the universities and other firms (Factor 3)
dependent variable. Either presence of R&D department or manufacturing high-tech product
increases the probability of intensity in cooperation level of the suppliers with the
universities and other firms, ceteris paribus.

291
PRODUCTINNO has a significant and positive influence on the cooperation level of the
suppliers in innovation activities with the AMMs (Factor 1) at least at 5% level. Conducting
product related innovation activities increases the probability of intensity in cooperation
level of the suppliers in innovation activities with AMMs, ceteris paribus. This finding
indicates that there are strategic relationships in terms of product innovation activities
between suppliers and AMMs, and also this confirms that innovation capability of the
suppliers plays an important role in this close cooperation.
SENGPER exerts also a statistically significant and positive impact on the cooperation level
of the suppliers in innovation activities with the AMMs (Factor 1) at least at 5% level. An
increase in SENGPER affects the probability of increases in cooperation level of the
suppliers in innovation activities with the AMMs, ceteris paribus, in positive way.
Conversely, this variable exerts a negative effect on other two dependent variables: the
cooperation level of the suppliers in innovation activities with the lower-tier suppliers
(Factor 2) and with the universities and other firms (Factor 3) but not statistically
significant.
HIGHDESCAP dummy variable affects positively and significantly both of the dependent
variables at 10% level: (i) the cooperation level of the suppliers in innovation activities with
the lower-tier suppliers (Factor 2) and (ii) with the universities and other firms (Factor 3) at
10% level. In other means, presence of high design capability in a firm – compared to those
without – increases the probability of intensity in cooperation level of the suppliers in
innovation activities with both the lower-tier suppliers and the universities and other firms,
ceteris paribus. Conversely, this variable exerts negative impact on the cooperation level of
the suppliers with the AMMs (Factor 1), but not statistically significant.
6.5.7. Determinants of the Performance Increases (improvements)
related to Production Capability
In this section, we examine the determinants of the developments achieved in terms of
production capabilities of the suppliers in the last three years. Before proceeding to
regression analyses, FA is conducted. Table 6.14 displays the results of FA for the
performance increase related to production capability scale. As it can be seen from the
Table, the items pertaining to the production capability were combined in only one factor.
The factor was labeled as “performance increase” (Factor 1).

292
Table 6.14: Factor Analysis of the Performance Increases (improvements)
Source: Author’s calculations based on survey data
Notes: Extraction method: Principal component analysis; Rotation method: Oblimin with Kaiser
Normalization. P-value is in bracket. See Appendix I for the Cronbach’s alpha value of the scale.
Findings of the regression analysis on the determinants of the improvements in production
capability of the suppliers in the last three years that accepted as a performance indicator are
presented in Table 6.27. Dependent variables conducted by FA and used in the regression
analyses are in the nature of ordinal and they take the value between 1 (very increased;
deterioration) and 5 (very decreased; improvement) on a five-point Likert scale according to
development level in production capability. Explanatory variables have been included to
ordinal model in three stages to determine the problem of a possible multicollinearity: There
are first ten variables in column one (Model I), then two variables are added,
HIGHTECHPROD and HIGHDESCAP, (Model II), lastly the ONESUPP and SSUBCONT
variables are added to the model (Model III).
EXPINT explanatory variable exerts a negative and significant impact on the performance
increases of the suppliers’ dependent variable (significant at 10% level). In other means, an
increase in EXPINT reduces the probability of performance increase (improvement) of the
suppliers related to production capability (Model I), ceteris paribus. This variable also exerts
a negative impact on the other two models (Model I and II), but not statistically significant.
EXPINT variable’s negative effect (i.e. increase) on the performance levels of the firms
regarding the indicators in Table 6.14, ceteris paribus, may indicate that there are qualitative
differences (more complex and quality products) between the products presented by exporter
suppliers to world markets and the products of the firms manufacturing mainly for domestic
market. Besides, it may indicate logistical problems to deliver on time the products
manufactured for mainly world markets – increase in the distance of the importing country
from Turkey may increase the seriousness of this problem. At the same time, the possible
problems at the customs of both Turkey and country of export, and problems arising from
import regulations in the importing country may extend the delivery period of the products.
Naturally, these kinds of problems are not in question for the firms manufacturing mainly for
Factor 1
ItemsPerformance
Increase
1. Cycle time 0.655
2. Defect rate 0.679
3. Average costs 0.600
4. Duration of on-time delivery 0.772
N=165, KMO Measure = 0.662, Bartlett’s chi-square = 64.43 (0.0000)

293
domestic market. Therefore, the increasing effect of the export intensity on defective product
rate, average costs, delivery duration in time and cycle time may be depending on these
qualitative differences184
. Naturally, these are the speculative remarks, but they are not
unreasonable.
As for the coefficients associated with the FOREIGN variable, they are positive and
statistically significant at 5% level for all models. Presence of foreign ownership in the firm
– compared to those without – exerts positive effect on the probability of performance
increases (improvement) of the suppliers related to production capability indicators stated in
Table 6.14, ceteris paribus. As it is discussed in the previous pages, higher technological
capabilities of the foreign-capital firms compared to the local firms may be interpreted with a
greater possession of both tangible and intangible assets by the foreign-capital firms. It
appears that foreign firms are superior to local firms in terms of many technological
indicators and absorptive capacity (more export intensity, manufacture technologically more
advanced and complex products, productivity, having high qualified personnel, performing
more R&D activities etc.) (see sections 5.1, 5.4, 5.8 and 5.10). Superiorities in these
technological levels indicate that it will bear the result of higher efficiency for the foreign
firms compared to the local firms (current studies point out that the efficiencies of local firms
in terms of labor/total factor productivity is generally lower than the foreign firms operating
in the same sector). If the differences in efficiency levels are reflected on the indicators in
Table 6.14, the result in Table 6.27 can be obtained.
Other explanatory variables do not exert any statistically significant impact on the
probability of performance increases (improvement) of the suppliers. It is quite interesting
that of these variables especially CLIENTMNC, RDDEPT, EXPINT, FIRMAGE,
DIRECTSUPP, and ONESUPP explanatory variables do not have any impact on the
performance increases of the suppliers. It is interesting and no obvious to interpret that these
competences of the firms not reflected on performance increases of the suppliers.
184
Whether these interpretations reflect truth or not and also if they reflect truth, the reasons thereof may be
comprehended as a consequence of semi-structured interviews to be conducted with supplier firms within the
scope of another study. In the literature review conducted for Turkey, no such study was found. Furthermore, we
didn’t come up with any coding error in the data used herein.

294
6.6. Summary
Recapitulative tables for findings obtained in this chapter in terms of logistic and ordinal
logistic regression analyses are presented in Tables 6.28 and 6.29. They contain signs of
coefficients statistically significant at least at the 10% level and that are associated with
explanatory variables that impact on the dependent variables analyzed such as being direct
supplier, possessing R&D department, carrying out innovation activities, sources of the
technologies, co-design activities, different types of KTTs – related to production process,
product, training, financial transfers – technology capabilities, benefits of being direct
supplier, cooperation activities and performance increases etc.
The effects of some important features of the suppliers that they were used as explanatory
variables in the regression analyses on being direct supplier and possessing R&D department
are summarized in Table 6.28. A larger number of variables influence positively both being
direct supplier and possessing R&D department. Four variables; (i) firm size, (ii) being a
part of local group, (iii) conduct product innovation activities and (iv) share of engineers in
total employees are the common variables that affect positively such both dependent
variables. On the other hand, being an experienced firm, being a foreign firm and
manufacturing high technology product affect positively the likelihood of being direct
supplier. The finding related to foreign ownership points out the difficulty of being a direct
supplier of the firms without foreign partners, in the same time it can be considered as a
reflection of the dependence on foreign technology in automotive supply industry. Therefore
dependence on foreign technology is not only unique to the automotive main industry. The
only variable that exerts negative impact on being direct supplier is the export intensity.
R&D incentives and high design capability variables affect positively the likelihood of
possessing R&D department. This finding indicates the positive role of R&D incentives in
resolving the problem of insufficient number of suppliers that have R&D competences in
automotive supply industry often voiced by AMMs185
.
The findings related to factors affecting innovation and product innovation activities of the
suppliers are summarized in Table 6.28. Export intensity and owning MNC among customers
exert positive impact on the probability of carrying out innovation activities, while being a
foreign firm exerts negative impact on these activities. The negative impact of the foreign
ownership indicates that the likelihood of innovation activities in the foreign firms is less
185
See Erdil et. al. (2011).

295
compared to local firms, ceteris paribus. This finding doesn’t point out any weakness in the
innovation competences of the foreign firms. On the contrary, MNCs that have intangible
assets have transferred these to their affiliates operating abroad therefore foreign firms in the
host country (assumed that they are the affiliates of MNCs) engage in less with these
activities – compared to local firms –. There are three variables that exert positive impact on
product innovation activities: (i) export intensity, (ii) being direct supplier and (iii)
possessing R&D department. The most striking finding is that the positive impact of the
export intensity on both innovation and product innovation activities of the suppliers. This
shows that the suppliers manufacturing for world markets are engaging in innovation
activities in order to develop the quality of the products and also to compete with other firms
in these markets. In other words, an increase in the share of the manufacturing conducted for
the world markets in the turnover have forced the suppliers to build their innovation
capabilities.
A larger number of variables influence positively the likelihood of performing technology
agreements (TA) (Table 6.28). The factors affecting positively the low-advanced level
technology agreements (LATA) are firm size, being direct supplier, possessing R&D
department and share of engineers in total employees. On the other hand, the factors
affecting positively the likelihood of performing advanced technology agreements (ATA)
are the share of subcontracting agreements in total sales, carry-out product innovation
activities and share of engineers in total employees. Being a part of local group exerts
negative impact on such agreements. These findings indicate that technology capabilities and
absorptive capacity of the suppliers play an important role to perform technology
agreements. Technology agreements may be seen an important channel in terms of the KTTs
especially for the firms seeking to improve their competences in search of technology.
When we examine the factors affecting the sources of technologies acquired and/or used by
the firms, we see that a larger number of variables have impact on the acquiring of
technologies from various sources (Table 6.28). Firm age and firm size are the two important
variables that affect positively the acquiring of technologies from the AMMs. Firm size and
being a part of local group affect positively the likelihood of acquiring these technologies
from the universities and other firms. Moreover, firm size and manufacturing high
technological product variables exert positive impact on the acquiring of technologies from
“overseas”186
sources, while being a direct supplier and having MNC among customers
186
OAMM and OS.

296
exert also positive impact on that from “domestic”187
sources. The variables that exert
negative impact on the acquiring of technologies from various sources are firm age (on
universities and other firms), foreign ownership (on both lower-tier suppliers and domestic
sources), being direct supplier (on overseas sources), being a part of local group (on
AMMs) and share of engineer personnel in total employees (on lower-tier suppliers).
The factors affecting the co-design activities related to products and the partners cooperated
in these activities are summarized in Table 6.28. Firm size and possessing R&D department
variables influence positively the likelihood of both performing co-design activities related
to products and performing these activities with the universities and other firms. Moreover,
conducting product innovation activities and export intensity also exert positive impact on
the co-design activities of the suppliers related to products. These findings indicate that
engaging in R&D and product innovation activities, an increase in the number of employees
and in firm’s total sales conducted to world markets trigger cooperation activities of the
suppliers in the field of product design. These findings point out the advantages benefited by
large-sized firms such as technological, managerial, financial and human resources. The
export intensity may give an idea about the place of the suppliers in the MNCs’ global
production networks. The most striking finding is that being direct supplier exerts positive
impact on both the co-design activities of the suppliers related to products and performing
these activities with the AMMs. This last finding indicates the superiority of the direct
suppliers (or 1st-tier suppliers) in the field of co-product design with the AMMs. The last
finding is that being an experienced firm and foreign ownership firm affect negatively the
co-design activities performed with universities and other firms.
If we look at the findings in Table 6.29 in terms of KTTs provided by customers to suppliers,
we can make the following observations.
A larger number of variables influence negatively production process–related KTTs
than the transfers related to product. Age of the firm, export intensity, foreign
ownership, being part of a local group, having MNC among customers and high
design capability reduce the possibility of such production process transfers at high
(HTL), medium (MTL) or low (LTL) technology levels. On the contrary, firm size,
engaging in R&D activities, being sole supplier of the most important customer and
share of the subcontracting agreements in total sales exert a positive impact on such
transfers. This finding that negative impacts of the variables on KTTs for production
187
DAMM and DS.
297
process probably related to the already developed technology capabilities of the
suppliers.
The variables that affect positively the product-related KTTs are being the sole
supplier of the most important customer, engaging in R&D and product innovation
activities. The variable owning a high design capability negatively affect these
transfers or reduce the possibility of such transfers because of probably developed
design capabilities of the suppliers in terms of product.
Being a direct supplier of AMMs, share of subcontracting agreements in total sales
and being a foreign firm are the most important features that affect the frequency of
training activities provided by customers. These training activities may be an
important channel for KTTs.
With respect to financial transfers, four explanatory variables exert a significant
effect: (i) firm size, (ii) foreign ownership, (iii) high design capability, and (iv) being
sole supplier of the most important customer. Firm size impacts positively the
possibility of financial transfers for strategic relationship, whereas foreign ownership
influences negatively these transfers. Moreover, high design capability impacts
negatively on financial transfers for procurement, whereas being sole supplier
influences positively such transfers.
One of the most striking findings is that being a direct supplier firm has not any
significant impact on transfers for production process, product and financial. It should
be taken into account that a majority of the firms participating in our survey are direct
suppliers (first-tier suppliers) may have affected these results.
In our study, technology capabilities of the suppliers measured in different dimensions such
as design, R&D, and production have been accepted as a performance indicator. There are
four variables that positively affect the likelihood of the increases of design and R&D
capabilities: (i) possessing R&D department, (ii) carrying out product innovation activities,
(iii) high design capability, and (iv) having MNC among customers (see Table 6.29). The
first three findings already indicates the developed competences and high absorptive capacity
of the suppliers, therefore it is expected that the suppliers that have these characteristics have
high technological capabilities in terms of such competences. The last finding may also
indicate that suppliers manufacturing for MNCs operating in or outside of Turkey get these
KTTs related to design and R&D from them188
. We don’t have any information about the
share of MNCs in the total sales of the suppliers and therefore we have to base this
188
This finding may also give an idea about the place of the suppliers manufacturing for MNC located abroad in
the global production chain of the MNC.

298
interpretation on the dummy variable included in the regression model. In addition, being a
part of local group exerts negative impact on technology capabilities related to design and
R&D, being a sole supplier of the most important customer exerts negative impact on such
capabilities related to both (i) design and R&D and (ii) production.
In order to be provided KTTs to suppliers by AMMs, a very important factor – perhaps a
prerequisite – is the cooperation activities of the suppliers with other firms. The main finding
related to factors affecting the establishment of cooperation activities with other firms is that
explanatory variables being foreign ownership firm reduce the probability of frequent
occurrence of these activities, while possessing R&D department increases such activities
(see Table 6.29). R&D activity of the suppliers which is an important indicator of
many competences increases the possibility of cooperation in order to obtain KTTs and to
develop technology level. Other variables do not exert any statistically significant impact on
the probability of cooperation activities.
The findings related to factors affecting improvements in production capability of the
suppliers for the last three years accepted another performance indicator are summarized in
Table 6.29. Being part of a local group reduces the probability of increases in improvements
of the suppliers in certain fields (stated in Table 6.11) related to production capability, while
a high design capability exerts positive impact on this probability.
The factors affecting positively the likelihood of increases in improvement of benefits
received from being direct supplier of AMM are being a foreign firm, share of engineer
personnel in total employees, high design capability and share of subcontracting agreements
in total sales (see Table 6.29). Share of engineers and foreign ownership variables exert
negative impact on the benefits related to production technology. On the other hand, share of
subcontracting agreements impacts positively on both “production technology” and “design
and business relationship” benefits. High design capability variable exerts positive impact
only on the benefits related to design and business relationships.
When we look at the findings in Table 6.29 in terms of external partners in innovation
activities, we can make the following observations. There are three variables that positively
affect the likelihood of the cooperation of the suppliers with the AMMs: being direct
supplier, conduct product innovation activities and share of engineers in total employment.
The variables that positively affect such cooperation activities with the universities and other
firms are being direct supplier, possessing R&D department, manufacturing high technology

299
product and high design capability, whereas firm age variable exerts negative impact on
these activities with the same partners. On the other hand, being a direct supplier and having
a MNC among customers exert negative impact on the cooperation with the lower-tier
suppliers, while high design capability affects these activities with such partners positively.
In Table 6.29, the findings related to factors affecting performance increases (improvements)
of the suppliers are summarized. The performance increases are measured by indicators that
determine the cooperation activities of the AMMs with suppliers such as cycle time, defect
rate, average cost, duration of on-time delivery. The findings show that being foreign
ownership firm increases the probability of performance increases compared to local firms –
ceteris paribus –, while increase in export intensity results in a decrease in performance
increases. The possible reasons of the negative effect of export intensity were already made
in the relevant section.
Finally, if we look at the findings in Tables 6.28 and 6.29 in terms of explanatory variables
used in the regressions, five variables that affect variety of factors positively come to the
fore: (i) firm size, (ii) being direct supplier, (iii) possessing R&D department, (iv)
conducting product innovation activities and (v) share of engineers in total employment.
These are assumed as important indicators of absorptive capacity of the suppliers except firm
size. The most prominent variable among these is the possessing R&D department or
engaging in R&D activities. Engaging in R&D activities – that is an important indicator of
competence – affects positively (a) high level KTTs related to product and production
process, (b) technology capabilities in terms of design and R&D, (c) cooperation activities
with other firms, (d) co-design activities related to products, (e) product innovation
activities, (f) carrying out low-advanced level technology agreements, (g) cooperation with
universities in both innovation and co-design activities related to products. These point out
to the importance of R&D competences for those suppliers which desire to be a co-designer,
to carry out innovation activities, to obtain KTTs, to establish partnerships and to develop
their technology capabilities. Engaging in R&D activities is also seen an important factor by
the AMMs in order to select their suppliers and to decide to collaborate with the suppliers
(see section 7.5). In these respects possessing R&D department is found more important than
any other factors.

300
Table 6.15: Description of the Explanatory Variables used in the Analyses
Variable Description
FIRMAGE Natural logarithm of firm age in years
FIRMSIZE Natural logarithm of the total employees in 2008
EXPINT Export intensity in percentage in 2008 (exports divided by total sales)
FOREIGNA dummy variable taking the value of 1 if the share of firm's capital owned by
foreigners equals at least to 10%, 0 otherwise
DIRECTSUPPA dummy variable taking the value of 1 if the firm is a direct supplier of at least one
automotive main manufacturer (AMM) in Turkey, 0 otherwise
LOCALGROUPA dummy variable taking the value of 1 if the firm is part of a larger group, a
parent company or holding in Turkey, 0 otherwise
CLIENTMNCA dummy variable taking the value of 1 if the firm has a multinational company
(MNC) among its customers, 0 otherwise
RDDEPTA dummy variable taking the value of 1 if the firm has a seperated R&D
department, 0 otherwise
PRODUCTINNOA dummy variable taking the value of 1 if the firm carries out product innovation
activities, 0 otherwise
SENGPER Share of engineer personnel in total number of employees in percentage
HIGHTECHPRODA dummy variable taking the value of 1 if the firm produces high technology
products, 0 otherwise
HIGHDESCAPA dummy variable taking the value of 1 if the design capability of the firm is high, 0
otherwise
ONESUPPA dummy variable taking the value of 1 if the firm stated that its most important
customer prefers to study with only one supplier per item purchased, 0 otherwise
SSUBCONT The share of subcontracting agreements in total contracts in percentage
RDSUB
A dummy variable taking the value of 1 if the firm gets a financial subsidy from
government or various institutons related to R&D (KOSGEB – TUBITAK –
TEYDEB – TTGV – EU etc.), 0 otherwise

301
Table 6.16: Descriptive Statistics for Explanatory Variables
Source: Author calculations based on survey results
Variable Variable Type Obs. Mean Std. Dev. Min Max
FIRMAGE (ln) Continous 165 3.133 0.736 0 4.32
FIRMSIZE (ln) Continous 161 5.201 0.987 2.71 8.01
EXPINT (%) Continous 165 36.832 29.412 0 100
FOREIGN Dummy 165 0.273 0.447 0 1
DIRECTSUPP Dummy 165 0.800 0.401 0 1
LOCALGROUP Dummy 164 0.366 0.483 0 1
CLIENTMNC Dummy 163 0.859 0.349 0 1
RDDEPT Dummy 165 0.600 0.491 0 1
PRODUCTINNO Dummy 164 0.732 0.444 0 1
SENGPER (%) Continous 161 8.035 8.548 0 66.20
HIGHTECHPROD Dummy 164 0.518 0.501 0 1
HIGHDESCAP Dummy 165 0.418 0.495 0 1
ONESUPP Dummy 162 0.414 0.494 0 1
SSUBCONT (%) Continous 155 12.161 26.607 0 100
RDSUB Dummy 165 0.509 0.501 0 1
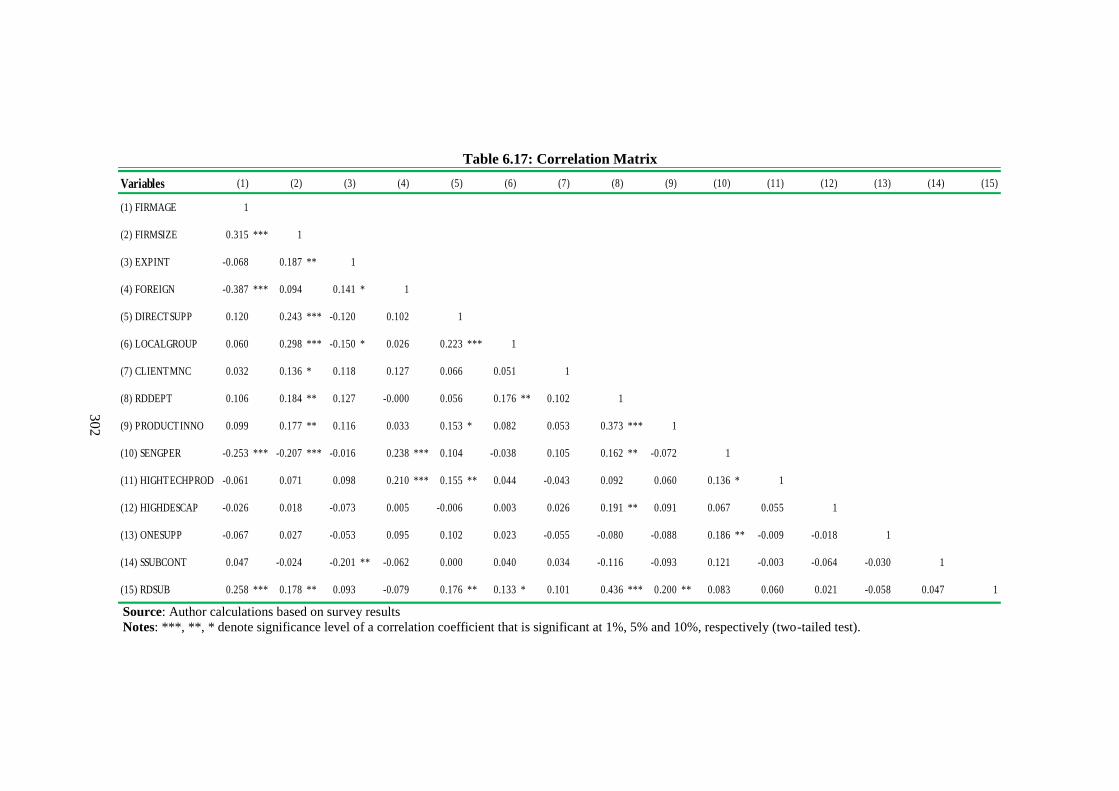
302
Table 6.17: Correlation Matrix
Source: Author calculations based on survey results
Notes: ***, **, * denote significance level of a correlation coefficient that is significant at 1%, 5% and 10%, respectively (two-tailed test).
Variables (1) (2) (3) (4) (5) (6) (7) (8) (9) (10) (11) (12) (13) (14) (15)
(1) FIRMAGE 1
(2) FIRMSIZE 0.315 *** 1
(3) EXPINT -0.068 0.187 ** 1
(4) FOREIGN -0.387 *** 0.094 0.141 * 1
(5) DIRECTSUPP 0.120 0.243 *** -0.120 0.102 1
(6) LOCALGROUP 0.060 0.298 *** -0.150 * 0.026 0.223 *** 1
(7) CLIENTMNC 0.032 0.136 * 0.118 0.127 0.066 0.051 1
(8) RDDEPT 0.106 0.184 ** 0.127 -0.000 0.056 0.176 ** 0.102 1
(9) PRODUCTINNO 0.099 0.177 ** 0.116 0.033 0.153 * 0.082 0.053 0.373 *** 1
(10) SENGPER -0.253 *** -0.207 *** -0.016 0.238 *** 0.104 -0.038 0.105 0.162 ** -0.072 1
(11) HIGHTECHPROD -0.061 0.071 0.098 0.210 *** 0.155 ** 0.044 -0.043 0.092 0.060 0.136 * 1
(12) HIGHDESCAP -0.026 0.018 -0.073 0.005 -0.006 0.003 0.026 0.191 ** 0.091 0.067 0.055 1
(13) ONESUPP -0.067 0.027 -0.053 0.095 0.102 0.023 -0.055 -0.080 -0.088 0.186 ** -0.009 -0.018 1
(14) SSUBCONT 0.047 -0.024 -0.201 ** -0.062 0.000 0.040 0.034 -0.116 -0.093 0.121 -0.003 -0.064 -0.030 1
(15) RDSUB 0.258 *** 0.178 ** 0.093 -0.079 0.176 ** 0.133 * 0.101 0.436 *** 0.200 ** 0.083 0.060 0.021 -0.058 0.047 1

303
Table 6.18: Determinants of being a Direct Supplier / Determinants of Possessing a separated R&D Department:
Logistic Regression Analysis
Source: Author calculations based on survey results
Notes: ***, **, * denote significance level at 1%, 5% and 10% respectively. Robust standard errors of the coefficients are shown in parentheses. All models
include intercepts significant at 1% level but not shown in the results for space reasons. Two-tailed test. P-values are in brackets in the last rows.
FIRMAGE 0.524 ( 0.310) * 0.590 ( 0.358) * 0.347 ( 0.397) -0.169 ( 0.355) 0.036 ( 0.382) 0.312 ( 0.423)
FIRMSIZE 0.462 ( 0.281) 0.610 ( 0.296) ** 0.893 ( 0.337) *** 0.149 ( 0.227) 0.331 ( 0.252) 0.458 ( 0.268) *
EXPINT -0.018 ( 0.007) ** -0.020 ( 0.008) ** -0.020 ( 0.009) ** 0.003 ( 0.008) 0.005 ( 0.008) 0.007 ( 0.009)
FOREIGN 1.328 ( 0.554) ** 0.642 ( 0.588) 0.156 ( 0.667) -0.059 ( 0.490) -0.433 ( 0.552) -0.454 ( 0.607)
LOCALGROUP 0.920 ( 0.569) 0.921 ( 0.567) 1.255 ( 0.613) ** 0.772 ( 0.427) * 0.851 ( 0.445) * 0.892* ( 0.504) *
CLIENTMNC 0.052 ( 0.659) -0.041 ( 0.768) 0.066 ( 0.845) 0.396 ( 0.609) 0.019 ( 0.713) -0.549 ( 0.623)
RDDEPT 0.011 ( 0.472) -0.334 ( 0.576) -0.386 ( 0.670)
PRODUCTINNO 0.793 ( 0.474) * 1.115 ( 0.524) ** 1.472 ( 0.621) ** 1.853 ( 0.431) *** 1.998 ( 0.451) *** 2.106 ( 0.498) ***
SENGPER 0.076 ( 0.040) * 0.100 ( 0.062) 0.083 ( 0.036) ** 0.121 ( 0.042) **
HIGHTECHPROD 0.911 ( 0.491) * 1.037 ( 0.567) * 0.090 ( 0.430) 0.178 ( 0.459)
HIGHDESCAP -0.128 ( 0.551) 0.193 ( 0.631) 1.043 ( 0.456) ** 1.263 ( 0.472) ***
ONESUPP 0.660 ( 0.546) -0.312 ( 0.498)
SSUBCONT 0.000 ( 0.009) -0.013 ( 0.008)
DIRECTSUPP -0.349 ( 0.488) -0.529 ( 0.525) -0.585 ( 0.608)
RDSUB 1.941 ( 0.409) *** 1.928 ( 0.450) *** 1.939 ( 0.467) ***
Obs. (N)
Likelihood
Pseudo R2
McFadden's Adj R2
Wald Chi2 Test 29.61 (0.0018)
-64.536
0.157
0.040
25.99 (0.0011) 46.92 (0.0000)
145
-51.569
0.260
0.059
35.89 (0.0006) 57.51 (0.0000)
156
-70.679
0.326
0.202
47.15 (0.0000)
157 145
-61.535
0.374
0.222
157
-77.969
0.263
0.168
156
-60.255
0.211
0.054
Model II Model III
R&D DepartmentDirect Supplier
Model I Model II Model III Model I

304
Table 6.19: Determinants of the Innovation / Determinants of the Product Innovation Activities:
Logistic Regression Analysis
Source: Author calculations based on survey results
Notes: ***, **, * denote significance level at 1%, 5% and 10% respectively. Robust standard errors of the coefficients are shown in parentheses. All models
include intercepts significant at 1% level but not shown in the results for space reasons. Two-tailed test. P-values are in brackets in the last rows.
FIRMAGE -0.480 ( 0.512) -0.529 ( 0.546) -0.572 ( 0.546) -0.042 ( 0.360) 0.033 ( 0.366) 0.153 ( 0.364)
FIRMSIZE 0.082 ( 0.212) 0.083 ( 0.210) 0.050 ( 0.217) 0.024 ( 0.145) 0.006 ( 0.147) -0.011 ( 0.147)
EXPINT 0.486 ( 0.227) ** 0.510 ( 0.246) ** 0.420 ( 0.249) * 0.344 ( 0.152) ** 0.368 ( 0.153) ** 0.341 ( 0.159) **
FOREIGN -1.514 ( 0.721) ** -1.436 ( 0.724) ** -1.465 ( 0.794) * 0.230 ( 0.571) 0.201 ( 0.602) 0.332 ( 0.611)
DIRECTSUPP 0.392 ( 0.722) 0.473 ( 0.726) 0.649 ( 0.728) 0.804 ( 0.482) * 0.805 ( 0.497) 0.660 ( 0.507)
RDDEPT 0.744 ( 0.577) 0.792 ( 0.577) 0.822 ( 0.593) 0.857 ( 0.445) * 0.772 ( 0.445) * 0.671 ( 0.450)
SENGPER 0.460 ( 0.491) 0.472 ( 0.511) 0.205 ( 0.504) -0.465 ( 0.300) -0.475 ( 0.324) -0.453 ( 0.338)
HIGHTECHPROD -0.561 ( 0.602) -0.494 ( 0.634) 0.135 ( 0.453) 0.269 ( 0.459)
HIGHDESCAP 0.268 ( 0.594) 0.280 ( 0.619) 0.265 ( 0.416) 0.187 ( 0.415)
CLIENTMNC 1.245 ( 0.705) * -0.149 ( 0.648)
Obs. (N)
Likelihood
Pseudo R2
McFadden's Adj R2
Wald Chi2 Test 20.30 (0.0162)
-45.773
0.118
0.036
17.85 (0.0127) 15.30 (0.0323)
138
-42.888
0.134
0.088
20.85 (0.0222) 14.68 (0.1440)
139
-73.000
0.105
0.018
16.88 (0.0506)
141 137
-71.491
0.094
0.045
140
-74.699
0.098
0.002
140
-45.127
0.128
0.065
Model III
Product Innovation ActivitiesInnovation Activities
Model I Model II Model III Model I Model II

305
Table 6.20: Determinants of the Technology Agreements (TA) / Determinants of the Sources:
Logistic Regression Analysis
Source: Author calculations based on survey results
Notes: ***, **, * denote significance level at 1%, 5% and 10% respectively. Robust standard errors of the coefficients are shown in parentheses All models include
intercepts significant at 1% level but not shown in the results for space reasons. Two-tailed test. 1: Domestic and Overseas Automotive Main Manufacturers. 2:
Domestic and Overseas Suppliers. 3: Universities, private engineering and consultancy firms. 4: Domestic Automotive Main Manufacturers and Domestic Suppliers. 5:
Overseas Automotive Main Manufacturers and Overseas Suppliers. P-values are in brackets in the last rows.
FIRMAGE -0.110 ( 0.327) -0.369 ( 0.324) 0.485 ( 0.289) * -0.111 ( 0.299) -0.526 ( 0.310) * -0.102 ( 0.316) 0.017 ( 0.303)
FIRMSIZE 0.568 ( 0.260) ** 0.128 ( 0.221) 0.443 ( 0.238) * 0.228 ( 0.232) 0.717 ( 0.239) *** 0.197 ( 0.244) 0.477 ( 0.235) **
EXPINT 0.007 ( 0.008) 0.007 ( 0.008) -0.006 ( 0.007) -0.005 ( 0.008) -0.005 ( 0.007) -0.010 ( 0.008) 0.008 ( 0.007)
FOREIGN 0.198 ( 0.540) -0.305 ( 0.473) -0.273 ( 0.466) -0.966 ( 0.482) ** -0.558 ( 0.506) -1.009 ( 0.497) ** -0.495 ( 0.480)
DIRECTSUPP 1.139 ( 0.532) ** -0.278 ( 0.560) 0.371 ( 0.526) -0.644 ( 0.579) -0.010 ( 0.560) 0.962 ( 0.543) * -1.043 ( 0.548) *
LOCALGROUP 0.248 ( 0.451) -0.677 ( 0.397) * -0.702 ( 0.408) * 0.109 ( 0.408) 0.782 ( 0.411) * -0.321 ( 0.444) 0.111 ( 0.412)
CLIENTMNC -1.133 ( 0.727) 0.105 ( 0.599) 0.564 ( 0.558) 0.195 ( 0.541) 0.468 ( 0.640) 1.196 ( 0.569) ** -0.098 ( 0.568)
RDDEPT 0.809 ( 0.423) * 0.350 ( 0.472) -0.436 ( 0.420) 0.023 ( 0.479) 0.460 ( 0.476) 0.057 ( 0.479) -0.017 ( 0.457)
PRODUCTINNO 0.129 ( 0.454) 0.893 ( 0.530) * -0.159 ( 0.470) -0.400 ( 0.531) 0.485 ( 0.516) -0.777 ( 0.541) -0.417 ( 0.504)
SENGPER 0.109 ( 0.055) ** 0.062 ( 0.036) * 0.032 ( 0.023) -0.043 ( 0.024) * 0.019 ( 0.025) -0.016 ( 0.026) 0.035 ( 0.030)
HIGHTECHPROD 0.024 ( 0.409) 0.272 ( 0.403) 0.106 ( 0.367) 0.169 ( 0.382) 0.395 ( 0.411) 0.537 ( 0.408) 0.668 ( 0.382) *
HIGHDESCAP 0.332 ( 0.424) 0.108 ( 0.409) -0.344 ( 0.368) 0.038 ( 0.394) -0.094 ( 0.416) -0.666 ( 0.410) -0.087 ( 0.386)
ONESUPP -0.088 ( 0.415) 0.460 ( 0.394) 0.185 ( 0.377) 0.287 ( 0.397) -0.617 ( 0.424) -0.168 ( 0.412) 0.105 ( 0.389)
SSUBCONT -0.002 ( 0.007) 0.012 ( 0.007) * -0.006 ( 0.006) 0.009 ( 0.006) 0.001 ( 0.006) -0.003 ( 0.008) 0.005 ( 0.007)
Obs. (N)
Likelihood
Pseudo R2
McFadden's Adj R2
Wald Chi2 Test
-76.935
0.208
0.054
26.23 (0.0242)
145
-85.057
0.112
-0.045
16.17 (0.3028)
145
-91.346
0.090
-0.059
15.26 (0.3605) 29.39 (0.0092)
145
-87.458
0.086
-0.070
15.06 (0.3742)
Factor 1
(AMMs)1
Factor 2
(Lower-tier suppliers)2
Factor 3
(Uni. and other firms)3Domestic 4 Overseas 5
145
-87.740
0.084
-0.073
15.98 (0.0352)
145
-79.462
Technology Agreements (TA)
Factor 1
(Low-Advanced TA)
Factor 2
(Advanced TA)
Sources of the Technologies used and/or acquired
145
0.107
-0.061
19.07 (0.0045)
145
-84.467
0.149
-0.002

306
Table 6.21: Determinants of the Co-Product Design Activities / Determinants of the Partners in Cooperation for these Activities:
Logistic Regression Analysis
Source: Author calculations based on survey results
Notes: ***, **, * denote significance level at 1%, 5% and 10% respectively. Robust standard errors of the coefficients are shown in parentheses. All models include
intercepts significant at 1% level but not shown in the results for space reasons. Two-tailed test. 1: Domestic and Overseas Automotive Main Manufacturers. 2:
Domestic and Overseas Suppliers. 3: Universities, private engineering and consultancy firms. P-values are in brackets in the last rows.
FIRMAGE 0.167 ( 0.289) 0.151 ( 0.284) 0.192 ( 0.287) -0.716 ( 0.492) -0.265 ( 0.434) -1.178 ( 0.556) **
FIRMSIZE 0.405 ( 0.224) * 0.400 ( 0.229) * 0.395 ( 0.239) * 0.016 ( 0.449) -0.228 ( 0.235) 1.047 ( 0.357) ***
EXPINT 0.012 ( 0.007) * 0.011 ( 0.007) 0.012 ( 0.007) * 0.022 ( 0.021) 0.010 ( 0.009) 0.001 ( 0.010)
FOREIGN 0.292 ( 0.507) 0.216 ( 0.521) 0.163 ( 0.547) -0.578 ( 0.871) 0.202 ( 0.620) -2.593 ( 0.909) ***
DIRECTSUPP 1.028 ( 0.481) ** 0.861 ( 0.495) * 0.884 ( 0.508) * 3.343 ( 1.227) *** -1.093 ( 0.777) -0.582 ( 0.891)
LOCALGROUP -0.133 ( 0.403) -0.153 ( 0.416) -0.174 ( 0.419) 0.217 ( 1.058) 0.598 ( 0.509) 0.344 ( 0.595)
CLIENTMNC -0.110 ( 0.519) -0.240 ( 0.533) -0.216 ( 0.535) -0.639 ( 0.853) -0.998 ( 0.822) 0.182 ( 1.078)
RDDEPT 0.951 ( 0.370) ** 0.701 ( 0.394) * 0.636 ( 0.435) -1.319 ( 1.285) 0.598 ( 0.569) 1.426 ( 0.821) *
PRODUCTINNO 0.981 ( 0.420) ** 0.913 ( 0.432) ** 0.596 ( 0.980) -0.184 ( 0.655) -0.534 ( 0.828)
SENGPER 0.001 ( 0.022) 0.006 ( 0.039) -0.021 ( 0.030) 0.034 ( 0.040)
HIGHTECHPROD 0.157 ( 0.410) -1.104 ( 1.181) 0.032 ( 0.486) 0.415 ( 0.635)
HIGHDESCAP 0.070 ( 0.396) 0.008 ( 0.843) -0.605 ( 0.479) 0.254 ( 0.559)
Obs. (N)
Likelihood
Pseudo R2
McFadden's Adj R2
Wald Chi2 Test
-89.641
0.137
0.050
22.10 (0.0047)
157
-86.444
0.160
0.062
26.93 (0.0014)
156
-85.468
0.161
0.033
27.28 (0.0070)
100
-23.842
0.267
-0.133
13.80 (0.0066)
100
-61.463
0.092
-0.100
10.04 (0.4285)
Co-Design Activities related to Products
Model I Model II Model III
Partners in Cooperation for Co-Product Design Activities
Factor 1
(AMMs)1
Factor 2
(Lower-tier suppliers)2
Factor 3
(Uni. and other firms)3
158 100
-43.797
0.205
-0.031
23.54 (0.0190)

307
Table 6.22: Determinants of the KTTs related to Production Process:
Ordinal Logistic Regression Analysis
Source: Author calculations based on survey results
Notes: ***, **, * denote significance level at 1%, 5% and 10% respectively. Robust standard errors of the coefficients are shown in parentheses. All models
include intercepts significant at 1% level but not shown in the results for space reasons. Two-tailed test. P-values are in brackets in the last rows.
FIRMAGE -0.545 ( 0.328) * -0.440 ( 0.322) -0.659 ( 0.282) ** -0.657 ( 0.313) ** -0.216 ( 0.315) -0.144 ( 0.330)
FIRMSIZE 0.320 ( 0.209) 0.292 ( 0.227) 0.482 ( 0.268) * 0.392 ( 0.268) 0.122 ( 0.213) -0.025 ( 0.228)
EXPINT -0.010 ( 0.006) -0.009 ( 0.007) -0.014 ( 0.007) * -0.011 ( 0.008) -0.019 ( 0.006) *** -0.015 ( 0.007) **
FOREIGN -0.807 ( 0.469) * -0.751 ( 0.476) -0.736 ( 0.456) -0.606 ( 0.446) 0.692 ( 0.496) 0.733 ( 0.516)
DIRECTSUPP 0.550 ( 0.448) 0.673 ( 0.477) 0.448 ( 0.438) 0.583 ( 0.483) 0.346 ( 0.477) 0.519 ( 0.491)
LOCALGROUP -0.802 ( 0.411) * -0.772 ( 0.419) * -0.422 ( 0.423) -0.542 ( 0.438) -0.289 ( 0.416) -0.286 ( 0.424)
CLIENTMNC 0.387 ( 0.465) 0.382 ( 0.490) 0.517 ( 0.512) 0.555 ( 0.516) -1.000 ( 0.594) * -1.065 ( 0.602) *
RDDEPT 0.735 ( 0.418) * 0.678 ( 0.449) 0.473 ( 0.434) 0.656 ( 0.448) 0.646 ( 0.469) 0.533 ( 0.492)
PRODUCTINNO -0.044 ( 0.421) 0.091 ( 0.440) 0.165 ( 0.421) 0.003 ( 0.442) -0.182 ( 0.477) -0.236 ( 0.518)
SENGPER -0.018 ( 0.025) -0.029 ( 0.025) 0.011 ( 0.018) 0.002 ( 0.019) -0.017 ( 0.022) -0.022 ( 0.026)
HIGHTECHPROD 0.502 ( 0.343) 0.531 ( 0.353) -0.105 ( 0.360) -0.250 ( 0.363) 0.021 ( 0.370) 0.006 ( 0.386)
HIGHDESCAP -1.240 ( 0.362) *** -1.299 ( 0.392) *** -0.379 ( 0.345) -0.470 ( 0.366) -1.095 ( 0.385) *** -1.001 ( 0.392) **
ONESUPP 0.337 ( 0.357) -0.100 ( 0.384) 0.684 ( 0.390) *
SSUBCONT 0.004 ( 0.007) 0.011 ( 0.005) ** 0.005 ( 0.008)
Obs. (N)
Likelihood
Pseudo R2
McFadden's Adj R2
Wald Chi2 Test
145
0.068
-0.057
25.40 (0.0309)
156 156145
0.093
-0.030
145
-86.620
0.119
-0.033
156
-94.021
0.110
-0.013
Factor 3 (Low-Technological Level)
Model II Model I Model IIModel I Model II Model I
Factor 1 (High-Technological Level) Factor 2 (Medium-Technological Level)
-126.245 -117.901 -127.539 -119.456
21.11 (0.0988)19.45 (0.0781)
0.088 0.059
21.94 (0.0382) 21.92 (0.0385)
-0.014 -0.044
26.25 (0.0240)

308
Table 6.23: Determinants of the KTTs related to Product, Training and Financial Transfers:
Ordinal Logistic Regression Analysis
Source: Author calculations based on survey results
Notes: ***, **, * denote significance level at 1%, 5% and 10% respectively. Robust standard errors of the coefficients are shown in parentheses. All
models include intercepts significant at 1% level but not shown in the results for space reasons. Two-tailed test. P-values are in brackets in the last
rows.
FIRMAGE -0.023 ( 0.338) 0.402 ( 0.313) -0.626 ( 0.493) 0.003 ( 0.282)
FIRMSIZE 0.154 ( 0.181) 0.112 ( 0.154) 0.700 ( 0.348) ** 0.252 ( 0.205)
EXPINT -0.003 ( 0.008) 0.004 ( 0.007) -0.003 ( 0.009) 0.002 ( 0.006)
FOREIGN -0.082 ( 0.524) 0.877 ( 0.463) * -2.048 ( 0.806) ** 0.310 ( 0.435)
DIRECTSUPP -0.086 ( 0.566) 1.094 ( 0.508) ** -0.432 ( 0.668) 0.126 ( 0.425)
LOCALGROUP -0.516 ( 0.477) 0.004 ( 0.434) -0.091 ( 0.546) 0.329 ( 0.357)
CLIENTMNC 0.190 ( 0.690) -0.097 ( 0.537) 0.433 ( 0.823) -0.230 ( 0.447)
RDDEPT 1.104 ( 0.572) * 0.360 ( 0.491) 0.202 ( 0.586) 0.224 ( 0.380)
PRODUCTINNO 1.147 ( 0.554) ** -0.256 ( 0.546) -0.811 ( 0.601) 0.524 ( 0.436)
SENGPER -0.033 ( 0.021) -0.033 ( 0.032) 0.048 ( 0.042) -0.029 ( 0.024)
HIGHTECHPROD 0.483 ( 0.439) -0.457 ( 0.380) 0.835 ( 0.607) 0.032 ( 0.357)
HIGHDESCAP -0.951 ( 0.466) ** -0.311 ( 0.372) -0.614 ( 0.532) -0.827 ( 0.353) **
ONESUPP 0.960 ( 0.453) ** 0.628 ( 0.398) -0.313 ( 0.533) 0.683 ( 0.352) *
SSUBCONT -0.009 ( 0.010) 0.011 ( 0.006) * -0.002 ( 0.008) 0.001 ( 0.007)
Obs. (N)
Likelihood
Pseudo R2
McFadden's Adj R2
Wald Chi2 Test
Financial TransfersProduct related
KTTsTraining Factor 1
(for Strategic Relationship)
Factor 2
(for Procurement)
126
-89.968
0.047
-0.029
23.93 (0.0467)
127
-124.971
0.091
-0.025
25.06 (0.0339)
144
-54.846
0.123
-0.132
12.30 (0.5820)
145
-147.285
0.068
-0.033
23.41 (0.0539)

309
Table 6.24: Determinants of the Technology Capabilities related to Production, Design and R&D:
Ordinal Logistic Regression Analysis
Source: Author calculations based on survey results
Notes: ***, **, * denote significance level at 1%, 5% and 10% respectively. Robust standard errors of the coefficients are shown in parentheses.
All models include intercepts significant at 1% level but not shown in the results for space reasons. Two-tailed test. P-values are in brackets in the
last rows.
FIRMAGE -0.030 ( 0.273) -0.192 ( 0.286) -0.185 ( 0.343) -0.399 ( 0.335)
FIRMSIZE 0.302 ( 0.223) 0.305 ( 0.227) 0.152 ( 0.208) 0.149 ( 0.226)
EXPINT 0.003 ( 0.006) 0.005 ( 0.007) -0.004 ( 0.006) -0.003 ( 0.007)
FOREIGN -0.353 ( 0.374) -0.321 ( 0.387) -0.382 ( 0.464) -0.312 ( 0.490)
DIRECTSUPP 0.516 ( 0.546) 0.570 ( 0.591) 0.461 ( 0.559) 0.364 ( 0.580)
LOCALGROUP -0.978 ( 0.393) ** -1.052 ( 0.410) ** 0.530 ( 0.397) 0.584 ( 0.424)
CLIENTMNC 1.072 ( 0.479) ** 1.198 ( 0.494) ** 0.731 ( 0.539) 0.691 ( 0.594)
RDDEPT 0.819 ( 0.351) ** 1.091 ( 0.393) *** -0.596 ( 0.449) -0.586 ( 0.503)
PRODUCTINNO 0.716 ( 0.378) * 0.641 ( 0.417) 0.151 ( 0.461) 0.053 ( 0.488)
SENGPER 0.025 ( 0.021) 0.019 ( 0.022) 0.025 ( 0.024) 0.036 ( 0.026)
HIGHTECHPROD 0.155 ( 0.338) 0.152 ( 0.343) -0.143 ( 0.375) -0.088 ( 0.392)
HIGHDESCAP 0.574 ( 0.349) * 0.408 ( 0.360) 0.448 ( 0.414) 0.661 ( 0.446)
ONESUPP -0.763 ( 0.334) ** -0.791 ( 0.350) ** -0.732 ( 0.378) * -0.797 ( 0.379) **
SSUBCONT 0.007 ( 0.007) 0.010 ( 0.008)
Obs. (N)
Likelihood
Pseudo R2
McFadden's Adj R2
Wald Chi2 Test
Factor 1 (Design and R&D Capabilities)
Technology Capabilities related to Production, Design and R&D
Factor 2 (Production Capabilities)
-175.314 -165.478 -114.078
152 153144
-105.519
145
0.084
-0.063
19.35 (0.1519)
0.119 0.0610.130
61.66 (0.0000) 13.92 (0.3796)61.64 (0.0000)
0.034 -0.0710.035

310
Table 6.25: Determinants of the Cooperation Activities with other Firms / Determinants of the Improvements in Production Capability
/ Determinants of the Benefits of being a Direct Supplier:
Ordinal Logistic Regression Analysis
Source: Author calculations based on survey results
Notes: ***, **, * denote significance level at 1%, 5% and 10% respectively. Robust standard errors of the coefficients are shown in parentheses. All models include
intercepts significant at 1% level but not shown in the results for space reasons. Two-tailed test. P-values are in brackets in the last rows.
FIRMAGE -0.215 ( 0.301) 0.279 ( 0.272) 0.228 ( 0.331) -0.220 ( 0.308)
FIRMSIZE 0.249 ( 0.198) 0.067 ( 0.224) 0.192 ( 0.291) 0.142 ( 0.243)
EXPINT 0.003 ( 0.007) 0.009 ( 0.007) 0.007 ( 0.008) 0.000 ( 0.008)
FOREIGN -1.020 ( 0.392) *** -0.430 ( 0.510) -0.846 ( 0.463) * -0.405 ( 0.513)
DIRECTSUPP 0.132 ( 0.524) 0.078 ( 0.489)
LOCALGROUP -0.077 ( 0.346) -0.661 ( 0.362) * 0.582 ( 0.461) 0.070 ( 0.469)
CLIENTMNC -0.134 ( 0.484) -0.536 ( 0.380) -0.669 ( 0.520) 0.202 ( 0.584)
RDDEPT 1.008 ( 0.369) *** -0.398 ( 0.430) -0.375 ( 0.518) -0.243 ( 0.594)
PRODUCTINNO -0.298 ( 0.426) 0.596 ( 0.437) 0.097 ( 0.463) -0.568 ( 0.697)
SENGPER -0.010 ( 0.039) 0.005 ( 0.040) -0.045 ( 0.022) ** -0.061 ( 0.040)
HIGHTECHPROD -0.271 ( 0.347) 0.181 ( 0.357) 0.632 ( 0.394) 0.345 ( 0.429)
HIGHDESCAP -0.073 ( 0.350) 0.637 ( 0.354) * 0.136 ( 0.420) 1.400 ( 0.444) ***
ONESUPP -0.279 ( 0.346) 0.266 ( 0.355) 0.284 ( 0.396) -0.043 ( 0.407)
SSUBCONT 0.012 ( 0.010) 0.015 ( 0.007) ** 0.024 ( 0.010) **
Obs. (N)
Likelihood
Pseudo R2
McFadden's Adj R2
Wald Chi2 Test
118 118147
0.054 0.107 0.125
139
0.059
-0.040
29.50 (0.0089) 19.24 (0.1158)
-0.062
-170.736 -130.653 -100.510 -81.389
30.40 (0.0041) 24 (0.0311)
-0.035 -0.036
Cooperation with
other Firms
Improvements in
Production CapabilityFactor 1
(Production Technology)
Factor 2
(Design and Business Relationships)
Benefits of being a Direct Supplier
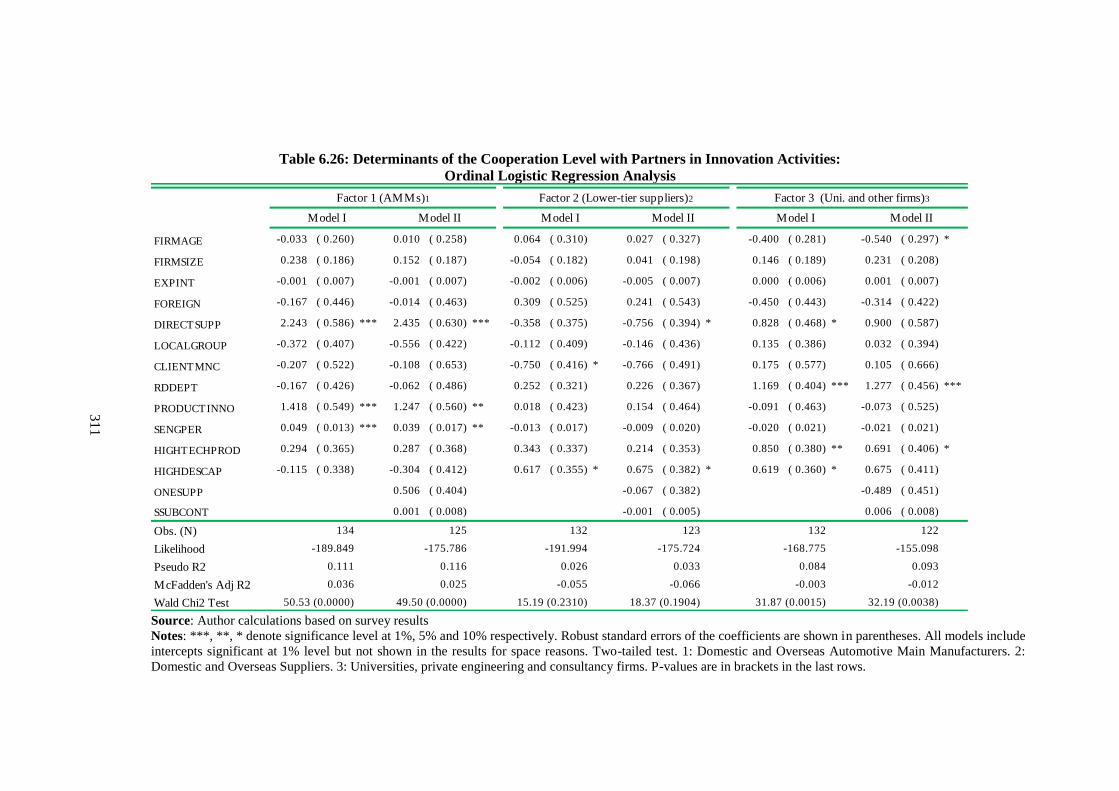
311
Table 6.26: Determinants of the Cooperation Level with Partners in Innovation Activities:
Ordinal Logistic Regression Analysis
Source: Author calculations based on survey results
Notes: ***, **, * denote significance level at 1%, 5% and 10% respectively. Robust standard errors of the coefficients are shown in parentheses. All models include
intercepts significant at 1% level but not shown in the results for space reasons. Two-tailed test. 1: Domestic and Overseas Automotive Main Manufacturers. 2:
Domestic and Overseas Suppliers. 3: Universities, private engineering and consultancy firms. P-values are in brackets in the last rows.
FIRMAGE -0.033 ( 0.260) 0.010 ( 0.258) 0.064 ( 0.310) 0.027 ( 0.327) -0.400 ( 0.281) -0.540 ( 0.297) *
FIRMSIZE 0.238 ( 0.186) 0.152 ( 0.187) -0.054 ( 0.182) 0.041 ( 0.198) 0.146 ( 0.189) 0.231 ( 0.208)
EXPINT -0.001 ( 0.007) -0.001 ( 0.007) -0.002 ( 0.006) -0.005 ( 0.007) 0.000 ( 0.006) 0.001 ( 0.007)
FOREIGN -0.167 ( 0.446) -0.014 ( 0.463) 0.309 ( 0.525) 0.241 ( 0.543) -0.450 ( 0.443) -0.314 ( 0.422)
DIRECTSUPP 2.243 ( 0.586) *** 2.435 ( 0.630) *** -0.358 ( 0.375) -0.756 ( 0.394) * 0.828 ( 0.468) * 0.900 ( 0.587)
LOCALGROUP -0.372 ( 0.407) -0.556 ( 0.422) -0.112 ( 0.409) -0.146 ( 0.436) 0.135 ( 0.386) 0.032 ( 0.394)
CLIENTMNC -0.207 ( 0.522) -0.108 ( 0.653) -0.750 ( 0.416) * -0.766 ( 0.491) 0.175 ( 0.577) 0.105 ( 0.666)
RDDEPT -0.167 ( 0.426) -0.062 ( 0.486) 0.252 ( 0.321) 0.226 ( 0.367) 1.169 ( 0.404) *** 1.277 ( 0.456) ***
PRODUCTINNO 1.418 ( 0.549) *** 1.247 ( 0.560) ** 0.018 ( 0.423) 0.154 ( 0.464) -0.091 ( 0.463) -0.073 ( 0.525)
SENGPER 0.049 ( 0.013) *** 0.039 ( 0.017) ** -0.013 ( 0.017) -0.009 ( 0.020) -0.020 ( 0.021) -0.021 ( 0.021)
HIGHTECHPROD 0.294 ( 0.365) 0.287 ( 0.368) 0.343 ( 0.337) 0.214 ( 0.353) 0.850 ( 0.380) ** 0.691 ( 0.406) *
HIGHDESCAP -0.115 ( 0.338) -0.304 ( 0.412) 0.617 ( 0.355) * 0.675 ( 0.382) * 0.619 ( 0.360) * 0.675 ( 0.411)
ONESUPP 0.506 ( 0.404) -0.067 ( 0.382) -0.489 ( 0.451)
SSUBCONT 0.001 ( 0.008) -0.001 ( 0.005) 0.006 ( 0.008)
Obs. (N)
Likelihood
Pseudo R2
McFadden's Adj R2
Wald Chi2 Test
122132132 123134
0.111
0.036
50.53 (0.0000)
125
-189.849
49.50 (0.0000)
0.025
18.37 (0.1904)
0.093
-0.066 -0.012
0.084
15.19 (0.2310)
0.026
-0.055
Factor 1 (AMMs)1 Factor 2 (Lower-tier suppliers)2 Factor 3 (Uni. and other firms)3
Model I Model II Model I Model II Model I Model II
-168.775 -155.098-175.786
0.116 0.033
-0.003
31.87 (0.0015) 32.19 (0.0038)
-175.724-191.994
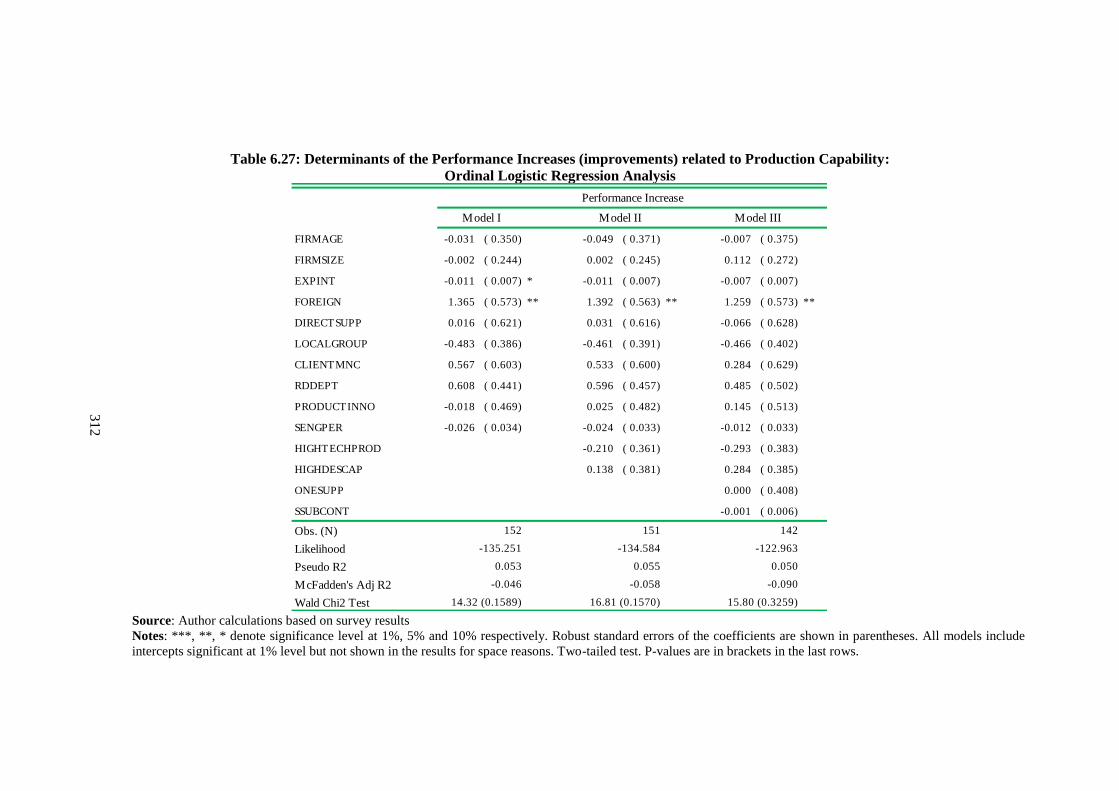
312
Table 6.27: Determinants of the Performance Increases (improvements) related to Production Capability:
Ordinal Logistic Regression Analysis
Source: Author calculations based on survey results
Notes: ***, **, * denote significance level at 1%, 5% and 10% respectively. Robust standard errors of the coefficients are shown in parentheses. All models include
intercepts significant at 1% level but not shown in the results for space reasons. Two-tailed test. P-values are in brackets in the last rows.
FIRMAGE -0.031 ( 0.350) -0.049 ( 0.371) -0.007 ( 0.375)
FIRMSIZE -0.002 ( 0.244) 0.002 ( 0.245) 0.112 ( 0.272)
EXPINT -0.011 ( 0.007) * -0.011 ( 0.007) -0.007 ( 0.007)
FOREIGN 1.365 ( 0.573) ** 1.392 ( 0.563) ** 1.259 ( 0.573) **
DIRECTSUPP 0.016 ( 0.621) 0.031 ( 0.616) -0.066 ( 0.628)
LOCALGROUP -0.483 ( 0.386) -0.461 ( 0.391) -0.466 ( 0.402)
CLIENTMNC 0.567 ( 0.603) 0.533 ( 0.600) 0.284 ( 0.629)
RDDEPT 0.608 ( 0.441) 0.596 ( 0.457) 0.485 ( 0.502)
PRODUCTINNO -0.018 ( 0.469) 0.025 ( 0.482) 0.145 ( 0.513)
SENGPER -0.026 ( 0.034) -0.024 ( 0.033) -0.012 ( 0.033)
HIGHTECHPROD -0.210 ( 0.361) -0.293 ( 0.383)
HIGHDESCAP 0.138 ( 0.381) 0.284 ( 0.385)
ONESUPP 0.000 ( 0.408)
SSUBCONT -0.001 ( 0.006)
Obs. (N)
Likelihood
Pseudo R2
McFadden's Adj R2
Wald Chi2 Test
0.053
-0.046
14.32 (0.1589)
0.050
-0.090
15.80 (0.3259)
0.055
-0.058
16.81 (0.1570)
Performance Increase
-135.251 -134.584 -122.963
Model I Model II Model III
142151152

313
Table 6.28: Recapitulative Table of Logistic Regression Analyses
Source: Author calculations based on survey results
Notes: (+) Positive Effect and (-): Negative Effect. All are statistically significant at least at the 10% level. Two-tailed test.
Legend: AMMs (Automotive Main Manufacturers) *Domestic: Domestic AMMs and Domestic Suppliers. *Overseas: Overseas AMMs and Overseas Suppliers;
LATA (Low-Advanced Technology Agreements); ATA (Advanced Technology Agreements)
Direct
Supplier
R&D
Department
Innovation
Activities
Product
Innovation
Activities
Technology
Agreements
(TA)
Sources of the Technologies
Co-Design
Activities related
to Products
Partners in Cooperation for
Co-Design Activities related to
Products
+ AMMs
- Universities and other Firms
+ AMMs
+ Universities and other Firms
+ O verseas*
- Lower-Tier Suppliers
- Domestic*
+ Domestic*- Overseas*
- AMMs
+ Universities and other Firms
CLIENTMNC + + Domestic*
RDDEPT + + LATA + + Universities and other Firms
PRODUCTINNO + + + ATA ++ LATA
+ ATA
HIGHTECHPROD + + O verseas*
HIGHDESCAP +ONESUPP
SSUBCONT + ATA
RDSUB +
+ AMMs
- Universities and other Firms
- Lower-Tier Suppliers
+ LATA
- ATA
+ ++ LATA + Universities and other Firms
- Universities and other Firms
++
FOREIGN
FIRMAGE
FIRMSIZE
EXPINT - + + +
+
+
SENGPER
DIRECTSUPP
LOCALGROUP +
-
+
+ +
+
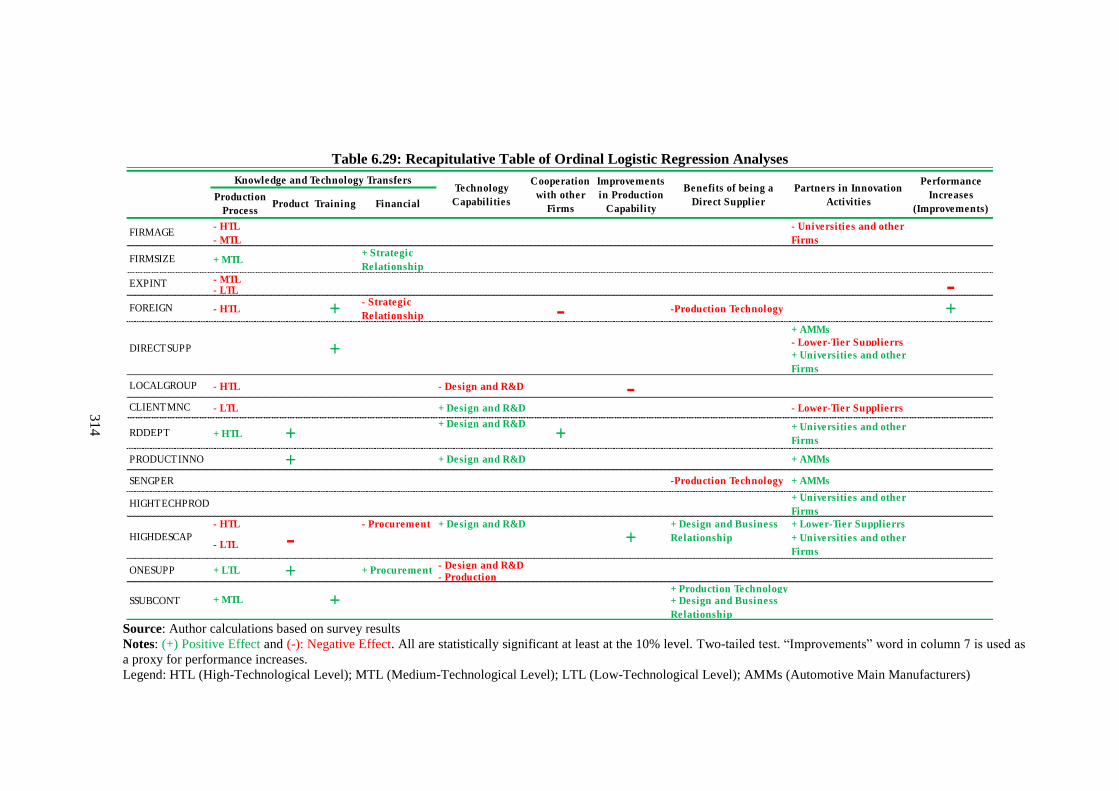
314
Table 6.29: Recapitulative Table of Ordinal Logistic Regression Analyses
Source: Author calculations based on survey results
Notes: (+) Positive Effect and (-): Negative Effect. All are statistically significant at least at the 10% level. Two-tailed test. “Improvements” word in column 7 is used as
a proxy for performance increases.
Legend: HTL (High-Technological Level); MTL (Medium-Technological Level); LTL (Low-Technological Level); AMMs (Automotive Main Manufacturers)
Production
ProcessProduct Training Financial
- HTL
- MTL
- MTL- LTL
+ AMMs
- Lower-Tier Supplierrs
+ Universities and other
Firms
+ Design and R&D
- HTL + Lower-Tier Supplierrs
- LTL+ Universities and other
Firms
- Design and R&D- Production
+ Production Technology+ MTL +
+ + Design and R&D + AMMs
- LTL + Design and R&D - Lower-Tier Supplierrs
+ Universities and other
Firms+ HTL + +
+ LTL + Procurement+
+ Universities and other
Firms
-- Procurement + Design and R&D
+
- -Production Technology +
- Universities and other
Firms
- HTL - Design and R&D -
+ Strategic
Relationship+ MTL
+
Improvements
in Production
Capability
Benefits of being a
Direct Supplier
+ Design and Business
Relationship
+ Design and Business
Relationship
Partners in Innovation
Activities
+ AMMs-Production Technology
Performance
Increases
(Improvements)
-
ONESUPP
SSUBCONT
Knowledge and Technology TransfersTechnology
Capabilities
Cooperation
with other
Firms
+- HTL- Strategic
Relationship
CLIENTMNC
RDDEPT
PRODUCTINNO
SENGPER
HIGHTECHPROD
HIGHDESCAP
FIRMAGE
FIRMSIZE
EXPINT
FOREIGN
DIRECTSUPP
LOCALGROUP

315
CHAPTER 7
FINDINGS AND ANALYSIS
OF THE INTERVIEWS WITH AMMs
This chapter will evaluate the qualitative data obtained from the semi-structured in-depth
analyses of the interviews conducted with 19 top executives of the 11 AMMs operating in
Turkey (DAMM), based on major topics and interview sub-sections. This chapter is
composed of seven sections. In the first section, general information on the AMMs
interviewed will be presented. In the next three sections, we will analyze the characteristics
of the AMMs operating in Turkey; their cooperation activities with MNCs (global AMMs)
as their foreign partners; R&D and technology-related activities and channels of the KTTs
realized by MNCs to the AMMs at intra-firm level. In the fifth and sixth sections, we will
detail the relations of the AMMs with their direct suppliers operating in Turkey, and analyze
and evaluate the channels and determinants of the KTT at inter-firm level realized by the
AMMs to their direct suppliers through backward linkages. The seventh section will contain
the results of the SWOT analysis of the industry in terms of KTTs based on the findings
obtained in the framework of the study. In the analyses, similar views will be put together for
the sake of keeping the identities of the AMMs interviewed confidential, and the findings
will be enriched with the viewpoints considered significant, as well. The interviews made
with the top-executives of the AMMs took 32 hours in total, and the text content of 447
pages were decoded following the interviews. The findings obtained from the interview
analyses will be also used for the quantitative survey results on supply industry attained in
Chapters 5 and 6 in a complementary way. Since there has been no similar another study
conducted in the industry on this subject as far as we know, no comparison of the findings

316
could be possible. The findings tried to be put forward herein are the first findings
concerning the industry and therefore are of major significance. In addition, they could
contribute to more extensive, similar studies yet to follow, setting an example for them.
7.1. Introduction
The global AMMs (or OAMM)189
are the MNCs who invest in many countries on a global
scale, who develop business relationships and establish partnerships, and who carry out
manufacturing activities at the plants founded in the host countries under their own licenses
as a result of those partnerships190
. For this reason, we prefer to use the expressions “global
AMM” and “MNC” interchangeably or to bear the same meaning hereafter.
The 11 AMMs we have made an interview with could be evaluated under three distinct
foundation and management structure: (i) affiliates of MNCs (FS=100%); (ii) capital
partnerships in the form of joint-ventures based on the different foreign shares, established
between a local group and MNC (29%<FS<86%) and (iii) independent local assemblers with
no foreign share but performing manufacturing under MNC licenses191
(see Appendix J). It
was observed during the interviews that even the AMMs, with no apparent licensed
manufacturing, do manufacture their engines and various powertrain192
parts locally under
foreign licenses of the global AMMs as their foreign partner or import them directly.
It has been determined that the know-how, design and R&D headquarters of the AMMs with
foreign-capital (FS≥29%) interviewed are located in the central countries of MNC who is
their partners (Japan, USA, Germany, France, Italy, etc.)193
. It has been found out that it is
these central headquarters who take the decisions on and strategies about manufacturing and
the future, who develop issues of each and every kind of basic design, planning, R&D
activities, manufacturing process supervision, operations management systems, etc., and who
is the final decision making organ in these respects. Generally speaking, it is observed that
the AMMs in Turkey are informed and notified of the decisions only after those decisions
189
See section 4.7.3 for the decription of OAMM. 190
Whereas some global AMMs specialize only in the personal car product range, some others specialize in both
personal car and commercial vehicle product ranges. 191
It is determined that these companies have several license agreements with various MNCs abroad in order to
produce and/or assemble some imported systems/parts (especially powertrain parts) in their vehicles. 192
Such parts (gearboxes, differentials, brakes, suspensions, axles, etc.) are imported from the partner MNC in
general. 193
For example, Japan is the headquarters for Toyota and Anadolu-Isuzu, Germany is the headquarters for
M.A.N Türkiye and Mercedes-Benz Türk, and France is the headquarter for Renault.

317
are made, except in highly unusual cases. Such kind of management style is also applicable
for MNCs’ other affiliates and plants around the world. In other words, the AMMs in the
form of joint-venture capital partnerships are considered a 100% MNC in management and
technological sense, although their capital structure is different. It has been determined as a
result of the interviews that there is also no difference between a MNC as a foreign partner
and the AMMs with joint-venture capital ownership in real sense. For example the company
TOFAŞ defines himself as FIAT, FORD-OTOSAN as FORD, OYAK RENAULT as
RENAULT and ANADOLU ISUZU as ISUZU. In this context, it is observed that each and
every kind of cooperation activities between the partners (MNCs and AMMs in Turkey) are
being performed mutually, that the manufacturing and management systems of MNCs
abroad are being implemented at the domestic AMMs and that there is no obstacle in front of
all types of KTTs conducted by MNCs to AMMs in Turkey. In addition, it is observed that
the local engineers of the AMMs and foreign engineers of MNCs work continuously as a
mixed team on many projects at home or abroad. In sum, the knowledge, experience,
technology, culture and know-how owned by MNCs are shared in different degrees with the
AMMs in Turkey as their partners (groups such as OYAK, OTOSAN, TOFAŞ, ANADOLU
and KOÇ), in consequence of the partnership agreements and cooperation.
Figure 7.1 shows the shares of all AMMs operating in Turkey (15 ea.), and among them,
shares of 11 AMMs who were interviewed, in total production and sales during 2010 year,
based on foreign ownership structure. As seen from the Figure ii, the share of the AMMs
interviewed in total production is 89% while their share in total sales is 91%. The ratio of the
AMMs with domestic-capital (FS=0%), with whom an interview could not be performed, in
total sales (total production) is 2% (2%), while the said ratio of the AMMs with majority-
foreign ownership (50% < FS < 86%) is 5% (7%) and the ratio of AMMs with fully foreign-
ownership (FS=100%) is 2% (1%), respectively. Therefore, we could assume comfortably
that the sample interviewed represents the universe (the automotive main industry of Turkey)
to a great extent (91%) (see section 4.6.2.4 and Table 4.10 for details).
We will analyze the AMMs in accordance with the previous chapters based on the following
three distinct foreign ownership structures:
1) Foreign ownership AMMs if FS is at least 10% or more in total capital (FS≥10%),
2) Joint-ventures with different foreign shares (29%<FS<86%) and with full foreign
ownership (FS=100%) (affiliate of MNCs),
3) Minority (29%<FS<42%) and majority foreign ownership AMMs (50%<FS).

318
(i)
(ii)
Figure 7.1: Share of the All and Interviewed AMMs in Total Production and
Sales in 2010 by Different Foreign Ownership
Source: Author calculations based on OSD statistics
When Figure 7.1 is evaluated based on the above-mentioned foreign ownership structures
with respect to all AMMs (Figure i):
It is observed that the share of the all AMMs with foreign ownership according to the first
category in the total production and sales is 97% and 92% respectively, while shares of
the AMMs with domestic-capital (FS=0%) are only 3% and 8%.
When the AMMs are compared according to second category, it is observed that the share
of the AMMs in the form of joint-venture capital partnership (7 companies) in total
production is 88%, approximately 10 times higher than those of the AMMs with 100%
foreign capital (3 companies) (9%), and their share in total sales is 81%, approximately 7
times higher than those of the AMMs with 100% foreign capital (11%).
Further, when we make the same evaluations according to the third category, we observe
that the AMMs have nearly equal shares [AMMs with minority (majority) foreign
ownership is 45% (52%) in production, and AMMs with minority (majority) foreign
ownership is 45% (47%) in total sales]. These statistics reveal that a major part (92%) of
the production activities in the Turkish automotive main industry is realized by the MNC

319
affiliates or partners, and underlines the fact that MNCs play a significant role in this
respect. In other words, it points out that the Turkish automotive main industry is under
the control and domination of the MNCs. Although we will analyze later in detail, it is
understood from the information obtained from the interviews that the AMMs operating
in Turkey are a part of MNCs and that they are included in their global production
networks, and that those MNCs exports their products to first of all the EU countries, and
the countries of the Eastern Europe, Middle East, Far East, Asia, North Africa, as well as
the Balkan countries and USA, utilizing Turkey as a regional production base.
7.2. General Characteristics of the AMMs Interviewed
7.2.1. General Information
The information on the 11 AMMs interviewed could be summarized as follows:
Capital Structure: When their capital structure is reviewed, it is seen that: 3 of them are
domestic and 2 are 100% foreign-capital companies. 6 other of them, however, have a joint-
venture capital ownership structure, where foreign capital remains as minority
(29%<FS<42%) (4 companies) and majority (FS≥50%) (2 companies).
Scale: The AMMs interviewed are large-scale companies. Total number of their employees
ranges between 500 and 8400 people. Average company size in terms of the number of
employees is above 3000 people (3390). See Appendix J for the capital of the companies,
their total production capacities during the year 2011 and total production and sales figures
during the year 2010.
Management: When we look into the management structure of the AMMs, we observe that
the management and organizational structure of the joint-venture partnerships where foreign
capital remains as minority are composed basically of the local managers appointed by the
domestic partner, while it is observed that the MNC as the foreign partner is represented with
relatively small number of foreign managers (2 or 3 people) within those structures.
However, in the companies of a joint-venture capital partnership that are fully foreign
companies or that have foreign capital in majority, the top management is established by the
MNC. Individuals appointed to the said management positions are in general foreigners, but

320
could be locals, as well. Foreign managers are appointed generally from the central country
where the MNC headquarters is located.
Vehicle Type: When the types of the vehicles manufactured by the companies are reviewed,
it is observed that 7 of them manufacture light commercial vehicles and/or buses, 2
manufacture personal cars and light commercial vehicles, 1 manufactures only personal cars
and 1 manufactures only tractors194
(see Appendix J for details). It has been understood from
the interviews that the AMMs in Turkey have been focused on and specializing in especially
manufacturing of buses and light commercial vehicles. In other words, we could say that
Turkey is a commercial vehicle production base. Trucks, light trucks, pick-ups and buses in
various models and versions, addressing to all segments, are manufactured and sold to
markets abroad.
Market: It is detected that on average 70%-80% of the vehicles manufactured by the AMMs
are exported. Therefore, the companies are giving special attention to overseas markets
rather than domestic market. On average, half of the exports of the companies are to the EU
countries (Portugal, France, Italy, Germany, Spain and England), while the rest to the
Eastern Europe, the Middle East, Asia, the North Africa, Saudi Arabia and USA.
R&D: All of the AMMs interviewed expressed that they conduct R&D activities. Except
one (TOYOTA), all of the AMMs have a R&D center in the framework of the R&D Law no.
5746 accepted in 2008. Number of the full-time R&D personnel of the AMMs ranges
between 55 and 960, while average number of R&D personnel is 287. When the said value is
compared to the average number of employees, it is understood that 8.5% of the employees
are R&D personnel. During the interviews, the managers consider it more appropriate to
share the information on the ratio of their R&D expenses to their total sales, rather than let
their R&D budget known, for confidentiality purposes. In view of that, it has been
determined that the ratio of the annual R&D expenses of the companies to their total sales
ranges between 2% and 5%, being on average 3.5%. When compared to the average R&D
expenses in Turkey, it is clear that those rates are quite high. When the companies were
asked about the reasons for the situation, they indicated that the ratios had been higher than
normal levels for the last couple of years and that the most important reason for that case was
the higher R&D investment amounts at the new product development phase and during
194
Two of the AMMs with domestic-capital manufacture also armoured vehicles and tanks in cooperation with
Aselsan, Roketsan and MKE, under the scope of the defence industry. Such types of vehicles are designed and
developed domestically and manufactured by obtaining relevant licenses. It has been determined that the AMMs
have accumulated significant design, R&D experience and know-how via such projects.

321
establishment of a R&D center under the scope of R&D Law no. 5746, despite the global
financial crisis. On the other hand, when the companies were asked about their estimations
for the upcoming years, their responses were that those ratios would remain higher for the
next couple of years and that it was planned that they would remain stable at 2%-3% in the
medium term. It is observed that, in consequence of the AMMs’ having been specialized in
the commercial vehicles, the ratio of the number of R&D personnel and R&D expenses of
the AMMs manufacturing buses and commercial vehicles to their total sales are higher than
those of the AMMs manufacturing personal cars.
7.2.2. Production Structure
It has been determined that, across the automotive main industry, the most technology- and
knowledge-intensive production, based mainly on know-how and electronics, is evident in
the personal cars while the most labor-intensive production is evident in the buses. In
general, the basic vision and mission of the AMMs in Turkey is to supply the highest-quality
systems and parts utilized during the manufacturing process, first from domestic sources,
then from various sources abroad, at lowest prices and in a timely manner, and assemble
these afterwards.
It has been discovered that the AMMs that are fully domestic or that have minority foreign
ownership do not engage in manufacturing actually but rather are involved, in general, in
assembly, design and R&D activities aimed at adaptive improvements basically of non-basic
scientific nature195
. On the other hand, the AMMs where foreign capital is in majority are
basically assembly facilities and do not perform R&D or design activities - such activities
are conducted at the MNC headquarters as the main centers -, but they are in strategic
cooperation with the said centers in terms of all the decisions taken on manufacturing
process.
According to the information gathered from the interviews, the production, design and R&D
activities of the AMMs could be summarized in three different fashions, independently of
the foreign capital structure:
i) Importing the vehicles as a whole from the facilities of the MNC located abroad, as
their foreign partner (being official distributor of the MNC). In this production
195
Two of the AMMs have underlined the fact that some of the critical and major parts which cannot be procured
from the suppliers are manufactured in-house.
322
structure, it has been observed that the AMMs, that have a joint-venture capital
structure, are allowed by their partner MNCs to perform small-scale arrangements,
adaptive changes and parts modifications on the vehicles when required, in terms of
compliance with the market and domestic highway conditions (involving no
production activities actually), at the plants of the AMMs located at home.
ii) Manufacturing totally identical copies of the vehicles produced abroad, through
localization process in Turkey, by means of utilizing the styles, concepts, designs and
projects developed abroad by the foreign partner MNCs. In this production structure,
the AMMs do not contribute in the vehicles manufactured in terms of design, R&D
and advanced level of technology; the manufacturing process is conducted totally
under the foreign licenses and at home. In other words, all activities such as basic
design, R&D, development, test, etc. depend on the MNC headquarters, and Turkey is
utilized only as a production base. The technology, electronics, powertrain group
based on know-how (transmission, drive shafts, and differentials), engines, steering
wheel systems, smart control units containing embedded software, safety parts or
systems used for the manufacturing are all imported from abroad. Localization efforts
are, on the other hand, performed mostly on various systems and components such as
seats, sheet-metal parts, plastic parts, tires, lighting (headlights/tail lights, etc.),
windshields and windows, internal trim materials, etc., under cooperation with
domestic suppliers. Although the rate of the localization according to the value of the
vehicle varies depending on the vehicle types being manufactured and AMMs, it
ranges from 40% to 50% for the personal cars and 60% to 70% for the commercial
vehicles (see section 7.2.4). As to the localization efforts and processes of the AMMs,
it has been observed that they could conduct adaptive, small-scale improvement and
development activities at their R&D centers in Turkey. In this respect, the
responsibility for the vehicles manufactured for the Turkish market lies with the R&D
unit located in Turkey.
iii) Planning, designing, developing, testing and manufacturing the vehicle and its systems
from scratch, totally by the local engineers of the AMMs with domestic-capital
(FS=0%) manufacturing buses and commercial vehicles196
. In this production
structure, it is observed that the most critical parts of the vehicle are produced on the
co-design and/or co-development basis, together with the direct suppliers located at
home or abroad, adhering to the basic design and style. In this production structure,
however, the basic components and parts of the vehicles, such as powertrain etc. are
196
The manufacturing process from scratch is composed of the following phases: conceptual design, detailed
design, design verification, developing, prototype, and tests for quality and durability, pre-production tests, serial
production and post-production tests.

323
also imported from abroad. When we look at the origins of the parts, we could say
that, in general, the powertrain parts are imported from the MNC headquarters located
abroad while system parts such as safety systems, steering box, etc. are as a whole
imported from the global-mega suppliers and then mounted on the vehicle. Other
critical sub-parts are procured from the other direct suppliers at home or abroad, on
the basis of co-design or co-development, while less complex parts are generally
procured from the domestic suppliers. As to the foreign-capital AMMs interviewed,
they have underlined the fact that, in the case of the style, concept and design of the
vehicle is totally local, in order for the vehicle to be manufactured in the facilities
located in Turkey and then exported to the world markets, it is imperative that those
vehicles be approved by the partner MNC, since the vehicles to be manufactured will
bear the trademark of the MNC who is the foreign partner. When it comes to the
intellectual property rights concerning the design, it is observed that those rights vary
depending on the business relations between the partners and financial structure, but in
general those rights belong to the partner who has developed the design. On the other
hand, there has been no such problem for the AMMs with domestic-capital, since they
have been using their own trademark. In this scope, it has been determined that the
design which has been developed in this way is subjected to various tests by the
foreign experts and engineers at the headquarters of the relevant MNC, and that it is
authorized to be manufactured and exported to other countries if deemed appropriate
as a result of those tests197
. As to the AMMs with domestic-capital, the approval is
granted by the domestic AMM if the style, design and engineering of the vehicle are
local; or by the partner MNC if it is not.
Among the AMMs interviewed, there are companies who fall within only one of the
production structures we have summarized above, as well as the AMMs falling within two or
all three of them. That being said, it could be stated that the AMMs in the personal car
category operate in production structures i and ii, while the AMMs in the commercial
category operate in production structures ii and iii. One of the most significant findings is
that it has been discovered that 90% of the R&D, innovation and technology-related
activities of the AMMs in Turkey are focused on the vehicles falling in the bus and light
commercial vehicle class, produced in the third (iii) manufacturing structure.
197
One of the MNCs has the only partner company in the bus class located in Turkey, manufacturing buses under
his own trademark only in Turkey together with his local partner and exports them to the world.

324
The most critical operations conducted by the AMMs in relation with the production process
are grouped under five main topics:
Deciding on from which suppliers and how the parts to be used in the production
process will be procured: The suppliers with whom the company will work together are
determined according to the criteria concerning the components to be required, such as
quantity, design, cost, quality, reliability, durability, delivery, defect rate.
Material technologies: Continuous optimization of the manufacturing-related structure;
researching and developing higher-quality, more comfortable, lighter and more robust
technological materials.
Torque-related processes: Assembling and torqueing the materials supplied accurately and
properly; using the tools correctly; and making and checking their calibrations and
performing their maintenance and service activities in a complete manner. These processes
are considered a highly critical operation by the AMMs.
Welding: Workmanship of the welding works of the parts (especially in the car-body);
welding quality; performing welding works accurately and uniformly every time. It is seen
that such welding works are performed by robots on the production line of some AMMs with
foreign-capital who manufacture personal cars. On the other hand, it is observed that
majority of the domestic- and foreign-capital AMMs who manufacture buses and
commercial vehicles do not employ any robot technologies. It has been determined that the
assembly and welding works at the production facilities of the MNCs abroad are performed
totally by robots, and that the quality of the workmanship takes precedence, since use of the
robot technologies is not feasible due to the fact that the quantities produced in the domestic
plants remains at very low levels.
Check-outs, test and measurements: Conducting each and every kind of tests and
measurements on both the parts used and final product before they come out of the
production line, and approving them and making the product ready for delivery to the final
user.

325
7.2.3. R&D, Innovation and Technology Activities
Another finding of the study is that majority of the AMMs continuously perform R&D,
innovation and technology-related activities on both the products and the production
processes, with a view to producing more comfortable, safer, higher-quality and less
expensive vehicles than those produced by their rivals.
We could summarize the R&D activities of the AMMs in three classes based on the
information obtained:
1. Improvement and development activities on the products which could be
industrialized in the short term (3-5 years).
2. R&D activities which could be transformed into products and therefore be
commercialized in the medium term (minimum 5 years).
3. Basic scientific R&D activities and researches on the products which could be
industrialized in the long term (10-15 years), conducted by the R&D units, private
research laboratories and headquarters of the MNC as foreign partner.
The most important finding is that the AMMs in Turkey do not engage in the basic R&D
projects falling in the third category. It has been determined that the most significant R&D
activities have been concentrated on the first category, followed partly by the second
category. It has been observed that the R&D activities of the AMMs include manufacturing
of the new products at low- and mid-tech level, and re-designing, improving and developing
the former parts in terms of quality and targeted use. It has also been determined that as
problems arise in the field of the topics studied under the scope of such R&D projects, the
need to co-operation with MNCs, universities and supply industry increases, as well.
It has been discovered that the AMMs with foreign-capital benefit, to the utmost degree,
from the advantages of being included in the global production network of the MNCs, i.e.
being a global company, when it comes to such R&D activities. In this scope, strategic
cooperation is established between the R&D centers of the MNCs abroad and the R&D
centers located in Turkey; the local and foreign engineers work, as a mixed team, on various
projects at home or abroad; and all kinds of support can be provided by the MNCs for
resolution of the problems faced with. It could be said that the common goal of the
companies is to give birth to new and different products involving intensive know-how and
technology, suitable for the market concerned; to improve the existing products; and to make
new designs.

326
Some of the AMMs have stated that after they have established a R&D center in Turkey,
certain departments such as design, parts development, new products design, etc. which are
currently included in the structure of the MNC headquarters abroad are planned to be shifted
by MNCs to the this center in Turkey. In addition, it has been discovered that two of the
AMMs with a foreign partner, operating in Turkey, have a separate R&D center affiliated to
the R&D center of the MNC as foreign partner. However, these centers at home are not a
fully-equipped R&D center but rather work together with the MNC headquarters on the
improvement projects for the vehicle to be manufactured at home.
The findings on the R&D, innovation and technology-related activities of the AMMs,
obtained in consequence of the interviews, may be summarized as follows:
Trying to implement to full extent the MNC systems, and trying to improve and
develop them continuously, on the issues of product, quality, occupational safety,
production processes and business management and under the supervision of the such
processes,
Conducting R&D and improvement activities for the vehicles to be produced and sold
locally in Turkey, on issues such as compatibility to the domestic market and highway
conditions,
To conduct R&D activities on innovative vehicle technologies and composite,
alternative, new materials. It has been determined that the AMMs in Turkey have a
serious accumulation of know-how on such issues,
To perform co-design and co-development activities through joint projects at the new
product development phases, by establishing strategic partnerships with the partner
MNC, global-mega suppliers and domestic direct suppliers,
To develop and enhance the engineering and designing skills of the R&D personnel
continuously, to employ advanced computer software in analyses, to perform virtual
3D design and mathematical modeling activities and to produce engineering drawings
based on dynamics and statics,
To perform optimization activities concerning the powertrain,
To perform partially design verification, virtual verification, physical verification and
virtual crash test activities,
To conduct studies on the vehicle manufacturing that comply with the EU regulations,
designing and safety-related activities, products or product lines,
To work on the issues concerning improvement of the exhaust-emission tests,
To perform activities on obtaining patents.

327
7.2.4. Domestic Input Rate and Major Sources of Inputs
It has been determined, according to the analyses of the interviews, that the rate of the
domestic inputs198
used in the vehicles produced at home has been gradually increasing from
personal car production to bus production. Based on the information obtained, the rate of the
domestic inputs increases up to 40%-50% in the production of personal cars, 50%-60% in
the production of trucks and pick-up trucks, and 70% in the production of buses. Since more
parts are used in the production of buses, their domestic value added is higher.
Regardless of foreign-capital ownership and the type of the vehicle produced, system parts
such as powertrain, engines, safety systems, steering wheel systems, electronic hardware
containing embedded software, brakes, etc. are imported from the MNC headquarters
basically located in Japan, Germany, USA, Italy, France and England and/or from global-
mega suppliers. The market accommodating the global-mega suppliers is an oligopoly
market composed of leading players who manufacture such system parts as stated above,
supplying many MNCs around the world with the parts concerned (see section 4.7.2). Less
complex and labor-intensive sub-parts are generally procured from the direct suppliers
located at home. The inputs procured from domestic sources are mostly such products as iron
and steel, sheet-metal parts, windshield and personal’s window glasses, plastic parts, seats,
glove compartment, tires, rubber parts, plastic tubes, signal lamps, headlights and tail lights.
While the average rate of the inputs that are procured from the domestic sources and used for
the production in terms of parts’ quantity is nearly 85%, the rate of the domestic inputs in the
total cost drops to 40%-50%. The most important reason for this is that the imported parts
and systems are the basic products composing the vehicle and increase the cost of the inputs
due to the fact that they are more expensive, since they are predominantly electronic,
technological and know-how inputs. When it is considered that also the parts and
components procured from the direct suppliers in Turkey contain imported inputs (indirect
import), the rate of the domestic inputs in the total vehicle production drops even further.
Moreover, given that the average rate of the domestic direct suppliers of the AMMs (66%) is
twice the average rate of the overseas direct suppliers (33%) (see section 7.5.2 and Table
7.1), average cost per supplier for the AMMs becomes two-fold higher when it comes to
overseas suppliers. In other words, although less number of products in terms of parts’
quantity is procured from less number of overseas suppliers, the total cost paid to them is
almost equal to the cost paid to the domestic suppliers.
198
Raw materials, intermediate goods etc.

328
7.2.5. Patent Policy
It has been observed that the efforts of the AMMs for obtaining patents have been gradually
increased in recent years and that therefore they attach great importance to the training of the
R&D personnel. It has been determined that, until the last 4-5 years, the AMMs did not make
much effort to increase the number of their patents; but have been trying to increase the
number by promoting obtaining patents via R&D centers established especially in the
framework of the R&D Law no. 5746. The fact that existence of a R&D center established
under the scope of the law encourages obtaining patents has been indicated as the most
important reason for such situation. Therefore, the AMMs, who did not desire to obtain a
patent for protecting their products before, have identified as their targets to increase the
number of the patents in their possession now in order to protect their rights and encourage
innovation. Nevertheless, there exist different opinions among the AMMs with regard to
obtaining patents. For some companies, increasing the number of the patents in their
possession constitutes an extremely important goal and indicator, and therefore their R&D
personnel are encouraged to get patents by producing projects in the subject fields
considered important by the company, and are rewarded to this end. Some companies,
however, do not prefer to obtain a patent even if they do have innovations and developments
specific to them. It has been stated that general opinion and target of those companies, as a
matter of fact, is obtaining patents for the technologies, innovations, products and studies
which would bring higher commercial values and which need to be protected, rather than
obtaining a patent for every minor innovation.
7.3. KTTs through Partners in Strategic Collaborations
It has been observed that the AMMs with both domestic and the joint-venture capital
structure have established formal or informal strategic collaborations and contacts both at
home and abroad with many partners, first of all their partner MNC. Mutual relationships
with such strategic partners have enabled KTTs on certain issues such as production,
production processes, supervision, quality, business management, training, etc. to the
AMMs, contributing greatly to the know-how of the AMM itself.

329
The partners with whom such collaborations have been established are listed as follows,
according to their order of significance:
1- MNC as foreign partner (global AMMs): Most critical technologies and know-how
employed for the production are provided from the MNC headquarters. It has been
determined, for example, that highly extensive engineering support are being obtained
concerning the issues such as production, production processes, quality control,
supervision, etc. It is observed that various training and support activities aiming at
implementing the self-proven "World Class Manufacturing" (WCM) systems199
successfully (see section 7.4.2), that are being implemented by the MNCs across their
worldwide plants; also at the plants located in Turkey ensure a noteworthy KTTs. It is
understood that successful and continuous implementation of such systems requires a
well thought-out planning, joint study, discipline, engineering, culture and vision. For this
reason, serious training on the establishment and successful implementation of such
systems are required and it may take years and years.
2- Licensor MNC: KTTs are provided via joint agreements and projects executed with the
licensor MNCs. This kind of activities is generally observed for the AMMs with domestic
capital that produce some parts under MNC license at home.
3- Global-mega suppliers: It has been determined that during design, design verification,
product development and production processes, KTTs are provided to the local engineers
through joint projects, consultancy and support. The mega-suppliers (also they are
MNCs) have considerable amount of know-how on the powertrain, engines, safety system
parts and electronic parts of high-tech nature; and design, develop and manufacture these
parts at their own R&D centers and headquarters abroad. Especially during the processes
involving new parts development, the engineers of the domestic AMMs and engineers of
the abovementioned companies work together as a mixed team under the scope of the co-
design and co-development activities. Therefore, various global-scale partnerships and
collaborations among the companies emerge and pre-competition collaboration projects
and/or joint projects are executed200
.
4- Overseas direct suppliers: The parts and systems, new products, technologies,
manufacturing methods and know-how that cannot be procured domestically are provided
199
Such as Toyota Production System (TPS). 200
There exist agreements on engines, concluded both currently and in the past among global AMMs (such as
ISUZU, GM, TOYOTA, NISSAN, MAZDA, RENAULT, AUDI, VW, BMW and OPEL). The last of them is the
mutual collaboration agreement on the electrical vehicle systems and diesel engines, concluded between
TOYOTA and BMW in the end of the year 2011. That's why same engines, same safety systems, etc. are seen in
different global brands. Similarly, many car manufacturers could use the brake, air-conditioning, airbag, etc.
systems produced by the same global-mega suppliers.

330
from these companies. During the procurement process, several collaboration, co-design
and co-development activities are executed and strategic collaborations are established
also with those companies.
5- Domestic direct suppliers: Co-design and co-development activities are realized in the
framework of the joint projects, concerning developing critical sub-components and/or
new products, with the local- or foreign-capital direct suppliers operating at home.
6- Companies from whom expertise support is obtained on certain topics: This includes
obtaining consultancy services, training and various assistances from the companies
specializing in specific engineering topics such as problems encountered during product
development and production, new technologies, software, design, R&D etc., and also
bringing in the specialists of those companies to Turkey for a certain period, when
required. It has been discovered that such activities play a very important role in KTTs.
7- Test centers located abroad: There are certain tests that are employed intensively by the
AMMs in their activities such as production, production processes, R&D, etc. and that
involve advanced technologies; for example, performance tests, durability tests, tests
evaluating the conformance with the regulations, etc. The engineers of the AMMs make
visits to the special test centers and laboratories located abroad for testing the parts and
work together with the foreign specialists-engineers at those centers. As a consequence of
such mutual relationships, know-how exchange occurs and knowledge of the local
engineers is enhanced.
8- Universities: The AMMs realize various (joint) projects with the universities in
Turkey201
, in the fields such as new product development; improving existing products;
developing production process; test methods, etc., under the scope of the TUBITAK,
TEYDEB, SANTEZ, R&D incentives. In addition, some other collaboration in academic
sense, involving recruitment of the students from the engineering departments of those
universities in a certain period at the plants as project students; consultancy provided by
the academic personnel of the university for the AMM concerned on the projects
requiring specialty, etc. are seen. Although such collaboration activities between
universities and industry are not so intensive, they nevertheless ensure mutual KTTs.
9- Overseas authorized dealers and services: Especially in the importing countries, the
dealers and services play a very important role in terms of proper commercialization, sale,
marketing, publicity and promotion activities of the vehicles manufactured, and they
constitute the contact points of the AMMs who are in touch in that country. At the same
time, the knowledge and experience of such dealers and services prove beneficial for the
201
The universities from which such collaborations are provided are basically ITU, METU, Uludag and
Marmara.

331
AMMs in terms of providing guidance in certain issues such as vehicle design, marketing,
sales and post-sales services, etc.
In sum, it could be said that the AMMs obtain KTT from partners mentioned above, first of
all the MNCs or global mega suppliers (Bosch, Autoliv, Magna, Delphi etc.) via developing
joint projects, and enhance their know-how at home and thus develop high value-added new
products involving advanced technology. As we pointed out before, the most important
partner in terms of KTT is the MNCs as foreign partner. KTTs from the partner MNCs to
domestic AMMs take place due to the strategic collaborations in many subject fields such as
products, production processes, supervision, investment, quality, testing, training, etc. The
transfers are realized via certain channels such as collaboration activities and joint projects
with the MNCs; implementation of the MNC's production, management and quality systems
at the domestic plants; auditing, supervision and assessment activities of the MNC; training
activities; and various assistances. We will review those channels in detail below.
7.4. Channels of KTTs from MNCs to AMMs operating in
Turkey at Intra-Firm Level
In this section, we will try to point out the channels of the KTTs from the MNCs to the
AMMs in Turkey at intra-firm level and the factors playing important role in these transfers.
7.4.1. Via Collaboration Activities with MNCs
It is observed that since the know-how and technologies of the partner MNCs are at a higher
level, issues such as major investments, designs, parts manufacturing, R&D activities etc. in
Turkey are realized in collaboration with the MNC via joint projects. Although the systems,
strategies, principles and planning are same under the roof of the MNC as the foreign
partner, every plant exhibits conditions and circumstances specific to it, and a system being
implemented at a plant of the foreign partner MNC cannot be implemented successfully on
an identical basis at another plant of the MNC, located in somewhere else in the world.
Therefore, despite the fact that the AMMs with foreign ownership structure on a joint-
venture basis obtain intensive support from the MNCs as their foreign partners during their
332
joint projects202
, it is their own local engineers who are supposed, and required, to ensure
adaptation of those projects into the domestic plants, their operation and their continuity,
provided that the principles of the MNC systems are adhered to. Such projects that are
executed in collaboration with the MNCs ensure KTTs in terms of R&D, production and
production processes, and management structure, playing a role in enhancing the skills of the
local engineers and at the same time providing accumulation of important know-how and
knowledge at home. One example of high significance among others which could be given in
this respect is the collaboration made with the MNC as the foreign partner during the
foundation process of one of the AMM’s plant in Turkey. Since the plant to be established in
Turkey will be the first and sole bus-manufacturing plant of the MNC in the world, the MNC
has no cut-and-dried system which is ready to be used specifically for the buses. Therefore,
during the foundation process of the plant, the local engineers have worked very closely with
the MNC’s engineers/specialists when establishing the production processes of the plant and
developing solutions to the problems arisen, playing thus a highly important role. This led to
the local engineers' obtaining knowledge and know-how, enhancing their technological skills
via KTTs from the MNC. In fact, it is expected that, during planning phase to establish a bus
manufacturing plant in another country, the MNC will benefit from the knowledge of the
local engineers participating in this project in Turkey.
In sum, it is noticed that the AMMs are in close collaboration with the partner MNCs in
almost all kinds of activities, the said collaboration being more intensive in the joint project
activities. Within the framework of the collaboration, various assistances such as required
raw materials, software, hardware, know-how, tools and equipment, engineering, financial
support, test facilities and consultancy services could be provided by the MNCs in formal or
informal ways. In other words, since they are a part of the MNCs concerned, the AMMs
benefit from the advantages of being included in the global production network of the MNCs
to the utmost degree.
7.4.2. Via Production, Management and Quality Systems of MNCs
It has been determined based on the interviews that the AMMs that are fully owned by
foreigners and that are in the form of joint-venture capital partnership take the various
production, quality and supervision systems called "World Class Manufacturing" (WCM)
202
Activities such as establishing the production lines and production processes of the plant, developing new
products, designing new models, R&D activities, improving the existing products, etc.
333
developed by the MNC as basis and use them for their business management, production,
production processes, management and quality systems203
. These are self-proven systems
involving advanced know-how and technology, that have been established based on the
MNC’s business culture and systems, created in the light of the experience, knowledge and
developments gained and obtained over long years, and they are implemented at all plants of
the MNC worldwide. It is targeted via these systems that the companies will develop
themselves continuously on the topics such as high quality, efficiency, supply and safety,
that they will reduce costs and increase the performance and that they will achieve the
highest quality in the production204
. To be brief, such systems aim at performing the works
faster, smoothly, and with quality, at less cost and utilizing less workforce. These systems
are implemented across all the departments of the company, being subjected to a continuous
supervision and improvement. Continuous and successful implementation of the systems
involves all the employees, from the top level of management to the workers working at the
assembly lines. It has been determined that highly intensive and significant support is
provided by the MNC for the implementation of these systems successfully at the domestic
plants. The most important and effective support in this respect is to assign the AMM's
personnel at the MNC's headquarters for a certain period (3 months, 6 months or 1 year) so
that they observe the operation of the system in situ and receive training, and/or to assign the
specialists from the MNC's headquarters a duty at the plant in Turkey for a certain period by
the MNC. Furthermore, training and seminars are delivered to the AMM's personnel by the
MNC's specialists at certain intervals, and continuous benchmarking is applied between the
MNC and the AMM, and the system is continuously supervised, improved and updated via
the knowledge exchange between the local and foreign personnel. For instance, whenever a
“best practice” which improves a system takes place at any plant of the MNC, this method is
immediately shared with other plants around the world and the system is updated
accordingly.
It has been discovered that, in the framework of the abovementioned activities, intensive
know-how, KTTs from the MNCs to the local engineers of the AMMs take place, enhancing
the knowledge of the local engineers.
203
Such as Toyota Production System (TPS) of TOYOTA also known as KAIZEN, Manufacturing Management
System (IMM) of ISUZU, Total Quality Management, and Lean Management Systems. 204
All vehicles will be at the required quality standards; efficiency will be at the highest level; works that do not
generate any added value will be removed; it will be ensured that no loss occur in the production; the parts supply
methods (JIT) and the safety of the workers and works will be at the highest level achievable; and problems and
occupational accidents will be at minimal levels. The main philosophy could be summarized as “manufacturing
the best vehicle in the shortest time, at minimum cost, and in compliance with the quality standards set forth”.

334
7.4.3. Via Auditing, Assessment and Awarding Activities of MNCs
As we pointed out in the previous section, the AMMs with foreign-capital implement the
global production, management, quality and auditing systems of the partner MNCs at their
own plants. It is observed that each and every kind of activities of the AMMs are monitored,
audited, evaluated and approved by the partner MNC under the scope of such systems. In
other words, all the processes of the AMMs, such as the quality, production, monitoring and
auditing are intertwined with the partner MNC. For example, depending on the MNC's
production and quality systems, the AMMs have certain targets on daily, weekly and
monthly basis for the topics such as defect rate, quality, efficiency, delivery on time, number
of accidents, etc., and all the personnel of the company, from head to toe, work together to
achieve those targets that are continuously monitored by the MNC205
. In addition, the
organizations of the AMMs, such as production, assembly, purchasing, etc. for achieving
such targets, are regularly monitored and inspected by the MNC auditors. During the
inspections, it is requested that the plant in question successfully pass the checklist based on
the MNC's production and quality systems and achieve highest levels thereof. If it is
discovered as a result of the inspections that there are some incomplete aspects or problems,
or the company fails to achieve the targets, improvement and development supports are
provided by the MNC for solution of the problems.
Moreover, there are manufacturing assessment activities conducted by MNCs across their
own plants worldwide, within the framework of the "WCM" system. The MNC evaluates
their world-wide plants based on the activities and the most successful plant is financially or
morally rewarded (plaques, certificates, letter of commendation etc.) by the MNC. It has
been determined, according to the information obtained from the interviews, that some of the
AMMs in Turkey have surpassed the other plants of the MNC all around the world and
awarded silver and bronze medals that are highly valued. In addition, it has been discovered
that three of the AMMs in Turkey have won the silver award since they are the MNC plants
where the most modern and quality production is executed in the world other than those
MNC headquarters winning the gold award.
Due to the reasons explained above, the plants of the MNCs all around the world compete
among themselves every year for achieving the predetermined targets. All these monitoring,
auditing, assessment and awarding processes of the MNCs ensure that AMMs in Turkey (the
plants of MNCs at home) develop themselves continuously, by competing against the other
205
Monitored by means of indicators such as DPM (delivery per million), PPM (parts per million), etc.

335
plants of the MNC on the global scale. In conclusion, it has been determined that KTTs are
provided to the AMMs and local engineers by means of mutual collaboration with the
specialists of MNC in implementing, improving and developing all those systems.
7.4.4. Via Training and Education Activities of MNCs
It is observed that the AMMs have fairly considerable opportunities to provide training, and
that they attach great importance to continuous training and improvement of the technical
capabilities of all their employees, first of all their R&D personnel and engineers206
. In this
context, they subject their personnel continuously to in-house training and follow up their
status in this respect by using various indicators to measure their individual proficiency. For
instance, every engineer in the AMMs with foreign-capital have a scale which is established
according to the MNC systems and composed of specific topics, and their proficiency are
monitored continuously based on the scale. According to the evaluations made together with
the foreign partner MNC, it is checked that certain targets have been achieved by reviewing
the scales, and personal development plans are devised accordingly.
Another significant finding is that the proficiency of the R&D personnel in the area of design
is considered as an important learning process. It has been determined that for this reason,
the more projects the a member of the R&D personnel is assigned at, the more his/her
proficiency in the area of “design” is considered to have enhanced and increased and the
more he/she gains knowledge and experience in such area. In parallel, as the R&D personnel
are assigned duties under the scope of the new projects, they obtain more knowledge by
communicating with the MNC, they develop themselves more, and they gain more
experience. It has also been determined that the AMMs apply various reward systems based
on material and moral incentives to encourage the training of their personnel.
The findings concerning main training activities that are performed by the AMMs and that
play a role in making the personnel specialize in a certain field and in enhancing their know-
how and technical capability are as follows:
206
It is determined that in the AMMs that have a R&D center within the framework of the R&D Law No. 5746,
the cost of such training activities are met from the R&D centre’s own budget, or included in the projects realized
at such centre. It is also expressed by the AMMs that one of the requirements to be met by the R&D centres is
continuous training and self-development.

336
Under the scope of a new vehicle or a new product development project, local
engineers’ visiting the MNC headquarters and assuming duties in such projects
staying abroad for a certain period (1 month to 1.5 years), during the design and
product development phase,
Making visits periodically to the headquarters of the MNCs and/or global suppliers
from whom parts are procured such as Germany, Japan, France, Italy, USA, etc. and
R&D personnel's working together with the foreign engineers for a certain period
during the testing phase of the parts,
R&D personnel’s visiting the test centers located abroad, for testing of some major
parts manufactured locally, and their working together with foreign engineers for a
certain period in these centers207
,
Teams’ visits to the MNC headquarters for the training on the new systems,
developments, and applications, periodically every few months, and their staying at
the headquarters for a certain period (2-3 weeks or a couple of months), depending on
the nature of the training,
Regular visits of the foreign engineers/specialists from the MNC headquarters to
Turkey, for training, supervision, consultancy and discussion purposes and to follow
up the processes,
Delivering online training and testing via the MNC to the personnel of the AMM, at
certain intervals, and by means of advanced communication tools. The points scored
as a result of these training activities are entered in the score cards of the personnel
and monitored. If the required criteria cannot be met when the results of the training
are evaluated, new training development and advancement activities are drawn up
accordingly. In other words, it is observed that there exists an ongoing communication
with the MNC,
It is understood that close relationships with the suppliers enable also the AMM's
personnel to obtain knowledge from the suppliers, which in turn contributes to their
self-development. For example, during the design phase of a product to be
manufactured by the suppliers, the AMM’s engineers are assigned duties at the
production facilities of the suppliers and gain an insight on-the-job into how the
product is manufactured, and therefore make better design feasible for production,
There are various training centers available for the blue- and white-collar personnel,
and miscellaneous courses for the production and management skills, seminars and
software training, etc. are delivered within the structure of these centers. In addition,
207
For example wind tunnel, durability, crash, exhaust-emission, aerodynamics and road tests.

337
the newly recruited personnel are provided with on-the-job training, being subjected to
the orientation training for a certain period at these centers,
Receiving education on several topics as required from domestic universities,
Participation of the managers, technicians, engineers and R&D personnel in various
training, conferences, expositions and courses at home and abroad, within their R&D
budgets,
Providing incentives for self-development of the personnel, encouraging them to take
post-graduate and doctoral degrees in the relevant fields of engineering. It is observed
that scholarships are granted under this scope, and that the personnel are allowed to
utilize the R&D facilities of the company for the projects they will prepare for their
post-graduate or doctoral degrees. Also, it has been determined that the personnel is
rewarded financially when they make an academic presentation, participate in
conferences, and publish a paper.
In consequence, all these training and education activities enhance further the KTTs from the
MNCs and other resources; and develop the local personnel's experience, practice, skills,
know-how and knowledge. Moreover, it has been determined that the increased skill level of
the personnel raises the absorptive capacities of the AMMs as well, facilitating absorption of
such transfers.
7.5. General Characteristics of the Direct Suppliers of the
AMMs Interviewed
In this section, we analyze the relationship of the AMMs with their direct suppliers in
Turkey, and their general characteristics. Also we analyze and evaluate the
channels/determinants of the KTTs at inter-firm level realized by the AMMs to their direct
suppliers through backward linkages.
7.5.1. General Information about the Direct Suppliers
It has been determined based on the analyses of the interviews that, in general, the AMMs
set and establish the design, basic systems, quality criteria and design of the production lines
of the vehicles they manufacture, and procure all other systems and sub-components

338
composing the vehicle from the domestic or overseas direct suppliers and then assemble
them. In this context, the AMMs inform their suppliers of the blank size208
of the parts
requested according to the design, their current regulations and the “sine qua non”
requirements, and tell them “you will set the design of the parts and deliver your suggestions,
illustrations and drawings to us by the predetermined date”. In turn, the suppliers make their
own design related to parts in accordance with the requirements such as size, quality, and test
values that are notified to and requested from them, and present their designs to the AMMs.
All the processes within this stage can be realized in the computer environment by
employing design software209
. Once the design of the requested product or part is approved
by the AMM in Turkey after certain processes, serial production is launched. In this context,
detailed design, design verification, development, prototype, quality tests, durability tests,
etc. concerning the parts as well as their production are carried out by the suppliers and the
final product is delivered to the AMM. It has been determined that, due to such close
collaboration between the AMMs and their suppliers, the direct suppliers are considered as a
part of the AMMs, life-time collaboration and working are targeted with them by the AMMs.
In other words, there exist a cooperation between the suppliers and the AMMs based on
mutual trust, and the direct suppliers are considered as strategic partners and a vital part of
the production chain. In consequence, average time of work with some suppliers could be
quite long, even going back to 20-30 years.
7.5.2. Number and Origin of the Direct Suppliers of AMMs
Table 7.1 shows the number of the domestic and overseas direct suppliers of the AMMs
based on their foreign-ownership structure according to the information obtained from the
top-executives interviewed.
According to the Table:
The total number of the direct suppliers of the AMMs ranges between minimum 150
and maximum 700; on average 338.
Among the total direct suppliers, the number of the domestic direct suppliers ranges
between 83 and 345 while the number of the overseas direct suppliers ranges between
208
The limit dimensions of the part which it should have with respect the whole vehicle design. 209
It has been determined that making the design, assembly and crash tests of a vehicle completely has become
possible in a computer environment, thanks to the software such as CATIA, ROBCAD, CAD, CAM, CAE, etc.
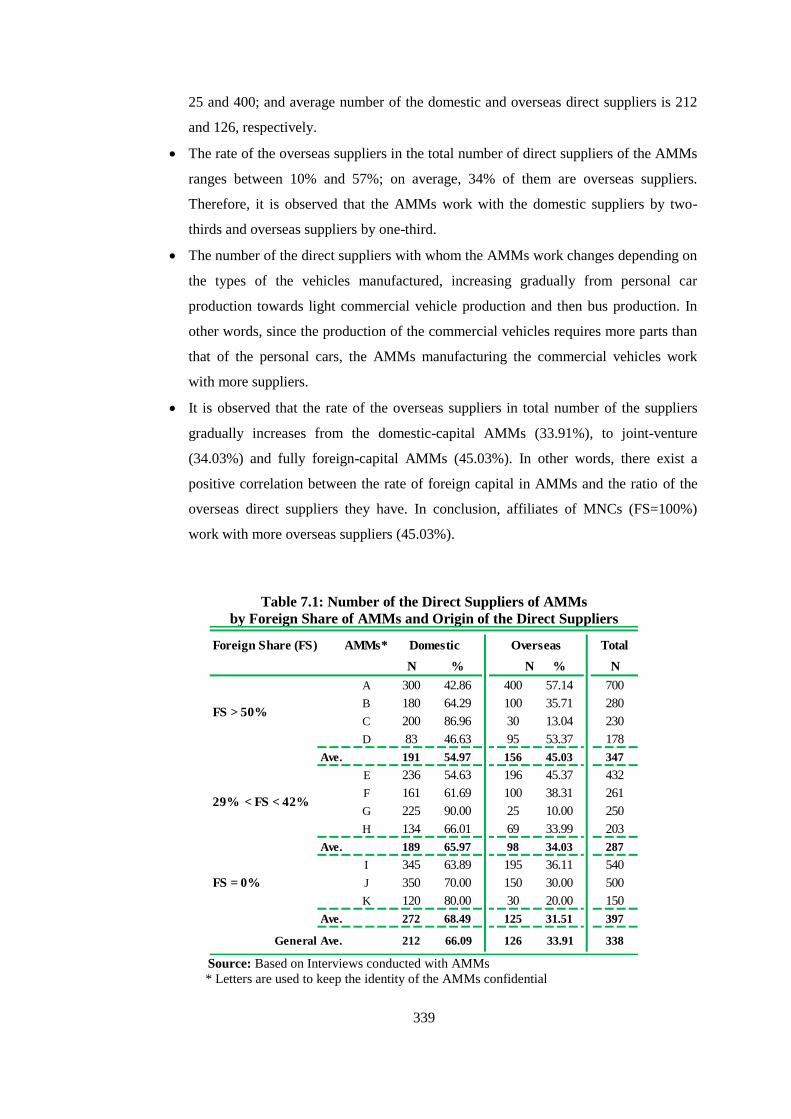
339
25 and 400; and average number of the domestic and overseas direct suppliers is 212
and 126, respectively.
The rate of the overseas suppliers in the total number of direct suppliers of the AMMs
ranges between 10% and 57%; on average, 34% of them are overseas suppliers.
Therefore, it is observed that the AMMs work with the domestic suppliers by two-
thirds and overseas suppliers by one-third.
The number of the direct suppliers with whom the AMMs work changes depending on
the types of the vehicles manufactured, increasing gradually from personal car
production towards light commercial vehicle production and then bus production. In
other words, since the production of the commercial vehicles requires more parts than
that of the personal cars, the AMMs manufacturing the commercial vehicles work
with more suppliers.
It is observed that the rate of the overseas suppliers in total number of the suppliers
gradually increases from the domestic-capital AMMs (33.91%), to joint-venture
(34.03%) and fully foreign-capital AMMs (45.03%). In other words, there exist a
positive correlation between the rate of foreign capital in AMMs and the ratio of the
overseas direct suppliers they have. In conclusion, affiliates of MNCs (FS=100%)
work with more overseas suppliers (45.03%).
Table 7.1: Number of the Direct Suppliers of AMMs
by Foreign Share of AMMs and Origin of the Direct Suppliers
Source: Based on Interviews conducted with AMMs
* Letters are used to keep the identity of the AMMs confidential
AMMs* Total
N % N % N
A 300 42.86 400 57.14 700
B 180 64.29 100 35.71 280
C 200 86.96 30 13.04 230
D 83 46.63 95 53.37 178
Ave. 191 54.97 156 45.03 347
E 236 54.63 196 45.37 432
F 161 61.69 100 38.31 261
G 225 90.00 25 10.00 250
H 134 66.01 69 33.99 203
Ave. 189 65.97 98 34.03 287
I 345 63.89 195 36.11 540
J 350 70.00 150 30.00 500
K 120 80.00 30 20.00 150
Ave. 272 68.49 125 31.51 397
General Ave.
Foreign Share (FS)
33833.9112666.09212
FS > 50%
29% < FS < 42%
FS = 0%
Domestic Overseas

340
According to the information obtained, the most important ones among the overseas direct
suppliers are global-mega suppliers who fall within category A, the highest level in the
manufacturing classes. The parts procured from these class-A suppliers could directly be sent
to the production line and mounted onto the vehicle, without performing any quality control.
The parts procured from these suppliers and other overseas suppliers are in general the most
important parts of the vehicle, called “system parts”, such as engines, gearboxes, brake
systems, electronic assemblies and safety equipment210
. These are mostly the electronic parts
which use know-how and technology extensively. Therefore, the rate of the foreign direct
inputs in the value of the total inputs used in manufacturing of a vehicle elevates up to 40%-
50% (see section 7.2.4). However, the rate of the imported inputs used in manufacturing of a
vehicle rises given the fact that the domestic direct suppliers procure some part of their
inputs from abroad. Moreover, it has been determined that on average 80% of the total input
costs of the AMMs is paid to the domestic and overseas direct suppliers who are 100 or
fewer in number.
Lastly, it has been determined that 80% of the domestic direct suppliers given in Table 7.1
are situated in provinces Istanbul, Kocaeli, Bursa and Izmir. The findings in this section
explain why the sample for the supply industry firms surveyed as mentioned in Chapter 4 has
been chosen in such four provinces, and indicate once more the success of the data on the
132 ea. direct supplier firms obtained from the survey.
7.5.3. Capabilities of the Direct Suppliers
Turkish automotive supply industry now witnesses the third generation, and there are
enormous differences in various aspects between the supply industry of 40 years before and
the current one. It has been determined that, today, the Turkish supply industry has become
relatively institutionalized, with its current structure of developed technology, knowledge
and experience, having been globalized and thus become capable of exporting 50% of their
products, having established its R&D and know-how systems, and possessing advanced
engineering services211
. Moreover, it has become an industry which possess skilled and
trained workforce and which is capable of manufacturing high-quality products and
delivering them on time, which has a competitive power in the international arena and a
210
Such parts are called system parts while the companies who manufacture and provide them to the AMMs are
called system suppliers. System suppliers also assume the whole responsibility (warranty, etc.) for the product,
following the sale of that product. 211
It has been pointed out that the Turkish supply industry is a robust sector in terms of parts production,
especially in sheet metal parts manufacturing and plastic injection activities.

341
capability to participate in the international expositions and fairs continuously. For these
reasons, the existence of a quite robust supply industry in Turkey is considered by the
AMMs as one of the most important advantages of Turkey in automotive industry. The
following statement expressed by a top-level manager during the interview summarized the
case best:
"The supply industry and the main industry go, develop and advance further hand
in hand; if there is no main industry, there would be no supply industry either,
and in a country whose supply industry is weak, automotive industry would not
and could not develop, or even exist at all".
When we look at the domestic direct suppliers from the viewpoint of the AMMs, we see that
they are highly skillful, carrying out quality and high-technology manufacturing with
requested characteristics and at competitive prices and delivering the products just in time
(JIT). In addition, they conduct R&D activities and collaborate with the AMMs in co-design
and co-development activities. The abovementioned situation coincides with the findings
stated in sections 5.4 and 5.7. Moreover, it has been determined that the domestic direct
suppliers who are successful in the sector establish joint-venture partnerships with the global
mega-suppliers and foreign companies, and participate in various joint projects with other
suppliers and AMMs both at home and abroad, for production, etc. purposes.
Another significant finding obtained from the interviews, which verify the findings in
chapter 5, is that the domestic direct suppliers of a foreign-capital structure are more capable
than the ones with local capital, that they have higher absorptive capacity and higher-quality
workforce, that they engage more in the R&D activities, that they have higher potential to
export, and that they perform knowledge and technology-intensive production. Furthermore,
the suppliers falling in this category at home are able to produce complete systems instead of
just parts, to conduct type approvals and type tests of the parts, and to sell them to the MNCs
under the scope of turn-key projects212
. It has been determined that some direct suppliers in
Turkey actually have reached a structure greater than those of some AMMs in terms of their
turnover.
212
Some domestic direct supplier firms with foreign capital could concurrently produce parts for the MNCs
abroad (global AMMs) such as BMW, MERCEDES, RENAULT, JAGUAR and FORD.

342
7.5.4. Expectations from the Direct Suppliers
As we pointed out before, the direct suppliers are considered a major link in the production
chain and therefore establishing a long-term strategic relationship with the suppliers based
on mutual trust becomes essential. The most important anticipation and target of the AMMs
in this respect is to develop long-term collaborations with their suppliers, and their
expectations from the suppliers could be summarized in general as delivery of the requested
product with the highest quality, at the lowest or target price and just in time. Given the fact
that a vehicle manufactured is composed of thousands of parts, it could be assumed that the
main philosophy adopted by the AMMs - especially on the suppliers of the critical parts - is
that each supplier should specialize in the part he produces, that he should produce the part at
the highest quality as per the international criteria, and at the lowest cost and deliver it just in
time. The suppliers are expected to have specific and general certifications in their product
range concerned; to have competitive power; and to have design, R&D, technical,
engineering and manufacturing capabilities. That being said, and for the reasons stated
above, the suppliers are required to conduct activities aiming at continuous quality
improvement; to ensure flexibility in manufacturing; to develop their technological and
engineering capabilities continuously; to watch their rivals and new technologies closely; to
enhance their design skills; to carry out R&D activities and to have a strong financial
structure.
7.5.5. Supplier Selection Criteria of the AMMs
It has been discovered that it is extremely difficult for a new supplier to be included in the
supply chain of the AMMs as direct supplier and/or to come and take place in the market
entirely from scratch. The main reasons are the fact that the AMMs have been working with
their existing direct suppliers included in their supply chains for long years, that those
suppliers, being highly capable, quality and trustworthy, have proven themselves in terms of
production consistency; and that they could manufacture continuously at the competitive
prices in terms of costs. It is observed that not only being included in the supply chain of the
AMMs, but also remaining there, is extremely difficult. Therefore it's imperative for the
suppliers to develop themselves continuously, to diminish their costs, to compete, and to
produce quality products.

343
Being able to become a direct supplier of the AMMs depend on the applications and efforts
made by the suppliers, rather than the AMMs' searching for a supplier (this case coincides
with the findings stated in section 5.7.1). The AMMs always prefer to work with the supplier
firms in their existing supplier pools primarily. Although observed seldom, searching for a
new direct supplier occurs only when it becomes necessary to do so for developing a new
vehicle/part; when it becomes unavoidable (bankruptcy of the existing supplier, his parting
ways with the company of his own accord, discontinuing the supplied part concerned, etc.);
and/or when an existing supplier is excluded from the pool of the direct suppliers by the
AMM213
. The AMMs have stated that, in such cases, they search for the domestic and
overseas supply industry companies in the product range concerned, via sourcing, and be
able to find a supplier.
It is also determined that the MNCs who have made investments and taken production
decisions in Turkey choose the suitable domestic suppliers among the direct suppliers of the
other AMMs that are currently operating in Turkey. As it will be pointed out in detail in
section 7.5.6, some of the overseas direct suppliers of MNCs has also come and invest in
Turkey together with MNCs in order to supply goods to these companies.
Becoming a direct supplier of an AMM is extremely hard and challenging process. The
criteria for becoming a direct supplier of the AMMs changes from one AMM to the other in
general, and every AMM has their own selection criteria and policy in this respect. The
direct supplier selection processes of the AMMs could be summarized as follows:
Candidate firms make a direct application via the standard forms, based on the
preliminary evaluation criteria and procedures of the AMMs,
After the application process, the candidate firm is, on paper, subjected to the
preliminary evaluation called "Initial Assessment" by the relevant departments214
.
During the initial assessment, the characteristics of the candidate firm, such as
organizational structure, financial structure, technological capabilities and specific
213
It is observed from the interviews that in cases where a supplier constantly falls behind in terms of quality, or
fails to deliver the parts in a timely manner, or fails to achieve the defined targets in terms of costs, or fails to
reach the levels requested and/or scores extremely low points during the inspections, or experiences commercial
and financial problems, or fails to meet the requirements concerning the product and production process, the
AMM warns the supplier severely and grant him a certain period of time to correct his failures and finally parts
ways with the direct supplier firm if the problems will not be resolved within the given period of time despite all
the warning. All these findings overlap with the findings in section 5.7.3. 214
Departments such as purchasing, supplier relations, quality, engineering, supplier development, etc.

344
certificates (e.g. Ford Q1), as well as the AMMs of whom he is the supplier215
and his
other references are reviewed in detail and marked by the relevant departments of the
AMM216
.
The candidate firm successfully passing the initial assessment is subjected to detailed
practical inspection and auditing in terms of technical and technological capability,
such as manufacturing ability; production process; quality; cost; delivery;
occupational safety; productivity systems; etc., by the AMM's specialists paying visits
at certain periods. During these inspections, how the production processes of the
candidate firm work; the quality and the work site is reviewed and whether the firm
has its own inspection and control mechanism is checked. The AMM should be
assured of the quality of the product the candidate firm will produce and the stability
and continuity of this quality; and convinced that the product will be delivered in time.
The processes could take some time, from 1 year to 5 years, depending on the product
range concerned and the candidate firm.
Another finding is that, in the MNC affiliates (FS=100%) in Turkey, the inspections of the
candidate firms are carried out by the MNC's own specialists located at home or abroad, and
that the final decision on accepting of the candidate firm into the pool of the suppliers lies
with the MNC headquarters. The “central purchasing” departments at these headquarters
engage in such activities. If the candidate firm is approved and included in the pool of the
suppliers, then all the global plants of the MNC could utilize from this firm.
As to the AMMs in the form of a joint-venture capital partnership, it has been determined
that the specialists of the AMMs located at home and/or MNC headquarters are assigned
duty in the selection processes, depending on the type of the part concerned, and that the
decision on accepting the candidate firm into the pool may be taken by the AMM located at
home, as well as by the MNC headquarters. While in the AMMs of a minority foreign
ownership capital structure, the MNC headquarters in general do not take part in the
selection process for the domestic direct suppliers, in the AMMs of a majority foreign
ownership structure, the MNC headquarters plays a role in the decision making process
concerning the supplier, if the part is to be used globally; or otherwise, the center located in
Turkey, if the part is to be used only for the Turkish market. In addition, the overseas direct
215
It appears highly difficult for a domestic supplier who currently does not work with any other AMM in
Turkey to become a new direct supplier of the AMM concerned. 216
The partnership structure; capital; turnover; R&D and design capabilities; quality and work systems; the
quality certificates he possesses (ISO9000, ISO14000, ISO/TS16949, etc.); human resources; the projects
performed before; etc.

345
suppliers of the AMMs with the joint-venture capital structure are determined by the MNC
headquarters abroad, and the parts procured from these suppliers are arrived officially over
the foreign partner MNC.
Purchasing specifications, legal contracts and confidentiality agreements concluded and
signed with the candidate firm who has approved to be included in the pool of the suppliers
after all these inspection processes, and serial production process begins afterwards. It has
been observed that if the candidate firm concerned is discovered to be poor and incompetent,
either the AMM parts ways with that candidate or - if the candidate is a critical firm - the
AMM's specialists determine the topics which need correction and improvement and that the
development plans on those topics are devised together with the specialists of the candidate
firm.
The main criteria sought for in becoming a direct Supplier could be summarized as follows,
according to the findings obtained:
Ability to take part in every stage of the parts’ development process and interoperate
with the AMM's production systems, since he will produce the parts developed by the
AMM,
Having quality, specialist, trained and qualified human capital,
Bearing high-technology capability in manufacturing,
Possessing co-design, co-development, R&D and engineering capabilities, depending
on the product ranges,
Delivering just in time and supplying defect-free products,
Being successful in the areas of quality, quality control, cost and management,
Having sophisticated and well-developed functions and proficiency in terms of
production processes, equipment pool, sub-suppliers, safety philosophy, production
and production support groups,
Having a financial structure that enables investments for future and self-development,
Adopting and implementing well the working criteria of the AMM,
Being open-minded, innovative and open to collaboration,
Allowing transparency and effective communication.

346
7.5.6. Location of the Direct Suppliers Based on the findings under this topic, it is observed that the AMMs prefer an intensive and
close communication with their suppliers at every stage of the collaboration between them,
and that they consider the “go and see” (genchi genbutsu)217
principle involving going and
observing any problem or issue on site as one of the most important working principles.
Furthermore, when a supplier is located closely to the AMM, it brings significant advantages
especially in terms of communication, delivery on time, storage, reacting quickly, detection
of the manufacturing problems on site, problem-solving, inspection and logistics costs. One
of the major reasons why the domestic suppliers are concentrated in the Marmara region
(Bursa, Istanbul and Kocaeli) where in general the AMMs operate is certainly these
advantages. Due to these advantages, some AMMs established considerably large "supplier
parks" next to their own plants and have assisted and allowed some of the suppliers to
establish their own production facilities in these parks218
. In addition, since it is more
advantageous both in terms of cost and time, the products are procured by the AMMs by
means of the “milk-run system”219
from the suppliers who are located closely to them.
Furthermore, some of the suppliers and global-mega suppliers located abroad has come and
invest in Turkey to supply goods to the AMMs operating in Turkey due to these advantages.
Preferring Turkey as a regional production base by the MNCs has also played a major role in
this process. In other words, the fact that MNCs have make investments in Turkey has
enforced the overseas direct suppliers of the MNCs to also invest in Turkey220
.
Although geographical closeness of the suppliers to the AMM bears the advantages
mentioned above, it is not considered the most important criterion by the AMMs in selecting
the suppliers. The product quality of the supplier; his production systems; cost structure;
R&D activities; co-design skills; ability to design; know-how structure; technological
capabilities; workforce quality; and organizational and financial structure play a more
significant and important role in the selection criteria than the location. In sum, it appears
that under the competition conditions of the global economy, the AMMs do not actually care
so much about in what part of the world and where a supplier perform the production, if the
217
It is an important working principle of the Toyota Production System and means “go and see”. 218
When selecting the supplier firms who will manufacture in these parks, what is considered and taken into
account is that the parts to be supplied are of a fairly large size and that the logistics cost increases in case of an
emergency. 219
In this system, the transport of the parts to be supplied is assumed by the AMMs due to the advantages in
terms of cost, time and procurement. An 18-wheeler belonging to the AMM visits the suppliers in turn every day
and carries 1- or 2-day stocks to the AMM. 220
Some of the AMMs have stated that they themselves had brought their overseas suppliers in Turkey.

347
supplier produces more quality, more comfortable, technological and less expensive parts
and deliver these just in time.
7.6. Channels of KTTs from AMMs to Direct Suppliers in
Turkey at Inter-Firm Level
In this section, we will try to point out the channels of the KTTs from the AMMs to the
domestic direct suppliers and the factors playing role in these transfers.
7.6.1. Role of the being the Sole Supplier of AMMs
It has been determined that being the sole supplier of the AMM in a certain product range
plays a highly significant role in the KTTs. It has been observed that the AMMs work mainly
with a single supplier in the procurement of the critical parts and systems, while the number
of the suppliers per item purchased increases going down the sub-systems and more simple
parts. The AMMs conduct many activities such as product development, co-design, R&D,
quality, tests, etc. together with the firms who are their sole supplier, and provide them with
every support on such issues.
Among the most important reasons for working with only one supplier per item purchased
are the lack of alternative suppliers in some products; buyer-supplier trust; scale economies;
long-term strategic relationships with the suppliers; considering the supplier as the strategic
partner of the AMM; and high investment and technological capability required by some
parts. That is to say, the AMMs prefer to work with only one supplier for the majority of the
parts they procure while they prefer to work with more than one supplier for only some of
the parts (some off-the-shelf products such as tires, ceiling lights, etc.). Risk distribution in
terms of procurement, production and cost, poor capacity, weak financial structure, raw
material procurement problems and technological inabilities of the suppliers have been
indicated by the AMMs among the most important reasons for working with more than one
supplier per item purchased. On the other hand, it has been discovered that the direct supplier
firms may be the supplier of more than one AMM, and that they may be the supplier of only
one AMM for a certain product range while they may work with more than one AMM for
some product ranges. In other words, the direct supplier firms could be the sole supplier of
more than one AMM. Also, the findings obtained in this respect coincide with the findings in
section 5.7.3.

348
7.6.2. Via Joint Projects
Intensive collaboration takes place between the AMMs and their domestic direct suppliers
through the joint projects, in the activities concerning developing a new product or
improving an existing product; increasing the quality; developing the production and
occupational safety processes, etc. Within the framework of such collaboration, meetings
and discussions are held between the personnel of the both companies continuously, and the
suppliers are visited by the AMM's specialists. Likewise, the personnel of the supplier are
allowed to visit the AMM and observe the line of production and use the laboratories and
test benches of the AMM. The specialists of the companies perform the trial runs and tests of
the product together, and determine the shortcomings and positive aspects. In consequence
of these activities, mutual knowledge exchanges occur between the parties and the suppliers
enhance their own know-how and R&D levels in line with the feedback they get, and they
attain a better position and apply the lessons they have learned in every project to other
AMMs during the next project, thereby developing themselves continuously. In summary, as
the supplier firm' specialists conduct joint projects with the AMMs, they get the opportunity
to develop themselves and gain knowledge. These findings verify the KTTs related to
product, via the joint projects on the product, as mentioned with reference to the surveyed
firms in section 5.2.2.
7.6.3. Via Co-Design Activities
It has been observed that other than engines and powertrains, the AMMs produce many
systems and/or sub-parts that are critical and that require know-how together with the co-
designer suppliers (this coincides also with our findings in section 5.4.6). The AMMs work
together with the supplier firms in co-design activities such as parts design, design
verification, development, tests, etc., and the cost, profit margin and sales price of the parts
to be manufactured is determined together with the supplier firm221
. Such activities enable at
the same time the production of a new vehicle to be realized in a shorter period. Due to the
reasons stated above, the co-designer suppliers are considered as strategic partners by the
AMMs, and long-term business relationships are established with those suppliers.
221
It has been determined that once the AMMs have R&D department, their co-design activities with suppliers
increase.

349
It has been determined that the rate of the domestic direct suppliers with whom the AMMs
conduct co-design activities in the total number of suppliers is 20%-30%. Among the most
noticeable common characteristics of these supplier firms are that they possess advanced
engineering skills; that they have a R&D department; that they perform high-technology
production; that they have quality human capital; and that most of them has of foreign-
capital structure. In addition, the suppliers with whom co-design activities are carried out are
in general the sole supplier of the AMMs for the product range concerned. Since ultimately it
is the AMM who will be the final user of those parts, the AMMs share all kinds of
knowledge and technology with their co-designer suppliers, in the areas such as production
of the parts, their design, their development, establishment of the production lines, and
production processes. In this respect, it is observed that the AMMs;
could bring together the MNC headquarters, global-mega suppliers, other foreign
companies and co-designer suppliers they collaborate during the development process
of a new vehicle,
could deliver on-the-job and/or off-the-job training/seminars/courses to the personnel
of the suppliers by means of their own specialists and could assign their own engineers
in a certain period at the supplier's plants for support purposes,
could obtain technical support and know-how from the MNC headquarters for the
supplier, and could provide every assistance on various issues such as procurement of
the raw materials, equipment and tools and to obtain the required technologies from
abroad, etc.,
could provide their suppliers with advance payments for the projects and financial
assistances for high investment costs222
.
The AMMs do not specialize in the production of the low-tech parts in sub-system levels
(such as seats, door parts, signal arms, mirrors, air-conditioners, internal trim materials, etc.);
and specializing in such parts is not deemed a must, nor as a necessity, either. As to the
manufacturing of such parts, the AMMs inform their suppliers of the quantity, blank size,
and quality standards required as well as their project and cost targets, and are not further
involved in the details such as the design, test and development of those parts. They leave all
those issues to the supplier's discretion, and request the timely delivery and assembly of
those parts in the framework of turnkey contracts so that the parts are delivered to production
line whenever required. The AMMs’ collaboration with and assistance to their suppliers in
222
The AMMs could provide the suppliers with various financial assistances in case that the equipment pool of
the part to be manufactured requires high amounts of investment or in case that the die cast of the part to be
manufactured is costly.

350
such activities remain less when compared to the co-design activities. Both the AMM and
the suppliers assume mutual responsibility for those parts.
In conclusion, the efforts made for the co-design activities constitute the most important leg
of the collaboration between the main and supply industry companies in Turkey. Such
activities, via KTTs from the AMMs, enhance the suppliers' capabilities in the fields of
design, quality, product development, R&D, engineering and technology, and increase their
know-how and absorptive capacity levels, making a highly positive contribution in their
performance.
7.6.4. Via Auditing, Assessment and Awarding Activities
One of the important channels through which the KTTs are realized between the AMMs and
the suppliers is auditing, assessment and awarding activities. Every AMM utilizes various
monitoring and auditing systems to follow closely their direct suppliers. It is observed that
these systems are basically same, although different for each AMM. The AMM’s own
specialists223
visit all the suppliers at certain intervals (every month, every 6 months or once
a year) and audit them during the production and collaboration activities224
. Audits are in
general divided into two sections:
Process audits: It covers head-to-toe checking how the parts manufactured by the supplier
firm are manufactured.
System audits: It is the inspection of the quality, production and management processes of
the suppliers. Here, a system similar to the “WCM” production systems (production, quality,
management and supervision systems) applied by the MNC headquarters to the AMMs in
Turkey is applied this time by the AMMs to the suppliers (see section 7.4.2). Success of such
systems, which have been generated by the MNCs with the experience and knowledge
accumulated over long years and which involve high level of know-how, in terms of their
application on the AMMs, depends on whether they are applied successfully also on the
direct suppliers included in the supply chain. The most important reason for this is the fact
that the AMMs are organically tied to their direct suppliers and that even the smallest
problem encountered by suppliers would naturally be reflected on the AMM's production
223
These specialists are called “supplier quality engineer” or “supplier technical assistant”. 224
The specialists are assigned duties at the departments such as purchasing, quality, supplier development etc.

351
lines. Therefore, the suppliers are also monitored constantly by the AMMs in accordance
with those systems, and their performances in terms of production, quality, delivery, cost,
productivity and competitiveness is very closely inspected225
. The findings obtained in this
respect coincide also with the findings in section 5.7.2.
The auditing and assessment stages conducted by the AMMs could be summarized as
follows, based on the findings from the interviews:
Once approved as the direct supplier at the very beginning, the suppliers are given a score
between 0 and 100, depending on the results of the test and evaluation criteria of the
AMM, and are classified into the categories as B, C or D; A being the highest grade226
.
The suppliers are subjected to the assessment systems called “Manufacturing Side
Assessment” (MSA). According to this, the suppliers are constantly monitored and
subjected to assessments by the auditors227
of the AMM at certain intervals (every month
or every 6 months), based on the procedures determined by the audit programs of the
AMMs. The audits are performed under certain topics such as logistics, quality, prices,
delivery on time, production processes, etc. Following each audit, the suppliers are
graded once more over a scale of 100 points, based on the checklists prepared in
accordance with the topics.
The level of the supplier firm is re-assessed on the basis of the reports and
recommendations drawn up as a result of the evaluations. Afterwards, the firms may
upgrade to the next higher level, may be warned or excluded from the pool of the
suppliers, depending on their success in achieving the predetermined targets.
The target and mission of the supplier firms is to proceed to the next higher category (to
category C if it is currently in category D, or to B if it is currently in category C) in the short
run and to achieve and settle down in grade A in the long run. It is observed that the detailed
and constant audits of the AMMs continue until the suppliers reach grade A. The main goal
from the AMMs' point of view is that advancement of their suppliers in category C and D
essentially to category B in the short run and finally their becoming a grade-A supplier in the
225
Since it is a matter of serial production, the quality of the parts to be mounted onto the vehicles is not
inspected generally on the production line. Quality control exists at every stage of the production process but the
inspections and audits are performed from scratch. During such audits, the suppliers are monitored on weekly,
monthly and annual basis via the indicators such as timely delivery under the scope of DPM (delivery
performance management) and defect-free product procurement in PPM (parts per million). Less than 100 PPM
for the personal cars and less than 500 PPM for the buses is accepted as standard. 226
Such categorical classifications vary among the AMMs. 227
Auditors from the departments such as purchasing, quality, production, supplier relations, supplier
development etc.

352
long run. However, since the criteria for becoming a grade-A supplier are set quite high, it
seems rather improbable to realize that goal. The firms achieving the top level category,
namely grade A, are in general global-mega suppliers, foreign capital firms, large-scale and
institutionalized firms that perform manufacturing by utilizing superior technological
capabilities. The suppliers of grade A are also subjected to the high-quality assessments
constantly by the AMMs at certain periods, but their audits are realized at longer intervals.
The firms falling in this category A are considered as the trusted firms and their products are
transferred directly to the production line without conducting input quality control by the
AMM. In addition, it has been determined that, along with the practical audit and assessment
activities, the AMMs continuously test the suppliers' parts that are included in the production
line and ready for assembly at certain intervals by means of random selection method.
The suppliers are recommended to increase the quality of their production and/or to develop
their processes, based on the reports drawn up as a result of the audits. Some suppliers are
requested to improve their scores and the suppliers who display poor performance and who
have been discovered to have certain problems and/or deficiencies are warned and they are
given certain period of time for correction of them. Also, some suppliers are included in the
scope of improvement works by the special teams of the AMMs. The AMMs have stated
they prefer to be interested in and support more the suppliers who remain below a certain
level, who encounter problems, instead of the suppliers who are already in good status, due
to limited resources. The main reason for this preference is that the means and capabilities
allocated to such suppliers would ensure higher quality and increase in the productivity on
average, in terms of the return obtained. The improvement works performed with the direct
suppliers could be summarized as follows, based on the findings:
Generation of work plans and schedules by the teams established within the AMM,
together with the specialists of the suppliers, determining the topics which need to be
improved in the suppliers; and their assisting the suppliers in application of such plans,
Inviting the engineers of the suppliers to the AMM and delivering seminars, training
and support to them in line with the audit outputs,
The AMMs’ acting as an intermediate agent between the MNC headquarters and
suppliers to provide support from the MNC headquarters,
Performing KTTs concerning the quality, product, production processes and systems
of the AMM with a view to improving and developing the suppliers.

353
The AMMs employ various rewarding systems also for the purpose of making their suppliers
compete among themselves and raising their technology and productivity levels. To this end,
relevant departments228
of the AMMs review every year the data on certain indicators of the
suppliers such as delivery on time, quality, defect rate, cost, product development, project
management, etc. and then grade them229
. Suppliers who display an outstanding performance
according to these scoring criteria are awarded financially and morally as the “supplier of the
year” due to his success, through a ceremony230
. In addition, the suppliers determined by all
AMMs (15 ea.) are assessed again according to certain criteria by OSD, and the best three of
them are awarded as “the best supplier of the year” by OSD. It is observed that winning
such rewards play a vital role in developing new business relationships especially abroad in
the sector; becoming the direct supplier of other companies; to be known across the sector; to
be a reference; etc. and is considered highly important for the suppliers.
In sum, it has been determined that the AMMs monitor, assess and reward their direct
suppliers, the most important element in the supply chain, by means of continuous audits and
evaluations so that they are assured of the product quality, timely delivery of the product and
its costs. According the information, obtained from the AMMs, that the output from such
activities motivates the suppliers; raises their production and technological capabilities and
their productivity, quality and production levels; promotes their R&D and innovation
activities; encourages them to increase their know-how and technological skills
continuously; creates competition among the supplier firms; and ensures KTTs from the
AMMs to the suppliers231
. In conclusion, such activities lead to increases in the performance
levels of the suppliers. The findings obtained in this section coincide also with the findings
in sections 5.7.2 and 5.9.2.
7.6.5. Via Global Certificates of MNCs
It has been discovered that the direct suppliers’ obtaining special quality certificates of the
MNCs (Q1 of Ford, Toyota, etc.) affects positively the KTTs (see also section 5.4.2).
228
Departments such as purchasing, supplier relations, supply industry development, etc. 229
These criteria may be summarized as follows: No problem encountered concerning supplier’s delivery on time
during the course of that year; no return of any product due to quality problems; supplier’s scoring high or
acceptable points as a result of the audits; supplier’s success in drawing his costs back to the predetermined price
levels; and supplier's success in increasing the productivity. 230
Suppliers are awarded for three ranks; i.e. gold, silver and bronze awards. Certificates, plaques, letter of
commendation, etc. are given as awards. 231
It is necessary to question the suppliers in order to ensure that how much these situations are right.

354
Especially the MNCs abroad set a precondition that the suppliers they will work with should
have the special quality certificates issued by them. Becoming entitled to the special quality
certificates and being able to maintain them is possible only by achieving extremely high
success and assessment criteria at the end of a long-term and planned process. Domestic
suppliers could be entitled to such special certificates only upon approval of the MNCs
abroad, as a result of the joint assessments of both AMMs in Turkey and MNCs as foreign
partner. Therefore, these certificates are valid globally and whether the firms obtaining these
certificates are originally Italian, German, American or Turkish firms makes no difference in
terms of their quality and production capability.
The suppliers possessing these certificates are included in the direct suppliers pool of the
MNC and could be able to sell their products directly also to the MNC plants located in other
countries. However, assessment and audit processes for the firms who possess these
certificates are based on more strict conditions and requirements, and it is possible to take
back these certificates in case of any problem. Since these certificates are of global nature
and for this reason they are regarded as an extremely important reference and reward by the
suppliers who possess them; at the same time, they constitute as a benchmark for other firms
and play a major role in procurement of products to the firms at home or abroad or executing
joint projects with them. Consequently, it has been observed that possessing the special
quality certificates issued by the MNC is highly important for the suppliers to develop
themselves and to ensure KTTs.
7.6.6. Via Training and Education Activities
One of the most important channels through which KTTs to the domestic direct suppliers are
realized is certainly education and training-related activities delivered and performed by the
AMMs232
. It has been determined that the AMMs continuously deliver on-the-job and off-
the-job training to the personnel of their direct suppliers, on the topics such as production,
production process, R&D, quality, cost reduction, productivity, technology, production
systems, etc. Such training activities are mostly in the form of seminars, workshops, courses
and consultancy services, and executed at the training departments or supply industry
development departments of the AMMs. It has been determined that such training could also
232
Although the terms "training" and "education" are generally used interchangeably, they are not same at all.
Companies may use both terms depending on their activities. In simplest way, training refers to the practical
activities in order to gain skills how to use new equipment best, while education refers to teaching activities to
help someone how to problem solve.

355
be delivered by the specialists of the AMMs at the plants of the suppliers, when necessary. It
has been also determined that some AMMs with foreign-capital assign their own specialist
personnel233
at the plants of the suppliers for a certain period (between 1 week and 1 month,
etc.) in order to assist in various subjects (especially in quality problems encountered during
serial production), under the scope of the activities aiming at improvement of the suppliers’
quality. These assigned personnel mainly are focused on resolving the problem; however,
they also work on the issues such as management of the sub-suppliers234
who are considered
to be in need of improvement, maintenance of the equipment and machinery, production and
quality systems applications of the AMM, field of delivery, etc. The abovementioned
findings obtained from the AMMs also verify the information obtained in section 5.2.4.
Activities included in the training delivered by the AMMs to their direct suppliers' engineers,
production and management personnel could be summarized as follows:
Making training arrangements by the AMM’s specialists in the form of meetings,
seminars and workshops for the purpose of ensuring adaptation to the AMM’s
production, quality and audit systems,
On-the-job demonstration of the work principles of the AMM, concerning the issues
such as tests, quality, audit, delivery just in time, etc.,
Delivering training on 3D design and the use of certain software such as CATIA,
ROBCAD, CAD, CAE, CAM, etc.,
Delivering training on the occupational safety and safety of the workers,
Executing intensive and extensive training activities and holding seminars and
meetings during the processes of co-design, joint projects, and production of new
vehicles and parts,
The engineers and R&D personnel of the suppliers’ working on the job together with
the engineers of the AMM for a certain period concerning a new part to be produced
or developed,
Conducting extensive training activities for ensuring speaking the same language and
enhance communication between the AMM and suppliers,
Delivering on-the- job training to the production personnel of the supplier on the
production lines of the AMM for a certain period,
233
Quality engineer, quality group leader, supplier production management or quality engineer etc. 234
Second and third-tier suppliers
356
Holding and performing workshops, meetings and training on the problem-solving
techniques for resolution of the common problems of more than one supplier and for
prevention of “operational blindness”, and on finalization of the projects and works,
Introducing and allowing visiting the production lines, R&D departments, test
laboratories of the AMMs.
Such training activities should improve the quality and production processes of the domestic
direct suppliers, raise their technological levels and increase their accumulation of know-
how and knowledge, by means of KTTs to them via their personnel, and therefore affect
their performance positively. However, to what degree such training activities delivered by
the AMMs provide KTT to the supplier firms and its effect on the suppliers’ performance
would essentially depend on the technological capabilities and absorptive capacities of the
suppliers as well as on to what extent they could internalize and digest such training.
7.6.7. Via Other Assistances by AMMs
During the interviews made with the top-executives of the AMMs, it was also determined
that, apart from the abovementioned supports, there were various forms of assistances
provided to the domestic direct suppliers. Such activities indirectly ensure self-development
of the suppliers and lead to raises in their know-how, technology, productivity and
performance levels. For this reason, these could also be regarded as some kind of KTT from
the AMMs. Such assistances are mainly as follows:
Acting as an intermediary agent to help the supplier firm to find raw materials from
abroad, if the raw material necessary for the relevant part is not available at home235
,
The AMM’s intervening in and concluding some wholesale contracts himself,
concerning some raw material resources to be utilized by more than one suppliers due
to high cost advantages,
Supporting financially and providing advance payments in the new projects requiring
high level of investment and in production of costly parts,
Providing guidance in purchasing various software programs,
Allowing the suppliers to use his own test laboratories and benches during tests of the
parts requested from the suppliers,
235
Since the AMMs have more extensive contacts and communication channels abroad compared to the domestic
supplier firms because of the fact that they are included in the production networks of the MNC, they could
develop business relations with the companies abroad more easily.

357
Providing guidance to the supplier in purchasing new machinery-equipment from
abroad, in selection of the production equipment and providing some materials and
tools in this respect,
Assisting the supplier in finding some sub-parts if the supplier has a difficulty in
finding those sub-parts that are required for manufacturing a part,
Acting as an intermediary agent to help the supplier in accessing overseas companies
with which the supplier could establish technological cooperation, with respect to a
part to be manufactured,
Ensuring that the new projects and future plans are discussed mutually by means of
holding meetings once or twice a year to bring together the top-level managers of the
suppliers, and trying to resolve the problems concerning production and buyer-
supplier relations within the framework of mutual cooperation, by means of creating
opportunities to express such problems and relevant expectations,
Providing various assistances on logistics, documentation, quality control and know-
how,
Carrying out workshops constantly on issues such as productivity enhancement,
quality control, new production methods and cost reduction,
Providing assistance and guidance for the problems encountered in the R&D activities,
Bringing together the suppliers who have high technology capabilities under joint
projects and ensuring that they support one another and establish cooperation among
themselves. In these activities mutual trust is very important and a prerequisite among
companies.
Promoting the foreign direct suppliers in Turkey, who are included in the direct
supplier pool of the AMM, to lead the local suppliers operating in the same field and
share their knowledge and experience with them. The aim of such supports is to
ensure that the local suppliers establish contacts with the foreign suppliers, who have
advanced level of production and technology capabilities, in the same field and
enhance their own capabilities concerning production, quality, delivery, design and
defect rate, etc., by means of know-how they will obtain from those foreign suppliers.
It is thought that supports of this kind are far more important than other assistances in
that they ensure KTTs from advanced-level foreign suppliers to local suppliers, and
these could be considered a kind of horizontal technology spillovers.

358
7.7. SWOT Analysis
This section will try to point out the strengths, weaknesses, opportunities and threats
concerning the Turkish automotive main and supply industry that will affect the KTTs from
the MNCs to home based on the findings obtained from the interviews made with the top-
executives of the AMMs236
. The findings obtained contain the generalizations drawn upon
the personal opinions, views and contributions expressed and made by the managers
concerning the questions remaining under the title E of the interview guide (see Appendix K)
within the framework of the study herein. When the findings are put forward, the opinions
and views of the managers have been revised and reviewed by the author and tried to be
presented in a compilation. The questions formulated with regard to the industry are
composed of the following topics in general:
Current status and future of the Turkish automotive industry,
Opportunities and challenges concerning the industry and how the Turkish automotive
industry will be affected by them,
Capabilities, strong and weak aspects of the supply industry firms, in comparison to the
rival countries,
Development of the strategic relationships between the AMMs and their suppliers,
Government policies towards the industry,
The status of the cooperation activities among the Universities, Industry and Public,
Opportunities and challenges lying before becoming a base of R&D, design and
excellency, rather than being a regional production base in the automotive industry,
The role of the MNCs in the industry, and how the direct investments that are knowledge-
intensive and that involve advanced technology could be drawn from MNCs into home,
Obstacles lying before the KTTs from the MNCs to the domestic firms, and how such
transfers could be realized in a more effective manner.
In the SWOT analysis, the findings put forward in each category are put in order according
to the level of significance commonly expressed by more than one manager.
236
With regard to this subject, see also SPO (2007), MITI (2010; 2011), and various TAYSAD
(http://www.taysad.org.tr) and OSD (www.osd.org.tr) publications on the industry, as well as Wasti et. al. (2009)
and Erdil et al. (2011).

359
7.7.1. Strengths (Internal-Positive)
The “strong aspects” of the industry as expressed by the participants concerning the KTTs
are as follows:
Geo-political location and demographic power (young population) of Turkey,
Young, well-educated, quality, enthusiastic, entrepreneurial, and relatively inexpensive
human capital. It is observed that, although the blue-collar human resource is inexpensive
in Turkey, well-educated and quality white-collar (engineer) human resource does not
contain inexpensive work force anymore; on the contrary, it is more expensive than those
of the Central and Eastern Europe countries, newly developed China, India, etc.; which,
in turn, creates a disadvantage in competition. For the time being, Turkey offsets this
disadvantage with her quality human capital; however, if well-tailored policies will not be
developed in the short and medium-term, the said countries' increasing quality level in
human capital could become a serious threat in the near future.
Possessing almost 50 years of experience and a culture on the automotive,
The automotive industry in Turkey has become a highly developed and strategic sector.
Existence of 15 AMMs operating in Turkey and their utilizing Turkey as a regional
production base,
The majority of the exports is to the EU countries where extremely high production and
quality standards are applicable,
Existence of the provinces which specialize in the automotive industry and which have
advanced logistics infrastructure, such as Bursa, Istanbul and Kocaeli, and existence of
clustering of organized industrial zones (GOSB, DOSAB, NOSAB etc.),
Existence of a strong supply industry and chain of suppliers,
Accumulation of experience, practice and knowledge in the areas of production, R&D
and design, which, in turn ensures KTTs; as well as existence of R&D centers to be able
to execute joint projects with the MNCs, and also high R&D expenses and innovation
activities made by the AMMs,
Existence of qualified and quality engineers who will be able to work together with
foreign engineers,
The interest in the advanced technology and technologies generating value added, as well
as in R&D, has increased recently in the industry; in addition, establishment of the R&D
departments and increase in the R&D expenses and investments, and establishing
collaborations on these issues with foreign firms,

360
As to the direct supplier firms in Turkish automotive supply industry,
o They are creative and entrepreneurial,
o They have strong accumulation of experience, practice, know-how and knowledge in
the areas of production such as sheet metal parts, plastic injections, glass, tires, rubber,
lighting, seats, cast and die-cast products,
o Their commercial, technical and manufacturing capabilities to enable them
manufacture products at international standards have developed,
o The quality of the products they manufacture has been developed to a great extent
while the costs have been diminished,
o They have been globalized and developed their potential to export and begun to
consider their target market as the world,
o They have begun to attach importance to the innovation and technology activities and
establish cooperation and conclude technology agreements with foreign firms at home
or abroad to this end.
Investment and export incentives of the government; project incentives of TUBITAK,
TEYDEB and SANTEZ; and the fact that the R&D incentives have been begun to be
granted on a legal basis upon enactment of the law no. 5746,
The importance of drawing more MNC investment into home and thereby obtain KTT,
also the importance of conducting innovation activities and thereby manufacturing mid-
tech/high-tech products that are knowledge-intensive and that involve high value added,
has been well understood both by the government and the actors in the sector,
Relatively low investment costs,
The fact that Turkey has a developing and growing economic structure with increasing
exports.
7.7.2. Weaknesses (Internal-Negative)
The “weak aspects” of the industry as expressed by the participants concerning the KTTs are
as follows:
The competence in the fields of powertrain, engines, electrical and electronic equipment
is poor and inadequate; also, inability to master such fields,
Insufficient number of qualified, well-educated and specialized intermediate
staff/engineer/R&D personnel required by the sector,

361
Inability to utilize and benefit from the scale economies due to the lack of a robust and
adequate-size domestic market,
The cost of the energy inputs (fixed costs) are high, which, in turn creates a disadvantage
in competition with the European, Far East and Asian countries,
The taxes imposed on the sector are extremely high and that inappropriate taxing policies
towards the vehicles restrict the production as well as innovation and R&D activities,
Insufficient regulatory role of the government to move and push forward the sector, to
increase the international competitive power, to draw FDI flows from the MNCs and
thereby ensure KTTs to the domestic firms,
Lack of basic test facilities required to generate a vehicle from scratch (wind tunnels,
crash tests, special drive courses, exhaust-emission tests), and thus remaining dependent
on abroad in this respect. It has been determined that such test facilities affect directly the
KTTs, R&D and design activities and MNC investments. Once such test facilities become
available, it will be possible to design and manufacture a vehicle from scratch at home.
Furthermore, it is expected that availability of those test facilities will ensure that
overseas firms come and invest in at home, that the AMMs will be able to draw more
projects from the MNCs, and that the co-design/co-development activities performed with
the MNCs will increase in quality and quantity; also, availability of such facilities would
contribute in Turkey’s becoming a base of R&D and excellency in the near future, rapidly
increasing the technology and know-how. For these reasons, it is regarded extremely
important and vital for the future of the automotive industry that such test facilities, which
require high level of investments that cannot be assumed solely by the sector, should be
developed at home immediately.
Being dependent on abroad in some vital raw material resources (such as plastic, sheet
metal, batteries, sponge etc.),
Although it has increased in recent years, the collaboration among the public, industry,
universities is still rather weak; the universities' research projects still remain at the
theoretical and literature researches to a great extent, rather than practical projects aiming
at development; the academic personnel fail to follow the innovations realized in the
industry and that they remain distant from and have got unfamiliar with the industry; the
universities' academic personnel participate very rarely in the projects executed in the
collaboration with the industry; there exist discouraging bureaucratic obstacles in front of
the academic personnel to prevent them from serving as consultants in the industry; as
well as failure of delivering the university students at the engineering departments on-the-
job training via internship,

362
Although they are now more favorable than before (especially with R&D Law no. 5746),
the R&D incentives still remain inadequate compared to the developed countries. Lack of
a strategy and incentive system especially for the small-scale automotive supply industry,
or inadequacy of such a system. The fact that the R&D incentives are granted on the basis
of product and that there exist no basic, long-term scientific R&D supports for developing
advanced technologies,
The government’s policies concerning the industry are inconsistent and not
supplementary, although there have been some developments,
The engineers’ lack of good level of knowledge of several foreign languages,
The fact that the majority of the supply industry;
o is small scale,
o still seems to have a structure that is far from professionalism, that is non-
institutionalized and that is poor and weak in financial structure,
o has limited competence in terms of production, design, engineering and R&D,
o has extremely poor resources reserved for the R&D and innovation activities,
o has high level of turnover among the firms, in terms of workforce such as engineering,
and has failed to obtain and acquire know-how, with continuing brain drain,
o has inadequate and weak power of competition at the international arena,
o is heavily dependent on the domestic AMMs, having inadequate contacts with and
links to abroad,
o has quite inadequate and poor organizational activities,
o has excess capacity,
o is composed of too many firms manufacturing similar parts; the firms that do not care
about merging and/or clustering policies in order to strengthen their financial structure
and to increase their technological levels as well as competitive power,
o fails to follow closely the technology and lacks vision.
The simultaneous engineering 237
(SE) activities have not developed at all or are
inadequate,
The sector has no macro plans and road maps containing the mid- and long-term future
strategies,
Worthy investments and R&D activities in the sector are poor and inadequate; the fact
that the financial resources reserved for R&D are extremely low compared to the
developed countries (USA, Germany, Japan, France, Italy etc.),
237
It is a process and widely used in the automotive industry and refers to complex simulation and development
projects for the manufacturing of new vehicle. It is defined in business dictionary as “concurrent new product
development through employing cross-functional teams to reduce cycle time” (see www.businessdictionary.com).

363
Lack of or inadequate pre-competition collaboration strategies among the firms,
Turkey is still perceived by the developed countries as a third-world country where poor-
quality and low-cost production is realized with inexpensive workforce; the facilities and
capabilities Turkey possesses in terms of production, investment, technology, R&D,
workforce and infrastructure have not been promoted and explained satisfactorily in the
developed countries,
The strategic relationship between the main and supply industry is poor and inadequate,
Transportation and shipment costs are extremely high due to inadequacy of the logistics
and transport infrastructure, such as railways and seaways, compared to rival countries,
The domestic or foreign investment incentives are not at the requested levels,
Works on patents and patent applications are not satisfactory.
7.7.3. Opportunities (External-Positive)
The “opportunities” for the industry as expressed by the participants concerning the KTTs
are as follows:
The demand for environment-friendly high-tech and mid-tech products has increased to
a great extent all over the world and that the governments provide substantial supports
and incentives for such technologies,
Due to the global financial crisis and increased prices for engineering in the developed
countries, the MNCs have shifted their R&D and direct investments to the developing
countries where incentives and inexpensive workforce are available,
The MNCs tend to develop their R&D and design activities not only in their
headquarters but also other centers in terms of developing new and differentiated
products, and making changes- adaptive and technical- to products aiming at target
markets,
Quite sound and long-term strategic cooperation activities with the MNCs have been
achieved as a result of almost 50-year experience in the Turkish automotive industry;
which in turn enables new business relationships with the MNCs at further levels,
The strategic approaches and enterprises aiming at becoming a R&D, design, test and
excellency base in the automotive, rather than remaining a production base, have been
expressed both the government and the industry,
364
The focus is now on developing and producing knowledge-intensive products at home
that generate high value added and that involve R&D, design, test and advanced
technologies, rather than on the labor-intensive production,
The transportation facilities have become easier and less expensive,
Ability to follow the technologies easily thanks to the advanced communication
facilities,
The government has a target to create local brand and trademarks,
Existence of economic and political stability.
7.7.4. Threats (External-Negative)
Lastly, the “threats” against the industry as expressed by the participants concerning the
KTTs are as follows:
Existence of rival countries238
with low-cost energy inputs and advantages in terms of
workforce and investment costs,
The fact that newly developed countries such as China and India have enormous domestic
markets; which, in turn, enables attraction of more MNC and R&D investments into those
countries. Knowledge and technology could be attained only via the MNCs possessing
advanced technologies and R&D investments. Such investments are extremely costly;
therefore, existence of a fairly large and robust domestic market to support those
investments is a must. This situation poses a serious threat in front of Turkey in terms of
attraction of MNC investments to enable KTTs, and carrying out sophisticated R&D and
innovation activities and hence production of knowledge-intensive, high value-added
products because of small domestic market.
The fact that the rival countries have been implementing, strictly and on the basis of a
long-term planning, extensive investment and export incentives and strategic industry
policies to attract the MNCs with advanced technologies and R&D investments to
themselves. The fact that such countries also support the sector's R&D activities and
activities aiming at developing advanced technologies (such as electrical cars) by means
of extensive incentives, public procurement239
and tax applications,
238
China, India, South Korea, Thailand, Malaysia and East Europe countries (such as Bulgaria, Slovakia,
Hungary, Romania, Czech Republic, Poland). 239
In the developed and some developing countries, for instance, municipalities and various governmental
organizations create a demand for the new products via billion-dollar tenders and guarantees of purchase, for the
purpose of encouraging and promoting new technologies involving high investment costs; and international

365
The rival countries have a resource of well-educated, well-equipped, qualified and less
expensive human capital composed of individuals who speak several foreign languages
and who specialize in computer programs (such as India),
Raw material resources are abundant in the rival countries,
In the rival countries, the public-university-industry collaboration has been implemented
for a long time successfully as required by the industry and at higher levels,
In the rival countries, the government plays a regulatory role in the automotive industry
and that the government's policies towards the industry are more strategic, more
extensive, longer-term and more supplementary in those countries.
7.8. Summary
This section will summarize the findings of the analyses of the interviews which were
conducted with the top-executives of 11 AMMs and which represents nearly 90% of the
Turkish automotive main industry successfully.
Turkey has become the 16th largest automotive manufacturer in the world in 2010, with 15
AMMs achieving a vehicle production capacity of more than 1.6M vehicles a year (total
production of more than 1.1M ea.), attracting significant amount of FDI into the automotive
industry within the last 40 years. She has witnessed a highly rapid development especially in
the bus and commercial vehicle production and achieved the first-rank as the production base
in these two classes across the EU and third-rank in the truck class, becoming therefore a
strategic sector240
. The information obtained from the interviews summarizes this situation
best: While in the past the AMMs with domestic-capital that manufacture bus and
commercial vehicles could produce only 3-5 vehicles per week on solely assembly basis at
each plant, by mounting driver’s cabin onto the truck chassis, today it has become possible to
develop and produce vehicles that are of local design and in compliance with the EU
regulation standards241
for export to the EU countries, up to an amount of 12 vehicle per day
institutions offer highly favourable loan and financing means and facilities for production of such technologies, as
well. 240
It has been determined that approximately 80% of the vehicles manufactured in Turkey by M.A.N, Mercedes-
Benz Türk, TEMSA, OTOKAR, B.M.C and ISUZU is exported to the EU countries. This could be regarded as a
highly significant criterion in that it clearly shows the development level of the bus and commercial vehicle
production especially and the achievement of the Turkish automotive industry across Europe. 241
Ensuring compliance with the regulations of the EU is considered vitally important since the most important
exportation market is composed of the EU countries. Such regulations affect every stage head to toe; from

366
at the domestic manufacturing plants. In addition, it has become possible to conduct some
major tests242
concerning the vehicles by the AMMs’ own personnel at home, instead of
having those tests conducted by the specialist firms and laboratories abroad. Especially as a
result of the developments witnessed during the last decade, the automotive main industry
today offers 20-30% of the vehicles manufactured to the domestic market, while the rest is
exported to first of all the EU countries and to many countries distributed over various
continents, such as Eastern Europe, Middle East, Asia, North Africa and America. Today,
the Turkish automotive main industry has become a strategically important industry of
Turkey with its current performance making it the industry achieving the highest export
figures in Turkey. Nevertheless, in gaining this importance it should be taken into account
that the level of the foreign inputs utilized in the production within the vehicle costs as we
mentioned before (see section 7.2.4) is 40-50% for the AMMs and reaches 50%-60% when
considered together with the supply industry.
The AMMs interviewed are divided into three groups, depending on their foreign capital
structure: The companies without foreign capital but manufacturing under foreign license (3
companies), the companies with partial foreign ownership (or joint ventures with the MNCs)
(6 companies) and affiliates of the MNCs (or companies with full foreign ownership) (2
companies). The headquarters of the AMMs with foreign-capital is located in the partner
MNC's country and basic R&D and design activities are performed and all kinds of strategic
decisions are taken by such headquarters. Since AMMs of the MNCs in Turkey are sort of
their own companies, they are open to all types of knowledge exchange, and no
differentiation between the personnel of the companies is applied based on being locals or
foreigners. On the other hand, the MNCs utilize Turkey as a production base and make
exports to the surrounding countries. Therefore, the AMMs with foreign-capital in Turkey
are in fact a part of the MNCs and included in their global production networks. Another
important finding is that the Turkish automotive main industry is under the control and
domination of such MNCs.
It has been determined that the industry highly specializes in the production of commercial
vehicles rather than personal cars, and that it could export 80% of its products. For this
reason, 90% of the R&D, innovation and technological activities of the AMMs aim at the
commercial vehicles. Yet another significant finding is that, while both the AMMs with
domestic capital and the AMMs with minority foreign capital conduct R&D and design
planning of the vehicle to its design and production. Therefore, there exist AMMs that have separate departments
focused on the EU regulations. 242
Industrial designs, 3D analyses, finite element analyses, durability tests, etc.

367
activities at home, other AMMs where foreign capital is in majority conduct such activities
in their headquarters abroad (see Appendix J).
Production structures of the AMMs interviewed may be summarized in three main
categories: (i) adaptive or minor technical changes on complete imported vehicles, (ii)
manufacturing the MNC’s vehicles at home by localization of them, and (iii) designing and
manufacturing the vehicle completely at home. It could be said that the AMMs
manufacturing personal cars operate in production structures no. i and ii, while the AMMs
manufacturing the commercial vehicles operate in production structures no. ii and iii. As to
production structure no. iii, if the AMM is of a foreign-capital structure, the final design and
production approvals of the vehicle are given by the MNC headquarters. The most critical
finding here is that, irrespective of the production structure, knowledge-intensive and quite
costly basic system parts/components are procured from the MNC headquarters and/or
global-mega suppliers, which, in turn, rendering the industry dependent on abroad in terms
of such parts.
It is observed that all of the AMMs conduct R&D activities; furthermore, except one
(TOYOTA), all of them has a R&D center in their structure, within the framework of the
R&D Law no. 5746. However, the most significant finding is that the AMMs are engaging in
short- and mid-term R&D activities aiming at product improvement and development,
instead of long-term basic scientific projects. When conducting such activities, the AMMs
with foreign-capital benefit from the advantage of being included in the global production
networks of the MNCs to the utmost extent, and establish collaboration with the MNCs and
obtain all kinds of support, in this respect. This may be interpreted as substitution of local
R&D by international linkages.
KTTs to the AMMs with domestic-capital and the AMMs with joint-venture capital
partnership are realized via the partners with whom they establish strategic collaboration.
When put in the order of significance, the most important ones are the partner MNC, licensor
MNC and global-mega suppliers, from whom transfers in many critical areas, mainly such as
product, production processes, design, R&D, engineering and training, are realized. It
appears that the most critical knowledge and technology resource in this respect is the
partner MNCs. Transfers from the MNCs are realized through certain channels such as joint
projects; co-design and co-development activities; implementation of the MNCs’ quality,
production and management systems at the domestic plants; monitoring and auditing by the
MNCs; and training delivered by the MNCs to the personnel of the AMMs. The training
368
activities performed by the MNCs ensure that the local engineers enhance their skills and
capabilities, thereby facilitating internalization and absorption of such transfers.
The AMMs procure the system parts and sub-components from the direct suppliers located at
home and abroad and assemble them, and these suppliers constitute a vitally important part
of the production and supply chain of the AMMs and are considered as a strategic partner.
Average number of the domestic and overseas direct suppliers of the AMMs is 338; the
number of suppliers with whom the AMMs work is higher for the AMMs engaging in
producing commercial vehicles, and they work with overseas suppliers by one-third. In
addition, it is observed that there is a positive correlation between the foreign capital share of
the AMMs and the ratio of the overseas direct suppliers they work with.
From the viewpoint of the AMMs, the domestic direct supplier firms appear highly
developed, capable, competitive and strong; they conduct R&D activities and have a high
level of absorptive capacity, establishing collaboration with the AMMs in the co-design/co-
development activities. The most important expectations from these suppliers are
summarized as delivering the requested products just in time, at the highest quality and at the
lowest price. Due to the reasons mentioned above, being selected as the direct supplier of the
AMMs and included in the supply chain becomes possible only after a challenging process.
It is observed that once these suppliers are included in the supply chain, they perform various
collaboration activities with the AMMs.
Another significant finding in this section is that the findings obtained from AMMs
concerning their direct suppliers coincide with the findings obtained from the suppliers
surveyed in Chapter 5. Especially the topics such as the KTTs concerning product and
production processes; financial transfers; training, monitoring and auditing; co-design and
co-development collaboration activities; capabilities of the direct suppliers and their
absorptive capacities; the importance of being the sole supplier in the product range
concerned; selection criteria for the direct suppliers; and the advantages of having the special
quality certificates of the AMMs and being the direct supplier coincide with each other.
It has been determined that the KTTs from the AMMs to the domestic direct suppliers are
realized through certain channels such as joint projects, co-design/co-development activities,
monitoring and auditing systems, the process of obtaining the global certificates of the
AMMs and delivering training by the AMMs, and that being a sole direct supplier of an
AMM in certain product range affects such transfers positively. The most important channels

369
in this respect are co-design and training activities, from the perspective of the content of
such transfers. However, to what extent such KTTs realized are absorbed by the supplier
firms and what effects such transfers would create on their performance essentially depends
on the technological and absorptive capacities of the suppliers.
It has been determined that the AMMs establish more intensive and more quality
collaboration with their do-designer suppliers, that they share necessary knowledge with
them and that such suppliers are in general the sole supplier of the AMM in the product
range concerned. The most important factor here is that the level of the technological
capabilities of the co-designer suppliers is fairly high. Anyway, to have qualified, skilled and
specialized human capital with high production capabilities is demanded by the AMMs and
they are considered the precondition for the suppliers for realization of such collaboration
with the AMMs.
The strengths of the industry, which would affect the KTTs from the MNCs to home could
be stated as the geo-political location of Turkey and the fact that she possesses an automotive
culture of nearly half a century; while being dependent on abroad in basic system parts and
not having an economically-strong and large domestic market could be regarded as its
weaknesses. The major opportunities for the industry are increased interest in the new
technologies on the global scale as well as the fact that MNCs have shifted their investments
to the developing countries due to increased investment and workforce costs in the
developed countries. On the other hand, existence of rival countries who have a large
domestic market, who hold fairly high advantages in terms of production costs, and who
have extensive incentive policies being applied for the purpose of attracting significant R&D
and technological investments of the MNCs, within the framework of the strategic
collaboration of university-industry-public could be considered as a major threats.
370
CHAPTER 8
CONCLUSION
8.1. Introduction
The main purpose of this thesis is to evaluate whether FDI occurring in the Turkish economy
has any effect on domestic firms, especially whether and to what extent it leads to
technology spillovers and transfer by paying attention to the role of MNCs. In this context,
the thesis consists of two main parts:
In the first part (Chapter 3), a series of econometric analyses were conducted to examine
the effects of FDI-related technology spillovers on domestic firms’ productivity level
through horizontal (intra-industry) and vertical (backward and forward) linkages (inter-
industry) with foreign firms in the Turkish manufacturing industry by using firm-level
panel data. In addition, we tried to measure the effects of the absorptive capacity of the
firms by using technological gap variable whether they benefited from these spillovers by
impacting on productivity level. To the best of our knowledge this is the first study
concerning the Turkish manufacturing industry for the post 2001 period where FDI flows
are rather high. Findings of this part provided benefits to understand the occurrence and
to show the importance of technology spillovers through FDI by their impacts on the
productivity level of the domestic firms; however, they are not sufficient to uncover the
mechanisms behind the results obtained. For instance, it is not possible to understand the
complex nature of these spillovers, in which ways these occurs, what are these spillovers,
what are the factors that give rise to spillover effects between firms, what is the role of
the firm characteristics and strategic collaborations between firms in these spillovers etc.

371
Instead, econometric analyses conducted only indicate the possibility that foreign
presence impacts on the productivity level of the domestic firms through horizontal and
vertical linkages not the quality and intensity of these relationships.
In the second part (Chapters 4, 5, 6 and 7), by going one step further for the purposes
mentioned above, a very detailed and comprehensive case study research was conducted
at the firm-level in the Turkish automotive industry in order to uncover what causes
technology spillover effects or lack of it, and their impacts on the domestic firms. The
statistical findings in Chapter 3 also confirmed that foreign firms played a major role in
Turkish automotive industry especially through horizontal and backward linkages (see
section 3.4.3.4); hence, this also justifies the aim of the thesis in terms of choosing the
automotive industry as a case study to analyze KTTs at both inter-and intra-firm level243
.
The second part of the thesis is based on the empirical case-study research and supported by
a research grant from TUBITAK and Faculty Development Program (OYP) of METU, and
the professional supports of OSD and TAYSAD, two main representatives of Turkish
automotive industry, have played an instrumental role in the success of the study.
The study has two main purposes in terms of KTTs at inter firm level. First one is to examine
whether FDI in Turkish automotive industry give rise to KTTs from MNCs (customers) to
their direct suppliers through backward linkages at inter-firm level. Second one is to analyze
the relative importance of the transfers took place and the effect on the performance level of
the suppliers. Therefore, the main purpose of the second part is to analyze what kinds of
KTT related to product (design, co-design, joint activities, various documentations etc.),
production process (various know-how, R&D, logistics etc.) and training (on-the job, off-the
job) issues have been provided by MNCs to suppliers operating in Turkish automotive
supply industry and the effects of these transfers on suppliers’ performance level. In
addition, the following issues were also included in the analysis:
Determine the firm characteristics that play an important role in these KTTs,
Reveal and understand channels and determinants of such transfers,
Obtaining clues about the place of the suppliers in the global value chain of the
MNCs,
243
For instance, findings of Chapter 3 pointed out the importance of foreign presence (especially MNCs)
especially in automotive industry which is in the first place among all sectors in Turkish manufacturing industry
in terms of number of foreign firms operating (17%), and their shares in employment (55%), gross output (80%)
and value added (80%) values. In addition, we revealed that the sector has the highest horizontal and backward
spillovers value, and also it has the third highest value in forward spillover value across all manufacturing sectors.
372
Analyze the effects of such transfers on suppliers performance level by using a series
of performance indicators,
Evaluation of technology, R&D and innovation activities of the suppliers,
The aim of the study in terms of KTTs at intra firm level is to analyze the channels of the
KTTs realized by the MNCs to the AMMs operating in Turkey, the characteristics of the
AMMs; their cooperation activities with the MNCs as their foreign partners (global AMMs);
R&D and technology-related activities.
To achieve these purposes, two different research methods were used to collect detailed data
and information at the firm-level from both suppliers and AMMs in Turkey:
Firstly, face-to-face questionnaire survey was successfully conducted with the top
executives of 166 automotive supplier firms (132 out of them are direct suppliers) in
order to collect quantitative data – that means 55.7% response rate (given that the main
sample consists of 298 firms). With this collected survey data, we tried to analyze our
objectives in terms of the suppliers in automotive supply industry.
Secondly, in-depth interviews were successfully carried out with the 19 top-executives of
11 AMMs in Turkey based on semi-structured interviewed guide. With the collected
qualitative data, we tried to analyze our objectives in terms of AMMs. In other means, we
examined and looked at our objectives from the two perspectives; one is from the
suppliers’ perspective as a recipient of these transfers and second one is from customers’
perspective as a source of KTTs at inter-firm level. When it is considered that such
studies need greater budget, time, research team, and include very detailed,
comprehensive and confidential information on the firms, and therefore need very effort
to be successful, it might be claimed that the study was carried out with a notable success.
To the best of our knowledge, in this context, this is the first empirical research carried
out successfully in national level on FDI-related KTTs at both inter- and intra-firm level.
8.2. Main Findings
In Chapter 3, our findings suggest that there are horizontal technology spillovers occurring
from foreign firms to domestic firms. Moreover, results show that local and DO firms have
more benefited from the foreign presence in the same sector in contrast to EO firms.
Specifically, these findings are also consistent in both situations (i) when all foreign firms

373
are taken into account (no restriction on foreign share), and (ii) when output share is
calculated for firms with 10% or more foreign share. These results mean that putting a 10%
restriction on FS does not give rise to different significant results in the generation of
horizontal spillovers. However, we obtained different results with respect to minority and
majority foreign ownership measures. According to this, horizontal spillovers seem to
originate from foreign firms with majority joint venture (FS higher than 50% or 70%) and
with full foreign ownership (FS is 100%), while no such effect is associated with minority
joint venture foreign ownership firms (less than %50 or 69%). These results confirm that
horizontal spillovers from foreign firms with majority or full foreign ownership are more
important and stronger than the spillovers accruing from foreign firms under minority
foreign ownership control. In sum, these figures indicate that local and DO firms more
benefited from foreign presence in the same sector but especially more when FS is higher.
In the case of vertical spillovers, we find positive evidence of horizontal spillovers, yet
regression results yield different results for backward (linkages between foreign firms and
their local suppliers) and forward spillovers (linkages between foreign suppliers of inputs
and their local customers) according to digit levels. At all digit levels, the effects of forward
spillovers are in the negative way. In the case of backward spillovers, we found negative
effects at 2-digit level but positive at both 3 and 4-digit levels. When we compare the
samples, we see that local firms benefited more from the foreign presence in sectors they
supply, while they more affected negatively from the foreign presence in sectors they
purchases inputs at both 3 and 4-digit levels, however, they are negatively affected from
vertical spillovers at 2-digit level. Furthermore, when estimations were performed for EO
firms, we could not find any indication of horizontal and vertical spillovers, this means that
EO firms’ linkages with the foreign firms are very weak and not any effect on their
productivity.
When the vertical spillover effects are analyzed with respect to the degree of foreign
ownership, we found that linkages through partially-owned firms give rise to positive
backward spillovers and negative forward spillovers at both 3 and 4-digit levels. On
the other hand, at 2-digit level, linkages through both fully and partially-owned firms
yield negative vertical spillovers. One of the most important findings is that backward
linkages/(forward linkages) through partially-owned firms have more
positive/(negative) effect on the productivity of the domestic firms than through fully
owned ones at all digit levels. These findings overlap with our earlier findings.

374
When the vertical spillover effects are analyzed with respect to EO and DO foreign
firms, we found that the linkages through EO foreign firms give rise to negative
backward spillovers and positive forward spillovers, whereas the linkages through
DO foreign firms give rise to positive backward spillovers and negative forward
spillovers. These results are compatible to our previous findings. In sum, these results
mean that backward linkages through DO foreign firms and forward linkages through
EO foreign firms offer greater opportunities for productivity increases.
The estimation results in terms of technology gap (TGAP) confirm the importance of
absorptive capacity of the firms for spillovers in order to benefit and to absorb the foreign
technology; however produce different results for both horizontal and vertical spillovers. In
the case of vertical spillovers, highly technological firms benefit more from forward (at all
digit levels) and backward (only at 2-digit level) technology spillovers as expected. Although
we could not find significant evidence of TGAP on horizontal at version 1 of TGAP
(TGAPV.1
), our results in the other two versions (TGAPV.2
and TGAP
V.3) show that firms with
low technological capacity benefit more from horizontal technology spillovers (at 2-digit
level). The results on TGAP variable interacted with Horizontal conflict with our starting
hypothesis244
, however, in fact, we think that this result can be more reasonable. Buyer and
supplier (vertical) relationships between firms are determined according to technology level
of the firms and it is clear that establish vertical linkages with foreign firms require more
technological capacity. In addition, the absorptive capacity has relatively played more
important role in benefit from vertical spillovers than benefit from horizontal spillovers, and
already highly technological firms are not affected so much from horizontal technology
spillovers because of the characteristics of these spillovers. For these reasons TGAP may
have much more positive effect on low technological firms to benefit from horizontal
spillovers in contrast to vertical spillovers.
Our main findings in terms of the second part of the thesis based on empirical case-study
research can be summarized as follows:
If we summarize our main findings in terms of KTTs at inter-firm level in Chapter 5, it
seems that KTTs occur from AMMs to their domestic suppliers mainly on providing
documentations, assistances for logistic management, quality control, know-how, R&D, co-
design and co-development activities, designing and cost reduction. Compared to foreign
244
It is expected a negative correlation between TGAP interacted variables and productivity; since assumed that
higher technological capabilities and absorptive capacity are necessary to benefit from technological spillovers.

375
suppliers, local suppliers tend to be involved in those production-product-training related
KTTs which are less knowledge-intensive and of a lesser quality. On the other hand, being a
direct supplier of AMMs in Turkey and therefore being more close to customers in the
supply value chain exerts a positive effect on the number, quality and intensity of KTTs.
Moreover, various types and modes of training activities have been also provided to
personnel of suppliers by customers. These trainings are mostly given to
production/operation staff via off-the job training activities. However, foreign suppliers are
more involved in these training activities than local firms. This situation does not mean that
foreign firms need more training because of lower capability of their human capital; on the
contrary, it indicates that customers prefer to work mostly with foreign suppliers because of
both their advanced technological capabilities and absorptive capacity level. These kinds of
KTTs are generally provided by customers on the basis of new product development process.
Therefore, this confirms that strategic relationships between foreign firms and customers are
very strong and it reflects that it is necessary to have very qualified personnel to be benefited
from these activities. Finally, it seems that customers do not generally prefer providing
financial assistances to supplier firms; but if they do, these assistances are generally made in
the form of pre-financing of machinery and prepayments for orders before delivery.
When the findings in Chapter 6 are reviewed, 5 factors come to the fore:
It is observed that being a direct supplier (first-tier supplier) of at least one AMM in
the automotive main industry will not trigger KTTs in terms of both the product and
production process, but triggers the ones realized via training (see Tables 6.28 and
6.29). This may indicate that the technological capability levels and absorptive
capacities of the direct supplier firms are not in good shape. The other side of the coin
is that being a direct supplier will decrease the probability of establishing
collaboration with the lower-tier suppliers and that the second or third-tier suppliers
could not benefit from such KTT channels (see Table 6.29). In addition, an interesting
point is that we could not find any positive effect of being a direct supplier on the
performance of these firms245
.
Especially R&D capabilities of the foreign firms in surveyed sample are more
advanced and higher compared to the local firms. This has been reflected in some way
or other on the performance (average costs) of the foreign firms, as well (see section
5.8.3 and Tables 5.36 and 6.29). Another finding is that the probability for the foreign
245
It should be taken into account that a majority of the firms participating in our survey are direct suppliers
(first-tier suppliers) may have affected these results.
376
firms to collaborate with other companies is lower compared to the local firms246
and
that they obtain the technologies they utilize from the headquarters of their parent
companies (MNCs) (another indicator to depict the technology dependence on
abroad). The regression analyses in Chapter 6 put forward that the foreign supplier
firms establish collaboration for production and/or R&D purposes with neither the
firms in their own sector (automotive supply industry) nor the AMMs in Turkey; on
the contrary, a negative effect is in question (see Table 6.28). This results in the fact
that the foreign firms in supply industry will not share their technological knowledge
with the local firms.
More than 90% of the supplier firms surveyed export to other countries. This rate
reflects the trend that has widespread after the second half of the 1990s. The findings
obtained from Chapter 6 show that increase of the share of the production aiming at
the world market in the total sales triggers the innovation and co-design activities of
the supplier firms for that product. On the other hand, it is observed that it does not
affect the KTTs realized by the customers concerning the production process and does
not affect the supplier firms’ performance positively, either; it could be even said that
it has a negative effect on being a direct supplier (see Tables 6.28 and 6.29). These
findings point out the fact that exportation and increase of the share of the production
aiming at the world markets in the turnovers alone will not suffice to enhance the
production, design and R&D capabilities of the firms. In our opinion, these findings
require that the status of the automotive supply industry firms in the global production
networks of the MNCs should be questioned.
We see that the firm size affects many factors positively (see Tables 6.28 and 6.29).
We observe that firm size affects the KTT processes in terms of product and finance
positively but does not affect the performance of the firm (capabilities and developing
production capability). In addition, it has positive effects also on the probability of
being a direct supplier; performing R&D activities; and establishing co-design and
technology collaboration with other firms for the product.
Lastly, the findings of the econometric analyses show that performing R&D and
innovation activities in terms of product by the firms is of vital importance for many
factors, first of all to obtain KTTs from the AMMs and to develop business
relationships with other companies (see Tables 6.28 and 6.29). Moreover, the findings
in Chapter 7 obtained from the interviews verify that those two factors are highly
important especially for being able to become a direct supplier and for performing co-
246
In addition, the probability of the customers to realize KTT in terms of both the production process and
products to the foreign firms is lower compared to the local ones.

377
design activities with the AMMs. These are also assumed as important indicators of
absorptive capacity of the suppliers and point out to the importance of technology
competences for those suppliers which desire to be a co-designer, and to obtain KTTs.
In these respects these two factors are found more important than any other factors.
Our findings in Chapter 7, obtained from the AMMs as a result of the interviews, coincide in
general with the findings in Chapters 5 and 6, obtained from the suppliers via questionnaire
survey. We could summarize those findings as follows:
It is understood from the findings we have obtained that the AMMs have an intensive
and close relationship with most of their suppliers, first of all their direct suppliers
with whom they carry out co-design activities. It is observed that various collaboration
activities between the AMMs and their suppliers have been conducted, on the subjects
such as product co-design and product development activities-agreements-discussions;
design of the production tools; development of the quality & control methods; cost
reduction; and material designs, etc. Since ultimately it is the AMMs who will be the
final users of the supplied parts, they want to be assured of the quality and timely
delivery of those parts, because even the most minor problem encountered in the
production and supply chain could bring the production lines to a halt. In other words,
any problem, even the most minor ones, encountered on the side of the suppliers
reflects directly on the AMMs due to the production chain. Therefore, the AMMs
monitor their suppliers closely, audit them and assist them in resolving their problems.
The AMMs share their knowledge and technologies with their suppliers in general via
certain channels such as joint projects and co-design/co-development and training
activities. The AMMs perform co-design activities with their suppliers during the
development phase of a new vehicle and part, and provide them required support
concerning product and production processes. Such buyer-supplier relationships
ensure KTTs to the suppliers through backward linkages and may enhance and
develop their technological capabilities, quality levels, productivities and performance
levels.
When problems arise in relation with the projects implemented, program follow-up
and applicability, production or the product, the AMMs deliver the training they deem
necessary to the supply industry firms by means of their engineers, through various
methods such as conferences, informative meetings, seminars and on-the-job training
held at the AMM's premises. In addition, the AMMs assign their engineers at the
relevant supply industry firm for a short period under highly specific circumstances

378
(for problem-solving purposes or when requested). Visits paid by the supply industry
engineers to the AMM’s plants are generally performed in case of production of a new
part, in order to ensure that no problem occurs at the production line of the product, to
detect problems if any, and to support the material flow. The engineers or employees
of the supply industry firms apply the information they obtained during those activities
afterwards also to the firms they work for.
At the same time, the monitoring and auditing systems; requested high quality
standards; price target and cost reduction requests of the AMMs in turn raise the levels
of the quality, technology and R&D capabilities of the suppliers and force them to
work up to more advanced standards. For example, one of the AMMs who deals with
bus production stated that since they employ 3-D design in production, they also
request from their suppliers to use the same technology and to provide them with not
only the illustration of the part but also its 3-D data, as well. With every new project
developed by the AMMs together with their suppliers, the AMMs’ standards and
demands are notched up another degree and this, in turn, ensures KTTs from
customers to the supplier firms, contributing greatly to accumulation of knowledge.
Furthermore, the competition among the supply industry firms both at home and
abroad causes them to develop themselves constantly. In sum, the supply industry
firms have to develop continuously their technological abilities so that they compete in
the fields of quality, R&D, costs, prices, design and productivity, and if they fail to do
so, they will be faced with being wiped out from the market. The supply industry
firms obtain know-how and knowledge by enhancing their technological capabilities
within the framework of the constant improvement and development system and by
getting KTTs.
The AMMs have also stated that they support the supply industry firms when required,
on issues such as selection of production-equipment, selection of machinery,
purchasing press-moulds, purchasing new software, etc. It has been stated that,
however, there is no such application in terms of financial supports; but that advance
payments are made if production of a new part is in question or financial supports are
provided in case of purchasing the parts (software, benches, press-moulds, etc.) that
are vital for the production.
The AMMs have underlined that the abovementioned collaboration activities provide an
important information exchange between the suppliers and the AMMs, contributing greatly
to the development of the supply industry firms and ensuring accumulation of knowledge. In
this context, it could be argued that the KTTs from the AMMs to the supply industry firms

379
are realized via joint-projects, training and agreements. Ultimately, that the suppliers exhibit
a better performance also increase the performance levels of the AMMs indirectly, and make
it possible for them to obtain better-quality products on-time. All these processes constitute a
gain from the supplier’s perspective.
Our findings in terms of KTTs at intra-firm level show that transfers in many critical areas
are provided to AMMs by their partner MNC. These transfers are realized through joint
projects; co-design and co-development activities; implementation of the MNCs’ quality,
production and management systems at the domestic plants; monitoring and auditing by the
MNCs; and training delivered by the MNCs to the personnel of the AMMs. The training
activities performed by the MNCs ensure that the local engineers enhance their skills and
capabilities, thereby facilitating internalization and absorption of such transfers.
In the light the findings we have obtained, we see that the Turkish automotive industry has
made a great deal of development in the last 40 years and been transformed from production
in small quantities, on complete assembly basis under licenses and not quite open to
competition, to being able to sell its own vehicles, especially commercial vehicles that it
designs and produces with its own R&D, to many countries in the world. Moreover, it has
been observed that the main and supply industry firms establish strategic partnerships with
foreign companies abroad, that their technological capabilities enhance and that they follow
the technologies and innovations closely, being integrated into the world. However, despite
all these positive developments, the Turkish automotive main industry still appears to be
unable to create its own global trademark in the personal car, continuing to produce under
foreign licenses, and it seems that the MNCs dominate the domestic market completely in
this area. As a result of the interviews made with the top-executives, it has been determined
that, irrespective of the foreign capital ratio, all the AMMs with foreign capital are
dependent on the headquarters of MNCs as foreign partner247
, and that all kinds of basic
product development, design and R&D activities are carried out at these headquarters
abroad. On the other hand, it has been observed that even if the MNCs have R&D
departments in their local affiliates in Turkey (AMMs), these departments generally work on
the issues such as adaptive changes, partial modifications and improvements of the products,
making them appropriate for the domestic market and production line, etc.
247
Naturally, the AMMs dealing with production under foreign license in Turkey become dependent on the
headquarters of the MNCs as foreign partner (the licensor MNC located abroad) in almost all strategic decisions.

380
In conclusion, the MNCs make investments in the developing countries for reasons such as
inexpensive labor force, raw materials, large size of the domestic market (and high growth
rate), and incentives concerning investment, export, R&D, etc. The knowledge and
technology possessed by the MNCs are generally transferred to the local firms in host
country through backward linkages, increasing the accumulation of knowledge and
technological capabilities of those firms. Furthermore, the presence, the culture and
experience of the MNCs create a competitive effect on the sector they operate and force the
local firms to develop themselves, affecting positively their productivity and technological
capabilities. However, the MNCs maintain their most critical product development,
technology, design and basic R&D departments at their headquarters abroad and remain
unwilling to share the knowledge they have in such fields with the firms other than those
they naturally establish strategic partnership and collaboration with. Obtaining the MNCs’
knowledge and technologies by the local firms become possible via joint projects and
technology or collaboration agreements. Yet, internalizing and absorbing the knowledge and
technologies obtained in this way largely depend on the absorptive capacities and
capabilities of the local firms in the areas of technology and engineering. For this reason,
attracting the MNCs’ investments involving high level of knowledge and technology to host
country do not suffice alone, but it is also required that those MNCs develop intensive
business relationships with the local firms and that the local firms have high level of
technological capabilities.
8.3. Policy Implications and Recommendations
As the another object of the study mentioned in section 1.2, this section will try to suggest
policy implications and recommendations for the Turkish automotive industry, in the light of
the data and findings obtained from long-lasting research conducted under the scope of the
thesis study. These should be read along with the findings given in the earlier chapters.
It appears that the Turkish automotive main and supply industry with their history of forty
years have succeeded in attaining significant amount of knowledge, technology and
capability especially in production area. The production proficiency established in a period
during which import-substitution industrialization strategy was implemented and made only
a limited development has started to develop in 1980s and reached an advanced level
especially after the second half of 1990s. Now, the priority issue for the firms in the supply
industry is to launch R&D activities, to follow closely the technology developing rapidly in

381
the sector or in their product ranges, to achieve proficiency in product design, and to
establish collaboration with the main industry companies at home or abroad in order to
achieve all these priority issues. Since the buyer-supplier collaboration has the potential to
trigger KTTs to the firms in the supply industry, it paves the way for notching up the R&D
and innovation activities of these firms and their technological capabilities concerning
production process and product design to the next level. Given the fact that such transfers
benefit both sides, the sooner such collaboration activities established is the better.
Moreover, with a view to increasing KTTs to the domestic firms in Turkish supply industry
in quantity and quality, the ways and opportunities to develop further the technological
collaboration with the MNCs and foreign firms abroad should be sought, and the existing
collaboration should be moved to next levels. In this context, the main and supply industry
firms in Turkey should take part in the joint projects to enhance their technology and know-
how with foreign companies abroad, by using the world-wide business channels and contacts
of the MNCs in Turkey.
It has been determined that the Turkish automotive industry has specialized in, focused on
and accumulated knowledge about the production of commercial vehicles rather than
personal cars. In this area, the main and supply industry firms seem powerful as a result of
the production, technology, R&D and design capabilities and able to compete in the
international markets. Therefore, it appears that Turkey maintains to be the production base
of the commercial vehicles in the medium term, even able to create her own global
trademark in the field. To this end, it would be highly beneficial in terms of exist in the
global market in the long run and to utilize scale economies if strategic collaboration is
established among the AMMs producing commercial vehicles, although it seems good for
them to compete among themselves in the domestic and overseas markets in the short term.
Despite the fact that university-industry-public collaboration has developed in Turkey in
recent years, the information gathered depict that the relationships of both the main industry
and the supply industry firms with the universities are still rather poor. For this aim,
especially within the framework of the university-industry-public collaboration, it is essential
that the dedicated, extensive and planned joint projects and road maps for the industry be
devised, by following closely and analysing the strategic and technological advancements in
world.
The foundation of the global competitive power is quality, qualified and specialized
workforce. Establishment of automobile engineering departments in some universities in

382
Turkey recently is considered a positive development by the industry in this respect. Yet, the
industry chooses the staff it needs among the successful university graduates and gaining the
requested experience and practice by the said staff takes place in the medium and long run,
via training and participation in various projects. Schooling and raising the quality, specialist
and qualified engineers and R&D staff required by the sector in a short time could be
possible by not only delivering theoretical education as has long been practiced by the
universities, but also through delivering practical and on-the-job training within university-
industry collaboration. For these reasons, it is mandatory that the government attach
importance to raise qualified workforce specialized in the subject area, both at the
universities and at the vocational high schools and devise long-term strategic planning, for
raising and schooling the personnel such as engineers, R&D staff, technicians, etc.
Therefore, realizing the required arrangements at once, based on the examples of the
countries who display superior success in this respect, such as Germany, Japan, France,
South Korea, etc., would also enhance the competitive power of the industry.
It is undeniable that the government's incentives for R&D, investment and export (subsidies
such as TUBITAK, TEYDEB, KOSGEB, SANTEZ) are of critical importance in terms of
increasing the technological capabilities and competitive powers of the main and supply
industry firms. Especially the R&D Law no. 5746, enacted in 2008, is a highly critical step
in this respect, and it has been determined that the companies who did not or could not
perform R&D activities before now have launched their R&D activities and that most of the
AMMs have established their separated R&D centers, all thanks to the supports provided by
the said law. Under this law, two basic rules to benefit from the tax incentives granted for
R&D are (i) existence of an individual R&D building separate from the business
establishment and (ii) recruitment of minimum 50 equivalent R&D personnel to work at that
building. While it seems difficult for large-scale companies to benefit from the law due to
those two basic rules, it seems impossible for the small and medium-scale (SME) supply
industry firms for the time being. This constitutes a considerable obstacle in front of the
firms to benefit from the law, especially given the fact that the majority of the firms in the
automotive supply industry falls within SME category. Yet, the fact that only a few firms in
supply industry have adequate R&D capabilities is expressed by the AMMs interviewed. The
findings of the econometric analyses in Chapter 6 point out that gaining R&D capability by
the supplier firms is of vital importance for establishing collaborations with other companies
and realizing KTTs from the customers to the firms in supply industry (see Table 6.29).
When it is remembered that the public incentives granted for R&D have a positive effect on
launching R&D activities (see Table 6.28), it may be required to change the existing R&D
383
incentive system, taking the necessities of the automotive supply industry firms into account.
Also, the level of the incentives and project subsidies remain too low compared to the
developed countries. In this context, it is required that the amount of these incentives and
subsidies be increased; the small- and medium-scale firms be made benefit from the R&D,
investment and export incentives more effectively; and that the incentives be widespread via
various associations or organizations in the industry. In addition, it is important for these
firms cluster and act jointly, adjust their production capacities accordingly and be in constant
interaction with each other, in order to increase their global competitive power.
Another significant finding obtained under the scope of the study is that, since personal cars
are considered luxury goods in Turkey, more tax is levied on the new and high-engine power
cars, which, in turn, decreases the total demand for the new, environment-friendly and
advanced technologies248
and therefore restricts the innovation and R&D activities with
respect to these products at home. In contrast to the tax policies applied in Turkey, the
policies in the developed and rival countries, such as levying less tax on electrical and hybrid
vehicles, levying higher taxes on aged vehicles older than a certain limit, levying taxes on
vehicles not based on their engine power but on their exhaust emission values, etc. increase
the total demand for the new, environmentally friendly and technological products and
therefore keep the R&D and innovation activities alive in these areas by promoting them.
Therefore, it would be critical to apply also in Turkey the similar tax policies aiming at
increasing the total demand that would promote the said activities and ensure equivalent
competition conditions with the rival countries, on condition that at least total tax income is
kept constant. This kind of policies may also play an important role in order to attract MNCs
with advanced technology into the country and to enhance KTTs to domestic firms.
The labour cost especially wages paid to the white-collar in the Turkish automotive industry
is not so inexpensive, although it remains behind what is applicable in Europe and USA. It
has been determined that, especially when compared to the Eastern Europe countries and
newly developing markets (such as China, India, Malaysia and Thailand), the labour cost is
considerably high and that Turkey has no wage advantage any more over those countries.
For the time being, Turkey offsets this disadvantage with her know-how, R&D, more quality
products and workforce. That is, the expression “quality and inexpensive workforce” is not
valid anymore for Turkey. Even if this case seems still as an advantage for Turkey in the
short run, it is inevitable that continuously increasing quality and technology levels of those
248
Such as electrical and hybrid cars, products less harmful to the environment, active safety assistance systems
for driver etc.

384
countries combined with their inexpensive workforce structures would pose a major threat
against Turkey in the medium and long run.
Production of a vehicle in the automotive main industry is possible by bringing together vast
amount of parts, systems and processes. Today, it is impossible for just one company to
produce a vehicle from scratch. As a result of the information gathered from the interviews,
it is determined that the AMMs stand at the top of the pyramid as planners and organizers,
manufacturing basic powertrain parts, determining the basic designs and performing
developments for the product, and identifying specifications of the parts to be supplied. In
this context, other systems and parts required by the main industry are manufactured by the
direct suppliers (1st tier suppliers) according to specifications determined by the main
companies. For these reasons, we are of the opinion that specializing in just one of the
thousands of the parts composing a vehicle; developing new products; acquiring high level
of knowledge and technology in any part; developing test equipment concerning the
products; and focusing on the design, R&D and engineering activities or rendering service in
these fields are more strategic ways to gain superiority in the sector, instead of trying to
produce a complete vehicle from scratch at home. In this respect, assuming a role and
specializing in the development of, for instance, knowledge-intensive new technologies
concerning the robots and lasers utilized in the vehicle production lines, and concerning the
batteries that are the most critical component of the electrical vehicles, or concerning active
and passive safety systems etc., creates, from our point of view, considerably much more
value added and bear essentially vital importance.
It has been understood from the interviews that only a few MNCs we call as global-mega
suppliers (such as BOSCH, DELPHI, DENSO, AUTOLIV, AVL, SIEMENS and MAGNA)
are dominant globally in the production of the specific system parts like steering systems,
braking, safety, electrical and electronic parts and that they supply these major systems to all
the global AMMs (OAMM). At the same time, it is observed that certain MNCs in global
automotive supply industry, such as BOSCH and SIEMENS producing brake systems,
electrical and electronic parts like electronic control units and processors, have become
globally the single and common supplier of the global AMMs in these fields, and that
reached a greater structure than some of the global AMMs. In addition, the market composed
by these MNCs (global mega-suppliers) has oligopolistic market characteristics. They
conduct all kinds of R&D, design, product development, etc. activities at the MNC
headquarters and work with large number of R&D personnel and a quite high R&D budget.
For instance, the number of the R&D personnel of the BOSCH only is greater than the total

385
R&D personnel of the Turkish automotive industry, and the company's R&D budget is also
higher than the total budgets of the firms operating in main and supply industry in Turkey.
For these reasons, it seems rather improbable to develop new products and to become
competitive in these fields in the short and medium terms. In our opinion, certain fields such
as plastic injection, sheet metal parts, lighting system parts, rubber parts and interior
equipment seem more open to develop for the Turkish automotive supply industry.
As we mentioned before, the Turkish automotive main industry has no dominant power over
the major system parts (such as powertrain, engine, steering, safety and electronic
processor) that constitute the most important input costs of a vehicle, and that the industry
has to import these parts from the MNCs as foreign partners and/or global mega suppliers
abroad. These are highly expensive parts that have been manufactured by global AMMs
and/or global-mega suppliers as a result of long-term R&D activities, involving extensive
knowledge and know-how. In order to increase our automotive industry’s competitive and
technological level, to attain the desired costs and finally to create its own trademark, it is
necessary to develop and manufacture such knowledge-intensive parts domestically. This, in
turn, seems probable only in the long run (10-15 years) by ensuring KTTs as a result of the
strategic collaborations established by the MNCs abroad and increasing the investments in
the R&D and innovation activities, as well as know-how accumulation. As long as such
activities are not performed, it seems rather unlikely to produce such parts that require
superior production, know-how and technological capabilities as well as higher investment
costs domestically in the short and medium term. This leads to the fact that the automotive
industry would remain dependent on abroad in the medium term and that it may lose its
advantages to the newly-developing markets.
It has been determined that the production of the labour-intensive commercial vehicles (such
as buses, trucks, light commercial vehicles) has shifted from the west to the east, to countries
such as Eastern Europe, Turkey, India and China, due to the increase in the operating costs,
economic recessions and production shrinkage in the developed countries due to the recent
global financial crisis. It has been expressed during the interviews with the AMMs that the
MNCs regard Turkey as a production base due to her close proximity to the Middle East and
EU countries; her quality and relatively inexpensive workforce; her inexpensive raw
materials; quality and strong supply industry; and that they invest in Turkey as a result. For
these reasons, it is observed that nowadays Turkey has attained a commercial vehicle
production base status in the automotive industry. From the MNCs’ point of view, investing
in Turkey means that they expect from Turkey to display significant progress and

386
contributions in the companies' battle they are waging against their competitors in the Far
East and Asia. Today, it is clearly foreseen that, as well as the developed countries leading
the automotive industry, the manufacturers located in the developing Far East and Asia
countries will direct the world automotive industry in near future. We are of the opinion that
the large domestic markets of such developing countries with their more dynamic
economies, their domestic market demands growing day by day (with increase in the income
levels), and their inexpensive workforce and raw material will strengthen their increased
export potential further, and that in this way, by increasing their quality levels and
technological skills, they would become serious competitors against Turkey in near future.
In the light of the findings obtained from the interviews, it has been determined that
especially Far East and Asia countries provide the MNCs with significant incentives for FDI
investments, but on condition that the MNCs realize the conditions to introduce new
technologies in their countries and to establish various technological collaborations with the
local companies. In this sense, it would be important for the Turkish government to play a
similar regulatory role in the industry and to develop strategic planning in the areas such as
increasing the skills and capabilities of the local firms, ensuring accumulation of knowledge
and providing KTTs from the MNCs; and to develop strategic investment decisions. This
would also facilitate Turkey's ability to compete under equal conditions against the rival
countries.
It is observed that the newly developing markets (such as India, Malaysia, Taiwan and
Thailand), first of all China, would become a serious threat against the Turkish automotive
industry in near future, due to their competitive levels. It is highly probable for the reasons
we mentioned before that the MNCs would shift their plants and certain departments (such
as R&D and design) from headquarters to such countries in near future. It has been
determined that such countries have not been able to realize the necessary regulations and
quality criteria in the vehicle production yet, but that they improve and develop themselves
continuously in those areas, raising their technological capabilities. In addition, it is observed
that they are able to produce high number of vehicles and sell them at considerably lower
prices thanks to their advantages as significantly low costs and large domestic markets.
Especially China seems to become the world’s automotive production base in the medium
and long term (10-15 years) because of her significant advantages such as low production
and raw material costs, and large domestic market. Moreover, China seems that she will be
the most serious rival of Turkey in terms of becoming the R&D and excellence centre target
by realizing intensive KTTs from the MNCs and developing her technological capability.

387
The fact that these newly developing markets, for the time being, are following Turkey
behind in the areas of technology, quality, know-how and qualified workforce, appears as an
advantage for Turkey. Nevertheless, the ability of the Turkish automotive industry to
maintain its advantages and status will certainly depend on its continuous self-development,
becoming a design, test, R&D and excellence base, creating its own trademark, enhancing its
technological capability level through KKTs from the MNCs and producing technological
products that create high value added. Otherwise, it appears that it is highly probable for the
Turkish automotive industry to experience a serious bottleneck in near future (10-15 years).
With globalization process, now the market is the world from the companies’ point of view,
and competition is realized on a global scale. What is important from the economic
standpoint is to produce the best at the least cost in the world. In this context, benefiting from
the scale economies is vital for both the main industry and the supply industry. The long-
term costs of a company producing several millions of vehicles (parts) in a year (such as
Toyota) and a company producing ten thousand or a hundred thousand of vehicles (parts) in
a year are not the same, and the scale economies provides the former with significant
superiorities over the latter in terms of competition. For these reasons, it is required that the
newly and rapidly developing countries of the Far East and Asia should not be considered as
a threat against our automotive sector; instead, the AMMs and suppliers in Turkish
automotive industry should establish production bases in those countries, by investing in
them with strategic collaborations, and thereby they should turn the threat into an
opportunity. Especially, the capabilities and facilities the countries possess, such as
inexpensive labour force, raw material resources, large domestic market, and possibility to
export to the surrounding countries, should be put to good use.
Today, in the automotive industry production, Turkey has achieved the rank of 16 in the
world and 7 in Europe. According to the information obtained from the interviews,
maintenance and sustainability of the current success of the industry would, in the medium
and long term, depend on adopting a target of becoming a design and R&D base rather than
being a production base, and attaining the target in the medium term. In other words, just
being a production or assembly base would mean nothing for the Turkish automotive
industry in near future249
. The situation is such that nowadays China has become a global
249
For instance, the most important part (hardware) of the electrical vehicles that have been started to be
produced by some AMMs with foreign capital in Turkey is battery. It involves intensive knowledge and
technology and its cost is very high in the total inputs of the vehicles. This battery is imported from abroad, just
as the powertrain parts of other vehicles being produced in Turkey, and assembled into the vehicles. These parts
have been developed by a few MNCs as a result of long years of advanced R&D studies that costs billions of
dollars, such parts involve extremely intensive knowledge and technology. Therefore, assembling of these parts
into the vehicles by importing at home means actually nothing to be production base.

388
production base for many products and MNCs, and it is possible to see the mark "Made in
China" almost on all products worldwide. However, design, basic R&D, and development
activities of all these products that are manufactured in China are conducted in the
headquarters of MNCs concerned in developed countries, and therefore, such products also
bear the marks “Designed in XXX” and “Developed in XXX”250
. This clearly reveals the fact
that the knowledge-intensive products with high value added are designed and developed in
the developed countries and the production process which means the labour-intensive part is
realized in the newly developing markets where inexpensive labour force is available. The
highest value added part within the products being produced in such developing countries is
the design and development part of the products that are knowledge-intensive, and this value
turn back to the developed countries at the end via transfer of the profits. Therefore, the
design, development, quality, technology, know-how and production cost of the product,
rather than the manufacturing, have become more important. In the present situation, the
most vital product is the knowledge from the viewpoint of both the companies and the
governments; generating knowledge and possessing it becomes the most important source of
power. Thus, it has now become mandatory for Turkey that the new and advanced
technologies be followed and observed, that those technologies be obtained from the MNCs
and be developed further, and that high value-added, knowledge-intensive products be
developed through our own R&D and innovation activities in the collaboration of university-
industry-public. In other words, the case could be summarized clearly by stating that, in
today’s global economy, if you know how to produce best product demanded by the market
at lowest cost, then where you produce the product is not so important any more.
In conclusion, Turkey should become a country where accumulation of knowledge is
realized, by attaining a status of being a design and R&D base that creates high value added
across Europe, along with being a competitive, developed automotive production base in the
world. To this end, it is necessary to develop long-term strategic plans which, within the
collaboration of public-industry-university, will ensure developing the technological
capabilities and absorptive capacities of the domestic firms; realizing future foresights and
projections; providing accumulation of knowledge and therefore realizing more
technological innovations and developments at home. For this aim, global technologies
should be followed and observed; FDI investments to provide advanced technology and
knowledge accumulation should be attracted to home; that state-of-the-art and latest
knowledge and technologies are transferred to home; and that they are well absorbed.
Otherwise, the foreign capital and technology would go to the developing rival countries
250
Here, XXX (USA, Germany, France, England, etc.) expresses the developed countries other than China,
where the product design and development is realized.

389
where it can find inexpensive workforce, engineering and raw materials, high investment
incentives such as China, India, etc., and thus current advantage would be lost. In sum,
today, the Turkish automotive industry is a developing industry that is one step ahead in
global sense; however, her possibility to maintain, sustain and push forward that
advantageous position further seem to depend on developing new, knowledge- and
technology-intensive products that have high value added at home by means of R&D and
innovation activities. This, in turn, could be possible only by closely following the global
technologies, by learning them via transferring the know-how involved, and by ensuring
accumulation of knowledge at home. In other words, it is not necessary to reinvent the
wheel; instead, to be informed of and to have heard of the fact that the wheel has been
invented, to know how it is produced, to develop it and to produce the better one or its
alternative should be the targeted goal. Turkey appears that she is capable of achieving that
with her geo-political location; her human capital, infrastructure, logistics facilities; her
industrial structure integrated into Europe via customs union; her 50 years of automotive
production culture; knowledge accumulation; strong main and supply industry, and her
vision.
8.4. Implications for Further Research Firstly, econometric investigation for the technology spillovers conducted in Chapter 3
should be repeated once more recent firm data become available. The panel data used in the
analysis is only four years; however it may take a long time for technology spillovers to
produce their final impact on the productivity level of firms. Secondly, this thesis contributes
to the literature as one of the first empirical evaluations to understand the main channels and
determinants of KTTs between AMMs and suppliers in the Turkish automotive industry. The
interviews with AMMs and survey conducted amongst suppliers in the industry, and the
econometric analysis conducted here using data collected via the survey is the first study of
its kind for the industry. For further research, same study can be repeated in the near future
in order to test accuracy of such study, and this could shed more light as whether KTTs
actually exist or not. Moreover, similar sector specific case studies using a different target
industries or different research methodologies should be undertaken to address the issues
industries will have to tackle in the next decades. Furthermore, the findings of this study in
terms of determinants of KTTs, R&D and innovation activities, collaborations among firms
etc. can be developed as separate hypotheses, and then they can be tested empirically as a
further research.

390
REFERENCES
Aitken, B. J. and Harrison, A. E. (1991) “Are There Spillovers from Foreign Direct
Investment? Evidence from Panel Data for Venezuela”, Mimeo, Cambridge, MA:
MIT, Washington D. C. World Bank
Aitken, B. J., Harrison, A. E. and Lipsey, R. E. (1996) "Wages and Foreign Ownership: A
Comparative Study of Mexico, Venezuela, and the United States", Journal of
International Economics, 40, 345-71
Aitken, B. J. and Harrison, A. E. (1997) “Do Domestic Firms Benefit from Foreign Direct
Investment? Evidence from Panel Data”, Mimeo, Columbia University
Aitken, B. J., Hanson, G. H. and Harrison, A. E. (1997) "Spillovers, Foreign Investment, and
Export Behavior", Journal of International Economics, 43 (1-2), 103-32
Aitken, B. J. and Harrison, A. E. (1999) "Do Domestic Firms Benefit from Direct Foreign
Investment? Evidence from Venezuela", American Economic Review, 89 (3), 605-18
Akarsoy, T. A. (2005) “Otomotiv Ana Sanayii Teknolojik Durum Değerlendirme Çalışması:
2002 Haziran’ından Günümüze Kaydedilen Gelişmeler, (in Turkish), Bilim
Teknoloji İnovasyon Politikaları Tartışma Platformu
Akpınar, A. (2001) “Turkey’s Experience with Bilateral Investment Treaties”, Paper
Presented at the OECD Investment Compact Regional Roundtable, May 28–29,
Dubrovnik
Aksoy, Y. O. (2008) “Technology Spillovers through Foreign Direct Investment in Turkish
Manufacturing Industry”, unpublished MSc thesis, METU, Ankara

391
Alıcı, A. A. and Ucal, Ş. M. (2003) “Foreign Direct Investment, Exports and Output Growth
of Turkey: Causality Analysis”, Presented at the European Trade Study Group, 11-
13 September, Madrid
Almeida, R. and Fernandes, A. M. (2008) “Openness and Technological Innovations in
Developing Countries: Evidence from Firm-Level Surveys”, Journal of
Development Studies, 44, 701-27
Alvaro, L., Chanda, A., Kalemli-Ozcan, S. and Sayek, S. (2004) “FDI and Economic
Growth: The Role of Local Financial Markets”, Journal of International Economics,
64 (1), 89-112
Amemiya, T. (1981) “Qualitative Response Models: A Survey”, Journal of Economic
Literature, 19, 1483-1533
Anfara, V. A. and Mertz, N. T. (2006) Theoretical Frameworks in Qualitative Research,
Sage Publications Inc., Thousand Oaks, CA
Aslanoğlu, E. (2000) “Spillover Effects of Foreign Direct Investments on Turkish
Manufacturing Industry”, Journal of International Development, 12, 1111-30
Audretsch, D. B. and Feldman, M. (1996) “Knowledge Spillovers and the Geography of
Innovation and Production”, American Economic Review, 86 (3), 630-40
Audretsch, D. B. (1998) “Agglomeration and the Location of Innovative Activity”, Oxford
Review of Economic Policy, 14, 18-29
Ayvaz, Y., Baldemir, E. and Ürüt, S. (2006) “Yabancı Sermaye Yatırımlarının Verimlilik ve
Kalkınmaya Etkilerinin Ekonometrik İncelemesi”, Yönetim ve Ekonomi, 13, 177-86
Bailey, K., D. (1987) Methods of Social Research, 3rd ed., Collier Macmillan Publishers,
London
Banga, R. (2003) "The Differential Impact of Japanese and U.S. Foreign Direct Investments
on Exports of Indian Manufacturing", Working Paper, Delhi School of Economics,
India

392
Barrios, S. and Strobl, E. (2002) "Foreign Direct Investment and Productivity Spillovers:
Evidence from the Spanish Experience", Weltwirtschaftliches Archiv, 138, 459-81
Barrios, S., Görg, H. and Strobl, E. (2003) "Explaining Firms' Export Behavior: R&D,
Spillovers and the Destination Market", Oxford Bulletin of Economics and Statistics,
65 (4), 475-96
Barro, R. and Sala-i-Martin, X. (1995) Economic Growth, McGraw-Hill, Cambridge, MA
Barry, F., Görg, H. and Strobl, E. (2005) “Foreign Direct Investment and Wages in Domestic
Firms in Ireland: Productivity Spillovers Versus Labour-Market Crowding Out”,
International Journal of the Economics of Business, 12, 67-84
Bartlett, M. S. (1954) “A Note on the Multiplying Factors for Various Chi Square
Approximations”, Journal of the Royal Statistical Society, 16 (series B), 296-8
Basant, R. (1997) “Technology Strategies of Large Enterprises in Indian Industry, Some
Explorations”, World Development, 25, 1683-1700
Bedir, A. (1999) “Gelişmiş Otomotiv Sanayilerinde Ana-Yan Sanayi İlişkileri ve
Türkiye’de Otomotiv Yan Sanayinin Geleceği”, (in Turkish), SPO thesis of
expertise, No: 2495, Ankara
Bell, M. and Pavitt, K. (1997) “Technological accumulation and industrial growth: contrasts
between developed and developing countries”, Technology, Globalisation and
Economic Performance, in Daniele, A. and Michie, J. (eds), Cambridge University
Press
Bennett, D. (2002) Innovative Technology Transfer Framework Linked to Trade for UNIDO
Action, UNIDO, Vienna
Berger, M. (2005) “Upgrading the System of Innovation in Late-Industrialising Countries –
The Role of Transnational Corporations in Thailand’s Manufacturing Sector”,
Unpublished PhD. Thesis, Christian-Albrechts-Universität, Mathematisch-
Naturwissenschaftlichen Fakultät

393
Bergman, M. M. (2008) Advances in Mixed Methods Research: Theories and Applications,
London, Sage Publications Ltd.
Bernard, M. and Ravenhill, J. (1995) “Beyond Product Cycles and Flying Geese:
Regionalization, Hierarchy, and the Industrialization of East Asia”, World Politics,
47, 187-237
Bernard, A. B. and Jones, C. I. (1996) “Technology and Convergence”, Economic
Journal, 106, 1037-44
Bertinelli, L., Pamukçu, M. T., Strobl, E. (2006) “Technology Spillovers due to Foreign
Ownership and Productivity of Domestic Firms: Analyzing the Evidence”, In
Selected Papers from the 13th International Conference of ERF, Economic Research
Forum (ERF), Egypt, 187-230
Biber, S. N. H. (2010), Mixed Methods Research: Merging Theory with Practice, New York,
Guilford Press
Bigsten, A. P., Collier, S., Dercon, M., Fafchamps, B., Gauthier, J.W., Gunning, A.,
Isaksson, A., Oduro, R., Oostendorp, C., Pattillo, M., Soderbom, E Teal, ve A.
Zeufack. (2002) “Do African Manufacturing Firms Learn from Exporting?”, Centre
for the Study of African Economies Working Paper Series, 2002-09, Oxford
University, Oxford
Blalock, G. (2001) “Technology from Foreign Direct Investment: Strategic Transfer through
Supply Chains”, Mimeo, Haas School of Business, University of California,
Berkeley
Blalock, G. and Gertler, P. (2003) "Technology from Foreign Direct Investment and Welfare
Gains through the Supply Chain", Working Paper, Department of Applied
Economics and Management, Cornell University, Ithaca, New York
Blalock, G. and Gertler, P. (2004) “Firm capabilities and Technology Adoption: Evidence
from Foreign Direct Investment in Indonesia, Working Paper, Department of
Applied Economics and Management, Cornell University, Ithaca, New York

394
Blomström, M. and Persson, H. (1983) "Foreign Investment and Spillover Efficiency in an
Underdeveloped Economy: Evidence from the Mexican Manufacturing Industry",
World Development, 11 (6), 493-501
Blomström, M. (1986) "Foreign Investment and Productive Efficiency: The Case of
Mexico", Journal of Industrial Economics, 35 (1), 97-110
Blomström, M. and Wolff, E. N. (1994) "Multinational Corporations and Productive
Convergence in Mexico", In Baumol, W. J., Nelson, R. R. and Wolff, E. N. (eds.),
Convergence of Productivity: Cross National Studies and Historical Evidence.
Oxford: Oxford University Press
Blomström, M., Lipsey, R. E. and Zejan, M. (1994) “What Explains Developing Country
Growth?’, NBER Working Paper, No. 4132
Blomström, M. and Kokko, A. (1997) “How Foreign Investment Affects Host Countries”,
Policy Research Working Paper, No 1745, The World Bank: Washington, DC
Blomström, M. and Kokko, A. (1998) “Multinational Corporations and Spillovers” Journal
of Economic Surveys, 12 (2), 247-77
Blomström, M. and Kokko, A. (1999) “Foreign Direct Investment and Technology Transfer:
A Survey”, International Conference on Asian-Europe on the Eve of the 21st
Century, Chulalongkorn University, Bangkok, Thailand
Blomström, M. and Sjöholm, F. (1999) "Technology Transfer and Spillovers: Does Local
Participation with Multinationals Matter?", European Economic Review, 43 (4-6),
915-23
Blomström, M. Globerman, S. and Kokko, A. (2001) “The Determinants of Host Country
Spillovers from Foreign Direct Investment: Review and Synthesis of the Literature”
in Pain, N. (ed.) Inward Investment, Technological Change and Growth, London,
Palgrave, 34-66
Borensztein, E., Gregorio, J. and Lee, J.-W. (1998) “How Does Foreign Direct Investment
Affect Economic Growth?”, Journal of International Economics, 45, 115–35

395
Bosco, M. G. (2001) "Does FDI Contribute to Technological Spillovers and Growth? A
Panel Data Analysis of Hungarian Firms", Transnational Corporations, 10(1), 43-68
Braga, H. and Willmore, L. (1991) “Technological Imports and Technological Effort: An
Analysis of their Determinants in Brazilian Firms”, Journal of Industrial Economics,
39, 421-32
Briggs, S. R. and Cheek, J. M. (1986) “The Role of Factor Analysis in the Development and
Evaluation of Personality Scales”, Journal of Personality, 54, 106-48
Cameron, A. C. and Trivedi, P. K. (2005) Microeconometrics: Methods and Applications,
New York, Cambridge University Press
Cantwell, J. (1989) Technological Innovation and Multinational Corporations, Oxford,
Blackwell
Cantwell, J. (1993) “Corporate Technological Specialization in International Industries”, in
Casson, M. C. and Creedy, J. (eds.) Industrial Concentration and Economic
Inequality, Edward Elgar
Carson, D., Gilmore, A., Perry, C. and Gronhaug, K. (2001) Qualitative Marketing
Research, London, Sage Publications Ltd.
Castellani, D. and Zanfei, A. (2002) “Multinational Companies and Productivity Spillovers:
Is There a Specification Error?”, Working Paper, Mimeo, University of Urbino, Italy
Caves, R.E. (1971) “International Corporations: The Industrial Economics of Foreign
Investment”, Economica, Vol. 38 (149), 1-27
Caves, R. E. (1974) "Multinational Firms, Competition, and Productivity in Host-Country
Markets" Economica, 41 (162), 176-93
Caves, R. E. (1996) Multinational Enterprise and Economic Analysis, 2nd ed. Cambridge:
Cambridge University Press

396
Chuang, Y. and Lin, C. (1999) "Foreign Direct Investment, R&D and Spillover Efficiency:
Evidence from Taiwan's Manufacturing Firms", Journal of Development Studies,
35(4), 117-37
Cohen, W. M. and Levinthal, D. A. (1990) “Absorptive Capacity: A New Perspective on
Learning and Innovation”, Administrative Science Quarterly, 35 (1), 128-52
Cohen, W.M. (2010) “Fifty Years of Empirical Studies of Innovative Activity and
Performance”, Economics of Innovation, 1, in Hall, B.H. and N. Rosenberg (eds.),
North Holland, 129-210
Collins, H. M. (2001) “Tacit Knowledge, Trust and the Q of Sapphire”, Social Studies of
Science, 31 (1), 71-85
Corden, W. M. (1967) “Protection and Foreign Investment”, Economic Record, 43, 209-32
Crespo, N. and Fontoura, M. P. (2007) “Determinant Factors of FDI Spillovers - What D o
We Really Know”, World Development, 35 (3), 410–25
Creswell, J. W. (2009) Research Design: Qualitative, Quantitative, and Mixed Methods
Approaches, Sage Publications Inc., Thousand Oaks, CA
Creswell, J. W. (2010) Designing and Conducting Mixed Methods Research, 2nd ed., Sage
Publications Inc., Thousand Oaks, CA
Cronbach, L. J. (1951) “Coefficient Alpha and the Internal Structure of Tests”,
Psychometrika, 16 (3), 297-334
Çelikel, T. A. (2009) “Factors Affecting Research and Development (R&D) Collaboration of
Multinational Enterprises (MNEs) and Their Local Partner Firms: A Case Study of
Turkish Automotive Industry”, Unpublished PhD. thesis, Department of
Contemporary Management, Işık University, Istanbul
Çetin, C. (2009) “Determinants of Technology Transfer in Developing Economies: the Case
of Turkish Manufacturing Industries”, unpublished MSc thesis, METU, Ankara

397
Damijan, J. P., Majcen, B., Knell, M. and Rojec, M. (2001) "The Role of FDI, Absorptive
Capacity and Trade in Transferring Technology to Transition Countries: Evidence
from Firm Panel Data for Eight Transition Countries", UN Economic Commission
for Europe, Geneva
Das, S. (1987) “Externalities, and Technology Transfer through Multinational Corporations:
A Theoretical Analysis”, Journal of International Economics 22, 171-82
Dayar, E. and Pamukçu, T. (2011) “Analysis of Foreign Ownership, R&D and Spillovers in
Developing Countries: Evidence from Turkey” Paper presented at 17th International
conference of Economic Research Forum, 20-22 March, 2011, Antalya
De Negri, J. A. and Turchi, L. M. (eds.) (2007) Technological innovation in Brazilian and
Argentine Firms, Institute for Applied Economic Research, Brazil
Devellis, R. F. (2003) Scale Development: Theory and Applications, 2nd ed., Sage
Publications, Thousand Oaks, CA
Dicken, P. (2007) Global Shift: Mapping the Changing Contours of the World Economy, 5th
ed., Sage Publications Ltd., London, UK
Djankov, S. and Hoekman, B. (1998) “Avenue of Technology Transfer: Foreign Investment
and Productivity Change in the Czech Republic”, CEPR Discussion Paper No. 1883
Djankov, S. and Hoekman, B. (2000) "Foreign Investment and Productivity Growth in Czech
Enterprises", World Bank Economic Review, 14 (1), 49-64
Dosi, G. (1988) “Sources, Procedures and Microeconomic Effects of Innovation,”
Journal of Economic Literature, 26 (3), 1120-71
Drever, E. (2003) Using Semi-structured Interviews in Small-scale Research: a teacher's
guide, Scottish Council for Research in Education, The SCRE Centre
Driffield, N. (2001) "The Impact on Domestic Productivity of Inward Investment in the UK",
Manchester School, 69 (1), 103-19

398
Driffield, N., Munday, M. and Roberts, A. (2002) "Foreign Direct Investment, Transactions,
Linkages, and the Performance of the Domestic Sector", International Journal of the
Economics of Business, 9 (3), 335-51
Dunning, J. (1958) American Investment in British Manufacturing, London; George Allen
and Unwin
Dunning, J. (1979) “Explaining Patterns of International Production: In Defence of the
Eclectic Theory”, Oxford Bulletin of Economics and Statistics, 41 (2), 269–95
Dunning, J. (1993) Multinational Enterprises and the Global Economy, Wokingham:
Addison-Wesley Publishing Company, New York
Dutz, M., Us, M., Yılmaz, K. (2005) “Turkey's Foreign Direct Investment Challenges:
Competition, the Rule of Law, and EU Accession”, World Bank and the Centre for
Economic Policy Research
Eden, L., Levitas, E. and Martinez R. J. (1996) “The Production, Transfer and Spillover of
Technology: Comparing Large and Small Multinationals as Technology Producers”,
Small Business Economics, 9, 53–66
Ekmekçi, U. (2009) “Determinants of Knowledge Transfer from Foreign Direct
Investments to Local Supplier Firms: The Case of Turkish Automotive Industry”,
Unpublished PhD thesis, Department of Management Engineering, Institute of
Science and Technology, Istanbul Technical University, Istanbul
Ellet, W. (2007) The Case Study Handbook, How to read, Discuss, and Write Persuasively
Cases, Harvard Business School Press, Massachusetts, Boston
Erdil, E., Pamukçu, T. M., Erden, Y., Göksidan, H. T., and Kepenek, E. (2011) “Türkiye
ekonomisinde yabancı sermayeli firmaların Ar-Ge etkinliklerinin analizi” (Analysis
of research and development (R&D) activities of foreign firms in the Turkish
Economy)”, (in Turkish), Türkiye Uluslararası Yatırımcılar Derneği (YASED) için
hazırlanan rapor (report prepared for YASED), pp. 350

399
Erdilek, A. (1986) “Turkey’s New Open-Door Policy of Direct Foreign Investment: A
Critical Analysis of Problems and Prospects”, METU Studies in Development, 13,
171–91
Erdilek, A. (2003) “A Comparative Analysis of Inward and Outward FDI in Turkey”,
Transnational Corporations, 12 (3), United Nations Conference on Trade and
Development, 79-105
Ernst, D. and Kim, L. (2002) “Global Production Networks, Knowledge Diffusion, and
Local Capability Formation”, Research Policy, 31, 1417–29
Evenson, R. E. and Westphal, L. E. (1995) “Technological Change and Technology
Strategy”, in Behrman, J. and Srinivasan, T. N. (ed.), Handbook of Development
Economics, 3, Elsevier Science Publishers, Amsterdam, 2211-99
Findlay, R. (1978) “Relative Backwardness, Direct Foreign Investment, and the Transfer of
Technology: A Simple Dynamic Model” Quarterly Journal of Economics, 92, 1-16
Froman, R. D. (2001) “Elements to Consider in Planning the Use of Factor Analysis”,
Southern Online Journal of Nursing Research, 2 (5), 1-22
Gabriel, P. P. (1967) The International Transfer of corporate Skills: Manager Contracts in
Less Developed Countries, Cambridge, Mass.; Harvard University Press
George, D. and Mallery, P. (2003) SPSS for Windows step by step: A simple guide and
reference, 4th ed., Allyn and Bacon, Boston
George, A. L. and Bennett A. (2005) Case Studies and Theory Development in the Social
Sciences, MIT Press, Cambridge, Massachusetts, London, England
Germidis, D. (1977) “Transfer of Technology by Multinational Corporations” Paris,
Development Centre of the OECD
Gerring, J. (2007) Case Study Research, Principles and Practices, Cambridge University
Press, New York

400
Ghosh, S. (2002) “Characteristics and Determinants of Technology Transfer to
Developing Countries”, Unpublished Ph.D. thesis, Boston University, Graduate
School of Arts and Sciences
Girma, S., Greenaway, D. and Wakelin, K. (2001) "Who Benefits from Foreign Direct
Investment in the UK?", Scottish Journal of Political Economy, 48 (2), 119-33
Girma, S. and Wakelin, K. (2001) “Regional Underdevelopment: Is FDI the Solution? A
Semi-Parametric Analysis”, GEP research paper 2001/11, University of Nottingham
Girma, S., Görg, H. and Pisu, M. (2003) "The Role of Exports and Foreign Linkages for FDI
Productivity Spillovers", Working Paper, University of Nottingham, United
Kingdom
Giroud, A. (2003) Transnational Corporations, Technology, and Economic Development:
Backward Linkages and Knowledge Transfer In South-East Asia, Cheltenham, UK,
Northhampton, MA, Edward Elgar
Glass, A. J. and Saggi, K. (1998) “International Technology Transfer and the Technology
Gap, Journal of Development Economics, 55, 369-98
Glass, A. J. and Saggi, K. (2002) "Multinational Firms and Technology Transfer",
Scandinavian Journal of Economics, 104 (4), 495-513
Globerman, S. (1979) "Foreign Direct Investment and 'Spillover' Efficiency Benefits in
Canadian Manufacturing Industries", Canadian Journal of Economics, 12 (1), 42-56
Goffin, K. and Koners, U. (2011) “Tacit Knowledge, Lessons Learnt and New Product
Development”, Journal of Product Innovation Management, 28 (2), 300-18
Gomm, R., Hammersley, M. and Foster, P. (2000) Case Study Method: Key Issues, Key
Texts, London, England, Sage Publications Inc.
Görg, H. and Greenaway, D. (2001), ‘Foreign Direct Investment and Intra-Industry
Spillovers: A Review of Literature’ Globalisation and Labor Market Programme,
Resarch Paper, 2001/37, Nottingham, U.K.

401
Görg, H. and Strobl, E. (2001) “Multinational Companies and Productivity Spillovers: A
Meta-Analysis”, Economic Journal, 111 (475), 723-39
Görg, H. and Strobl, E. (2002) "Spillovers from Foreign Firms through Worker Mobility:
An Empirical Investigation", GEP Research Paper 02/13. University of Nottingham,
UK
Görg, H. and Strobl, E. (2003) “Multinational Companies, Technology Spillovers and Plant
Survival”, Scandinavian Journal of Economics, 105 (4), 581-595
Görg, H., Strobl, E. and Walsh, F. (2003) "Why Do Foreign Firms Pay More? The Role of
On-the-job Training", GEP Research Paper 02/15, University of Nottingham, UK
Görg, H. and Greenaway, D. (2004) “Much Ado About Nothing? Do Domestic Firms Really
Benefit from Foreign Direct Investment?”, World Bank Research Observer, 19 (2),
171-97
Greenaway, D., Sousa, N. and Wakelin, K. (2004) "Do Domestic Firms Learn to Export
from Multinationals?", European Journal of Political Economy, 20 (4), 1027-1043
Greene, J. C. (2007) Mixed Methods in Social Inquiry (Research Methods for the Social
Sciences), Jossey-Bass, A Wiley Imprint, San Francisco, CA
Greene, W. H. (2008) Econometric Analysis, 6th ed., Prentice Hall, New York
Griffith, R. (1999) “Using the ADR Establishment Level Data to Look at the Foreign
Ownership and Productivity in the United Kingdom”, Economic Journal, 109, 416-
41
Griliches, Z. and Mairesse, J. (1995) “Production functions: The search for identification”,
NBER Working Paper, No 5067, NBER, Washington DC
Grosse, R. (1996) “International Technology Transfer in Services”, Journal of International
Business Studies, 27, 781-800

402
Grossman, G. M. and Helpman, E. (1991) Innovation and Growth in the Global Economy,
MIT press, Cambridge, MA, USA
Haddad, M. and Harrison, A. (1993) "Are There Positive Spillovers from Direct Foreign
Investment? Evidence from Panel Data for Morocco", Journal of Development
Economics, 42 (1), 51-74
Hair, J. F., Jr. Babin, B., Money A. H. and Samouel, P. (2003) Essential of Business
Research Methods, New Jersey, John Wiley and Sons Inc.
Hair, J. F., Jr. Black, W. C., Babin, B. J., Anderson, R. E. and Tatham, R. L. (2006)
Multivariate Data Analysis, 6th ed., Upper Saddle River, Pearson Prentice Hall, NJ
Hamel, J., Dufour, S. and Fortin, D. (1993) Case Study Methods (Qualitative Research
Methods), Teller Road, Sage Publications Inc., CA
Hancock, D. R. and Algozzine, B. (2006) Doing Case Study Research: A Practical Guide for
Beginning Researchers, Teachers College Press, Columbia University, New York
Hanson, G. H. (2001) "Should Countries Promote Foreign Direct Investment?" G-24
Discussion, Paper 9, UNCTAD, Geneva
Harris, R. and Robinson, C. (2003) “Foreign Ownership and Productivity in the United
Kingdom Estimates for UK Manufacturing using the ARD”, Review of Industrial
Organization, 22, 207-23
Harris, R. and Robinson, C. (2004) "Productivity Impacts and Spillovers from Foreign
Ownership in the United Kingdom", National Institute Economic Review, 187, 58-75
Haskel, J. E., Pereira, S. C. and Slaughter, M. J. (2002) "Does Inward Foreign Direct
Investment boost the Productivity of Domestic Firms?", NBER Working Paper, No
8724, Cambridge, Massachusetts
Hines, J. R. (1995) “Taxes, Technology Transfer, and R&D by Multinational Firms”, in
Feldstein, M., James R., Hines, J. R. and Hubbard, R. G. (eds.), Taxing
Multinational Corporations, University of Chicago Press, 51-62

403
Hobday, M. (1995) Innovation in East Asia: The Challenge to Japan, Edward Elgar, UK
Humphrey, J. and Memedovic, O. (2003) The Global Automotive Industry Value Chain:
What Prospects for Upgrading by Developing Countries, sectoral studies series,
UNIDO, Vienna
Hymer, S. (1960) "The International Operations of National Firms: A Study of Direct
Investment", Ph.D. dissertation, Massachusetts Institute of Technology
Jabbour, L. and Mucchielli, J. L. (2007) “Technology Transfer through Vertical Linkages:
The Case of the Spanish Manufacturing Industry”, Journal of Applied Economics,
10, 115-36
Javorcik, B. S. (2004) “Does Foreign Direct Investment Increase the Productivity of
Domestic Firms? Search of Spillovers through Backward Linkages”, American
Economic Review, 94 (3), 605-27
Kaiser, H. (1970) A Second generation Little Jiffy, Psychometrika, 35, 401-15
Kaiser, H. (1974) A index of factorial simplicity, Psychometrika, 39, 31-6
Kathuria, V. (1996) "Spillover Effects of Technology Transfer to India: An Econometric
Study”, Indira Gandhi Institute of Development Research, Bombay-400065, India
Kathuria, V. (2000) "Productivity Spillovers from Technology Transfer to Indian
Manufacturing Firms", Journal of International Development, 12 (2), 343-69
Katrak, H. (1989) “Imported Technologies and R&D in a Newly Industrializing Country”,
Journal of Development Economics, 31, 123-39
Katrak, H. (1990) “Imports of Technology and the Technological Effort of Indian
Enterprises”, World Development, 18, 371-81
Katrak, H. (1997) “Developing Countries’ Imports of Technology, In-House Technological
Capabilities and Efforts: An Analysis of the Indian Experience”, Journal of
Development Economics, 53, 67-83

404
Keller, W. (1994) “Human Capital and Technology: Characteristics and Interaction”,
Mimeo, Yale University, NH, CT
Keller, W. (1996) “Absorptive Capacity: On the Creation and Acquisition of Technology in
Development”, Journal of Development Economics, 49, 199-227
Keller, W. and Yeaple, S. (2003) “Multinational Enterprises, International Trade, and
Productivity Growth: Firm-Level Evidence from the United States” NBER working
paper 9504, Cambridge, M A: National Bureau of Economic Research
Keller, W. (2004) “International Technology Diffusion”, Journal of Economic
Literature, 42, 752-82
Kepenek, Y. and Yentürk, N. (2003) Türkiye Ekonomisi, 14th ed., Remzi Kitabevi, Istanbul
Kim, L. (1997) Imitation to Innovation: The Dynamics of Korea’s Technological Learning,
Harvard Business School Press, Boston, USA
Kim, L. (1998) “Technology Policies and Strategies for Developing Countries: Lessons from
the Korean Experience”, Technology Analysis and Strategic Management, 10 (3),
311-23
Kim, L. (2001) “The Dynamics of Technological Learning in Industrialization”, Blackwell
Publishers, ISSJ 168/2001, UNESCO 2001, MA, USA, 297-308
King, N. and Horrocks, C. (2010) Interviews in Qualitative Research, Sage Publications
Ltd., Oliver’s Yard, London
Kinoshita, Y. (1999) “Technology Spillovers through Foreign Direct Investment”,
University of Michigan William Davidson Institute, Working Paper, 221
Kinoshita, Y. (2001) "R&D and Technology Spillovers through FDI: Innovation and
Absorptive Capacity”, CEPR Discussion Paper DP2775, Centre for Economic Policy
Research, London

405
Kokko, A. (1992) “Foreign Direct Investment, Host Country Characteristics,
and Spillovers”, The Economic Research Institute, Stockholm
Kokko, A. (1994) "Technology, Market Characteristics, and Spillovers", Journal of
Development Economics, 43(2), 279-93
Kokko, A. (1996) “Productivity Spillovers from Competition between Local Firms and
Foreign Affiliates”, Journal of International Development, 8 (4), 517-30
Kokko, A., Tansini, R. and Zejan, M. C. (1996) "Local Technological Capability and
Productivity Spillovers from FDI in the Uruguayan Manufacturing Sector", Journal
of Development Studies,32, 602-11
Kokko, A., Zejan, M. and Tansini, R. (2001) "Trade Regimes and Spillover Effects of FDI:
Evidence from Uruguay." Weltwirtschaftliches Archiv, 137, 124-49
Kokko, A. (2003) “Globalization and FDI Policies”, in the Development Dimension of FDI:
Policy and Rule-Making Perspectives”, UNCTAD, Geneva and New York, 29-39
Konings, J. (2001) "The Effects of Foreign Direct Investment on Domestic Firms: Evidence
from Firm Level Panel Data in Emerging Economies", Economics of Transition, 9
(3), 619-33
Köymen, S. and Sayek, S. (2010) “The Role of Human Capital in Productivity Spillovers
from FDI: An Empirical Analysis on Turkish Manufacturing Firms”, Department of
Economics, Discussion Papers, 10-03, Bilkent University, Ankara
Krugman, P. (1979) “A Model of Innovation, Technology Transfer, and the World
Distribution of Income”, The Journal of Political Economy, 87, 253-66
Kugler, M. (2001) "The Diffusion of Externalities from Foreign Direct Investment: The
Sectoral Pattern of Technological Spillovers", Working Paper, University of
Southampton, United Kingdom
Kuroda, A. (2001) “Technology Transfer in Asia: A case study of auto parts and electrical
parts industries in Thailand”, Maruzen Planet, Japan

406
Kuznets, S. (1966) Modern Economic Growth: Rate, Structure, Spread, New Haven, Yale
University Press
Kvale, S. and Brinkmann, S. (2008) Interviews: Learning the Craft of Qualitative Research
Interviewing, 2nd
ed., Sage Publications Inc., Thousand Oaks, CA
Lall, S. (1980) “Vertical inter-firm linkages in LDCs: an empirical study”, Oxford Bulletin of
Economics and Statistics, 42 (3), 203-26
Lall, S. (1992) “Technological Capabilities and Industrialization”, World Development, 20
(2), 165-86
Lall, S., (1996) Learning from the Asian Tigers, MacMillan Press, London
Lall, S. (1997) “East Asia”, in: Dunning, J. H. (ed.), Governments, Globalization, and
International Business, Oxford university Press, Oxford, 407-30
Lall, S. and Narula R. (2004) “Foreign Direct Investment and its Role in Economic
Development: Do We Need a New Agenda?, The European Journal of Development
Research, 16 (3), 447–64
Larrain, F. B., Lopez-Calva, L. F. and Rodriquez-Clare, A. (2000) "Intel: A Case Study of
Foreign Direct Investment in Central America", Center for International
Development, Working Paper, 58, Harvard University, Cambridge, Mass.
Lavrakas, P. J. (2008) Encyclopedia of Survey Research Methods, Sage Publications Inc.,
Thousand Oaks, CA
Lee, C. (2008) “Innovation, Productivity and Exports: Firm-Level Evidence from Malaysia”,
Nottingham University Business School University of Nottingham Malaysia
Campus, Working Paper Series, March, Vol. 2008-06
Lenger, A. (2004) “Technological Capability and Economic Growth: A Study on the
Manufacturing Industries in Turkey”, Unpublished PhD. thesis, METU, Ankara

407
Lenger, A. and Taymaz, E. (2006) “To Innovate or to Transfer? A Study on Spillovers and
Foreign Firms in Turkey”, Journal of Evolutionary Economics, 16, 137-53
Levinsohn, J. and Petrin, A. (2003) “Estimating Production Functions Using Inputs to
Control for Unobservables”, Review of Economic Studies, 70, 317-42
Li, X., Liu, X. and Parker, D. (2001) "Foreign Direct Investment and Productivity Spillovers
in the Chinese Manufacturing Sector", Economic Systems, 25 (4), 305-21
Liao, T. F. (1994) Interpreting Probability Models: Logit, Probit, and Other Generalized
Linear Models, Quantitative applications in the social sciences, Sage University
Papers Series, Sage Publications, CA
Lin, P. and Saggi, K. (2004) “Multinational Firms and Backward Linkages: A Survey and a
Simple Model”, Mimeo: Lingnan University and Southern Methodist University
Lipsey, R. E. and Sjöholm, F. (2001) "Foreign Direct Investment and Wages in Indonesian
Manufacturing", NBER Working Paper, 8, 299, Cambridge, Massachusetts
Lipsey, R. E. and Sjöholm, F. (2004) “Foreign Direct Investment, Education and Wages in
Indonesian Manufacturing”, Journal of Development Economics, 73, 415–22
Liu, X., Siler, P., Wang, C. and Wei, Y. (2000) "Productivity Spillovers from Foreign Direct
Investment: Evidence from UK Industry Level Panel Data", Journal of International
Business Studies 31 (3), 407-25
Long, J. S. (1997) Regression Models for Categorical and Limited Dependent Variables,
Sage Publications, Thousand Oaks, CA
Long, J. S. (2001) Regression Models for Categorical and Limited Dependent Variables,
Advanced Quantitative Techniques in the Social Science Series, Sage Publications,
CA
Lopez-Cordova, J. E. (2002) "NAFTA and Mexico's Manufacturing Productivity: An
Empirical Investigation Using Micro-Level Data", Working Paper, Inter-American
Development Bank, Washington, D.C

408
Lorentzen, J., Mollgaard, P. and Rojec, M. (2003) “Host-Country Absorption of Technology:
Evidence from Automotive Supply Networks in Eastern Europe” Industry and
Innovation, 10 (4), 415–32
Lorentzen, J. (2005) “The Absorptive Capacities of South African Automotive Component
Suppliers”, World Development, 33 (7), 1153–82
MacDougall, G. D. A. (1960) “The Benefits and Costs of Private Investment from Abroad:
A Theoretical Approach”, Economic Record, 36, 13-35
Maddala, G. S. (1983) Limited-Dependent and Qualitative Variables in Econometrics,
Econometric Society Monographs, Cambridge University Press, New York
Mansfield, E. and Romeo, A. (1980) "Technology Transfer to Overseas Subsidiaries by
U.S.-Based Firms", Quarterly Journal of Economics, 95 (4), 737-50
Markusen, J. R. (1995) "The Boundaries of Multinational Enterprises and the Theory of
International Trade", Journal of Economic Perspectives, 9 (2), 169-89
Markusen, J. R. and Venables, A. (1999) “Foreign Direct Investment as A Catalyst for
Industrial Development” European Economic Review, 43, 335–56
Marshall, C. and Rossman, G. B. (2010) Designing Qualitative Research, 5th ed., Sage
Publications, Inc., Thousand Oaks, CA
McDonald, I. M. and Solow, R. (1981) “Wage Bargaining and Employment”, American
Economic Review, 71, 896-908
McFadden, D. (1984) “Econometric Analysis of Qualitative Respond Models”, in Griliches,
Z. and Intriligator, M. (eds.), Handbook of Econometrics, 2, Amsterdam, North-
Holland
McKelvey, M. (1998) “Evolutionary Innovations: Learning, Entrepreneurship and the
Dynamics of the Firm”, Journal of Evolutionary Economics, 8, 157-75

409
Mead, D. C. (1984) “Of Contracts and Subcontracts: Small Firms in Vertically Disintegrated
Production/Distribution Systems in LDC”, World Development, 12, 11/12, 1095-
1106
Merriam, S. B. (2009) Qualitative Research: A Guide to Design and Implementation, San
Francisco, John Wiley and Sons Inc.
Meyers, L. S., Gamst, G. and Guarino, A. J. (2006) Applied multivariate research: Design
and Interpretation, Sage publications Inc., CA
Mills, A. J., Durepos, G. and Wiebe, E. (eds.) (2009), Encyclopedia of Case Study Research,
Sage Publications Inc., Thousand Oaks, CA
MITI (2010) Otomotiv Sektörü Raporu (Automotive Sector report), Sektörel Raporlar ve
Analizler Serisi, Ministry of Industry and Trade of Turkey, 2010/3
MITI (2011) Otomotiv Sektörü Raporu (Automotive Sector report), Sektörel Raporlar ve
Analizler Serisi, Ministry of Industry and Trade of Turkey, 2011/1
Mody, A., Sanders, J., Suri, R., Rao, C. and Contreras, F. (1991) “International Competition
in the Bicycle Industry”, World Bank
Mollgaard, P. H and Lorentzen, J. (2004) “Exclusive Safeguards and Technology Transfer:
Subcontracting Agreements in Eastern Europe’s Car Component Industry”,
European Journal of Law and Economics, 17, 41-71
Moran, T. (2001) “Parental Supervision: The New Paradigm for Foreign Direct Investment
and Development”, Washington, D.C., Institute for International Economic
Moulton, B. R. (1990) “An Illustration of a Pitfall in Estimating the Effects of Aggregate
Variables on Micro Units”, Review of Economics and Statistics, 72 (2), 334–38
Nadiri, M. I. (1991) “Innovations and Technological Spillovers”, Mimeo, NBER, New York
University

410
Narula, R. and Dunning, J. H. (2000), “Industrial Development, Globalization and
Multinational Enterprises: New Realities for Developing Countries”, Oxford
Development Studies, 28 (2), 141-67
Narula, R. and Marin, A. (2003) “FDI Spillovers, Absorptive Capacities and Human Capital
Development: Evidence from Argentina”, MERIT-Infonomics Research
Memorandum Series, 2003-016
Narula, R. (2004) “Understanding Absorptive Capacities in an Innovation Systems Context:
Consequences for Economic and Employment Growth”, MERIT Research
Memorandum, 2004-003
Narula, R. and Driffield, N. (2012) “Does FDI Cause Development? The Ambiguity of the
Evidence and Why it Matters”, European Journal of Development Research, 24, 1–7
Navaretti, G. B. and Venables, A. J. (2004) Multinational Firms in the World Economy,
Princeton University Press, Princeton and Oxford
Nelson, R. R. and Winter, S. (1982) Evolutionary Theory of Economic Change,
Massachusetts: Harvard University Press
Neuman, W. L. (2006) Social Research Methods: Qualitative and Quantitative Approach, 6th
ed., Pearson International Edition, Boston
Nunnally, J. C. (1978) Psychometric Theory, 2nd ed., McGraw-Hill, New York
Nunnally, J. C. and Bernstein, I. H. (1994) Psychometric theory, 3rd
ed., McGraw-Hill Inc.,
New York
OECD (1997) Oslo Manual, “The Measurement of Scientific and Technological Activities:
Proposed Guidelines for Collecting and Interpreting Technological Innovation
Data”, OECD and Eurostat, European Commission, published by: OECD
Publishing, pp.92

411
OECD (2002) Frascati Manual, “The Measurement of Scientific and Technological
Activities: Proposed Standard Practice for Surveys on Research and Experimental
Development”, OECD and Eurostat, European Commission, published by: OECD
Publishing, pp.256
OECD (2005) Oslo Manual, “The Measurement of Scientific and Technological Activities:
Guidelines for Collecting and Interpreting Innovation Data”, 3rd
ed., OECD and
Eurostat, European Commission, published by: OECD Publishing, pp. 164
OECD (2009) Main Science and Technology Indicators Database, 2009, issue 1
Okamoto, Y. (1999) “Multinationals, Production Efficiency, and Spillover Effects: The Case
of the US Auto Parts Industry”, Weltwirtschaftliches Archiv, 135, 241-60
Olley, S. and Pakes, A. (1996) “The Dynamics of Productivity in the Telecommunications
Equipment Industry”, Econometrica, 64 (6), 1263-97
Önis, Z. (1994) “Liberalization, Transnational Corporations and Foreign Direct Investment
In Turkey: The Experience of the 1980s”, in Senses, F. (ed.) Recent Industrialization
Experience of Turkey in a Global Context, Greenwood Press, Westport, Conn., 91-
109
Özler, S. and Yılmaz, K. (2007) “Productivity Response to Reduction in Trade Barriers:
Evidence from Turkish Manufacturing Industry”, TUSIAD-KOC University
Economic Research Forum Working Paper Series, Working Paper, 0704, Istanbul
Pack, H. and Westphal, L. E. (1986) “Industrial Strategy and Technological Change: Theory
versus Reality”, Journal of Development Economics, 22 (1), 87-128
Pack, H. (1992) “Technology Gaps between Industrial and Developing Countries: Are There
Dividends For Latecomers?”, Proceedings of the World Bank Annual Conference on
Development Economics, Supplement to the World Bank Economic Review and
World Bank Research Observer, World Bank, Washington, DC, 283-302
Pack, H. and Saggi, K. (1997) “Inflows of Foreign Technology and Indigenous
Development”, Review of Development Economics, 1(1), 81-98

412
Pack, H. and Saggi, K. (2001) “Vertical Technology Transfer via International Outsourcing”
Journal of Development Economics, 65, 389-415
Pack, H. (2005) “Econometric Versus Case Study Approaches to Technology Transfer”, in
Hoekman, B. and Javorcik, B. S. (ed.), Global Integration and Technology Transfer,
Washington, Palgrave Macmillan and the World Bank, 29-50
Pallant, J. (2007) SPSS Survival Manual, A Step by Step Guide to Data Analysis using SPSS
for Windows, 3rd
ed., McGraw Hill, England
Pamukçu, T. (2003) “Trade Liberalization and Innovation Decisions of Firms: Lessons from
Post-1980 Turkey'', World Development, 31, 1443-58
Pamukçu, T. and Taymaz, E. (2009) “Spillovers in the MENA region: The case of Turkey”,
Economic Research Forum for the Arab Countries (ERF), Working Paper Series,
463, Cairo
Perez, T. (1997) “Multinational Enterprises and Technological Spillovers: An Evolutionary
Model”, Journal of Evolutionary Economics, 7, 169-92
Polanyi, M. (1962) Personal Knowledge: Towards a Post-Critical Philosophy, University of
Chicago Press, Chicago
Portelli, B. and Narula, R. (2004) “Foreign Direct Investment through Acquisitions and
Implications for Technological Upgrading”, Case Evidence from Tanzania’, Merit
Research Memorandum
Radosevic, S. (1999) International Technology Transfer and Catch-up in Economic
Development, Edward Elgar Publishing Limited, Cheltenham, UK
Ramachandran, V. (1993) “Technology Transfer, Ownership, and Investment in
Human Capital”, Review of Economics and Statistics 75, 664-70
Rath, A. (1994) “Technology Transfer and Diffusion”, in Salomon, J-J., Sagasti, F. and
Sachs-Jeantet, C. (eds.), The Uncertain Quest: Science, Technology and
Development, United Nations University, New York

413
Rhee, J. W. and Belot, T. (1989) "Export Catalysts in Low-Income Countries", Working
Paper, World Bank
Rhee, Y. (1990) “The Catalyst Model of Development: Lessons From Bangladesh’s Success
with Garment Exports”, World Development, 18 (2), 333–46
Rodriquez-Clare, A. (1996) “Multinationals, Linkages, and Economic Development”,
American Economic Review, 86 (4), 851–73
Romer, P. (1986), “Increasing Returns and Long-Run Growth”, Journal of Political
Economy, 94 (5), 1002–37
Romer, P. (1990) “Endogeneous Technological Change”, Journal of Political Economy, 98
(5), 71–102
Rubin, H. J. and Rubin, I. S. (2004) Qualitative Interviewing: The Art of Hearing Data,
2nd ed., Sage Publications Inc., Thousand Oaks, CA
Safarian, A. E. (1966) Foreign Ownership of Canadian Industry, Toronto; Mcgraw-hill
Saggi, K. (2002) “Trade, Foreign Direct Investment, and International Technology Transfer:
A Survey”, The World Bank Research Observer, 17 (2), 191–235
Schoors, K. and Van der Tol, B. (2001) “The Productivity Effect of Foreign Ownership on
Domestic Firms in Hungary”, Mimeo, University of Gent
Schumpeter, J. A. (1934) The Theory of Economic Development: An Inquiry into
Profits, Capital, Credit, Interest and the Business Cycle, Cambridge, Mass.: Harvard
University Press
Seidman, I. (2006) Interviewing As Qualitative Research: A Guide for Researchers in
Education and the Social Sciences, 3rd
ed., Teachers College Press, New York
Sekaran, U. (2003) Research Method for Business: A Skill-Building Approach, 4th ed., John
Wiley and Sons, New York

414
Sekaran, U. and Bougie, R. (2009) Research Methods for Business: A Skill Building
Approach, 5th ed., John Wiley and Sons Ltd, West Sussex, United Kingdom
Sinani, E. and Meyer, K. (2004) “Spillovers of Technology Transfer From FDI: The Case Of
Estonia”, Journal of Comparative Economics, 32, 445–466
Sjöholm, F. (1999a) "Technology Gap, Competition and Spillovers from Direct Foreign
Investment: Evidence from Establishment Data", Journal of Development Studies,
36 (1), 53-73
Sjöholm, F. (1999b) "Productivity Growth in Indonesia: The Role of Regional
Characteristics and Direct Foreign Investment", Economic Development and
Cultural Change, 47 (3), 559-84
Smeets, R. (2008), “Collecting the Pieces of the FDI Knowledge Spillovers Puzzle”, The
World Bank Research Observer, 23, 107-138
Solow, R. (1956) “A Contribution to the Theory of Economic Growth”, Quarterly Journal of
Economics, 70, 65–94
SPO (2007) Ninth Plan for Economic Development (2007-2013), Report of the Special
Expert Committee on Automotive Industry, (in Turkish), No: 2736-ÖİK: 687,
Ankara
Stevens, J. P. (2002) Applied Multivariate Statistics for Social Sciences, 4th ed., Hillsdale,
NJ, Erlbaum
Şenses, F. and Taymaz, E. (2003) “Unutulan Bir Toplumsal Amaç: Sanayileşme Ne Oluyor?
Ne Olmalı?” [A Social Objective Forgotten: Industrialization], in Köse, A. H.,
Şenses, F. and Yeldan, E. (eds.), İktisadi Kalkınma Kriz ve İstikrar, İletişim
Yayınları, İstanbul
Tabachnick, B. G. and Fidell, L. S. (2007) Using Multivariate Statistics, 5th ed., Boston,
Pearson Education
415
Tanaka, H., Iwaisako, T. and Futagami, K. (2007) “Dynamic Analysis of Innovation and
International Transfer of Technology Through Licensing”, Journal of International
Economics, 73, 189–212
Tashakkori, A. and Teddlie, C. (1998) Mixed Methodology: Combining Qualitative and
Quantitative Approaches, Sage Publications Inc., Thousand Oaks, CA
Tashakkori, A. and Teddlie, C. (2010) SAGE Handbook of Mixed Methods in Social &
Behavioral Research, 2nd
ed., Sage Publications Inc., Thousand Oaks, CA
Taymaz, E. and Lenger, A. (2004) “Multinational Corporations as a Vehicle for Productivity
Spillovers in Turkey”, Danish Research Unit for Industrial Dynamics (DRUID),
Winter Ph.D Conference, Working Paper, No 04-09, Aalborg, Denmark
Taymaz, E. and Yılmaz, K. (2007) “Productivity and Trade Orientation: Turkish
Manufacturing Industry before and after the Customs Union”, Journal of
International Trade and Diplomacy, 1 (1), 127-54
Taymaz, E. and Yılmaz, K. (2008a) “Foreign Direct Investment and Productivity Spillovers:
Identifying Linkages through Product-Based Measures”, Paper presented to the 35th
EARIE Conference, Toulouse, France
Taymaz, E. and Yılmaz K. (2008b) “Integration with the Global Economy: The Case of
Turkish Automobile and Consumer Electronics Industries”, The World Bank, the
Commission on Growth and Development, Working Paper No: 37
Techakanont, K. (2002) “A Study on Inter-firm Technology Transfer in the Thai
Automobile Industry, Unpublished PhD. Thesis, Graduate School for International
Development and Cooperation, Hiroshima University, Japan
Techakanont, K. and Terdudomtham. T. (2004) “Evolution of Inter-firm Technology
Transfer and Technological Capability Formation of Local Parts Firms in the Thai
Automobile Industry”, Journal of Technology Innovation, 12, 2-20

416
Teddlie, C. and Tashakkori, A. (2008) Foundations of Mixed Methods Research: Integrating
Quantitative and Qualitative Approaches in the Social and Behavioral Sciences,
Sage Publications Inc., Thousand Oaks, CA
Teece, D. J. (1977) “Technology Transfer by Multinational Firms: The Resource cost of
Transferring Technological Know-how”, Economic Journal, 87, 242-61
Temenggung, D. (2006) “Productivity Spillovers from Foreign Direct Investment:
Indonesian Manufacturing Industry’s Experience 1975-2000”, Economics Division,
Research School of Pacific and Asian Studies, ANU
Thomas, R. M. (2003) Blending Qualitative & Quantitative Research Methods in Theses and
Dissertations, Thousand Oaks, Corwin Press Inc., Sage Publications Company, CA
Travers, M. (2001) Qualitative Research through Case Studies, Oliver’s Yard, Sage
Publications Ltd., London
TUBITAK, report for 2023 vision, “Otomotiv Yan Sanayii Parça Sektörü”, (in Turkish),
draft report, Appendix-6A, Ankara, Turkey
Tung, R. L. (1994) “Human Resource Issues and Technology Transfer”, International
Journal of Human Resource Management 5, 808-25
Ullrich, D. (1998) “Intellectual capital = competence × commitment”, Sloan Management
Review, Winter, 15–26
UN (1999) “World Investment Report 1999”, Geneva, United Nations
UNCTAD (1997) “World Investment Report 1997: Transnational Corporations, Market
Structure and Competition Policy”, New York and Geneva, United Nations
UNCTAD (1998) “World Investment Report 1998: Trends and Determinants”, New York
and Geneva, United Nations
UNCTAD (2000) “Cross-Border Mergers and Acquisitions and Development”, World
Investment Report 2000, New York and Geneva, United Nations

417
UNCTAD (2003), “World Investment Report 2003: FDI Policies for Development: National
and International Perspectives, New York and Geneva, United Nations
UNCTAD (2005) World investment report 2005: Transnational Corporations and the
Internationalization of R&D, New York and Geneva: United Nations
UNCTAD (2011) “World Investment Report 2011: Non-Equity Modes of International
Production and Development”, New York and Geneva, United Nations
UNCTC (1994) “Costs and Conditions of Technology Transfer through Transnational
Corporations: A Regional Perspective”, in Dunning, J. H. (edt.), Technology
Transfers to Developing Countries, United Nations Library on Transnational
Corporations, 18, published by Routledge, New York
Verbeek, M. (2008) A Guide to Modern Econometrics, 3rd ed., John Wiley and Sons,
New York
Wagner, R. K. and Sternberg, R. J. (1985) “Practical Intelligence in Real-World Pursuits: the
Role of Tacit Knowledge”, Journal of Personality and Social Psychology, 49 (2),
436-58
Wang, J. (1990) “Growth, Technology Transfer, and the Long-Run Theory of International
Capital Movements”, Journal of International Economics, 29, 255–71
Wang, J. and Blomström, M. (1992) "Foreign Investment and Technology Transfer: A
Simple Model", European Economic Review, 36 (1), 137-55
Wasti, N. S., Kozan, M. K. and Kuman, A. (2006) “Buyer-Supplier Relationships in the
Turkish Automotive Industry”, International Journal of Operations and Production
Management, 26, 947-70
Wasti, S. N., Kozan, M. K. and Çınar, A. K. (2009) "Ana Sanayi Firmalarının Yan Sanayiye
Yaptıkları İlişkiye Has Yatırımın Öncülleri: Türk Otomotiv Sanayinde bir
Araştırma”, (in Turkish), ODTÜ Gelişme Dergisi, 35, 315-40

418
Wengraf, T. (2001) Qualitative Research Interviewing: Semi-Structured, Biographical and
Narrative Methods, Sage Publications Ltd., Oliver’s Yard, London
Wong, P. K. (1991) “Technological Development through Subcontracting Linkages”, Asia
Productivity Organization, Tokyo
Xu, B. (2000) “Multinational Enterprises, Technology Diffusion, and Host Country
Productivity Growth”, Journal of Development Economics, 62, 477–93
Yamashita, S. (1991) Transfer of Japanese Technology and Management to the ASEAN
Countries, University of Tokyo Press, Tokyo
Yılmaz, B. and Barbaros, A. (2005) “Development and Determinants of Foreign Direct
Investment in Turkey: A Comparison with Ireland and Spain”, Prepared for the
Conference on Elites and EU Enlargement, Germany
Yılmaz, K. (2006) “Türkiye için Doğrudan Yabancı Yatırım Stratejisi’ne Doğru”, (in
Turkish), YASED
Yin, R. K. (1989) Case Study Research: Design and Methods, revised ed., Sage Publications
Inc., Newbury Park, CA
Yin, R. K. (2003) Applications of Case Study Research, 2nd
ed., Sage Publications Inc.,
Thousand Oaks, CA
Zukowska-Gagelmann, K. (2000) "Productivity Spillovers from Foreign Direct Investment
in Poland", Economic Systems, 24 (3), 223-56

419
APPENDICES
420
Appendix A:
Data Cleaning and Transformation Procedures
The data cleaning procedure required very effort, careful attention therefore it took most of
the time for construction of the appropriate dataset.
Our cleaning procedures can be summarized in the following stages:
a) Firstly, only private firms were selected (firms with public share more than 50% in total
capital of the firm were dropped).
b) Firms less than 20 employees were dropped.
c) Next, we analyzed the number of the firms at the 4-digit NACE level, and we dropped 4-
digit sector if total number of firms in this sector is less than 10, so one of the sectors not
satisfied this condition was completely - NACE 37- excluded from the data set.
d) Then, firms were analyzed by one by in the data set. Some of them appear only at two
consecutive years, or only one year, some only appears recently and no data available
from the previous year so to perform the panel analyses firms were taken that appear at
least three consecutive years.
e) Also a lot number of observations were analyzed and reduced to minimize noise due to
misreporting, obvious mistakes in data keypunching, and not satisfying basic error
checks.
f) We performed a detailed analysis for the key variables (used in the analysis) to determine
the missing and zero values. After detailed analysis, some of the observations with
missing and zero values were dropped from the dataset.
From this point, the only problematic variables were number of paid employees (L;
labor variable) and depreciation and depletion allowances variables (used as a proxy
for capital stock variable); they had 125 and 9390 missing values respectively.
Dropping all these observations with missing values was not preferred due to
importance of the variables and preventing data loss. To solve this problem, using of

421
interpolation method was preferred. For this aim, a special program code was written
to calculate new values for each observation from available values and replace them
with missing values. This code creates new values for each observation by using
previous and next year values related to missing values for each case (firm) in the
dataset with this sequence:
1- If missing data is in the second or third year, code calculates average of previous
and next year value if they are available and put this new value instead of missing
data.
2- If missing data is in the last year it calculates the average of previous two years
value if they are available and put this new value instead of missing data.
3- If missing data is in the first year it calculates the average of next two years value if
they are available and put this new value instead of missing data.
4- If missing data is in the second or third year, code calculates the average of the
previous and next year value if they are available and put this new value instead of
missing data.
5- If missing data is in the first year it calculates the average of next two years value if
they are available and put this new value instead of missing data.
With this interpolation method, 95 and 4490 new data were created for the labor and
capital stock variables, and the rest observations with missing values were dropped
from the dataset (total 4930 observation with missing values were dropped, 30 for
labor and 4900 for capital variable).
g) In the conclusion of these last procedures, we analyzed the number of the firms at the 4-
digit NACE level and we corrected the dataset again for appearing of the firms at least
three consecutive years (we repeated the same steps in c and d).
After these detailed and extensive data cleaning procedures, more consistent dataset was
obtained.

422
Appendix B:
Construction of Composite Price Indexes
The following procedures are followed to construct the composite (input) price indexes
(CPI) for each sector j. Initially, the shares of inputs purchased by industry j from industry k
were calculated based on two-digit input-output matrix. Then the highest six sector’s shares
supplied to sector j were taken and equaled to one. Then PPI of each sector were weighted
by these coefficients and totaled.
For each sector j, six highest input coefficients are taken, ∑
Define:
so that ∑
Then composite (input) price index (CPI) for sector j
=∑
Where

423
Appendix C:
Cover Letter for Face-to-Face Questionnaire Survey
with Suppliers in Turkey Automotive Supply Industry
MIDDLE EAST TECHNICAL UNIVERSITY
Department of Economics & Science and Technology Policies
Research Center
R&D, Innovation, Knowledge and Technology Transfer
Research in Turkey Automotive Industry
Dear/Company Name_ _ _ _ _ _ _ _ _ _ _ DD.MM.YYYY
First of all your firm is a part of the sample chosen specially and carefully in the automotive
industry.
This study titled “R&D, Innovation, Knowledge and Technology Transfer Research in Turkey
Automotive Industry” is supported as a research project by TUBITAK, OSD, TAYSAD and its
application has been conducted by XXX Co. Inc.
Preface
In the 21st century, the most important factors that determine firms’ power and position in
international competition area are firms’ capabilities on improving/developing competitive new
technologies – products - production processes, and on adaptation of and follow up closely new
technologies. Therefore firms have undertaken increasingly innovation and R&D activities, and they
have increasingly rely on collaborations with external partners (such as MNCs, customers, suppliers,
universities, private institutions etc.) in order to obtain technological innovations. At the same time,
governments, firms, institutions and universities have come together to support these activities and to
develop national science and technology policies for these aims in many developed and developing
countries.
The Purpose of the Study
This research has four main aims; (i) to reveal what kind of knowledge and technology transfers have
been provided to the suppliers by their customers, and their determinants, (ii) to reveal characteristics
and technology capabilities of the suppliers in Turkey automotive industry, (iii) to examine innovation
and R&D activities of the suppliers, and (iv) to analyze the qualitative of collaboration between
AMMs and their suppliers with respect to transfers and design activities.
This scientific research is of great significance for the firms in the sector -especially yours - in terms
of continuing the current position and competitive environment in the future. At the same time, we
think that it may be an important source for the public and various private institutions (SPO,
KOSGEB, TUBITAK, OSD, and TAYSAD etc.) to develop knowledge and technology policies in
support of R&D, innovation and technology transfer activities relating to sector.

424
In the countries in which there are developed automotive industry and highly concentrated
cooperation among public, university and industry (such as USA, Germany, France, South Korea,
Thailand, Malaysia, and China etc.), similar researches have continuously been implemented in a
successful way, and most important results have also obtained in terms of development of the sector.
With this respect, one important aim of the study is to make a contribution by closing this deficiency
in our country, and the other one is to prevent losing its leader role to other countries by providing to
the sector to capture sustainable competitive environment that will lead to the sector to be regional
production and excellence base in the near future.
Research Methodology
Considering its scope and characteristic, the research needs to collect detailed information and data at
the firm level. For this purpose, a questionnaire form was prepared under cover of international
scientific literature and it consists of 9 sections and 43 detailed questions. It has been careful to keep
the questionnaire short; and apart from a few questions the majority of it is formed with closed-ended
multiple-choice questions. Average response time of the questionnaire is about 60 minutes and it will
be applied to members of TAYSAD and leading firms in the sector like as your firm.
Your participation to this research study as an important leader and executive in the industry is very
critical for the success of the study. We hope that you will agree to participate and you will want to
have a voice in this study because of contribution of the research and also future success of Turkey
automotive industry
We will happily send you -free of charge- a copy of the final report.
It must be emphasized that all information and data obtained from this questionnaire will be kept in
strictly confidential, and it will not be published in a form like report or article which would identify
you or your firm without your consent.
The success of the study, and obtaining accurate results and policies for the sector depend on
your responses’ accuracy and completeness, otherwise all efforts related to this study will fail.
Please do not hesitate to contact us -preferably Alper Sönmez- with the following communication
channels if you have any question or problem about the survey.
Assoc. Prof. Dr.
M. Teoman Pamukçu
Middle East Technical University,
Science and Technology Policies
Research Center
METU, MM Building, 2nd Floor,
No: 220 06531 Ankara
E-Mail: [email protected]
Office Phone: (0312) 210 37 19
Fax: (0312) 210 79 93
Research Assistant
Alper Sönmez
Middle East Technical University,
Department of Economics
Room No: : A202
06531 Ankara
E-Mail: [email protected]
Office Phone: (0312) 210 30 77
(0312) 283 98 58
Mobil: 0 533 xxx xx xx
Fax: (0312) 210 79 64
Yours Sincerely,
Appendix 1: Letter of support from OSD
Appendix 2: Letter of support from TAYSAD
***Thank you for your kindly cooperation and concern about the research***

425
Appendix D:
Cover Letter for Interview Request from AMMs in Turkey
MIDDLE EAST TECHNICAL UNIVERSITY
Department of Economics & Science and Technology Policies
Research Center
R&D, Innovation, Knowledge and Technology Transfer Research
in Turkey Automotive Industry
Subject: Request for an Interview
Dear/Company Name_ _ _ _ _ _ _ _ _ _ _ DD.MM.YYYY
This study titled “R&D, Innovation, Knowledge and Technology Transfer Research in Turkey
Automotive Industry” is supported as a research project by TUBITAK, OSD and TAYSAD.
Preface
In the 21st century, the most important factors that determine power and position of the firms in
international competition area are firms’ capabilities on improving/developing competitive new
technologies – products - production processes, and on adaptation of and follow up closely new
technologies. Therefore firms have undertaken increasingly innovation and R&D activities, and they
have increasingly rely on collaborations with external partners (such as MNCs, customers, suppliers,
universities, private institutions etc.) in order to obtain technological innovations. At the same time,
governments, firms, institutions and universities have come together to support these activities and to
develop national science and technology policies for these aims in many developed and developing
countries.
The Purpose of the Study
This research has four main aims; (i) to reveal what kind of knowledge and technology transfers have
been provided to the suppliers by their customers, and their determinants, (ii) to reveal characteristics
and technology capabilities of the suppliers in Turkey automotive industry, (iii) to examine innovation
and R&D activities of the suppliers, and (iv) to analyze the qualitative of collaboration between
AMMs and their suppliers with respect to transfers and design activities.
This scientific research is of great significance for the firms in the sector -especially yours - in terms
of continuing the current position and competitive environment in the future. At the same time, we
think that it may be an important source for the public and various private institutions (SPO,
KOSGEB, TUBITAK, OSD, and TAYSAD etc.) to develop knowledge and technology policies in
support of R&D, innovation and technology transfer activities relating to sector.
In the countries in which there are highly developed automotive industry and highly concentrated
cooperation among public, university and industry (such as USA, Germany, France, South Korea,
Thailand, Malaysia, and China etc.), similar researches have continuously been implemented in a
successful way, and most important results have also obtained in terms of development of the sector.

426
With this respect, one important aim of the study is to make a contribution by closing this deficiency
in our country, and the other one is to prevent losing its leader role to other countries by providing to
the sector to capture sustainable competitive environment that will lead to the sector to be regional
production and excellence base in the near future.
Research Methodology
Considering its scope and characteristic, the research needs to collect detailed information and data at
the firm level. For this purpose, it is planned to make an interview with the top executives (managers
of R&D, production, purchasing etc.) of the AMMs in the Turkey automotive industry, and it will take
place from February to June. The interview will be based on interview guide with open-ended
questions (see Appendix 1), and it will be conducted in a semi-structured way to give you ample
opportunity to express your opinions and it should take about 120 minutes.
Your participation to this research study as an important leader and executive in the industry is very
critical for the success of the study. We hope that you will agree to participate and you will want to
have a voice in this study because of contribution of the research and also future success of Turkey
automotive industry. In anticipation of your co-operation and participation to this research, we are
writing to request a factory visit and interview with you, or one of your colleagues recommended by
you. In the arrangement of interview date, you can contact with our interviewer Alper Sönmez from
the following communication channels.
We will happily send you -free of charge- a copy of the final report.
It must be emphasized that all information and responses obtained from this interview will be kept in
strictly confidential, and it will not be published in a form like report or article which would identify
you or your firm without your consent.
Assoc. Prof. Dr.
M. Teoman Pamukçu
Middle East Technical University,
Science and Technology Policies
Research Center
METU, MM Building, 2nd Floor,
No: 220 06531 Ankara
E-Mail: [email protected]
Office Phone: (0312) 210 37 19
Fax: (0312) 210 79 93
Research Assistant
Alper Sönmez
Middle East Technical University,
Department of Economics
Room No: A202
06531 Ankara
E-Mail: [email protected]
Office Phone: (0312) 210 30 77
(0312) 283 98 58
Mobil: 0 533 xxx xx xx
Fax: (0312) 210 79 64
Yours Sincerely,
Appendix 1: Interview Guide
Appendix 2: Letter of support from OSD
Appendix 3: Letter of support from TAYSAD
***Thank you for your kindly cooperation and concern about the research***

427
Appendix E:
Letter of Support from OSD (in Turkish)

428
Appendix F:
Letter of Support from TAYSAD (in Turkish)

429
Appendix G:
Fieldwork Instructions for the Questionnaire Survey
1. Questionnaire survey will be applied to 298 automotive supply firms which are
primarily the members of TAYSAD and operate in various industrial zones (BTSO,
UIB, NOSAB, DOSAB and GOSB) in Istanbul, Izmir, Bursa and Kocaeli.
2. Addresses and contact information of the firms were acquired primarily from
TAYSAD and various communication channels in terms of sector such as web pages
of industrial zones, web pages of firms, web pages of İstanbul chamber of industry
etc.
3. The questionnaire will be applied by means of face-to-face interview with the top-
executives of the firms.
4. Top-executives (respondents of the questionnaire) may be senior managers such as
general director, production manager, factory manager, R&D manager, sales or
marketing manager, deputy managers, product development manager and owner of
the factory etc.
5. Firms should be accessed by means of required communication devices in order to
obtain the name/e-mail addresses of the top-executives specified in article 4, provide
information to the person about the importance and details of the survey and request
appointment.
6. In the event that the lists of the firms obtained is not up-to-date, in phone calls,
a. It should be verified that the main operational field of the firm is automotive
sector. If the main operational field of the firm is another one (service
industry, food industry, electrical and electronic sector, white appliances
sector, defense etc.), the questionnaire should not be applied.
b. If the firm has withdrawn from the manufacturing or it has ceased the
manufacturing for a period of time, the questionnaire should not be applied.
c. Name, address and contact information of the firms to be surveyed should be
verified in order to avoid problems.

430
7. Top-executives should be informed regarding the objective, scope and method of the
survey within the framework of the information included in the cover letter (see
Appendix C) and appointment should be requested by contacting them via phone.
Following phone calls, cover letter organized in her/his own name should be sent to
the e-mail address together with the support letters of OSD (see Appendix E) and
TAYSAD (see Appendix F) regarding the survey.
8. Appointments taken from the firms must be joined in time. Making appointment for
more than one firm in the same day should not prevent the pollster arriving in time
for the appointments. If it’s not possible to the place of an appointment in time due
to various reasons, respondent must be informed about the situation beforehand and
if necessary new appointment should be taken.
9. It should be noted that the questionnaire survey is a scientific research; any
information regarding the participant firms will not be explained or released.
10. Respondents may give their business cards if they want.
11. Full name of the pollster and interview date should be specified on each
questionnaire form.
12. Success of the questionnaire survey is dependent on the accurate and complete
response for each question. Therefore, pollsters should attach utmost importance to
the survey. If there is any missed point or a situation that needs explanation or if
there are any problems during the interview and so on, Alper Sönmez must be
contacted on the telephone via the phone number 0533 XXX XX XX.

431
Appendix H:
Structure of the Questionnaire Form
A) Questions for Supplier Firm Characteristics: Numerical Indicators
- Establishment date (age of the firm)
- Size of the firm (total sales, total number of workers)
- Distribution of total sales according to main customers/buyers (used also in supply chain)
- Share of exports in total sales (export or domestic oriented firm, export intensity)
- Major export markets
- Related to products:
Major three products manufactured/assembled and their share in total sales
(technological complexity level of the products and firm)
Major sources of raw materials (suppliers of the firm)
- Ownership status (share of foreign capital)
- Origin of foreign partner or firm
B) Knowledge and Technology Transfer Questions (explicit and tacit)
- Types and degrees of KTTs related to product
- Types and degrees of KTTs related to production process
- Types and degrees of KTTs related to training (type of training activities provided, on the job
or off the job training, visual training)
- Types and degrees of KTTs related to financial assistances
- The reasons for not making sufficient amount of KTTs
C) Questions for Supplier Firm Capabilities: Technological Capabilities related to Design,
R&D, Innovation and Production
- Rate of skilled workers to total workers (share of engineers/white collar workers in total
employment)
- Share of exports in total sales (used also in B)
- Technology level of the products (used also in B)
- R&D and innovation activities (R&D department, total R&D expenditures)
- Quality certifications
- Number of patents
- Technology agreements

432
- Sources of technologies used or acquired
- Design capability of the firm
- Various indicators (such as design capability, quality control, maintenance, JIT etc.)
- Co-product design activities and partners in these activities
D) Strategic Cooperation Questions
- Intensity of relationship among main buyers, suppliers, various firms and institutions
- Main reasons for collaborations with external parties
- Length of relationship with most important customer (year)
- Subcontracting agreements (share of subcontracting agreements in total contracts)
E) Questions for Direct Suppliers
- How to be a direct supplier of AMMs
- Benefits of being a direct supplier of AMMs
- Strategic relationships with AMMs (governance meetings, design-production process-
production development activities, send its expert staff, KTTs, etc.)
F) Questions in terms of R&D and Innovation Activities
- R&D and innovation activities and partners in these activities
- Have a separated R&D department in firm
- support from government or various institutions related to R&D
- number of patents obtained and applied
- R&D Expenditures (TL) and/or share of R&D expenditures in total sales
G) Questions related to Performance of Supplier Firm (for last three years)
- Related to production capability (defect rate, average cost, delivery and cycle time)
- Related to supports of customers (design, productivity, export, quality control etc.)
H) Questions Related to Supply Chain
- Main customers (buyers) and suppliers of the firm (used also in B)
- Major export markets (used also in B)
- A subsidiary (or affiliate) firm dependent on any domestic/overseas firm/group/holding?
- A part of a MNC
- MNCs among customers
- Purchasing strategy of the most important customer (buyer)
I) Questions for Future Projections (Related to Technology Acquisition and Firm Activities)

433
Appendix I:
Questionnaire Form Applied to Suppliers in
Turkey Automotive Supply Industry
Section 1: General Information
1. Please indicate your firm’s establishment date.
Year of Establishment _______
2. Please indicate your firm’s average number of employees in 2007 and 2008 according to the following table.
2007 2008
1- Engineers _________People _________People
2- White-Collar _________People _________People
3- Blue-Collar _________People _________People
Total Number of Employees (1+2+3) _________People _________People
3. Please indicate approximately your firm’s total sales (turnover) in 2008.
2008 T.L ____________________Million
4. Please indicate average distribution (%) of your firm’s total sales according to the following categories (main customers of your firm).
1. Domestic automotive main manufacturers (DAMM) %
2. Overseas automotive main manufacturers (OAMM) %
3. Domestic suppliers (DS) %
4. Overseas suppliers (OS) %
5. Parent company %
6. Other affiliates of parent company %
7. Retailers %
Others, (please specify): _ _ _ _ _ _ _ _ _ _ _ _ _ _ _ _ _ _
%
Total 100 %
Questionnaire Number:
Form Number:

434
5. Please indicate the share of exports (%) in your firm’s total sales for 2008.
Share of Exports in Total Sales in 2008 _______%
6. If there is a foreign capital in your firm, please indicate the share (%) and origin of this capital (for example; Germany, Italy, France, Spain, Japan, England, USA, South Korea etc.).
Origin*
Share of Foreign Capital __________% _________
Completely Foreign Ownership [ ] _________
*In case of more than one foreign partner, please indicate the origin of the foreign partner that has the highest capital share in the firm 7. Please specify the names of three major products manufactured/assembled by your firm and the approximate share (%) of these in your firms’ total sales.
Major 3 Products Share (%) in Total Sales
1. ______%
2. ______%
3. ______%
Section 2: Knowledge and Technology Transfer (KTTs)
1. Please indicate how often the following types of transfers related to product are provided by your customers. Attention: The implied meaning of the word “Assistance” used in items related to product and production process transfers (following sentences) is every help such as providing technical support-training- advice-knowledge and technology transfers etc.
Cronbach's α = 0.785; Inter-Item Correlations: mean = 0.422, min: 0.273, max: 0.572
Types of knowledge and technology transfer related to product
Never Rarely Frequently
1. Assistance related to product designs [ ] [ ] [ ]
2. Joint operation related to product [ ] [ ] [ ]
3. Joint design activity related to product [ ] [ ] [ ]
4. Product specifications [ ] [ ] [ ]
5. Technical specifications, original design or technical drawings for products
[ ] [ ] [ ]
Others, (please specify): _ _ _ _ _ _ _ _ _ _ _ _ _ _ _ _ _ _
[ ] [ ] [ ]

435
2. Please indicate how often the following types of transfers related to production process are provided by your customers.
Cronbach's α = 0.853
Types of knowledge and technology transfer related to production process
Never Rarely Frequently
1. Assistance for R&D activities [ ] [ ] [ ]
2. Assistance for logistic management [ ] [ ] [ ]
3. Provide documentations [ ] [ ] [ ]
4. Know-how [ ] [ ] [ ]
5. Supply of machinery, tools and equipment [ ] [ ] [ ]
6. Supply of raw material [ ] [ ] [ ]
7. Customer sent its expert staff to stay at your plant for a certain period of time for assistance in solving problems in the production process
[ ] [ ] [ ]
8. Assistance for business management [ ] [ ] [ ]
9. Assistance for quality control methods [ ] [ ] [ ]
10. Patent and/or license rights granted [ ] [ ] [ ]
11. Assistance for design [ ] [ ] [ ]
12. Assistance for productivity-related problems [ ] [ ] [ ]
13. Consumer assigned its expert staff in the establishment of production process of the plant
[ ] [ ] [ ]
Others, (Please specify): _ _ _ _ _ _ _ _ _ _ _ _ _ _ _ _ _ _
[ ] [ ] [ ]
3. Please indicate how often the following types of financial transfers are provided by your customers.
Cronbach's α = 0.712; Inter-Item Correlations: mean = 0.389, min: 0.241, max: 0.578
Types of financial transfer Never Rarely Frequently
1. Unilateral financial aid [ ] [ ] [ ]
2. Loans with low interest rates [ ] [ ] [ ]
3. Contribution to risk capital [ ] [ ] [ ]
4. Pre-financing of machinery, equipment and tools [ ] [ ] [ ]
5. Prepayment for orders before delivery [ ] [ ] [ ]
Others, (Please specify): _ _ _ _ _ _ _ _ _ _ _ _ _ _ _ _ _ _
[ ] [ ] [ ]
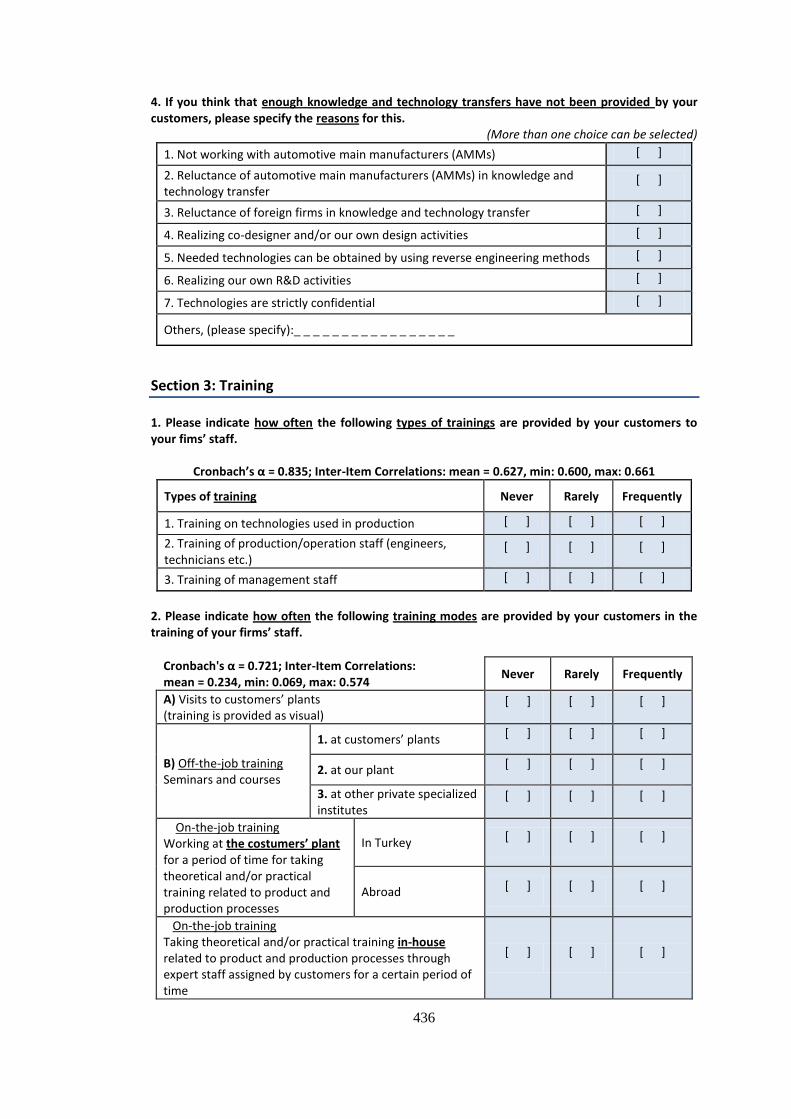
436
4. If you think that enough knowledge and technology transfers have not been provided by your customers, please specify the reasons for this.
(More than one choice can be selected)
1. Not working with automotive main manufacturers (AMMs) [ ]
2. Reluctance of automotive main manufacturers (AMMs) in knowledge and technology transfer
[ ]
3. Reluctance of foreign firms in knowledge and technology transfer [ ]
4. Realizing co-designer and/or our own design activities [ ]
5. Needed technologies can be obtained by using reverse engineering methods [ ]
6. Realizing our own R&D activities [ ]
7. Technologies are strictly confidential [ ]
Others, (please specify):_ _ _ _ _ _ _ _ _ _ _ _ _ _ _ _ _
Section 3: Training
1. Please indicate how often the following types of trainings are provided by your customers to your fims’ staff.
Cronbach’s α = 0.835; Inter-Item Correlations: mean = 0.627, min: 0.600, max: 0.661
Types of training Never Rarely Frequently
1. Training on technologies used in production [ ] [ ] [ ]
2. Training of production/operation staff (engineers, technicians etc.)
[ ] [ ] [ ]
3. Training of management staff [ ] [ ] [ ]
2. Please indicate how often the following training modes are provided by your customers in the training of your firms’ staff.
Cronbach's α = 0.721; Inter-Item Correlations: mean = 0.234, min: 0.069, max: 0.574
Never Rarely Frequently
A) Visits to customers’ plants (training is provided as visual)
[ ] [ ] [ ]
B) Off-the-job training Seminars and courses
1. at customers’ plants [ ] [ ] [ ]
2. at our plant [ ] [ ] [ ]
3. at other private specialized institutes
[ ] [ ] [ ]
On-the-job training Working at the costumers’ plant for a period of time for taking theoretical and/or practical training related to product and production processes
In Turkey [ ] [ ] [ ]
Abroad [ ] [ ] [ ]
On-the-job training Taking theoretical and/or practical training in-house related to product and production processes through expert staff assigned by customers for a certain period of time
[ ] [ ] [ ]

437
Section 4: Market and Competition Structure
1. Please rank your firm’s major markets in order of importance, (1>2>3>4>5).
Domestic Market [ ]
European Union;______________ [ ]
USA [ ]
Middle East [ ]
Asia [ ]
Africa [ ]
Others, (please specify):_ _ _ _ _ _ _ _ _ _ _ _ _ _ _ _ _ _ _ _
2. Please indicate the location of your firm’s main competitors.
(Please tick as appropriate)
In Turkey [ ]
Abroad [ ]
Both [ ]
3. Please indicate how much you either agree or disagree with each of the following statements related to your firm’s business environment.
0-No response, 1–Strongly disagree, 2-Disagree 3-Neither agree nor disagree, 4-Agree, 5-Strongly agree
1. Domestic competition is intense 0 1 2 3 4 5
2. Global competition is intense 0 1 2 3 4 5
3. Relationships between customers and suppliers are strong 0 1 2 3 4 5

438
Section 5: Technology Capabilities related to Production and Design
1. Please indicate your firm’s capability level on a five-point scale ranging from 1(low) to 5(high) for each category when compared to other rival or leader companies in the sector. Cronbach's α = 0.751 0- No response, 1-Low <--------------------> 5- High
1. R&D capability 0 1 2 3 4 5
2. Reach to lower prices 0 1 2 3 4 5
3. Expertness on CAD-CAM-CAE* 0 1 2 3 4 5
4. Co-designer capability 0 1 2 3 4 5
5. Quality control capability 0 1 2 3 4 5
6. Testing and analytical capability 0 1 2 3 4 5
7. Design capability 0 1 2 3 4 5
8. Product improvement capability 0 1 2 3 4 5
9. Automation level in production process 0 1 2 3 4 5
10. On-time delivery 0 1 2 3 4 5
Others, (please specify): _ _ _ _ _ _ _ _ _ _ _ _ _ _ _ _ _ _
0 1 2 3 4 5
*CAD: Computer Aided Design, CAM: Computer Aided Manufacturing, CAE: Computer Aided Engineering 2. Please indicate international quality certifications obtained by your firm. (More than one choice can be selected)
ISO/TS 16949 [ ]
QS 9000 [ ]
ISO 9001 [ ]
ISO 9002 [ ]
ISO 14000 [ ]
ISO 14001 [ ]
ISO 18000 [ ]
Specific Certificates of Automotive Main Manufacturers (AMMs) [ ]
Others, (please specify): _ _ _ _ _ _ _ _ _ _ _ _ _ _

439
3. Please indicate what kinds of technology agreements your firm undertakes. Cronbach's α = 0.726 (More than one choice can be selected)
1. Turn-key projects [ ]
2. Management contracts [ ]
3. Licensing agreement [ ]
4. Know-how agreement [ ]
5. Purchasing of engineering services [ ]
6. Joint venture agreement [ ]
7. Purchasing of license and/or patent [ ]
8. Agreements on personnel exchange [ ]
9. Technical assistance agreement [ ]
10. International subcontracting agreements [ ]
11. Agreements on the determination of product design and/or technical specifications
[ ]
Others, (please specify):_ _ _ _ _ _ _ _ _ _ _ _ _ _ _ _ _
4. Please indicate the sources of technologies acquired and/or used by your firm. Cronbach's α = 0.779 (More than one choice can be selected)
1. Domestic automotive main manufacturers (DAMM) [ ]
2. Overseas automotive main manufacturers (OAMM) [ ]
3. Domestic suppliers (DS) [ ]
4. Overseas suppliers (OS) [ ]
5. Parent company [ ]
6. Universities [ ]
7. Private engineering and consultancy firms [ ]
Others, (please specify):_ _ _ _ _ _ _ _ _ _ _ _ _ _ _ _ _
5. Please indicate which of the following statements describes your firm’s design capability.
(More than one choice can be selected)
1. All technical specifications, design and quality standards of products produced are determined by customers
[ ]
2. Although basic designs are determined by customers, we can add details and/or make joint designing with customer (co-designer capability)
[ ]
3. Although our firm makes all or most of the designing, customer approval is necessary for final designs
[ ]
4. Our firm is entirely responsible for all stages of product design [ ]

440
6A. Does your firm carry out co- design activities related to products with customers?
6B. If your firm carries out co-design activities, please indicate your partners in these activities. Cronbach's α = 0.730 (More than one choice can be selected)
1. Domestic automotive main manufacturers (DAMM) [ ]
2. Overseas automotive main manufacturers (OAMM) [ ]
3. Domestic suppliers (DS) [ ]
4. Overseas suppliers (OS) [ ]
5. Parent company [ ]
6. Universities [ ]
7. Private engineering and consultancy firms [ ]
Others, (please specify):_ _ _ _ _ _ _ _ _ _ _ _ _ _
7. If your firm carries out co-product design activities, are you included to this process from the beginning?
Yes [ ]
Section 6: Supply Chain
1. Please answer the following four questions as Yes or No YES NO
1. Is your firm a subsidiary (or affiliate) firm dependent on any domestic firm/group/holding?
[ ] [ ]
2. Is your firm a subsidiary (or affiliate) firm dependent on any overseas firm/group/holding?
[ ] [ ]
3. Is your firm part of a multinational company? [ ] [ ]
4. Are there MNCs among your customers? [ ] [ ]
2. Please rank primary source(s) of inputs (raw materials and/or intermediate goods etc.) used in the production of major products in order of importance, (1>2>3>4>5)
Domestic automotive main manufacturers (DAMM) [ ]
Overseas automotive main manufacturers (OAMM) [ ]
Domestic suppliers (DS) [ ]
Overseas suppliers (OS) [ ]
Parent company [ ]
Other affiliates of parent company [ ]
Others, (please specify):_ _ _ _ _ _ _ _ _ _ _ _ _ _ _ _ _
Yes [ ] No [ ] Go to section 6
No [ ]

441
3. Please indicate the purchasing strategy of your most important customer. (Please choose only one option)
Customer prefers to study with only one supplier per item purchased [ ]
Customer prefers to study with many suppliers per item purchased [ ]
4. Please indicate approximately how many years you have been working together with your customer which you have most-intense cooperation with. 5. Please indicate the share (%) of subcontractor contracts in your total contracts.
The Share of Subcontracting Contracts in Total Contracts
___________%
Section 7: Cooperation
1. Please indicate the degree of importance of the following factors for carrying out cooperation activities with other firms.
0- No response, 1– Very unimportant, 2- Unimportant
3- Neither important nor unimportant, 4- Important, 5- Very important
Cronbach's α = 0.925; Inter-Item Correlations: mean = 0.580, min: 0.453, max: 0.819
1. Carrying out R&D activities 0 1 2 3 4 5
2. Know-how transfer 0 1 2 3 4 5
3. Reducing/sharing production costs/risks 0 1 2 3 4 5
4. Replacing technologically phased out products with the new ones 0 1 2 3 4 5
5. Establishing long-term strategic partnership 0 1 2 3 4 5
6. Improving product quality 0 1 2 3 4 5
7. Opening up global markets 0 1 2 3 4 5
8. Entering new technology fields 0 1 2 3 4 5
9. Learning about new technologies 0 1 2 3 4 5
Others, (please specify):_ _ _ _ _ _ _ _ _ _ _ _ _ _ _ _ _ 0 1 2 3 4 5
Duration of working ________ Years
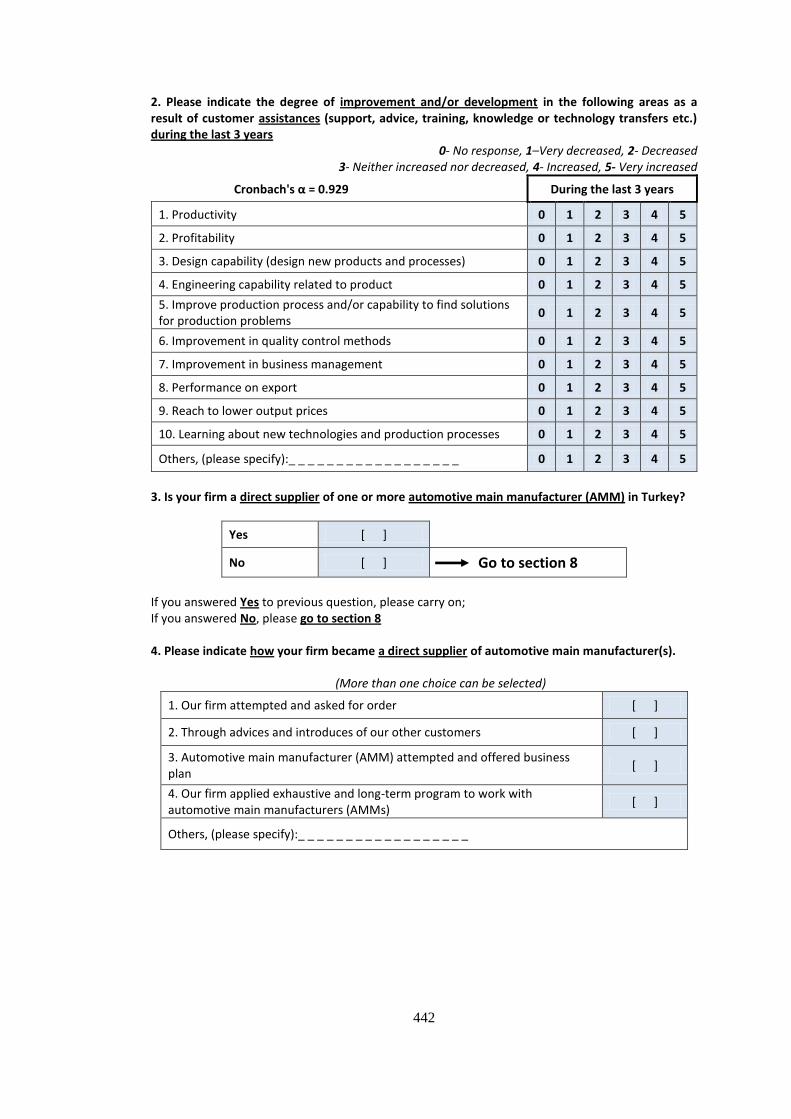
442
2. Please indicate the degree of improvement and/or development in the following areas as a result of customer assistances (support, advice, training, knowledge or technology transfers etc.) during the last 3 years
0- No response, 1–Very decreased, 2- Decreased 3- Neither increased nor decreased, 4- Increased, 5- Very increased
Cronbach's α = 0.929 During the last 3 years
1. Productivity 0 1 2 3 4 5
2. Profitability 0 1 2 3 4 5
3. Design capability (design new products and processes) 0 1 2 3 4 5
4. Engineering capability related to product 0 1 2 3 4 5
5. Improve production process and/or capability to find solutions for production problems
0 1 2 3 4 5
6. Improvement in quality control methods 0 1 2 3 4 5
7. Improvement in business management 0 1 2 3 4 5
8. Performance on export 0 1 2 3 4 5
9. Reach to lower output prices 0 1 2 3 4 5
10. Learning about new technologies and production processes 0 1 2 3 4 5
Others, (please specify):_ _ _ _ _ _ _ _ _ _ _ _ _ _ _ _ _ _ 0 1 2 3 4 5
3. Is your firm a direct supplier of one or more automotive main manufacturer (AMM) in Turkey?
Yes [ ]
No [ ] Go to section 8
If you answered Yes to previous question, please carry on; If you answered No, please go to section 8 4. Please indicate how your firm became a direct supplier of automotive main manufacturer(s).
(More than one choice can be selected)
1. Our firm attempted and asked for order [ ]
2. Through advices and introduces of our other customers [ ]
3. Automotive main manufacturer (AMM) attempted and offered business plan
[ ]
4. Our firm applied exhaustive and long-term program to work with automotive main manufacturers (AMMs)
[ ]
Others, (please specify):_ _ _ _ _ _ _ _ _ _ _ _ _ _ _ _ _ _

443
5. Please indicate how important you evaluate the following benefits of being a direct supplier of automotive main manufacturer(s) based on your experiences in this area.
0- No response, 1– Very unimportant, 2- Unimportant Cronbach's α = 0.951 3- Neither important nor unimportant, 4- Important, 5- Very important
1. Developing new business relationships with other firms 0 1 2 3 4 5
2. Good reputation and familiarness in sector 0 1 2 3 4 5
3. Stable trade 0 1 2 3 4 5
4. Learning/improving new production processes 0 1 2 3 4 5
5. Learning/improving new quality control methods 0 1 2 3 4 5
6. Better understand the customers’ blueprint and technical specifications 0 1 2 3 4 5
7. Improvement in testing and analyzing capabilities/techniques 0 1 2 3 4 5
8. Attendance to early stage in the design activities and developing prototype
0 1 2 3 4 5
9. Increase in design capability 0 1 2 3 4 5
10. Access to international developed markets 0 1 2 3 4 5
11. Improving in ability and knowledge about identifying and finding solutions to problems encountered in the production
0 1 2 3 4 5
12. Increase in productivity 0 1 2 3 4 5
13. Reducing risks involved with making decision to invest in new technology and/or machines
0 1 2 3 4 5
14. Learning about new technologies 0 1 2 3 4 5
Others, (please specify): _ _ _ _ _ _ _ _ _ _ _ _ _ _ _ _ _ _
0 1 2 3 4 5
6. Please answer the following seven questions as Yes or No
AMM=Automotive Main Manufacturer YES NO
1- Does AMM sent its expert staff to your firm for giving support or assistance about various topics?
[ ] [ ]
2- Does AMM arrange regular management and/or governance meetings?
[ ] [ ]
3. Did AMM give any support in the establishment process of your firm? (Cooperation in capacity and production planning/ in purchasing machines/ in technical organization etc.)
[ ] [ ]
4- Does AMM make regular visits to evaluate your firm about quality, cost and on-time delivery etc.?
[ ] [ ]
5- Does AMM provide regular training activities for your staff? [ ] [ ]
6- Does AMM transfer any knowledge or technology related to product/production process/design?
[ ] [ ]
7- Does your firm have to provide detailed information to AMM(s) about production and/or quality control processes?
[ ] [ ]

444
Section 8: R&D and Innovation Activities
1. Please answer the following six questions as Yes or No
Yes No
1. Does your firm carry out R&D activities? [ ] [ ]
2. Is there a separated R&D department in your firm? [ ] [ ]
3. If your firm is a direct supplier of automotive main manufacturer, are joint R&D activities being carried out with these manufacturer(s)?
[ ] [ ]
4. Are joint R&D activities being carried out with other customers? [ ] [ ]
5. Do your customers help or support your firm related to R&D and design? [ ] [ ]
6. Does your firm get any support from government or various institutions related to R&D (KOSGEB – TÜBİTAK – TEYDEB – TTGV - EU etc.)?
[ ] [ ]
2. If your firm carries out R&D activities, please indicate R&D expenditures (TL) and/or share of R&D expenditures in total sales (%) for 2008
R&D Expenditures (TL)
and/Or
Share of R&D expenditures in total sales
2008 TL_________________ ________%
3. If your firm carries out R&D activities, please indicate who started these activities. (More than one choice can be selected)
4A. Does your firm undertake innovation activities?
1. Domestic automotive main manufacturers that we are the supplier of [ ]
2. Overseas automotive main manufacturers that we are the supplier of [ ]
3. Foreign partner [ ]
4. Parent company [ ]
5. Own choice [ ]
Others, (please specify): _ _ _ _ _ _ _ _ _ _ _ _ _ _ _ _ _
No [ ] Go to question 5 Yes [ ]

445
4B. Please indicate how intensely you cooperate with the following external parties in your innovation activities.
Degree of cooperation 0- No response, 1-No cooperation, 2- Little, 3– Average, 4-Intense, 5- Very intense
Cronbach's α = 0.718; Inter-Item Correlations: mean = 0.336, min: 0.110, max: 0.572
1. Domestic automotive main manufacturers (DAMM) 0 1 2 3 4 5
2. Overseas automotive main manufacturers (OAMM) 0 1 2 3 4 5
3. Domestic suppliers (DS) 0 1 2 3 4 5
4. Overseas suppliers (OS) 0 1 2 3 4 5
5. Parent company 0 1 2 3 4 5
6. R&D institutions 0 1 2 3 4 5
7. Universities 0 1 2 3 4 5
8. Private engineering and consultancy firms 0 1 2 3 4 5
Others, (please specify): _ _ _ _ _ _ _ _ _ _ _ _ _ _ _ _ _ _
0 1 2 3 4 5
5. Please indicate the number of patents applied and obtained by your firm.
1. Number of patents applied ________
2. Number of patents obtained ________
6. Has your firm developed and/or introduced following innovation activities (TPP innovation activities*) into the market during the last 3-years?
Yes No
1. New or significantly improved methods for production process(es) [ ] [ ]
2. New or significantly improved product(s) [ ] [ ]
3. New or significantly improved service(s) [ ] [ ]
4. New or significantly improved logistics, delivery, and distribution methods
[ ] [ ]
5. New or significantly improved supporting activities related to processes (maintenance systems, and operations for purchasing/accounting/computing)
[ ] [ ]
* “Technological product and process (TPP) innovation activities are all those scientific, technological, organizational, financial and commercial steps which actually, or are intended to, lead to the implementation of technologically new or improved products or processes. A technologically new product is a product whose technological characteristics or intended uses differ significantly from those of previously produced products. A technologically improved product is an existing product whose performance has been significantly enhanced or upgraded. Technological process innovation is the adoption of technologically new or significantly improved production methods, including methods of product delivery” (see OECD, 1997, Oslo Manual, pp.32-39).

446
Section 9: Performance and Future Projections
1. Please indicate how your firm’s production capability has been improved in the following areas during the last 3-years.
0- No response, 1– Very increased, 2- Increased 3- Neither increased nor decreased, 4- Decreased, 5– Very decreased
Cronbach's α = 0.745; Inter-Item Correlations: mean = 0.379, min: 0.319, max: 0.508
For the last 3 years
1. Cycle time* 0 1 2 3 4 5
2. Defect rate 0 1 2 3 4 5
3. Average costs 0 1 2 3 4 5
4. Duration of on-time delivery 0 1 2 3 4 5
* Cycle time: Period required to complete one cycle of an operation; or to complete a function, job, or task from start to finish. (from businessdictionary.com) 2. Please indicate the effectiveness degree of the following factors in the improvement of your firm’s production capability and/or in developing new technologies related to product/process in recent years.
0- No response, 1– Very ineffective, 2- Ineffective
Cronbach's α = 0.795 3- Neither effective nor ineffective, 4- Effective, 5- Very effective
1. Being a direct supplier of automotive main manufacturer (AMM) 0 1 2 3 4 5
2. Knowledge and technology transfers from domestic automotive main manufacturers (DAMM)
0 1 2 3 4 5
3. Knowledge and technology transfers from foreign manufacturers 0 1 2 3 4 5
4. Undertaking R&D activities 0 1 2 3 4 5
5. Hiring skilled-specialist employees from other firms 0 1 2 3 4 5
6. Skill and capability improvement of employees through in-house training
0 1 2 3 4 5
7. Improvements in our suppliers’ quality level 0 1 2 3 4 5
8. Cooperation with universities and other institutions* in Turkey 0 1 2 3 4 5
9. Using of new production methods 0 1 2 3 4 5
10. Acquisition of new software, hardware, equipment and tools 0 1 2 3 4 5
Others, (Please specify): _ _ _ _ _ _ _ _ _ _ _ _ _ _ _ _ 0 1 2 3 4 5
*Other institutions: Various research and consultancy institutions/firms, private or public research laboratories etc.
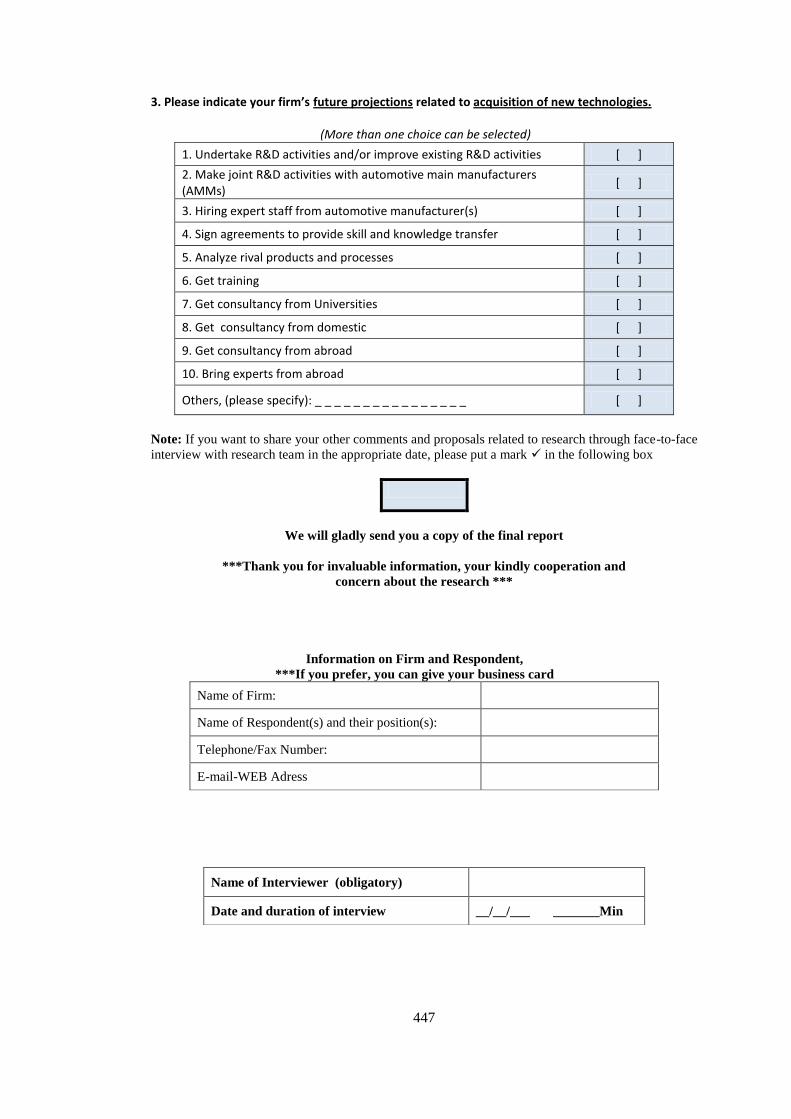
447
3. Please indicate your firm’s future projections related to acquisition of new technologies.
(More than one choice can be selected)
1. Undertake R&D activities and/or improve existing R&D activities [ ]
2. Make joint R&D activities with automotive main manufacturers (AMMs)
[ ]
3. Hiring expert staff from automotive manufacturer(s) [ ]
4. Sign agreements to provide skill and knowledge transfer [ ]
5. Analyze rival products and processes [ ]
6. Get training [ ]
7. Get consultancy from Universities [ ]
8. Get consultancy from domestic [ ]
9. Get consultancy from abroad [ ]
10. Bring experts from abroad [ ]
Others, (please specify): _ _ _ _ _ _ _ _ _ _ _ _ _ _ _ _ [ ]
Note: If you want to share your other comments and proposals related to research through face-to-face
interview with research team in the appropriate date, please put a mark in the following box
We will gladly send you a copy of the final report
***Thank you for invaluable information, your kindly cooperation and
concern about the research ***
Information on Firm and Respondent,
***If you prefer, you can give your business card
Name of Firm:
Name of Respondent(s) and their position(s):
Telephone/Fax Number:
E-mail-WEB Adress
Name of Interviewer (obligatory)
Date and duration of interview __/__/___ _______Min

448
Appendix J: List of Domestic Automotive Main Manufacturers (DAMM)
:: Interviewed DAMM
DAMMFS
(%)
Establishment
DateLocation Licence
Types of Vehicles
Manufactured
Capital
(TL)
Total
Capacity
(2011)
Total
Production
(2010)
Sales
(TL)
(2010)
Toyota 100 1994 Sakarya Toyota P.CAR 150M 150,000 83,286 2,186M
Honda Türkiye 100 1997 Kocaeli HONDA MOTOR EUROPE P.CAR 180M 50,000 20,305 473M
M.A.N Türkiye 99.9 1966 Ankara MAN Truck & BUS AG BUS 65M 1,700 1,132 393M
Mercedes-Benz Türk 85 1968/1985 İstanbul/Aksaray Mercedes-BenzRoad Tractor / Truck
/ Bus275M 18,500 14,480 2,069M
Hyundai Assan 70 1997 Kocaeli HYUNDAI MotorP. Car / Pick Up /
Minibus206M 125,000 77,000 1,500M
Oyak Renault 51 1971 Bursa Renault P.CAR 323M 360,000 307,083 6,450M
Ford Otosan 41 1983/2001 Eskişehir/Kocaeli FORDTruck / Pick Up /
Minibus351M 330,000 242,070 5,753M
Tofaş 37.8 1971 Bursa FIAT P. Car / Pick-Up 500M 400,000 312,245 5,409M
Türk Traktör 37.5 1954 Ankara - Farm Tractor 53M 35,000 28,277 984M
Anadolu Isuzu 29.74 1966 Kocaeli ISUZUTruck / Pick Up /
Midibus / Minibus25M 13,155 3,292 226M
Otokar 0 1963 Sakarya Land Rover / FruehaufPick Up / Bus /
Minibus / Midibus24M 6,700 2,236 516M
B.M.C 0 1966 İzmir -
Truck / Pick Up /
Midibus / Minibus /
Bus
500M 20,000 3,342 681M
Karsan 0 1966 Bursa
Karsan / Peugeot / Hyundai
Motor / Renault Trucks / Breda
Menarini Bus
Truck / Pick Up /
Minibus / Midibus /
Bus
196M 95,050 24,719 514M
Temsa Global 0 1987/2008 Adana/SakaryaTemsa / Mitsubishi / Fuso
Truck & Bus Corp.
Pick Up / Bus /
Midibus210M 10,750 3,367 377M
Hattat 0 2002 Tekirdağ Valtra, Universal, Hattat Farm Tractor 40M 10,500 2,148 107M
Source: Constructed by Author depend on OSD data; Legend: FS (Foreign Share); P.CAR (Personal Car) Total 3,098M 1,626,355 1,124,982 27,638M
FS
> 5
0%
29%
< F
S <
42%
FS
= 0
%

449
Appendix K:
Semi-Structured Interview Guide used in Interviews
with AMMs in Turkey
MIDDLE EAST TECHNICAL UNIVERSITY
Department of Economics & Science and Technology Policies
Research Center
R&D, Innovation, Knowledge and Technology Transfer
Research in Turkey Automotive Industry
A) General Information
Please indicate your company’s ownership structure.
o Is your company a part of a MNC or network?
If yes, please state headquarters and other locations of these?
What is the role and importance of your company within this MNC or network?
What are your company’s main products?
What are your major markets? (domestic, country, region)
What are the major sources of inputs (raw material, components etc.) used in production?
B) Technology Activities
What are the most critical technologies used in production?
What are the sources of these technologies (explicit or tacit) used in production?
What kind of innovation and technology activities does your company carry out in order to
improve or change your products- production process – organization - business management or
to develop new ones? (R&D, patent, design, design verification, test and innovation activities
etc.). Please specify.
C) Strategic Collaboration
Who are your company’s strategic partners? Where are they located?
What kinds of collaboration exist with these partners? (R&D, production, production process,
design etc.)
Do you carry out innovation and technological activities related to product/production
process/organizational improvement or development? If yes, please specify.
Are any sorts of knowledge or technology related to product - production process - business
management transferred by your partners? If yes, please specify how and in what way.

450
D) Relationship with Suppliers
How many direct suppliers does your company have?
o Who are they?
o Where are they located? (domestic, abroad)
o Is it important for your company that suppliers are close by?
How are these suppliers selected by your firm?
What are the most important criteria to be supplier of your firm?
What kinds of collaborations are carried out with these selected suppliers? What kind of
benefits and problems do you experience while collaborating? Please specify.
What are the most important expectations and demands of your company from these suppliers?
(Quality control, production, JIT etc.)
Do you supervise and follow these suppliers regularly?
Do you have any evaluation and reward system?
Does your company transfer any kind of knowledge and technology to these suppliers related
to product / production process / business management? If yes, please specify.
Does your company carry out training programs or activities to these suppliers? If yes, please
specify.
Do you send your own expert staff for a certain period of time to suppliers to help various
issues? If yes, please specify.
Does your company provide any other support to these suppliers? If, yes please specify.
E) Views, Future Projections and Government Policies related to Industry
What do you think about the future of Automotive Industry and your company?
o What are the challenges and opportunities related to sector?
o How will Turkey Automotive Industry be affected from these?
What do you think about the local suppliers’ capabilities and competitive levels in Turkey?
o What are their strengths and weaknesses compared to China, South Korea,
Malaysia, Thailand, Germany, France and Italy?
o What kind of suggestions do you have to increase their capabilities and
competitiveness?
What are the future strategies of your company about technology and production in terms of
global competition?
What do you think about the MNCs role in the development of Turkey automotive industry?
What do you think about the government role in the development and upgrading of local
suppliers’ technology capabilities? What kinds of policies are applied by government?
Do you have any suggestions
o to enhance KTTs from MNCs to local supplier firms?
o to increase technological capabilities of local supplier firms?

451
Appendix L:
Summary Statistics for Key Indicators in the Survey
according to Firm Descriptions
Source: Author calculations based on survey results
Legend: NPAT (Number of Owned and Applied Patents); NOPAT (Number of Owned Patents);
NAPAT (Number of Applied Patents); Worktogether (number of years worked for the most important
customer); Subcontracting Agr. (subcontracting agreements or contracts)
O bs. Mean St. Dev. Min Max O bs. Mean St. Dev. Min Max
Age (year) 120 28.84 13.78 4 73 45 18.56 13.85 2 53
Turnover (TL) 105 49272931 68056943 800000 488000000 38 97316793 112000000 4000000 400000000
Employment 119 255.33 280.48 15 2275 42 404.36 551.20 16 3011
Engineer 119 16.38 21.25 1 170 42 27.50 26.93 2 106
White-Collar 119 36.92 33.84 2 195 42 67.24 103.87 3 642
Blue-Collar 118 204.01 245.70 5 2100 41 318.27 501.69 10 2774
Foreign Share (%) 120 0 0 0 0 45 76.00 29.10 0 100
Export Intensity (%) 120 34.53 27.50 0 100 45 44.00 33.20 0 100
R&D Expenditures (TL) 100 913846 3628707 0 36000000 33 2565398 4332883 0 20000000
R&D Intensity (%) 104 2.55 4.83 0 31 35 2.91 3.50 0 15
NPAT 114 3.75 12.59 0 122 40 1.62 4.12 0 22
NOPAT 114 1.56 4.63 0 42 40 0.82 2.02 0 10
NAPAT 112 2.23 8.15 0 80 39 0.82 2.22 0 12
Worktogether (year) 118 18.12 10.29 2 55 45 15.80 11.36 1 55
Subcontracting Agr. (%) 113 13.17 27.55 0 100 42 9.00 24.00 0 100
Local Firms (LF) Foreign Firms (FF)
O bs. Mean St. Dev. Min Max O bs. Mean St. Dev. Min Max
Age (year) 165 26.04 14.50 2 73 132 26.38 14.31 2 73
Turnover (TL) 143 62039832 84353133 800000 488000000 114 66568299 82750000 800000 400000000
Employment 161 294.20 374.41 15 3011 129 325.08 403.91 16 3011
Engineer 161 19.42 23.39 1 170 130 22.24 25.06 1 170
White-Collar 161 44.70 61.16 2 642 129 49.05 65.42 2 642
Blue-Collar 159 233.47 333.07 5 2774 127 258.24 361.75 10 2774
Foreign Share (%) 165 20.68 37.07 0 100 132 22.00 38.00 0 100
Export Intensity (%) 165 36.83 29.41 0 100 133 35.00 28.30 0 100
R&D Expenditures (TL) 133 1323629 3865176 0 36000000 107 1540915 4263426 0 36000000
R&D Intensity (%) 139 2.64 4.52 0 31 111 2.77 4.87 0 31
NPAT 154 3.20 11.05 0 122 125 3.58 12.12 0 122
NOPAT 154 1.37 4.12 0 42 125 1.51 4.48 0 42
NAPAT 151 1.87 7.13 0 80 123 2.10 7.82 0 80
Worktogether (year) 163 17.48 10.61 1 55 131 18.59 10.85 1 55
Subcontracting Agr. (%) 155 12.16 26.61 0 100 125 12.00 27.30 0 100
All Firms (AF) Direct Supplier Firms (DSF)

452
Appendix M:
Turkish Summary
ÇUŞ’LAR YOLUYLA TEKNOLOJİ YAYILIMLARI VE TRANSFERİ:
TÜRKİYE OTOMOTİV SANAYİ ÜZERİNE BİR SAHA ÇALIŞMASI
I. Giriş
Bu tez, bilgi ve teknolojinin özellikle gelişmekte olan ülkelerin ekonomik kalkınmasındaki
önemi tarafından motive edilmiştir. Bu kapsamda, özellikle ÇUŞ'ların rolüne dikkat çekerek
Türk ekonomisinde Doğrudan Yabancı Yatırımların (DYY) yurtiçi firmalara bir etkisinin
olup olmadığı, yurtiçi firmalara teknoloji yayılımlarına ve transferlerine yol açıp açmadığı,
açıyorsa ne ölçüde bir etkisi olduğu üzerine bulgular sunmayı amaçlamaktadır. Bu kapsamda
bu tez iki ana kısımdan oluşmaktadır:
İlk kısımda (Bölüm 3), Türk imalat sanayinde DYY ilişkili teknoloji yayılımlarının, yabancı
firmalarla yatay (sektör-içi) ve dikey (ileri ve geri) bağlantılar (sektörler arası) yoluyla,
yurtiçi firmaların verimlilik seviyeleri üzerine bir etkisi olup olmadığını analiz etmek amacı
ile, 2003-2006 yıllarına ilişkin firma seviyesinde panel veri seti kullanarak, bir dizi
ekonometrik analiz gerçekleştiriyoruz. Ayrıca, firmaların massetme kapasitelerinin, bu
teknoloji yayılımlarını ne derecede etkilediğini de teknoloji açığı değişkeni vasıtasıyla,
firmaların verimlilik seviyeleri üzerine olan etkilerini değerlendirerek analiz etmeye
çalışıyoruz. Türkiye üzerine bu konuda çok az sayıda çalışma vardır ve bunların hemen hepsi

453
DYY girişlerinin oldukça düşük seviyede olduğu 2001 dönemi öncesine odaklanmaktadır ve
bizim bilgimize göre bu çalışma 2001 yılı sonrası dönem için Türk imalat sanayi ile ilgili ilk
çalışmadır. Ekonometrik tahmin sonuçları yatay ve geriye doğru teknoloji yayılımları
açısından olumlu bulgular üretirken, ileri teknoloji yayılımları açısından negatif bulgular
üretmiştir. Sonuçlarımız düşük teknoloji kapasitesine sahip firmaların yatay teknoloji
yayılımlarından daha fazla faydalandıklarını da göstermiştir.
İlk kısımdaki ekonometrik çalışmanın bulguları, teknoloji yayılımlarının yurtiçi firmaların
verimlilik seviyeleri üzerine etkilerini inceleyerek, DYY aracılığıyla teknoloji yayılımlarının
oluşumunun anlaşılması ve önemini göstermesi açısından faydalı olmasına rağmen, elde
edilen sonuçların altında yatan mekanizmaları ortaya çıkarmak için yeterli değildir. Örneğin,
bu teknoloji yayılımlarının karmaşık doğasını, ne şekilde meydana geldiğini, bu yayılımların
neler olduğunu, firmalar arasında yayılma etkileri doğuran faktörleri, firmaların
özelliklerinin ve firmalar arasındaki stratejik işbirliklerinin bu transferlerde rollerinin ne
olduğunu anlamak mümkün değildir. Bunun yerine, yapılan ekonometrik analizler sadece
yabancı varlığının yatay ve dikey bağlantılar yoluyla yerli firmaların verimlilik düzeyleri
üzerine olan etkilerinin olasılığını göstermekte, bu firmalar arasındaki ilişkilerin
yoğunluğunu ve kalitesini göstermemektedir.
Yukarda açıklanan nedenlerden dolayı, tezin ikinci kısmında (4. 5. 6. ve 7. Bölümler) bir
adım daha ileri giderek, Türk otomotiv sanayiinde firma düzeyinde saha çalışmasına dayalı
detaylı ve kapsamlı deneysel bir araştırma gerçekleştiriyoruz. Bu çalışma ile sektörde firma
içi (intra-firm) ve firmalar arası (inter-firm) bilgi ve teknoloji transferlerinin varlığını,
yoğunluğunu, doğasını ve –eğer varsa- ne tür transferlerin gerçekleştiğini sorgulamayı
amaçlıyoruz. Ayrıca, çalışma bu transferlerin oluşumunu etkileyen yurtiçi tedarikçilerin
özelliklerini, ÇUŞ’ların tedarik zincirinde yurtiçi tedarikçilerin konumlarını, söz konusu
transferlerin yurtiçi tedarikçilerin performansları üzerine etkilerini de ortaya çıkarmayı
amaçlamaktadır. Bu analizler sırasında, firmaların massetme kapasiteleri, teknolojik
yetenekleri, Ar-Ge ve yenilik faaliyetlerinin hacmi ve nitelikleri de ele alınacaktır. Bu
amaçlar için, hem tedarikçiler hem de müşterilerden firma düzeyinde ayrıntılı veri ve bilgi
toplamak amacıyla niceliksel ve niteliksel iki farklı araştırma yöntemi kullanılmıştır. İlk
olarak, akademik yazından faydalanarak araştırma amaçları doğrultusunda detaylı ve orijinal
bir anket formu oluşturulmuştur. Daha sonra bu anketin uygulaması transferlerin alıcıları
olan ve otomotiv yan sanayiinde faaliyet gösteren 166 adet yurtiçi tedarikçi firmanın üst
düzey yöneticileri ile başarılı bir şekilde yüz yüze gerçekleştirilmiştir. İkinci olarak, bu
transferlerin kaynakları olan ve Türkiye’de faaliyet gösteren 11 adet otomotiv ana sanayi

454
firmasının 19 üst düzey yöneticisi ile yarı-yapılandırılmış mülakat kılavuzuna dayalı olarak
yüz yüze ve derinlemesine mülakatlar gerçekleştirilmiştir.
II. Amaç ve Yöntem
Bu tezin firmalar arası (ana sanayi firmalarından yurtiçi tedarikçilerine) bilgi ve teknoloji
transferleri ile ilgili olarak iki ana amacı vardır. Birincisi Türkiye otomotiv sanayiinde
firmalar arası seviyede gerçekleşen DYY’lerin geriye doğru bağlantılar aracılığı ile
ÇUŞ’lardan (müşterilerden) yurtiçi doğrudan tedarikçilerine bilgi ve teknoloji transferlerine
yol açıp açmadığını analiz etmektir. İkincisi, gerçekleşen bu transferlerin göreli önemini ve
tedarikçilerin performansları üzerine etkilerini analiz etmektir. Bu nedenle, ikinci bölümün
temel amacı Türk otomotiv sanayiinde ÇUŞ’lardan yurtiçi tedarikçilerine ürün (tasarım, eş-
tasarım, ortak faaliyetler, çeşitli belgeler vb.), üretim süreci (çeşitli know-how, Ar-Ge,
lojistik vb.) ve eğitimlere ilişkin (iş-üzerinde, iş-dışında) ne tür bilgi ve teknoloji transferleri
sağlandığını ve bu transferlerin tedarikçilerin performans seviyeleri üzerine etkilerini analiz
etmektir. Bunlara ek olarak, aşağıdaki konularda analize dâhil edilmiştir:
Transferlerde önemli rol oynayan firma karakteristiklerini belirlemek,
Transferlerin kanallarını ve belirleyicilerini anlamak ve ortaya çıkarmak,
Tedarikçilerin ÇUŞ'ların küresel değer zincirinde ki yeri hakkında ipuçları elde etmek,
Bir dizi performans göstergesi kullanılarak, transferlerin tedarikçilerin performans
seviyeleri üzerine etkilerini analiz etmek,
Tedarikçilerin Ar-Ge, yenilik ve teknoloji aktivitelerini değerlendirmek.
Tezin firmalar içi (küresel ana sanayi firmalarından yurtiçi iştiraklerine) bilgi ve teknoloji
transferleri ile ilgili temel amacı ise, Türkiye’de faaliyet gösteren otomotiv ana sanayi
firmalarına ortakları olan ÇUŞ’lar tarafından gerçekleştirilen transferlerin kanallarını, bu
transferlerde rol oynayan ana firma karakteristiklerini, ana firmaların ÇUŞ’lar ile olan
stratejik işbirliklerini, Ar-Ge ve teknoloji faaliyetlerini analiz etmektir.
Bu amaçları gerçekleştirmek ve firma seviyesinde ayrıntılı veri ve bilgi toplamak için iki
farklı araştırma yöntemi kullanılmıştır.

455
İlk olarak, ana örneklemde yer alan 298 tedarikçiden firma seviyesinde niceliksel veri
toplamak için anket çalışması gerçekleştirilmiştir. Anket uygulama süreci sonunda bu
firmalardan 166 tanesinin üst düzey yöneticileri ile yüz-yüze anket çalışması başarılı
bir şekilde gerçekleştirilmiş (bu 166 firmanın 132 tanesi doğrudan tedarikçi
konumundadır) ve %55,7 yanıt oranı elde edilmiştir. TÜİK istatistiklerine göre, firma
sayısı temel alındığında anket çalışması gerçekleştirilen örneklem Türk otomotiv yan
sanayiinin %4,4’ünü temsil etmektedir. Diğer taraftan yan sanayinin (NACE342 ve
NACE343) toplam istihdam ve cirosunu temel aldığımızda, örneğimizin temsil oranı
çok daha yüksek olmakta ve sırasıyla otomotiv yan sanayi toplam istihdamının %55,
toplam cirosunun ise %66’sını başarılı bir şekilde temsil etmektedir. Elde edilen anket
verileri kullanılarak daha önce ifade edilen amaçlarımızı otomotiv yan sanayiinde
faaliyet gösteren ve transferlerin alıcıları olan tedarikçiler açısından analiz etmeyi
hedefliyoruz.
İkinci olarak, araştırma amaçlarına uygun olarak tasarlanmış yarı-yapılandırılmış
mülakat kılavuzuna bağlı olarak Türkiye’de faaliyet gösteren 11 adet otomotiv ana
sanayi firmasının 19 üst-düzey yöneticisi ile derinlemesine mülakatlar başarılı bir
şekilde gerçekleştirilmiştir. OSD verilerine göre firma sayısı temel alındığında
mülakat gerçekleştirilen örneklem otomotiv ana sanayiinin %73’ünü temsil
etmektedir. Ancak, ana sanayinin toplam sermaye (%80), kapasite (%83), üretim
(%89) ve satışları (%91) temel alındığında, örneklemimizin temsil oranı çok daha
yüksek olmaktadır. Mülakatlardan toplanan niteliksel veriler ile amaçlarımızı ana
firmalar açısından analiz etmeyi hedefliyoruz. Başka bir deyişle, amaçlarımızı iki
farklı bakış açıdan analiz etmeyi hedefliyoruz: Birincisi, niceliksek veriler kullanarak
bu transferlerin alıcıları olan tedarikçilerin bakış açısından; ikincisi niteliksel verileri
kullanarak bilgi be teknoloji transferlerinin kaynakları olan otomotiv ana sanayi
firmaları (müşteriler) açısından.
Tezin saha çalışmasına dayalı olan ikinci bölümü TÜBİTAK ve ODTÜ Öğretim üyesi
Yetiştirme Programı (ÖYP) tarafından desteklenmiştir, ayrıca OSD ve TAYSAD’ın (Türk
otomotiv sektörünün iki ana temsilcileri) profesyonel destekleri de çalışmanın başarısında
önemli bir rol oynamıştır. Bu tür çalışmaların yüksek finansal bütçe, geniş zaman ve
araştırma ekipleri gerektirdiği, firma seviyesinde oldukça detaylı, kapsamlı ve gizli bilgiler
toplanmasını içerdiği ve bu nedenlerle başarılı olması için oldukça çaba gerektirdiği
düşünüldüğünde, çalışmanın dikkate değer bir başarı ile gerçekleştirildiği iddia edilebilir.
Bildiğimiz kadarıyla, bu çalışma DYY ile ilişkili firma içi ve firmalar arası bilgi ve teknoloji
transferleri üzerine ulusal düzeyde başarı ile gerçekleştirilen ilk deneysel araştırmadır.

456
III. Ana Bulgular
Tezin panel veri seti kullanılarak Türk imalat sanayiinde teknoloji yayılımlarının analiz
edildiği birinci kısım ile ilgili bulguları aşağıdaki şekilde özetlenebilir.
Bölüm 3’te ki bulgularımız, yabancı firmalardan yerel firmalara yatay teknoloji yayılımları
olduğunu göstermiştir. Bununla birlikte, tahmin sonuçlarımız ihracat odaklı ve bütün
firmalar ile karşılaştırıldığında, yerel ve ihracat odaklı firmaların aynı sektördeki yabancı
varlığından daha fazla fayda sağladığını göstermektedir. Ayrıca, regresyon sonuçları
firmaların azınlık ve çoğunluk yabancı sahiplik yapısına göre farklı sonuçlar üretmiştir. Buna
göre yatay teknoloji yayılımları, yabancı sermayenin çoğunlukta olduğu ve/veya tam yabancı
sermayeli firmalardan ortaya çıkmakta, yabancı sermayenin azınlıkta olduğu firmalardan bu
tür yayılımlara ilişkin bir etki gözlenmemektedir.
Dikey teknoloji yayılımlarına ilişkin regresyon sonuçlarımız ise yatay yayılımlara ilişkin
olarak pozitif kanıtlar üretirken, tahmin edilen sektör basamak seviyelerine bağlı olarak
(NACE) geriye (yabancı firmalar ile onların yurtiçi tedarikçileri arasındaki bağlantılar) ve
ileriye (girdi sağlayan yabancı firmalar ile onların yurtiçi müşterileri arasındaki bağlantılar)
doğru teknoloji yayılımlarına ilişkin farklı sonuçlar üretmiştir. İleri teknoloji yayılımlarının
etkisi bütün NACE basamak seviyelerinde negatif yönde bulunmuştur. Geriye doğru
teknoloji yayılımları ise iki basamaklı NACE seviyesinde negatif, üç ve dört basamaklı
NACE seviyelerinde pozitif olarak bulunmuştur. Tahmin edilen örnekleme göre sonuçları
karşılaştırdığımızda, üç ve dört basamaklı NACE seviyelerinde yerel sermayeli firmaların
girdi sağladıkları sektörde faaliyet gösteren yabancı firmalardan pozitif etkilendikleri, fakat
girdi aldıkları sektörlerdeki yabancı varlığından negatif etkilendikleri görülmektedir. Diğer
yandan yerel sermayeli firmalar iki basamaklı NACE seviyesinde dikey teknoloji
yayılımlarından negatif olarak etkilenmektedirler. Tahminler ihracat odaklı firmalar için
değerlendirildiğinde, yatay ve dikey yayılımlara ilişkin herhangi bir kanıt elde edilememiştir.
Bu durum, ihracat odaklı firmaların yabancı firmalar ile olan bağlantılarının oldukça zayıf
olduğunu ve onların verimlilikleri üzerine bir etkileri olmadığı anlamına gelmektedir.
Teknoloji yayılımlarından faydalanabilmek için firmaların yüksek teknoloji yeteneklerine ve
massetme kapasitesine sahip olmaları gerektiğini varsaydığımızdan, analizler sonucunda
teknoloji açığı (TGAP) ile etkileşim içerisinde olan yatay ve dikey teknoloji yayılımları vekil
değişkenleri ile verimlilik düzeyi arasında negatif bir korelasyon beklenmektedir. Teknoloji
açığı ile ilgili analiz sonuçları firmaların yabancı teknoloji yayılımlarından

457
faydalanabilmeleri ve bunları özümsemeleri açısından firmaların massetme kapasitelerinin
oldukça önemli bir rol oynadığını doğrulamış, ancak yatay ve dikey teknoloji yayılımları için
farklı sonuçlar üretmiştir. Dikey teknoloji yayılımlarında, beklendiği gibi yüksek teknolojik
yeteneklere sahip firmalar dikey (bütün NACE seviyelerinde) ve geriye doğru (yalnızca iki
basamaklı NACE seviyesinde) teknoloji yayılımlarından daha fazla faydalanabilmektedir.
Ancak, tahmin sonuçlarımız düşük teknolojik yeteneğe sahip olan firmaların yatay teknoloji
yayılımlarından daha fazla faydalandıklarını da göstermiştir. Yatay teknoloji yayılımlarına
ilişkin bu bulgu, bizim başlangıç hipotezimiz ile çatışmaktadır, ancak, aslında biz bu
sonucun daha makul olabileceğini düşünmekteyiz. Müşteriler ile tedarikçiler arasındaki
ilişkiler (yatay ilişkiler) firmaların teknoloji seviyelerine göre belirlenmektedir ve açıktır ki
yabancı firmalarla dikey ilişkiler kurabilmek yatay ilişkiler kurmaya göre daha fazla
teknolojik yetenek gerektirmektedir. Ayrıca, firmaların massetme kapasiteleri görece olarak
yatay teknoloji yayılımlarından ziyade dikey teknoloji yayılımlarından faydalanmak
açısından daha önemli bir rol oynamaktadır. Zaten yatay teknoloji yayılımlarının özellikleri
nedeniyle, yüksek teknolojik yeteneklere sahip olan firmaların bu yayılımlardan çokta fazla
olumlu etkilenmeleri beklenemez. Bu nedenlerden dolayı, dikey teknoloji yayılımları ile
karşılaştırıldığında, teknoloji açığı değişkeni düşük teknolojik yeteneğe sahip firmaların
yatay teknoloji yayılımlarından faydalanmaları üzerine daha fazla pozitif etki etmiş olabilir.
Tezin alan araştırmasına dayalı ikinci bölümü ile ilgili bulgular ise aşağıdaki şekilde
özetlenebilir.
Bölüm 5’te bilgi ve teknoloji transferleri açısından başlıca bulgular şu şekilde özetlenebilir:
Otomotiv ana sanayi firmalarından yurtiçi tedarikçilere geriye doğru bağlantılar
aracılığı ile yapılan bilgi ve teknoloji transferleri, temel olarak dokümantasyon
sağlama, lojistik yönetimi, kalite kontrol, know-how, Ar-Ge, eş-tasarım ve eş-
geliştirme faaliyetleri, tasarım ve maliyet azaltma gibi konu başlıkları altında çeşitli
yardımlar şeklinde olmaktadır.
Yabancı tedarikçiler ile karşılaştırıldığında, yerel tedarikçiler daha az bilgi yoğun
ve/veya daha az kaliteli üretim-ürün-eğitim ile ilgili transferlere dâhil olmak
eğilimindedirler.
Diğer taraftan, Türkiye'de ki ana sanayi firmalarının doğrudan tedarikçisi olma ve
dolayısıyla tedarik zinciri içinde müşterilere daha yakın olmak; transferlerin sayısı,
kalitesi ve yoğunluğu üzerinde olumlu bir etki göstermektedir.

458
Ayrıca, müşteriler tarafından tedarikçilerin personeline eğitim faaliyetlerinin çeşitli
formlarda ve yöntemlerde sağlanmakta olduğu da tespit edilmiştir. Bu eğitim
faaliyetleri çoğunlukla üretim ve işletme personeline iş-dışı eğitimler şeklinde
verilmektedir. Ancak, yabancı tedarikçiler bu tür eğitim faaliyetlerine yerel
firmalardan daha fazla dâhil olmaktadırlar. Bu durum, yabancı firmaların beşeri
sermayesinin daha az yetenekli olduğu bu nedenle de daha fazla eğitime ihtiyaç
duydukları anlamına gelmemekte, tam tersine, müşterilerin yabancı firmalar ile
çalışmayı bu firmaların gelişmiş teknoloji yetenekleri, massetme kapasiteleri ve
yetişmiş insan sermayesi kaynağına sahip olmaları nedeni ile daha çok tercih
ettiklerini göstermektedir. Yabancı tedarikçilerin birçok gösterge ve massetme
kapasitesi açısından yerel tedarikçilerden daha üstün olduklarına ilişkin bulgular bunu
doğrulamaktadır. Ayrıca bilgi ve teknoloji transferleri genellikle yeni ürün geliştirme
süreçlerinde yoğun olarak müşteriler tarafından sağlanmaktadır. Bu durum yabancı
tedarikçiler ile müşteriler arasındaki stratejik ilişkilerin oldukça güçlü olduğunu
doğrulamakta ve aynı zamanda bu faaliyetlerden yararlanabilmek için oldukça
yetenekli işgücüne sahip olmak gerektiğini göstermektedir.
Son olarak, bulgular müşterilerin tedarikçilerine genel olarak finansal yardımlarda
bulunmayı tercih etmediklerini, ama gerekmesi durumunda bu tür yardımların
çoğunlukla makine-donanım alımında ön finansman sağlama ve teslimattan önce
siparişlere ilişkin ön ödemelerde bulunma şekillerinde yapıldığını göstermektedir.
Anket çalışmasından elde edilen niceliksel verilere dayalı olarak Bölüm 6’da gerçekleştirilen
ekonometrik analizlere ilişkin bulguları incelediğimizde ise 5 faktör ön plana çıkmaktadır:
Otomotiv ana sanayiinde en az bir firmanın doğrudan tedarikçisi olmanın (ilk-kademe
tedarikçi) ürün ve üretim sürecine yönelik bilgi ve teknoloji transferlerini
tetiklemediği ama eğitim yoluyla yapılanları tetiklediği görülmektedir (bk. Tablolar
6.28 ve 6.29). Bu durum, doğrudan tedarikçi firmaların teknolojik yetenek düzeyleri
ile massetme kapasitelerinin çok iyi olmadığını gösterebilir. Madalyonun öbür yüzü
doğrudan tedarikçi olmanın daha alt kademe tedarikçiler ile işbirliği yapma olasılığını
azaltması ve ikinci-üçüncü kademe tedarikçilerin bu bilgi ve teknoloji aktarımı
kanallarından yararlanamamasıdır (bk. Tablo 6.29). Ayrıca ilginç bir nokta da
doğrudan tedarikçi olmanın bu firmaların performansları üzerinde etkisinin
olmamasıdır. Anketimize katılan firmaların önemli bir bölümünün birinci kademe
tedarikçi olmasının bu sonuçları etkilemiş olabileceği göz önünde bulundurulmalıdır.

459
Otomotiv yan sanayinde faaliyet gösteren yabancı firmaların özellikle Ar-Ge
yetenekleri yerli firmalara göre daha gelişmiş ve ileri düzeydedir. Bu durum yabancı
firmaların performansına da (ortalama maliyetlere) bir şekilde yansımıştır (bk. bölüm
5.8.3 ve Tablolar 5.36 ve 6.29). Bir başka bulgu da yabancı sermayeli yan sanayi
firmalarının diğer firmalarla işbirliği yapma olasılığının yerli firmalara göre daha az
olduğu ve ayrıca kullandıkları teknolojileri yurtdışındaki ana merkezlerde faaliyet
gösteren ana firmalarından (ÇUŞ’lardan) edindikleridir (ki bu dışa teknoloji
bağımlılığının bir başka göstergesidir). Ayrıca müşterilerin yabancı tedarikçilere
üretim sürecine ve ürünlere yönelik bilgi ve teknoloji transferi yapma olasılıkları
yerlilere göre daha düşüktür. Bölüm 6’da ki regresyon analizleri, yabancı sermayeli
tedarikçi firmaların ne kendi sektörlerindeki (yan sanayi) ne de ana sanayideki
firmalarla üretim ya da Ar-Ge’ye yönelik işbirliği yaptığını ortaya koymaktadır; tam
tersine negatif etkisi vardır (bk. Tablo 6.28). Bunun sonucu ise yabancı yan sanayi
firmalarında bulunan teknolojik birikimlerin yerli firmalarla paylaşılmaması
olmaktadır.
Ankete katılan firmaların % 90’ından fazlası ihracat yapmaktadır. Bu oran 1990’ların
ikinci yarısından sonra yaygınlaşan eğilimi yansıtmaktadır. Bölüm 6’dan elde edilen
bulgular, dünya pazarları için yapılan üretimin toplam satışlar içindeki payının
artmasının firmaların ürüne yönelik yenilik ve ortak tasarım faaliyetlerini tetiklediğini
göstermektedir. Diğer taraftan müşteriler tarafından yapılan üretim sürecine yönelik
bilgi ve teknoloji transferlerini tetiklemediği ve tedarikçi firmaların performansını
olumlu yönde etkilemediği görülmektedir, hatta doğrudan tedarikçi olma üzerindeki
etkisi de olumsuzdur (bk. Tablolar 6.28 and 6.29). Bu bulgular, ihracat yapmanın ve
dünya pazarları için yapılan üretimin cirodaki payının artmasının tek başına firmaların
üretim, tasarım ve Ar-Ge yeteneklerini artırmaya yeterli olmadığına işaret etmektedir.
Kanımızca, bu bulgular otomotiv yan sanayi firmalarının ÇUŞ’ların küresel üretim
ağlarımdaki konumlarının sorgulanmasını gerektirmektedir.
Firma büyüklüğünün çok sayıda faktör üzerinde olumlu etkisi olduğunu görmekteyiz
(bk. Tablolar 6.28 and 6.29). Firma büyüklüğünün ürün ve mali transferlere yönelik
bilgi ve teknoloji transferleri süreçlerine olumlu etki yaptığı, ancak firma
performansını (yetenekler ve üretim yeteneği geliştirme) etkilemediğini görmekteyiz.
Ayrıca doğrudan tedarikçi olma, R&D faaliyetlerinde bulunma, diğer firmalarla ürüne
yönelik ortak tasarım ve teknoloji işbirlikleri yapma olasılıklarında da etkisi
olumludur.
Son olarak, ekonometrik analizlerin bulguları firmaların R&D ve ürüne yönelik
yenilik faaliyetlerinde bulunmalarının, başta ana firmalardan bilgi ve teknoloji
460
transferi sağlamak ve diğer firmalarla iş ilişkileri geliştirmek olmak üzere birçok
faktör üzerinde can alıcı bir öneme sahip olduğunu göstermektedir (bk. Tablolar 6.28
ve 6.29). Ayrıca bölüm 7’de mülakatlardan elde edinilen bulgularda, özellikle
doğrudan tedarikçi olabilmek ve ana firmalarla eş-tasarım faaliyetlerinde bulunmak
açısından bu iki faktörün oldukça önemli olduğunu doğrulamaktadır. Bu iki faktör
aynı zamanda tedarikçilerin massetme kapasitelerinin önemli bir göstergesi olarak
kabul edilmekte ve ana firmalardan bilgi ve teknoloji transferleri elde etmek ve eş-
tasarım faaliyetleri gerçekleştirmek isteyen tedarikçilerin teknoloji yeterliliklerinin
önemine işaret etmektedir. Bu nedenlerden ötürü bu iki faktör (R&D ve ürüne yönelik
yenilik faaliyetlerinde bulunma) diğer faktörlerden daha önemli bulunmuştur.
Bölüm 7’de ana firmalardan mülakatlar neticesinde elde ettiğimiz niteliksel bulgularımız ise
genel olarak Bölüm 5 ve 6’da tedarikçilerden anket yoluyla elde edilen niceliksel bulgular ile
örtüşmektedir. Bunları şu şekilde özetleyebiliriz:
Yaptığımız tespitlerden, ana firmaların başta eş-tasarım faaliyetlerini gerçekleştirdiği
doğrudan tedarikçileri olmak üzere bütün tedarikçileriyle oldukça sıkı ve yoğun bir
ilişkisi olduğu ortaya çıkmaktadır. Ana sanayi firmaları ile tedarikçileri arasında; ortak
ürün tasarımı ve ürün geliştirme faaliyetleri-anlaşmaları-görüşmeleri, üretim
araçlarının tasarımı, kalite ve kontrol yöntemleri geliştirme, maliyet azaltma ve
malzeme tasarımları gibi konularda çeşitli işbirliği faaliyetlerinin gerçekleştiği
gözlenmektedir. Nihayetinde, ana firmalar temin edilen parçaların son kullanıcıları
olduğundan bu parçaların kalitesinden, zamanında tesliminden emin olmak
istemektedirler, çünkü üretim ve tedarik zincirinde ki en ufak bir aksaklık, üretim
hatlarının durmasına yol açabilmektedir. Başka bir deyişle, üretim zincirinden dolayı
tedarikçilerdeki en ufak bir sorun doğrudan ana firmalara yansımaktadır. Bu
nedenlerle ana firmalar tedarikçilerini yakından izlemekte, denetlemekte, sorunlarının
çözümünde yardımcı olmaktadırlar.
Ana firmalar sahip oldukları bilgi ve teknolojileri genel olarak ortak projeler, eş-
tasarım/geliştirme ve eğitim faaliyetleri kanalları aracılığı ile tedarikçileri ile
paylaşmaktadırlar. Ana firmalar yeni bir araç ve parça geliştirme süreçlerinde
tedarikçileri ile eş-tasarım faaliyetlerinde bulunmakta, üretim ve üretim süreçlerine
ilişkin her türlü desteği kendilerine sağlamaktadırlar. Ana firmalarla tedarikçileri
arasındaki bu ilişkiler tedarikçilere geriye doğru bağlantılar vasıtasıyla bilgi ve
teknoloji transferleri sağlamakta, onların teknoloji yeteneklerini, kalite seviyelerini,
verimliliklerini, performans seviyelerini yükseltmekte ve geliştirmektedir.

461
Uygulanan projeler, programın takibi ve uygulanabilirliği, üretimle veya ürünle ilgili
problemler yaşandığında; ana sanayi firmaları gerekli gördükleri eğitimleri
mühendisleri aracılığıyla ana firmada konferanslar, bilgilendirme toplantıları,
seminerler, iş üstünde gösterim gibi yöntemlerle yan sanayi firmalarına
vermektedirler. Ana firmalar ayrıca çok özel durumlarda (sorun çözmeye yönelik
problem veya talep olduğunda) kısa bir süreliğine mühendislerini yan sanayi
firmasında görevlendirebilmektedirler. Yan sanayide çalışan mühendislerinin ana
firma fabrika ziyaretleri de, yeni bir parça üretimi söz konusu olduğunda, bu ürünün
üretim hattında sorun yaşanmaması, sorun varsa bu sorunların saptanması ve malzeme
akışına destek olunması gibi nedenlerle gerçekleşmektedir. Yan sanayi firmalarının
mühendisleri veya çalışanları bu faaliyetler neticesinde öğrendikleri bilgileri daha
sonra istihdam edildikleri firmalarda da uygulamaktadırlar.
Aynı zamanda ana firmaların izleme, denetleme sistemleri, talep ettikleri yüksek kalite
standartları, maliyet azaltma talepleri de tedarikçilerin kalite, teknoloji ve R&D
yeteneklerine ilişkin seviyelerini yükseltmekte, onları daha ileri şartlarda çalışmaya
zorlamaktadır. Örneğin, otobüs üretimi yapan ana firmalardan bir tanesi üretimde üç
boyutlu tasarım kullandıkları için tedarikçilerinin de aynı teknolojiyi kullanmasını
talep ettiklerini, tedarikçilerinden sadece parçanın resmini değil aynı zamanda üç
boyutlu verisinin kendilerine verilmesini talep ettiklerini belirtmiştir. Ana firmanın
tedarikçileri ile birlikte geliştirdiği her yeni projede, ana firmaların standartları ve
talepleri biraz daha yükselmekte ve bu durum tedarikçi firmalara bilgi ve teknoloji
transferleri sağlayarak bilgi birikimi açısından büyük katkılar sağlamaktadır.
Daha fazlası, yan sanayi firmalarının hem yurtiçi hem de yurtdışında kendi
aralarındaki rekabetleri, kendilerini sürekli geliştirmelerine yol açmaktadır. Özetle yan
sanayi firmaları kalite, R&D maliyet, fiyat, tasarım, verimlilik gibi alanlarda rekabet
etmek için sahip olduğu teknolojik yeteneklerini sürekli geliştirmek zorunda olup,
bunu başaramazsa da piyasadan silinmekle karşı karşıya kalmaktadır. Yan sanayi
firmaları bu sürekli iyileştirme ve geliştirme sistemi içerisinde teknolojik yeteneklerini
geliştirerek, bilgi ve teknoloji transfer ederek know-how ve bilgi birikimi
sağlamaktadırlar.
Ana firmalar üretim-ekipman seçimi, makine seçimi, kalıp alımı, yeni yazılım alımı
gibi konularda gerektiğinde yan sanayi firmalarına destek olduklarını da
belirtmişlerdir. Finansal destekler konusunda ise genelde böyle bir uygulamanın
olmadığı, ancak yeni bir parça üretimi söz konusu olduğunda ön avanslar verildiği ya
da üretim için gerekli olan çok önemli parçaların alımında (yazılım, tezgâh, kalıp vb.)
finansal destekler verildiği belirtilmiştir.

462
Mülakat yapılan ana firmalar, yukarıda belirtilen işbirliği faaliyetlerinin tedarikçiler ile ana
firmalar arasında önemli bir bilgi alışverişini sağlayarak yan sanayi firmalarının gelişimine
çok önemli katkılarda bulunduğu ve bilgi birikimini sağladığı belirtmişlerdir. Bu kapsamda
yan sanayi firmalarına yapılan bilgi ve teknoloji transferinin genel olarak ortak-projeler,
eğitimler ve anlaşmalar yoluyla gerçekleştiği söylenebilir. Sonuçta, tedarikçilerin daha iyi
performans göstermeleri dolaylı olarak ana firmaların da performans seviyelerini
yükseltmekte daha kaliteli ürünleri zamanında elde etmelerini sağlamaktadır. Bütün bu
süreçler tedarikçiler açısından hep birer kazanç olmaktadır.
Firma içi bilgi ve teknoloji transferleri ise yerli sermayeli ve joint venture sermaye ortaklı
ana firmalara stratejik işbirlikleri yaptıkları ÇUŞ ortakları aracılığı ile gerçekleşmektedir. Bu
ortakların en önemlileri sırasıyla yabancı ortak olan ÇUŞ, lisansör ÇUŞ ve küresel–mega
tedarikçiler olmakta ve bunlardan ürün, üretim süreci, tasarım, R&D, mühendislik, eğitim
başta olmak üzere bir çok kritik konuda transferler yapılmaktadır. Ana firmaların temel
hedeflerinin, başta yabancı ortak ÇUŞ olmak üzere bu ortaklardan bilgi ve teknoloji transfer
edip, yurtiçinde bilgi birikimini artırmak ve bu sayede yüksek teknoloji içeren, katma değeri
yüksek yeni ürünler geliştirmek olduğu söylenebilir. Bu kapsamda en önemli bilgi ve
teknoloji kaynağının yabancı ortak ÇUŞ olduğu görülmektedir. Bu ÇUŞ’lardan transferler;
ortak projeler, eş-tasarım ve eş-geliştirme faaliyetleri, ÇUŞ’ların kalite, üretim ve yönetim
sistemlerinin yurtiçi fabrikalara uygulanması, ÇUŞ’lar tarafından izlenme-denetlenme ve ana
firma personellerine ÇUŞ’lar tarafından sağlanan eğitim faaliyetleri kanalları ile
gerçekleşmektedir. ÇUŞ’lar tarafından sağlanan eğitim faaliyetleri aynı zamanda yerel
mühendislerin yeteneklerini artırarak bu transferlerin özümsenip, içselleştirilmesini de
kolaylaştırmaktadır.
IV. Sonuç
ÇUŞ’lar gelişmekte olan ülkelere ucuz işgücü, hammadde, iç pazarın büyüklüğü (ve yüksek
büyüme hızı), yatırım, ihracat, R&D teşvikleri vb. gibi nedenlerle yatırım yapmaktadırlar.
ÇUŞ’ların sahip oldukları bilgi ve teknoloji birikimleri ev sahibi ülkelerdeki yurtiçi firmalara
geriye doğru bağlantılar yoluyla aktarılmakta ve bu firmaların bilgi birikimlerini, teknolojik
yeteneklerini yükseltmektedir. Daha fazlası, ÇUŞ’ların varlığı ve sahip oldukları kültürleri,
tecrübeleri faaliyette bulundukları sektörlerde rekabet etkisi yaratmakta ve yerel firmaların
kendilerini geliştirmesini zorunlu kılarak verimliliklerini, teknolojik yeteneklerini olumlu

463
yönde etkilemektedir. Ancak ÇUŞ’lar en kritik ürün geliştirme, teknoloji, tasarım ve temel
Ar-Ge birimlerini yurtdışındaki merkez karargâhlarında tutmakta, bu konularda sahip
oldukları bilgileri stratejik ortakları ve işbirliği yaptıkları firmalar dışında paylaşmak
konusunda isteksiz olmaktadırlar. ÇUŞ’ların sahip oldukları bilgilerin ve teknolojilerin yerel
firmalar tarafından elde edilmesi ortak yapılan projeler, teknoloji veya işbirliği anlaşmaları
ile mümkün olmaktadır. Ancak elde edilen bilgi ve teknolojilerin kavranması, emilmesi
(massedilmesi), özümsenmesi ise yerel firmaların teknolojik kapasitelerine, yetenekli insan
gücüne, teknoloji ve mühendislik alanındaki yeteneklerine bağlı olmaktadır. Bu nedenle ev
sahibi ülkelere yüksek bilgi ve teknoloji içeren ÇUŞ yatırımlarını çekmek tek başına yeterli
olmamakta, aynı zamanda bunların yerel firmalarla yoğun iş ilişkileri geliştirmeleri ve yerel
firmaların teknoloji yeteneklerinin yüksek olması gerekmektedir.
Elde ettiğimiz bulgular ışığında, Türkiye otomotiv sanayiinin son 40 yılda büyük bir gelişme
göstererek küçük adetlerde, montaja dayalı lisans altında ve rekabete çokta açık olmayan
üretimden bugün özellikle ticari araçlarda kendi Ar-Ge’si ile tasarlayarak ürettiği araçları
dünyanın birçok ülkesine satar hale geldiğini görmekteyiz. Ayrıca, ana ve yan sanayi
firmalarının yabancı firmalar ile stratejik ortaklıklara gittiğini, teknolojik yeteneklerinin
yükseldiğini, dünya ile entegre olarak, teknolojileri ve yenilikleri yakından takip ettikleri
gözlenmiştir. Ancak tüm bu olumlu gelişmelere rağmen, özellikle binek araç üretiminde,
Türk otomotiv ana sanayi halen kendi küresel markasını yaratamayarak yabancı lisanslar
altında üretim yapmakta ve ÇUŞ’lar yurtiçi piyasaya tamamen hâkim gözükmektedirler.
Yöneticiler ile yapılan mülakatlar neticesinde, yabancı sermaye oranından bağımsız olmak
üzere bütün yabancı sermayeli ana firmaların yönetim olarak yabancı ortak ÇUŞ’un
yurtdışındaki ana merkezine bağlı oldukları, özellikle temel ürün geliştirme, tasarım ve Ar-
Ge faaliyetlerinin bu merkez karargâhlarında gerçekleştirildiği tespit edilmiştir. Yurtiçinde
yabancı lisans altında üretim yapan otomotiv ana sanayi firmaları doğal olarak hemen hemen
her türlü stratejik kararda ana merkeze (lisans sahibi ÇUŞ’un yurtdışındaki karargâhı)
bağımlı olmakta bağımsız hareket edememektedirler. Diğer taraftan, ÇUŞ’ların Türkiye’de
Ar-Ge birimleri olsa bile bu birimlerde genelde ürünlerin kısmi modifikasyonları,
iyileştirmeleri, yurtiçi pazara ve üretim hattına uygun hale getirilmeleri vb. konular üzerinde
çalışılmakta olduğu görülmektedir.
Ana firmalardan yurtiçi doğrudan tedarikçilere bilgi ve teknoloji transferlerinin genel olarak
ortak projeler, eş-tasarım/eş-geliştirme faaliyetleri, izleme ve değerlendirme sistemleri, ana
firmaların küresel sertifikalarına sahip olma süreci ve ana firmalar tarafından verilen eğitim
faaliyetleri kanalları ile gerçekleşmekte olduğu saptanmıştır. Ayrıca, ana firmanın belli bir

464
ürün grubunda tek tedarikçisi konumunda olmanın da bu transferleri oldukça pozitif
etkilediği tespit edilmiştir. Transferlerin içeriği açısından bu kanallardan en önemlileri eş-
tasarım ve eğitim faaliyetleridir. Ancak sağlanan bilgi ve teknoloji transferlerinin tedarikçi
firmalar tarafından ne derecede özümsendiği ve performans seviyelerine etkisi hiç kuşkusuz
tedarikçilerin teknoloji ve massetme kapasitelerine bağlı olmaktadır. Bu nedenlerle, daha
fazla DYY çekmeye yönelik teknoloji politikaları bu tezin bulguları ve çözümlemeleri
ışığında gözden geçirilmelidir çünkü bu yatırımlardan fayda sağlamak için etkin bir
massetme kapasitesi veya yetenekli beşeri sermaye stoku –yeterli bir koşul olmasa da-
gereklidir.
Son olarak, Türkiye yüksek katma değer yaratan, dünyadaki gelişmiş, rekabetçi bir otomotiv
üretim merkezi olmanın yanında, Avrupa’da bir tasarım ve Ar-Ge üssü merkezi haline
gelerek bilgi birikiminin sağlandığı bir ülke olmalıdır. Bu amaçla devlet-sanayi-üniversite
işbirliği içerisinde küresel teknolojilerin yakından izlenmesi; ileri teknoloji ve bilgi birikimi
sağlayacak DYY’lerin yurtiçine çekilmesi; en son bilgi ve teknolojilerin yurtiçine transfer
edilmesi; bunların özümsenmesi için yurtiçi firmaların teknoloji yeteneklerinin ve massetme
kapasitelerinin sürekli geliştirilmesi; geleceğe yönelik tahminler ve projeksiyonların
yapılması; ülke içinde bilgi birikiminin sağlanarak sonuçta daha teknolojik yeniliklerin ve
geliştirmelerin yurtiçinde ortaya çıkarılmasını sağlayacak uzun vadeli stratejik planlar
geliştirilmelidir. Aksi takdirde yabancı sermaye ve teknoloji, gelişmekte olan, ucuz işgücü,
mühendis ve hammaddeyi bulacağı Çin, Hindistan gibi rakip ülkelere gidecek ve bu üstünlük
kaybedilecektir. Özetle, Türkiye otomotiv sanayii küresel olarak önde ve gelişen bir sanayii
konumundadır ancak bu konumun korunması, sürdürülmesi ve daha ilerilere götürülmesi,
Ar-Ge ve yenilik faaliyetleri sonucunda bilgi ve teknoloji yoğun, katma değeri yüksek yeni
ve teknolojik ürünlerin yurtiçinde geliştirilmesine bağlı gözükmektedir. Bu da ancak, küresel
teknolojilerin yakından izlenmesi, bunlara ilişkin know-how’ların transfer edilerek
öğrenilmesi ve yurtiçinde bilgi birikiminin sağlanması ile mümkün gözükmektedir. Başka bir
deyişle tekerleği yeniden icat etmenin bir anlamı yoktur, onun yerine tekerleğin icat
edildiğinden haberdar olmak, nasıl üretildiğini bilmek, onu geliştirmek, daha iyisini veya
alternatifini yurtiçinde üretmek amaç olmalıdır. Türkiye sahip olduğu jeopolitik konumu,
insan gücü, altyapısı, lojistik imkanları, gümrük birliği ile Avrupa’ya entegre sanayi yapısı,
tesis ve makine donanımı, 50 yıllık otomotiv üretim kültürü, bilgi birikimi, güçlü yan
sanayisi ve vizyonu ile bunu başarabilecek durumda gözükmektedir.

465
Appendix N:
Curriculum Vitae
PERSONAL INFORMATION
Surname, Name: Sönmez, Alper
Nationality: Turkish (TC)
Date & Place of Birth: 26 July 1980, Istanbul
Marital Status: Married
Languages: Advanced English (KPDS 92; ÜDS 87.5), Turkish (Native Language)
E-mail: [email protected], [email protected]
RESEARCH INTERESTS
FDI, MNCs, Technology Spillovers, Innovation and R&D, Production Networks, Global Value
Chains, Economics of Technology, Industrial Development, Automotive Industry
EDUCATION
Year Degree Institution
2003-Present Ph.D. on B.S METU, Department of Economics, Ankara, Turkey
2002-2003 School of Foreign
Languages
Department of Basic English, METU, Ankara, Turkey
1998-2002 B.S. Yıldız Technical University,
Department of Economics, Istanbul
WORK EXPERIENCE
Year Place Enrollment
August 2002 – Present METU, Department of Economics,
Ankara, Turkey
Teaching & Research assistant
Jan 2011 – Jan 2012 Cornell University, Department of
Applied Economics and Management
(AEM), New York, USA
Visiting Fellow, Non-Faculty
Academic Position
Spring 2007 METU, Department of Economics,
Ankara, Turkey
Instructor: “Principles of
Economics” (ECON210)

466
CONTRIBUTION IN BOOKS
“Foreign Direct Investment and Technology Spillovers in the Turkish Manufacturing
Industry”, (2012), in: I. Hakan, Yetkiner, E.Erdil and T. Pamukçu (Eds.), Dynamics, Innovation
Policy and Economic Growth through Technological Advancements, USA: IGI Global, (with M.
Teoman Pamukçu)
“Technology Transfer in the Global Automotive Value Chain - The Case of Turkish Automotive
Industry”, (2012) in: D. Audretsch L. Lehmann, A. Link and A. Starnecker (Eds.), Technology
Transfer in a Global Economy, International Handbook Series on Entrepreneurship, Springer
(forthcoming) (with M. Teoman Pamukçu)
INTERNATIONAL CONFERENCE PAPER
Type : 1.1.5.0.1. Full paper presented at and published in the proceedings of a refereed conference
regularly held by an international organization
“Technology Transfer in the Global Automotive Value Chain. The Case of Turkish Automotive
Industry”, paper presented to the Technology Transfer in a Global Economy, Technology Transfer
Society (T2S) Meetings, September 21-23, 2011, University of Augsburg, Bavaria, Germany (with
M. Teoman Pamukçu)
“Foreign Direct Investment and Productivity Spillovers in the Turkish Manufacturing Industry:
An Econometric Analysis with Enterprise-Level Data for the Period 2003-2006”, 4th
International Conference on Industrial Dynamics, Innovation Policy and Growth, May 21-22,
2010, Izmir, TURKEY (with M. Teoman Pamukçu)
Type : 1.1.5.0.2. Abstract of a paper presented at and published in the proceedings of a refereed
conference regularly held by an international organization
“Horizontal Spillovers from FDI: The Case of Turkish Manufacturing Industry”, the
International Journal of Arts & Sciences Conference, Volume 2, Number 4, ISSN 1943-6114, June
8-11, 2010, Aix-En-Provence, FRANCE
“Foreign Direct Investment and Productivity Spillovers in the Turkish Manufacturing Industry:
An Econometric Analysis with Enterprise-Level Data for the Period 2003-2006”, 4th
International Conference on Industrial Dynamics, Innovation Policy and Growth, May 21-22,
2010, Izmir, TURKEY (with M. Teoman Pamukçu)

467
RESEARCH PROJECTS
January 2010 - December 2010: “Analysis of Knowledge and Technology Transfer by Multinational
Companies to Local Suppliers in the Turkish Automotive Industry”, project (109K587) funded by
TUBITAK (The Scientific and Technological Research Council of Turkey), Researcher, (with M.
Teoman Pamukçu)
WORKING PAPERS
“Technology Transfer in the Global Automotive Value Chain: Lessons from Turkish Automotive
Industry", Science and Technology Policies Research Center (TEKPOL) Working Paper Series,
WP 11/09, 2011 (with M. Teoman Pamukçu)
“Foreign Direct Investment and Technology Spillovers in the Turkish Manufacturing Industry”,
Science and Technology Policies Research Center (TEKPOL) Working Paper Series, WP 11/03,
2011 (with M. Teoman Pamukçu)
LECTURES, SEMINARS AND PARTICIPATION TO WORKSHOPS
Seminar on the theme “Impact of Foreign Direct Investment on the Technological Change Process
in the Turkish Manufacturing Industry; A Panel Data Analysis for the Period 2003- 2006”,
Econometric Research Association, May 27, 2010, Ankara, TURKEY (with M. Teoman Pamukçu)
(Presentation and Participation to Workshops), “FDI-Related Knowledge Spillovers and Enterprise
Productivity in Emerging Countries; Testing the Impact of Intra- versus Inter-Industry Spillovers
in the Turkish Manufacturing Industry”, paper presented to the Competition and Innovation
Summer School (CISS) at the International Academy Marmaris (IAM), organized jointly by COST
(European Cooperation in Science and Technology), KUL (Catholic University of Leuven), STRIKE
(Science and Technology Research in a Knowlege-based Economy), ZEW (Centre for European
Economic Research), May 17-21, 2010, Turunç/Marmaris, TURKEY