
Technology industry analysis and outlook
14
A look at High-tech in the U.S. 2014
-
Upload
jll -
Category
Technology
-
view
1.177 -
download
0
Transcript of Technology industry analysis and outlook
A look at High-tech in the U.S.
2014
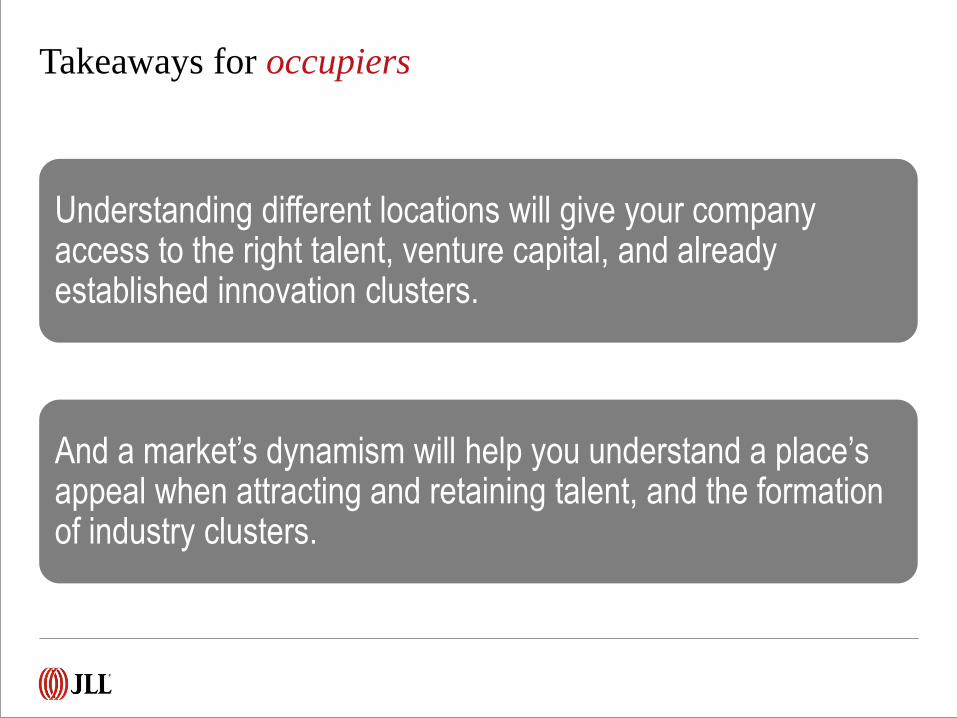
Takeaways for occupiers
Understanding different locations will give your company access to the right talent, venture capital, and already established innovation clusters.
And a market’s dynamism will help you understand a place’s appeal when attracting and retaining talent, and the formation of industry clusters.

Takeaways for investors and owners
Understanding the strength and penetration of high-tech in local markets will help guide investment decisions when targeting markets utilizing new trends in workplace design and development, buoyed by a strong industry.
And understanding workplace preference from both internal and external office perspective will help owners create places where high-tech employers and employees hope to work.

High-tech employment
Since October 2013, the sector has surpassed the dot.com peak by 69,000 jobs, reaching 3.3 million positions as of July 2014.
U.S. high-tech employment
0
500
1000
1500
2000
2500
3000
3500
1999
2000
2001
2002
2003
2004
2005
2006
2007
2008
2009
2010
2011
2012
2013
2014
High-tech services employment (000)
High-tech manufacturing employment
Source: Bureau of Labor Statistics

19.1% of office jobs recovered after the recession were within the high-tech services sector, compared with just 14.1% from 2003 to 2007.
Source: Bureau of Labor Statistics
19.1%
80.9%
High-tech services All other office jobs
2009-2014
High-tech employment
U.S. High-tech services share of
office employment growth

Talent and innovation insight
5
Computer-related occupations of
H-1B Visas
2011 2012 vs.
50.8% 59.0%
Total utility patents: Top 5 countries
United States
133,593
Canada 6,547 Germany
15,498
Taiwan 11,071
South Korea 14,548
Japan 51,919
The share of H-1B visa holders working in tech has increased in the last year. But the U.S. remains the innovation leader worldwide.
CA 36,193
TX 9,222
WA 5,878
MN 5,119
IL 4,644 PA
3,961
NJ 4,717
NY 8,489
MA 6,409
Utility patents by state: Top 10 states

Venture capital insight
1.5%
29.4%
44.5%
24.7% Seed Stage
Early Stage
Expansion Stage
Later Stage
VC funding by high-tech sector
65% 11%
8%
6% 3% 7%
Software
Media and Entertainment
IT Services
Consumer Products andServicesComputers and Peripherals
Rest of HT sector
$9.6B total U.S. high-tech
VC funding
U.S. VC funding vs. high-tech funding
Source: PricewaterhouseCoopers
$
$ 5,000,000,000
$ 10,000,000,000
$ 15,000,000,000 US Total HT VC FundingUS Total VC Funding
VC funding by stage of development
$13.3B total Q2 2014
U.S. VC funding
Venture capital investment still far from dot-com high
7
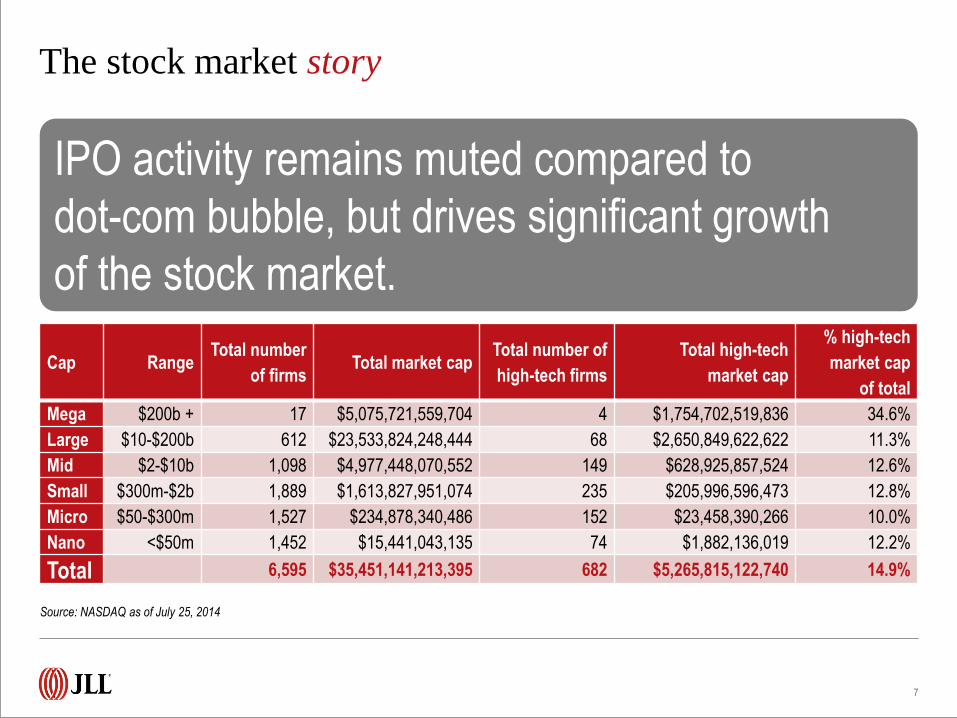
The stock market story
Source: NASDAQ as of July 25, 2014
Cap Range Total number
of firms Total market cap
Total number of
high-tech firms
Total high-tech
market cap
% high-tech
market cap
of total
Mega $200b + 17 $5,075,721,559,704 4 $1,754,702,519,836 34.6%
Large $10-$200b 612 $23,533,824,248,444 68 $2,650,849,622,622 11.3%
Mid $2-$10b 1,098 $4,977,448,070,552 149 $628,925,857,524 12.6%
Small $300m-$2b 1,889 $1,613,827,951,074 235 $205,996,596,473 12.8%
Micro $50-$300m 1,527 $234,878,340,486 152 $23,458,390,266 10.0%
Nano <$50m 1,452 $15,441,043,135 74 $1,882,136,019 12.2%
Total 6,595 $35,451,141,213,395 682 $5,265,815,122,740 14.9%
IPO activity remains muted compared to
dot-com bubble, but drives significant growth
of the stock market.

The stock market story
8
Source: Renaissance Capital, NASDAQ.com
1,181 high-tech companies have gone public from 1995 to 2014
1995
1996 1997 1998 1999 2000
2001
2002 2003 2004 2005 2006 2007 2008
2009
2010 2011 2012 2013
2014
748 IPOs
125
or 16.7% of these
companies remain
public today
222 IPOs
165
or 74.3% of these
companies remain
public today
268 IPOs
71
or 26.5% of these
companies remain
public today

High-tech steadies the office market recovery
9
Source: JLL Research
0.0%
2.0%
4.0%
6.0%
8.0%
10.0%
12.0%
14.0%
16.0%
Cla
ss A
ask
ing
ren
t
year
-on
-yea
r g
row
th
$0.00
$20.00
$40.00
$60.00
$80.00
$100.00
$120.00
Cla
ss A
dir
ect
aver
age
as
kin
g r
ent
($ p
.s.f
.)
Rents in many of the high-tech submarkets
have jumped more than 10.0% year-over-
year…
…resulting in some of the highest asking
rents across submarkets nationally

Demographics and technology drive productivity and
utilization and the next evolution of office space use.
10
15% Space reduction by
U.S. law firms and
financial services
relocating
72% Of global CREs plan to
aggressively increase
density in next 3 years
200 s.f./employee average
target density, down
from 250-300 s.f. in 2009
50%
of the U.S. workforce
were baby boomers
in 2010. Millennials
will be 50% by 2020

The top anchor tenants across the country also
top the list of most acquisitions
11
5
3
2
2
Number of markets by
anchored company
Top 15 acquiring companies
Cisco 161
Google 154
Microsoft 134
IBM 120
Yahoo! 107
Hewlett-Packard 86
Oracle Corporation 86
AOL 63
EMC 59
Intel 57
Apple 49
eBay 48
Facebook 48
Amazon 45
Adobe Systems 38 Source: Crunch Base

This publication is the sole property of Jones Lang LaSalle IP, Inc. and must not be copied, reproduced or transmitted in any form or by any means, either in whole or in part, without
the prior written consent of Jones Lang LaSalle IP, Inc. The information contained in this publication has been obtained from sources generally regarded to be reliable. However, no
representation is made, or warranty given, in respect of the accuracy of this information. We would like to be informed of any inaccuracies so that we may correct them. Jones Lang
LaSalle does not accept any liability in negligence or otherwise for any loss or damage suffered by any party resulting from reliance on this publication.
Contacts
12
For more information, please contact:
Julia Georgules
Vice President, Director of Research
+1 415 354 6908
Amber Schiada
Vice President, Director of Research
+1 415 395 4924
Christan Basconcillo
Senior Research Analyst
+1 650 815 2213
Phil Ryan
Research Analyst
+1 202 719 6295
Lauren Picariello
Senior Vice President, Director of Industry Research
+1 617 531 4208
Chirag Modi
Head of Markets Consulting
+1 248 231 0533

© Copyright 2014 Jones Lang LaSalle
Thank you
>> If you enjoyed this preview,
click here to access the full report.