Techno-Economic Model for Policy Assessment to Optimize Spectrum
10
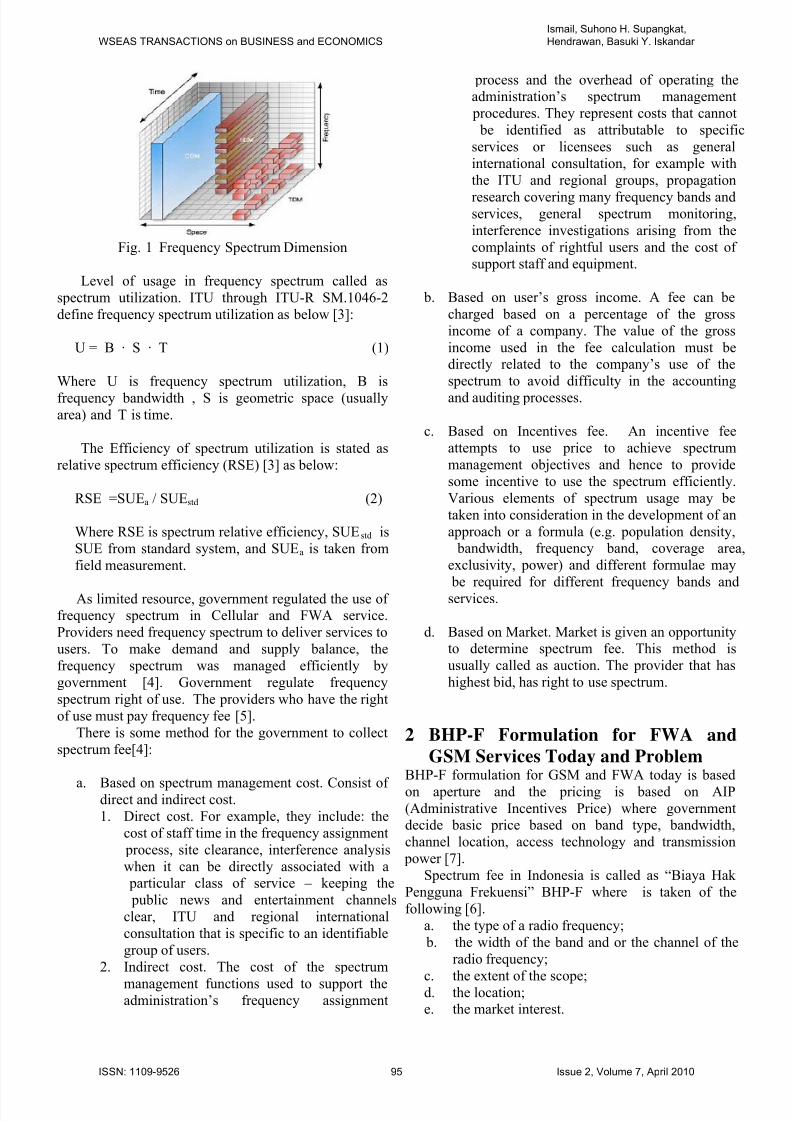
Techno-Econ omic Model for Policy Assessment to Optimize Spectrum Frequency Utilization Study Case: Frequency Fee for FWA and GSM Services in Indonesia ISMAIL #1 , SUHONO H. SUPANGKAT #2 , HENDRAWAN #3 , BASUKI Y. ISKANDAR *4 School of Electrical Engineering and Informatics Bandung Institute of Technology #1,2,3 , Ministry of Communication and Information Technology *4 Ganesha 10, Bandung #1,2,3 , Medan Merdeka Barat 9 Jakarta *4 INDONESIA 1 [email protected] 2 [email protected] 3 [email protected] 4 [email protected] Abstract: - Radio frequency spectrum is a limited resource, owned and regulated by government. Each telecommunication providers, which use radio frequency spectrum, has the obligation to pay frequency fee. Currently, frequency fee, called as “Biaya Hak Spektrum Frekuensi” (BHP-F), for the cellular and fixed wireless access (FWA) services are calculated based on the number of frequency spectrum channel that being used (aperture based). This method is considered obsolete for cellular and FWA services BHP-F, not only this method has technical problem but also calculation based on aperture is hampering the utilization of frequency spectrum. International telecommunication Union (ITU), through ITU-R SM 2012-2 rec ommends about BHP-F formula based on frequency spectrum spectral, which can promote the frequency spectrum utilization. The policy of changing BHP-F from aperture based to spectral based will affects in economic especially to GSM and FWA industries. The policy also will affect to government goals to increase frequency spectrum utilization and to have proper non-tax government income. To assessment this policy, we need proper model. This paper will propose a techno-economic model to evaluate the impact of the new policy. In this paper, we use cellular and FWA services as case study. Key-Words: Frequency Fee, cellular and fixed wireless access services, utilization, techno-economic 1 Introduction Radio frequency spectrum consists of bands of electro- magnetic frequencies. Those bands range from 9 kHz to over 275 GHz [1]. Spectrum has characteristics which make it unique as a resource. Spectrum is non-homogeneous in which different frequencies have different characteristics that make specific frequencies more suitable for certain uses. Spectrum is finite. Spectrum is non-depletable, using the spectrum today does not prevent use of spectrum tomorrow. It is non-storable. It cannot be stockpiled, spectrum not used today is lost forever. Different frequencies have different propagation, bandwidth and interference characteristics. The propagation of radio signals depends on the communications equipment in use, the time of day, time of year, solar activity, and topography and weather conditions. Lower frequency radio signals tend to propagate over long distances and penetrate some materials, while higher frequency signals are more suited to shorter range ‘line-of-sight’ applications. High powered signals propagate further than low powered signals. In general, the greater the bandwidth, the more information that can be transmitted in a given period. Interference reduces the quality of voice communication, reduces data rates and can even eliminate the communications connection. Some spectrum uses are more susceptible to interference than others. Interference depends, in part, on the technology used and more sophisticated equipment can improve receiver performance [2]. There is four (4) actor that involved with spectrum. Regulator manage the allocation of spectrum, provider has right to use spectrum from license, user use spectrum to make communication with other user and industry support user and provider to have equipment that can make a communication with spectrum. Provider and user utilize spectrum. Utilization of spectrum can be looked in three dimension : frequency dimension, space dimension and time dimension.[5]. The concept of frequency spectrum can be easier to understand by illustrate it in 3-dimesion that consist of frequency, space, and time as shown in Fig.1. In the FDM technology, the spectrum is separated by frequency and in the TDM technology, spectrum is separated by the time, but in the CDMA technology, spectrum is not separated by frequency and time. WSEAS TRANSACTIONS on BUSINESS and ECONOMICS Ismail, Suhono H. Supangkat, Hendrawan, Basuki Y. Iskandar ISSN: 1109-9526 94 Issue 2, Volume 7, April 2010
Transcript of Techno-Economic Model for Policy Assessment to Optimize Spectrum

8/6/2019 Techno-Economic Model for Policy Assessment to Optimize Spectrum
http://slidepdf.com/reader/full/techno-economic-model-for-policy-assessment-to-optimize-spectrum 1/10
8/6/2019 Techno-Economic Model for Policy Assessment to Optimize Spectrum
http://slidepdf.com/reader/full/techno-economic-model-for-policy-assessment-to-optimize-spectrum 2/10
Fig. 1 Frequency Spectrum Dimension
Level of usage in frequency spectrum called as
spectrum utilization. ITU through ITU-R SM.1046-2
define frequency spectrum utilization as below [3]:
U = B · S · T (1)
Where U is frequency spectrum utilization, B is
frequency bandwidth , S is geometric space (usuallyarea) and T is time.
The Efficiency of spectrum utilization is stated as
relative spectrum efficiency (RSE) [3] as below:
RSE =SUEa / SUEstd (2)
Where RSE is spectrum relative efficiency, SUEstd is
SUE from standard system, and SUEa is taken from
field measurement.
As limited resource, government regulated the use of
frequency spectrum in Cellular and FWA service.
Providers need frequency spectrum to deliver services to
users. To make demand and supply balance, the
frequency spectrum was managed efficiently by
government [4]. Government regulate frequency
spectrum right of use. The providers who have the right
of use must pay frequency fee [5].
There is some method for the government to collect
spectrum fee[4]:
a. Based on spectrum management cost. Consist of direct and indirect cost.
1. Direct cost. For example, they include: the
cost of staff time in the frequency assignment
process, site clearance, interference analysis
when it can be directly associated with a
particular class of service – keeping the
public news and entertainment channels
clear, ITU and regional international
consultation that is specific to an identifiable
group of users.
2. Indirect cost. The cost of the spectrum
management functions used to support theadministration’s frequency assignment
process and the overhead of operating the
administration’s spectrum management
procedures. They represent costs that cannot
be identified as attributable to specific
services or licensees such as general
international consultation, for example with
the ITU and regional groups, propagation
research covering many frequency bands andservices, general spectrum monitoring,
interference investigations arising from the
complaints of rightful users and the cost of
support staff and equipment.
b. Based on user’s gross income. A fee can be
charged based on a percentage of the gross
income of a company. The value of the gross
income used in the fee calculation must be
directly related to the company’s use of the
spectrum to avoid difficulty in the accounting
and auditing processes.
c. Based on Incentives fee. An incentive fee
attempts to use price to achieve spectrum
management objectives and hence to provide
some incentive to use the spectrum efficiently.
Various elements of spectrum usage may be
taken into consideration in the development of an
approach or a formula (e.g. population density,
bandwidth, frequency band, coverage area,
exclusivity, power) and different formulae may
be required for different frequency bands andservices.
d. Based on Market. Market is given an opportunity
to determine spectrum fee. This method is
usually called as auction. The provider that has
highest bid, has right to use spectrum.
2 BHP-F Formulation for FWA and
GSM Services Today and ProblemBHP-F formulation for GSM and FWA today is based
on aperture and the pricing is based on AIP
(Administrative Incentives Price) where government
decide basic price based on band type, bandwidth,
channel location, access technology and transmission
power [7].
Spectrum fee in Indonesia is called as “Biaya Hak
Pengguna Frekuensi” BHP-F where is taken of the
following [6].
a. the type of a radio frequency;
b. the width of the band and or the channel of the
radio frequency;
c. the extent of the scope;d. the location;
e. the market interest.
WSEAS TRANSACTIONS on BUSINESS and ECONOMICS
Ismail, Suhono H. Supangkat,
Hendrawan, Basuki Y. Iskandar
ISSN: 1109-9526 95 Issue 2, Volume 7, April 2010
8/6/2019 Techno-Economic Model for Policy Assessment to Optimize Spectrum
http://slidepdf.com/reader/full/techno-economic-model-for-policy-assessment-to-optimize-spectrum 3/10
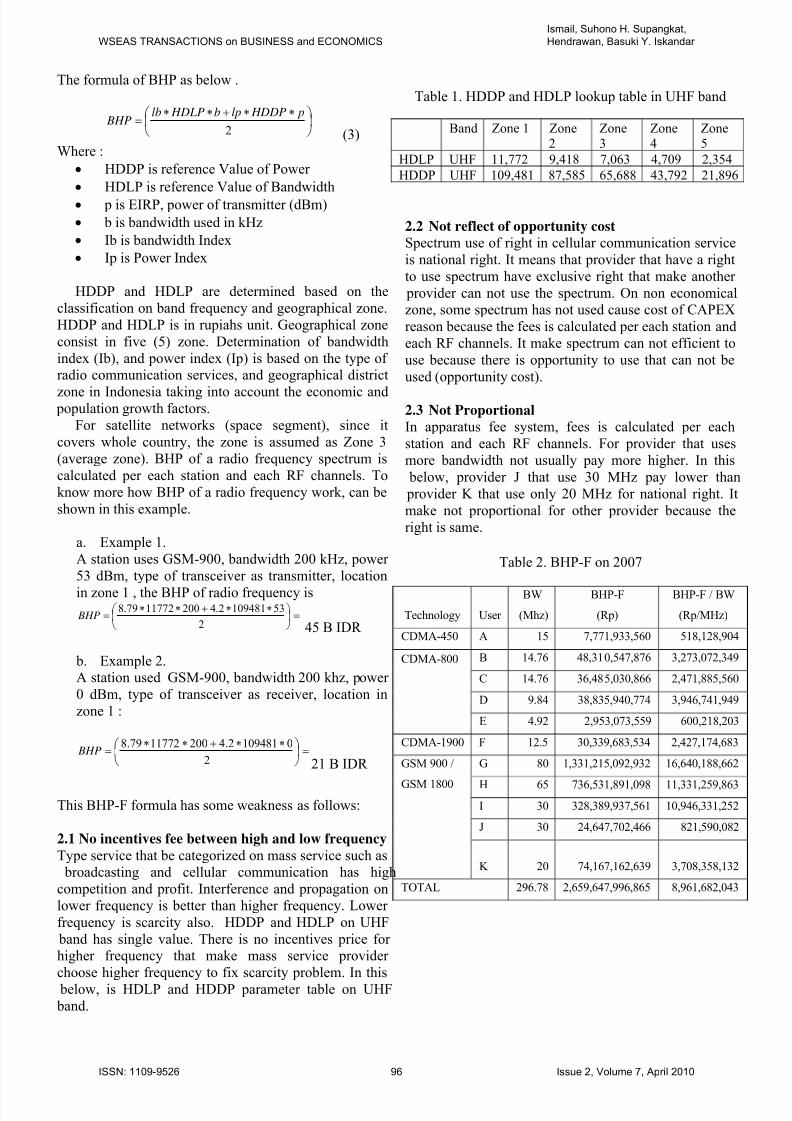
The formula of BHP as below .
⎟ ⎠
⎞⎜⎝
⎛ ∗∗+∗∗=
2
p HDDPlpb HDLPlb BHP
(3)
Where :
• HDDP is reference Value of Power
• HDLP is reference Value of Bandwidth
• p is EIRP, power of transmitter (dBm)
• b is bandwidth used in kHz
• Ib is bandwidth Index
• Ip is Power Index
HDDP and HDLP are determined based on the
classification on band frequency and geographical zone.
HDDP and HDLP is in rupiahs unit. Geographical zone
consist in five (5) zone. Determination of bandwidth
index (Ib), and power index (Ip) is based on the type of
radio communication services, and geographical district
zone in Indonesia taking into account the economic and population growth factors.
For satellite networks (space segment), since it
covers whole country, the zone is assumed as Zone 3
(average zone). BHP of a radio frequency spectrum is
calculated per each station and each RF channels. To
know more how BHP of a radio frequency work, can be
shown in this example.
a. Example 1.
A station uses GSM-900, bandwidth 200 kHz, power
53 dBm, type of transceiver as transmitter, location
in zone 1 , the BHP of radio frequency is
=⎟ ⎠
⎞⎜⎝
⎛ ∗∗+∗∗=
2
531094812.42001177279.8 BHP
45 B IDR
b. Example 2.
A station used GSM-900, bandwidth 200 khz, power
0 dBm, type of transceiver as receiver, location in
zone 1 :
=⎟ ⎠
⎞⎜⎝
⎛ ∗∗+∗∗=
2
01094812.42001177279.8 BHP
21 B IDR
This BHP-F formula has some weakness as follows:
2.1 No incentives fee between high and low frequency
Type service that be categorized on mass service such as
broadcasting and cellular communication has high
competition and profit. Interference and propagation on
lower frequency is better than higher frequency. Lower
frequency is scarcity also. HDDP and HDLP on UHF
band has single value. There is no incentives price for
higher frequency that make mass service provider
choose higher frequency to fix scarcity problem. In this
below, is HDLP and HDDP parameter table on UHF
band.
Table 1. HDDP and HDLP lookup table in UHF band
Band Zone 1 Zone2
Zone3
Zone4
Zone5
HDLP UHF 11,772 9,418 7,063 4,709 2,354
HDDP UHF 109,481 87,585 65,688 43,792 21,896
2.2 Not reflect of opportunity cost
Spectrum use of right in cellular communication service
is national right. It means that provider that have a right
to use spectrum have exclusive right that make another
provider can not use the spectrum. On non economical
zone, some spectrum has not used cause cost of CAPEX
reason because the fees is calculated per each station and
each RF channels. It make spectrum can not efficient to
use because there is opportunity to use that can not be
used (opportunity cost).
2.3 Not Proportional
In apparatus fee system, fees is calculated per each
station and each RF channels. For provider that uses
more bandwidth not usually pay more higher. In this
below, provider J that use 30 MHz pay lower than
provider K that use only 20 MHz for national right. It
make not proportional for other provider because the
right is same.
Table 2. BHP-F on 2007
Technology User
BW
(Mhz)
BHP-F
(Rp)
BHP-F / BW
(Rp/MHz)
CDMA-450 A 15 7,771,933,560 518,128,904
B 14.76 48,310,547,876 3,273,072,349
C 14.76 36,485,030,866 2,471,885,560
D 9.84 38,835,940,774 3,946,741,949
CDMA-800
E 4.92 2,953,073,559 600,218,203
CDMA-1900 F 12.5 30,339,683,534 2,427,174,683
G 80 1,331,215,092,932 16,640,188,662
H 65 736,531,891,098 11,331,259,863
I 30 328,389,937,561 10,946,331,252
J 30 24,647,702,466 821,590,082
GSM 900 /
GSM 1800
K 20 74,167,162,639 3,708,358,132
TOTAL 296.78 2,659,647,996,865 8,961,682,043
WSEAS TRANSACTIONS on BUSINESS and ECONOMICS
Ismail, Suhono H. Supangkat,
Hendrawan, Basuki Y. Iskandar
ISSN: 1109-9526 96 Issue 2, Volume 7, April 2010

8/6/2019 Techno-Economic Model for Policy Assessment to Optimize Spectrum
http://slidepdf.com/reader/full/techno-economic-model-for-policy-assessment-to-optimize-spectrum 4/10
2.4 Not Technology Neutral
lb and lp index still categories service related with
technology such as below. It will make difficult cause
technology of communication is rapid development.
Table 3. Cellular and WLL service
Type of service lb lp
Cellular FDMA
(AMPS. NMT)
Base + out station 8.210 0.630
Cellular TDMA
(GSM,DCS &PCS)
Base + out station 8.790 4.200
Cellular DS-CDMA (IS95)
Base + out station 3.400 11.710
WLL FDMA Base + remote/out
station
1,360 0,110
WLL TDMA Base + remote/out
station
0,230 0,490
WLL DS-CDMA Base + remote/out
station
0,070 0,490
The weaknesses make spectrum utilization only
optimal in some area especially in economic area that
shown as below. It is happened because the providers
have not obligation to pay their spectrum right
opportunity.
‐
20,000
40,000
60,000
80,000
100,000
120,000
140,000
N A D
S U M U T
S U M B A R
R I A U
J A M B I
S U M S E L
B E
N G K U L U
L A M P U N G
B A B E L
K E P R I
D K I J A Y A
J A B A R
J A T E N g
D I Y
J A T I M
B A N T E N
B A L I
N T B
N T T
K A L B A R
K A L T E N G
K A L S E L
K A L T I M
S U L U T
S U L T E N G
S U L S E L
S U L T R A
S U L B A R
G O R
O N T A L O
M A L
M A L U T
P A P U A
I R B A
Fig. 2. Channel utilization per province
3 ITU Recommendation For Frequency
FeeBHP-F using aperture based for GSM and FWA services
is not suitable anymore today because cannot promote
spectrum utilization. Today, the formulation of
frequency spectrum is based on the opportunity to utilize
spectrum. Many country today, use frequency fee
calculation based on bandwidth and spectral. ITU-T
recommends ITU-R SM. 2012-2 that can promote
optimalization on frequency spectrum utilization. ITU-
R SM. 2012 – Economic aspects of spectrum
management, was issued in 1998. In that
recommendation, ITU proposed, An analytical model for
calculating license fees on the basis of specified
incentives that are designed to promote efficient
spectrum use[7].
This model was developed in the framework of the
BDT Asia and Pacific Project on Spectrum Validation
and Licensing, Bangkok, 2000. The study focuses on a
specific method of spectrum fee calculation. The model
is derived from the conceptual base that there is a
distinct need to price spectrum and that the pricing of
spectrum resources should reflect more than
administrative convenience[7].
The purpose of this model is to increase spectrum
utilization efficiency. It is designed to introduce non-
discriminatory access to the spectrum for variouscategories of users, stimulate the use of less congested
(particularly – higher) frequency bands, stimulate
harmonized development of radio communication
services throughout the country, and cover the cost of
spectrum management. It includes the consideration of
the phased development and/or maintenance of spectrum
management and monitoring facilities and
reimbursement of expenditures of a national
telecommunication administration including its
international activities within ITU[7].
The proposed spectrum payment algorithm includes
the following steps[7]:
a. Determination of annual expenditures of the
State on management of actually used spectral
resource and determination of the common value
of the annual payments for all spectral resources.
b. Determination of the value of the spectral
resource used by each radio station and, through
their summation, by all stations registered in a
national Spectrum Management Database.
c. Determination of the price for a unit of the
spectral resource.d. Determination of the annual payment for a
specific user on a differential and non-
discriminatory basis, determined from the actual
value of used spectral resource.
3.1 Expenditures and Income of A State Concerning
Spectrum Management.
The total amount of the annual payments for spectral
resource Can, to be collected from all users where they
come from share of the sum that is necessary for
covering expenditures of the State on all national and
international spectrum management activities, netincome of the State, if applied and etc.
WSEAS TRANSACTIONS on BUSINESS and ECONOMICS
Ismail, Suhono H. Supangkat,
Hendrawan, Basuki Y. Iskandar
ISSN: 1109-9526 97 Issue 2, Volume 7, April 2010

8/6/2019 Techno-Economic Model for Policy Assessment to Optimize Spectrum
http://slidepdf.com/reader/full/techno-economic-model-for-policy-assessment-to-optimize-spectrum 5/10
3.2 Determination of The Used Spectral Resource
Value
The second step is to determine the spectral resource
value used by each user and then – by all users. For any
i-th frequency assignment (from their total amount n
incorporated in the national database) the three-
dimensional value of the spectral resource, denoted as
Wi, . This spectral resource is multiply from frequencyresource, territorial resource and time resource.
3.3 Determination of a time resource used by an
emission.
A time resource Ti used by i -th emission is determined
as not more than one year and for each frequency
assignment represents a fraction of time related to one
year, determined in that or another way, during which
the radio transmitter operates in accordance with terms
set out in the relevant license.
For example, if particular TV transmitter in
accordance with terms of its license is operating only16 h per a day throughout the whole year, than: Ti =
16/24 = 0.67 year. If another transmitter (for example an
HF one used for geological expedition), in accordance
with terms of its license can operate totally only 3
months per year, then: Ti = 3/12 = 0.35 year.
3.4 Determination of a territorial resource used by
an emission.
A territorial resource Si used by i -th emission is
determined by the territory actually occupied (covered)
by the emission in accordance with certain criteria(km2), and weighting coefficient which depends on the
j-th category of the territory actually occupied by the
emission and also number of categories.
The number of categories m and the relevant values
of the weighting coefficients bj should be set out by a
national telecommunications administration. These
categories can take into account density of population
and/or level of economic (industrial and/or agricultural)
development of various regions of a country.
3.5 Determination of a frequency resource used by
an emission.A frequency resource Fi used by i-th emission is
determined by necessary bandwidth of the emission
(MHz), calculated in accordance with Recommendation
ITU-R SM.1138, taking into account that an occupied
bandwidth of an emission should be equal to its
necessary bandwidth (Recommendation
ITU-R SM.328-9)
3.6 Determination of weighting coefficients.
General weighing coefficient can be presented from
takes into account commercial value of the spectrum
range used, taking into account social factor, takes intoaccount features of transmitter location, takes into
account the complexity of spectrum management
functions and other coefficient (coefficients) which can
be introduced by an administration reflecting its specific
needs.. Another weighting coefficient is exclusiveness of
the frequency assignment.
3.7 Price for The Qualified Unit of The Used
Spectral Resource
Then it is possible to determine the price of ∆ Can for a
qualified unit of the spectral resource where it present as
units of a national currency/(MHz ⋅ km2 ⋅ 1 year)
3.8 Annual Fees for Particular Frequency
Assignment
According to equation above the price ∆ Can for the
qualified unit of the spectral resource is determined.
Equation above gives the value of the spectral resource
Wi used for a particular i-th frequency assignment.
Based on this, the amount of the annual payment Ci
from the specific user of the spectrum for this frequency
assignment can be determined
4 Techno-Economic ModelingThe changing of frequency fee policy from aperture
based to bandwidth and spectral based will impact to the
industry and spectrum utilization. Government has the
obligation to manage spectrum more efficient in any
region and make healthy industry competition. Before
change the policy, government must analysis impact of
the new policy. Because this policy is related withtechnical and economic, Government must use techno-
economic model to ensure that their policy will have
lower risk.
Techno-economic model proposed in this research is
adopted from TERA (Techno-Economic Results from
ACTS)[8]. Illustration of the model is shown as below:
WSEAS TRANSACTIONS on BUSINESS and ECONOMICS
Ismail, Suhono H. Supangkat,
Hendrawan, Basuki Y. Iskandar
ISSN: 1109-9526 98 Issue 2, Volume 7, April 2010
8/6/2019 Techno-Economic Model for Policy Assessment to Optimize Spectrum
http://slidepdf.com/reader/full/techno-economic-model-for-policy-assessment-to-optimize-spectrum 6/10
Fig. 3. Techno-Economic Model for Policy Analysis
4. 1 Demand Forecast
Input of this model is came from customer forecast for
five year later. This forecast is illustrated as probability
of customer that provider can reach.
4.2 Define ARPU and Tariff
Customer consumption each user is came from ARPUdata. We use same tariff and type of traffic for all
providers. From this input, this model will produce data
of traffic each mount and each Provence.
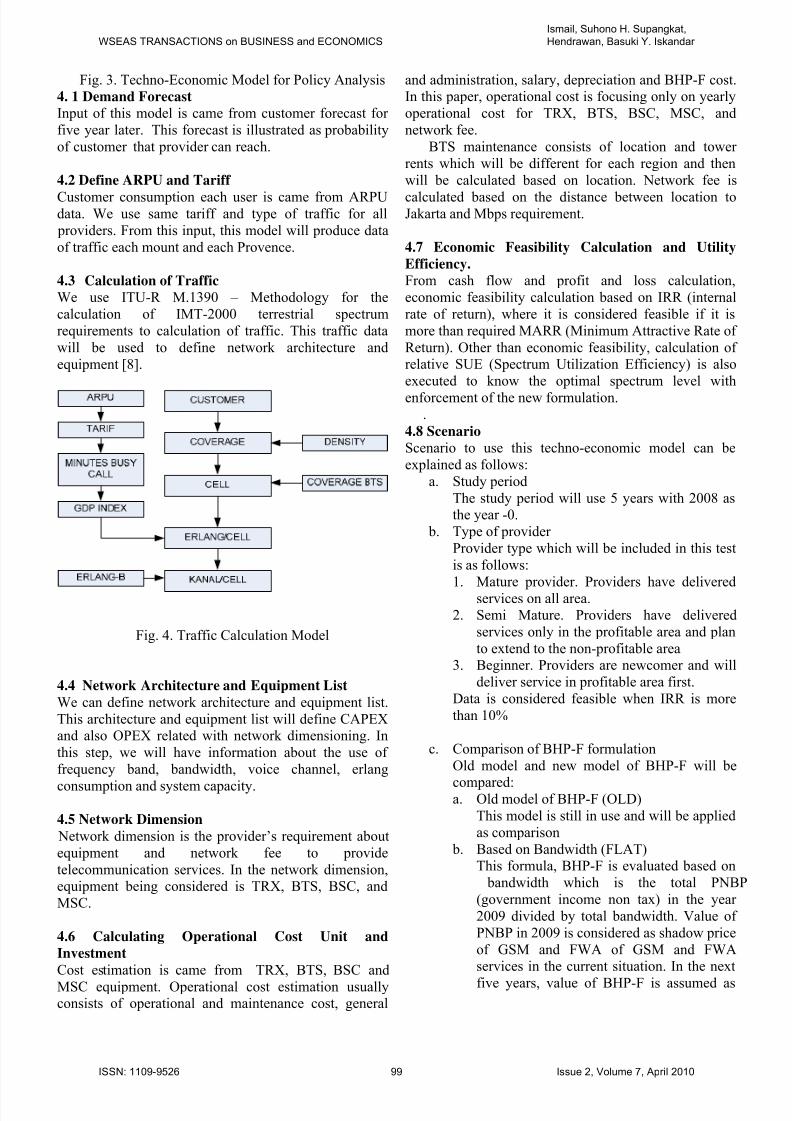
4.3 Calculation of Traffic
We use ITU-R M.1390 – Methodology for the
calculation of IMT-2000 terrestrial spectrum
requirements to calculation of traffic. This traffic data
will be used to define network architecture and
equipment [8].
Fig. 4. Traffic Calculation Model
4.4 Network Architecture and Equipment List
We can define network architecture and equipment list.
This architecture and equipment list will define CAPEX
and also OPEX related with network dimensioning. In
this step, we will have information about the use of
frequency band, bandwidth, voice channel, erlang
consumption and system capacity.
4.5 Network Dimension
Network dimension is the provider’s requirement about
equipment and network fee to provide
telecommunication services. In the network dimension,
equipment being considered is TRX, BTS, BSC, and
MSC.
4.6 Calculating Operational Cost Unit and
Investment
Cost estimation is came from TRX, BTS, BSC and
MSC equipment. Operational cost estimation usuallyconsists of operational and maintenance cost, general
and administration, salary, depreciation and BHP-F cost.
In this paper, operational cost is focusing only on yearly
operational cost for TRX, BTS, BSC, MSC, and
network fee.
BTS maintenance consists of location and tower
rents which will be different for each region and then
will be calculated based on location. Network fee is
calculated based on the distance between location toJakarta and Mbps requirement.
4.7 Economic Feasibility Calculation and Utility
Efficiency.
From cash flow and profit and loss calculation,
economic feasibility calculation based on IRR (internal
rate of return), where it is considered feasible if it is
more than required MARR (Minimum Attractive Rate of
Return). Other than economic feasibility, calculation of
relative SUE (Spectrum Utilization Efficiency) is also
executed to know the optimal spectrum level with
enforcement of the new formulation..
4.8 Scenario
Scenario to use this techno-economic model can be
explained as follows:
a. Study period
The study period will use 5 years with 2008 as
the year -0.
b. Type of provider
Provider type which will be included in this test
is as follows:
1.
Mature provider. Providers have deliveredservices on all area.
2. Semi Mature. Providers have delivered
services only in the profitable area and plan
to extend to the non-profitable area
3. Beginner. Providers are newcomer and will
deliver service in profitable area first.
Data is considered feasible when IRR is more
than 10%
c. Comparison of BHP-F formulation
Old model and new model of BHP-F will be
compared:a. Old model of BHP-F (OLD)
This model is still in use and will be applied
as comparison
b. Based on Bandwidth (FLAT)
This formula, BHP-F is evaluated based on
bandwidth which is the total PNBP
(government income non tax) in the year
2009 divided by total bandwidth. Value of
PNBP in 2009 is considered as shadow price
of GSM and FWA of GSM and FWA
services in the current situation. In the next
five years, value of BHP-F is assumed as
WSEAS TRANSACTIONS on BUSINESS and ECONOMICS
Ismail, Suhono H. Supangkat,
Hendrawan, Basuki Y. Iskandar
ISSN: 1109-9526 99 Issue 2, Volume 7, April 2010

8/6/2019 Techno-Economic Model for Policy Assessment to Optimize Spectrum
http://slidepdf.com/reader/full/techno-economic-model-for-policy-assessment-to-optimize-spectrum 7/10
fixed. Formulation of this model is as
follows:
BHP-F1=B x Cost Unit (4)
Cost Unit=PNBP BHP-F 2009 / B (5)
Where B is the bandwidth (MHz) and CostUnit is price per MHz.
c. Extended of ITU-R SM.2012-2. ITU
through ITU-R SM.2012-2 introduce
formula calculation BHP-F based on
opportunity which will able to promote
efficient use of spectrum. Basic idea of
using this method is to calculate the spectral
resources already in use. Combining with
AIP, government has intervention power to
set the price basis.
BHP-F3=∑[αi x P x B x Si ] x 114 (6)
P=[Log(275000)-Log(f)] (7)
Where α is economic level index, P is
spectrum index, B is the bandwidth (MHz),
S is population coverage which has been
served by provider (kilopops), i is each
location where service exists, and f is
frequency band (MHz) being used. Unit of α
and S is as follows:
Unit cost is Rp 114, is calculated based on
of PNBP BHP-F 2008 and it is assumed that
all region has been serviced.
Government intervention to set special fee
to certain region/location to induce the
increase of spectrum utilities there. In
Maluku, North Maluku, Papua, and West
Irian Jaya provinces, the incentive is 50%
discount, for NAD (Aceh) the incentive is
25%, for DKI Jakarta the discount is 10%.
5 ResultTesting is executed by executing IRR analysis to SUE
and see the effect to BHP-F. Testing is executed in
stages on each BHP-F formula starting from the old
BHP-F formula until the developed ITU-R SM-2012-2
INCENTIVE to the 3 provider types. The result is as
follows:
a. Beginner
SUE has maximum value for OLD formula and ITU-R
formula but the best IRR is on OLD formula. It is
happened because BHP-F only calculate base on channel
for OLD formula so it make lower cost for provider if
they use OLD formula.
OLD formula has better advantage for Beginner
Provider because they only pay only number of channel
that they have utilized. For government and their
competitor, it is not advantage if use OLD formula
because there is not opportunity cost on this formula. In
this situation, ITU-R is the best choice because has better SUE, IRR and BHP-F than FLAT although have
lower value than OLD formula.
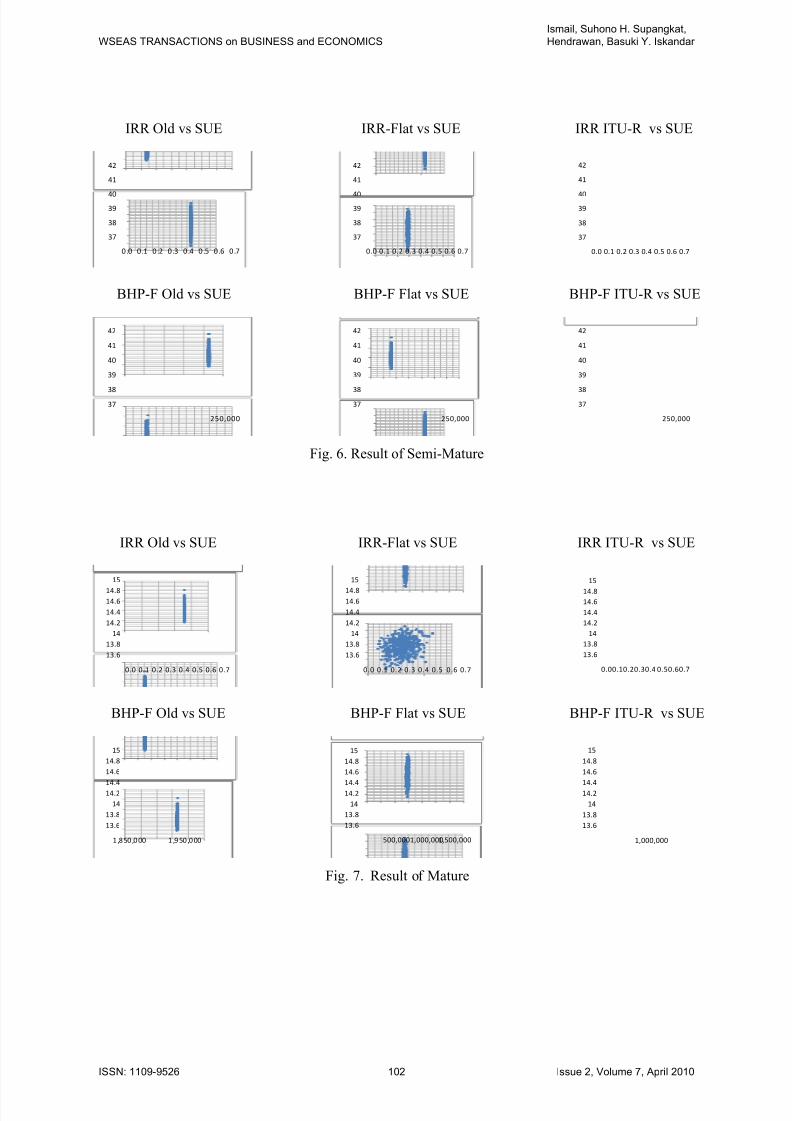
b. Semi Mature
All probability of SUE have same value for all formula.
The best IRR is on ITU-R Formula where has IRR
between 0.16-0.17. In this type of provider, ITU-R is the
best choice because has better SUE, IRR and BHP-F
than another.
Table 4. Result of Beginner Provider
FORMULABEGINNER
OLD FLAT ITU-R
MAX 0.8529 - 0.7576
AVERAGE 0.5696 - 0.6271SUE
MIN 0.3472 0.4934
MAX 0.59 - 0.18
AVERAGE 0.51 - 0.12IRR
MIN 0.36 0.10
MAX 52,950 - 353,382
AVERAGE 37,195 - 353,382BHP-F
(Million Rp)MIN 20,346 353,382
FEASIBILITY 100.0% 0.0% 6.6%
Table 5. Result of Semi Mature Provider
FORMULASEMI MATURE
OLD FLAT ITU-R
MAX 41.1131 41.1131 41.1131
AVERAGE 38.9632 38.9632 38.9632SUE
MIN 37.8341 37.8341 37.8341
MAX 0.15 0.16 0.17
AVERAGE 0.14 0.16 0.16IRRMIN 0.14 0.16 0.16
MAX 214,065 177,712 164,881
AVERAGE 213,853 177,712 164,036BHP-F
(Million
Rp) MIN 213,654 177,712 161,899
FEASIBILITY 100.0% 100.0% 100.0%
c. Result for Mature
All probability of SUE have same value for all formula.
The best IRR is on FLAT and ITU-R Formula. The
BHP-F is near one another for FLAT and ITU-R
formula, but for OLD, the BHP-F is highest because
mature provider hs utilized much channel. In this type of
WSEAS TRANSACTIONS on BUSINESS and ECONOMICS
Ismail, Suhono H. Supangkat,
Hendrawan, Basuki Y. Iskandar
ISSN: 1109-9526 100 Issue 2, Volume 7, April 2010

8/6/2019 Techno-Economic Model for Policy Assessment to Optimize Spectrum
http://slidepdf.com/reader/full/techno-economic-model-for-policy-assessment-to-optimize-spectrum 8/10
provider, ITU-R is the best choice because has better
SUE, IRR and BHP-F than another.
Table 6. Result of Mature Provider
FORMULAMATUREOLD FLAT ITU-R
MAX 14.9098 14.9098 14.9098
AVERAGE 14.3428 14.3428 14.3428SUE
MIN 13.7135 13.7135 13.7135
MAX 0.29 0.31 0.31
AVERAGE 0.28 0.30 0.30IRR
MIN 0.26 0.29 0.28
MAX 1,966,134 1,066,275 1,081,540
AVERAGE 1,911,446 1,066,275 1,081,540
BHP-F
(Million
Rp) MIN 1,867,070 1,066,275 1,081,540
FEASIBILITY 100.0% 100.0% 100.0%
With three type of provider and three kind of
formulation, we can conclude that ITU-R formula is the
best choice as substitute of old formula because in this
formula, have incentives factor that government can
intervention to promote utilization on un economic area
and have lower risk on economic feasibility.
IRR Old vs SUE IRR-Flat vs SUE IRR ITU-R vs SUE
0
0.2
0.4
0.6
0.8
1
0 .0 0 .1 0 .2 0 .3 0 .4 0 .5 0 . 6 0 . 7
0
0.2
0.4
0.6
0.8
1
0.0 0.1 0.2 0.3 0.4 0.5 0.6 0.7
0
0.2
0.4
0.6
0.8
1
0.0 0.1 0.2 0.3 0.4 0.5 0.6 0.7
BHP-F Old vs SUE BHP-F Flat vs SUE BHP-F ITU-R vs SUE
0
0.2
0.4
0.6
0.8
1
250,000
0
0.2
0.4
0.6
0.8
1
250,000
0
0.2
0.4
0.6
0.8
1
2 5 0 ,0 0 0 5 0 0 ,0 0 0
Fig 5. Result of Beginner
WSEAS TRANSACTIONS on BUSINESS and ECONOMICS
Ismail, Suhono H. Supangkat,
Hendrawan, Basuki Y. Iskandar
ISSN: 1109-9526 101 Issue 2, Volume 7, April 2010
8/6/2019 Techno-Economic Model for Policy Assessment to Optimize Spectrum
http://slidepdf.com/reader/full/techno-economic-model-for-policy-assessment-to-optimize-spectrum 9/10
IRR Old vs SUE IRR-Flat vs SUE IRR ITU-R vs SUE
37
38
39
40
41
42
0.0 0 .1 0 .2 0.3 0 .4 0.5 0.6 0.7
37
38
39
40
41
42
0.0 0.1 0.2 0.3 0.4 0.5 0.6 0.7
37
38
39
40
41
42
0.0 0.1 0.2 0.3 0.4 0.5 0.6 0.7
BHP-F Old vs SUE BHP-F Flat vs SUE BHP-F ITU-R vs SUE
37
38
39
40
41
42
250,000
37
38
39
40
41
42
250,000
37
38
39
40
41
42
250,000
Fig. 6. Result of Semi-Mature
IRR Old vs SUE IRR-Flat vs SUE IRR ITU-R vs SUE
13.6
13.8
14
14.2
14.4
14.6
14.8
15
0.0 0.1 0.2 0.3 0.4 0.5 0.6 0.7
13.6
13.8
14
14.2
14.4
14.6
14.8
15
0.0 0.1 0.2 0.3 0.4 0.5 0.6 0.7
13.6
13.8
14
14.2
14.4
14.6
14.8
15
0.00.10.20.30.4 0.50.60.7
BHP-F Old vs SUE BHP-F Flat vs SUE BHP-F ITU-R vs SUE
13.6
13.8
14
14.214.4
14.6
14.8
15
1 ,8 50 ,0 00 1 ,9 50 ,0 00
13.6
13.8
14
14.214.4
14.6
14.8
15
500,0001,000,0001,500,000
13.6
13.8
14
14.214.4
14.6
14.8
15
1,000,000
Fig. 7. Result of Mature
WSEAS TRANSACTIONS on BUSINESS and ECONOMICS
Ismail, Suhono H. Supangkat,
Hendrawan, Basuki Y. Iskandar
ISSN: 1109-9526 102 Issue 2, Volume 7, April 2010

8/6/2019 Techno-Economic Model for Policy Assessment to Optimize Spectrum
http://slidepdf.com/reader/full/techno-economic-model-for-policy-assessment-to-optimize-spectrum 10/10
6 ConclusionAs a limited and critical resource, Government has
to manage and regulate the frequency fee policy.
The objective is to ensure that frequency spectrum
has better utilization in all region. To reach the
objectives, government must recommend to
changing aperture based BHPF-F with a new BHP-
F because aperture based BHP-F has been proven
that cannot push to better utilization. This policy
changing will affect in economic and in technical.
By this model, government is able to obtain the
best policy. In this case, formula from ITU has a
lower risk economic impact and can reach better
utilization than others.
References:
[1] M. Cave, C. Doyle, W. Webb, “Essential of
Modern Spectrum Management”, Cambridge
University Press, New York, 2007
[2] Commonwealth of Australia, “Radio
communications Inquiry Report”, Productivity
Commission, Australia, 2002
[3] http://www.ictregulationtoolkit.org/en/Publicati
on.2978.html[4] ITU-R Recommendations SM.1046-2 on
“Definition of spectrum use and efficiency of a
radio system”
[5] A.M. Youssef, E. Kalman,L. Benzoni,
“Technico-Economic Methods for Radio
Spectrum Assignment”, IEEE Communications
Magazine, IEEE, Volume 33, Issue 6, June
1995
[6] Government Regulation No.53 Of 2000, The
Use Of A Radio Frequency Spectrum And
Satellite Orbit.
[7] ITU-R M.2012-2 on “Economic aspect of spectrum management”
[8] Smura, Timo, “Techno-Economic Analysis Of
IEEE 802.16a-Based Fixed Wireless Access
Networks”, Helsinki, 2004
[9] ITU-R M.1390 – Methodology for the
calculation of IMT-2000 terrestrial spectrum
requirements
[10] Ministry Of ICT Regulation No 7 Of 2006,
The Use Of A Radio Frequency Spectrum For
IMT-2000
[11] ITU-R Recommendation P.1546 “ Method for
point-to-area predictions for terrestrial services
in the frequency range 30 MHz to 3 000 MHz”[12] Indonesia Statistic Year Book 2008.
WSEAS TRANSACTIONS on BUSINESS and ECONOMICS
Ismail, Suhono H. Supangkat,
Hendrawan, Basuki Y. Iskandar
ISSN: 1109-9526 103 Issue 2, Volume 7, April 2010