Techno-economic Evaluation of FTTC/ VDSL and FTTH Roll-Out ...cgi.di.uoa.gr/~arkas/PDFs/J30...
13
Techno-economic Evaluation of FTTC/ VDSL and FTTH Roll-Out Scenarios: Discounted Cash Flows and Real Option Valuation Theodoros Rokkas, Dimitris Katsianis, and Dimitris Varoutas Abstract—Due to the increasing demand in data rates telecom operators are faced with the question of when to upgrade their access network infrastructure toward fiber-to-the-home (FTTH). In this paper a techno-economic study of fiber-to-the-cabinetÕvery high bit rate digital subscriber line (FTTCÕVDSL) and FTTH deployments is performed. The economics and risks associated with the incumbent’s decision to in- vest in dense urban and urban areas are analyzed us- ing both discount cash flow (DCF) analysis and real options analysis (ROA). The results revealed that in the case of investment subsidization, the option value to expand in a later phase can significantly improve the financial metrics of the business cases. The analy- sis made is based on the ECOSYS techno-economic methodology and tool. Index Terms—Communication systems economics; Optical networks; Technology assessment; Technol- ogy forecasting; Communication system operations and management; Communication system planning. I. INTRODUCTION D emand for higher bandwidth is rapidly increas- ing, fueled by content distribution, file sharing/ downloading, and social networking. Existing copper- based (xDSL) and wireless/mobile (mainly WiFi, WiMAX and 3G, HSPA) technologies are already at a mature level, but fiber-based deployments and espe- cially fiber to the home (FTTH) are under way with the aim to offer a future-proof solution for real sus- tainable high bandwidths in access networking [1,2]. However, many telecom operators are skeptical in introducing fiber to the home (FTTH) due to the high investment costs associated with civil works, espe- cially in urban and rural areas [3]. Therefore, their current strategy is to exploit at the highest possible level their existing copper-based networks as long as possible. This strategy leads to fiber-to-the-cabinet (FTTC) and fiber-to-the-node (FTTN) deployments with very high bit rate digital subscriber line (VDSL) Ethernet access. A number of research and policy questions have arisen as different architectures and technologies are discussed, such as the upgrade possi- bilities from FTTC to FTTH [4]. Although 50% of the initial FTTC investment could be reused in an FTTH upgrade, if multiple operators invest in active equip- ment at the street cabinet, the situation could still lead to market failures [4]. To deal with the pertinent issues of FTTH deployment, regulatory and policy ac- tions aiming to provide incentives for FTTH as a com- modity are also ongoing. The most important action in this direction is the deployment of fiber-based net- works from municipalities, utility companies, and housing companies [5], which aim mostly to get indi- rect revenues from these deployments (e.g., city at- tractiveness), but direct revenues could also be fore- seen. Nevertheless, the private initiatives for the deploy- ment of future-proof networks as well as the public ones, especially from national and local governments to offer subsidies in order to boost deployments, have brought up critical questions regarding the costs and risks, mostly associated with the technology, market, and regulation of these networks. Since the financial figures of these deployments will determine the level of subsidization or the cost allocation between the dif- ferent actors and stakeholders, a detailed techno- economic approach is more than important today. During recent years, an increasing number of re- search papers besides the consultancy reports have been developed within national and international col- laborative projects aiming to contribute to this broad- band debate. Most of these works deal with the instal- Manuscript received December 11, 2009; revised June 20, 2010; ac- cepted July 30, 2010; published August 31, 2010 Doc. ID 121329. The authors are with the Department of Informatics and Telecommunications, University of Athens, Panepistimiopolis, Ilisia, Athens, GR 15784, Greece (e-mail: [email protected]). Digital Object Identifier 10.1364/JOCN.2.000760 760 J. OPT. COMMUN. NETW./VOL. 2, NO. 9/SEPTEMBER 2010 Rokkas et al. 1943-0620/10/090760-13/$15.00 © 2010 Optical Society of America
Transcript of Techno-economic Evaluation of FTTC/ VDSL and FTTH Roll-Out ...cgi.di.uoa.gr/~arkas/PDFs/J30...

760 J. OPT. COMMUN. NETW./VOL. 2, NO. 9 /SEPTEMBER 2010 Rokkas et al.
Techno-economic Evaluation of FTTC/VDSL and FTTH Roll-Out
Scenarios: Discounted Cash Flows andReal Option Valuation
Theodoros Rokkas, Dimitris Katsianis, and Dimitris Varoutas
icclp(wEqtbiumlitmtwhrts
motbrafiofe
sblb
Abstract—Due to the increasing demand in datarates telecom operators are faced with the question ofwhen to upgrade their access network infrastructuretoward fiber-to-the-home (FTTH). In this paper atechno-economic study of fiber-to-the-cabinetÕveryhigh bit rate digital subscriber line (FTTCÕVDSL) andFTTH deployments is performed. The economics andrisks associated with the incumbent’s decision to in-vest in dense urban and urban areas are analyzed us-ing both discount cash flow (DCF) analysis and realoptions analysis (ROA). The results revealed that inthe case of investment subsidization, the option valueto expand in a later phase can significantly improvethe financial metrics of the business cases. The analy-sis made is based on the ECOSYS techno-economicmethodology and tool.
Index Terms—Communication systems economics;Optical networks; Technology assessment; Technol-ogy forecasting; Communication system operationsand management; Communication system planning.
I. INTRODUCTION
D emand for higher bandwidth is rapidly increas-ing, fueled by content distribution, file sharing/
downloading, and social networking. Existing copper-based (xDSL) and wireless/mobile (mainly WiFi,WiMAX and 3G, HSPA) technologies are already at amature level, but fiber-based deployments and espe-cially fiber to the home (FTTH) are under way withthe aim to offer a future-proof solution for real sus-tainable high bandwidths in access networking [1,2].
However, many telecom operators are skeptical inintroducing fiber to the home (FTTH) due to the high
Manuscript received December 11, 2009; revised June 20, 2010; ac-cepted July 30, 2010; published August 31, 2010 �Doc. ID 121329�.
The authors are with the Department of Informatics andTelecommunications, University of Athens, Panepistimiopolis,Ilisia, Athens, GR 15784, Greece (e-mail: [email protected]).
Digital Object Identifier 10.1364/JOCN.2.000760
1943-0620/10/090760-13/$15.00 ©
nvestment costs associated with civil works, espe-ially in urban and rural areas [3]. Therefore, theirurrent strategy is to exploit at the highest possibleevel their existing copper-based networks as long asossible. This strategy leads to fiber-to-the-cabinetFTTC) and fiber-to-the-node (FTTN) deploymentsith very high bit rate digital subscriber line (VDSL)thernet access. A number of research and policyuestions have arisen as different architectures andechnologies are discussed, such as the upgrade possi-ilities from FTTC to FTTH [4]. Although 50% of thenitial FTTC investment could be reused in an FTTHpgrade, if multiple operators invest in active equip-ent at the street cabinet, the situation could still
ead to market failures [4]. To deal with the pertinentssues of FTTH deployment, regulatory and policy ac-ions aiming to provide incentives for FTTH as a com-odity are also ongoing. The most important action in
his direction is the deployment of fiber-based net-orks from municipalities, utility companies, andousing companies [5], which aim mostly to get indi-ect revenues from these deployments (e.g., city at-ractiveness), but direct revenues could also be fore-een.
Nevertheless, the private initiatives for the deploy-ent of future-proof networks as well as the public
nes, especially from national and local governmentso offer subsidies in order to boost deployments, haverought up critical questions regarding the costs andisks, mostly associated with the technology, market,nd regulation of these networks. Since the financialgures of these deployments will determine the levelf subsidization or the cost allocation between the dif-erent actors and stakeholders, a detailed techno-conomic approach is more than important today.
During recent years, an increasing number of re-earch papers besides the consultancy reports haveeen developed within national and international col-aborative projects aiming to contribute to this broad-and debate. Most of these works deal with the instal-
2010 Optical Society of America

wngtc
hynaatdpametg
nlnsHcigbdpurpclrmtc
qfooemipt(focc
Rokkas et al. VOL. 2, NO. 9 /SEPTEMBER 2010/J. OPT. COMMUN. NETW. 761
lation first cost (IFC) of the infrastructure or a part ofit [2,6–9] and they usually deal only with an analysisof techno-economic benefits of technological solutions.In [10–12] a techno-economic analysis of municipalnetworks and the associated costs are also presented,whereas in [13] the migration path from FTTC toFTTH is analyzed and discussed. An interesting ap-proach based on game theory dealing with the compe-tition in small-scale networks can also be found in[10]. In [14], an algorithm for minimizing the cost fora passive optical network is discussed, in [15] ananalysis for a WDM network is presented, and [16]studies the impact of fiber deployments in the accessnetwork to the regulatory framework in Europe. Inthe near past, similar research has been undertakenwithin the European-funded projects IST-TONIC [17]and CELTIC-ECOSYS [18], which studied various up-grade or deployment scenarios for both fixed and wire-less mostly mobile telecommunication networks.These projects are precursors in the investigation ofthe economic side of telecommunications networksand services deployments [3,19–22].
However, a complete analysis related to the FTTHdeployment scenarios aiming to offer quantitative re-sults and to analyze the associated attitude from in-cumbent operators is still absent, to the best of au-thors’ knowledge. This paper aims to offer thesequantitative results by incorporating both “tradi-tional” discounted cash flow (DCF) analysis and realoptions analysis (ROA).
The rest of the paper is organized as follows. SectionII describes the techno-economic methodology and thetool exploited for the analysis presented and dis-cussed. Section III includes the description of thecases analyzed and the assumptions and parametersincorporated. Section IV presents the results relatedto the base cases, namely, the FTTC/VDSL and FTTHdeployments in dense urban and urban areas. Sec-tions V and VI introduce the real options methodologyand the results based on this theory, and Section VIIconcludes the analysis.
II. TECHNO-ECONOMIC METHODOLOGY AND TOOL
A. TONIC–ECOSYS Methodology and Tool
The techno-economic methodology adopted for theevaluation of FTTC and FTTH deployments is basedon the TONIC tool developed within the IST-TONIC[17] and the CELTIC-ECOSYS [18] Europeanprojects. The TONIC tool and its enrichment, theECOSYS tool, have been used for several studiesamong European telecom operators and universitiesfor many years [3,19–21,23].
The model’s operation is based on its database,here the cost figures of the various network compo-ents are kept and constantly updated from dataathered from the biggest European telecommunica-ion companies and vendors as well as from the tele-om market [3,19].
The study period is best adapted to the case atand. For a fixed network deployment case an 8–10-ear period is reasonable, considering the time a fixedetwork or service takes to reach market maturitynd to pay back the investments. The services offeredre specified as well as their market penetration overhe study period. In addition, the service tariffs areefined taking into account both econometric andrice forecast models, and the part of the tariff that isttributed to each network under study can also beodeled. From the combination of yearly market pen-
tration and tariff evolution, with the ECOSYS toolhe revenue side of network deployments for each yeariven the selected service set can be calculated.
For the expenditures side, the architecture sce-arios that provide the selected service set are se-
ected from the candidates. This kind of modelingeeds network planning expertise and is mostly out-ide of the framework of the ECOSYS methodology.owever, many network architectures can be ac-
ounted for, such as tree, mesh, or ring architectures,ncorporated within the tool, which includes a set ofeometric models that assist in the network planningy automatically calculating lengths for cables anducting. These geometric models [24] are optionalarts of the methodology and the ECOSYS tool can besed without them, as in the techno-economic case ofadio access technologies. Network data from otherlanning tools can also be used. The output of the ar-hitecture scenario definition is the so-called shoppingist, which is calculated for each year of the study pe-iod and shows the volumes of all network cost ele-ents (equipment, cables, cabinets, ducting, installa-
ion, etc.) and the distribution of these networkomponents over different network levels and layers.
To estimate the number of network components re-uired throughout the study period, the necessaryorecasts (both demand and price forecast) are carriedut according to existing methodologies (e.g., [25,26])r market studies and are incorporated in the techno-conomic model. The operation, administration, andaintenance (OA&M) cost for each network element
s estimated from the price of each of its constitutivearts. For example, in the case of an Ethernet switch,he model includes the switch basic equipmentswitching fabric, power supply, rack and line inter-ace cards) taking into account list price informationf several vendors. The price evolution of the networkomponents is estimated using the extended learningurve model as in [24]. As far as the cost of repair
sccLhtctltda
csocaVdrcpFfpu
EbLELb
A
DeDaNNCNSTBTDDaDa
762 J. OPT. COMMUN. NETW./VOL. 2, NO. 9 /SEPTEMBER 2010 Rokkas et al.
parts is concerned, it is calculated by the model as afixed percentage of the total investments in networkelements, whereas the cost of repair work is calcu-lated based on mean time between failures (MTBF)and the mean time to repair (MTTR).
By combining the revenues and expenditures sides,namely, service revenues, investments, operatingcosts, and general economic inputs (e.g., discount rate,tax rate), the tool calculates the results necessary forDCF analysis such as cash flows, net present values(NPVs), internal rate of return (IRR), payback period,and other economic figures of merit (see Fig. 1). Moredetails on the methodology are presented in [24], butthey can also be found in [3,19]. For the cases pre-sented hereafter, the dimensioning rules and the geo-metric models are presented in Section III.
B. Discounted Cash Flow Analysis
DCF analysis takes into account the time value ofmoney and the risks of investing in a project and es-timates and discounts the investment’s future cashflows in order to calculate the present value (PV). Themain advantages of DCF analysis are that it is asimple quantitative method to implement, is widelyaccepted, and provides clear and consistent metrics(e.g., NPV, IRR, payback period) for all kinds ofprojects.
It should be noted that the models used in DCF aredeterministic and static and the results and decisionsare fixed, as modeled. That would be valid in a worldwithout changes in the economic environment, but inthe real world conditions change rapidly. Therefore,the decision maker of a project has the flexibility tomake changes when the conditions require it. Thisfact necessitates the analysis of uncertainty in variousways. A first step to model the uncertainty is to build abasic DCF model, taking into account as many factorsas possible, especially in complex projects such as tele-com projects and then to perform sensitivity and riskanalysis in order to include the (un)expected develop-ments.
III. CASE STUDY AND ASSUMPTIONS
A. Architecture and Area Description
FTTH and FTTC architectures with a combinationof gigabit Ethernet and Ethernet over VDSL for thelast mile are investigated from the incumbent opera-tors’ point of view. Two area types in an average Eu-ropean country, namely, dense urban (DU) and urban(U) are studied. These areas share the same networktopology but differ in several characteristics such asarea dimensions, population density, and averagecable and duct lengths; these characteristics are pre-
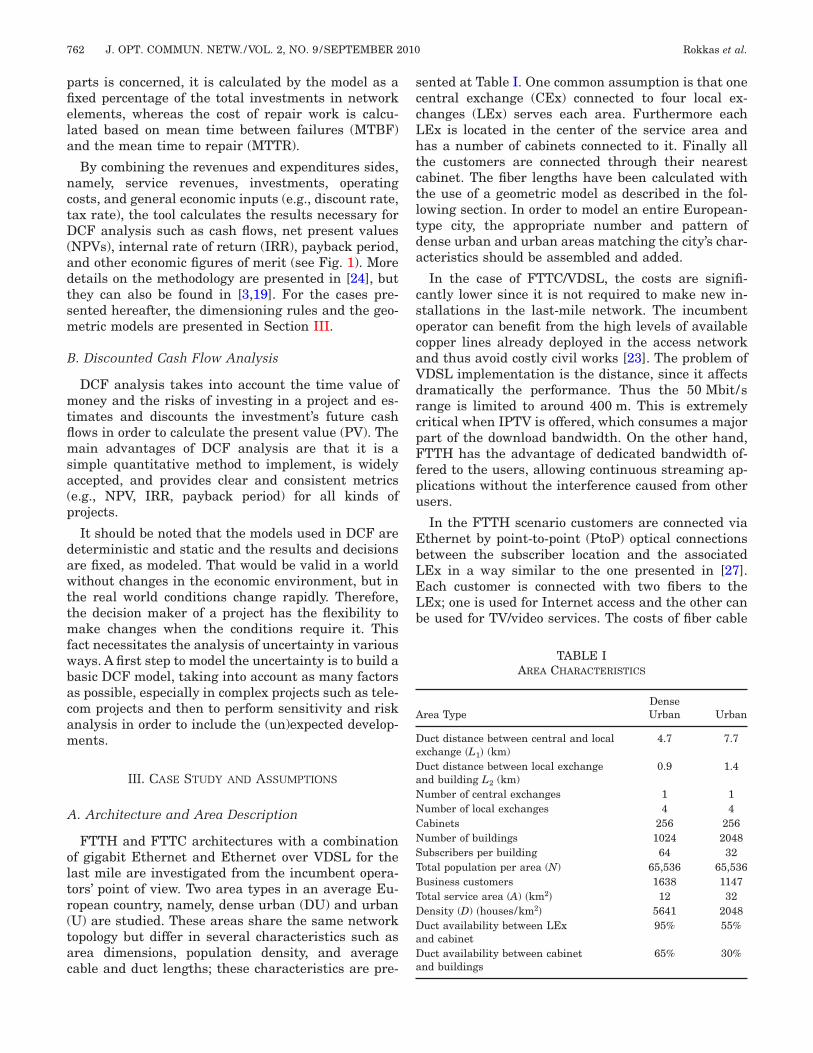
ented at Table I. One common assumption is that oneentral exchange (CEx) connected to four local ex-hanges (LEx) serves each area. Furthermore eachEx is located in the center of the service area andas a number of cabinets connected to it. Finally allhe customers are connected through their nearestabinet. The fiber lengths have been calculated withhe use of a geometric model as described in the fol-owing section. In order to model an entire European-ype city, the appropriate number and pattern ofense urban and urban areas matching the city’s char-cteristics should be assembled and added.
In the case of FTTC/VDSL, the costs are signifi-antly lower since it is not required to make new in-tallations in the last-mile network. The incumbentperator can benefit from the high levels of availableopper lines already deployed in the access networknd thus avoid costly civil works [23]. The problem ofDSL implementation is the distance, since it affectsramatically the performance. Thus the 50 Mbit/sange is limited to around 400 m. This is extremelyritical when IPTV is offered, which consumes a majorart of the download bandwidth. On the other hand,TTH has the advantage of dedicated bandwidth of-
ered to the users, allowing continuous streaming ap-lications without the interference caused from othersers.
In the FTTH scenario customers are connected viathernet by point-to-point (PtoP) optical connectionsetween the subscriber location and the associatedEx in a way similar to the one presented in [27].ach customer is connected with two fibers to theEx; one is used for Internet access and the other cane used for TV/video services. The costs of fiber cable
TABLE IAREA CHARACTERISTICS
rea TypeDenseUrban Urban
uct distance between central and localxchange �L1� (km)
4.7 7.7
uct distance between local exchangend building L2 (km)
0.9 1.4
umber of central exchanges 1 1umber of local exchanges 4 4abinets 256 256umber of buildings 1024 2048ubscribers per building 64 32otal population per area (N) 65,536 65,536usiness customers 1638 1147otal service area (A) �km2� 12 32ensity (D) �houses/km2� 5641 2048uct availability between LExnd cabinet
95% 55%
uct availability between cabinetnd buildings
65% 30%

wo
Hb
ftL
ft
C
os
sntFanashE
Rokkas et al. VOL. 2, NO. 9 /SEPTEMBER 2010/J. OPT. COMMUN. NETW. 763
and branching boxes, including installation costs andthe pulling costs into the ducts, have also been esti-mated.
B. Geometric Model
A geometric model is usually used to estimate theamount of cable, ducts, and civil works (trenches) re-quired in the network. The model takes several inputssuch as subscriber density, network topology, ductavailability, etc. and calculates trench length, ductlength, and cable length [24]. The model follows thelayered structure of the network, in which each layeruses the same basic geometric model, but with differ-ent parameters. In the model incorporated in thisstudy, the total area covered is modeled as a squareand the network follows a star topology at each layer.
The first layer, represented as flexible point (FP) #7,is a large CEx and serves a square area with sidelength L6. The splitting ratio of this point is equal to 1as shown in Fig. 2. This means that there is only onepoint of the next lower level point (FP6), representinga branching box, which is now connected with the fourLExs, numbered as FP5. Figure 3 illustrates theseflexible points and layers. In all calculations, the flex-ibility points are always placed in the center of thenext layer. The total cable and duct length is calcu-lated by aggregation of the appropriate lengths. Forexample, the length of level 6 is given by
Fig. 1. Techno-economic methodology and tool [17,18].
Fig. 2. Architecture of dense urban areas.
L6 = �A =�N
D, �1�
here A is the total service area, N is the populationf the area, and D is the subscriber density.
The total duct length of Layer 6 illustrated by the-shaped gray line ducting system in Fig. 3 is giveny
DUCTL6 = 1.5 · L6. �2�
The total cable length at one layer can easily beound by adding up cable lengths from the center FPo each of the next-level FPs. The total cable length ofayer 6 is given by
CL6 = 2 · L6. �3�
Following the same algorithm, the length and ductsor all layers down to layer 0, which represent cus-omer premises, can be easily calculated.
. Services Offered
For the analysis of the selected business cases, a setf services bundled in four service baskets has beenelected, as illustrated in Table II.
These service baskets include the fees for both theervice and network operator and provide unlimitedational phone calls and unlimited broadband accesso the Internet. The difference between the cases ofTTC and FTTH is that the latter can offer highernd symmetric data rates. TV and video services areot included in these baskets and in the followingnalysis since there is variety in these services acrosseveral European countries. The above tariff valuesave been adopted based on a survey among majoruropean operators in several countries. A yearly
Fig. 3. Geometric model description.

ocfit
dnobitohale
ttdbeeai
E
mpfiiFpm
o
764 J. OPT. COMMUN. NETW./VOL. 2, NO. 9 /SEPTEMBER 2010 Rokkas et al.
price erosion of 2% has been adopted in order to modelthe current situation of price competition worldwide.
D. Demand Forecasts
Telecommunications demand forecasting has at-tracted the interest of many researchers worldwide,not only due to the long period of innovations duringthe past several years, but also due to the uniquecharacteristics associated with telecommunications,such as the strong substitution effects between differ-ent technology generations [28]. Related research ac-tivities focus on the study of the diffusion process dy-namics aiming to develop and apply methods towardcomprehensive analyses of telecommunications prod-ucts, services, and technology. Usually the interest in-cludes the study and development of demand models,the associated mathematical methods for the estima-tion of the models’ parameters, and the evaluation ofthe results over specific cases [29–31].
In this analysis, a logistic model is used to performthe demand forecasts for the selected services. Thismodel is recommended for long-term forecasts and fornew services both for fixed and mobile networks[25,26]. To achieve a good fit, a four-parameter modelincluding the saturation level is used. The model isdefined by the following expression:
Yt =M
�1 + ea+bt�c , �4�
where Yt is the actual or forecasted demand at time tas a population percentage; M is the demand satura-tion level as a population percentage; t is the time inyears; and a, b, and c are diffusion parameters thatcan be estimated based on existing market data, re-lated to broadband penetration across Europe.
Since the model is a nonlinear function of the re-lated parameters, a typical regression analysis, e.g.,
TABSERVICE
NameDownload
FTTC/VDSL (MB)Download/Upload
FTTH (MB)
Residential
Basic 6 100Premium 12 300
Silver 24 500Gold 50 1000
Business S
Basic 6 100Premium 12 200
Silver 24 500Gold 50 1000
rdinary least-squares regression, can lead to signifi-ant errors. Therefore, a stepwise procedure is used tond the optimal parameter estimation. More informa-ion about this topic can be found in [28–30].
Market demand considers both business and resi-ential market segments in order to evaluate theumber of subscribers belonging to each segment. Theperator will provide services at both residential andusiness customers with the characteristics presentedn Table II. The requirements of business and residen-ial customers are obviously different, with the formerften demanding a more symmetric bit rate with aigher quality of service (QoS) and increased securitynd in most of the cases higher data rates than theatter, especially when HDTV has not been consid-red.
The penetration for each packet is modeled usinghe previous equations with the following assump-ions. During the first years that the service is intro-uced, the preferred packet will be the basic packet,ut as the years pass, finally the silver and gold pack-ts will prevail and attract more and more subscrib-rs. Due to new innovative applications that will bevailable only to these packets, customers will be will-ng to pay the extra money (Fig. 4).
. Deployment Scenarios
For the case of FTTC, the incumbent operatorakes a strategic decision during the first year of the
roject (in this model year 2009 has been used as therst year) to invest in a VDSL upgrade on the network
n the dense urban areas. On the other hand, if theTTH scenario is chosen, all the copper lines are re-laced with fiber ones reaching the customer pre-ises.
The decision that should be made by an incumbentperator is whether it should also invest in the urban
IIFFERED
tentionatio
Initial MonthlyPrice (€) FTTC (2009)
Initial MonthlyPrice (€) FTTH (2009)
vice Basket
1:20 20 341:20 28 461:20 33 541:20 38 64
ice Basket
1:5 97 1001:5 135 1691:5 178 2231:5 231 290
LES O
ConR
Ser
erv

ucf
nalbtotjotlatqmS
Rokkas et al. VOL. 2, NO. 9 /SEPTEMBER 2010/J. OPT. COMMUN. NETW. 765
areas and, if yes, when in the following years is theoptimum time to do it. To answer these questions, ini-tially the case of building these new networks simul-taneously in both dense urban and urban areas will beexamined, and then the impact of the delay of expand-ing the network to the urban areas as a function oftime (e.g., if the operator delays the expansion at ur-ban areas for T=1, . . . ,6 years after the initial deploy-ment in dense urban areas at T=0) will be studied.The analysis will be performed both with the tradi-tional DCF analysis but also with the application ofreal options analysis that will be introduced and ana-lyzed in Section V.
IV. DCF ANALYSIS RESULTS
A. Base Case Results
The selected study period is set to 8 years beginningin 2009 and ending in 2016; the discount rate is as-sumed to be 10% and no taxes are applied. Table IIIpresents the calculated NPV for both scenarios for thebase case; the incumbent upgrades the network inboth dense urban and urban areas during the initialyear �T=0� of the project. To better understand the re-sults, a breakdown of the NPV for the two areas isalso presented. Both cases have negative values forthe NPV with the remark that the FTTC/VDSL solu-tion has a total value (both areas covered) that is bet-ter than the case of deploying FTTH only in the dense
Fig. 4. Penetration forecasts for residential and business services.
TABLE IIIECONOMIC RESULTS
NPV Total (M€) Dense Urban (M€) Urban (M€)
FTTC/VDSL −2.3 4.4 −6.7FTTH −24.1 −4.4 −19.7
rban areas. Thus from first reading one would con-lude that it is better to choose the FTTC solutionrom the first year and for both areas.
In Fig. 5, the basic economic indices for both sce-arios are presented. The cash flow depicts the bal-nce of the economics per each year and the cumu-ated discounted cash flow widely known as the cashalance summarizes the total economics and gives theotal financial evolution of the business case. The firstbservation is that both projects start with high nega-ive values. This originates from the fact that the ma-or part of the investments are made in the first yearf the deployment, which represents a typical rule inelecommunications. The observation is used in theater sections to justify the use of the real optionsnalysis. In both cases these costs are associated withhe costly fiber roll-out in order to achieve coverage re-uirements, and thus these high front-end invest-ents affect the NPV greatly as will be presented inection V.
Fig. 5. Economics of the project (both areas).
ttue2cpeeteBdTalc
B
umpascfsti
766 J. OPT. COMMUN. NETW./VOL. 2, NO. 9 /SEPTEMBER 2010 Rokkas et al.
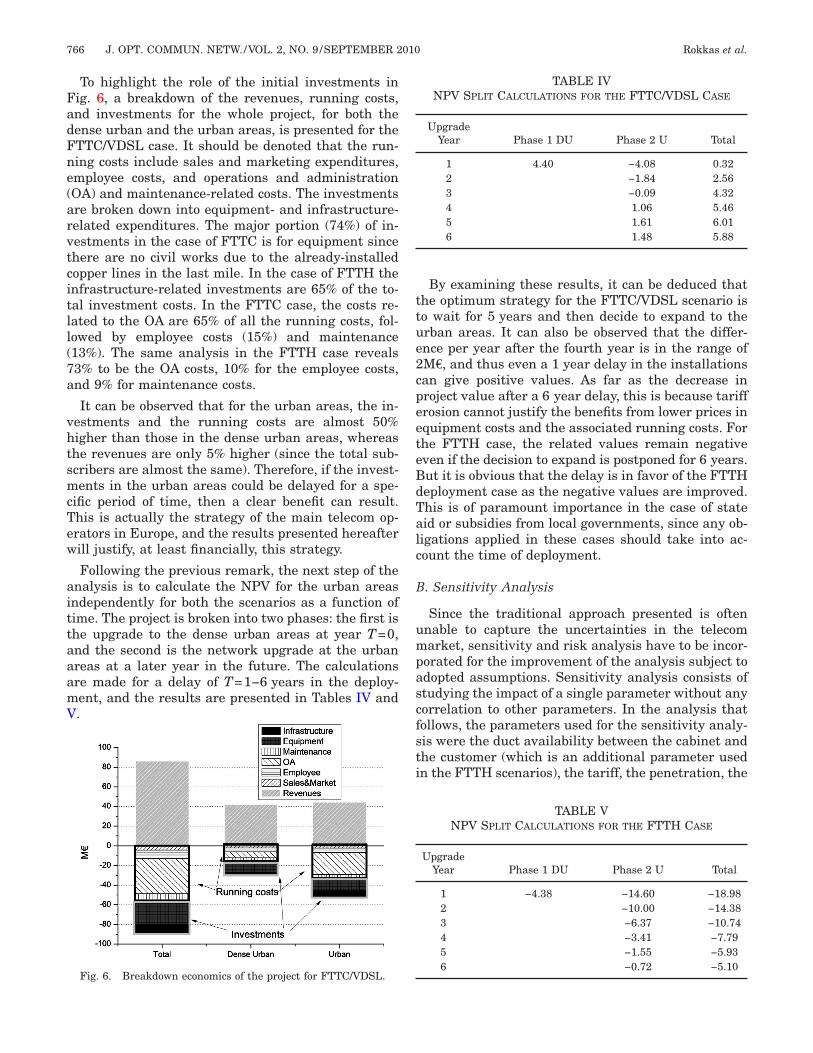
To highlight the role of the initial investments inFig. 6, a breakdown of the revenues, running costs,and investments for the whole project, for both thedense urban and the urban areas, is presented for theFTTC/VDSL case. It should be denoted that the run-ning costs include sales and marketing expenditures,employee costs, and operations and administration(OA) and maintenance-related costs. The investmentsare broken down into equipment- and infrastructure-related expenditures. The major portion (74%) of in-vestments in the case of FTTC is for equipment sincethere are no civil works due to the already-installedcopper lines in the last mile. In the case of FTTH theinfrastructure-related investments are 65% of the to-tal investment costs. In the FTTC case, the costs re-lated to the OA are 65% of all the running costs, fol-lowed by employee costs (15%) and maintenance(13%). The same analysis in the FTTH case reveals73% to be the OA costs, 10% for the employee costs,and 9% for maintenance costs.
It can be observed that for the urban areas, the in-vestments and the running costs are almost 50%higher than those in the dense urban areas, whereasthe revenues are only 5% higher (since the total sub-scribers are almost the same). Therefore, if the invest-ments in the urban areas could be delayed for a spe-cific period of time, then a clear benefit can result.This is actually the strategy of the main telecom op-erators in Europe, and the results presented hereafterwill justify, at least financially, this strategy.
Following the previous remark, the next step of theanalysis is to calculate the NPV for the urban areasindependently for both the scenarios as a function oftime. The project is broken into two phases: the first isthe upgrade to the dense urban areas at year T=0,and the second is the network upgrade at the urbanareas at a later year in the future. The calculationsare made for a delay of T=1−6 years in the deploy-ment, and the results are presented in Tables IV andV.
Fig. 6. Breakdown economics of the project for FTTC/VDSL.
By examining these results, it can be deduced thathe optimum strategy for the FTTC/VDSL scenario iso wait for 5 years and then decide to expand to therban areas. It can also be observed that the differ-nce per year after the fourth year is in the range ofM€, and thus even a 1 year delay in the installationsan give positive values. As far as the decrease inroject value after a 6 year delay, this is because tariffrosion cannot justify the benefits from lower prices inquipment costs and the associated running costs. Forhe FTTH case, the related values remain negativeven if the decision to expand is postponed for 6 years.ut it is obvious that the delay is in favor of the FTTHeployment case as the negative values are improved.his is of paramount importance in the case of stateid or subsidies from local governments, since any ob-igations applied in these cases should take into ac-ount the time of deployment.
. Sensitivity Analysis
Since the traditional approach presented is oftennable to capture the uncertainties in the telecomarket, sensitivity and risk analysis have to be incor-
orated for the improvement of the analysis subject todopted assumptions. Sensitivity analysis consists oftudying the impact of a single parameter without anyorrelation to other parameters. In the analysis thatollows, the parameters used for the sensitivity analy-is were the duct availability between the cabinet andhe customer (which is an additional parameter usedn the FTTH scenarios), the tariff, the penetration, the
TABLE IVNPV SPLIT CALCULATIONS FOR THE FTTC/VDSL CASE
UpgradeYear Phase 1 DU Phase 2 U Total
1 4.40 −4.08 0.322 −1.84 2.563 −0.09 4.324 1.06 5.465 1.61 6.016 1.48 5.88
TABLE VNPV SPLIT CALCULATIONS FOR THE FTTH CASE
UpgradeYear Phase 1 DU Phase 2 U Total
1 −4.38 −14.60 −18.982 −10.00 −14.383 −6.37 −10.744 −3.41 −7.795 −1.55 −5.936 −0.72 −5.10

C
fiwIfvebtotd
litsb
w
ttordsl
atlatbfr
Madswlrsact
Rokkas et al. VOL. 2, NO. 9 /SEPTEMBER 2010/J. OPT. COMMUN. NETW. 767
sales and marketing, as well as the network opera-tions. The effect each of these has on the total NPV ispresented in Fig. 7. The values of all these parametersare modified between 50% and 150% of the initialvalue.
The sensitivity analysis revealed that the most cru-cial parameter for both scenarios is the tariff level. Ifthe tariffs collected are 50% over the price initially as-sumed (Table II), the FTTH case turns positive. How-ever, it is not expected to make a major difference onthis parameter from the initial assumption due to theincreased competition in the broadband market. Net-work operation as a percentage of the total invest-ments is the second most critical parameter. For bothcases, penetration followed by duct availability andsales and marketing costs make a minor contribution.For the FTTC case, existing duct availability canmake the difference between negative and positivevalues and is also a crucial parameter for the FTTHscenario.
Fig. 7. Sensitivity results.
. Risk Analysis
As a next step in the analysis, a risk analysis is per-ormed over the same parameters used in the sensitiv-ty analysis except of the sales and marketing costs,hich have only a minor contribution as stated before.
n the risk analysis, a suitable probability densityunction is associated with each of these most criticalariables, in order to shape the risk associated withach parameter. In similar business cases usuallyeta and lognormal distributions are used to modelhe probability of each parameter to change valuesver a predefined space. In the analysis presented inhis paper, each of the variables was modeled by betaistribution.
The beta distribution is a special case of the Dirich-et continuous probability distribution that is definedn the space [0,1] and characterized by only two posi-ive parameters � (alpha) and � (beta), also named thehape parameters. The probability function is giveny
P�x� =�1 − x��−1xa−1
B��,��, �5�
here B is the beta function.
The beta distribution has a number of characteris-ics that make it useful for most studies: it is confinedo a specified interval; it can be bounded to positive-nly values, which is the case of the majority of pa-ameters used in this analysis; and it has sufficientegrees of freedom, since it can be symmetric and bellhaped or asymmetric and peaked according to the se-ection of the shape parameters, � and �.
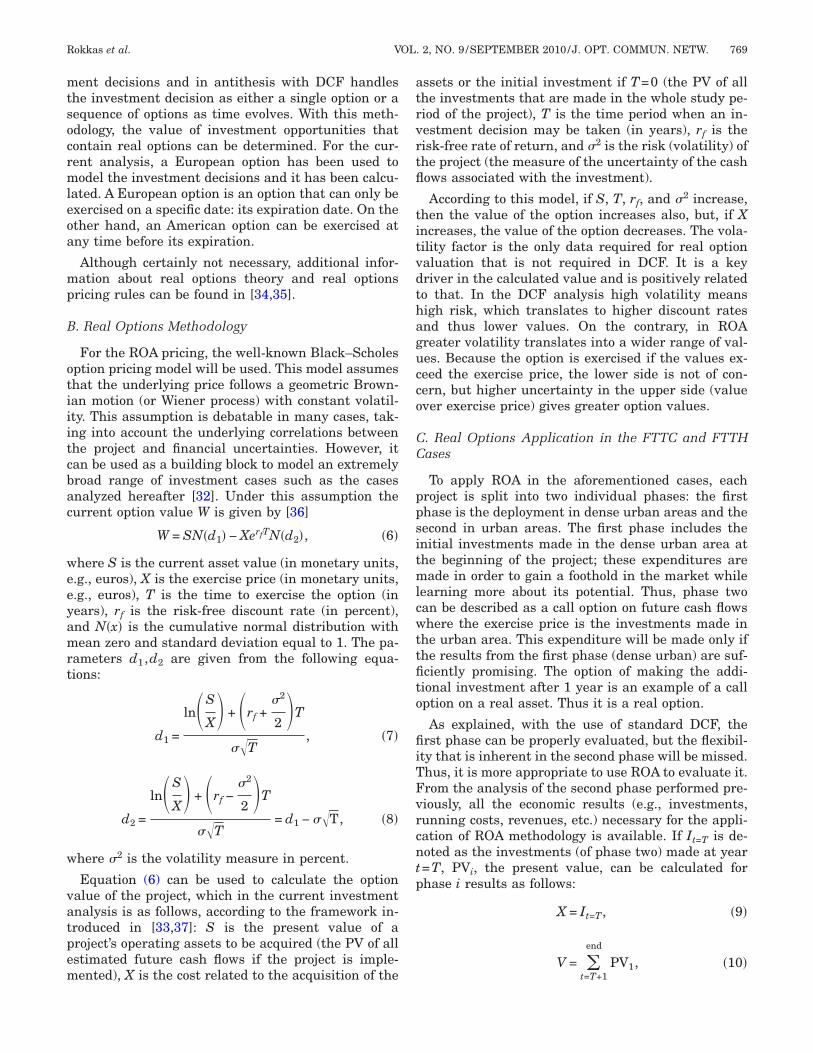
For each of the selected variables, namely, the ductvailability, the tariff, the network operations, andhe penetration, the default value, the upper andower limits, the optimistic and pessimistic values,nd the confidence interval were determined in ordero calculate the parameters � and � of the beta distri-ution as presented at Table VI. The shape of the betaunctions for the total penetration is presented as aepresentative in Fig. 8.
These distribution parameters are the input for aonte Carlo simulation with 1000 random samples,
nd the NPV is selected as the output variable in or-er to evaluate the financial risk of the project. Theimulation output values of NPV can be comparedith the unique deterministic value already calcu-
ated. Thus, extensive statistical information on theesult is generated, i.e., mean value, percentiles, andtandard deviation. In addition, the input variablesre ranked according to their significance to the out-omes, the measure can be either the contribution tohe variance of the output variables or the rank corre-
taicd
grtmffflaw
R
MSPPV
768 J. OPT. COMMUN. NETW./VOL. 2, NO. 9 /SEPTEMBER 2010 Rokkas et al.
lation. It is often observed that some variables havevery little significance after all and could therefore beremoved in future simulations. This will increase clar-ity as well as reduce the time it takes to complete asimulation.
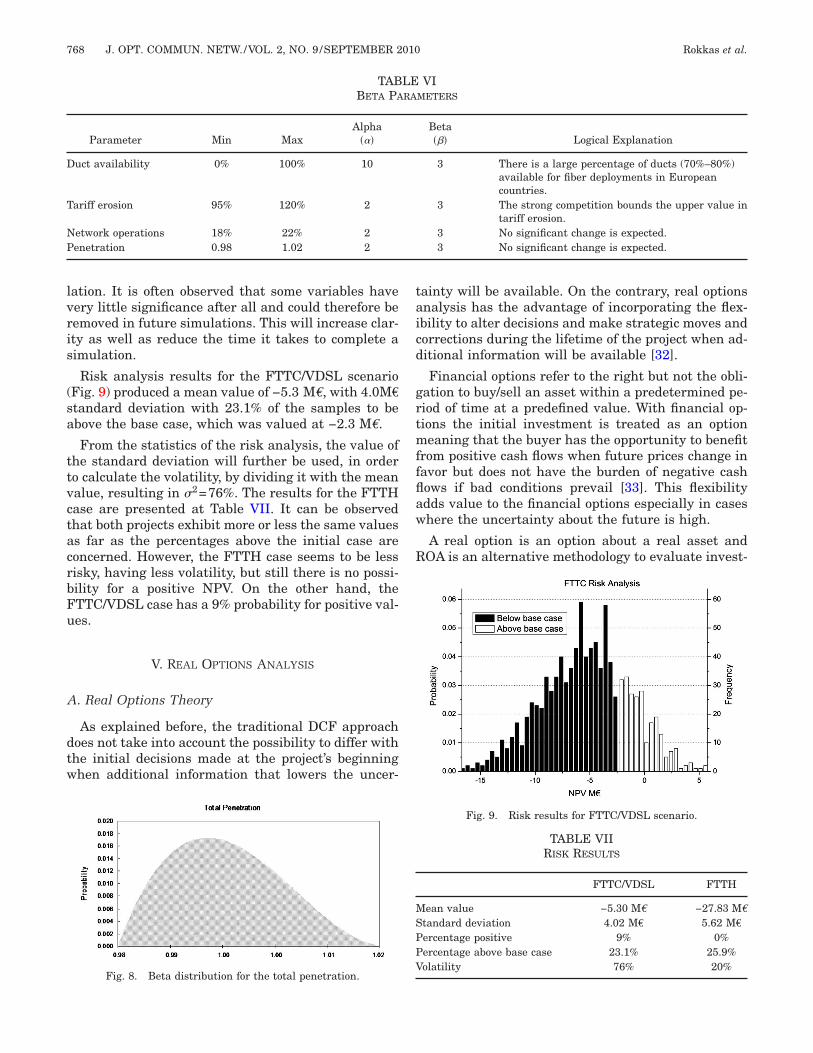
Risk analysis results for the FTTC/VDSL scenario(Fig. 9) produced a mean value of −5.3 M€, with 4.0M€
standard deviation with 23.1% of the samples to beabove the base case, which was valued at −2.3 M€.
From the statistics of the risk analysis, the value ofthe standard deviation will further be used, in orderto calculate the volatility, by dividing it with the meanvalue, resulting in �2=76%. The results for the FTTHcase are presented at Table VII. It can be observedthat both projects exhibit more or less the same valuesas far as the percentages above the initial case areconcerned. However, the FTTH case seems to be lessrisky, having less volatility, but still there is no possi-bility for a positive NPV. On the other hand, theFTTC/VDSL case has a 9% probability for positive val-ues.
V. REAL OPTIONS ANALYSIS
A. Real Options Theory
As explained before, the traditional DCF approachdoes not take into account the possibility to differ withthe initial decisions made at the project’s beginningwhen additional information that lowers the uncer-
TABBETA PA
Parameter Min MaxAlpha
���
Duct availability 0% 100% 10
Tariff erosion 95% 120% 2
Network operations 18% 22% 2Penetration 0.98 1.02 2
Fig. 8. Beta distribution for the total penetration.
ainty will be available. On the contrary, real optionsnalysis has the advantage of incorporating the flex-bility to alter decisions and make strategic moves andorrections during the lifetime of the project when ad-itional information will be available [32].
Financial options refer to the right but not the obli-ation to buy/sell an asset within a predetermined pe-iod of time at a predefined value. With financial op-ions the initial investment is treated as an optioneaning that the buyer has the opportunity to benefit
rom positive cash flows when future prices change inavor but does not have the burden of negative cashows if bad conditions prevail [33]. This flexibilitydds value to the financial options especially in caseshere the uncertainty about the future is high.
A real option is an option about a real asset andOA is an alternative methodology to evaluate invest-
VIMETERS
Beta��� Logical Explanation
3 There is a large percentage of ducts (70%–80%)available for fiber deployments in Europeancountries.
3 The strong competition bounds the upper value intariff erosion.
3 No significant change is expected.3 No significant change is expected.
Fig. 9. Risk results for FTTC/VDSL scenario.
TABLE VIIRISK RESULTS
FTTC/VDSL FTTH
ean value −5.30 M€ −27.83 M€
tandard deviation 4.02 M€ 5.62 M€
ercentage positive 9% 0%ercentage above base case 23.1% 25.9%olatility 76% 20%
LERA
atrvrtfl
titvdthagucco
CC
ppsitmlcwttfito
fiiTFvrcntp
Rokkas et al. VOL. 2, NO. 9 /SEPTEMBER 2010/J. OPT. COMMUN. NETW. 769
ment decisions and in antithesis with DCF handlesthe investment decision as either a single option or asequence of options as time evolves. With this meth-odology, the value of investment opportunities thatcontain real options can be determined. For the cur-rent analysis, a European option has been used tomodel the investment decisions and it has been calcu-lated. A European option is an option that can only beexercised on a specific date: its expiration date. On theother hand, an American option can be exercised atany time before its expiration.
Although certainly not necessary, additional infor-mation about real options theory and real optionspricing rules can be found in [34,35].
B. Real Options Methodology
For the ROA pricing, the well-known Black–Scholesoption pricing model will be used. This model assumesthat the underlying price follows a geometric Brown-ian motion (or Wiener process) with constant volatil-ity. This assumption is debatable in many cases, tak-ing into account the underlying correlations betweenthe project and financial uncertainties. However, itcan be used as a building block to model an extremelybroad range of investment cases such as the casesanalyzed hereafter [32]. Under this assumption thecurrent option value W is given by [36]
W = SN�d1� − XerfTN�d2�, �6�
where S is the current asset value (in monetary units,e.g., euros), X is the exercise price (in monetary units,e.g., euros), T is the time to exercise the option (inyears), rf is the risk-free discount rate (in percent),and N�x� is the cumulative normal distribution withmean zero and standard deviation equal to 1. The pa-rameters d1 ,d2 are given from the following equa-tions:
d1 =
ln�S
X� + �rf +�2
2 �T
��T, �7�
d2 =
ln�S
X� + �rf −�2
2 �T
��T= d1 − ��T, �8�
where �2 is the volatility measure in percent.
Equation (6) can be used to calculate the optionvalue of the project, which in the current investmentanalysis is as follows, according to the framework in-troduced in [33,37]: S is the present value of aproject’s operating assets to be acquired (the PV of allestimated future cash flows if the project is imple-mented), X is the cost related to the acquisition of the
ssets or the initial investment if T=0 (the PV of allhe investments that are made in the whole study pe-iod of the project), T is the time period when an in-estment decision may be taken (in years), rf is theisk-free rate of return, and �2 is the risk (volatility) ofhe project (the measure of the uncertainty of the cashows associated with the investment).
According to this model, if S, T, rf, and �2 increase,hen the value of the option increases also, but, if Xncreases, the value of the option decreases. The vola-ility factor is the only data required for real optionaluation that is not required in DCF. It is a keyriver in the calculated value and is positively relatedo that. In the DCF analysis high volatility meansigh risk, which translates to higher discount ratesnd thus lower values. On the contrary, in ROAreater volatility translates into a wider range of val-es. Because the option is exercised if the values ex-eed the exercise price, the lower side is not of con-ern, but higher uncertainty in the upper side (valuever exercise price) gives greater option values.
. Real Options Application in the FTTC and FTTHases
To apply ROA in the aforementioned cases, eachroject is split into two individual phases: the firsthase is the deployment in dense urban areas and theecond in urban areas. The first phase includes thenitial investments made in the dense urban area athe beginning of the project; these expenditures areade in order to gain a foothold in the market while
earning more about its potential. Thus, phase twoan be described as a call option on future cash flowshere the exercise price is the investments made in
he urban area. This expenditure will be made only ifhe results from the first phase (dense urban) are suf-ciently promising. The option of making the addi-ional investment after 1 year is an example of a callption on a real asset. Thus it is a real option.
As explained, with the use of standard DCF, therst phase can be properly evaluated, but the flexibil-
ty that is inherent in the second phase will be missed.hus, it is more appropriate to use ROA to evaluate it.rom the analysis of the second phase performed pre-iously, all the economic results (e.g., investments,unning costs, revenues, etc.) necessary for the appli-ation of ROA methodology is available. If It=T is de-oted as the investments (of phase two) made at year=T, PVi, the present value, can be calculated forhase i results as follows:
X = It=T, �9�
V = �t=T+1
end
PV1, �10�
Voiper(a�
attbrTtybT
cRtsdTrban
770 J. OPT. COMMUN. NETW./VOL. 2, NO. 9 /SEPTEMBER 2010 Rokkas et al.
S = �t=T+1
end
PV2, �11�
NPVphase 1 = �t=0
T
PV1. �12�
For the rest of the calculation, the modified Black–Scholes formula is used as follows:
NPVRO = e−rfT�SN�d1�erfT − XN�d2�� + V�1 − N�d2��,
�13�
d1 =
ln� S
X�� + �rf +
�2
2 �T
��T, �14�
d2 =
ln� S
X�� + �rf −
�2
2 �T
��T, �15�
X� = X + �1 + rd�TV. �16�
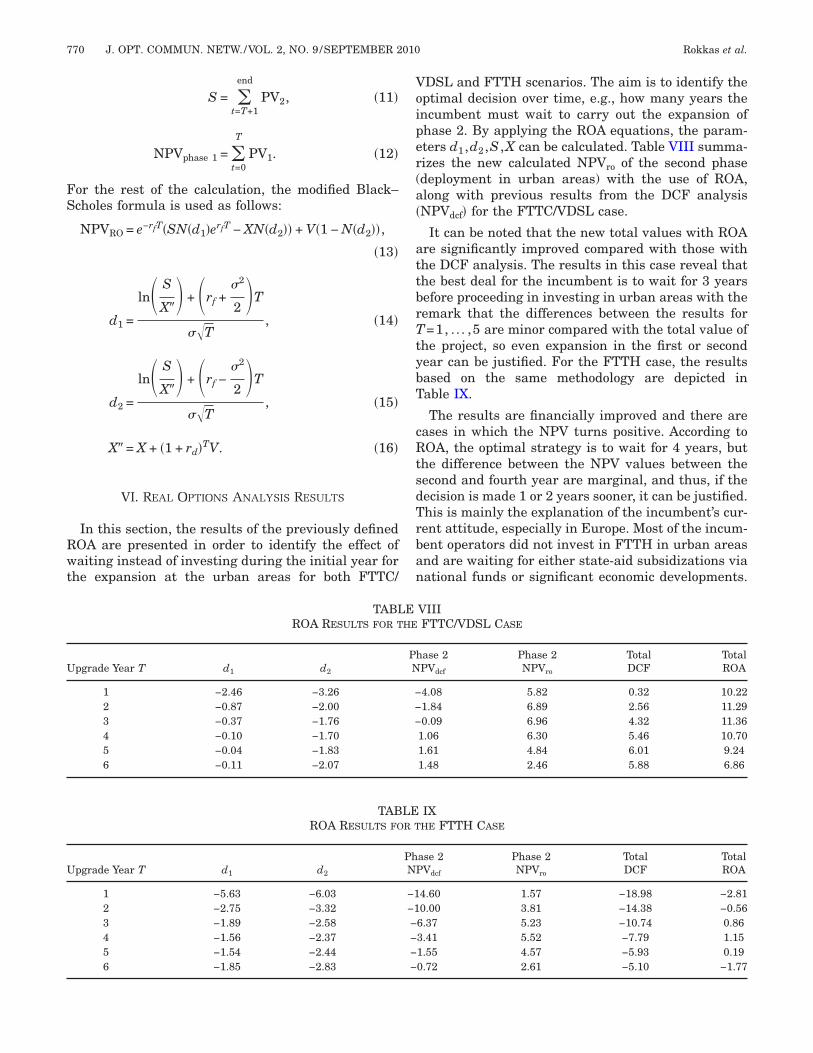
VI. REAL OPTIONS ANALYSIS RESULTS
In this section, the results of the previously definedROA are presented in order to identify the effect ofwaiting instead of investing during the initial year forthe expansion at the urban areas for both FTTC/
TABLROA RESULTS FOR T
Upgrade Year T d1 d2
1 −2.46 −3.262 −0.87 −2.003 −0.37 −1.764 −0.10 −1.705 −0.04 −1.836 −0.11 −2.07
TABROA RESULTS FO
Upgrade Year T d1 d2
1 −5.63 −6.032 −2.75 −3.323 −1.89 −2.584 −1.56 −2.375 −1.54 −2.446 −1.85 −2.83
DSL and FTTH scenarios. The aim is to identify theptimal decision over time, e.g., how many years thencumbent must wait to carry out the expansion ofhase 2. By applying the ROA equations, the param-ters d1 ,d2 ,S ,X can be calculated. Table VIII summa-izes the new calculated NPVro of the second phasedeployment in urban areas) with the use of ROA,long with previous results from the DCF analysisNPVdcf� for the FTTC/VDSL case.
It can be noted that the new total values with ROAre significantly improved compared with those withhe DCF analysis. The results in this case reveal thathe best deal for the incumbent is to wait for 3 yearsefore proceeding in investing in urban areas with theemark that the differences between the results for=1, . . . ,5 are minor compared with the total value of
he project, so even expansion in the first or secondear can be justified. For the FTTH case, the resultsased on the same methodology are depicted inable IX.
The results are financially improved and there areases in which the NPV turns positive. According toOA, the optimal strategy is to wait for 4 years, but
he difference between the NPV values between theecond and fourth year are marginal, and thus, if theecision is made 1 or 2 years sooner, it can be justified.his is mainly the explanation of the incumbent’s cur-ent attitude, especially in Europe. Most of the incum-ent operators did not invest in FTTH in urban areasnd are waiting for either state-aid subsidizations viaational funds or significant economic developments.
VIIIFTTC/VDSL CASE
ase 2PVdcf
Phase 2NPVro
TotalDCF
TotalROA
4.08 5.82 0.32 10.221.84 6.89 2.56 11.290.09 6.96 4.32 11.36
1.06 6.30 5.46 10.701.61 4.84 6.01 9.241.48 2.46 5.88 6.86
IXHE FTTH CASE
ase 2Vdcf
Phase 2NPVro
TotalDCF
TotalROA
4.60 1.57 −18.98 −2.810.00 3.81 −14.38 −0.566.37 5.23 −10.74 0.863.41 5.52 −7.79 1.151.55 4.57 −5.93 0.190.72 2.61 −5.10 −1.77
EHE
PhN
−−−
LER T
PhNP
−1−1−−−−

spFtF
Fneutncso
cswtcIeai
TtcTrpEfu“w
Rokkas et al. VOL. 2, NO. 9 /SEPTEMBER 2010/J. OPT. COMMUN. NETW. 771
For both cases the incumbent before making the deci-sion must also take into account the presence of thecompetitors in these areas and can further benefitfrom an earlier investment by taking over the poten-tial market share and have accessional economical ad-vantages that have not been captured in the analysis.All the results for both DCF and ROA are valid if nocompetitor enters the market during the study period.But it was learned from similar cases that the incum-bent is the one that controls the situation and usuallymakes the first move in such large-scale investments.
In Fig. 10, the NPVs for both scenarios for all thepossible years of expansion with both the DCF andROA methods are presented. It can be observed thatthe difference in the calculations are significant forthe first years and then both methods seem to con-verge as the years pass, which can be expected as anyoption value decreases as the time reaches the expira-tion date. However, an important finding of the ROAis that in the case of investment subsidization, the op-tion value to expand in a later phase can significantlyimprove the financials of the business cases, and thisadditional value should be taken into account. As faras any subsidization from national or local govern-ments is related to geographic coverage, the associ-ated flexibility valuated through ROA should be takeninto account. In addition, risk-sharing schemes can bebased on such a ROA valuation.
VII. CONCLUSIONS
In this paper, the alternatives of FTTC/VDSL andFTTH roll-outs in dense urban and urban areas froman incumbent’s point of view have been investigated.The analyzed business cases reflect the current stanceof incumbent telecom operators regarding their deci-sion to upgrade their infrastructure toward FTTH ar-chitecture.
Both classical DCF and ROA have been used toevaluate the options that the incumbent has. ROA
Fig. 10. ROA and DCF analysis results.
eems more suitable for capturing these effects com-ared with DCF analysis. The results reveal that forTTC the expansion can be made even 1 year after
he deployment in dense urban areas, whereas in theTTH case it can be made after 2 years.
Since the costs associated with the deployment ofTTH are quite large and the technological and busi-ess risks can lead to market failures, the techno-conomic analysis of these business cases can provideseful insights about the economic figures and the op-imum strategies. Especially as the technology alter-atives are always improved, this kind of study isritical for decision makers, and the analysis pre-ented offers a complete framework for the evaluationf these technology and strategy options.
In conclusion, the techno-economic challenges of theurrent and next generations of FTTx networkshould be addressed and several issues associatedith the evolution of existing copper-based infrastruc-
ures should be analyzed taking into account techni-al, economic, regulatory, and environmental aspects.n light of 10G operations, the analysis should also bexpanded from the access network back to the feedernd distribution networks that will be heavily utilizedn the case of FTTC and FTTH deployments.
ACKNOWLEDGMENTS
he authors thank the two anonymous reviewers forhe fruitful comments and suggestions that signifi-antly improved the presentation and the conclusions.he authors also acknowledge the long-term collabo-ation with their colleagues in the CELTIC-ECOSYSroject. This work was also partially supported by theuropean Social Fund, the Greek General Secretariat
or Research and Technology, and the private sector,nder Measure 8.3 of the Operational ProgrammeCompetitiveness,” 3rd Community Support Frame-ork.
REFERENCES
[1] P. E. Green, “Fiber to the home: the next big broadband thing,”IEEE Commun. Mag., vol. 42, no. 9, pp. 100–106, Sept. 2004.
[2] N. J. Frigo, P. P. Iannone, and K. C. Reichmann, “A view of fi-ber to the home economics,” IEEE Commun. Mag., vol. 42, no.8, pp. S16–S23, Aug. 2004.
[3] T. Monath, N. K. Elnegaard, P. Cadro, D. Katsianis, and D.Varoutas, “Economics of fixed broadband access network strat-egies,” IEEE Commun. Mag., vol. 41, no. 9, pp. 132–139, Sept.2003.
[4] Analysys Mason, “Final report for the broadband stakeholdersgroup: the costs of deploying fibre-based next-generationbroadband infrastructure,” 2008.
[5] J. Salanave and P. Kalmus, “Telecoms in Europe 2015 (final re-port),” IDATE, 2007.
[6] R. Van Caenegem, J. A. Martinez, D. Colle, M. Pickavet, P. De-meester, F. Ramos, and J. Marti, “From IP over WDM to all-optical packet switching: economical view,” J. Lightwave Tech-nol., vol. 24, no. 4, pp. 1638–1645, Apr. 2006.
772 J. OPT. COMMUN. NETW./VOL. 2, NO. 9 /SEPTEMBER 2010 Rokkas et al.
[7] E. Le Rouzic and S. Gosselin, “160-Gb/s optical networking: aprospective techno-economical analysis,” J. Lightwave Tech-nol., vol. 23, no. 10, pp. 3024–3033, Oct. 2005.
[8] K. A. Janjua and S. A. Khan, “A comparative economic analysisof different FTTH architectures,” in Int. Conf. on Wireless Com-munications, Networking and Mobile Computing, 2007, pp.4979–4982.
[9] K. W. Marcus and Z. Francis, “The economics of fiber to thehome revisited,” Bell Labs Tech. J., vol. 8, no. 1, pp. 181–206,2003.
[10] K. Casier, B. Lannoo, J. Van Ooteghem, S. Verbrugge, D. Colle,M. Pickavet, and P. Demeester, “Game-theoretic optimizationof a fiber-to-the-home municipality network rollout,” J. Opt.Commun. Netw., vol. 1, no. 1, pp. 30–42, June 2009.
[11] C. Bouras, A. Gkamas, J. Papagiannopoulos, G. Theophilopou-los, and T. Tsiatsos, “Broadband municipal optical networks inGreece: a suitable business model,” Telematics and Informat-ics, vol. 26, no. 4, pp. 391–409, Nov. 2009.
[12] S. Verbrugge, R. Meersman, K. Casier, D. Colle, J. Vanhaver-beke, J. Van Ooteghem, and P. Demeester, “Issues in techno-economic evaluation of VDSL/FTTH access networks roll-out(invited paper),” in 12th European Conf. on Networks and Op-tical Communications, Stockholm, Sweden, 2007, pp. 208–215.
[13] K. Casier, S. Verbrugge, R. Meersman, D. Colle, M. Pickavet,and P. Demeester, “Techno-economic evaluations of FTTH roll-out scenarios (invited paper),” in 13th European Conf. on Net-works and Optical Communications, Krems, Austria, 2008, pp.113–120.
[14] J. Li and G. Shen, “Cost minimization planning for greenfieldpassive optical networks,” J. Opt. Commun. Netw., vol. 1, no. 1,pp. 17–29, June 2009.
[15] M. Okada, J. Kani, T. Watanabe, and N. Yoshimoto, “An opti-mal investment strategy for tunable, pluggable, and tunablepluggable optical transceivers in static DWDM networks,” J.Opt. Commun. Netw., vol. 1, no. 1, pp. 3–16, June 2009.
[16] G. B. Amendola and L. M. Pupillo, “The economics of next gen-eration access networks and regulatory governance: towardsgeographic patterns of regulation,” Commun. Strategies, vol.69, p. 85, Mar. 2008.
[17] IST-TONIC, 2000–2004, “Techno-economics of IP optimisednetworks and services,” European Union, EU IST, IST-2000-27172. Available: http://www-nrc-nokia.com/tonic/.
[18] CELTIC-ECOSYS, 2002–2006, “techno-ECOnomics of inte-grated communication SYStems and services,” CELTIC. Avail-able: http://www.celtic-ecosys.org/.
[19] D. Katsianis, I. Welling, M. Ylonen, D. Varoutas, T. Sphicopou-los, N. K. Elnegaard, B. T. Olsen, and L. Budry, “The financialperspective of the mobile networks in Europe,” IEEE Pers.Commun., vol. 8, no. 6, pp. 58–64, Dec. 2001.
[20] D. Varoutas, D. Katsianis, T. Sphicopoulos, F. Loizillon, K. O.Kalhagen, K. Stordahl, H. Welling, and J. Harno, “Business op-portunities through UMTS-WLAN networks,” Ann. Telecom-mun., vol. 58, no. 3–4, pp. 553–575, Mar.–Apr. 2003.
[21] B. T. Olsen, D. Katsianis, D. Varoutas, K. Stordahl, J. Harno,
N. K. Elnegaard, I. Welling, F. Loizillon, T. Monath, and P.Cadro, “Technoeconomic evaluation of the major telecommuni-cation investment options for European players,” IEEE Net-work, vol. 20, no. 4, pp. 6–15, July 2006.
[22] B. T. Olsen, A. Zaganiaris, K. Stordahl, L. A. Ims, D. Myhre, T.Overli, M. Tahkokorpi, I. Welling, M. Drieskens, J. Kraushaar,J. Mononen, M. Lahteenoja, S. Markatos, M. De Bortoli, U.Ferrero, M. Ravera, S. Balzaretti, F. Fleuren, N. Gieschen, M.De Oliveira Duarte, and E. de Castro, “Techno-economic evalu-ation of narrowband and broadband access network alterna-tives and evolution scenario assessment,” IEEE J. Sel. AreasCommun., vol. 14, no. 6, pp. 1184–1203, Aug. 1996.
[23] T. Rokkas, T. Kamalakis, D. Katsianis, D. Varoutas, and T.Sphicopoulos, “Business prospects of wide-scale deployment offree space optical technology as a last-mile solution: a techno-economic evaluation,” J. Opt. Netw., vol. 6, no. 7, pp. 860–870,July 2007.
[24] L. Ims, “Broadband access networks introduction strategiesand techno-economic evaluation,” in Telecommunication Tech-nology and Applications, New York: Chapman & Hall, 1998.
[25] K. Stordahl and K. O. Kalhagen, “Broadband forecast model-ling. Evaluation of methodology and results,” in Int. Symp. onForecasting, Merida, Mexico, 2003.
[26] C. Michalakelis, D. Varoutas, and T. Sphicopoulos, “Diffusionmodels of mobile telephony in Greece,” Telecommun. Policy,vol. 32, no. 3–4, pp. 234–245, Apr.–May. 2008.
[27] P. W. Shumate, “Fiber-to-the-home: 1977–2007,” J. LightwaveTechnol., vol. 26, no. 9–12, pp. 1093–1103, May–June 2008.
[28] R. Fildes and V. Kumar, “Telecommunications demandforecasting—a review,” Int. J. Forecast., vol. 18, no. 4, pp. 489–522, Oct.–Dec. 2002.
[29] L. P. Rai, “Appropriate models for technology substitution,” J.Sci. Ind. Res. India, vol. 58, no. 1, pp. 14–18, Jan. 1999.
[30] V. Kumar and T. V. Krishnan, “Multinational diffusion models:an alternative framework,” Mark. Sci., vol. 21, no. 3, pp. 318–330, July 2002.
[31] International Telecommunications Union, “Adjusting forecast-ing methods to the needs of the telecommunication sector,” inITU Experts Dialogue, Geneva, 2004.
[32] A. K. Dixit and R. S. Pindyck, Investment Under Uncertainty.Princeton, N.J.: Princeton U. Press, 1994.
[33] T. Luehrman, “Investment opportunities as real options: get-ting started on the numbers,” Harvard Bus. Rev., vol. 76, pp.51–66, 1998.
[34] H. T. J. Smit and L. Trigeorgis, Strategic Investment: Real Op-tions and Games. Princeton, N.J.: Princeton U. Press, 2004.
[35] L. Trigeorgis, Real Options: Managerial Flexibility and Strat-egy in Resource Allocation. Cambridge, Mass.: MIT Press,1996.
[36] F. Black and M. Scholes, “The pricing of options and corporateliabilities,” J. Polit. Econ., vol. 81, no. 3, pp. 637–659, 1973.
[37] K. O. Kalhagen and N. K. Elnegaard, “Assessing broadband in-vestment risk through option theory,” Telektronikk, vol. 2–3,
pp. 51–62, 2002.