Techno economic evaluation of anchor plates in prestressed ...
Upload
trinhhuongCategory
view
219download
1
SCHOOL OF CHEMICAL ENGINEERING
TECHNO‐ECONOMIC EVALUATION OF
COMPRESSED AIR ENERGY STORAGE
IN UNCONVENTIONAL APPLICATIONS Thomas B. McConnaughy, Conor Young and Eric McFarland
ABSTRACT
Compressed air energy storage systems consist of an electrically driven air
compressor, pressure vessels for storage of high pressure air, and an expander
motor coupled to a generator to produce electricity from the compressed air
supply. Unconventional configurations of CAES were analysed for compression in
underutilised water pipelines or tanks, and the system costs were compared to
conventional batteries and hydroelectric alternatives. For arbitrage of peak and off‐
peak electricity pricing, use of water pipelines for gas storage will only justify the
capital expense if the average electricity price difference exceeds $800/MWh.
Water pipeline storage may prove feasible in locations where PHS is not possible
and if price spreads increase significantly. In data centre UPS applications, CAES is
shown to be competitive with battery systems. Household CAES integrated with PV
systems are economically favourable to batteries, however, neither have
favourable overall economics. Batteries are superior to CAES for peak shaving
applications and may be profitable for certain power consumption profiles.
INTRODUCTION
Electrical energy storage encompasses a broad range of
technologies and storage time scales spanning seconds
to months (capacitors to hydroelectric dams). The
different technologies often have very different
economic and reliability characteristics.
Intermediate storage times, hours to days, have received
recent attention due to increased interest in
intermittent, renewable energy sources such as wind
and solar, for which energy storage can increase supply
reliability. Additionally, storage of stranded or excess
electricity generation, back‐up power systems and peak
demand reduction are other applications that can
benefit from intermediate storage times. At present
electrical energy storage technologies deployed
commercially at significant scales are pumped
hydroelectric storage (PHS), batteries, and CAES. Several
technologies are trying to establish their
competitiveness including flow batteries,
supercapacitors, flywheels, and superconducting
magnets1.
Electricity generation and storage using hydroelectric
systems is an established technology with generally the
lowest energy storage costs2. However, hydroelectric is
limited in capacity due to geographical and
environmental constraints1. Batteries are ubiquitous in
consumer product applications, however, their use in
large scale energy storage applications is limited due to
their high unit cost, limited cycle lives, and often their
use of hazardous materials3.
CAES has been proposed for many different energy
storage applications, however, identifying an
economically competitive application remains for
widespread adoption. In this report four scenarios are
investigated to assess the market competitiveness of
CAES.
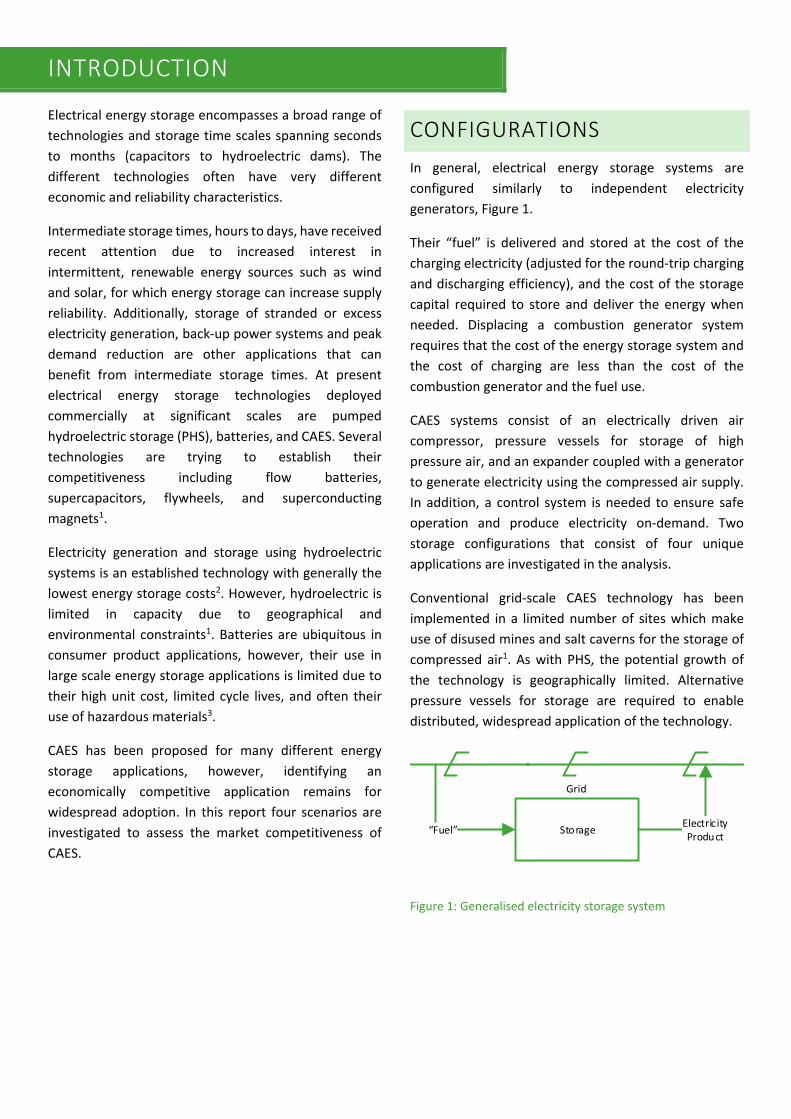
CONFIGURATIONS
In general, electrical energy storage systems are
configured similarly to independent electricity
generators, Figure 1.
Their “fuel” is delivered and stored at the cost of the
charging electricity (adjusted for the round‐trip charging
and discharging efficiency), and the cost of the storage
capital required to store and deliver the energy when
needed. Displacing a combustion generator system
requires that the cost of the energy storage system and
the cost of charging are less than the cost of the
combustion generator and the fuel use.
CAES systems consist of an electrically driven air
compressor, pressure vessels for storage of high
pressure air, and an expander coupled with a generator
to generate electricity using the compressed air supply.
In addition, a control system is needed to ensure safe
operation and produce electricity on‐demand. Two
storage configurations that consist of four unique
applications are investigated in the analysis.
Conventional grid‐scale CAES technology has been
implemented in a limited number of sites which make
use of disused mines and salt caverns for the storage of
compressed air1. As with PHS, the potential growth of
the technology is geographically limited. Alternative
pressure vessels for storage are required to enable
distributed, widespread application of the technology.
Grid
Storage“Fuel”Electricity Product
Figure 1: Generalised electricity storage system

UNCONVENTIONAL CAES
CONFIGURATIONS
WATER PIPELINES
Empty or partially filled water distribution pipelines
could theoretically be utilised as CAES systems for grid‐
scale applications, similar to natural gas pipeline energy
recovery. Abandoned pipes can be pressurised with air
during off‐peak hours and expanded during peak hours
as a form of arbitrage. Underwater CAES (UWCAES) is a
technology which makes use of the hydrostatic pressure
of water (i.e. 1 bar per 10 m depth4) to store pressurised
air. The high hydrostatic pressure allows for a flexible
bladder to be used rather than an expensive, fixed
volume pressure vessel. Partially filled pipes can utilise a
bladder, in order to control the distribution of air within
the pipe, and the nominal water pressure for expansion.
This has the added benefit of a constant discharge
pressure, similar to underwater UWCAES5, which
simplifies the selection process of the expander and can
increase the system efficiency. The main advantage of
using pipelines is that the storage is likely to be closer to
the end user than conventional underwater storage; the
challenges and limitations of repurposing existing
infrastructure must also be considered. Figure 2 shows
the water pipeline configuration.
Grid
Compressor
Turbine
Storage
Bladder
Figure 2: Water pipeline CAES configuration
Here, we perform a case study on a water pipeline in
Brisbane, Australia. The Western Corridor Recycled
Water Pipeline is 200 km of pipeline which was designed
to transport water from various water recycling plants to
Wivenhoe dam and two power stations in the area6.
Arbitrage can be leveraged to generate daily revenue by
storing energy at off‐peak prices and releasing it during
peak demand. The difference between peak and off‐
peak electricity cost represents the profit margin of the
system and therefore is the key determining factor in the
viability of the application.
HIGH PRESSURE TANK STORAGE
Compressed air is used in a variety of commercial
applications and high pressure gas cylinders used as
storage vessels are common. We examined whether
these configurations would be appropriate for dedicated
electrical energy storage. This configuration is depicted
in Figure 3. There is flexibility with the size and pressure
of the tank, which can be customized to the application.
Grid
Compressor
Turbine
Storage
Figure 3: High pressure tank CAES configuration
Applications: The following applications share a
common mechanical model, however have different
value propositions due to energy delivery requirements.
The frequency of operation of the devices varies from
daily to annually, whilst power output varies from tens
to thousands of kilowatts.
a) Uninterruptable Power Supply (UPS)
UPS systems are used to avoid abrupt losses of power to
critical equipment which can result in significant loss of
revenue. Lead acid battery UPS systems are the
dominant technology for data centre backup power
supply, however, of those that experienced unplanned
power outages, battery failures were the leading root
cause7. The increased reliability of CAES systems, due to
their mechanical rather than electrochemical operation8,
holds promise to reduce the frequency of power outages
in UPS applications.
From a techno‐economic perspective, there is
substantial savings potential in mitigating power outages
due to the high costs associated with blackouts. Here,
the business case for a CAES UPS system is explored as
well as a comparison to existing lead acid battery UPS
systems.
Water Pipeline

b) Household & Photovoltaic
Recently, flexible pricing schemes have been introduced
by electricity providers to reduce the difference between
peak and off‐peak energy demands. Energy costs shift
depending on the demand associated with the period of
the day, known as peak (morning and evening), shoulder
(afternoon), and off‐peak (night). Passing on the
difference in cost between producing energy at peak and
shoulder or off‐peak times to the consumer incentivises
a reduction in peak power consumption9 and thus the
need for inefficient, expensive, and high carbon intensity
peaking power plants10. Coupling CAES and
photovoltaics (PV) can provide stored solar energy for
on‐demand use during peak hours, while grid electricity
can be used exclusively during off‐peak and shoulder
hours when electricity is cheaper.
Households in Queensland either pay a flexible or
variable rate for their electricity usage11. In order to
utilise flexible pricing economically, the price difference
between the standard rate and shoulder or off‐peak,
depending on time of use, must be high enough such
that the cost to generate and recover the electricity is
less than the standard electricity rate. More simply, the
annual savings, or ‘profits’, can be seen as the money
saved each year on the household electricity bill.
c) Peak Shaving
In many electricity markets, customers are charged a fee
based on their highest power consumption during the
billing period, known as a ‘demand charge’. The
infrastructure provider’s cost are related to their
capacity to provide peak power which can be greater
than the costs for generating the electricity12. The total
electricity bill for customers can be a combination of
demand charges and time‐of‐use adjusted total energy
consumption. Customers whose power demand profile
features brief power consumption spikes have
significant potential for savings if those demand spikes
can be removed through energy storage. The proposed
energy storage system is charged at times of reduced
power consumption and low cost energy for use at later
times to reduce the peak power required from the
supplier.
ANALYSIS
THERMODYNAMICS
The CAES system is charged by compression of air and
discharged by expansion of the air in a motor to drive a
generator producing electricity. Each step has associated
energy losses which determine the overall round trip
efficiency.
An estimate of the system efficiency can be determined
based on thermodynamic considerations of the
compression, storage, and expansion operations. Using
Equations 1 and 2, the energy required for compression
is calculated assuming ideal gasses and adiabatic
operation, where η is the expansion efficiency or inverse
compression efficiency (ηe = ηc = 0.8)13, γ is the heat
capacity ratio, (γair = 1.4), 1 and 2 refer to the inlet and
outlet of compressor respectively, and C is constant
between compressed and expanded states. This is
opposed to modelling isothermally, which is currently
unrealistic given current heating/cooling technologies.
In reality, the cycle will be neither adiabatic nor
isothermal. Equation 1 can be modified to calculate the
power required of compression or expansion given the
volumetric flow rate, q [m3/s] (Equation 3). The
compressed air storage volume is dictated by the system
work‐output requirement and expansion inefficiency
(Equation 1).
Equation 1: Adiabatic compression/expansion work
11
Equation 2: Adiabatic ideal gas relationship
Equation 3: Power
11

TECHNO‐ECONOMIC MODEL
An analysis of the costs was performed on several of the
system configurations and applications described above.
Table 1 lists the assumptions that were consistently used
for multiple application examples; any inconsistencies
are addressed in scenario specific tables. The
compressor, expander, and storage capital including
efficiency values13 were determined based on available
industrial information. The installed cost of the
equipment was then determined by using an installation
factor14. A storage pressure of 300 bar was used,
assuming multi‐stage expansion to ambient pressure.
The CAES system is expected to have a lifespan of 30
years2, however, a period of 10 years is used to assess
investment potential. Operating expenses (OPEX) are
the sum of the fixed and variable costs. Fixed costs are
assumed to be 5% of the discounted annual capital
expenditure15 (CAPEX) while the variable costs include
expenses such as charging the system. The discounted
annual CAPEX can be found by dividing the total CAPEX
by the total discount factor (TDF [years], Equation 4),
where i is the discount rate, n is the current year, and N
is the plant life.
Table 1: Model assumptions
Parameter Value Unit
Expansion Efficiency 80 %
Compression Efficiency 80 %
Tank Storage Pressure 300 bar
Tank Storage Capital 950 $/kWh
Installation Factor 1.25 n/a
CAES Lifespan 30 years
Investment Period 10 years
Discount Rate 10 %
Fixed Costs 5% of annual CAPEX $/year
TDF 9.43 years
Equation 4: Total discount factor
1
A key metric to compare and value CAES and other
storage technologies is the cost, per kilowatt hour, of
energy recovered over the lifetime of the system
(CoERlife [$/kWhlife], Equation 5), which is a function of
CAPEX and OPEX over the device lifetime, and the total
energy delivered during that time. This value provides a
basis for comparison against existing storage
technologies, such as batteries, that have lower capital
costs, but shorter lifetimes. This comparison provides
insight on the economic feasibility of CAES for different
applications.
Equation 5: Cost of energy recovered over the lifetime of the
system
$ $
$
The annualised costs of any electrical energy storage and
generation system used for a cycle duration or period,
tcycle [hours/cycle], can be placed in the same framework.
Using the unit capital cost based on delivered electric
power [$/kWrated], the capital cost to store the energy
[$/kWhrated], and the operating costs to charge the
system [$/kWh], the annual cost of power (ACoP
[$/kW‐y]), neglecting fixed costs, for a unit lifetime
approximately equal to the TDF, is given by:
Equation 6: Annual power cost of competing technologies
$
)
Where η is the round trip efficiency of the system and
fcycle is the cycle frequency [cycles/year]. Equation 6 has
the advantage of having two terms that include usage
dependence and independence. Here we use this basis
to compare CAES to competing technologies.
Performance metrics of competing technologies in
literature are shown in Table 2. Energy storage systems
have time‐dependent as well as cycle‐dependent failure
modes, measured in years and cycles respectively. The
ultimate failure mode will be whichever limit is reached
first, depending on scenario. CAPEX takes into account
the discounted future value of replacement batteries.
Internal rate of return (IRR) is calculated for each
scenario, 10% being used as the cut‐off for a feasible
investment prospect. A discount rate of 10% is applied
to determine the future value of profits and expenses.
Table 2: Comparative technology performance metrics2
Parameter PHS Lead‐acid Battery
Cycle Lifetime 13000+ 1000
Lifespan [years] 30 5
Capital [$/kWh] 222 703
WATER PIPELINE ARBITRAGE
Here, we perform a case study on a water pipeline in
Brisbane, Australia. The Western Corridor Recycled
Water Pipeline is 200 km of pipeline which was designed
to transport water from various water recycling plants to
Wivenhoe dam and two power stations in the area6.
Arbitrage can be leveraged to generate daily revenue by
storing energy at off‐peak prices and releasing it during
peak demand. The difference between peak and off‐
peak electricity cost represents the profit margin of the
system and therefore is the key determining factor in the
viability of the application.
Since completion of the Western Corridor Recycled
Water Pipeline in 2008 much of the pipe remains
unused; 140 km was considered in this analysis for
partial or total repurposing for CAES6. The maximum
pressure and average diameter of the pipeline were
estimated because no publically available data was
found. Data from the nearby Gold Coast Water network
was used to estimate an average diameter of 650 mm for
the pipeline in question. The pipeline storage volume,
4,646 m3, was calculated using the length and 10% of the
cross‐sectional area. Analysis of the pipeline path
revealed a steep 85 m elevation change at the Mt Petrie
balance tank. Assuming a continuous water column
across the elevation change, nearby sections of pipe
must be rated to at least 8.3 bar. It was assumed that
average water pressure in the pipeline is 5 bar, for the
purpose of estimating storage capacity. Air in a flexible
bladder cannot be pressurised any higher than the
surrounding fluid. The assumptions for the techno‐
economic analysis can be seen in Table 3.
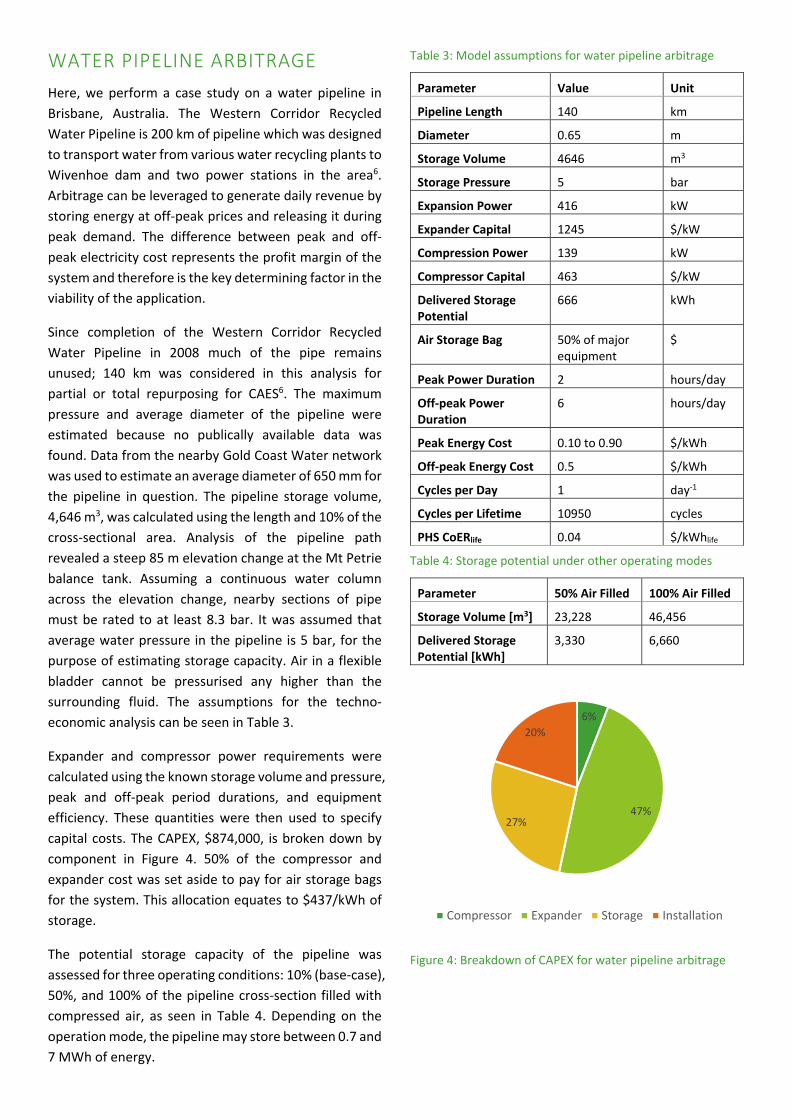
Expander and compressor power requirements were
calculated using the known storage volume and pressure,
peak and off‐peak period durations, and equipment
efficiency. These quantities were then used to specify
capital costs. The CAPEX, $874,000, is broken down by
component in Figure 4. 50% of the compressor and
expander cost was set aside to pay for air storage bags
for the system. This allocation equates to $437/kWh of
storage.
The potential storage capacity of the pipeline was
assessed for three operating conditions: 10% (base‐case),
50%, and 100% of the pipeline cross‐section filled with
compressed air, as seen in Table 4. Depending on the
operation mode, the pipeline may store between 0.7 and
7 MWh of energy.
Table 3: Model assumptions for water pipeline arbitrage
Parameter Value Unit
Pipeline Length 140 km
Diameter 0.65 m
Storage Volume 4646 m3
Storage Pressure 5 bar
Expansion Power 416 kW
Expander Capital 1245 $/kW
Compression Power 139 kW
Compressor Capital 463 $/kW
Delivered Storage Potential
666 kWh
Air Storage Bag 50% of major equipment
$
Peak Power Duration 2 hours/day
Off‐peak Power Duration
6 hours/day
Peak Energy Cost 0.10 to 0.90 $/kWh
Off‐peak Energy Cost 0.5 $/kWh
Cycles per Day 1 day‐1
Cycles per Lifetime 10950 cycles
PHS CoERlife 0.04 $/kWhlife
Table 4: Storage potential under other operating modes
Parameter 50% Air Filled 100% Air Filled
Storage Volume [m3] 23,228 46,456
Delivered Storage Potential [kWh]
3,330 6,660
Figure 4: Breakdown of CAPEX for water pipeline arbitrage
6%
47%27%
20%
Compressor Expander Storage Installation
UPS
UPS specifications of 1.36 MW power output and 2.7
MWh energy per cycle correlate to average data centre
size, blackout duration, and frequency in the United
States. On average, data centres experience one full
power outage per year lasting 119 minutes7. The average
cost of such blackouts are $7900/min due to business
disruption and lost revenue7. Compression power was
determined assuming a 7 day recharge duration is
acceptable because of the infrequencies of power
outages. Due to the increased reliability of CAES when
compared to batteries, it was also of interest to see how
the lifetime storage cost was affected by a battery UPS
failure, however unlikely. The cost of a UPS failure
caused power outage was discounted and assumed to
occur at the halfway point of the system lifetime. This
investigation was done to quantify the step change in
CAPEX given a system failure. A sensitivity analysis of IRR
was conducted by varying the blackout cost to simulate
the feasibility for differing levels of power outage
consequence.
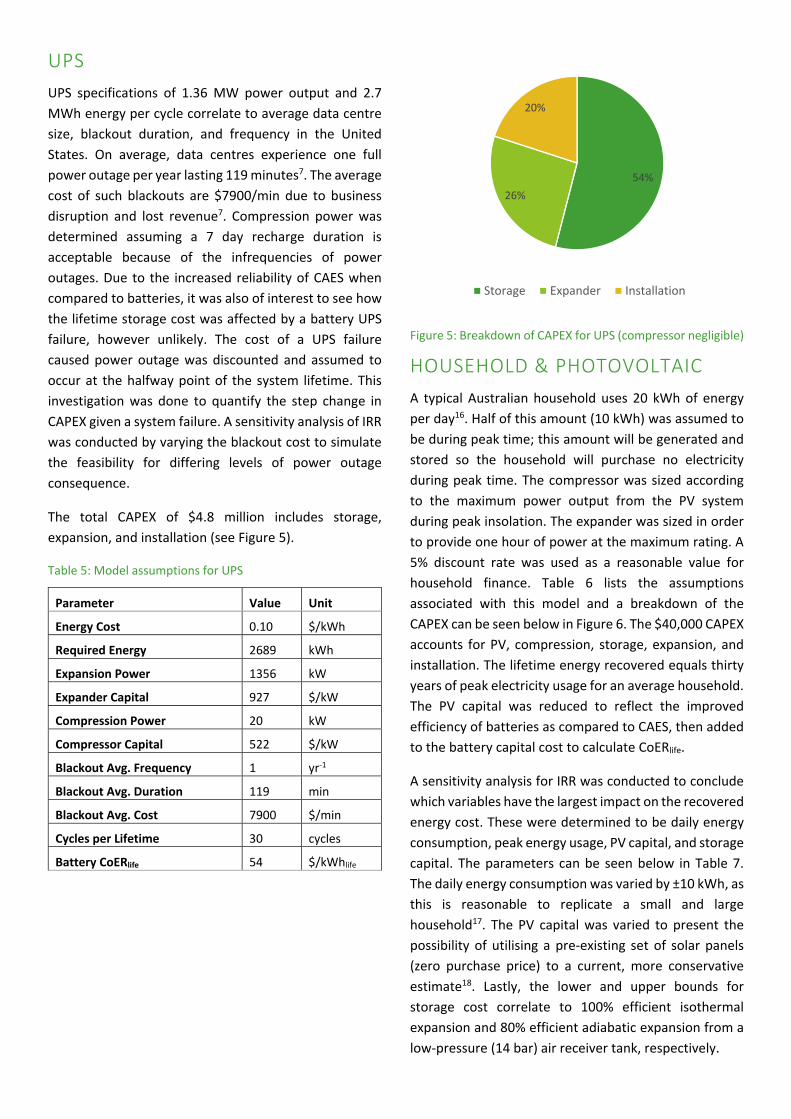
The total CAPEX of $4.8 million includes storage,
expansion, and installation (see Figure 5).
Table 5: Model assumptions for UPS
Parameter Value Unit
Energy Cost 0.10 $/kWh
Required Energy 2689 kWh
Expansion Power 1356 kW
Expander Capital 927 $/kW
Compression Power 20 kW
Compressor Capital 522 $/kW
Blackout Avg. Frequency 1 yr‐1
Blackout Avg. Duration 119 min
Blackout Avg. Cost 7900 $/min
Cycles per Lifetime 30 cycles
Battery CoERlife 54 $/kWhlife
Figure 5: Breakdown of CAPEX for UPS (compressor negligible)
HOUSEHOLD & PHOTOVOLTAIC
A typical Australian household uses 20 kWh of energy
per day16. Half of this amount (10 kWh) was assumed to
be during peak time; this amount will be generated and
stored so the household will purchase no electricity
during peak time. The compressor was sized according
to the maximum power output from the PV system
during peak insolation. The expander was sized in order
to provide one hour of power at the maximum rating. A
5% discount rate was used as a reasonable value for
household finance. Table 6 lists the assumptions
associated with this model and a breakdown of the
CAPEX can be seen below in Figure 6. The $40,000 CAPEX
accounts for PV, compression, storage, expansion, and
installation. The lifetime energy recovered equals thirty
years of peak electricity usage for an average household.
The PV capital was reduced to reflect the improved
efficiency of batteries as compared to CAES, then added
to the battery capital cost to calculate CoERlife.
A sensitivity analysis for IRR was conducted to conclude
which variables have the largest impact on the recovered
energy cost. These were determined to be daily energy
consumption, peak energy usage, PV capital, and storage
capital. The parameters can be seen below in Table 7.
The daily energy consumption was varied by ±10 kWh, as
this is reasonable to replicate a small and large
household17. The PV capital was varied to present the
possibility of utilising a pre‐existing set of solar panels
(zero purchase price) to a current, more conservative
estimate18. Lastly, the lower and upper bounds for
storage cost correlate to 100% efficient isothermal
expansion and 80% efficient adiabatic expansion from a
low‐pressure (14 bar) air receiver tank, respectively.
54%
26%
20%
Storage Expander Installation
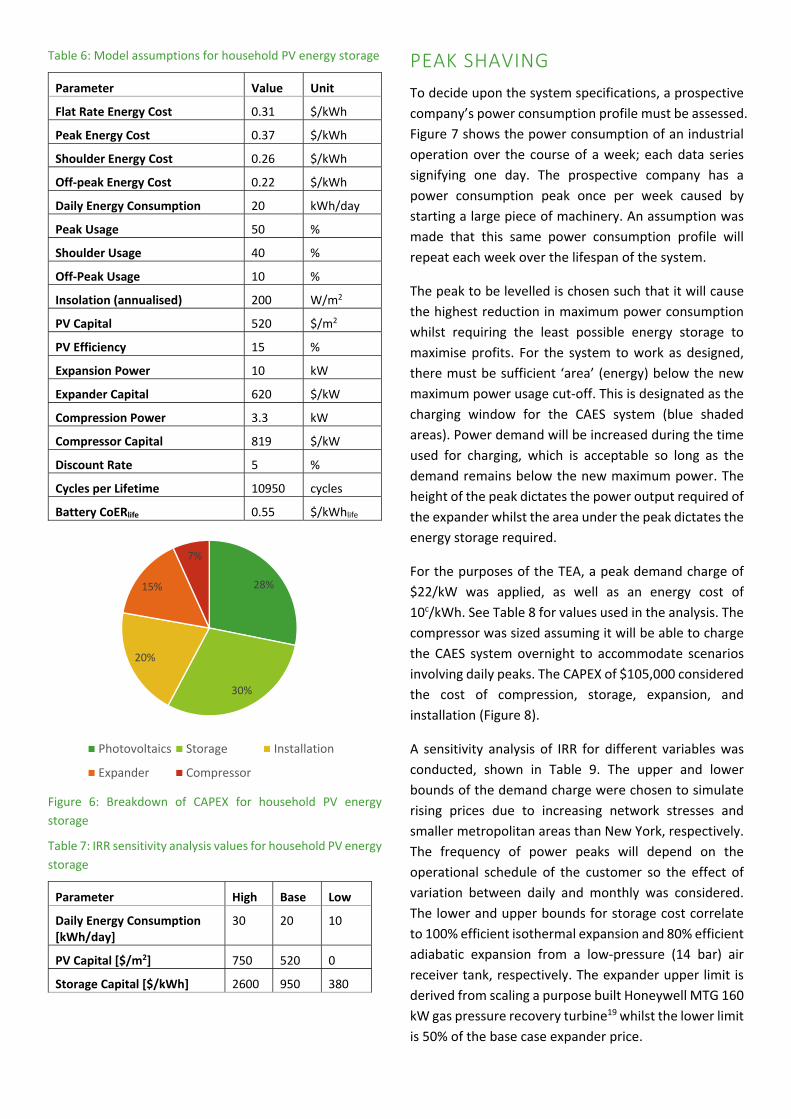
Table 6: Model assumptions for household PV energy storage
Parameter Value Unit
Flat Rate Energy Cost 0.31 $/kWh
Peak Energy Cost 0.37 $/kWh
Shoulder Energy Cost 0.26 $/kWh
Off‐peak Energy Cost 0.22 $/kWh
Daily Energy Consumption 20 kWh/day
Peak Usage 50 %
Shoulder Usage 40 %
Off‐Peak Usage 10 %
Insolation (annualised) 200 W/m2
PV Capital 520 $/m2
PV Efficiency 15 %
Expansion Power 10 kW
Expander Capital 620 $/kW
Compression Power 3.3 kW
Compressor Capital 819 $/kW
Discount Rate 5 %
Cycles per Lifetime 10950 cycles
Battery CoERlife 0.55 $/kWhlife
Figure 6: Breakdown of CAPEX for household PV energy
storage
Table 7: IRR sensitivity analysis values for household PV energy
storage
Parameter High Base Low
Daily Energy Consumption [kWh/day]
30 20 10
PV Capital [$/m2] 750 520 0
Storage Capital [$/kWh] 2600 950 380
PEAK SHAVING
To decide upon the system specifications, a prospective
company’s power consumption profile must be assessed.
Figure 7 shows the power consumption of an industrial
operation over the course of a week; each data series
signifying one day. The prospective company has a
power consumption peak once per week caused by
starting a large piece of machinery. An assumption was
made that this same power consumption profile will
repeat each week over the lifespan of the system.
The peak to be levelled is chosen such that it will cause
the highest reduction in maximum power consumption
whilst requiring the least possible energy storage to
maximise profits. For the system to work as designed,
there must be sufficient ‘area’ (energy) below the new
maximum power usage cut‐off. This is designated as the
charging window for the CAES system (blue shaded
areas). Power demand will be increased during the time
used for charging, which is acceptable so long as the
demand remains below the new maximum power. The
height of the peak dictates the power output required of
the expander whilst the area under the peak dictates the
energy storage required.
For the purposes of the TEA, a peak demand charge of
$22/kW was applied, as well as an energy cost of
10c/kWh. See Table 8 for values used in the analysis. The
compressor was sized assuming it will be able to charge
the CAES system overnight to accommodate scenarios
involving daily peaks. The CAPEX of $105,000 considered
the cost of compression, storage, expansion, and
installation (Figure 8).
A sensitivity analysis of IRR for different variables was
conducted, shown in Table 9. The upper and lower
bounds of the demand charge were chosen to simulate
rising prices due to increasing network stresses and
smaller metropolitan areas than New York, respectively.
The frequency of power peaks will depend on the
operational schedule of the customer so the effect of
variation between daily and monthly was considered.
The lower and upper bounds for storage cost correlate
to 100% efficient isothermal expansion and 80% efficient
adiabatic expansion from a low‐pressure (14 bar) air
receiver tank, respectively. The expander upper limit is
derived from scaling a purpose built Honeywell MTG 160
kW gas pressure recovery turbine19 whilst the lower limit
is 50% of the base case expander price.
28%
30%
20%
15%
7%
Photovoltaics Storage Installation
Expander Compressor
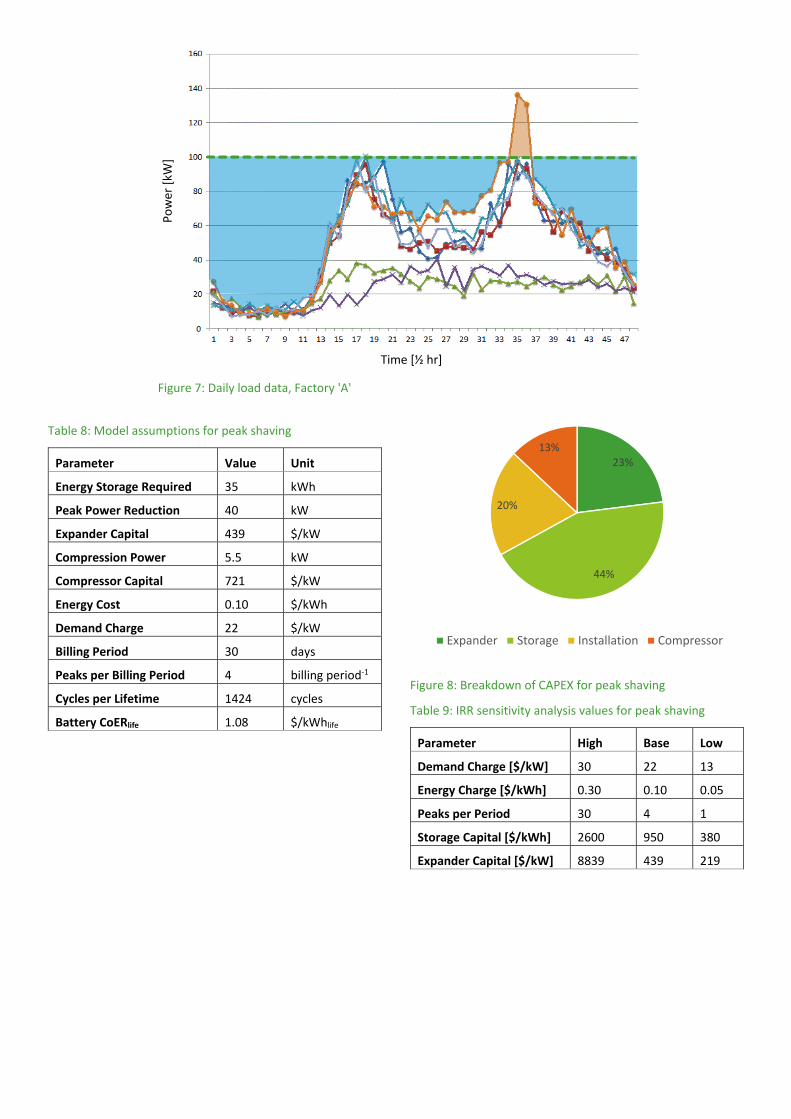
Table 8: Model assumptions for peak shaving
Parameter Value Unit
Energy Storage Required 35 kWh
Peak Power Reduction 40 kW
Expander Capital 439 $/kW
Compression Power 5.5 kW
Compressor Capital 721 $/kW
Energy Cost 0.10 $/kWh
Demand Charge 22 $/kW
Billing Period 30 days
Peaks per Billing Period 4 billing period‐1
Cycles per Lifetime 1424 cycles
Battery CoERlife 1.08 $/kWhlife
Figure 8: Breakdown of CAPEX for peak shaving
Table 9: IRR sensitivity analysis values for peak shaving
Parameter High Base Low
Demand Charge [$/kW] 30 22 13
Energy Charge [$/kWh] 0.30 0.10 0.05
Peaks per Period 30 4 1
Storage Capital [$/kWh] 2600 950 380
Expander Capital [$/kW] 8839 439 219
23%
44%
20%
13%
Expander Storage Installation Compressor
Power [kW
]
Time [½ hr]
Figure 7: Daily load data, Factory 'A'

RESULTS & DISCUSSION
WATER PIPELINES
The base case of a 10% air filled pipeline resulted in a
CoERlife of $0.18/kWhlife. This can be compared to PHS
that has a CoERlife of $0.02/kWhlife, seen in Table 3.
Considering the 5000 MWh storage of the nearby
Wivenhoe pumped hydro power station20, the 7 MWh
pipeline storage potential spread out over 140 km seems
negligible and difficult to justify.
Whilst it is proposed that a pipe with 10% cross‐sectional
area taken by air storage could still be used to transport
water, inevitably it would come at the cost of increased
pumping work. Reduction in the effective pipe diameter
caused by the air storage causes increased fluid velocity
and therefore frictional losses. Whether or not this
aspect would render the proposal unfeasible is still
unknown. The risk of a detached air storage bag blocking
pipe flow may make adaptation of in‐use pipelines
unfeasible.
Figure 9 plots IRR against wholesale energy price
difference. The techno‐economic analysis on the 10% air
filled pipeline predicted that a consistent peak/off‐peak
wholesale electricity price difference of $800/MWh
would be required for the project to break even. In
January 2014, when price spreads are large, the
maximum intraday spread was just $284/MWh21. More
importantly, the median for 2013‐2014 wholesale price
spread was only $3.38/MWh, which is the key metric to
predicting economic sustainability. Even with the low
CoERlife, the minimal profits result in an uneconomical
proposal given the current energy market.
Figure 9: IRR sensitivity as a function of price spread for water
pipeline arbitrage
UPS
As seen in Table 10, the capital ($/kWh) of CAES as well
as the CoERlife is more than the equivalent six sets of
batteries required for the same lifespan. If the cost of
one unmitigated blackout over the course of 30 years is
added to the NPV analysis, simulating a battery failure,
the capital and CoERlife are both increased by ~5%.
Table 10: Cost comparison of CAES and battery UPS systems
Parameter CAES Battery Battery with 1 Failure
Capital [$/kWh] 1777 1624 1707
CoERlife [$/kWhlife] 62 54 57
The cost per minute of power outage is highly variable
between different industries. This variable determines
the sensible upper limit on spending to avoid power
outages. Figure 10 depicts the effect cost per minute of
blackout has on IRR for the model, demonstrating the
business case for having an effective CAES UPS system so
long as the facility’s predicted blackout cost is greater
than $6800/min for the given scenario. The IRR is 14%
for the base case, which explains the widespread
adoption of UPS systems.
Figure 10: IRR sensitivity as a function of blackout cost per
minute for UPS
‐25%
‐20%
‐15%
‐10%
‐5%
0%
5%
10%
15%
0 200 400 600 800 1000
IRR
Price Spread [$/MWh]
‐30%
‐20%
‐10%
0%
10%
20%
30%
40%
50%
0 5000 10000 15000 20000
IRR
Blackout Cost [$/min]

HOUSEHOLD & PHOTOVOLTAIC
The model delivers peak energy at a rate of $0.38/kWhlife,
somewhat cheaper than the battery and PV setup which
delivers power at $0.55/kWhlife. As can be seen, the PV
system takes up a large portion of the total capital. This
is largely due to the inefficiencies of the system, as well
as the high installed cost of residential PV. The
competitiveness of CAES arises due to the frequency of
use in this scenario. Batteries cycled daily need to be
replaced every 2.7 years. IRR over 10 years is ‐16%.
The results of the sensitivity analysis in Figure 11 exhibit
the current futility of the application. As the energy
consumption increases, the profitability decreases. Even
with PV capital reduced to zero the investment is
unviable. Altering the storage capital has a similarly
minimal effect. A significant increase in flat rate energy
cost coupled with a decrease in off‐peak and shoulder
variable pricing rates is required to warrant investment.
Admittedly, the required photovoltaic system size is
highly dependent on the level of insolation, which is
highly variable due to season and weather. Therefore
the size of the system has an element of intrinsic error
due to the fact that during times when consumption is at
its greatest, the system will not be adequately sized. This
model assumes a constant insolation year‐round, which
is an optimistic approach. During times of low insolation,
some grid peak energy will need to be purchased which
is not factored into the analysis. It was assumed that
purchasing peak energy during these times would be
cheaper than oversizing the system to accommodate for
a worst‐case scenario.
PEAK SHAVING
The base case IRR was found to be 5.9% with a CoERlife of
$1.56/kWhlife. Lead acid batteries provide cheaper
energy for the same application, at $1.08/kWhlife.
The shape of the peak to be shaved has great influence
on the profitability of the installation; the reduction of a
sharp peak is more feasible than one which is wide. This
is due to the cost of energy storage, which does not have
a revenue stream associated with it. See Figure 12 for the
IRR sensitivity as a function of the required peak power
to energy ratio. A high ratio indicates a very sharp peak,
minimising storage capacity and maximising demand
charge reduction.
Figure 12: IRR as a function peak power/energy ratio for peak
shaving
At low power to energy ratios, the tanks make up the
vast majority of capital expenses. So much is spent
storing the compressed gas that the profitability of the
savings is diminished.
‐20%
‐15%
‐10%
‐5%
0%
5%
10%
15%
20%
25%
0.0 0.4 0.8 1.2 1.6 2.0 2.4
IRR
Peak Power to Energy Ratio [kW/kWh]
Figure 11: IRR sensitivity analysis for household PV energy storage
‐6.0%
‐10.6%
‐13.1%
‐24.5%
‐18.1%
‐22.1%
‐30% ‐25% ‐20% ‐15% ‐10% ‐5% 0%
Daily Energy Consumption [kWh/day]
PV Capital [$/m^2]
Storage Capital [$/kWh]
IRR
Low High

Figure 13 shows how changing the power to energy ratio
of the peak to be levelled affects the magnitude and
breakdown of capital expenditure. This was done by
simultaneously increasing peak power and reducing the
energy storage capacity required of the system. As the
peak becomes sharper, the proportion spent on storage
capacity and compression drops whilst expander
equipment makes a larger fraction of expenditure.
Overall, CAPEX is significantly reduced whilst at the same
time the savings derived from demand charge reduction
increase.
Figure 14: CAPEX versus power to energy ratio
Results from the sensitivity analysis can be seen in Figure
14. Changing the demand charge has a large effect on
IRR as this is the only source of profit. Targeting areas
with the highest demand charges, such as New York, will
reap the greatest benefits22. The energy cost and peaks
per period do not have as much of an effect because of
the relatively small amount of energy used by the system.
Increasing the amount of peaks that require shaving per
billing period only affects the operating expenses, which
as previously mentioned are small. Varying the capital
costs associated with storage and expansion result in
large changes in IRR as they make up a large proportion
of CAPEX.
COMPARISONS
Unconventional applications of CAES were compared to
conventional energy storage solutions for: water
pipeline, UPS, household photovoltaic, and peak shaving
applications. The CoERlife was determined for each, as
seen in Table 11.
For all scenarios except household + PV, CAES is more
expensive over the lifetime than existing solutions. This
is due to the daily operation of the household PV system
and the relatively low cycle‐lifetime of lead‐acid
batteries. The frequent replacement of battery packs
caused by daily cycling drives up the lifetime energy cost,
making CAES the less economically unfavourable option.
The annual cost of power of CAES applications can be
compared to battery storage, PHS, and combustion
based power generators given a frequency of 52 cycles
per year (Figure 15). It is shown how the ACoP changes
with respect to usage per cycle. As usage increases,
0
20
40
60
80
100
120
140
160
0.2 0.3 0.5 0.7 1.0 1.4 2.0
CAPEX
[$k]
Peak Power to Energy Ratio [kW/kWh]
Storage Expander Installation Compressor
Table 11: CoERlife summary [$/kWhlife]
Water Pipeline UPS Household + PV Peak Shaving
CAES 0.18 62 0.38 1.56
Current Solution (PHS/Battery) 0.04 54 0.55 1.08
Figure 13: IRR sensitivity for peak shaving
‐4.4%
6.0%
6.0%
15.7%
9.3%
13.3%
5.5%
4.6%
‐6.8%
‐24.2%
‐30% ‐25% ‐20% ‐15% ‐10% ‐5% 0% 5% 10% 15% 20%
Demand Charge [$/kW]
Energy Charge [$/kWh]
Peaks per Period
Storage Cost [$/kWh]
Expander Cost [$/kW]
IRR
Low High

batteries and CAES costs also increase, while PHS and gas
generators stay relatively the same. This is evident of the
minor capital costs associated with storage in PHS and
gas generators. Therefore, in scenarios with high usage
cycles, PHS and gas generators prove to be much more
economical than alternatives. In scenarios with high
cycle duration and where PHS and gas generation are
unsuitable, CAES may have a market opportunity over
battery systems. The storage capital and resulting ACoP
for battery systems will increase, for a given cycle
duration, if the cycle frequency is increased above 200
cycles per year, due to batteries requiring earlier
replacement.
CONCLUSIONS
The application specific economics of unconventional
uses of CAES in configurations in underutilised water
pipelines or compressed gas tanks were compared to
conventional alternatives for applications in: arbitrage,
UPS, household photovoltaics, and peak shaving.
a) Water pipeline energy storage will only justify the
capital expense when average differences in
peak/off‐peak electricity prices exceed $800/MWh.
Based on existing data, a compelling business case
does not exist in the present energy market. PHS is
currently a cheaper alternative however, water
pipeline storage may prove feasible in locations
where PHS is not possible and if electricity price
spreads increase significantly.
b) There may be cause for further investigation into
UPS applications of CAES as it was shown to be close
to competitive with battery systems. The value of
energy storage for UPS is proven and its usage in
battery form is widespread.
c) Household CAES integrated with PV systems are less
economically unfavourable than batteries. PV’s
without storage are the least unfavourable however
implementation of demand charges would
incentivise storage.
d) Batteries are superior to CAES for peak shaving
applications and are feasible and advantageous for
certain power consumption profiles.
In all scenarios, it is important to note how each
equipment specification affects the overall conclusion of
the analysis. Storage pressure dictates the energy
density and overall size of equipment required. The cost
of energy recovered depends largely on the cylinder
specification. Tanks are available in a range of working
pressure depending on application and this must be
considered when specifying a system. Expansion and
compression efficiencies affect the CAPEX and OPEX of
the CAES system. The efficiency of expansion dictates
how much excess storage capacity is required to achieve
the desired energy output on discharge. The round trip
efficiency determines the increase in total electricity
consumption caused by use of the system which has a
mild effect on profitability.
Further research of each application is needed to
determine if there are more specific situations in each
scenario that do warrant investment. This may be the
case for extended sections of large and disused water
pipeline, facilities that have very high cost per minute
blackout, or businesses with occasional sharp peaks in
their electricity usage. These situations are likely
uncommon and therefore may not have widespread
impact. The most favourable scenarios will be those
which can utilise existing infrastructure to reduce CAPEX,
such as, empty water pipelines or facilities already using
compressed air. Future research into associated
technologies, which may be coupled with enticing
energy price spreads, will also assist in providing a stable
economic landscape for feasibility. In summary, CAES
research should be directed toward applications where
the delivered energy provides high value savings to the
customer and where high reliability is required.
0
200
400
600
800
1000
1200
1400
0 1 2 4 6 8 10Annual Cost of Power [$/kW‐y]
Cycle Duration, tcycle [hours/cycle]
Battery CAES PHS Gas Generator
Figure 15: ACoP comparison of competing technologies23
CONTACT UQ DOW CENTRE
w: dowcsei.uq.edu.au
t: +61 7 334 63883
UQ Dow Centre
Level 5 Hawken Engineering Building (50)
The University of Queensland
Brisbane QLD 4072
REFERENCES 1. Debarre BDR. Leading the Energy Transition
Factbook: Energy Storage. 2013 [cited 2014]. Available from: http://www.sbc.slb.com/SBCInstitute/Publications/~/media/Files/SBC%20Energy%20Institute/SBC%20Energy%20Institute_Electricity_Storage%20Factbook_vf.ashx
2. Bradbury KJ. The Potential of Energy Storage Systems with Respect to Generation Adequacy and Economic Viability. 2013.
3. Australia O‐GE. Batteries. 2014. 4. Toolbox TE. Hydrostatic Pressure: Relationship
between depth and pressure 2014 [22/10/14]; Available from: http://www.engineeringtoolbox.com/hydrostatic‐pressure‐water‐d_1632.html
5. Hydrostor. Underwater Compressed Air Electrical Storage 2013 [cited 2014]; Available from: http://www.hydrostor.ca/home/
6. Department of Infrastructure and Planning QG. Final Progress Report: Western Corridor Recycled Water Project. 2014.
7. Institute P. 2013 Cost of Data Center Outages. 2013. 8. Wesoff E. Compressed Air Storage Beats Batteries at
Grid Scale: Green Tech Media; 2011; Available from: http://www.greentechmedia.com/articles/read/compressed‐air‐energy‐storage‐beats‐batteries
9. Huang Y. Estimating Response to Price Signals in Residential Electricity Consumption. 2013.
10. Association ES. Flexible Peaking Resource 2014; Available from: http://energystorage.org/energy‐storage/technology‐applications/flexible‐peaking‐resource
11. Regulator AE. Tariff and Fees Explained 2014; Available from: http://www.aer.gov.au/consumers/my‐energy‐bill/tariff‐and‐fees‐explained
12. Energy D. Understanding Demand and Consumption 2014; Available from: http://www.think‐energy.net/KWvsKWH.htm
13. Airsquared. Scroll Expander Produces 1kW of Quiet Power 2006 [cited 2014]; Available from: http://airsquared.com/news/patented‐scroll‐expander‐produces‐1‐kw‐of‐quiet‐power
14. Humphreys KK, Wellman P. Basic Cost Engineering. 3 ed. New York: M. Dekker; 1996.
15.Douglas JM. Conceptual design of chemical processes. New York ; Sydney ; London: McGraw‐Hill; 1988.
16. Systems ZE. Energy Storage: Taking personal energy security to the next level 2014; Available from: http://www.zenenergy.com.au/home/energy‐storage/
17. Tribunal IPR. Typical Household Energy Use 2014; Available from: http://www.ipart.nsw.gov.au/Home/For_Consumers/Compare_Energy_Offers/Typical_household_energy_use
18. G. Barbose NDSW, R. Wiser. Tracking the Sun V: An Historical Summary of the Installed Price of Photovoltaics in the United States from 1998 to 2012. LBNL 2013.
19. Honewell. Turboexpander MTG 160 product information. 2014.
20. Energy C. Wivenhoe Power Station Fact Sheet; 2014. 21. AEMO. Electricity Price and Demand Australian
Energy Market Operator. 2014. 22. Edison C. Statement of Market Supply Charge ‐
Capacity 2014; Available from: http://www.coned.com/documents/elecPSC10/StatMSCCAP‐8.pdf