Techno-Economic Evaluation of Biomass Fired or · PDF file ·...
41
Techno-Economic Evaluation of Biomass Fired or Co Fired Power Plant Biomass Fired or Co-Fired Power Plant with Post Combustion Capture Stanley Santos IEA Greenhouse Gas R&D Programme IEA Greenhouse Gas R&D Programme Cheltenham, UK Regional Workshop for Regional Workshop for the Baltic Sea and Central & Eastern European Countries Vilnius, Lithuania 13 th April 2011
-
Upload
nguyendung -
Category
Documents
-
view
224 -
download
4
Transcript of Techno-Economic Evaluation of Biomass Fired or · PDF file ·...

Techno-Economic Evaluation of Biomass Fired or Co Fired Power PlantBiomass Fired or Co-Fired Power Plant
with Post Combustion CaptureStanley Santos
IEA Greenhouse Gas R&D ProgrammeIEA Greenhouse Gas R&D ProgrammeCheltenham, UK
Regional Workshop forRegional Workshop for the Baltic Sea and Central & Eastern European Countries
Vilnius, Lithuania13th April 2011

AcknowledgementAcknowledgement
• This presentation is the res lts of the• This presentation is the results of the work done by Foster Wheeler Italiana for IEA Greenhouse Gas R&D Programme
• Would like to thank...• Paolo Cotone• Franco Gasparinip
2

OutlineOutline
• Moti ation of this St d (Disc ssion• Motivation of this Study (Discussion Points)
• Study Cases• Design Basis• Design Basis• Summary of Performance Results• Economic analysis• Concluding Remarks• Concluding Remarks
3

Discussion PointDiscussion Point• How to consider the “Accounting” of CO2 Captured from g p
Biomass Fired Power Plant• The discussion is now centred on how to consider the CO2 emitted
f bi fi d l t if it i t d “CO t l” dfrom biomass-fired power plants, if it is counted as “CO2 neutral” and if stored, whether how this could be considered or accounted as a “negative” CO2 emission.
• Validation / Accounting methodology when CO2 captured from Co-Fired Power Plant.
• One of the questions/Issues addressed in this study:• “What should be the cost of CO emissions avoided that would• “What should be the cost of CO2 emissions avoided that would
make CCS an attractive option to be incorporated into a biomass fired power plant assuming that the stored CO2 from a bi fi d l t ld t dditi l
4
biomass fired power plant could generate an additional revenue as CO2 credit”

Study CasesStudy Cases
• Case 1: Nominal 500 MWe (net) Coal co fired with• Case 1: Nominal 500 MWe (net) Coal co-fired with Biomass Supercritical PC Power Plant.
• Case 2: : Nominal 500 MWe (net) Coal co-fired withCase 2: : Nominal 500 MWe (net) Coal co-fired with Biomass Supercritical CFB Power Plant.
• Case 3: : Nominal 250 MWe (net) Biomass (standalone)Case 3: : Nominal 250 MWe (net) Biomass (standalone) CFB Power Plant.
• Case 4: : Nominal 75 MWe (net) Biomass (standalone) ( ) ( )BFB Power Plant.
• For all the four cases, power plants without and with CO2 capture are evaluated
5

Design Basis (Summary)Design Basis (Summary)• Feedstocks:
• Eastern Australian Bituminous (LHV = XX MJ/kg; Coal S = 1.1% wt, dry ash free bases)
• Biomass is a clean, virgin wood chips (LHV = 7.3 MJ/kg)• Location of the Power PlantLocation of the Power Plant
• NE Coast of The Netherlands• Reference Ambient Temperature: 9oC• Reference Ambient Temperature: 9 C• Cooling Water Type:
O th h t li• Once through sea water cooling• Cooling temperature: 12oC → 19oC
6

Design Basis (Summary)Design Basis (Summary)• Emissions Limit;Emissions Limit;
• Based on the requirement of the EC Large Combustion DirectivesCombustion Directives.
o NOx (as NO2): ≤ 200 mg/Nm3(@ 6%v O2 – dry)o SOx (as SO2): ≤ 200 mg/Nm3(@ 6% O2 dry)o SOx (as SO2): ≤ 200 mg/Nm3(@ 6%v O2 – dry)o Particulates: ≤ 30 mg/Nm3(@ 6%v O2 – dry)
• CO2 Characteristics at Battery LimitsCO2 Characteristics at Battery Limits• Delivered Pressure: 110 Bar• CO P it ≥ 99% (≤ 10 H O)
7
• CO2 Purity: ≥ 99% (≤ 10 ppm H2O)

Summary – CasesSummary Cases
Case CO2Case No. Boiler Technology Fuel Feedstock Nominal Rating CO2
Capture
1a PC (supercritical) Coal (90%) + Biomass (10%)* 500MWe (net) No
1b PC (supercritical) Coal (90%) + Biomass (10%)* 500MWe (net) Yes
2a CFB (supercritical) Coal (90%) + Biomass (10%)* 500MWe (net) No2a CFB (supercritical) Coal (90%) Biomass (10%) 500MWe (net) No
2b CFB (supercritical) Coal (90%) + Biomass (10%)* 500MWe (net) Yes
( ) ( )3a CFB (subcritical) Biomass 250MWe (net) No
3b CFB (subcritical) Biomass 250MWe (net) Yes
4a BFB (subcritical) Biomass 75MWe (net) No
4b BFB (subcritical) Biomass 75MWe (net) Yes
8
* Based on thermal input (LHV value)
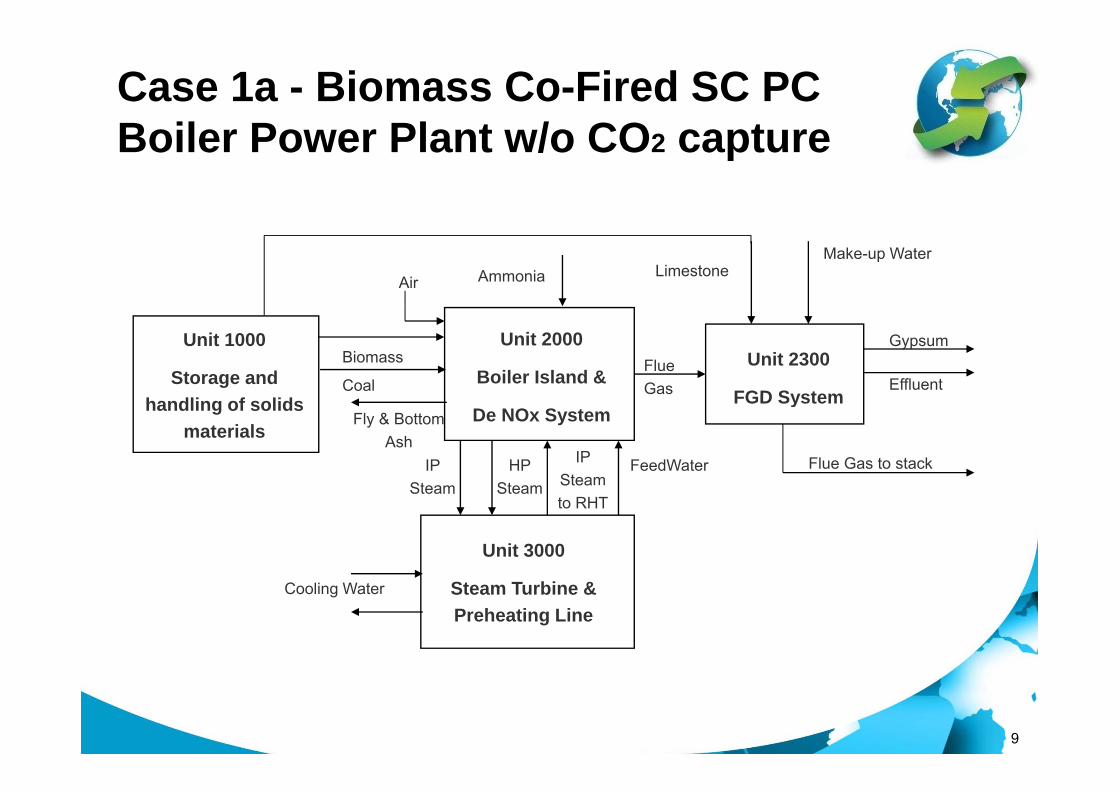
Case 1a - Biomass Co-Fired SC PC B il P Pl t / CO tBoiler Power Plant w/o CO2 capture
Air
Make-up WaterLimestoneAmmonia
Unit 1000
Storage and
Unit 2000
Boiler Island & Unit 2300
FGD SystemCoal
Gypsum
EffluentFlue Gas
Biomass
handling of solids materials
De NOx System FGD System
IP Steam
HP Steam
FeedWater Flue Gas to stackIP Steam
Fly & Bottom Ash
Unit 3000
Steam Steam Steato RHT
Steam Turbine & Preheating Line
Cooling Water
9

Case 1a (Power Plant Features)Case 1a (Power Plant Features)• Power Plant Capacityp y
• Actual Net Power Output: 518.9 MWe• Boiler is commercially available / proven• Boiler is commercially available / proven• Boiler is co-fired with 10% Biomass (LHV
basis); No pre-drying of biomass• Steam Conditions:• Steam Conditions:
• 580oC HP (275 Bar) / 600oC RH (55 Bar)• Boiler Efficiency: ~93%
• SCR and FGD are installed to meet the
10
SCR and FGD are installed to meet the emissions required.

Case 1b - Biomass Co-Fired SC PC B il P Pl t ith CO tBoiler Power Plant with CO2 capture
Air Make-upAmmonia Li t
Unit 1000
Coal & Ash
Unit 2000
Boiler Island &Unit 2400
C l
Gypsum
Effl t
Make up Water
Flue
Ammonia Limestone
Coal & Ash Handling
Boiler Island &
De NOx System FGD SystemCoal EffluentGas
IP HP Feedwater FlueIP
Fly & Bottom Ash
Clean Flue Gas
Unit 3000
IP Steam
HP Steam
Feedwater Flue
GasSteam to RHT
Cooling Water
Steam Turbine & Preheating Line
Unit 5000
CO2 Capture PlantUnit 6000
CO2 Compression & Drying
Cooling
Water& Drying
CO2 to Storage
CondensateSteam to Reboiler
Condensate from Reboiler
11
CondensateCondensate Return
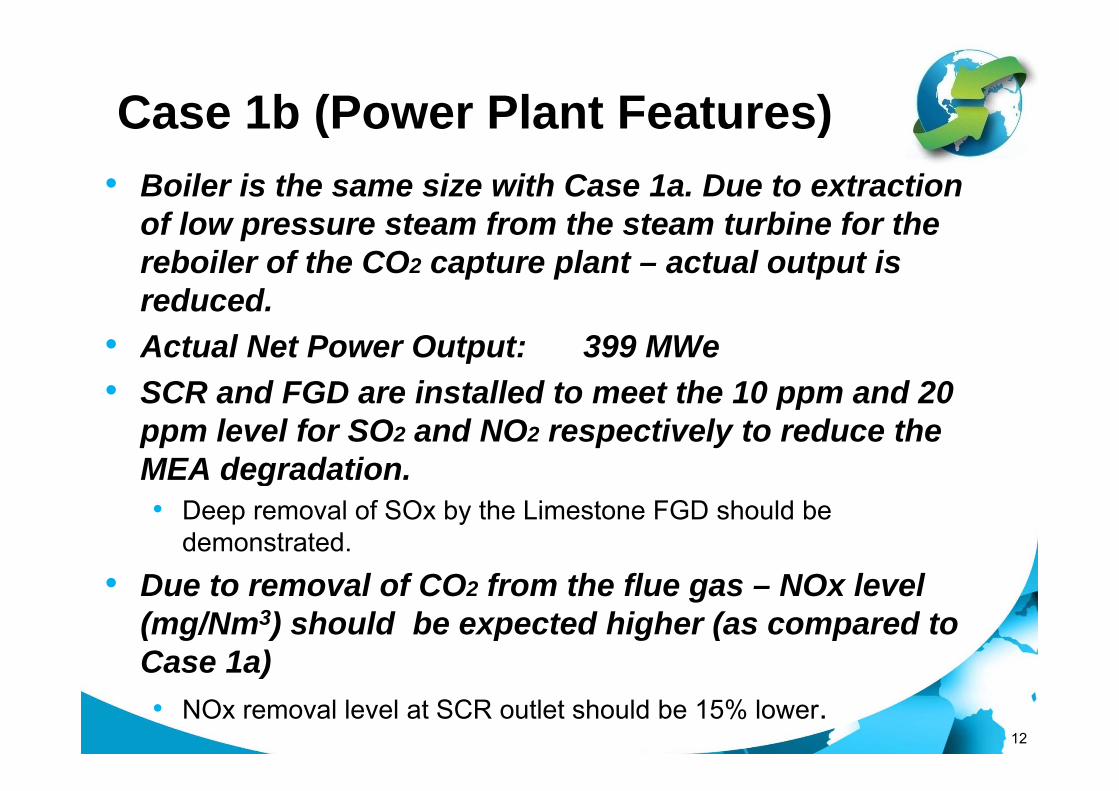
Case 1b (Power Plant Features)Case 1b (Power Plant Features)• Boiler is the same size with Case 1a. Due to extraction
f l t f th t t bi f thof low pressure steam from the steam turbine for the reboiler of the CO2 capture plant – actual output is reducedreduced.
• Actual Net Power Output: 399 MWe• SCR and FGD are installed to meet the 10 ppm and 20SCR and FGD are installed to meet the 10 ppm and 20
ppm level for SO2 and NO2 respectively to reduce the MEA degradation.g• Deep removal of SOx by the Limestone FGD should be
demonstrated.
D t l f CO f th fl NO l l• Due to removal of CO2 from the flue gas – NOx level (mg/Nm3) should be expected higher (as compared to Case 1a)
12
Case 1a)• NOx removal level at SCR outlet should be 15% lower.

Case 2a - Biomass Co-Fired SC CFB B il P Pl t / CO tBoiler Power Plant w/o CO2 capture
Air Limestone
Unit 1000
Storage and
Unit 2000
Boiler IslandCoalFlue Gas to stack
Biomass
handling of solids materials
IP Steam
HP Steam
FeedWaterIP Steam
Fly & Bottom Ash
Unit 3000
Steam Steamto RHT
Steam Turbine & Preheating Line
Cooling Water
13

Case 2a (Power Plant Features)Case 2a (Power Plant Features)• Power Plant Capacity
• Actual Net Power Output: ~521 MWe• Boiler is based on supercritical boiler
technology which is commercially available / proven
• Boiler is co-fired with 10% Biomass (LHV basis); No pre-drying of biomass); p y g
• Steam Conditions:• 580oC HP (275 Bar) / 600oC RH (60 Bar)580 C HP (275 Bar) / 600 C RH (60 Bar)
• Only limestone injection into the boiler is included Ca/S ratio of 2 84 is used to
14
included. Ca/S ratio of 2.84 is used to achieve the minimum emissions required.

Case 2a (Power Plant Features)Case 2a (Power Plant Features)• No SCR is installed. Required NOx q
emission is achieved by the CFB itself. Lower NOx emission is expected due toLower NOx emission is expected due to lower combustion temperature in the CFB boilerboiler.
• Special Feature of the Power Plant:• A plastic heat exchanger is installed
downstream of the ID fan to maximise the heat recovery thus achieving some efficiency gain. (Expected flue gas temperature at stack
15
g ( p g p~90oC)

Case 2b - Biomass Co-Fired SC CFB B il P Pl t ith CO tBoiler Power Plant with CO2 capture
Air M k
Unit 1000 Unit 2000Unit 2400
Air
Gypsum
Make-up Water
Flue
Limestone Limestone
Coal
Coal & Ash Handling
Boiler IslandFGD SystemCoal Effluent
Flue Gas
IP HP F d FlIP
Fly & Bottom Ash
Clean Flue Gas
Unit 3000
IP Steam
HP Steam
Feedwater Flue
Gas
IP Steam to RHT
Cooling Water
Unit 3000
Steam Turbine & Preheating Line
Unit 5000
CO2 Capture PlantCooling
Water
Unit 6000
CO2 Compression & D i
Steam to Reboiler
Condensate from Reboiler
& Drying
CO2 to Storage
16
CondensateCondensate Return

Case 2b (Power Plant Features)Case 2b (Power Plant Features)• Boiler is the same size with Case 2a. Due to
extraction of low pressure steam from the steam turbine for the reboiler of the CO2 capture plant – actual output is reduced.
• Actual Net Power Output: ~390 MWep• To achieve the 10 ppm SOx level, in addition to
the limestone that is injected into the boiler withthe limestone that is injected into the boiler with a Ca/S ratio of 1, an external FGD has been installed.installed.
• Unlike Case 2a, there will be no plastic heat exchanger installed downstream of the ID fan
17
exchanger installed downstream of the ID fan due to the installed FGD.
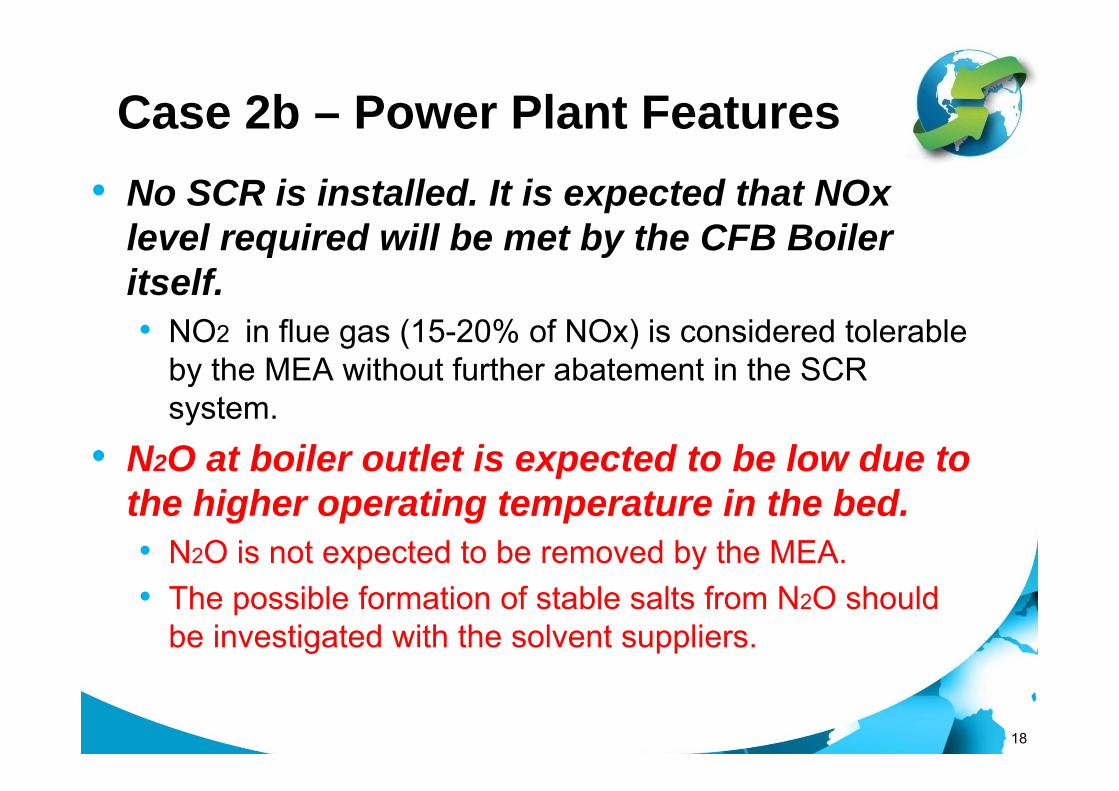
Case 2b – Power Plant FeaturesCase 2b Power Plant Features• No SCR is installed. It is expected that NOx
level required will be met by the CFB Boiler itself.• NO2 in flue gas (15-20% of NOx) is considered tolerable
by the MEA without further abatement in the SCR system.
• N2O at boiler outlet is expected to be low due to the higher operating temperature in the bed. • N2O is not expected to be removed by the MEA.• The possible formation of stable salts from N2O should
be investigated with the solvent suppliers.
18

Case 3a- Biomass Fired CFB Boiler P Pl t / CO tPower Plant w/o CO2 capture
U it 1000 Unit 2000
Air
Unit 1000
Storage and handling of solids
Unit 2000
Boiler IslandFlue Gas to stack
Fly & Bottom
Biomass
materialsIP
SteamHP
SteamFeedWaterIP
Steam to RHT
yAsh
Unit 3000
Steam Turbine & Cooling WaterPreheating Line
19

Case 3a – Power Plant FeaturesCase 3a Power Plant Features
• Power Plant Capacityp y• Actual Net Power Output: 273 MWe
• Boiler is a subcritical circulating fluidized• Boiler is a subcritical circulating fluidized bed unit which is commercially available / proven
• Boiler is fired with 100% Biomass; no pre-Boiler is fired with 100% Biomass; no predrying of biomass is included.St C diti• Steam Conditions:• 565oC HP (169 Bar) / 565oC RH (39 Bar)
20

Case 3a – Power Plant FeaturesCase 3a Power Plant Features
• External FGD and limestone injection in jthe combustion chamber are not required to meet SOx emission limits because ofto meet SOx emission limits because of the low sulphur content in biomass.NO i t b th CFB b il N SCR i• NOx is met by the CFB boiler. No SCR is necessary.
• A Plastic Heat Exchanger is installed downstream of the ID Fan to maximisedownstream of the ID Fan to maximise heat recovery.
21

Case 3b - Biomass Fired CFB Boiler P Pl t ith CO tPower Plant with CO2 capture
Air Limestone
Unit 1000
Coal & Ash
Unit 2000
Boiler Island Biomass
Handling
IP HP Feedwater Flue IP Steam
Fly & Bottom Ash
Clean Flue Gas
Unit 3000Unit 5000
Steam Steam GasSteam to RHT
Cooling Water
Steam Turbine & Preheating Line
Unit 5000
CO2 Capture PlantCooling
Water
Unit 6000
CO2 Compression & Drying
CondensateSteam to Reboiler
Condensate from Reboiler CO2 to Storage
22
Condensate Return

Case 3b – Power Plant FeaturesCase 3b Power Plant Features• Boiler is the same size with Case 3a. Due to extraction
f l t f th t t bi f thof low pressure steam from the steam turbine for the reboiler of the CO2 capture plant – actual output is reducedreduced.
• Power Plant Capacity• Actual Net Power Output: ~169 MWeActual Net Power Output: 169 MWe
• No plastic heat exchanger installed downstream of the ID fan – due to the direct contact cooler of the CO2
capture plant.• In order to achieve the 10 ppm SOx level as required to
reduce degradation of the MEA, limestone is injected into the boiler with Ca/S ratio of ~2.8. (This system requires demonstration )
23
requires demonstration.)

Case 3b – Power Plant FeaturesCase 3b Power Plant Features• NOx emissions limit is met by the CFB. NO2 in the flue
i id d t l bl b th MEA th th illgas is considered tolerable by the MEA, thus there will be no SCR installed.
• N2O at the boiler outlet is expected to be low due to the• N2O at the boiler outlet is expected to be low due to the slightly higher temperature in the bed. N2O is not expected to be removed by MEA. However the e pected to be e o ed by o e e t epossibility of formation of stable salts from N2O should be investigated with the MEA suppliers.
24

Case 4a - Biomass Fired BFB Boiler P Pl t / CO tPower Plant w/o CO2 capture
U i 1000 Unit 2000
Air
Unit 1000
Storage and handling of solids
Unit 2000
Boiler IslandFlue Gas to stack
Fly & Bottom
Biomass
materialsHP
SteamFeedWater
yAsh
Unit 3000
Steam Turbine & Cooling WaterPreheating Line
25

Case 4a – Power Plant FeaturesCase 4a Power Plant Features
• Power Plant Capacityp y• Actual Net Power Output: 75.8 MWe
• Boiler is a subcritical bubbling fluidized• Boiler is a subcritical bubbling fluidized bed unit which is commercially available / proven
• Boiler is fired with 100% Biomass; no pre-Boiler is fired with 100% Biomass; no predrying of biomass is included.St C diti• Steam Conditions:• 540oC HP (115 Bar) / No Steam Reheat
26

Case 4a – Power Plant FeaturesCase 4a Power Plant Features
• External FGD and limestone injection in jthe combustion chamber are not required to meet SOx emission limits because ofto meet SOx emission limits because of the low sulphur content in biomass.NO i t b th BFB b il N SCR i• NOx is met by the BFB boiler. No SCR is necessary.
• No Plastic Heat Exchanger is installed downstream of the ID Fan due todownstream of the ID Fan due to performance increase does not justify the i t t t
27
investment cost.
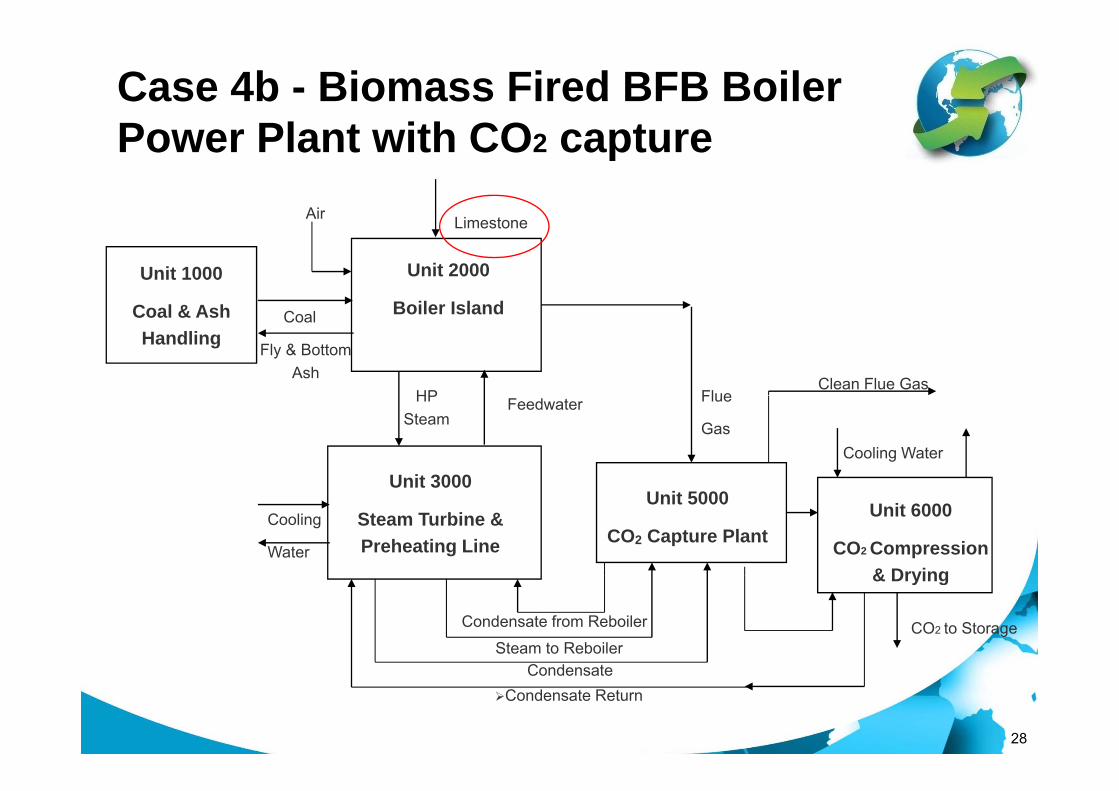
Case 4b - Biomass Fired BFB Boiler P Pl t ith CO tPower Plant with CO2 capture
Air
Unit 1000
C l & A h
Unit 2000
Boiler Island
Air Limestone
Coal & Ash Handling
Boiler IslandCoal
HP Flue
Fly & Bottom Ash
Clean Flue Gas
Unit 3000
HP Steam
Feedwater Flue
GasCooling Water
Unit 3000
Steam Turbine & Preheating Line
Unit 5000
CO2 Capture PlantCooling
Water
Unit 6000
CO2 Compression & Drying
C d tSteam to Reboiler
Condensate from Reboiler
& Drying
CO2 to Storage
28
CondensateCondensate Return

Case 4b – Power Plant FeaturesCase 4b Power Plant Features• Boiler is the same size with Case 4a. Due to extraction of
l f h bi f h b illow pressure steam from the steam turbine for the reboiler of the CO2 capture plant – actual output is reduced.
• P Pl t C it• Power Plant Capacity• Actual Net Power Output: ~49 Mwe
• In order to achieve the 10 ppm SOx level as required to• In order to achieve the 10 ppm SOx level as required to reduce degradation of the MEA, limestone is injected into the boiler with Ca/S ratio of ~2.8. No external FGD is required.
• NOx emissions limit is met by the BFB. The NO2 level is considered tolerable to the MEA.
• N2O is considered low – but would require the evaluation
29
of MEA solvent supplier with regard to formation of stable salt.

Performance of the Power Pl t SPlants - SummaryCase Plant Type Nominal Size SCR FGD CO2 Capture Net Efficiency Net output
1a SC PF boiler 500 MWe Yes Yes 0 44.8% 518.9 MWe
1b SC PF boiler 500 MWe Yes Yes 90% 34.5% 398.9 MWe
2a SC CFB boiler 500 MWe No No 0 45 1% 521 4 MWe2a SC CFB boiler 500 MWe No No 0 45.1% 521.4 MWe
2b SC CFB boiler 500 MWe No Yes 90% 38.8% 390.5 MWe
3a CFB boiler 250 MWe No No 0 41.7% 273.0 MWe
3b CFB boiler 250 MWe No No 90% 25.8% 168.9 MWe
4a BFB boiler 75 MWe No No 0 36.0% 75.8 MWe
4b BFB boiler 75 MWe No No 90% 23.2% 48.9 MWe
30

Economic AssessmentEconomic Assessment
B i A ti & A t C it i• Basic Assumptions & Assessment CriteriaAvailability: 90% (w/o capture) 88% (w/ capture)
Cost of coal: 2.90 €/GJ
Cost of biomass: 8.39 €/GJ
Plant cost: in Euro (May 2009)(1 € = 1.35 US $)
Discount Rate: 10% (Annual Basis)
Plant life: 25 years
CO2 transport cost: Not considered
31

Economic Analysis (cont’d)Estimated CAPEX
Total Investment costMillion of Euro
Specific CostEuro/kW
Case # 1 a 657 21 1267Case # 1 a 657.21 1267Case # 1 b 824.32 2066Case # 2 a 707.28 1357Case # 2 b 918.37 2352Case # 3 a 370.30 1356Case # 3 b 519.73 3077Case # 4 a 185.42 2446Case # 4 b 256 39 5243Case # 4 b 256.39 5243
32

Scenarios ConsideredScenarios Considered
4 scenarios considered for the economical analysis:4 scenarios considered for the economical analysis:Scenario 1: the calculation of the cost of electricity does not include the revenues from the green certificates nor from the ETSthe revenues from the green certificates nor from the ETS mechanism. Scenario 2: the calculation of the cost of electricity only includesScenario 2: the calculation of the cost of electricity only includes the revenues from the green certificates (50 €/MW).Scenario 3: the calculation of the cost of electricity only includes y ythe revenues from the ETS mechanism (14€/t CO2).Scenario 4: the calculation of the cost of electricity includes both the revenues from the green certificates and from the ETS mechanism.
33

For Scenario 01 – No Consideration of ETS or Green Certificate Incentives (Case 1 and 2)
120.0
100.0
without CO2 capture
with CO2 capture
80.0
(€/ M
Wh)
40.0
60.0
velis
ed C
OE
20.0
Le
0.0
500MWe Net Nominal PF Power Plant (Co-firing) 500MWe Net Nominal CFB Power Plant (Co-firing)
34

For Scenario 01 – No Consideration of ETS or Green Certificate Incentives (Case 3 and 4)
300.0
350.0
without CO2 capture
with CO2 capture
250.0
/ MW
h)
150.0
200.0
lised
CO
E (€
/
50.0
100.0Leve
l
0.0
250MWe Net Nominal CFB Power Plant (Biomass) 75MWe Net Nominal BFB Power Plant (Biomass)
35

Economic summaryEconomic summary
120
Electricity Production Cost, Cofiring cases
80
100
Scenario 1
40
60
Scenario 1
Scenario 2
Scenario 3
0
20Scenario 4
0
Case 1a Case 1b Case 2a Case 2b
36International Conference on Greenhouse Gas Technologies (GHGT10) – Amsterdam
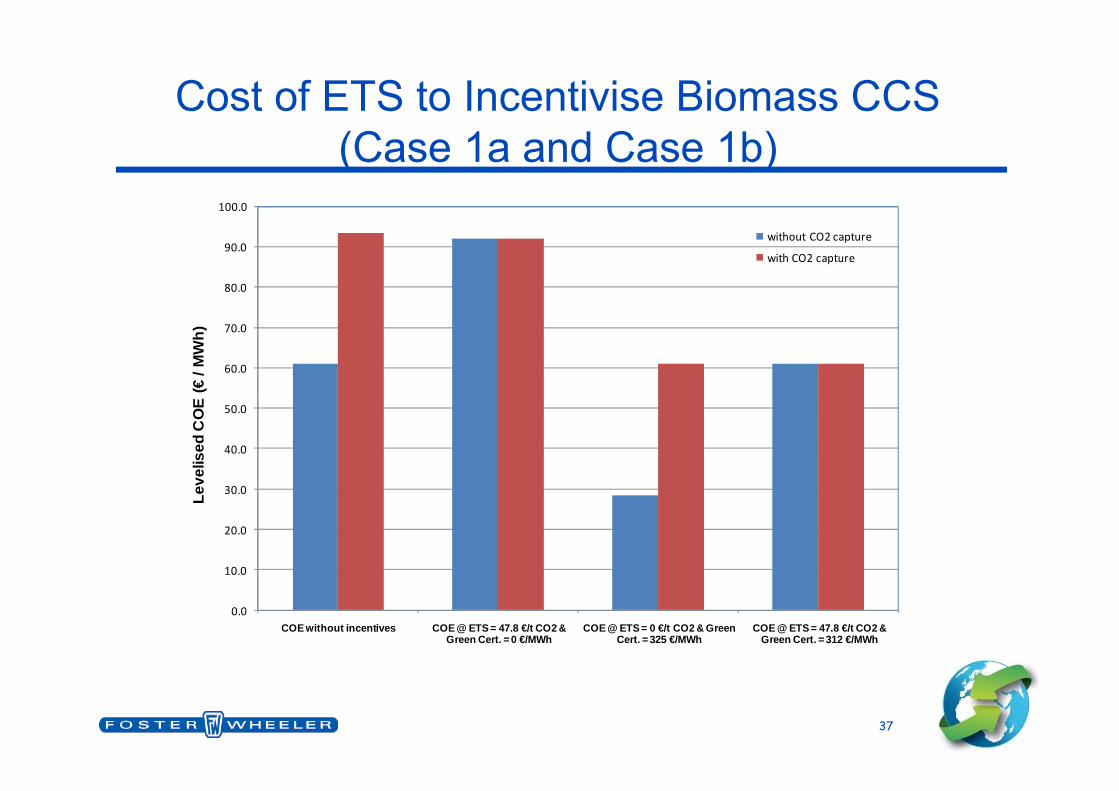
Cost of ETS to Incentivise Biomass CCS(Case 1a and Case 1b)
100.0
80.0
90.0without CO2 capture
with CO2 capture
60.0
70.0
(€/ M
Wh)
40.0
50.0
velis
ed C
OE
10.0
20.0
30.0Lev
0.0COE without incentives COE @ ETS = 47.8 €/t CO2 &
Green Cert. = 0 €/MWhCOE @ ETS = 0 €/t CO2 & Green
Cert. = 325 €/MWhCOE @ ETS = 47.8 €/t CO2 &
Green Cert. = 312 €/MWh
37

Economic summaryEconomic summary
350Electricity Production Cost, 100% biomass cases
200
250
300
Scenario 1
100
150
200 Scenario 1
Scenario 2
Scenario 3
0
50
100Scenario 4
0
Case 3a Case 3b Case 4a Case 4b
38

Cost of ETS to Incentivise Biomass CCS(Case 3a and Case 3b)
200 0
225.0
250.0
without CO2 capture
with CO2 capture
150.0
175.0
200.0
/ MW
h)
100.0
125.0
ised
CO
E (€
50.0
75.0Leve
l
0.0
25.0
COE without incentives COE @ ETS = 0 €/t CO2 & Green Cert = 101 85 €/MWh
COE @ ETS = 64.7 €/t CO2 & Green Cert = 0 €/MWh
COE @ ETS = 64.7 €/t CO2 & Green Cert = 50 €/MWh
39
Cert. = 101.85 €/MWh Green Cert. = 0 €/MWh Green Cert. = 50 €/MWh

Concluding RemarksConcluding Remarks• There is potential for the use of biomass fired power plant with CO2
capture to be economically viablecapture to be economically viable.• The economic viability of capturing CO2 from biomass fired or co-fired power
plant could be dependent on the price of carbon / carbon tax that would incentivise the CO2 negative emissionsincentivise the CO2 negative emissions.
• The study only evaluated the use of virgin wood as biomass feedstock – which is considered more expensive than indigeneous low quality and more difficult burning biomass fuel. This should provide lower biomass fuel cost.
• The capture of CO2 from a biomass fired power plant using MEAThe capture of CO2 from a biomass fired power plant using MEA Solvent, the following should be noted:• it should be expected that the need to treat larger volume of flue gas and a
deeper removal of the SO2 and NOx in the flue gas would contribute to thedeeper removal of the SO2 and NOx in the flue gas would contribute to the reduction of the performance of the plant and increase in cost (CAPEX and OPEX).
• This study only evaluated standard MEA solvent therefore there
40
• This study only evaluated standard MEA solvent – therefore there are room for improvement in terms of cost and efficiency by using advance solvent.