TECHNICOLOR: FULL YEAR 2018 RESULTS · Strategy update • In 2018 Technicolor increased its...
17
1 PRESS RELEASE TECHNICOLOR: FULL YEAR 2018 RESULTS Paris (France), 27 February 2019 – Technicolor (Euronext Paris: TCH; OTCQX: TCLRY) announces today its results for the full year 2018. Full Year 2018 Key Indicators from continuing operations In € million Reported At constant rate 2017 As published in Feb. 2018 2017 (* and **) 2018 As published (* and **) 2018 As published (* and **) 2018 Guidance perimeter (** and ***) Revenues from continuing operations 4,231 4,253 3,988 4,132 4,138 Adjusted EBITDA from continuing operations 291 341 266 284 267 Free Cash Flow from continuing operations 63 109 (43) (34) (51) (*) Technicolor announced on 11 February 2019, its decision to dispose of its Research & Innovation (“R&I”) activity. As a result, the Group reports the financial information of its R&I activity in Discontinued operations. It was previously presented in the Corporate and Other segment. Pursuant to IFRS 5, 2017 accounts have been restated to reclassify R&I activity as discontinued operations. (**) Following the close of the Patent Licensing disposal, Technicolor kept a portion of its Patent Licensing revenues which was not part of the disposal (previously booked in discontinued). As a result, this contribution was retained in 2018 in its continuing results and will be reported in the future in continuing operations. (***) Including contribution of Patent Licensing and “R&I” businesses.
Transcript of TECHNICOLOR: FULL YEAR 2018 RESULTS · Strategy update • In 2018 Technicolor increased its...

1
PRESS RELEASE
TECHNICOLOR: FULL YEAR 2018 RESULTS
Paris (France), 27 February 2019 – Technicolor (Euronext Paris: TCH; OTCQX: TCLRY) announces today
its results for the full year 2018.
Full Year 2018 Key Indicators from continuing operations
In € million Reported At constant rate
2017
As published in
Feb. 2018
2017
(* and **)
2018
As published
(* and **)
2018
As published
(* and **)
2018
Guidance
perimeter
(** and ***)
Revenues from
continuing operations
4,231 4,253 3,988 4,132 4,138
Adjusted EBITDA from
continuing operations
291 341 266 284 267
Free Cash Flow from
continuing operations
63 109 (43) (34) (51)
(*) Technicolor announced on 11 February 2019, its decision to dispose of its Research & Innovation (“R&I”) activity. As
a result, the Group reports the financial information of its R&I activity in Discontinued operations. It was previously
presented in the Corporate and Other segment. Pursuant to IFRS 5, 2017 accounts have been restated to reclassify
R&I activity as discontinued operations.
(**) Following the close of the Patent Licensing disposal, Technicolor kept a portion of its Patent Licensing revenues
which was not part of the disposal (previously booked in discontinued). As a result, this contribution was retained in
2018 in its continuing results and will be reported in the future in continuing operations.
(***) Including contribution of Patent Licensing and “R&I” businesses.
2
Before taking into account the positive impact of the announced disposal of the Research & Innovation
(“R&I”) activity, 2018 Adjusted EBITDA amounted to €267 million at constant rate within the revised
guidance communicated by Technicolor in December 2018 (see reconciliation of 2017 and guidance
perimeter on page 9).
Full Year 2018 Key Highlights
• Revenues from continuing activities were €3,988 million, down 3% year-on-year at constant rate, with
an Adjusted EBITDA of €266 million compared to €341 million in 2017. Sales in the second half of the
year grew by 3% at constant rate, driven in particular by a solid 5% during the last quarter.
• Production Services recorded a solid performance, up 6% year-on-year at constant rate, including 7%
growth during the second half at constant rate. This growth was driven in particular by the Film & TV
Visuals Effects activity resulting from significant capacity expansion throughout the year.
• In DVD Services, revenues declined by 5% at constant rate year-on-year, down 2% in the second half.
The stronger than expected volume decline in 2018, affecting particularly the distribution activity, has
led to a depreciation of the division goodwill. As a result, a non-cash impairment charge of €(77) million
is booked in the 2018 accounts.
• Connected Home revenues totaled €2,218 million in 2018, down 5% year-on-year at constant rate
(mainly due to the year on year decline in the North American video market) but up 5% at constant rate
in the second half.
• Restructuring amounted to €(62) million at current rate, including €(34) million for Connected Home
(pursuant to the three-year transformation plan), and €(26) million, mainly resulting from sites closures
in the US for Post Production and DVD Services.
• Full Year free cash flow from continuing operations (excluding “R&I”) was €(43) million, down by €143
million year-on-year at constant rate, with a second half free cash flow of €94 million.
• Further simplification of the Group’s structure has been achieved, beyond the Patent Licensing activity
disposal, with the announced disposal of its Research & Innovation activity to Interdigital.
• Solid financial structure, with a nominal gross debt of €1,029 million, down €74 million compared to 31
December 2017. The Group also had a strong level of liquidity at the end of December, including cash
on hand of €291 million and committed undrawn credit lines of €394 million.
• Nominal net debt at the end of 2018 amounted to €738 million, €(46) million lower than 2017. This
decrease reflects mainly the positive impact of the €117 million net proceeds from the sale of Patent
Licensing, offset by €(43) million from continuing operations free cash flow , €(17) million of R&I
accounted for in discontinued free cash flow, and others of €(11) million.
Strategy update
• In 2018 Technicolor increased its investments in organic growth in Production Services and in the
transformation program in Connected Home. These initiatives are expected to continue over the next
few years in well-defined areas.
• Specifically:
o The Group will continue to build upon its strong position as worldwide leader in Production
Services by increasing capacity (in particular in India, France, Australia and Canada), while
continuing to improve profitability;

3
o In Connected Home, the benefits from the implementation of the ongoing transformation
plan and the expected improvement in components availability and pricing, will enable the
Group to invest in market share gains in broadband access and Android based video
solutions which will lead to improving margins over the next several years.
o In DVD Services the Group expects to start renewing contracts with its major customers on
improved trading terms over the next several years to reflect structural reductions in
volumes.
Guidance
• The Group will no longer provide specific numerical guidance for the current or future financial years. It
will continue to pursue leverage reduction through improved profitability and cash generation.
Governance
• The Board of directors of Technicolor appointed today Mindy Mount as Vice Chairman of the Board.
This is further to Bruce Hack’s announcement to the Board that he will not apply for the renewal of his
term as Director at the next shareholders’ meeting.
Dividend
• The Board of Directors of Technicolor will not propose a dividend to the 2019 Annual General Meeting
of Shareholders.

4
Segment Review – FY 2018 Result Highlights
Second Half Change HoH Full Year Change YoY
Entertainment Services
In € million (reported)
2017 2018 Reported At constant
rate
2017 2018 Reported At constant
rate
Revenues 952 970 1.9% 1.7% 1,790 1,726 (3.6)% (0.5)%
o/w Production Services
As a % of ES revenues
382
40%
409
42%
6.9%
6.6% 766
43%
785
45%
2.5%
5.6%
DVD Services
As a % of ES revenues
570
60%
562
58%
(1.4)% (1.6)% 1,024
57%
942
55%
(8.1)%
(5.1)%
Adj. EBITDA 152 123 (18.8)% (17.7)% 216 178 (17.6)% (14.8)%
• Production Services revenues were up 5.6% year-on-year at constant rate and increased in the
second half compared to the 2017 second half by 6.6% at constant rate. The division achieved
significant profitability improvement in Film & TV Visual Effects. Capacity increases and related
investments were accelerated in 2018 and are expected to continue in 2019.
Business Highlights:
Film & TV Visual Effects (“VFX”): record year with exceptionally strong double-digit revenue growth
year-on-year, and a robust pipeline of future projects continuing into 2019 (e.g., Disney’s The Lion King
and Dumbo, Fox’s Dark Phoenix, Universal’s The Voyage of Doctor Dolittle, Warner Bros./Legendary’s
Godzilla: King of The Monsters). VFX teams worked on over 40 films in 2018, including completing
major studio features like Warner Bros.’ Aquaman and Disney’s a Wrinkle in Time; and 14 episodic
projects during the year, including the latest seasons of franchises like History’s Vikings and Netflix’s
Narcos;
Advertising VFX: mid-single digit revenue growth year-on-year as The Mill and MPC received numerous
industry accolades including seven Cannes Lions and nine British Arrow Awards. MPC was awarded
VFX Company of the Year at both the Ciclope and Shots awards, while The Mill was recognized by
Televisual as the UK’s #1 Post Production Company for the 10th year in a row. The Advertising segment
saw continued expansion in direct-to-brand capabilities alongside strong growth in emerging
technology/experiential projects;
Animation & Games: lower revenues compared to prior year due primarily to delays in signing new
feature projects. Mikros in 2018 delivered three animated theatrical features (Paramount’s Sherlock
Holmes, Fun Academy’s Sgt. Stubby: An American Hero and M6’s Asterix: The Secret of the Magic
Potion) and is ramping up production on Paramount’s SpongeBob Squarepants animated feature.
Technicolor Animation continues to deliver on high-quality episodic productions for major clients while
Technicolor Games worked on several of the best-selling AAA games of 2018;
Post Production: revenues were down compared to 2017, mainly driven by lower volume, in particular
in localization services and the exit from certain underperforming businesses.
• DVD Services revenues totaled €942 million in 2018, down 5.1% at constant currency compared to
2017. Revenues decreased in the second half compared to the 2017 second half by 1.6% at constant
rate.
5
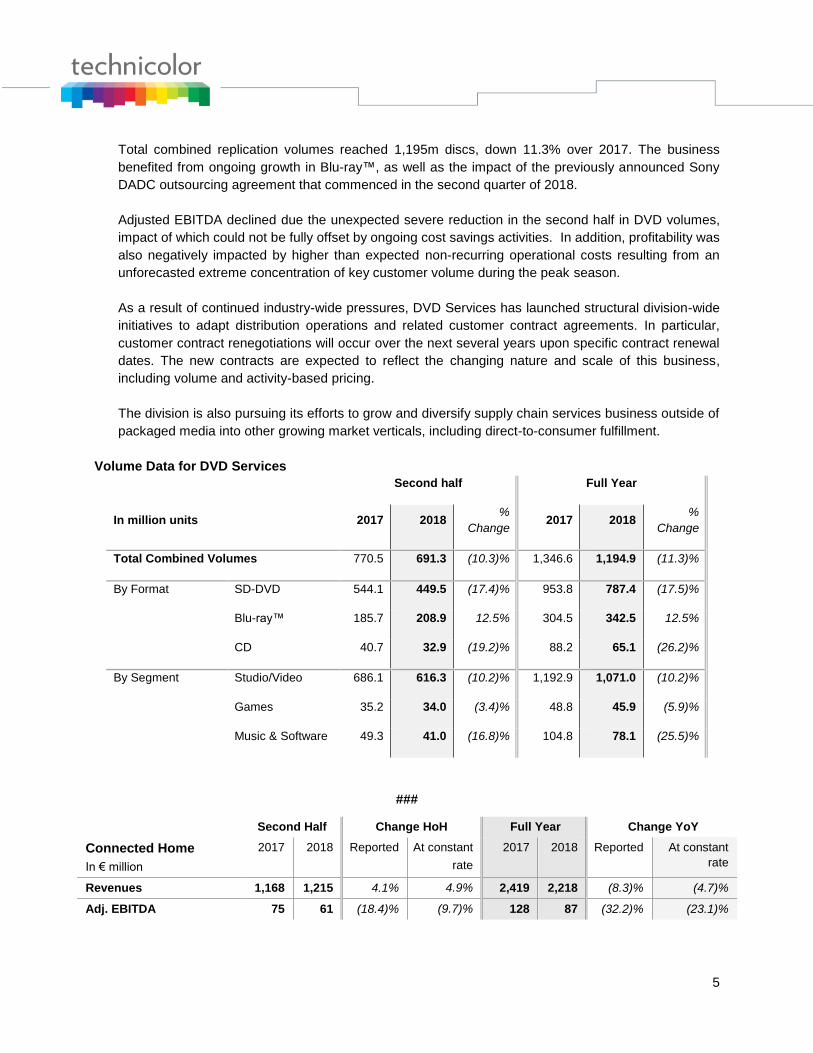
Total combined replication volumes reached 1,195m discs, down 11.3% over 2017. The business
benefited from ongoing growth in Blu-ray™, as well as the impact of the previously announced Sony
DADC outsourcing agreement that commenced in the second quarter of 2018.
Adjusted EBITDA declined due the unexpected severe reduction in the second half in DVD volumes,
impact of which could not be fully offset by ongoing cost savings activities. In addition, profitability was
also negatively impacted by higher than expected non-recurring operational costs resulting from an
unforecasted extreme concentration of key customer volume during the peak season.
As a result of continued industry-wide pressures, DVD Services has launched structural division-wide
initiatives to adapt distribution operations and related customer contract agreements. In particular,
customer contract renegotiations will occur over the next several years upon specific contract renewal
dates. The new contracts are expected to reflect the changing nature and scale of this business,
including volume and activity-based pricing.
The division is also pursuing its efforts to grow and diversify supply chain services business outside of
packaged media into other growing market verticals, including direct-to-consumer fulfillment.
Volume Data for DVD Services
Second half Full Year
In million units 2017 2018 %
Change 2017 2018
%
Change
Total Combined Volumes 770.5 691.3 (10.3)% 1,346.6 1,194.9 (11.3)%
By Format SD-DVD 544.1 449.5 (17.4)% 953.8 787.4 (17.5)%
Blu-ray™ 185.7 208.9 12.5% 304.5 342.5 12.5%
CD 40.7 32.9 (19.2)% 88.2 65.1 (26.2)%
By Segment Studio/Video 686.1 616.3 (10.2)% 1,192.9 1,071.0 (10.2)%
Games 35.2 34.0 (3.4)% 48.8 45.9 (5.9)%
Music & Software 49.3 41.0 (16.8)% 104.8 78.1 (25.5)%
###
Second Half Change HoH Full Year Change YoY
Connected Home
In € million
2017 2018 Reported At constant
rate
2017 2018 Reported At constant
rate
Revenues 1,168 1,215 4.1% 4.9% 2,419 2,218 (8.3)% (4.7)%
Adj. EBITDA 75 61 (18.4)% (9.7)% 128 87 (32.2)% (23.1)%

6
• Connected Home revenues totaled €2,218 million in 2018, down 4.7% year-on-year at constant rate
but increased in the second half compared to 2017 by 4.9% at constant rate. Despite continued market
challenges, the business increased market share throughout the year driven by extremely strong growth
in broadband and Android TV video. At the same time, Connected Home was able to significantly
mitigate another year of heavy components costs increases (net €(45) million year-on-year impact and
€(47) million at constant rate) and the exceptional drop in North American video sales, while continuing
to reduce its fixed cost basis.
Business Highlights
North America: revenues with North American customers were down compared to 2018 driven by
lower video demand from Charter and AT&T and the impact of severe component shortages on
deliveries.
During 2018, Technicolor was the sole supplier of DOCSIS 3.1 gateways to Comcast and Syndication
customers and started shipping DOCSIS 3.1 in volume to Charter, vaulting Technicolor to become the
undisputed leader of DOCSIS 3.1 worldwide.
Europe, Middle-East & Africa, Asia-Pacific and Latin America: High single digit revenue growth due
to large orders from the 50+ customers that the Group is focusing on.
The component environment and regulatory framework was challenging in 2018. As previously
communicated, the Group reinvoiced the vast majority of identifiable cost increases to its clients in the
second half of 2018.
Revenue Breakdown for Connected Home
Second half Full Year
In € million 2017 2018 % Change1 2017 2018 % Change2
Total revenues 1,167 1,215 4.9% 2,419 2,218 (4.7)%
By region North America 574 561 (3.5)% 1,364 1,033 (21.3)%
Europe, Middle-
East and Africa 242 265 9.8% 434 460 6.0%
Latin America
Asia-Pacific
155
197
168
221
16.4%
14.3%
324
297
327
398
11.6%
38.7%
By product Video 834 535 (27.9)% 1,582 1,078 (25.1)%
Broadband 333 680 87.6% 837 1,140 34.1%
Adjusted EBITDA amounted to €87 million, or 3.9% of revenue, down €41 million at current rate year-on-
year. The margin decline was driven by the gross margin squeeze resulting mainly from net component
1 Change at constant currency. 2 Change at constant currency.
7
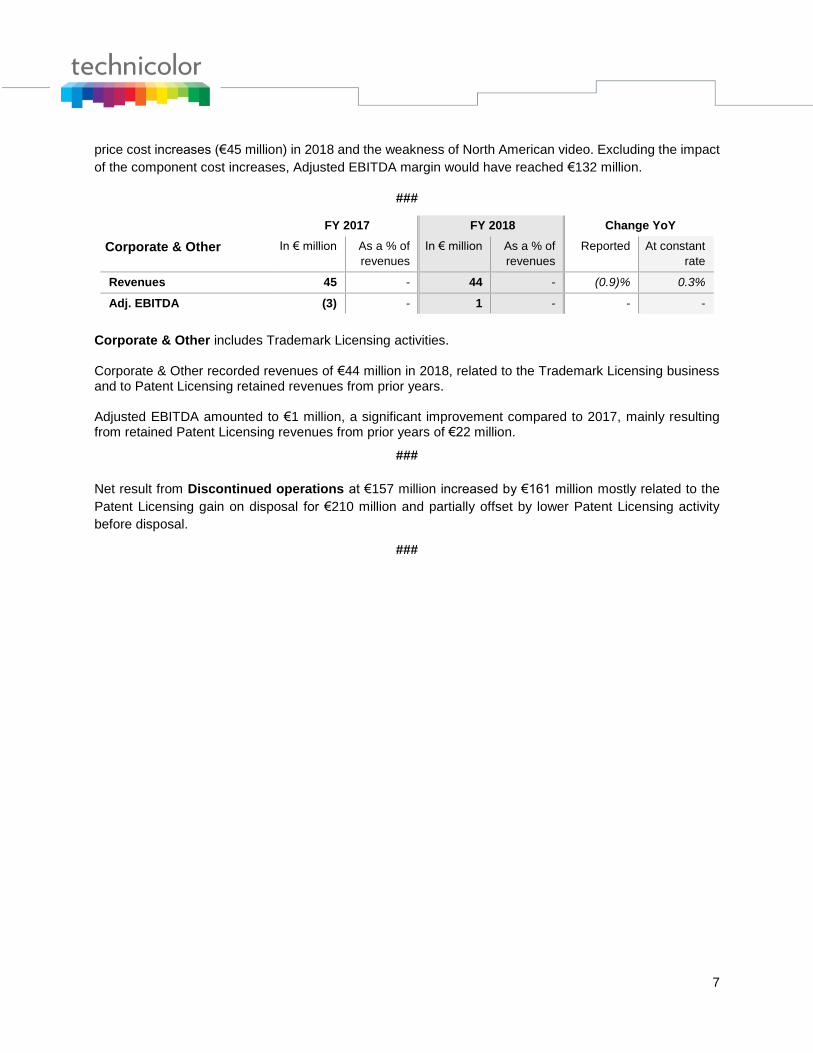
price cost increases (€45 million) in 2018 and the weakness of North American video. Excluding the impact
of the component cost increases, Adjusted EBITDA margin would have reached €132 million.
###
FY 2017 FY 2018 Change YoY
Corporate & Other In € million As a % of
revenues
In € million As a % of
revenues
Reported At constant
rate
Revenues 45 - 44 - (0.9)% 0.3%
Adj. EBITDA (3) - 1 - - -
Corporate & Other includes Trademark Licensing activities. Corporate & Other recorded revenues of €44 million in 2018, related to the Trademark Licensing business and to Patent Licensing retained revenues from prior years. Adjusted EBITDA amounted to €1 million, a significant improvement compared to 2017, mainly resulting from retained Patent Licensing revenues from prior years of €22 million.
###
Net result from Discontinued operations at €157 million increased by €161 million mostly related to the
Patent Licensing gain on disposal for €210 million and partially offset by lower Patent Licensing activity
before disposal.
###

8
Summary of consolidated results for the full year of 2018
Second Half Full Year
In € million 2017 2018 Change3 2017 2018 Change4
Revenues from continuing operations 2,150 2,215 3.0% 4,253 3,988 (6.2)%
Change at constant currency (%) 3.4% (2.9)%
o/w Production Services 382 409 6.9% 766 785 2.5%
DVD Services
Connected Home
570
1,168
562
1,215
(1.4)%
4.1%
1,024
2,419
942
2,218
(8.1)%
(8.3)%
Corporate & Other 30 29 - 45 44 -
Adjusted EBITDA from continuing operations 239 194 (19.0)% 341 266 (21.8)%
Change at constant currency (%) (15.4)% (16.6)%
As a % of revenues 11.1% 8.7% - 8.0% 6.7% -
o/w Entertainment Services 152 123 (18.8)% 216 178 (17.6)%
Connected Home 75 61 (18.4)% 128 87 (32.2)%
Corporate & Other 12 9 - (3) 1 -
Adjusted EBIT from continuing operations 109 80 (26.5)% 103 48 (52.9)%
Change at constant currency (%) (17.8)% (42.6)%
As a % of revenues 5.1% 3.6% - 2.4% 1.2% -
EBIT from continuing operations 78 (28) - 40 (119) -
Change at constant currency (%) - -
As a % of revenues 3.6% (1.3)% - 0.9% (3.0)% -
Financial result (34) (31) 9.7% (96) (51) 47.3%
Income tax (107) (44) 58.5% (112) (54) 52.6%
Share of profit/(loss) from associates 1 (1) -
Profit/(loss) from continuing operations (63) (104) (64.8)% (168) (224) (33.9)%
Profit/(loss) from discontinued operations (4) 188 - (5) 157 -
Net income (67) 84 - (173) (67) -
Depreciation and Amortization (“D&A”) amounted to €(218) million compared to €(238) million in 2017. D&A
included €(50) million of amortization related to purchase price allocation, mostly due to the 2015
acquisitions (Cisco Connected Devices, The Mill and Cinram North America). As a result, the Adjusted EBIT
from continuing operations amounted to €48 million, down by 53% year-on-year at current rate.
Restructuring provisions amounted to €(62) million at current rate and related to Entertainment Services
(Post Production and DVD Services site closures, both in the US), and Connected Home.
The EBIT from continuing operations amounted to a loss of €(119) million in 2018.
3 Year-on-year change at current currency. 4 Year-on-year change at current currency.
9
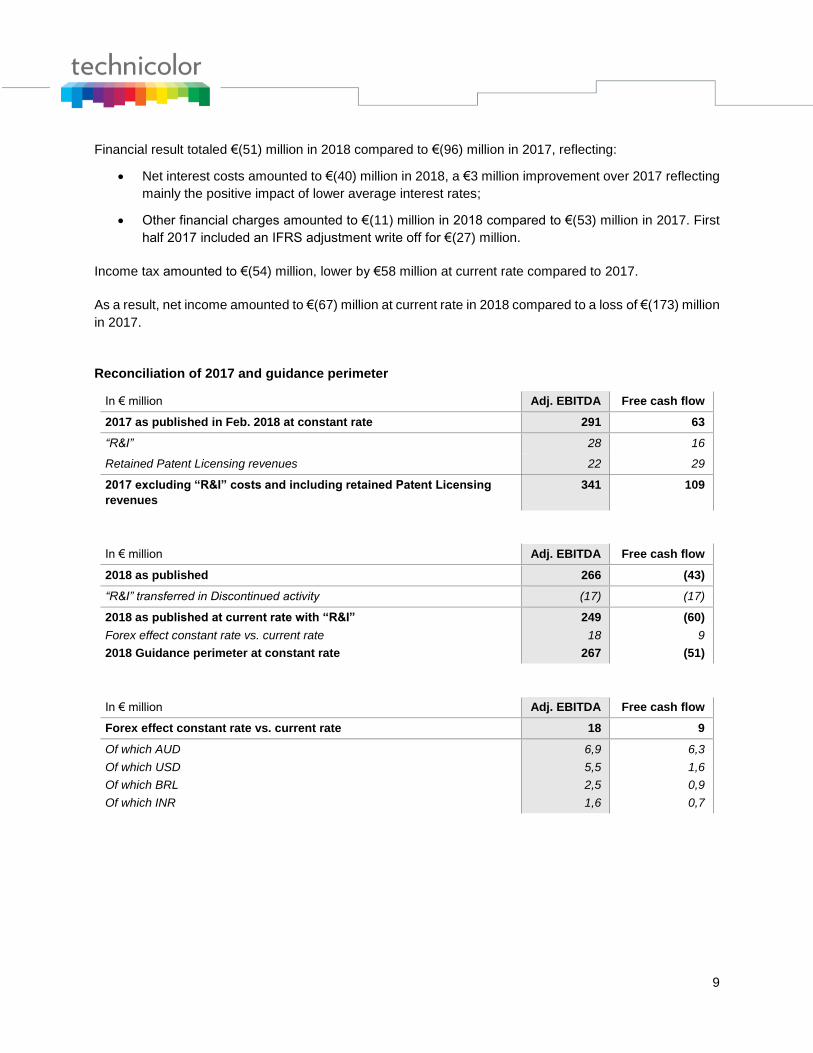
Financial result totaled €(51) million in 2018 compared to €(96) million in 2017, reflecting:
• Net interest costs amounted to €(40) million in 2018, a €3 million improvement over 2017 reflecting
mainly the positive impact of lower average interest rates;
• Other financial charges amounted to €(11) million in 2018 compared to €(53) million in 2017. First
half 2017 included an IFRS adjustment write off for €(27) million.
Income tax amounted to €(54) million, lower by €58 million at current rate compared to 2017.
As a result, net income amounted to €(67) million at current rate in 2018 compared to a loss of €(173) million
in 2017.
Reconciliation of 2017 and guidance perimeter
In € million Adj. EBITDA Free cash flow
2017 as published in Feb. 2018 at constant rate 291 63
“R&I” 28 16
Retained Patent Licensing revenues 22 29
2017 excluding “R&I” costs and including retained Patent Licensing
revenues
341 109
In € million Adj. EBITDA Free cash flow
2018 as published 266 (43)
“R&I” transferred in Discontinued activity (17) (17)
2018 as published at current rate with “R&I”
Forex effect constant rate vs. current rate
2018 Guidance perimeter at constant rate
249
18
267
(60)
9
(51)
In € million Adj. EBITDA Free cash flow
Forex effect constant rate vs. current rate 18 9
Of which AUD
Of which USD
Of which BRL
Of which INR
6,9
5,5
2,5
1,6
6,3
1,6
0,9
0,7
10
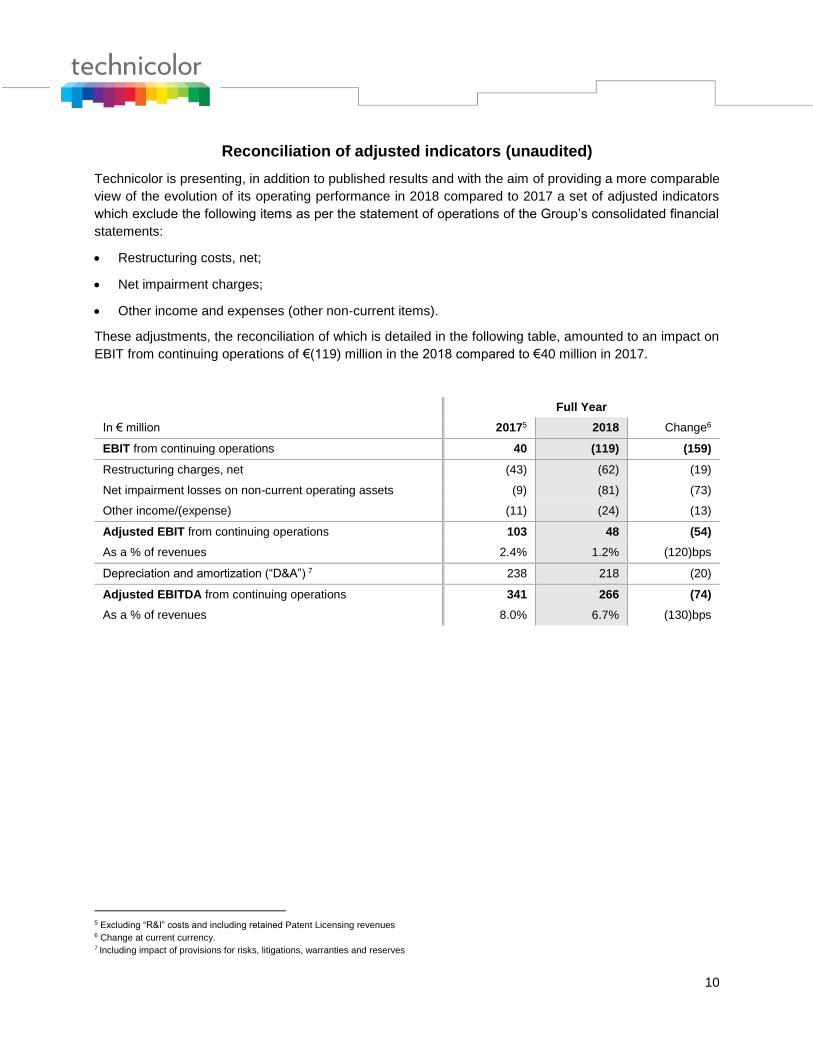
Reconciliation of adjusted indicators (unaudited)
Technicolor is presenting, in addition to published results and with the aim of providing a more comparable
view of the evolution of its operating performance in 2018 compared to 2017 a set of adjusted indicators
which exclude the following items as per the statement of operations of the Group’s consolidated financial
statements:
• Restructuring costs, net;
• Net impairment charges;
• Other income and expenses (other non-current items).
These adjustments, the reconciliation of which is detailed in the following table, amounted to an impact on
EBIT from continuing operations of €(119) million in the 2018 compared to €40 million in 2017.
Full Year
In € million 20175 2018 Change6
EBIT from continuing operations 40 (119) (159)
Restructuring charges, net (43) (62) (19)
Net impairment losses on non-current operating assets (9) (81) (73)
Other income/(expense) (11) (24) (13)
Adjusted EBIT from continuing operations 103 48 (54)
As a % of revenues 2.4% 1.2% (120)bps
Depreciation and amortization (“D&A”) 7 238 218 (20)
Adjusted EBITDA from continuing operations 341 266 (74)
As a % of revenues 8.0% 6.7% (130)bps
5 Excluding “R&I” costs and including retained Patent Licensing revenues 6 Change at current currency. 7 Including impact of provisions for risks, litigations, warranties and reserves
11
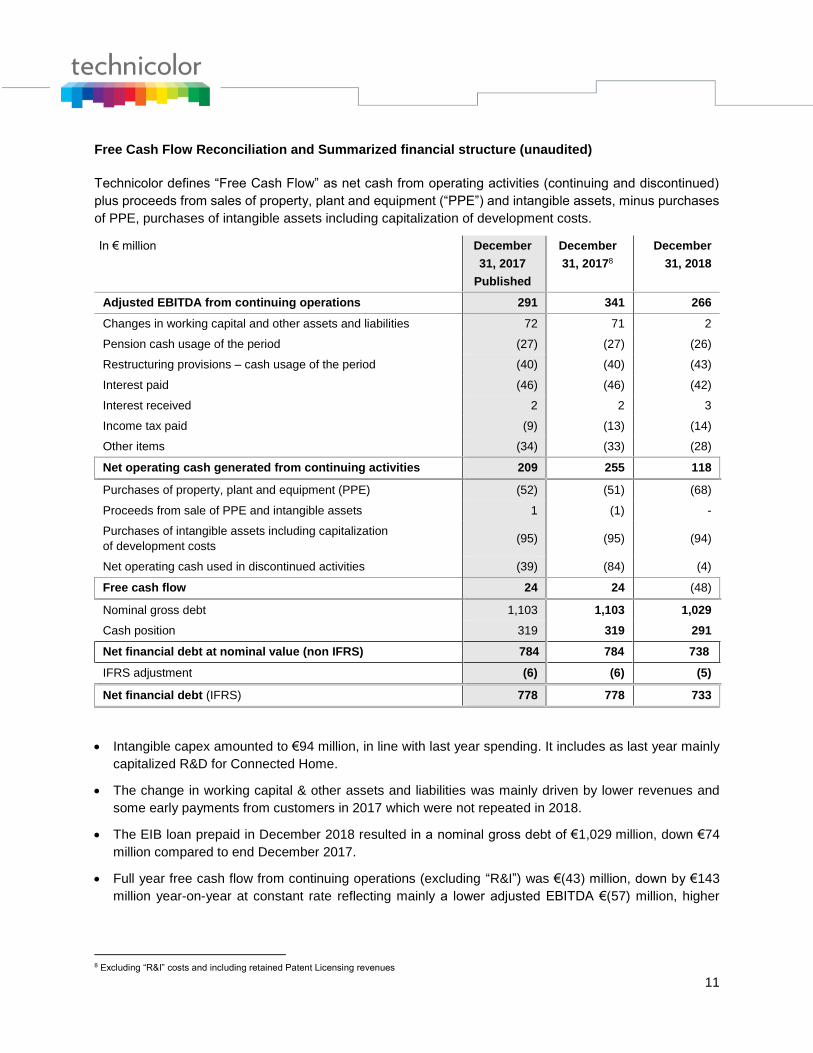
Free Cash Flow Reconciliation and Summarized financial structure (unaudited)
Technicolor defines “Free Cash Flow” as net cash from operating activities (continuing and discontinued)
plus proceeds from sales of property, plant and equipment (“PPE”) and intangible assets, minus purchases
of PPE, purchases of intangible assets including capitalization of development costs.
In € million December
31, 2017
Published
December
31, 20178
December
31, 2018
Adjusted EBITDA from continuing operations 291 341 266
Changes in working capital and other assets and liabilities 72 71 2
Pension cash usage of the period (27) (27) (26)
Restructuring provisions – cash usage of the period (40) (40) (43)
Interest paid (46) (46) (42)
Interest received 2 2 3
Income tax paid (9) (13) (14)
Other items (34) (33) (28)
Net operating cash generated from continuing activities 209 255 118
Purchases of property, plant and equipment (PPE) (52) (51) (68)
Proceeds from sale of PPE and intangible assets 1 (1) -
Purchases of intangible assets including capitalization
of development costs (95) (95) (94)
Net operating cash used in discontinued activities (39) (84) (4)
Free cash flow 24 24 (48)
Nominal gross debt 1,103 1,103 1,029
Cash position 319 319 291
Net financial debt at nominal value (non IFRS) 784 784 738
IFRS adjustment (6) (6) (5)
Net financial debt (IFRS) 778 778 733
• Intangible capex amounted to €94 million, in line with last year spending. It includes as last year mainly
capitalized R&D for Connected Home.
• The change in working capital & other assets and liabilities was mainly driven by lower revenues and
some early payments from customers in 2017 which were not repeated in 2018.
• The EIB loan prepaid in December 2018 resulted in a nominal gross debt of €1,029 million, down €74
million compared to end December 2017.
• Full year free cash flow from continuing operations (excluding “R&I”) was €(43) million, down by €143
million year-on-year at constant rate reflecting mainly a lower adjusted EBITDA €(57) million, higher
8 Excluding “R&I” costs and including retained Patent Licensing revenues

12
capex cash outflow €(21) million at constant rate, lower financial interest paid of €18 million and a lower
negative variation of working capital of €70 million.
• Cash position at €291 million at end December 2018, up €94 million compared to end June 2018, at
€197 million.
The board of directors approved today these consolidated financial statements which have been audited by
our statutory auditors who are in the process of issuing an unqualified opinion.

13
An analyst audio webcast hosted by Frederic Rose, CEO, and Laurent Carozzi, CFO, will be held
Wednesday, 27 February 2019 at 6:30pm CET.
Link to the Audio Webcast
http://www.technicolor.com/webcastFY2018 (The presentation slides will be made available on our website prior to the webcast)
The replay will be available at the latest by 9:30pm (CET) on February 27, 2019
Financial calendar
Q1 2019 business update 24 April 2019
H1 2019 results 24 July 2019
###
Warning: Forward Looking Statements
This press release contains certain statements that constitute "forward-looking statements", including but not limited to
statements that are predictions of or indicate future events, trends, plans or objectives, based on certain assumptions
or which do not directly relate to historical or current facts. Such forward-looking statements are based on management's
current expectations and beliefs and are subject to a number of risks and uncertainties that could cause actual results
to differ materially from the future results expressed, forecasted or implied by such forward-looking statements. For a
more complete list and description of such risks and uncertainties, refer to Technicolor’s filings with the French Autorité
des marchés financiers.
###
About Technicolor
Technicolor, a worldwide technology leader in the media and entertainment sector, is at the forefront of digital innovation.
Our world class research and innovation laboratories enable us to lead the market in delivering advanced video services
to content creators and distributors. Our commitment: supporting the delivery of exciting new experiences for consumers
in theaters, homes and on-the-go.
www.technicolor.com – Follow us: @Technicolor – linkedin.com/company/technicolor
Technicolor shares are on the NYSE Euronext Paris exchange (TCH) and traded in the USA on the OTCQX
marketplace (OTCQX: TCLRY).
Investor Relations
Christophe Le Mignan : +33 1 88 24 32 83 [email protected]

14
CONSOLIDATED STATEMENT OF OPERATIONS
December 31,
(€ in million) 2018 20179
CONTINUING OPERATIONS
Revenues 3,988 4,253
Cost of sales (3,521) (3,651)
Gross Margin 467 602
Selling and administrative expenses (292) (350)
Research and development expenses (127) (149)
Restructuring costs (62) (43)
Net impairment gains (losses) on non-current operating assets
(81)
(9)
Other income (expense) (24) (11)
Earning before Interest & Tax from continuing operations
(119)
40
Interest income 3 3
Interest expense (43) (46)
Other financial income (expense) (11) (53)
Net financial income (expense) (51) (96)
Share of gain (loss) from associates - -
Income tax (54) (112)
Profit (loss) from continuing operations (224)
(168)
DISCONTINUING OPERATIONS
Net profit (loss) from discontinuing operations 157 (5)
Net income (loss) (67)
(173)
Attributable to:
- Equity holders of the parent (68) (172)
- Non-controlling interest 1 (1)
EARNINGS PER SHARE December 31,
(in euro, except number of shares) 2018 2017
Weighted average number of shares outstanding (basic net of treasury shares held)
413 440 227
412 716 772
Earnings (losses) per share from continuing operations
- basic (0,54) (0,41)
- diluted (0,54) (0,41)
Earnings (losses) per share from discontinuing operations
- basic 0,38 (0,01)
- diluted 0,38 (0,01)
Total earnings (losses) per share
- basic (0,16) (0,42)
- diluted (0,16) (0,42)
9 Excluding “R&I” costs and including retained Patent Licensing revenues

15
CONSOLIDATED STATEMENT OF FINANCIAL POSITION
(€ in million)
December 31, 2018
December 31, 201710
ASSETS
Goodwill 886
942
Intangible assets 705 625
Property, plant & equipment 233 243
Other operating non-current assets 41 38
TOTAL OPERATING NON-CURRENT ASSETS 1,865 1,848
Investments and available-for-sale financial assets
14
17
Other non-current financial assets 10 19
TOTAL FINANCIAL NON-CURRENT ASSETS 24 36
Investments in associates and joint-ventures
2
2
Deferred tax assets 210 275
TOTAL NON-CURRENT ASSETS 2,101 2,161
Inventories 268 238
Trade accounts and notes receivable 677 684
Contract Assets 77 23
Other operating current assets 264 233
TOTAL OPERATING CURRENT ASSETS 1,286 1,178
Income tax receivable 40 37
Other financial current assets 14 10
Cash and cash equivalents 291 319
Assets classified as held for sale 28 7
TOTAL CURRENT ASSETS 1,658 1,551
TOTAL ASSETS 3,759 3,712
10 Excluding “R&I” costs and including retained Patent Licensing revenues
16
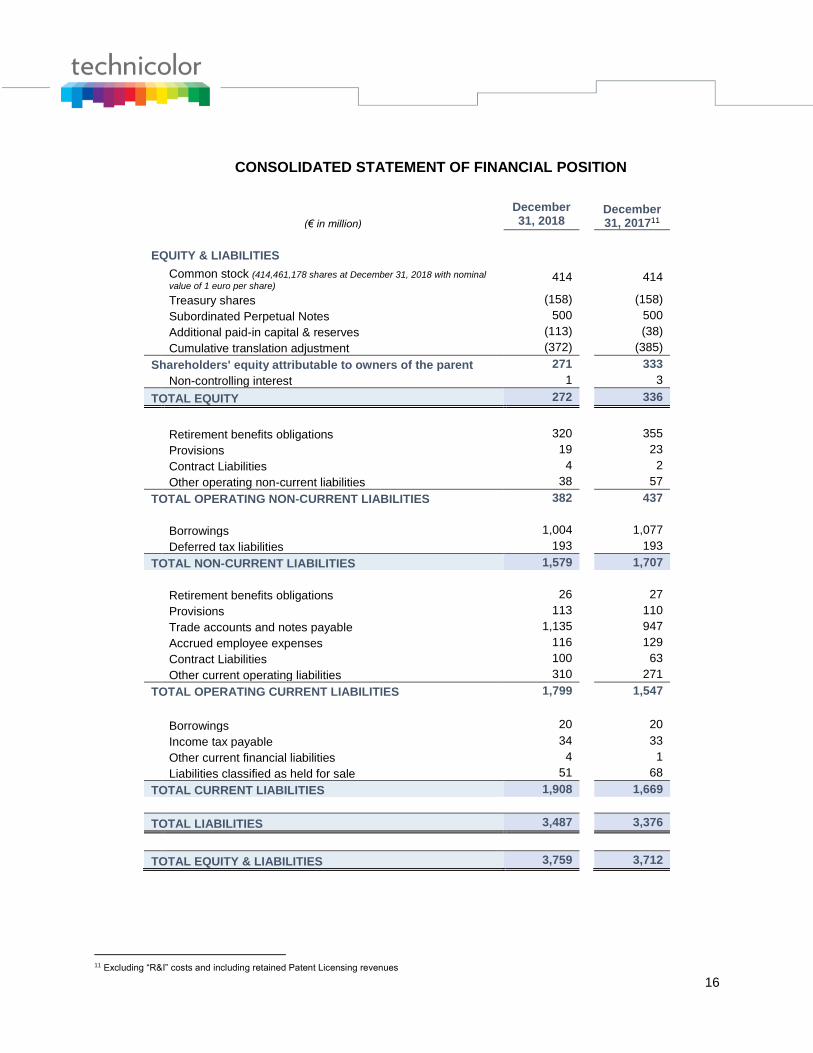
CONSOLIDATED STATEMENT OF FINANCIAL POSITION
(€ in million)
December 31, 2018
December 31, 201711
EQUITY & LIABILITIES
Common stock (414,461,178 shares at December 31, 2018 with nominal
value of 1 euro per share) 414 414
Treasury shares (158) (158)
Subordinated Perpetual Notes 500 500
Additional paid-in capital & reserves (113) (38)
Cumulative translation adjustment (372) (385)
Shareholders' equity attributable to owners of the parent 271 333
Non-controlling interest 1 3
TOTAL EQUITY 272 336
Retirement benefits obligations 320 355
Provisions 19 23
Contract Liabilities 4 2
Other operating non-current liabilities 38 57
TOTAL OPERATING NON-CURRENT LIABILITIES 382 437
Borrowings 1,004 1,077
Deferred tax liabilities 193 193
TOTAL NON-CURRENT LIABILITIES 1,579 1,707
Retirement benefits obligations 26 27
Provisions 113 110
Trade accounts and notes payable 1,135 947
Accrued employee expenses 116 129
Contract Liabilities 100 63
Other current operating liabilities 310 271
TOTAL OPERATING CURRENT LIABILITIES 1,799 1,547
Borrowings 20 20
Income tax payable 34 33
Other current financial liabilities 4 1
Liabilities classified as held for sale 51 68
TOTAL CURRENT LIABILITIES 1,908 1,669
TOTAL LIABILITIES 3,487 3,376
TOTAL EQUITY & LIABILITIES 3,759 3,712
11 Excluding “R&I” costs and including retained Patent Licensing revenues

17
CONSOLIDATED STATEMENT OF CASH FLOWS
December 31,
(€ in million) 2018
201712
Net income (loss) (67) (173)
Income (loss) from discontinuing activities 157 (5)
Profit (loss) from continuing activities (224) (168)
Summary adjustments to reconcile profit from continuing activities to cash generated from continuing operations
Depreciation and amortization 234 240
Impairment of assets 91 9
Net changes in provisions (14) (37)
Gain (loss) on asset disposals (8) (1)
Interest (income) and expense 40 43
Other non-cash items (including tax) 50 155
Changes in working capital and other assets and liabilities 2 71
Cash generated from continuing activities 171 312
Interest paid (42) (46)
Interest received 3 2
Income tax paid (14) (13)
NET OPERATING CASH GENERATED FROM CONTINUING ACTIVITIES (I) 118 255
Acquisition of subsidiaries associates and investments, net of cash acquired
1
(25)
Proceeds from sale of investments, net of cash 5 10
Purchases of property, plant and equipment (PPE) (68) (51)
Proceeds from sale of PPE and intangible assets - 1
Purchases of intangible assets including capitalization of development costs
(94)
(95)
Cash collateral and security deposits granted to third parties (3) (1)
Cash collateral and security deposits reimbursed by third parties 3 9
Loans (granted to)/reimbursed by third parties - 1
NET INVESTING CASH USED IN CONTINUING ACTIVITIES (II) (156) (151)
Increase of Capital - 1
Proceeds from borrowings - 646
Repayments of borrowings (116) (616)
Fees paid linked to the debt (3) (3)
Dividends and distributions paid to Group's shareholders - (25)
Other 23 (32)
NET FINANCING CASH USED IN CONTINUING ACTIVITIES (III) (96) (29)
NET CASH FROM DISCONTINUED ACTIVITIES (IV) 105 (88)
CASH AND CASH EQUIVALENTS AT THE BEGINING OF THE YEAR 319 371
Net decrease in cash and cash equivalents (I+II+III+IV) (29) (13)
Exchange gains/(losses) on cash and cash equivalents 1 (39)
CASH AND CASH EQUIVALENTS AT THE END OF THE YEAR 291 319
12 Excluding “R&I” costs and including retained Patent Licensing revenues