
TECHNICAL ZA 2014 - WWFawsassets.wwf.org.za/downloads/enabling_re_in_sa.pdf · TECHNICAL REPORT...
68
© Global Warming Images / WWF-Canon ZA 2014 TECHNICAL REPORT Enabling Renewable Energy in South Africa: Assessing the Renewable Energy Independent Power Producer Procurement Programme Climate and Energy
-
Upload
duongkhanh -
Category
Documents
-
view
214 -
download
0
Transcript of TECHNICAL ZA 2014 - WWFawsassets.wwf.org.za/downloads/enabling_re_in_sa.pdf · TECHNICAL REPORT...

© Gl
obal W
arming
Image
s / W
WF-Ca
non
©
ZA
2014
TECHNICAL REPORT
Enabling Renewable Energy in South Africa: Assessing the Renewable Energy Independent Power Producer Procurement Programme
Climate and Energy

2
ABOUT WWFWWF is one of the world’s largest and most experienced independent conservation organisation, with over 5 million supporters and a global network active in more than 100 countries.
WWF’s mission is to stop the degradation of the planet’s natural environment and to build a future in which humans live in harmony with nature, by conserving the world’s biological diversity, ensuring that the use of renewable natural resources is sustainable, and promoting the reduction of pollution and wasteful consumption.
CREDITSAuthor: P. Papapetrou (Arista Capital Advisors)Editor: Lee CahillDesigner: Michelle Heyns, Apula
ACKNOWLEDGEMENTSThe financial support provided by WWF-SA for this research is gratefully acknowledged. The author would also like to acknowledge and thank the wide range of local experts, interested and affected parties, and other stakeholders in the renewable energy sector for the deep insights and constructive suggestions offered during the compilation of this report. Peer reviews of sections of the paper by the WWF team, Mike Mulcahy, Christopher North, and others were also much appreciated. Any errors contained in the document remain the responsibility of the author. Designed by ApulaPublished in September 2014 by WWF-SA – World Wide Fund for Nature (formerly World Wildlife Fund), South Africa.© Text 2014 WWF-SAAll rights reserved

3
TABLE OF CONTENTSList of Abbreviations 4
Introduction 5
Non-financial aspects of REIPPPP 9 Overview of the non-financial aspects of REIPPPP 9 A decade of renewable energy ambitions 9 The game-changing REIPPPP 9 The success of the Programme – overarching goals and high level outcomes 12 Challenges and consequences of the non-financial aspects of REIPPPP 13 Setting the tariff caps in Round 1 14 Financial burden on the private sector – risk versus return 15 Ambitious pace of development 19 Grid connection 20 Setting appropriate PPA terms 25 Local content 26
Financial aspects of REIPPPP 30 Overview of the financial aspects of REIPPPP 30 Total financing required for REIPPPP projects and sources thereof 30 Key REIPPPP financial qualification criteria 33 Status quo financing: project financing in the South African market 33 Challenges and consequences in the current funding model 39 Financial close and market movements 39 Foreign exchange exposure 41 Interest rates and inflation exposure 46 Diversification of funding sources 50 BBBEE finance 56 Refinancing 58
Conclusion and Outlook 60 A coherent policy framework 60
A successful partnership 60 Skills transfer 61 The way forward 61
Appendices 63

4
LIST OF ABBREVIATIONSBBBEE Broad-Based Black Economic EmpowermentBEE Black Economic EmpowermentCEL Cost Estimate LetterCOD Commercial Operation DateCP Conditions PrecedentCPI Consumer Price IndexCPV Concentrating PhotovoltaicCSP Concentrated Solar PowerDBSA Development Bank of Southern AfricaDEA Department of Environmental AffairsDFI Development Finance InstitutionDOE Department of EnergyDWA Department of Water AffairsECA Export Credit AgencyEIA Environmental Impact AssessmentEPC Engineering, Procurement and ConstructionFC Financial CloseFX Foreign ExchangeGW GigawattGWh Gigawatt-hourIDC Industrial Development CorporationIPP Independent Power ProducerIRP Integrated Resource PlanIRR Internal Rate of ReturnJIBAR Johannesburg Interbank Agreed RatekW KilowattkWh Kilowatt-hourMLP Master Limited PartnershipMOI Memorandum of IncorporationMW MegawattMWh Megawatt-hourMYPD Multi-Year Price DeterminationNCCR National Climate Change ResponseNERSA National Energy Regulator of South AfricaO&M Operations & MaintenancePB Preferred BidderPIC Public Investment CorporationPPA Power Purchase AgreementPPP Public Private PartnershipPPPFA Preferential Procurement Policy Framework Act PV PhotovoltaicRE Renewable EnergyREDZ Renewable Energy Development ZonesREFIT Renewable Energy Feed-In Tariff ProgrammeREIPPPP Renewable Energy Independent Power Producer Procurement ProgrammeREIT Real Estate Investment TrustRFP Request for ProposalSBO Single Buyer OfficeSEGS Solar Energy Generating SystemsZAR South African RandZDE Zones de Développement Éolien (Wind Energy Areas)

5
1 Energy Price War Looms”, Business Day, 13 November 2013.2 Nersa System Adequacy Outlook, Issue 3: 30 October 2013.
4 Based on current total grid capacity of 43 GW.5 “IRP 2010 update” (Department of Energy, 21 November 2013).6 “Includes 100 MW of small projects with maximum installed capacity of 5 MW, per the original RFP.7 In the RFP, updated for Round 4, the DOE anticipates that there will be a maximum of six bidding rounds.
3 Various Eskom System Status Bulletins, 2013-2014.
INTRODUCTIONFor the greater part of the last decade, South Africa has been battling with a power supply crisis. The state of the electricity deficit reached a critical level in 2008, when the public power utility Eskom was forced to implement a load-shedding (black-out) schedule to prevent a shutdown of the national grid, costing the economy an estimated 50 billion rand1 and denting investor confidence.
Load-shedding was implemented again in March 2014, providing a further reminder of the critical levels of power supply currently available through Eskom. While Eskom’s official reserve margin is forecast at nearly 20% in 20142, significant unplanned outages and maintenance downtime have resulted in actual electricity reserve margins frequently dipping below 1%3, well below the international norm of 15%.
South Africa has recognised the need to move towards a sustainable energy future, and is making strides to revolutionise its power sector at a record-setting pace.
Motivated by an urgent need for new generation capacity to alleviate energy constraints, as well as mounting international pressure to decarbonise its energy supply, the Government of South Africa (the Government) has set a target to generate 45%4 of all new electricity from renewable sources by 2030 in its latest updated Integrated Resource Plan (IRP, 2010 updated in November 2013). This includes a commitment to install 17,430 megawatts (MW) of wind and solar-generated energy, from a total projected capacity of approximately 81,350 MW5.
With this ambitious goal in mind, the DOE issued an RFP for REIPPPP on 3 August 2011. The RFP called for 3,725 MW6 of renewable energy (RE) projects to be procured from the private sector over five rounds, subject to minimum qualification criteria and a competitive bidding process. With only a handful of small IPPs existing, no history of large-scale renewable energy installations, and an astonishingly short timeline of three months to submit first round bids, South Africa surprised the international RE stage with its call to perform at an unprecedented scale and pace.
Notwithstanding this tall order, South Africa has successfully procured approximately 3,920 MW in only three bidding rounds and across 64 renewable energy projects, in just over two years since the inception of the Programme. While already surpassing the original targets stipulated in the initial RFP, the Government has further extended the Programme with the intention of procuring nearly three gigawatts (GW) of additional RE capacity over a maximum of three more bidding rounds7. The latest round of bidding (Round 4), which took place on 18 August 2014, has made available 1,105MW and is already said to be significantly oversubscribed. This anecdotal evidence suggests that the Programme has hitherto been largely successful, which accords with consensus amongst the RE community through conferences and in the media (based on discussions with various RE stakeholders, including financiers, developers, sponsors and government representatives).
Of the total procured megawatts, 28 projects (representing 1,416 MW of capacity) were awarded in Round 1 and are due to come on line by 2014/2015; 19 projects (1,044 MW) in Round 2, by 2016; 17 projects (1,456 MW) in Round 3, by 2017 (with the exception of Concentrated Solar Power (CSP) technologies, which will come on line by 2018). In 2014, an additional 200 MW has been allocated for procurement from a CSP-specific Round (so-called ‘Round 3.5’) in March; and an additional

6 8 Discussions with Eskom Network Planning Unit.9 Includes 100 MW of small projects with maximum installed capacity of 5 MW, per the original RFP.
1,105 MW (590 MW onshore wind; 400 MW solar PV; 40 MW biomass; 15 MW landfill gas; 60 MW small hydro), from Round 4 in August. The DOE has delayed the announcement of Preferred Bidders for Round 3.5, and the announcement of Preferred Bidders from Round 4 is expected on 25 November 2014. If all available megawatts from Rounds 3.5 and 4 are procured, this will bring the total committed allocation of renewable energy to over 5.2 GW, with the megawatts procured in 2014 expected to begin commercial operation before the end of 2020. As of 15 September 2014, 33 projects representing 1,670 MW of renewable energy capacity, are fully on line and connected to the grid.8
The results of the first three rounds are shown in Table [1] below and discussed in further detail in this research paper.
Table 1: Review of REIPPPP ROUNDS 1, 2 & 3 Results
Source: Department of Energy presentations, May 2012 and November 2013
1. Prices are averaged and fully indexed based on April 2011 for comparison purposes2. Due to changes in tariff structure, CSP tariffs in Round 2 and Round 3 are not directly comparable3. In some cases, more megawatts have been awarded to a technology than originally allocated. The DOE reserves the
right in the RFP to reallocate megawatts to different technologies.
With the completion of Round 3, the Programme has exceeded the First Determination of the Minister of Energy (the Minister) to procure 3,725 MW9. Given increasing demand for affordable renewable energy generation, former Minister of Energy Dipuo Peters issued a Second Determination for an additional 3,200 MW to be procured from IPPs. Following Round 4 in August this year, if all a
WIND SOLAR PV CSP SMALL HYDRO BIOMASS BIOGAS LANDFILL GAS TOTAL
First Ministerial Determination (MW) 1850,0 1450,0 200,0 75,0 12,5 12,5 25,0 3625,0
Round 1 (November 2011)Capacity Awarded (MW) 634,0 631,5 150,0 - - - - 1415,5Projects Awarded (#) 18 8 2 - - - - 28 Fully Indexed Average Tariff (ZAR/kWh) (Base Apr '11) 1,14 2,76 2,69 - - - - N/ATotal Project Cost (ZAR in million) 12 724 21 937 11 365 - - - - 46 026Project Cost Per MW (ZAR in million/MW) 20,07 34,74 75,77 - - - - 32,52 Round 2 (March 2012)Capacity Remaining (MW) from First Determination 1216,0 818,5 50,0 75,0 12,5 12,5 25,0 2209,5Capacity Awarded (MW) 563 417 50 14 - - - 1 044
Projects Awarded (#) 7 9 1 2 - - - 19 Fully Indexed Average Tariff (ZAR/kWh) (Base Apr '11) 0,90 1,65 2,51 1,03 - - - N/AReduction in Tariff (%) From Previous Round -22% -40% -6% N/A - - - N/ATotal Project Cost (ZAR in million) 10 897 12 048 4 483 631 - - - 28 059Project Cost Per MW (ZAR in million/MW) 19,37 28,89 89,66 44,13 - - - 26,88 Round 3 (August 2013)Round 3 Allocation from Second Ministerial Determination - - 200,0 60,0 47,5 - - 307,5Capacity Remaining (MW) 653,5 401,4 200,0 120,7 60,0 12,5 25,0 1 473Capacity Awarded (MW) 787 435 200 - 16 - 18 1 456 Projects Awarded (#) 7 6 2 - 1 - 1 17 Fully Indexed Average Tariff (ZAR/kWh) (Base Apr '11) 0,66 0,88 1,46 - 1,25 - 0,84 N/AReduction in Tariff (%) From Previous Round -27% -46% -42% - N/A - N/A N/ATotal Project Cost (ZAR in million) 16 969 8 145 17 949 - 1 062 - 288 44 413Project Cost Per MW (ZAR in million/MW) 21,56 18,72 89,75 - - 16,00 30,50 Round 3.5 (March 2014) & Round 4 (August 2014)Round 3.5: CSP-specific Allocation - - 200,00 - - - - 200,0Round 4: Other Technologies Allocation 590 400 0,0 60,0 40 - 15,0 1 105,0Cumulative ResultsCapacity Awarded (MW) 1 984 1 484 400 14 16 - 18 3 915 % Allocated of First Ministerial Determination 107% 102% 200% 19% 128% - 72% 108%Projects Awarded (#) 32 23 5 2 1 - 1 64 Total Project Cost (ZAR in million) 40 590 42 130 33 797 631 1 062 - 288 118 498 Project Cost Per MW (ZAR in million/MW) 20,46 28,40 84,49 44,13 66,38 - 16,00 30,26

710
“Cheaper electricity with renewable energy”, WWF-SA, [2010]11 http://www.eskom.co.za/AboutElectricity/FactsFigures/Documents/Kusile_and_Medupi.pdf
vailable 1,105 MW are allocated, there will be approximately 1,505 MW remaining from the First and Second Determinations for procurement in future rounds.
This additional capacity is expected to be procured through further bidding rounds set to occur annually, with the fifth round anticipated to take place in May or June 2015. It is expected that there will be a maximum of six rounds. However, the DOE has also clearly communicated in its re-issued RFP for Round 4 that the Department cannot provide confirmation today of how the remaining megawatts will be allocated, nor if there will be a further determination made for RE. This uncertainty regarding future procurement, coupled with a shrinking allocation of available megawatts and increasing appetite from IPPs, is expected to make further rounds even more competitive. To put this into context, there were 6,023 MW bid in Round 3, and only 1,457 MW allocated, translating to a 24% bid success rate.
WWF South Africa (WWF-SA) has previously shown that a transition to an energy supply sourced predominantly from renewable energy sources is necessary, not only to combat climate change, but also to provide a sustainable solution to the costly externalities of a fossil fuel-based energy system. In the case of South Africa specifically, research undertaken by WWF-SA has shown that investing in renewable energy, coupled with the promotion of energy efficiency in industry, will provide cheaper electricity by 2020 than investing further in coal or nuclear power10.
Against this backdrop, this research paper seeks to provide a review of the Programme process, of its successes and shortcomings, with a focus on the financial landscape and associated challenges with the scaling-up of renewable energy technologies. Having observed the Programme evolve over the last three years, WWF-SA believes the Programme has been incredibly successful and laid significant groundwork for South Africa to become a leader in renewable energy deployment, given its abundant resources and need for additional power supply.
In addition, WWF-SA believes it is a critical time to contemplate the future of the Programme and RE industry in South Africa. While there have been some delays in REIPPPP (most notably in the financial close process for the first and third rounds), the market has moved with such pace and scale that results may need to be evaluated and impact on the grid and financial market assessed. While the IRP certainly provides for additional renewable energy procurement through to 2030, there are a number of factors currently at play that may impact the near-term future of the Programme. Aside from the uncertainty communicated from the DOE mentioned above, there are also competing programmes such as Baseload and Nuclear hot on the heels of REIPPPP, both vying for generation allocation and grid connection. Furthermore, there are proponents lobbying for additional coal-fired power giants such as Medupi and Kusile – the two 4.8 GW power stations are currently under construction but may not be fully commissioned before 2020 due to delays. When operational, Medupi and Kusile will be the third and fourth largest coal-fired power plants in the world11. Lastly, new Cabinet appointments may also introduce a change in the direction of South Africa’s energy future from what is currently envisaged in the IRP.
With such a wide-ranging list of potentially influencing factors, the energy future of South Africa must be carefully contemplated with an eye towards optimising a diversified energy resource base, maintaining the strength of the grid system, and further integrating new technologies without creating costly externalities. While REIPPPP has been largely successful, it does not provide a one-stop solution to the power deficit in South Africa. Further reflection and collaborative effort are required from both public and private sector players – most notably, cooperation between DOE, Eskom, the National Energy Regulator of South Africa (NERSA) and the National Treasury, in order

8
to refine the long-term vision, taking into account lessons learned from REIPPPP, as well as other important energy supply matters (e.g. load shedding) and current undertakings (Medupi, Kusile and other projects).
The South African power sector is unique and adjustments to REIPPPP for market adaptation must be expected. Therefore, this research paper will also discuss ways in which the Programme can evolve efficiently to sustain a long-term renewable energy market that will support SA’s growth and development needs, and its peak-plateau-decline trajectory stipulated in the National Climate Change Response (NCCR) White Paper.

9
NON-FINANCIAL ASPECTS OF REIPPPPOVERVIEW OF THE NON-FINANCIAL ASPECTS OF REIPPPPFor over a decade, the Government has released a variety of different papers and policies to promote renewable energy deployment. While this is a clear indication that the Government has invested significant time and resources in developing a well-constructed policy framework, a number of contradicting targets, processes and timelines created a significant degree of regulatory uncertainty, resulting in diminished investor confidence and costs to the private sector that will not be recovered. REIPPPP sought to bring clarity to the ever-changing policy landscape with the release of a comprehensive and transparent framework and bidding process, accompanied by detailed project documents including a Power Purchase Agreement (PPA), Implementation Agreement, Direct Agreement and Connection Agreement. The Programme provided a clear path towards the execution of South.
A DECADE OF RENEWABLE ENERGY AMBITIONS In November 2003, the South African Department of Minerals and Energy released a White Paper on Renewable Energy that articulated the Government’s vision of creating “an energy economy in which modern renewable energy increases its share of energy consumed and provides affordable access to energy throughout South Africa, thus contributing to sustainable development and environmental conservation.” Accordingly, the White Paper set a 10-year target of “10,000 GWh…[of] renewable energy contribution to final energy consumption by 2013, to be produced mainly from biomass, wind, solar and small-scale hydro.”12
Six years later, in July 2009, the first significant renewable energy programme was revealed. NERSA announced the Renewable Energy Feed-In-Tariff Programme (REFIT). The programme offered generous tariffs compared to concurrent programmes globally, and generated a rush of activity from developers hastening to secure sites for development. By 2011, over 400 environmental impact assessments (EIAs) had been lodged with the Department of Environmental Affairs (DEA) in connection with these developments. However, not one PPA was signed.
The REFIT evolved over two years with a series of regulations, guidelines, public consultations and decision papers. Questions were raised as to the legality of the programme with respect to South Africa’s public procurement framework. In March 2011, the REFIT prices were revised downwards by NERSA, citing changes in macroeconomics and finance assumptions. The new tariffs were significantly lower and rattled the fledgling industry with concerns of regulatory uncertainty and economic viability. While this paper does not seek to discuss the REFIT programme in detail, it is important to note that the greatest failure of the REFIT was the lack of executable documents and a clear procurement process.
THE GAME-CHANGING REIPPPP South Africa’s IPP Procurement Programme, established on 3 August 2011, replaced the dated REFIT scheme with a competitive bidding process, targeting 3,725 MW of renewable energy capacity to be procured from IPPs. The RFP, assembled by the Department of Energy (DOE), the Public Private Partnership (PPP) unit of National Treasury and a team of expert consultants, was several hundred pages long and cost R15,000 to obtain electronically through online registration. This was a signal to the market that the Government had done its proverbial homework and was ready to engage the private sector.
12 White Paper on Renewable Energy, Department of Minerals and Energy, 2003.

10
REIPPPP created a platform through which private developers would develop renewable energy projects and enter into PPAs with Eskom. Under the key terms of the comprehensive PPAs, Eskom would contract to purchase a certain amount of energy at an agreed price for a specified period. The Government specified how much energy capacity from each RE technology it would seek to procure in each round of bidding, meaning that there was an observable limit on the demand from government, which would, in theory, diminish with each round of bidding.
The Programme was established as a competitive bidding process that aimed to jumpstart the renewable energy industry in South Africa and significantly progress deployment of the IRP 2010 targets. As discussed, it was envisaged that 3,725 MW would be procured through five bidding rounds. Following Round 1, subsequent rounds were expected to occur twice in a calendar year (in March and August), with financial close occurring nine months later (in December and May, respectively). All five rounds were initially envisaged to be completed by 2013. In practice, the total capacity of the IPP Procurement Programme was indeed taken up by 2013; however, this was executed over only three rounds, instead of the initially conceived five – a clear indication of the significant private sector appetite for the Programme. The ambitious original bidding schedule has since evolved into annual bidding rounds that afford projects approximately twelve months from the awarding of Preferred Bidder status to achieving financial close13. These adjusted timelines are likely to be more realistic and sustainable than those set out in the initial RFP.
In short, the competitive bidding process follows a two-stage approach to evaluating projects. Firstly, projects must meet a comprehensive list of minimum qualification criteria, the key terms of which are summarised in Table [2] below. Amongst other requirements, projects must be shovel-ready with debt and equity commitments in place, the technical, financial and legal structures agreed, and a certain minimum threshold of land and environmental prerequisites per technology met. The qualification criteria need to be strictly adhered to. If any of these criteria are not met, even as far as failing to submit an original with a translated version of an incorporation agreement, the DOE reserves the right to discard the bid immediately for non-compliance, placing at risk the R100,000/MW bid bonds that project sponsors are required to have in place.
Table 2: Key Qualification Criteria14
13 Due to Programme delays, the window from bid submission to financial close for Round 3 has exceeded 12 months.
14 The updated RFP for Round 4 has removed certain requirements such as the submission of a fully-developed shareholders’ agreement and Memorandum of Incorporation (MOI);
detailed heads of terms to be entered into with contractors or equipment suppliers; and land use and environmental consent applications.
CRITERIA NECESSARY INCLUSIONSProject Structure Project participants: equity participants, lenders, contractors, equipment suppliers,
black enterprises and local community members
Financial Price (full indexation and partial indexation), financial standing of project sponsors, robustness and deliverability of funding proposal, robustness of financial models
Legal Legal status of the project company, acceptance of project agreements (i.e. PPA, Implementation Agreement, Direct Agreement), Statements by Members
Technical Proven technology, energy resource availability, generation forecast, project schedule, cost and timing of grid connection, deliverability of project, water consumption
Land / Environmental
Title deeds, notarial leases, land options, Environmental Impact Assessments or Basic Assessment Reports, water and waste management license prerequisites vary by technology
Economic Development
Various minimum thresholds for SA ownership, job creation, manufacturing, local content, black ownership including local communities, preferential procurement, enterprise development, socio-economic development
Fees and Bid Guarantee
Bid submission: R100,000 per MW; Preferred Bidder: R200,000 per MW; Development Fee: 1% of total project cost
Source: PV Project Development Summit SA, September 2012, Standard Bank presentation updated by Author

11
Secondly, once projects meet the criteria referred to above, they are considered ‘Compliant Bids’ and are evaluated through a tiered weighting system, with the price per kilowatt-hour weighted 70 percent and socioeconomic development weighted 30 percent in the evaluation process. With price carrying a heavy weighting in the evaluation criteria, the competitive bidding process thus helped maintain price tension amongst developers, which contrasted with the set prices fixed by government under the original REFIT proposal. The fixed allocation of energy per technology to be procured enabled further competition by attempting to match demand with supply of projects.
In the first two bidding rounds, tariff caps were imposed on the prices per kilowatt-hour that developers could submit, with different technologies having different caps. Not surprisingly, with less competition amongst developers involved in the first round of bidding, prices submitted were at or close to the price caps imposed by the Government. Competition increased from Round 2, and the caps for solar PV and wind were removed in Round 3. The renewable energy technologies permitted under the scheme are listed in Table [3] below with their respective price caps, and compared to the former REFIT levels.
Table 3: Price Caps In REIPPPP Round 1 Versus Refit
TECHNOLOGY REFIT 2009(R/KWH)
REFIT 2011(R/KWH)
REIPPPP PRICE CAP(R/KWH)
Wind 1.25 0.94 1.15
Solar PV 3.94 2.31 2.85
Solar CSP 3.14 1.84 2.85
Small hydro 0.94 0.67 1.03
Landfill gas 0.65 0.54 -
Biomass 1.18 1.06 1.07
Biogas 0.96 0.84 -
Source: NERSA and REIPPPP RFP
Projects submitted are evaluated according to the two-stage approach described above. Cognisance is also given to the allocation to each technology of energy to be procured (i.e. supply and demand), before successful projects are awarded Preferred Bidder status. Once successful projects are awarded PB status, they are granted a fixed period to achieve financial close, whereby they are required to finalise and execute all necessary contracts, legal agreements, funding arrangements (including hedging) and other binding agreements.
One of the Programme’s goals was to ensure that IPPs submit proposals that achieve value for money for the South African Government by setting social and economic targets. The DOE, alongside a panel of international consultants, evaluates each IPP proposal individually and subsequently announces the preferred bids publicly before the National Energy Regulator of South Africa (NERSA) approves the final Power Purchase Agreement (PPA) between the IPP and Eskom, acting through its Single Buyer Office (SBO). National Treasury then provides a guarantee over Eskom’s PPA payment obligations. Figure [1] is a simple illustration of the structure.

12
Figure 1: REIPPPP Structure
Source: PV Project Development Summit SA, September 2012, Standard Bank presentation
THE SUCCESS OF THE PROGRAMME – OVERARCHING GOALS AND HIGH LEVEL OUTCOMESThe tremendous growth in South Africa’s RE market can be clearly observed and measured. Today, only three years since the inception of the Programme, there are already 33 projects representing 1,670 MW of renewable energy capacity fully on line and connected to the grid.
Delivering megawatts to the grid quickly and efficiently.
As previously discussed, after a decade of challenges to deployment, the Programme brought an end to years of uncertainty and ambitious goals with no clear approach to execution. One of the greatest successes of the Programme was the ability to procure, and therefore ultimately deliver, renewable energy to the grid quickly and efficiently.
The Programme was structured in a way that motivated the private sector to capitalise on certain energy market ‘inefficiencies’. Specifically, developers were given the freedom to choose any sites they identified, provided they could attain the necessary environmental approvals. Developers thus flocked to sites where there existed spare capacity to feed into the Eskom grid, reducing their costs by limiting capital expenditure that would have been required to build or upgrade transmission lines or substations. With international expertise in renewable energy, some developers handpicked sites with the most abundant renewable resources and the cheapest infrastructure costs. Granting the private sector the responsibility for planning the rollout of renewable energy, allowed for a quick and efficient solution to delivering renewable electrons to the grid.
While there have been some delays incurred in the Programme (most notably, the timing of bid submission for Round 3 and financial close for Rounds 1 and 3), the Programme will have successfully achieved its initial goal: to procure all 3,725 MW by 2018. Further, the initial targets have been surpassed with the expectation that roughly 5,200 MW will be procured by the end of 2014 if all available megawatts from Rounds 3.5 and 4 are allocated.
Enabling a competitive environment to procure the most cost-effective tariffs.
REIPPPP
Consumers Single Buyer Office(Eskom)
NERSA
Money
Regulates national
tariffs, enables cost
pass throughPPA
Money
Electricity
Electricity
Generation Licence

13
The Programme has evolved into an extremely competitive process. As compared to Round 1, wind tariffs in Round 3 have decreased by 43%, and solar PV tariffs by 68%. While the comparison to Round 1 may be slightly misleading, as discussed in Section [2.2.1] below, the reduction in tariffs from the second to the third round are still impressive, with a 27% reduction in wind tariffs and a 46% reduction in solar PV tariffs, as shown in Figure [2] below. Figure 2: Evolution Of REFIT and REIPPPP Tariffs
Source: Compiled from NERSA and RFP
One of the greatest achievements of the Programme has been the continued decline in the price per kilowatt-hour of renewable technologies. At R0.881 per kilowatt-hour for solar PV and R0.656 per kilowatt-hour for wind15, renewable energy has become increasingly competitive with coal-fired electricity. Industry estimates for the price of Eskom’s next coal-fired plant, 4,800 MW Medupi, exceed one rand per kilowatt-hour16. While a full analysis of the costs associated with the externalities for both renewable energy and conventional fossil fuels would be required in order to derive a ‘like-for-like’ cost comparison, the current REIPPPP tariff levels suggest that a price premium may no longer be required for renewable energy. The significant reduction in price per kilowatt-hour of renewable energy technologies has been driven in large part by increased competition amongst developers bidding for available capacity, but is also admittedly a function of the high base which Round 1 prices established.
CHALLENGES AND CONSEQUENCES OF THE NON-FINANCIAL ASPECTS OF REIPPPPWhile the Programme has been highly effective in jumpstarting the renewable energy industry in South Africa, no newly established programme, especially one of such unprecedented scale and pace, is without its challenges. This section presents some of the challenges encountered in the Programme process, as well as the consequences that have transpired as a result. In highlighting some of these challenges, it is the objective of this report to encourage constructive discussions about methods to remove these barriers and determine whether some of the negative consequences can be mitigated or improved upon, or whether they are a necessary requirement to establishing the renewable energy industry in South Africa.
REFIT REIPPPP
Tar
iff
(R/k
Wh
)
REFIT 2009 Round 1REFIT 2011 Round 2 Round 3
R4.00
Wind
Solar PV
Solar CSP
Solar Wind
Cap: Solar PV & CSP
R3.50
R3.00
R2.50
R2.00
R1.50
R1.00
R0.50
15 November 2013 DOE Presentation, fully indexed tariffs using April 2011 baseline.
16 Business Day Nedbank Green Energy Dialogue, November 2013, http://cdn.bdlive.co.za/images/pdf/NedbankTranscript.pdf.

14
SETTING THE TARIFF CAPS IN ROUND 1Challenge: How to set price caps and capacity allocations when an industry is not yet established.
In order to establish starting benchmarks for the industry, and to attract investment, the Government was required to establish price caps and allocate capacity for the various technologies in Round 1. While there had been some financial modelling and calculations done by NERSA for REFIT (see Table [3] in Section [2.1.2]), ascertaining prices for projects that had never been built or financed in the country presented a challenge. The Government settled on price caps for wind and solar PV, which fell between the REFIT 2009 and REFIT 2011 levels. Similarly, while they knew there existed significant interest in the Programme from the private sector, it was difficult to gauge exactly how many projects were bid-ready, in order to determine the number of megawatts to make available in the first round. Before moving on to the consequences of this challenge, it is important to understand the mechanics of the Programme. As discussed in Section [2.1.2], the Programme followed a two-stage approach. However, this was with one important exception: if a technology allocation was undersubscribed, the Government could award all the bids it received without moving on to the competitive price and socioeconomic development evaluation process, provided the bids were compliant and under the price cap.
Consequence: First Round bids received at or just below the tariff caps with no true price competition.
It did not take long for the private sector to recognise that both the wind and solar PV technologies would be undersubscribed. In a new market, the playing field is often small, and the players have a good understanding of their competition. Furthermore, in order to bid in Round 1, a developer must have already made significant progress on his project prior to the release of the RFP, because the requirements would have made it nearly impossible to bid otherwise, given the timelines stipulated. As an example, with only three months from the release of the RFP to bid submission, a developer needed to complete an environmental impact assessment, which typically takes nine to twelve months. If you were submitting a wind or CSP project, you needed a full year of ground measurement to prove the resource.
Armed with this knowledge and a strong grasp of the RFP evaluation process, developers who bid in the first round capitalised on their first-mover advantage and bid at or just below the tariff caps, knowing that their chances of success were relatively high, given the lighter competition. This meant that the prices submitted and awarded were potentially well higher than a ‘fair market’ price. When solar PV and wind technologies were oversubscribed in Round 2 only six months later, the lower prices established appeared to corroborate this view, and the Government became aware that the ceiling tariffs stipulated in Round 1 were quite far off the mark. The price decline from the first to the second round for wind technologies was a considerable 22 percent; and for solar, an astounding 40 percent.
It has often been the case internationally that the first renewable energy installations in a country attract large premiums to the project cost in order to incentivise the market. It is also likely that the developers awarded projects in Round 1 had been investing capital at risk in the nascent renewable energy sector since the release of the first REFIT in 2009. As such, it may be warranted that these first movers were rewarded for the high risk they took in persisting through an uncertain regulatory environment.
On the other side of the coin, given international examples of retroactive tariff setting and the introduction of RE-specific surcharges and taxes – most notably in Spain, Germany and Italy – it is

15
not difficult to conceive that, in five to ten years’ time, when Round 1 tariffs are fully escalated with inflation and may cost more than three times the grid price, the Government may revisit the tariffs that they unknowingly priced at the onset of the market. Thus, while endowed with healthy returns, Round 1 projects face greater policy and government risks than projects in subsequent rounds with more sustainable tariff levels. Furthermore, a mechanism already exists in the current legislative framework of the Electricity Act to grant the Minister of Energy the authority to prescribe levies to licensed electricity generators on an annual basis. While this amount is a fraction of a rand cent (at R0.06709 cents per kWh as of 16 May 201417) today, and thus has a marginal impact on project economics, any future significant escalation that would be out of the IPPs’ control, could substantially hamper project return expectations.
Solution: The removal of tariff caps in Round 3 allow market dynamics and competition to establish prices.
As of Round 3, the DOE has removed tariff caps for the most competitive technologies (solar PV and wind), suggesting market ‘equilibrium’ has been reached. Given the level of increased competition in REIPPPP, there have been instances in the Programme where the DOE has considered expanding set allocations for solar PV and wind, given the number of attractive projects that were bid. While there are a wide range of factors to be considered in determining the number of projects and megawatts awarded Preferred Bidder status – including the impact on government liabilities and grid capacity constraints – the significant oversubscription of economically-attractive projects in the latest rounds requires an innovative solution. Perhaps a new mechanism (for example, opening up a diversified buyer/seller market and improving wheeling agreements), could allow the country to absorb additional renewable capacity, which is cost-effective today rather than postponing the supply of much-needed electricity onto the grid to the future.
FINANCIAL BURDEN ON THE PRIVATE SECTOR – RISK VERSUS RETURNChallenge: How to procure competitive, bankable, shovel-ready projects at the drop of a dime with limited risk.
Failed tender processes are not unusual. In many developing and emerging markets, tender processes are sometimes ill-conceived or not properly managed. In some extreme cases, they comprise only a single page document, or are presented as a brief blurb on a website. This was not the case with the Programme. Warned against competitive tenders that have resulted in unrealistic proposals pitched by inexperienced developers who ultimately could not finance and deliver their projects, the Government of South Africa, with support of international consultants, was meticulous in creating a robust RFP that set out stringent requirements with high penalty costs, to ensure that the bids received would be as close to fail-safe as possible. From a government perspective, these hurdles are necessary to ensure that only the strongest projects are awarded, and that they create value for money for South Africa.
Consequence: Significant development capital is invested that is never translated into electrons on the grid.
The consequence of the rigorous tender process is that the onus falls on the private sector to undergo a complex, time-consuming and costly process with limited chance of success. As discussed in Section [2.1.2], the RFP is highly compliance-driven, which adds another element of cost. Anecdotes of projects that were turned away on submission day for having minor irregularities, such as the wrong details on the form of bid guarantee, are not uncommon.
17 Government Notice, National Gazette No 37630, 16 May 2014

1620
This assumes a capital cost of R19 million per MW (the average capital cost of solar PV in Round 3) and pre-bid development spending of R30 million.copies.
19 Energy price war looms”, Business Day, 13 November 2013.
18 The Updated RFP for Round 4 has reduced the number of copies of the bid response from seven copies (including one master copy) to only two copies.
The process is difficult and time-constrained, the requirements are extensive, and documentation must be thorough. Financial, legal, technical, insurance and tax advisors are called upon by both lenders and sponsors to ensure every box is ticked. Bid bonds are a not-insignificant expense. A new specialist market for bid preparation, with services largely offered by audit firms, developed almost overnight. Costs for bid preparation services can total hundreds of thousands of rand per project, with printing alone representing a sizeable expense18. South African RE developers have a variety of estimates of development costs leading into bid submission. Most estimate a range of R10 to R30 million per bid19. Others have estimated as much as R50 million, depending on how much time the project has been in development, the technology and complexities of the development, and whether the project has undergone more than one bid window. For example, a project may undergo full due diligence prior to bid but cannot be submitted because it did not receive an environmental consent timeously or one of its financiers could not pass the project through its credit process. Once the project must be rebid, costs immediately escalate given some work must necessarily be duplicated. Having incurred significant sunk costs, developers are under high pressure to ensure they will submit compliant bids, and no expense is spared to mitigate that risk.
To grasp fully the consequences of the burden on the private sector, a few scenarios have been explored to estimate the development capital spent that has not translated into renewable megawatts on the grid. If one assumes an estimate of R30 million per project, roughly R4.8 billion has been spent by the private sector developing shovel-ready projects that may never be constructed. Table [4] examines this further, with sensitivities for varying development cost assumptions.
Figure 4: Private Sector Losses On Development Costs
Source: Analysis based on DOE presentations and market feedback
While the ‘lost’ development capital indicated in Figure [4] may be slightly overstated, given that some of the projects may have subsequently successfully re-bid, there is nonetheless a significant amount of capital that is not being directed to the production of megawatts. To put these numbers in further context, if the total private sector losses on developing bids for submission into the Programme were aggregated and invested, one could build a 250 MW solar PV farm20.
Consequence: High-risk premiums have been passed on to the Government in the form of success fees.
Round 1 Round 2 Round 3
Assumptions: Development cost per bid
R10m / bid
R4.8 bn
R3.2 bn
R1.6 bn
R2.5 bn
R2.0 bn
R1.5 bn
R1.0 bn
R0.5 bn
R0.0 bn
R20m / bidR30m / bid
Total development costs for unsuccessful bids:

17
While the development costs of failed projects amount to only a small amount (less than 5%) of total capital mobilised for successful projects, and one may argue that this is a fair cost required to create an efficient and competitive market, the quantum of capital at risk is significant enough to warrant appropriate risk/return analysis from developers. As always, risk is priced appropriately in any efficient market transaction. Just as investors in the stock market look for risk-adjusted returns, bidders in the Programme calculate the price of the tariffs they bid with an embedded premium for the risk they have taken to develop the project. The less the chance of success, the greater the risk; and therefore, the greater the reward sought. This market risk premium is passed on to the Government in the form of developer success fees paid by the project, which can have a significant impact on the ultimate cost of electricity, depending on the size of the project. However, it is widely understood in the market that success fees have reduced significantly since Round 1, given the increased competition.
Smaller projects are affected more than larger projects, because their success fees are spread over a smaller capital cost and cannot benefit from economies of scale. This is exacerbated by high transaction costs, which similarly can make small projects relatively uncompetitive.
Consequence: Evolution of risk versus reward profile may deter development.
As the Programme has progressed, the success rates have begun to fall dramatically – a natural consequence of increased competition, as more and more projects are bid (see Figure [5] below). The success rate has dropped from 53% in Round 1 to 18% in Round 3, and there has been significant downward pressure on tariffs and therefore success fees, which clearly impacts the risk versus reward profile many developers face.
Figure 5: Project Success Rate Per Round
Source: Analysis based on DOE presentations and market feedback
Furthermore, the rate of decline in tariffs has also not been matched by the rate of decline in capital and development costs. As shown in Table [1] above, the wind tariff from the first to the second round fell 21.5% whereas the capital cost fell only 3.5%. Similarly, the solar tariff from the first to the second round fell 40.4% while the capital cost only fell 16.8%. Given that the reduction in tariff has not been proportional to the reduction in capital costs, and if one assumes that the rate of tariff reduction cannot be fully attributed to the abnormally high price caps established in Round 1, an assumption can be made that significant savings have come from reduced project return expectations (in addition to potentially lower operating costs and better financing terms). Companies may be lowering their return thresholds below market norms in order to see a project awarded. This will be
Round 1 Round 2 Round 3
60%
52,8%
24,1%
18,3%
Su
cces
s R
ate
40%
20%
0%
#Bids:
#Successful:
53 79 93
28 19 17

18
explored in more detail in Section [3]. However, it serves our purposes in this section to illustrate the heightened competition in the Programme.
South Africa has also had the benefit of a slowdown in the developed, international renewable energy market, specifically in Europe and the United States, and new emerging markets have been slower to act. However, in the near term, if another market establishes a greater value proposition with a risk profile that is commensurate with the reward, then South Africa could see an exit of international developers, who may have become frustrated with the lengthy, costly process and the low success rate. We note, however, that this is not currently the case, and that Rounds 3 and 4 have seen increased activity from a number of international developers, suggesting perhaps that the risk versus reward profile of South Africa’s REIPPPP remains attractive.
Consequence: Fledgling, cash-strapped start-up companies are disadvantaged against well-capitalised utilities
An additional consequence of the costly nature of bidding in the Programme is that it creates an advantage for well-capitalised companies over fledgling, cash-strapped South African start-ups. While this is true of most growth industries, it is particularly acute in the case of renewable energy, given the high barriers to entry created by the large capital costs and high risk of capital loss. Large utilities and well-capitalised companies are endowed with sufficient working capital to develop and bid multiple projects simultaneously, and take greater risk. Utilising a portfolio approach, cash-rich developers are able to spread their efforts and risk, investing in a number of different projects with the objective of increasing their probability of success. Ultimately, the returns from a successful project will compensate for losses on unsuccessful projects. Furthermore, bids submitted by larger entities in REIPPPP may only represent a small fraction of their total project portfolio (and indeed may even serve to reduce risk by presenting portfolio diversification), potentially increasing their risk appetite. On the other hand, local start-ups tend to have all their eggs in one basket. They don’t have a large balance sheet and the financial muscle to fund development, are often over-extended through bid submission, and do not have the human resources to work on multiple submissions. The disparity is particularly evident with government delays in financial close, where smaller project developers struggle with access to capital to pay advisors and progress projects with a moving goalpost, given they have not received any income from development fees – which are typically only transferred at financial close.
Furthermore, price has been a determining factor in the evaluation. As discussed in Section [3.1.2], price is weighted 70 percent of the decision. Where established European utilities may be able to finance projects on balance sheets with low internal rates of return (IRRs), South African start-up companies typically cannot compete with the same cost of capital, and thus may be forced to submit less competitive pricing. The strong weighting in favour of price also creates a challenge for local content, discussed further in Section [2.2.6] below.
Today, a trend is emerging where small developers are looking more earnestly for opportunities to sell their projects for potentially lower returns earlier in the project development cycle in order to guarantee income streams. Large international developers have created a buyer’s market for these projects based on the portfolio approach mentioned above. It is likely there will be increased consolidation in the RE sector in South Africa, with market share already concentrated in the hands of a few well-capitalised companies.
Solution: Amendments to the RFP for Round 4 provide some relief to developers in the time-consuming and costly bid process.

19
As mentioned previously, one of the key factors contributing to REIPPPP’s success has been maintaining ongoing dialogue with the Programme’s private and public stakeholders throughout its various implementation phases. As such, the DOE has taken several of the above challenges into consideration in revising the RFP for Round 4.
Specifically, in the newly issued RFP, the DOE has removed certain requirements necessary for bid submission. These include the requirements to submit a fully-developed shareholders’ agreement and detailed heads of terms of the contracts to be entered into by the project company. Further, proof of necessary site-related applications, including but not limited to land use change, subdivision and zoning applications, as well as certain environmental consents, are either no longer required or have been limited for bid submission. Rather, these items will be required if the projects are awarded Preferred Bidder status, at which point they will be required to demonstrate that all applications have been made and progressed sufficiently so as not to delay financial close. In addition to alleviating strain on the developer in the bidding process, this will also provide relief to government departments, which need to respond to applications for consents and authorisations from hundreds of projects, some of which may not be bid.
Lastly, in order to recognise the effort made by bidders in previous rounds who were compliant yet unsuccessful, the DOE has introduced the concept of ‘Returning Compliant Bidders’, which grants these bidders exemption on submission of certain criteria related to land acquisition, land use and environmental consents. This applies only for projects where the project site, layout and technology are identical to those submitted in the previous bid.
AMBITIOUS PACE OF DEVELOPMENTChallenge: How to set timelines for bid rounds and financial close when the industry is not yet established.
The constitutional framework required that the Government procure renewable energy through a competitive bid process. The quantity of megawatts was determined through the Integrated Resource Plan with the aid of a taskforce of skilled energy consultants and government departments. The challenge was how to procure such a large quantity of renewable energy in such a short timeframe. To ensure a level playing field, the Government set fixed dates for bid submission and financial close for all projects to adhere to.
Consequence: Timelines set for bid submission and financial close have been extremely ambitious for South Africa’s nascent RE market, which has been tasked with building capacity with limited resource availability.
From service providers to Engineering, Procurement and Construction (EPC) companies, there is significant strain in procuring resources to meet the strict deadlines required by the Programme. The 2014 calendar year alone will see the completion of three significant events: firstly a CSP-specific bid submission (Round 3.5) on 31 March; secondly the Round 4 bid submission on 18 August; and thirdly the Round 3 financial close, which was expected on 30 July, but has since been delayed, and is now expected to be staggered through to the end of the year. These timelines are so tight that they place considerable strain on the professional resources available to meet the deadlines. While resource constraints may not have been the sole cause, they have certainly been a significant contributing factor to the delays in the Programme to date.

20
Capacity constraints are so great that in more than one instance, insurance and legal advisory firms have provided services to both the sponsors and the lenders of the same transaction from different teams. Conflicts of interest are difficult to manage. Similarly, financiers may have to use the same deal teams on competing projects in one technology group.
There simply is not enough capacity in the new market to meet the needs of procuring thousands of megawatts of renewable energy. Even after four rounds of procurement, there are still only a handful of commercial lenders, law firms, technical advisors, insurance advisors and audit firms who provide services to the renewable energy sector. Along the same lines, EPC companies and technology providers that are building more than one project, whether in the same or different rounds, have the difficult task of managing resources and developing contingency plans to mitigate risks associated with cash flow timing.
As expected, there have been a number of hiccups across all links of the RE supply chain with capacity challenges. For example, sharing roads, cranes and other necessary construction equipment, which is limited in the South African market, inevitably created dilemmas with construction timelines, and therefore milestone achievements and payments. However, for the most part, the capacity constraints have created new opportunities for employment in the sector. Similarly, the capacity constraints have in some instances required the import of resources, which has allowed for significant skills transfer into the local market.
In addition to private sector capacity constraints, there have also been significant government department constraints in this process. Further discussion of Eskom’s involvement in the process is discussed in Section [2.2.4] below. The other two departments where considerable engagement with the private sector is necessary to enable bids are the DEA and the Department of Water Affairs (DWA). The DEA alone has received in excess of 600 renewable energy EIA applications. It is important to note that certain inefficiencies in the current authorisation system have been identified, and there are measures under consideration to allow for a more streamlined authorisation process.
The relevant financial challenges to achieving financial close on the same date for all projects will be discussed in Section [3.2.1].
Solution: Timelines and requirements have been modified to alleviate the strain on resources.
As of Round 3 financial close, the DOE has announced its intention to stagger financial close timelines, which may help reduce capacity bottlenecks. As of Round 4 bid submission, REIPPPP will move to an annual procurement process, which may be less demanding on resource requirements. Furthermore, as discussed above, the DOE has also provided some concessions to reduce the time-consuming nature of the bid process by waiving certain bid requirements. However, this may also create strain in the timeframe to financial close if the process is not managed carefully by project sponsors.
GRID CONNECTIONChallenge: How to ensure that IPPs will be able to connect to the electrical network when and where they need to, while maintaining a consistent process that provides equitable, cost-effective and on-time access.

21
At the most basic level, procuring renewable energy through REIPPPP will not yield generation without connection. There are many international examples where projects have been built without aligning the timing for grid connection with commercial operation, or where the grid limitations were not properly taken into consideration before ambitious procurement programmes were rolled out. In South Africa, Eskom plays a critical role in the Programme in ensuring grid connection would possible for all the bids submitted. What’s more, in a competitive programme like REIPPPP, the cost and timing of grid connection can be the determining factor between a winning and losing bid. The challenge lies with Eskom in how to provide reliable estimates for cost and timing for hundreds of grid connection requests prior to bid submission, when such estimates are dependent on a number of uncertain factors. Eskom has developed a standard process to support the numerous requests, as shown in Figure [6] below.
Figure 6: Eskom’s Standardised REIPPPP Grid Connection Process
Consultation with, and advising IPPs
Quotation, Contracting and Connection
Operation of IPPs and generators
IPP feasibility study
Application Form
Accept Cost Estimate letter
Accept Budget Quote
IPP
Eskom
Dept. of Energy
Produce prelim design (TEF) &
cost project
Issue Budget Quote, SBA &
CUOSA
PPA with Preferred Bidders - Single Buyer Office
Operations
Project Close out
Test & Commission Connection Assets
Eskom Construct Connection
Works
Perform / Approve Detailed
Design
Perform Detailed Design
(Self Build Option)
Construct Connection Work (Self Build Option)
DOE Financial Close
Requests EIA for project
Planning, Design Routes
& Sites
Provide Cost Estimate
Letter
Receives EA approval
Submission documents
Eskom or self-build?
DOE IPP evaluations preferred bidders
Grid Access Unit
Open CommunicationInformation sharing
Monitors full process
Source: Eskom Network Planning Unit 21
Following the awarding of Preferred Bidder status, Eskom is under pressure to determine the final cost and a strategic timeline in order to connect the awarded projects before their proposed commercial operation date as set out in the bid documents, while ensuring that such connections will not put the stability of the network in jeopardy. Renewable energy generators can have a significant impact on the electrical network (e.g. voltage rise, increase in fault level, rapid voltage change). It is critical that the network impacts of proposed generators are carefully assessed, so that their impact is minimised – and that the generators have capabilities to support the network, such as reactive power control and fault ride through capability22.
21 “Process for Eskom IPP renewable energy grid integration”, Riaan Smit, Eskom Holdings, Energize RE: Renewable Energy Supplement. June 2013.
22 “Technical analysis of the connection of renewable energy generators to the Eskom network”, Energize RE: Renewable Energy Supplement, June 2013.

22
Consequence: Eskom faces capacity and resource constraints, given the number of projects that require connection to the grid.
The large number of applications that need to be addressed on an individual basis, create a considerable strain on Eskom’s existing resources. Additionally, many of these applications will not translate into bids into REIPPPP. As shown in Figure [7] below, Eskom received 270 requests for cost estimate letters in Round 1, a further 180 in Round 2, and 500 more in Round 3. This has resulted in an effective 10% success rate of Preferred Bidders in Rounds 1 and 2 and an even lower 3% in Round 3.
Figure 7: Eskom Cost Estimate Requests
600 12%
270
190
>500
28 19 17
500 10%
400 8%
300 6%
200 4%
100
Eskom CELs Succesful Projects
Conversion Rate (RHS)
2%
0 0%Round 1 Round 2 Round 3
Source: Author, based on data from Eskom Network Planning Unit
Furthermore, between Rounds 1 and 2, where six months separated financial close of the two rounds, 47 projects require connection to the grid in the space of two to three years. Eskom’s decision to allow a self-build option in December 2011 has alleviated some of the construction capacity constraints within Eskom, but the issue is generally not the shallow connections (many of which developers are building and funding themselves), but rather the deep connection investments that Eskom needs to make in order to strengthen the transmission backbone.
In the event of a delay in grid connection, Eskom will be liable for deemed energy payments, which would have a negative impact on the utility’s financial health and could require National Treasury guarantees to be called upon. Some developers have been notified recently that there will be considerable delays in connecting their projects. In order to maintain investor confidence in the Programme and compensate projects for their loss of revenue, it is critical that buyer obligations under the PPA are upheld, and deemed energy payments are made. There is speculation in the market that if developers are not compensated through deemed energy payments, then there must be a tariff adjustment for the loss of revenue caused by connection delays. Furthermore, in scenarios where projects are notified of connection delays before financial close, there should be a mechanism to compensate for the impact on project economics, which can be significant due to potential cost increases for financing and construction, among other variables.

23
Consequence: The current process creates time and cost inefficiencies in long-term network planning, and has resulted in delays in the Commercial Operation Date (COD) dates agreed with the DOE in bid submission
With approximately 500 applications submitted to Eskom in a single round, it is unrealistic to expect that Eskom would look at all the possible combination scenarios of those 500 applications with no certainty of any being selected as Preferred Bidders. As such, each project is evaluated on an individual basis, as if only that one project had applied. Only at the evaluation phase, which is controlled by the DOE, will Eskom provide a decision-making tree, based on the applications, actual grid topology and associated capacities available.
Before bid submission, the IPP requests a cost estimate letter (CEL) from Eskom. At this stage, there is no selected line route and site; the availability of resources and even lead times are unknown. Thus, there is a fundamental disconnect between what the IPP needs (a date-certain connection with as close to a fixed price as possible) and what Eskom needs (visibility in terms of how many total megawatts from REIPPPP will go onto the grid, when and from where). To complicate matters even further, there are associated costs relating to strengthening the network and allowing the IPP to connect, for which Eskom must strategically plan and budget in order to prevent connection delays. However, how does one properly plan and budget in advance for combinations of over 500 different projects, some of which may not even bid? Unfortunately, there is no strategic vision afforded to Eskom prior to bid submission (when the utility must issue CELs) as to when and where megawatts will come on line.
Only once projects are awarded PB status, are they regarded as connected to the system for further analysis. It is important to note that Eskom can only begin its internal approval processes at this stage, following which budget quotes can be issued. It is this fundamental mismatch in timing that causes delay - the DOE guarantees connection to Preferred Bidders for COD dates in their bid submissions prior to Eskom receiving firm approvals. In the month leading up to the anticipated Round 3 DOE financial close date (30 July 2014), some projects had still not received budget quotes from Eskom. DOE financial close has since been delayed by several months, with the expectation that projects will reach financial close on a staggered basis. While Eskom may not be the sole reason for this delay, it is likely that the constrained timelines for Eskom’s approvals contributed to the postponement of Round 3 financial close.
Furthermore, there may be cost efficiencies that are not captured in the current process, given that each project receives a CEL on a standalone basis. That is, there is no provision for accounting for shared infrastructure, which could translate to a lower per-MWh cost of procured renewable energy. For illustrative purposes, let’s say Project A wants to connect to the same substation as Project B. For either project to connect, an upgrade to the substation is necessary. However, given that at the time of issue of the CELs Eskom cannot be certain that both Project A and Project B will be selected as Preferred Bidders, each CEL assumes that the full cost of the substation upgrade will be covered by either Project A or Project B. That is, Eskom’s current standardised process translates to an assumption that only one project will receive Preferred Bidder status. If the process were to be amended to allow for shared infrastructure scenario planning, the transmission cost that Project A and Project B submit in their bids could potentially be split in half, which would presumably lead to a lower tariff bid.
Furthermore, in a competitive programme like REIPPPP, there is a reluctance to shoulder the full financial burden of substantial grid upgrades on an individual project basis, as it is seen as giving the competition a leg up. That is, the benefit others will receive from the upgrade in the future is viewed as funding the competition.

24
Solution: Eskom is currently exploring a number of options with DOE and other government departments in order to improve the current process.
It is evident that increased coordination and strategic planning are necessary for REIPPPP to continue to improve its grid connection cost budgeting processes. Lessons learnt from renewable energy grid integration in other countries around the world should also be taken into account. For example, Germany currently generates approximately 25% of its electricity from renewable energy. However, the country has recently encountered some obstacles with the need to wheel excess power from energy delivery points in the south to load centres in the north. Proper system planning is necessary to avoid similar situations.
Currently a working group within the DEA is looking at the establishment of Renewable Energy Development Zones (REDZ), which would aim to address inefficiencies in the current system by identifying geographical areas most suitable for the rollout of specific technologies, with a specific focus on the supporting electricity grid network. Environmental and social aspects would also be taken into consideration in the establishment of said zones. The REDZ would, in theory, allow for the associated grid infrastructure to be developed in these areas without requiring additional environmental authorisation, subject to certain conditions and guidelines. This approach has been successful in France with the establishment of Wind Energy Areas, or Zones de Développement Éolien (ZDE). State authorities determine the zones, as well as the total generation possible in each zone, on the basis of wind potential, grid connection and landscape protection. It is unusual to see wind projects developed outside these areas in France. While zones were not pre-established in South Africa, a mapping of the current projects in REIPPPP would illustrate wind and solar ‘corridors’, where the most wind and solar energy resources are concentrated across the county. It is likely that these market-driven corridors would inform the location of REDZ in South Africa.Funding grid infrastructure is one of the largest obstacles globally to the deployment of large-scale renewable energy. It is often described as a ‘chicken and egg’ scenario where renewable energy projects in the planning stages are unable to move ahead without confirmation that there will be grid connection, but the grid operator does not have the necessary funds to upgrade the grid. Financing is often central to this bottleneck.
Some South African market participants have lobbied Eskom to invest in the network upfront in order to ensure there is a certainty of connection in the future. That is, Eskom would develop a strategic view, possibly through the establishment of REDZ, and then invest, for illustrative purposes, R50 billion into strengthening the network with an eye towards creating renewable energy corridors in those areas over the next 10 years. The costs would be recovered in future by charging connection fees to projects, but the investment would be required upfront. While Eskom is not averse to the concept (it would, in fact, improve the efficiency of the utility’s long-term network planning), the question of access to financing for such an investment is the outstanding and controversial issue. Eskom receives its funding through the Multi-Year Price Determination (MYPD) process, where the utility applies to the regulator NERSA for multi-year price increases in order to fund its capital expansion plans. The funding of an upfront transmission connection would unavoidably be linked to an increase in tariff prices. Eskom’s current budgetary constraints would seem to make such upfront investment unlikely. Eskom recently applied to NERSA under the Regulatory Clearing Account (RCA) mechanism for cost recovery of R18.4 billion, which the utility claims it was unable to recover under the tariff allowed between 2010 and 201323.
While there a number of uncertain grid-related factors outstanding today, Programme stakeholders may have confidence that as REIPPPP continues, the benefit of operating data from technologically and geographically diverse projects will help to inform a long-term strategy for further grid integration of renewable energy and optimisation of South Africa’s resources. This should also help
23 Business Day, http://www.bdlive.co.za/business/energy/2014/07/31/eskom-set-to-claw-back-costs-from-consumers

25
refine the procurement process to allow for standardisation, with some flexibility to provide for unique circumstances such as shared infrastructure.
Eskom arguably plays the most critical role in ensuring the long-term growth and sustainability of the renewable energy industry in South Africa. Its ability to adhere to timelines and to deliver connections and related infrastructural upgrades within budget is absolutely essential to maintaining the much-needed investor confidence in the Programme. Questions marks over the integrity of the process, including the way in which delays or variations to project connection plans are dealt with, could put the entire Programme in jeopardy.
SETTING APPROPRIATE PPA TERMS Challenge: How to set PPA terms for different technologies when there has been limited exposure to renewable energy projects to date.
In the absence of precedent examples in South Africa, the Programme has applied uniform PPA terms across RE technologies, which in some instances may not be optimal for each specific technology. While it is beyond the scope of this paper to assess the DOE’s PPA and the appropriateness of its terms for each technology, two key items have been highlighted by stakeholders as deserving further consideration: the term of the PPA and the plant size criteria.
Regarding the term of the PPA, the Programme has set a 20-year PPA duration across all technologies, which may not allow for projects to capitalise on the full useful life of plants for certain technologies. For example, in the United States and Europe, it is not unusual to be granted a PPA for a solar PV farm for 25 years or a CSP plant for 30 years. This may be in part due to the desire to maintain consistency and uniformity in the absence of prior exposure to RE projects, but also to limit the additional encumbrances and contingent liabilities on the Government’s balance sheet, given that the South African Government guarantees Eskom’s PPAs (see below), which makes sense from a financial planning and ratings perspective.
Regarding plant sizes, in order to ensure that there would be a benefit spread across the country and to numerous projects, the Programme also set maximum project size thresholds.
Consequence: Curtailing the useful life of the power plants and setting project size limitations may have a negative impact on the long-term cost of power.
It may be uneconomical to curtail the useful life of a power plant when it is likely that in 20 years’ time, these plants (in particular, solar plants) will be operating at marginal costs that may be cheaper than the utility’s cost of power. For example, the Solar Energy Generating Systems (SEGS) plants commissioned in the 1980s in the United States, continue to operate and deliver clean power to the grid. While there have been some additional capital expenditures, it has proven more cost effective to upgrade the plants than to decommission them.
The Implementation Agreement in the RFP requires that, at the expiration of the PPA, the project site be restored to its original purpose of use. That is, regardless of whether the plant is still operating and generating electricity at low cost, the plant would need to be decommissioned and the site rehabilitated. While many would assert that the DOE would grant extensions for these projects when the time came, this requirement foregoes value that could be realised today by incorporating this assumption into project models. Extending the useful life of these facilities has a positive benefit on the equity IRR, which could, in turn, reduce the tariffs bid. Allowing the plants the flexibility to continue to operate – even at a discounted price to the would-be tariff in year 20 (i.e. Eskom’s

26
market price) – could have an impact on the equity IRR. Given this would extend the so-called ‘tail’ on the debt funding, it might also be possible to stretch debt tenors (as is the case in international markets), easing cover ratios in the early periods and potentially lowering the tariffs bid.
One must bear in mind that the limitation on PPA useful life may be a function of the explicit guarantees for up to R350 billion of certain Eskom liabilities that the South African Government has provided, including Eskom PPAs. This is reflective of Eskom’s difficulty in accessing the debt capital markets at reasonable costs of borrowing for its significant capital expansion programme without Government support. There is a strong link between the sovereign’s credit rating and that of Eskom, implying an implicit guarantee is being priced into Eskom’s cost of borrowing for liabilities over and above the R350 billion explicitly guaranteed. This is important, because any additional contingent liabilities that Eskom incurs may have a detrimental impact on the sovereign’s credit rating – which is already perilously close to a sub-investment grade or ‘junk’ rating, following significant labour unrest in the country’s mining sector. It should be pointed out that the guarantees – explicit and implicit – are not a particularly unique arrangement for emerging market state-owned utilities, but may indeed form the basis of an argument to open up and/or partially privatise the transmission market in South Africa. While this has been a subject of significant debate and public speculation, the Government has recently confirmed that it is reviewing a number of options through an inter-ministerial task team to develop an optimal solution to Eskom’s funding crisis. As part of the solution, the Government has recently approved a support package, which will include a state equity injection and a R50 billion bond offering24.
With regards to project size, the setting of maximum limits encourages competition, but it handicaps projects on costs because economies of scale may translate into lower transmission and component costs. Furthermore, while in theory the policy was intended to allow projects to be spread across numerous IPPs, in practise market share has been concentrated in only a few IPPs (multiple hundreds of MW and at times multiple projects in a single round). As the industry matures, it may become more efficient to let the market decide project size.
Solution: As the market matures, PPA terms will most likely evolve based on historical data and experiences.
As in any nascent market, adjustments to standardised contracts can be expected for market adaptation. In the meantime, it may be reasonable and sufficient for equity investors to consider the upside of an extension of plant life in their investment decisions. Regarding project size, economies of scale could still be established in some instances – for example by expanding project sites, or bidding multiple projects in a single round.
LOCAL CONTENTChallenge: How to set local content criteria without substantially increasing costs, given a nascent renewable energy industry in South Africa.
With the inception of a new market, there is typically a trade-off between cost-competitiveness and local content requirements. The challenge in South Africa was how to create sustainable jobs while procuring the lowest cost electricity, given Eskom’s current financial position and concerns over looming electricity price hikes. The Government thus set criteria with a 70% weighting for price and 30% weighting for economic development, which was a departure from the normal 90%/10% split mandated in the Preferential Procurement Policy Framework Act (PPPFA). This demonstrated South Africa’s political will to establish economic development as a key driver in the renewable energy industry’s growth in South Africa.
24

27
Consequence: The focus on economic development introduces prescriptive criteria and high penalties for non-compliance.
There are several components to the economic development score of a bid in REIPPPP, comprising local content, ownership, job creation, management control, preferential procurement, enterprise development and socioeconomic development. Half of the 30% weighting for economic development is linked to local content and job creation, emphasising the importance the DOE attaches to these two components. As per the latest RFP re-issued for Round 4, Table [4] sets out the economic development categories and their corresponding weightings.
Table 4: Economic Development Scorecard Weightings
Source: REIPPPP RFP
There are, however, minimum thresholds for local content that must be met in order for bids to be compliant. Falling short of committed economic development obligations will result in penalties in the form of termination points in the Implementation Agreement. If the project racks up points exceeding stipulated maximum thresholds, the DOE has a right to terminate the PPA. The punitive nature of this compliance has even spurred a new industry for firms who independently verify economic development obligations. While this has added another layer of cost to projects, minimum requirements do not have much meaning without the right system in place for performance measurement.
As shown in Figure [8] below, there has been a fairly steady increase to 40% and above in the local content thresholds for the upcoming round of bidding. The ‘targets’ shown below set out the levels that the DOE encourages projects to meet or exceed. These represent a basis for guidance; the thresholds are the levels at which penalties are payable for a failure to meet minimum criteria. As can be seen from the table below, on average, results have exceeded thresholds, but fallen short of targets.
Figure 8: Local Content Thresholds, Results And Targets
ECONOMIC DEVELOPMENT CATEGORY WEIGHTINGJob Creation 25%
Local Content 25%Ownership 15%
Management Control 5%Preferential Procurement 10%Enterprise Development 5%Socioeconomic Development 15%
Round 1
% L
oca
l Co
nte
nt
PV
70% 70%
60% 60%
50% 50%
40% 40%
30% 30%
20% 20%
10% 10%
0%
Desired Targets Minimum compliance threshold
0%CSP Wind Wind WindCSP CSPPV PV
Round 2 Round 3
Source: RFP, Department of Energy presentations and interviews

28
Local content is calculated as the value of local content divided by the total project value. This definition has been refined over the rounds to exclude items such as financing costs and land, in order to ensure the calculation directly reflects spending on South African goods and services. The evaluation of local content scores has also evolved since Round 1, where bidders were awarded 10 points for hitting the thresholds and an additional 10 points for exceeding the targets. The scoring has now evolved to points awarded on a ‘curve’ basis in which projects’ local contents are ranked and scored relative to each other. That is, the bidder with the highest local content would receive the maximum points for that category with the other compliant bidders awarded points proportionally between the highest score and the threshold. This incentivised bidders not only to meet the threshold, but to achieve the highest possible scoring. Given how competitive REIPPPP has become with tariff pricing expected to converge at levels which have ‘bottomed out’, the local content category becomes a competitive advantage. Some developers believe there is room for improvement, and while the economic development score is only worth 30 points compared to the 70 points on price, every fraction of a point makes a difference.
As can be expected, the local content aspect of REIPPPP remains a point of significant debate. Further localisation studies have been undertaken by the Government and it is clear that they will continue to work to optimise this policy. Some developers argue that the local content requirements in REIPPPP are a form of subsidisation that should be invested elsewhere. Their view is that renewable energy projects do not create sustainable long-term jobs, given the increased automation of the manufacturing processes, the short-term nature of construction jobs, and the fairly limited number of jobs required during the operational phase of plants. Thus, the money spent in paying for higher-cost electricity for the local content is not justified in terms of the total number of jobs created. Other industries which are more labour-intensive should be subsidised for local content, where greater job creation is achievable. Furthermore, visibility of long-term demand is key to any capital-intensive investment decision. These decisions are negatively affected by the current status of the renewable energy industry worldwide: an overcapacity in manufacturing facilities in Asia, Europe and the US may be able to absorb the demand from the South African market.
On the other side of the coin, there are developers who strongly support local content criteria and policies, and point to examples in Europe, where the lack of local manufacturing capabilities has resulted in subsidisation of Chinese imports. It does seem the thresholds are being achieved; however, targets as high as 65% are reminiscent of China’s local content requirement of 70% for wind farms, which was introduced in 2004, but revoked in 2009. Some cite the challenging targets as the reason why development has stalled25.
Solution: The Government is working towards optimising the current local content policy, as evidenced by adjustments to the RFP to date.
Perhaps a compromise could be reached by restructuring the local content criteria to isolate specific components that would maximise job creation. It seems that the DOE may be headed this way, given that the Department specifically lists key components which the Government has earmarked for manufacturing in South Africa, including wind turbine blades and towers, PV modules, PV inverters and the metal structures used in PV plants. In a similar vein, the Department has also recognised components where South Africa may not conceivably be competitive. For example, raw or unworked steel and aluminium products, which are sourced abroad, but used for manufacturing components locally, are recognised as 100% local.
25 Global lessons learnt can boost SA renewables success, http://www.ee.co.za/wp-content/uploads/legacy/Energize%20RE%202013/energize-re-supplement_pf-global-lessons.pdf

29
Other potential ideas include prioritising skills transfer or investing in the research and development of innovative technologies that could dramatically affect the renewable energy industry globally. That way, the Government is not ‘subsidising’ locally-manufactured renewable energy components that are uncompetitive in other markets, but rather first movers who need to demonstrate their technology for market adaptation globally. For example, energy storage solutions that could minimise grid impact may be more easily introduced in South Africa, where investment is already necessary to strengthen the network.
An evaluation of the localisation potential of the renewable energy industry in South Africa is beyond the scope of this paper. In short, further research should be undertaken, taking into account global lessons learnt, the current experience in setting up local manufacturing in South Africa, as well as a macroeconomic study that would look at the dynamics of supply and demand and an optimisation of policies that look at the job creation potential by South African industry.

3026
June 2012 and November 2013 DOE presentations.27
These include some equity commitments to projects where financiers have typically underwritten equity alongside their debt commitments (e.g. Investec, IDC and DBSA).
FINANCIAL ASPECTS OF REIPPPPOVERVIEW OF THE FINANCIAL ASPECTS OF REIPPPPTOTAL FINANCING REQUIRED FOR REIPPPP PROJECTS AND SOURCES THEREOFApproximately R118 billion has been committed across the first three rounds of the Programme: R46 billion in Round 1; R28 billion in Round 2; and R44 billion in Round 326. Assuming an average debt-to-equity ratio of 70:30, this translates to approximately R83 billion in debt and R35 billion in equity.
The majority (R68 billion) of the total debt financing has been provided by local commercial banks: Absa, Investec, Nedbank, Rand Merchant Bank and Standard Bank; followed by the domestic development finance institutions (DFIs), with the Industrial Development Corporation (IDC) and the Development Bank of Southern Africa (DBSA) taking up R25.3 billion, as shown in Figure [9]. International DFIs are becoming increasingly active, although much of their participation has been in the post-bid syndication process to date.
Figure 9: Summary Of Debt Financiers’ Participation And Financial Commitment27
20
15
10
05
0
Deb
t ca
pit
al c
om
mit
ted
(R
’bn
)
Nedbank
No. of projects: 23 11 16 14 4 22 20
RMB Standard Bank
ABSA Investec IDC* DBSA*
17.616.5 16.3
15.6
3.8
13.1 12.2
Round 1Large Portion of IDC and DBSA debt used to finance equity investments
(e.g. BEE Shareholders) Round 2
Round 3
Source: Various media announcements, discussions with financiers
The Programme requires a minimum of 40% South African shareholding in the project companies, which translates to an estimated maximum-allowed foreign equity investment of R21 billion. Figure [10] lists some of the largest foreign and non-foreign shareholders in the Programme to date. Where equity shareholding is taken up by foreign entities, this is generally provided on a sponsor basis.
The largest foreign shareholders in REIPPPP projects have been major foreign utilities and project developers. Foreign EPC contractors have also taken a large share of project equity. Although not always the case, this is sometimes as a result of pressure from financiers to ensure alignment of interests, as well as to provide comfort to local stakeholders, given the technical know-how that the nascent local industry needs.

31
Figure 10: Major Equity Providers To REIPPPP Projects
Major Equity Investors - Estimated equity investments based on estimated capital cost per project, debt: -equity splits and shareholdings as disclosed in presentations to NERSA.
Sources and key assumptions:
1. The figure above reflects the top investors in REIPPPP by estimated equity invested.
2. In preparing this table, the author has relied primarily on information publicly available in the presentations prepared by
each project developer and presented to NERSA, where these have been published on the NERSA website.
3. Where presentations are not available (14 out of 64 projects to date), alternative sources of publicly available information
including developer websites and published news articles relating to the specific projects have been used.
4. In the few instances where shareholding information is still not available, assumptions have been made in line with the
minimum or maximum ownership requirements of the RFP (i.e. 2.5% for BBBEE ownership; 12% for BEE; 25.5% for
local investors; and 60% for foreign investors).
5. Where shareholdings of joint ventures or entities with similar joint ownership are not available (e.g. SolarReserve/
Intikon; AE-AMD), equal shareholdings of the joint venture from each principal have been assumed.
6. Total capital costs per technology per round have been sourced from DOE presentations and used to determine an
average ‘capital cost per MW’ for each technology per round, which is then multiplied by the capacity of each project
to estimate the total cost of each project. In most cases, these estimates are in line with the actual project costs where
these have been disclosed.
7. The debt:equity ratio of each project is then applied to the total project cost to estimate the equity investment. Where
debt:equity ratios have not been disclosed, a 30:70 ratio has been assumed.
8. Finally, each developer’s project shareholding is then applied to the project equity investment to estimate the equity
invested by each shareholder in each individual project, and these are summed to derive the estimated total equity
investment per shareholder.
9. Some major equity investors may not appear in this figure as they acquired their shareholding after the NERSA
presentations had been made.
No. of projects: 2 7 6 10 4 2 2 2 2 2 23 3 3 3 3 51 1410
3000 2,816
2,610
1,741
Abeng
oa
IDC
Enel
Main
strea
m
Old M
utua
l
PIC
Cenne
rgi
Scate
c Sola
r
Globele
q
Solar C
apita
l
Long
yuan
Accion
a
Buildin
g Ene
rgy
Kensa
ni
ACS Cob
ra
ACWA
SolarR
eser
ve
Intik
on E
nerg
y
Inve
stec
Gesta
mp
Muli
lo
1,461 1,3551,204 1,175
1,007 859 859760 728 686 655 538 538
530 530451 448 436
2500
2000
1500
1000
500
Est
imat
ed e
qu
ity
inve
sted
(R
’bn
)
0
Local Investors Foreign Investors

32
Lastly, the Programme sets out minimum thresholds for shareholding in the project equity by black economic empowerment entities. The Programme makes a further distinction between ownership by local communities (Broad-Based Black Economic Empowerment – BBBEE) and other black economic empowerment funds and/or companies (Black Economic Empowerment – BEE). For example, each project must have at least 12% BEE shareholding and 2.5% ownership from a local community (BBBEE), which refers to towns and villages located within 50 kilometres of the project site. Bidders are also incentivised to maximise the level of BBBEE ownership, given its weighting on the economic development scorecard. As a result, some projects exceeded the minimum targets, with some noteworthy examples achieving levels above 30 percent of BBBEE/BEE ownership.
Table [5] shows an estimation of funding commitments from various shareholders split into categories of BBBEE, BEE, foreign and local shareholders. This table is based on actual published data where available, and where data was unavailable, an estimate was used based on the minimum requirements set under REIPPPP. Local shareholding was also assumed to be at the minimum of 40%, unless publicly disclosed.
The table shows that projects have substantial foreign shareholding, with the commitments being split almost 50:50 between foreign and local (including BBBEE and BEE) shareholders. BBBEE and BEE shareholding has been funded in most cases by the IDC and DBSA.
Some examples of corporate or vendor financing of BBBEE and BEE shareholders have emerged in the latest rounds. One specific example is Enel’s portfolio of six projects awarded in Round 3. Their BEE investments are understood to have been financed on the back of a corporate guarantee.
Table 5: Estimated Profiles Of Equity Shareholdings
MW BBBEE BEE Local (Ex BEE) Foreign Total (‘ZAR million’) (Assumed) BBBEE BEE Local (Ex BEE) ForeignRound 1
PV 632 8% 25% 9% 58% 100% 21,937 30% 543 1,632 597 3,810 Wind 634 11% 14% 32% 44% 100% 12,724 30% 403 532 1,203 1,679 CSP 150 20% 0% 29% 51% 100% 11,365 30% 682 - 989 1,739
R1 Total 1,416 46,026 1,628 2,164 2,788 7,228
Round 2
PV 417 5% 16% 22% 57% 100% 12,048 30% 177 582 795 2,060 Wind 563 10% 8% 51% 30% 100% 10,897 30% 338 272 1,669 990 CSP 50 10% 15% 25% 51% 100% 4,483 30% 134 195 336 679
R2 Total 1,030 27,428 650 1,049 2,800 3,729 Round 3
PV 435 13% 23% 11% 53% 100% 8,145 27% 286 519 242 1,184
Wind 787 13% 10% 26% 51% 100% 16,969 27% 588 467 1,219 2,365 CSP 200 18% 8% 45% 30% 100% 17,949 30% 942 404 2,423 1,615
R3 Total 1,422 43,063 1,817 1,390 3,884 5,164
Total 3,867 12% 13% 28% 47% 116,517 34,292 4,095 4,603 9,472 16,121
WEIGHTED AVERAGE EQUITY PERCENTAGE CAPEX PROJECT EQUITY EQUITY COMMITMENT (‘ZAR MILLION’)
Source: Compiled from various NERSA presentations.

33
KEY REIPPPP FINANCIAL QUALIFICATION CRITERIA In a very prescriptive manner, the RFP sets out the requirements for financing projects in the Programme. While it allows for a variety of funding structures to be employed, stringent qualification criteria for each form of finance must be met in order to give the DOE comfort that the commitments are robust, and that there is no risk of a funding shortfall that would jeopardise the projects reaching financial close within the prescribed timelines.
Four key criteria are set out for financial qualification per the RFP: i) price; ii) financial standing; iii) robustness and delivery of the funding proposal; and iv) robustness of the financial models.
Criteria (i) and (iv) are relatively straightforward, in that one must submit partial and full indexation prices and audited financial models wherein all the technical and financial assumptions reconcile to the bid submission.
Criterion (ii) (financial standing) relates to corporate and equity finance. A number of details must be disclosed in the bid, such as the source of finance (for example, cash reserves, fundraising from external sources, etc.), audited financial statements28 (over three years), as well as the fulfilment of a proven track record test (over five years) or a net asset test (over three years). That is, the financier must show that it has either maintained average net assets of at least its proposed financing for the project over the previous three years; or that it has raised funding of a value that is at least as much as its proposed financing for the project.
Criterion (iii), robustness and deliverability of the funding proposal, requires a detailed breakdown of sources and uses of funds, including the disclosure of any development fees or success payments. Letters of support (with evidence of full board approval) specifying any conditions to funding are required from each financier, whether providing debt, equity, BBBEE or corporate finance. Detailed debt term sheets must be attached that include the cost of the debt, commitment amount, fees, tenor, grace periods and cover ratios, among other required terms. Similarly, the terms of the equity, BBBEE or corporate finance must also be attached, with confirmation that certain key elements of the funding, such as target equity return, are fixed. Bidders are also required to submit a mitigation strategy in the event that the proposed funders are unable to provide finance on the disclosed terms.
The level of granularity of detail regarding the proposed financing plan and terms is very high, even by international standards. However, as discussed in Section [2.1], one of the DOE’s primary objectives of the prescriptive Programme was ensuring a successful tender process. The exhaustive list of financial qualification criteria mitigates the risk that the project will not be able to procure finance based on the specific project characteristics and the tariff level bid.
STATUS QUO FINANCING: PROJECT FINANCING IN THE SOUTH AFRICAN MARKETCurrency DenominationAs shown in Figure [9], local funding sources have provided the majority of debt finance to projects in the Programme. Given that the PPA is denominated in South African rand (ZAR), projects employing foreign currency debt are exposed to exchange rate risk through the mismatch between the currency of the project revenues and the project debt service obligations.
28 Per the updated Round 4 RFP, audited statutory financial accounts are no longer required in bid submission for parent companies providing corporate finance.

34 29 Project Financing: Asset-Based Financial Engineering. Finnerty, 2007.
The ZAR’s volatility, and thus the costliness of hedging instruments such as cross currency swaps, brings into question the financial viability of raising foreign funding for these projects. The experience over the last three rounds of the Programme indicate that foreign financiers were largely unable to provide competitive ZAR funding with tenors of 15 to 18 years, as provided by the local banking and DFI community. This is discussed further in Section [3.2.4] under diversification of funding sources. It is important to note that this situation is not unique to South Africa, and would most likely apply to any non-RE manufacturing country with an emerging market currency.
StructureIn terms of finance structure, project finance (the raising of funds on a ring-fenced project basis where the financiers look to the project’s cash flows as the source of funds to service their debt) has been the most widely-employed funding method. Given its limited/non-recourse nature, project finance is generally the preferred structure for large-scale infrastructure projects globally, including renewable energy. By permitting the sharing of operational and financial risks, project finance is generally more flexible than financing on the sponsors’ general credit. This is particularly advantageous when the economic, technical, environmental or regulatory risks are of such magnitude that it would be impractical for a single party to undertake them29.
One of the largest drawbacks to project finance is that it involves an extremely time-consuming process and is associated with high transaction costs. Given that these costs are generally fixed for a project regardless of size, a 100 MW project would have a significant benefit over a 20 MW project, with an ability to amortise the cost over a greater total project value, thereby making smaller projects in the Programme largely uncompetitive.
In the South African REIPPPP context, pre-bid due diligence for projects financed on this basis require a number of independent sponsor and lender advisory reports covering the technical, legal, financial and insurance elements of the project. In order to give lenders sufficient time to get comfortable with the project’s risk allocation structure (so that they can issue firm letters of support and sign off on preliminary credit approved term sheets for bid), a minimum of six weeks is often required for the due diligence process. Thus, projects must be nearly bid-ready well before the bid submission date in order to employ a project finance structure.
Figure [11] provides a diagram of a typical project finance structure in the Programme. These structures require a complicated documentation framework to ensure adequate allocation of risks to the various parties able to manage them.

35
Figure 11: Typical Project Finance Structure
Project SPV, Independent Power
Producer (IPP)
Max Foreign Sponsor RSA
GovernmentImplementation Agreement
(Parliamentary Decree)
Facility Management Contract
5-20 Year Operation & Maintenance
20 -Year Take or Pay Power Purchase
Consumables Supply Contract
ABC (Pty) Ltd
Contractor[Reputable]
EskomRSA Gov
Supplier[Reputable]
Environmental Authorities
Construction Permit
Direct Agreements
Shareholders Agreement & Shareholder
Loan Agreement
Min RSA Company
Local Bank
20%-30% Equity
Main Sub-Contractors
60%
40%
60%-80%Debt
DFI / Blank
Intercreditor Agreement
Security SPV
Debt Guarantor Agreement
Component Manufacturer /
Supplier
Technology / Turbine Supplier
Electrical Contractor
Civil Contractor
Fixed price EPC Contract
Contractor(Rating)
Facility Agreements
CTA & SeniorDebt
Security Agreements & Indemnity
Source: Finnerty, 2007, modified for REIPPPP-specific context.
Pricing referenceGiven that the majority of the funding has been ZAR-denominated, the project debt in the Programme has typically been priced off the Johannesburg Interbank Average Rate (JIBAR). DFIs have largely co-financed with commercial banks, with one well-known exception from a local DFI that provides debt funding on a fixed rate basis using the R186 government bond, maturing 2027, as a reference. This alternative pricing method has provided an appropriate match for typical debt tenors required by REIPPPP projects.
QuantumCommercial banks have typically funded between R500-1,500 million of a project’s total debt requirement (depending on the size of the project). It is unlikely that the large commercial banks will write a debt ticket for less than R500 million, given the cost and time implications of the diligence process discussed above.
Most projects in the Programme have been funded through club deals, with a single commercial bank rarely providing the funding on a standalone basis. This is due in part to the high funding requirements of projects, as well as an approach taken by the lenders to mitigate risk and to spread the due diligence workload. Commercial banks have designated limits on sector and single counterparty exposure (such as to Eskom), in order to achieve risk mitigation and diversification. In addition, project sponsors may see a club deal as a risk mitigation to ensure that the project is not beholden to the terms of a single debt financier. As shown in Section [2.2], the increasingly low success rate of projects also incentivises lenders to participate in a greater number of projects to increase the probability that they will be able to deploy capital for each round of bidding.

36
KEY TERMS AND FINANCIAL COVENANTS TYPICAL RANGESMinimum Senior Debt Cover Ratio 1.25x - 1.40x
Minimum Senior Loan Life Cover Ratio 1.30x - 1.45xEquity Lock-Up Cover Ratio 1.10x - 1.20x
Default Cover Ratio / Trigger Event 1.05x - 1.15x
Gearing1 60%-80%Tenor1 15-18 yearsGrace Period Potentially up to 1 yearAvailability Period (Drawdown)1,2 Wind / PV:12 - 24 months
CSP: 24 - 36 months All-in Margin1 270 - 400 bps (incl. liquidity
premium of ~120 bps and statutory costs of ~30 bps)
FX Hedging 90% - 100% during constructionInterest Rate Hedging 90% - 100% during construction
40% - 70% during construction
TermsWith the evolution of three rounds of the Programme, the commercial financing terms in the market have become fairly standard. Table [6] below sets out estimated ranges and averages, where appropriate, for the salient terms of funding projects in the Programme.
Table 6: Typical Terms In South Africa’s Project Financing Market
Source: Discussions with market participants
The above terms depend of course on the project’s risk profile and mitigation strategies. Given that in a project finance structure, lenders are dependent solely on project cash flows to repay their debt, and they would prefer to see any risks to those cash flows mitigated – meaning that the capital cost, revenue and expense assumptions should be fixed or as predictable as possible. Typically, this includes conditions for fully wrapped, fixed price, turnkey and lump sum engineering, procurement and construction (EPC) contracts with prescribed levels for liquidated damages for time and performance. Similarly, Operations and Maintenance (O&M) contracts are usually required for the duration of the project and to be price-certain for an agreed minimum number of years. As a general rule, the firmer the contracts related to project construction and operation, the lower the risk margins and the more leeway with certain debt constraints and terms.
Lending to a project prior to the start-up of construction, without protection against the various business and financial risks, would expose the project lenders to equity risks. Lenders, who are often fiduciaries, find it imprudent to assume technological, commercial or other business risks. Thus, if lenders are left exposed to some magnitude of project-related risks, they may require supplemental credit support through additional security arrangements. These arrangements will apply if the completion undertaking fails to provide the capital to enable the project to meet its debt service obligations.
Such mechanisms, also referred to as ‘backstops’, might take the form of a financial support agreement, such as a standby facility, a capital subscription agreement, a clawback agreement or an escrow fund. All of these agreements have a single purpose: they provide a commitment from one or more creditworthy parties to supply the cash that may be necessary for the project to meet its debt obligations.

37
HedgingIn addition to mitigating project-specific risks, financial risks that have to be addressed include exposure to interest rate and foreign exchange (FX) fluctuations. Lenders will require projects to enter into derivative instruments to hedge exposure to these financial risks. Because volatility in these variables could adversely affect project value or introduce variability of earnings and cash flows, project managers seek to avoid it, or at least reduce its effects, through hedging.
Banks lend on a floating-rate basis, which exposes projects to interest-rate risk. The sponsors can eliminate this risk exposure by swapping the floating interest rate for a fixed interest rate through an interest-rate swap. Similarly, if a project has future non-ZAR denominated payment obligations (for example, a turbine supplier may need to be paid in euros rather than ZAR), the lenders would require that the project enter into a foreign exchange hedging contract, in order to minimise the impact of movements in the exchange rate to the project economics.
The various commercial banks will have distinct credit requirements for interest rate and foreign exchange hedging. As shown in Table [6], commercial banks generally prefer that the exposure during construction is nearly fully covered. If the project is not hedged for market movements during construction, the project could be at risk of being underfunded. During the operations period, the commercial banks have differing views. For example, some require a minimum term of the operations to be fully hedged (for example, 100% during the first three years); while others may require a minimum amount to be hedged for the full term of the debt (for example, 50-70% for the 15- to 18-year term). That being said, increased flexibility with derivatives has evolved in the market since Round 1, with recognition that the most effective instruments are customised to suit a project’s particular characteristics and requirements. This may involve employing more advanced instruments, such as stepped-up swaps or interest rate caps.
SyndicationSyndication is a common practice among commercial banks, in which they look to sell assets in a secondary market, typically to other banks or institutional investors. This is becoming increasingly commonplace, given increased funding costs and constraints on capital and liquidity with the implementation of Basel III, and banks are thus increasingly looking to reduce their long-term positions by selling assets to institutional investors. In addition, REIPPPP projects are particularly attractive to institutional investors, given that they are a source of long-term and relatively low risk (once operational) annuity income. In REIPPPP, banks have taken different positions on syndication, with some looking to hold onto their funding commitments for the time being, and others executing a clear syndication strategy as early as financial close. For the most part, firms will not fully divest from any single project, as they want to keep exposure to economically sound, return-generating assets.
Given the confidential and proprietary nature of the information, it is difficult to quantify what portion of the total debt financing raised to date has been syndicated. However, over the last three years of REIPPPP, institutional appetite has grown significantly. One noteworthy positive development is the increased appetite from institutions to finance the construction phase. Other new industries in South Africa have not typically seen institutional investors willing to take construction risk this early in the development of a fledgling market. This is important for REIPPPP, given the large number of projects that require significant capital commitments to finance construction over the same time period.
Some of the largest institutional investors in REIPPPP have been Liberty, Sanlam, Futuregrowth and Old Mutual Specialised Finance (OMSFIN). There has also been significant DFI interest in syndicated assets, most notably from the German Development Bank (kFW) and its subsidiary, German Investment and Development Corporation (DEG); the Dutch Development Bank (FMO); the World Bank and its Clean Technology Fund; the International Finance Corporation (IFC); the

38 30 These funders do not appear in Figure 9 as major debt providers, given they acquired their positions after preferred bidder presentations had been made.
African Development Bank (AfDB), Agence Française de Développement (AFD), and China Banking Corporation (CBC)30. Participation from offshore investors has been limited, given the rand exposure and pricing. Typically, these investors seek higher yields for rand-denominated returns. There are also a few institutional renewable energy debt funds, including the Mergence Renewable Energy Debt Fund and the Vantage GreenX Fund. As more projects come on line, it is likely that there will be an increase in the number of institutional renewable energy platforms being established to meet the financing needs of the burgeoning market.
Projects do not typically receive any benefit from syndication (in terms of a step down in fees or margin); however, there is a possibility that as the market evolves, and syndication occurs post-COD, that such a mechanism may be incorporated into finance documents. In general, syndication has been successful in the REIPPPP market. While this is a reflection of the appetite for RE projects from institutions, this also reflects a well-structured and efficient process from banks’ distribution teams, who typically get involved prior to financial close in order to begin marketing the project to institutions.
BBBEE financingAll projects will include a BBBEE financing vehicle to support project ownership by disadvantaged communities and empowerment companies.
To date, the DBSA and IDC have provided the majority of BBBEE financing. Given the developmental role these finance institutions play in the country, both DBSA and IDC have mandates to provide this type of financing. Commercial banks usually do not have the risk appetite for these instruments, or the returns fall short of the commercial banks’ return hurdles and expectations. These instruments are most commonly repaid from equity dividends. Furthermore, many institutional investors would most likely prefer to invest directly in the equity, rather than in a vehicle which would limit their return, hence their limited involvement in BBBEE financing.
The DBSA has used a JIBAR-linked instrument, while the IDC has employed a preference share structure that targets a real rate of return. The basic premise of the funding is the same – there is a specified time period during which the instrument must vest under certain fixed terms, such as the upfront capital commitment of the BBBEE party and the level of trickle dividend permitted prior to vesting.
Both structures were employed through special purpose holding companies, as illustrated in Figure [12].
Figure 12: Typical BBBEE Funding Structure
CommunityTrust
CommunityHoldCo
BEE Funders BEE HoldCo DeveloperStrategic Equity
Partners
Project Company
BEE Investors
BEE Investors / Beneficiaries
BEE Holding Companies
BEE Funders Ordinary share investments
Other equity investors Preference share financing
Source: Discussions with IDC and DBSA

39
CHALLENGES AND CONSEQUENCES IN THE CURRENT FUNDING MODELFinancing projects in the Programme has not been without its challenges. As is widely known, the levelized cost of renewable energy generation is extremely sensitive to high financing costs, given the upfront capital intensity of the investment. Thus, a key focus for the sustainability of renewable energy in South Africa must be on identifying innovative approaches to lower the cost of funding.
This section gives an overview of some of the distinct finance-related hurdles that REIPPPP participants have encountered since the inception of the Programme. Some of these obstacles are inherent in project finance transactions, while others are particular to the South African market, and more specifically to the Programme’s structure. If mechanisms could be identified in the Programme to ease these constraints on financing renewable energy projects, the ultimate cost of power delivered to the grid could be reduced significantly.
FINANCIAL CLOSE AND MARKET MOVEMENTS
Challenge: How to ensure that all projects reach financial close in a reasonable timeframe that will not delay megawatts onto the grid.
Financial close is typically defined as the time when all conditions precedent (CPs) to legal agreements and contracts have been satisfied or waived, and all necessary documentation has been executed. Only at this stage will projects be able to draw down on the funding commitments provided by debt providers.
As discussed in Section [2.1], the DOE sets a firm date for financial close for each round of procurement. On the face of it, this seems a prudent course of action: the country is in urgent need of power on the grid, and a delayed financial close would prolong the wait for new commercially operating power plants. Furthermore, examples abound internationally of power projects chasing an indefinite date for financial close over time periods spanning multiple years. An indefinite date can allow inestimable time for negotiation, whereas a fixed date tends to accelerate the negotiation process, given that the parties to the transaction have a mutual understanding that concessions on both sides need to be made in order to meet the time constraint imposed, or else the project will fail to be executed. In the South African REIPPPP context, the cost of such failure is even more pronounced, given that millions of rand are at stake in the forfeiture of bid bonds (a 100 MW project would have R20 million at risk in bid guarantees at Preferred Bidder stage).
Before moving on to the consequences, an important distinction must be made between DOE Financial Close (DOE-Signing or DOE Close) and Lender Financial Close (financial close), in that they may not necessarily occur on the same day. Projects endeavour to reach financial close as soon as possible after DOE-Signing, in order to place hedges expeditiously and limit exposure to market movements. However, projects that do not manage the process timeously, could face delays and might be at risk of not achieving financial close – given that they are unable to execute hedges on time and are exposed to market swings.
Consequence: Significant hedging requirements must flow through the market effectively on the same day, which can have a pronounced effect on the FX and swap markets.

40
While there is valid reasoning for the DOE’s approach to setting a fixed date for financial close, there have been significant consequences at the market level that pose a systemic risk to financial close, and even more concerning, to the long-term sustainability of the Programme. Specifically, these relate to foreign exchange and interest rate market implications.
As discussed in Section [3.1], commercial banks in South Africa require that the project company enter into long-term contracts to hedge against foreign exchange and interest rate risk through the FX and swap market. While the hedging strategy is typically developed far in advance, the execution of the hedging contracts can only occur at financial close when all conditions precedent (including the DOE execution of the PPA) have been satisfied. Therein lies the problem: how does the market react to information that tens of billions of rand across some twenty projects needs to hedged, for all intents and purposes on the same day?
While other macroeconomic factors certainly influenced the FX and interest rate swap market leading up to and following the date of DOE-Signing in Rounds 1 and 2, Figure [13] depicts the market movements that occurred in each round.
Figure 13: Market Movements At Financial Close (Rounds 1 And 2)
Round 1
Round 2
Source: Bloomberg
The charts clearly indicate the impact of the REIPPPP hedging activity on the markets, by the sharp run-up in FX and swap rates in each of the windows.
Markets around the time of both windows were particularly volatile due to major macroeconomic events, such as the South African ratings downgrade and the announcement by the US Federal Reserve Bank of its plans to taper its asset purchase programme, having a pronounced effect especially on emerging markets.
The notable exception to this is in the swap market in Round 1, can be seen in the chart at top right,

41
where sizeable offshore demand for fixed rates allowed the hedging to be absorbed, and resulted in a decrease in swap rates over the period. However, there does appear to have been some pre-hedging leading up to DOE close.
Across Rounds 1 and 2, it is fair to say that, given the volatility of the rand and its linkage to interest rates and the swap market, pushing tens of billions of rand of hedging through the market on or around the same day can have a pronounced effect. The rand depreciated from R9 to R10 to the dollar, and swaps ticked up 200 basis points in the window between DOE-Signing and financial close in Round 2. Further, advanced knowledge of these hedging requirements by non-REIPPPP market participants, which can lead to ‘front running’, can exacerbate the effect.
As will be discussed in Sections [3.2.2] and [3.2.3], this can have a significant impact on project economics, and can result in projects failing to achieve financial close. These sections seek further to explore the risks related to foreign exchange and interest rate exposure, which go hand-in-hand with this section on market movements.
Solution: Stagger DOE-Signing or extend the window in which projects are permitted to reach financial close.
The DOE has announced that it intends to introduce staggering of DOE-Signing dates for Round 3, which will allow project companies more time to execute hedges and spread out the execution of the required hedges. This should reduce pressure on the market, leading to reduced execution costs for the project companies. In addition, it will create uncertainty for non-REIPPPP market participants in the rand market around actual closing dates and limit the scope for such participants to take advantage of the hedging requirements through trading positions. This solution is discussed further in Section [3.2.2].
FOREIGN EXCHANGE EXPOSUREChallenge: Recognising the volatility of the rand and the import-intensive nature of RE projects, how to ensure projects will not be at risk of failing to achieve financial close due to movements in the FX rate from bid submission.
It is well known that the rand is one of the more liquid emerging market currencies. This results in it often being used as proxy for emerging market risk, which can give rise to relatively high volatility. As shown in Figure [14] below, monthly swings as high as five percent are not uncommon.
Figure 14: ZAR Volatility
ZAR monthly % change vs. USD and EUR ZAR daily closing rate vs. USD and EUR
Source: Bloomberg
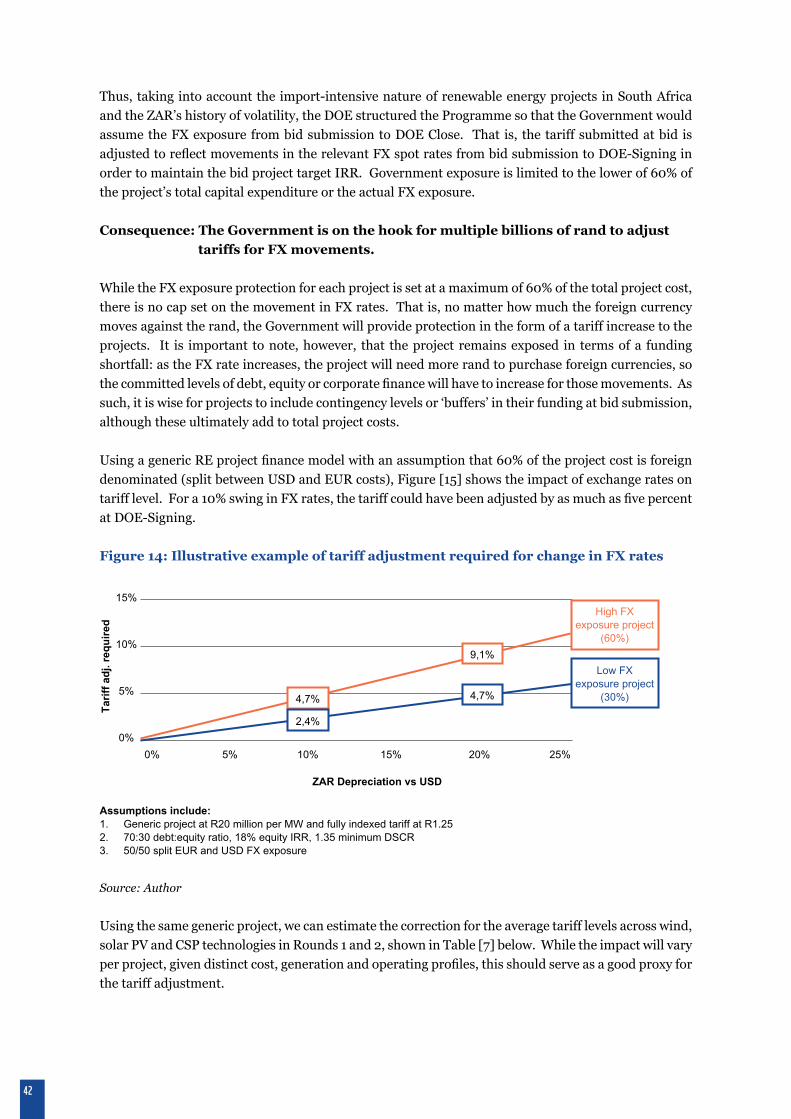
42
Thus, taking into account the import-intensive nature of renewable energy projects in South Africa and the ZAR’s history of volatility, the DOE structured the Programme so that the Government would assume the FX exposure from bid submission to DOE Close. That is, the tariff submitted at bid is adjusted to reflect movements in the relevant FX spot rates from bid submission to DOE-Signing in order to maintain the bid project target IRR. Government exposure is limited to the lower of 60% of the project’s total capital expenditure or the actual FX exposure.
Consequence: The Government is on the hook for multiple billions of rand to adjust tariffs for FX movements.
While the FX exposure protection for each project is set at a maximum of 60% of the total project cost, there is no cap set on the movement in FX rates. That is, no matter how much the foreign currency moves against the rand, the Government will provide protection in the form of a tariff increase to the projects. It is important to note, however, that the project remains exposed in terms of a funding shortfall: as the FX rate increases, the project will need more rand to purchase foreign currencies, so the committed levels of debt, equity or corporate finance will have to increase for those movements. As such, it is wise for projects to include contingency levels or ‘buffers’ in their funding at bid submission, although these ultimately add to total project costs.
Using a generic RE project finance model with an assumption that 60% of the project cost is foreign denominated (split between USD and EUR costs), Figure [15] shows the impact of exchange rates on tariff level. For a 10% swing in FX rates, the tariff could have been adjusted by as much as five percent at DOE-Signing.
Figure 14: Illustrative example of tariff adjustment required for change in FX rates
Source: Author
Using the same generic project, we can estimate the correction for the average tariff levels across wind, solar PV and CSP technologies in Rounds 1 and 2, shown in Table [7] below. While the impact will vary per project, given distinct cost, generation and operating profiles, this should serve as a good proxy for the tariff adjustment.
ZAR Depreciation vs USD
4,7%
2,4%
0%
0% 15%5% 20%10% 25%
5%
10%
15%
4,7%
9,1%
High FX exposure project
(60%)
Low FX exposure project
(30%)
Tar
iff
adj.
req
uir
ed
Assumptions include:1. Generic project at R20 million per MW and fully indexed tariff at R1.25 2. 70:30 debt:equity ratio, 18% equity IRR, 1.35 minimum DSCR 3. 50/50 split EUR and USD FX exposure

43
RELEVANT FX ADJUSTMENTS ROUND 1 ROUND 2Exchange Rates 5 Nov -12 9 May-13
EUR: ZARBid Submission 10.69 10.35Financial Close 11.25 11.84
%Change 5.2% 14.4%USD: ZAR
Bid Submission 8.00 7.94Financial Close 8.77 9.00
%Change 9.6% 13.4%Average Bid Tariffs (ZAR/KWH)
Wind 1.14 0.90Solar PV 2.76 1.65
CSP 2.69 2.51Tariff Adjustments
High FX Exposure 3.36% 6.53%Wind 1.18 0.96
Solar PV 2.85 1.75CSP 2.78 2.68
Low FX Exposure 1.72% 3.34%Wind 1.16 0.93
Solar PV 2.81 1.70CSP 2.73 2.60
Table 7: Example Of Tariff Adjustment Required From Bid To Financial Close To Maintain Equity IRR At Bid Levels As A Result Of Movement In FX Rates
Source: Author
From here, we know the total megawatts procured for each technology in Rounds 1 and 2, so we can use standard industry capacity factors to determine the annual generation for each technology. Using the difference between financial close tariffs and bid tariffs, we can estimate the FX premium covered in Rounds 1 and 2. Table [8] below shows the increase in the total procurement cost to Eskom over the life of the projects calculated at between R4 and R8 billion in today’s terms. While this may seem to be a significant amount, the additional cost to Eskom is negligible, given the very low contribution of renewable energy generation to Eskom’s total energy mix (the author calculates the impact would be between 0.26% and 0.47%).
Assumptions include:1. % Change in tariff level is the same for all technologies in each round given generic assumption of 50/50 split of USD
and EUR foreign denominated costs 2. Tariff levels based on 2011 baseline data for comparison purposes

44
ROUND 1 ROUND 2Total Capacity (MW) 1 416 1 030 Avg. Capacity Factor (%) 30% 30%Annual Generation (MWh) 3, 712, 313 2 ,686, 946Average Premium (ZAR per MWh) (1)
High FX Exposure 68,1 83,5Low FX Exposure 34,8 42,7Annual Premium (ZAR in millions) (2)
High FX Exposure 282,5 250,6Low FX Exposure 144,4 128,1Total Premium over PPA Life (ZAR in millions)High FX Exposure 10 062.2 8 926.8Low FX Exposure 5, 144.3 4, 562.4NPV of Premium @ 8.5% (ZAR in millions) (3)
High FX Exposure 4 108,1 3 644,5Low FX Exposure 2, 100.3 1, 862.7
Table 8: Cumulative Cost Of Tariff Adjustments For FX Movements
Source: Author
Consequence: Projects are still exposed to movements in FX rates post-DOE Financial Close.
As stated above, there is an important distinction between DOE Close and financial close.The Department will correct bidders for the spot rate at DOE-Signing. Any movements from the spot rate at DOE-Signing to financial close are the project’s risk.
As discussed in Section [3.2.1], financial close occurs only when all CPs have been satisfied or waived. The CP process is a time-consuming undertaking, only achieved once all lenders are satisfied with the necessary corporate documentation, project, finance and security documents, environmental authorisations, insurance and tax provisions, among others. If a project does not manage its CP process effectively before DOE-Signing, it could take weeks before the project could execute its hedging strategy. The DOE does set a cut-off date for financial close (the date at which the project must submit a post-hedge model); however, it will not provide any further protection on the FX rate between DOE-Signing and financial close.
In order to quantify the project exposure during this period, we’ll use the example of a generic 100 MW solar project with the average bid tariff of R1.65 per kWh, with tariffs corrected per Table [7] to R1.76 per kWh for movements between bid and DOE-Signing. From that point, the rand depreciated from ZAR9/US$ to ZAR10/US$, which would have required a further increase to approximately R1.85 per kWh in order to maintain the target equity IRR from bid submission. Given that no tariff adjustment is possible from this period, the project’s financial close economics would have been jeopardised. The equity IRR would have fallen over 200 basis points, and the debt would have been under pressure to meet minimum cover ratios, which would most likely have led to restructuring of the project’s capital structure. From this, it is clear that the Programme can better absorb the movement in FX than the
Assumptions include:1. Total capacity: Includes wind, solar and CSP from Rounds 1 and 2; excludes 14 MW of small hydro2. Capacity Factor: Weighted average of estimated capacity factors for solar (24%), wind (33%) and CSP (42%)3. Average premium based on Table [12] above, on April 2011 baseline figures4. Assumed discount rate equal to yield on 10-year government bond

45
20-month Construction Schedule EUR Drawdown Forward Points ZAR Equivalent1. 30-Sep-2014 12 225 000 14,72 180 000 0002. 31-Oct-2014 1 630 000 14,82 24 149 5483. 30-Nov-2014 2 445 000 14,90 36 436 3784. 31-Dec-2014 2 852 500 14,98 42 722 7965. 31-Jan-2015 3 260 000 15,07 49 136 7126. 28-Feb-2015 3 667 500 15,15 55 576 5547. 31-Mar-2015 4 075 000 15,24 62 104 4208. 30-Apr-2015 4 890 000 15,33 74 961 8079. 31-May-2015 5 297 500 15,42 81 663 61710. 30-Jun-2015 6 520 000 15,52 101 188 14011. 31-Jul-2015 4 075 000 15,60 63 582 99112. 31-Aug-2015 3 260 000 15,70 51 179 39313. 30-Sep-2015 2 852 500 15,80 45 066 91314. 31-Oct-2015 5 705 000 15,89 90 640 49815. 30-Nov-2015 4 075 000 15,98 65 130 49616. 31-Dec-2015 3 260 000 16,09 52 443 87517. 31-Jan-2016 3 260 000 16,18 52 761 99118. 29-Feb-2016 2 852 500 16,29 46 462 30319. 31-Mar-2016 2 037 500 16,39 33 404 16320. 30-Apr-2016 3 260 000 16,49 53 761 573
81 500 000 1 262 374 167Total Hedging Cost Value: 62 374 167Total Hedging Cost as % of Base Rate Cost: 5,2%
projects can, so it was an astute decision by the DOE to cover projects for this exposure. However, the DOE has not provided blanket protection for FX exposure. Projects will still incur costs to hedge the FX curve from financial close. That is, projects enter into hedges at financial close based on the forward market exchange rates, so any difference between those rates and the spot rate at DOE Financial Close are for the project’s cost. Depending on the size of the project, the amount of foreign currency exposure, the construction period, the drawdown schedule and the FX forward curve, this could represent millions of rand in hedging costs. Table [9] gives an example of a 20-month construction schedule and the calculation of hedging costs for the forward curve for EUR:ZAR. For CSP projects, where the currency exposure typically approaches the upper limit of 60% and construction spans nearly three years, the hedging costs can be well over R200 million. As a general rule of thumb, the greater the FX component and the longer the construction schedule, the higher the FX hedging costs. This cost, however, is an input at bid submission, and provided there is no significant change to the shape of the forward curve, the project’s target IRR should not be affected materially at financial close by this cost.
Table 9: Example Of Hedging Costs From Generic Flows 1
Source: Adapted from Bloomberg data
Assumptions include:1. R2 billion project with 60% EUR-denominated value2. Long-dated FX exposure, 70% spread across months 12-203. Base Rate Cost: ZAR-equivalent of EUR-denominated value without hedging costs

46
Solution: At the project level, maximise local content to minimise exposure to FX risk and manage CP process effectively
At the project level, the key solution is to maximise local content. However, as discussed in Section [2.2.6], this can also have implications on project costs and increase the tariff that the project is able to bid, given a nascent manufacturing market for renewable energy projects and potentially uncompetitive local content costs. Projects could also explore options for a natural hedge if a shareholder will be investing equity in the same currency as the FX exposure of the contract. A variety of additional hedging techniques could also be employed, including, for example, currency options such as capped flat forwards. However, each project would need to evaluate the cost of these options compared to entering into forward exchange contracts. To date, the cost of these options has been more expensive for projects in REIPPPP than entering into synthetic forwards.
Managing the CP process closely is important to ensure that the project can execute hedges as close to DOE-Signing as possible, and reduce the period in which the project is exposed to FX market risk.
Solution: At the Programme level, allow projects to reach DOE Close on a staggered basis.
As discussed in Section [3.2.1], staggering DOE-Signing dates may help reduce the volatility of the FX market surrounding financial close, thereby reducing the FX risk to both Government and projects.
Allowing projects flexibility about when to hedge, may also help them manage their CP process, which can vary significantly for different projects and technologies. For example, a solar PV project may be able to complete its CP process only a few months after achieving Preferred Bidder status. Thus, they may be able to take advantage of a lower exchange rate (also translating to a lower cost burden to the Government), if there is no restriction on the date for DOE-Signing. Furthermore, projects may have increased negotiating power with suppliers to get fixed rand pricing if the gap between bid submission and financial close is shortened (the duration for which the contract price is fixed has an impact on how a foreign company will price the rand-denominated portion of its contract)31.
To manage their exposure, the DOE could also consider using an average rate to fix the level of the rand when the contracts are signed. Using the average rate over a 30-day period post-DOE-Signing can mitigate some of the volatility compared to the fixed level set on signing date. In periods of extreme volatility as witnessed in Round 2, using an average rate would also provide some relief for the project companies, and flexibility when applying appropriate hedging strategies. This limits the FX volatility for the DOE to 30 days.
INTEREST RATE AND INFLATION EXPOSUREChallenge: How to manage two key variables in the project economics: interest rate and inflation over 15-20 years in the absence of DOE guidance and cure.
While the DOE provides a significant amount of risk mitigation for FX exposure, the same does not apply to interest rate risk. This can present a challenge for projects given the volatility of the swaps market and long lead times between bid submission and financial close.
Consequence: The volatility of the swaps market has placed some projects at risk of not reaching financial close, given the lack of DOE guidance on interest rate assumptions, and cure for movements in interest rates from bid submission to DOE Close.
31 The RFP stipulates that contract prices must be fixed for a minimum period of 365 days.

47
Given that developers typically submit bids a full year before they can reach financial close, they remain significantly exposed to movements in interest rates. The fundamental decision of whether or not to invest in the project, could therefore change, based on a substantial movement in interest rates affecting the levels of returns on which the bidders based their commitments.
As shown in Figure [16] below, in the 12 months that have elapsed before Round 3 bid submission to September 2014, there have been movements of roughly 200 basis points in the swaps market. Keeping all other variables constant, an increase of 200 basis points on rates could translate to a decrease of over 250 basis points in the equity IRR, as shown in Figure [16]. Given there is no cure available from the DOE, this could place projects at risk of not closing.
Figure 16: Relationship Between Interest Rate And Equity IRR
Movement in swap rates: Round 3 bid submission to date
Illustrative example of impact on equity IRR of increasing rates
Source: Bloomberg, Author
Furthermore, while the DOE provides assumptions for FX and inflation for bid submission, the DOE does not provide any guidance on interest rates, which has meant that assumptions for interest rates have varied significantly across projects. This allows developers who model aggressive assumptions to present a stronger economic case than those modelling conservative assumptions.
Consequence: Hedging interest rates at the wrong point in the cycle could prove a greater detriment than benefit to the project.
In an inflation targeting monetary policy regime such as South Africa’s, inflation and interest rates are inextricably linked. Interest rates are often used to target inflation with a tightening, or rate increases are used to head off inflation and easing, or rate decreases are aimed at spurring economic growth. Figure [17] below shows the relationship between inflation and interest rates in South Africa over the last six years.
Assumptions include:1. 100% hedged during construction, 50% hedged for operations, weighted average cost of debt 12.5%2. Generic project at R20 million per MW and fully indexed tariff at R1.25 3. 70:30 debt:equity ratio, 18% equity IRR, 1.35 minimum DSCR

48
Figure 17: Relationship Between Interest Rates And Inflation In South Africa: 01/01/2008 – 31/07/2014
Relationship between inflation and interest rates
14%
12%
10%
8%
6%
4%
2%
0%
Jan 08 Jan 09 Jan 10 Jan 11 Jan 12 Jan 13 Jan 14
CPI (% Change Y/Y) 3m JIBAR
Source: FactSet, SAFEX, 5 August 2014
At a fundamental level, inflation and interest rates follow similar curves, so the project in a sense has a natural hedge. However, swap rates are not the same as floating interest rates. Swap rates price for where the market thinks interest rates will go. For example, if the market believes that the Reserve Bank will increase rates over the course of the next few months, the swap rates will increase to price this expectation. If a project therefore locks in this swap rate, and the Reserve Bank does not raise rates, the floating rate (and therefore, inflation) may stay at lower levels and the project could be left with higher interest and lower inflation, with a material impact on project cash flows. Inflation forecasts should therefore be incorporated when modelling economics of projects. There is currently a mismatch between the fixed inflation forecasts stipulated by the RFP (used to adjust revenue), and the higher inflation forecasts implicit in the forward interest rate curves (used to model costs).
While REIPPPP projects to date have been fortunate to obtain funding at or near the bottom of a local interest rate cycle, future projects may be required to fix rates at the top of a cycle, which would result in increased tariffs being bid.
Solution: At the Programme level, the DOE could provide guidance on interest rates, so that if a material market movement occurs, the Department would be able to take measures to provide relief uniformly from baseline assumptions.
The DOE could consider providing a universally adopted curve for interest rates used for bid submission so that all projects would be evaluated on a ‘like-for-like’ basis. Furthermore, if there were a systemic risk to financial close due to sharp rises in interest rates, the DOE could consider an adjustment, but would only be able to do so if the baseline assumptions in the bid models were uniform. This could be done by providing a standard forward interest rate curve as a requirement for the bid model. Figure [18] below serves to illustrate the potential tariff adjustment required for a significant change in interest rates.

49
Figure 18: Example Of Correction Of Average Tariff Levels Based On Movement In Interest Rates
Change in interest rates (bps)
Illustrative example of tariff adjustment required for change in interest rates to maintain equity IRRs
8%
6%
4%
2%
0%
+0 +150+50 +200+100 +250 +300
2,7%
5,3%
7,8%
Source: Author
Solution: At a project level, choose derivatives that offer greater flexibility for breakage and explore inflation-linked debt.
Each project will vary and derivatives should be tailored to a project’s unique cash flow characteristics. A variety of alternatives to swaps, such as options, swaptions and interest rate caps could be explored. The ability to hedge using financial instruments and/or engineering is dependent on a well-developed and sophisticated financial market with sufficient liquidity. Derivatives that offer greater flexibility for breakages or allow the project to fix inflation on revenue or operating cash flow, may mitigate the risks discussed above. The South African market has, however, in some cases not had the requisite depth or liquidity to make such options attractive.
However, an alternative, which appears to be receiving greater consideration for REIPPPP projects, is the use of inflation-linked (CPI-linked) debt instruments as opposed to JIBAR-linked debt, which is currently the most commonly-used benchmark. Instead of a fixed nominal rate, the project receives a fixed real rate that will be adjusted upwards by inflation.
A number of factors have to be taken into consideration when exploring the use of CPI-linked instruments, including complexities with the drawdowns and the cost of unwinding. However, given that all REIPPPP projects receive some minimum threshold of inflation on revenues, using inflation-linked debt would create a natural hedge between revenue and interest costs, and make project economics less sensitive to changes in JIBAR and inflation. This can be seen in Figure [19], which illustrates the high sensitivity to inflation of a project with a fully-indexed tariff employing JIBAR-linked debt, compared to projects with fully-indexed tariffs employing CPI-linked debt that mimic the effect of a partially-indexed tariff.
Assumptions include:1. Correction calculated as shift in forward curve based on IRR in an unhedged model in order to keep projects on
like-for-like basis2. Generic project at R20 million per MW and fully indexed tariff at R1.25 3. 70:30 debt:equity ratio, 18% equity IRR, 1.35 minimum DSCR

50
Figure 19: Impact Of Inflation On Projects With CPI-Linked Debt Versus JIBAR-Linked Debt
5%
-1.5% -1% -0.5% 0% 5% 1% 1.5%
3%
1%
Imp
act
on
Eq
uit
y IR
R(b
ps)
Illustrative example of impact on equity IRR of changing inflation
Change in inflation
-1%
-3%
-5%
Fully-indexed tariff, no CPI debt Fully-indexed tariff, 80% CPI debt Partially-indexed tariff (20%)
Source: Author
While CPI-linked debt does present some challenges in terms of breakages, overall the use of CPI-linked debt would also reduce interest rate hedging costs. As a result, we may see CPI-debt become more prevalent in the market.
Some portion of the debt should also be left unhedged to allow more flexibility in refinancing if the project sponsors take a view that the project will become less risky over time and could therefore be financed at lower rates in the future. Breaking swap contracts can be very costly.
DIVERSIFICATION OF FUNDING SOURCESChallenge: How to ensure that projects receive firm funding commitments to mitigate the risk of not reaching financial close due to a funding shortfall.
The Programme is structured to ensure that the financing package submitted at bid is achievable (under the tariff submitted) through a variety of requirements, including letters of support and term sheets. Thus, the pricing and terms of the debt for these projects are locked in long before final due diligence processes and financial close. Domestic commercial banks are the largest providers of these pre-bid financial commitments.
This makes sense, given that South Africa has a well-established, sophisticated banking sector that has welcomed and engaged renewable energy project sponsors and developers long before REIPPPP was established. Since the inception of the Programme, the commercial banking sector has provided significant value to the market by acting swiftly to perform pre-bid due diligence on a large number of projects, and mobilising tens of billions of rand of financing to a nascent industry. They have demonstrated an ability to evaluate complex project risks and a willingness to bear construction and completion risk that other types of lenders would shy away from. As such, they have been a large part of the success of the Programme. However, it has also meant projects have become somewhat beholden to the banks’ terms.
Assumptions include:1. 100% hedged during construction, 50% hedged for operations, weighted average cost of debt 12.5%2. CPI parameters: Inflation of 5.7% and CPI debt margin of 5.0% 3. 70:30 debt:equity ratio, 18% equity IRR, 1.35 minimum DSCR

51
Consequence: Commercial banks dominate the market, even though there is a mismatch in long-term funding, given bank capital constraints – cost of debt is a limiting factor on tariff reduction.
While commercial banks are effective at taking greater risk upfront than other long-term debt providers, they also face funding and capital constraints in light of regulated reserve margins, which can add to the cost of the long-term debt they provide. The introduction of Basel III could further increase the cost for banks to provide long-term non-recourse project finance. Under Basel III, funding to renewable energy projects is not considered a liquid asset, and thus these assets will negatively affect liquidity coverage ratios.
Ultimately, these banks will most likely syndicate large portions of their debt to institutional investors, who do not have the same liquidity costs. Unfortunately, institutions have to date expressed a lack of interest in becoming involved pre-bid, given the perceived large workload and has been awarded. However, given mandate agreements with lenders, it is often difficult to restructure a lender pool post-bid without paying significant penalties.
Thus, institutional involvement has been largely effected through the syndications process. The commercial bank paper, including any bank costs and liquidity premiums, is thus passed on to the institutional investor, with no benefit from a reduction in the cost of debt from the withdrawal of bank costs. Syndications teams typically provide guidance to banks’ credit processes on what levels the projects’ debt might be transferred from the bank’s balance sheet in a secondary sale. This guidance typically takes into account institutional buyers’ appetite in terms of size and pricing under given market conditions.
Notwithstanding the important role commercial banks have played in jumpstarting the renewable energy industry in South Africa, further diversification of funding sources is needed to reduce the cost of debt and therefore tariffs bid. Furthermore, given the large pipeline of non-renewable, large-scale projects with substantial financing requirements expected to come on line over the course of the next few years, additional liquidity from additional sources, including foreign markets, could be sought to fund new projects.
Solution: Seek alternative financing vehicles, which would provide access to a larger, more diversified pool of investors.
Historically, and in the international market context, long-term insurance companies have been the principal source of long-term fixed rate loans in the project financing market. The major life insurance companies possess a high degree of investment sophistication, and their analytical ability allows them to make judgments on their own as to the credit risk and other risks present in highly complex undertakings, such as project financing. The universe of institutional investors, including pension funds, mutual funds, endowments and investment trusts, among others, are an appropriate long-term funding match for REIPPPP projects, given that they seek the annuity income that these projects provide post construction. As more projects are funded and additional operating history becomes available, there will most likely be more interest in funding projects earlier in the bid process.

52
A bridge funding market – which would be used to fund the higher risk construction / start-up phase of plants – has not yet developed for REIPPPP, but may reduce the long-term cost of debt, should this develop as the market matures.
In the US, renewable energy projects are often financed through bridge loans (mini-perm structures) for construction (usually for the construction period plus two years of operations), followed by long-term debt for the operations phase (offtake financing typically in the form of tax equity structures, which is beyond the scope of this report). In these structures, the refinancing risk between bridge and long-term financing sits with the project and the sponsors, but is split, because there are different pools of lenders with different risk appetites that would provide funding for the two distinct financing periods (higher risk construction period vs. proven and stable operating period).
There is also typically a significant cost reduction in the debt between these two periods. In South Africa, we have not yet seen the development of a similar practice. This is partly because finance must be committed upfront through letters of support for the full term of the project in order for a bid to be compliant (i.e. it is a condition of the DOE). In addition, a market of bridge lenders prepared to lend to a project that is exposed to refinance risk has not yet developed for South Africa, resulting in financing for the construction and the operating period typically being provided by the same lenders on a blended rate basis. While there is a clear benefit to the long-term debt offered by the South African commercial banks, in that the project faces no refinancing risk, there may be some lost value if the project cannot realise a pricing benefit for the long-term debt once the project is significantly de-risked and placed with institutional investors.
Bridge financing structures can be potentially attractive to commercial banks, given that the short-term nature is not as punitive from a capital intensity perspective. Yet, the bridge loans still attract arranging and underwriting fees and often attract a higher interest rate to compensate for the additional refinance risk.
Create financing frameworks that price in the benefit of syndication to institutional investors.
Banks in the REIPPPP market are essentially both providers of bridge financing and facilitators of long-term debt. If structures could be employed that would line up institutional investors to participate according to some agreed terms following a few years of operating history, cheaper term financing could potentially be employed in the pre-bid model, also resulting in lower tariffs bid in the Programme. In this case, the commercial banks would represent the ‘institutional investors’. The same principle was highlighted in WWF’s Navigating Muddy Waters report series, which concluded that “there are currently limited opportunities for South African institutional investors to invest in renewable energy as a result of the limited supply of products that have the necessary scale and investment grade”32.
Bond structures provide wider access to funding, and may provide relief from onerous covenant restrictions.
Additional structures to consider could include providing bridge financing to a bond structure. There has been one bond in the market to date, issued by Soitec, a French solar company, for a 44 MW concentrating photovoltaic (CPV) project awarded in Round 1. Soitec corporate financed the construction risk of the project, and Moody’s provided a rating of Baa2.za on the project bond. Some of the advantages and disadvantages of a bond issuance are shown in Table [10].
In future rounds, project/corporate bonds could become a viable option as developers look for new investors to fund their projects.
32 Responsible investing for climate change and water in South Africa, WWF, November 2012,
available at http://www.wwf.org.za/media_room/publications/?7201/responsible-investing-for-climate-change-and-water

53
Table 10: High Level Advantages And Disadvantages Of Project Bonds Versus Senior Bank Debt
ADVANTAGES DISADVANTAGESPotential for improved pricing, although no evidence to date given limited issuance
The structure of REIPPPP and time periods from bidding to financial close make pricing a challenge
Longer average loan life as bonds typically settled in tranches or bullet payments Construction risk is generally excluded
Potentially higher gearing A rating and listing is required and needs stronger sponsor commitment
Potentially less onerous covenant restrictions Management of increase in number of debt providers (i.e. 2-3 banks versus 10+ bondholders)
Potential to take advantage of current market appetite for ‘green bonds’
Negative cost of carry (bonds are typically drawn in tranches or upfront and interest is payable from the signature date)
Source: Author
Vendor financing for strong corporates can result in far lower cost of debt.
Vendor finance or corporate finance structures through commercial banks are increasingly being used, as they have been seen to reduce the cost of financing in REIPPPP. That is, the bank would provide a loan to a corporate to invest in the project, and the terms of the loan would be based on the company’s credit profile rather than the project’s credit profile. The loan would be recorded on the corporate’s balance sheet, and be on-lent to the project from the corporate. In Round 3, Enel Green Power was successful with six projects (four solar PV and two wind projects) through a corporate financing vehicle.
Corporate-to-project finance structures may provide greater flexibility for procuring more favourable financing terms post-bid.
Allowing projects the flexibility to procure financing post-bid could also reduce the cost of debt. Provided a project sponsor has a well-capitalised balance sheet and a proven track record of financing projects of this nature, they would meet the criteria of the RFP. In Rounds 1 and 2, this approach was typically employed to avoid the costly and time-consuming project finance process pre-bid. The intention was then to approach the funding market for project finance once Preferred Bidder status had been obtained. This could translate to greater competition in the market, and better terms. Pre-bid, the lenders tend to have greater bargaining power, given that projects are dependent on the lenders’ letters of support for bid. However, once a project is awarded Preferred Bidder status post-bid, it gains a more powerful position, given it already has a right to a PPA and could engender more competition from financing parties. Typically, institutions become more interested at this stage than at pre-bid stage, when the success rates are low and the workload for assessing credit risk and pricing terms is high.
This approach is risky, as DOE consent is required to change the funding structure of a project after bid award has been obtained. However, in some cases corporate finance can make sense for projects, depending on the debt capacity of the sponsor, the cost of their internal funding and the size of the project.
Development finance mechanisms, which swap out South African commercial bank funding costs, could provide relief on all-in-margin.

54
Further, there may be potential for on-lending products to the domestic banking sector where South African commercial banks’ funding costs could be substituted with that of international finance institutions, leaving the commercial banks with clean credit margins.
Export credit agencies (ECAs) could provide lower cost of funds if a significant portion of the project’s equipment is sourced from a country with a creditworthy government.
Funding from export credit agencies could also provide a cheaper source of funds if the creditworthiness of the government providing the support is better than the project’s credit risk. A key concern of ECA funding is high associated upfront premiums. There has been some involvement from Euler Hermes Kreditversicherungs (Hermes), Overseas Private Investment Corporation (OPIC), and Eksport Kredit Fonden (EKF) in the REIPPPP space, but generally ECA involvement has been limited to date. Green bonds could provide significant access to capital as the market matures.
Other examples of innovative financing structures that have emerged include the so-called ‘green bonds’, for example the bonds issued by Nedbank and the IDC. As shown in Figure [9], both of these financiers have invested heavily in REIPPPP projects, with Nedbank investing approximately R18 billion and the IDC R13 billion over the course of the first three rounds. If these financiers continue to participate at this rate, these numbers are likely to double over the next two to three years. Further, the market is currently anticipating a large pipeline of non-RE, large-scale projects with substantial funding requirements to come on line over the course of the next few years. These two considerations provide significant motivation for firms to seek new sources of funding to finance their future participation in RE projects. A key aspect of both of these bonds is that, while the capital raised from such offerings will be invested in a portfolio of renewable energy projects, the investors are not exposed to the risk of the underlying projects, but that of Nedbank and the IDC.
Nedbank’s green bond is a retail product that aims simultaneously to address savings challenges in South Africa, while providing accessibility to investments in which retail investors typically cannot participate. South Africans who buy Nedbank’s Green Savings Bond can invest as little as R1,000 in the vehicle and be provided guaranteed returns. Further, the bond’s coupon is competitive with that of Treasury’s RSA Retail Savings Bond, making the bond fairly attractive for retail investors. With a target of raising R4 billion from the bond, Nedbank will be able to diversify its funding, in line with Basel III rules that compel banks not to rely heavily on wholesale funding33.
The IDC’s bond was privately placed with the Public Investment Corporation (PIC)34. Given the IDC’s R25 billion mandate to invest in green industries, it was seeking a cost-effective means to fund its large pipeline of projects. The R5 billion bond is priced on a fixed rate basis, using the R186 government bond as a reference, and it holds a tenure of 14 years to be issued in tranches depending on the project pipeline. The proceeds from the bond have already been fully committed to projects across the first three rounds. Given its successful uptake, it would seem likely that the IDC would return to the market to launch a second offering. Since the private placement, the PIC has made further direct investments in renewable energy projects, suggesting additional appetite from the pension fund manager for renewable energy assets. While this has largely been through investment directly in project equity or through community trusts, the PIC may now expand its offerings to senior debt products such as CPI and JIBAR-linked facilities. There may be scope for the PIC to create its own renewable energy debt or equity fund from the portfolio of projects in which it invests.
33 “Green Bond aims to raise R4bn”, Business Day, 11 July 2012
34 IDC Access Newsletter, December 2012 (www.idc.co.za/access/latest-news-december-2012)

55
Developer-specific funding platforms may become more common as developers seek competitive funding terms from new investors.
In addition to the alternative funding structures employed by financial institutions discussed above, project developers are also looking at innovative ways to raise finance for their projects. For example, Mainstream Renewable Power has developed its own capital-raising arm, aiming to raise capital from pension funds and insurance companies that seek long-term, government-backed cash flows, which Mainstream’s wind and solar projects can provide. While the IPP has project financed its renewable energy projects in South Africa to date, it may seek to utilise this platform in future rounds in order to drive down the cost of financing. Developer-specific financing vehicles seek to raise funding on the basis of experience and a proven track record. There are other participants in the market who are considering developing similar platforms, such as debt or equity funds that would invest in a diversified portfolio of their projects, on the basis of the developers’ expertise. Some seed funding or initial guarantees may be required from the developer to jumpstart such platforms; however, once performance is proven, it is envisaged that such support mechanisms could fall away. Access to funding for project developers on as flexible a basis as possible is critical to ensure growth, pipeline development and capitalisation of opportunities expeditiously.
Innovative structures that enable the use of foreign-denominated debt are likely to evolve to the extent that the domestic market becomes constrained and seeks liquidity from other foreign markets.
If undertaken through an innovative structure, one could potentially reduce the cost of capital for renewable energy projects by taking advantage of dollar- or euro-denominated debt. On the face of it, dollar- or euro-denominated debt would be used to take advantage of extremely low interest rates in those jurisdictions. However, this typically presents a challenge for REIPPPP projects, as their revenue streams are denominated in ZAR, and hence there is a large currency risk, given the mismatch in revenues and debt service obligations. At present, hedging foreign currency debt for 15 to 18 years is possible, but it is extremely expensive given current ZAR market levels, thereby negating the benefit of low foreign interest rates. That being said, there is precedent for foreign-denominated debt in REIPPPP. A transaction involving a 17-year cross currency swap and an innovative structure was executed to finance a project in Round 2. The mechanics are complex, but such structures may be increasingly employed in REIPPPP, given the high current investments levels of the domestic commercial banks and the need for liquidity from other foreign markets to sustain large-scale infrastructure financing into the future.
It is important to note, however, that foreign-denominated debt may expose the project to additional risk in REIPPPP. Specifically, the Implementation Agreement seeks to limit government exposure to foreign currency risk in the event of termination due to buyer default. Specifically, the termination payment will firstly reflect the lower of the exchange rate at financial close and the Termination Date, and secondly exclude any breakage costs in respect of hedging arrangements for foreign debt. Projects which employ foreign-denominated debt, must look for structuring solutions to protect against a high potential future exposure in the event of default.
There may also be an opportunity to take advantage of the lower cost of dollar-denominated debt by involving companies with large dollar-denominated revenue streams (for example, most of the multinational miners with operations in South Africa). This would need to be explored further and would most likely require significant structuring and a willingness on the Government’s part, as such a solution may be seen by the Government as ‘dollarising’ the local economy. This solution lends itself to the private sector and would be difficult to incorporate into a public programme such as REIPPPP. However, if it can provide a significant reduction in the cost of power, it should be explored further within the framework of relevant legislation and regulations such as exchange controls.

56
Looking to the future with examples from advanced renewable energy financing markets.
Based on precedents in more advanced renewable energy financing markets, there is also potential for listing debt and equity vehicles for projects or portfolios. Given that public listings of securities are often preferred (or even required) amongst institutional investors, as well as the fact that such institutional investors do not typically have the same funding costs (i.e. statutory and liquidity) as banks, listed vehicles may enable lower-cost funding to be sourced from institutional investors. However, this must be weighed up against the cost and administrative burden of maintaining a listing. In the US, innovative financing schemes such as securitisation structures and crowd funding platforms from companies like SolarCity and Mosaic are increasingly used to finance renewable energy projects. Asset securitisation structures in REIPPPP have not yet emerged, but are likely to do so as more projects are funded and additional operating history becomes available. Modifications to regulation surrounding real estate investment trusts (REITs) and master limited partnerships (MLPs), such as are being considered in some international markets, may provide further innovative means for financing.
The renewable energy market in South Africa is still nascent, but there will be further international examples that financiers and the Government can look to in order to lower the cost of financing for these projects in the future. As the market matures, there will likely be greater funding appetite from a larger, more diversified pool of investors willing to take risk earlier on in the project development cycle than is currently the case.
BBBEE FINANCEChallenge: How to ensure black ownership of projects and the objectives of community ownership are met in relation to procurement policies related to BBBEE.
The RFP sets out minimum thresholds for black ownership, as well as criteria for socioeconomic development to be achieved through community ownership. The development finance institutions, namely the IDC and DBSA, have been instrumental in providing funding vehicles to maximise BBBEE ownership of REIPPPP projects.
Consequence: While not unique to REIPPPP, BBBEE financing options are sometimes limited and can become a constraint in financing, which leads to an increase in the necessary tariff bid.
There is currently a gap in the market for BBBEE finance in REIPPPP projects. As with most BBBEE financing structures, debt repayments are typically serviced by dividends from the project’s equity cash flows. However, in the case of REIPPPP projects, terms are fairly inflexible, given inter alia the debt providers’ requirements to be consistent and treat the large number of BBBEE funding applicants on an equitable basis. Key terms of BBBEE financing typically include vesting periods, pricing and trickle dividend levels. In some projects, the return on equity must be higher than 18% in order for the instrument to vest. This may lead to an increase in the tariff bid in order to meet the requirements for BBBEE finance, which is a requirement in the RFP.
Solution: As the market matures, new entrants to RE BBBEE funding are likely to emerge, and current financing vehicles are likely to evolve.
The BBBEE investment structure is typically based on achieving a return threshold within a certain vesting period, so the absolute quantum of the trickle dividend flowing to the BBBEE entity is not a

57
key factor in the investment decision by BBBEE providers. There should be some benefit for projects where the communities see greater value earlier in the project. In other words, for large multi-billion rand projects where the community may be receiving a 20% share of the project, the community would most likely see large dividends, but the project equity returns may not achieve the vesting hurdle (for example, to achieve a 9% real return in 15 years).
While there is still merit in providing this finance, given the absolute quantum of dividends that will flow to the community and to the development goals, such financing may not be credit-approved unless the vesting period and return thresholds are met. This may mean that the price per kWh bid is increased in order to meet such vesting and return thresholds. Further structuring could be done to evaluate the size of the dividends: perhaps a lower trickle dividend could be employed to achieve the vesting period and return threshold; or the vesting period could be stretched if the dividends were of a minimum quantum that provided meaningful developmental support to the community.
As the market evolves, new players are likely to enter the BBBEE funding market. For example, the PIC, which has invested nearly R3 billion in REIPPPP projects to date, is understood to be gaining a more meaningful presence in the market as a BBBEE finance provider. To date, the PIC has funded seven community trusts in projects where the institution was also invested directly as a shareholder. Furthermore, several sponsors are vendor-financing the BBBEE contributions, which is a more common structure in corporate South Africa, as they are finding it more cost-effective than the current solutions available. In addition, some commercial banks are also beginning to offer a one-stop solution for funding, which includes senior debt and BBBEE financing based on relationships with project sponsors.
Lastly, there could be scope to aggregate BBBEE funding products into a portfolio which could be syndicated or securitised. Funding could also be raised in the international market from socially-responsible investment funds, which may find this type of product attractive. These two considerations could potentially create a market for RE-specific BBBEE funds with a diversification of risk.
Consequence: The current structure may not allow for the full realisation of value that could be created in communities from REIPPPP, given a lack of coordination, communication and transparency.
Some developers have argued that the BBBEE requirements are too onerous and do not achieve the objectives which the DOE has set out, given that REIPPPP bidders are experts in renewable energy development and not socioeconomic development. This is a somewhat tenuous argument. While some developers may spend significant time on establishing trust and ensuring that the project dividends flow to the greatest needs of the community, others may see the BBBEE requirement as a ‘tick box’ exercise.
Furthermore, there can be overlap between the socio-economic development obligations (SED), typically denominated as one to three percent of the project’s income and community trust obligations, typically denominated as trickle dividends. In some cases, these funds are targeting the same outcomes, but in an uncoordinated fashion, resulting in an inefficient use of capital.
In general, there appears to be a lack of coordination, communication and transparency between the developers, communities, municipalities, and local, provincial and national government. At the community level, the mechanics (and potentially long-dated nature) of dividend payments may not be fully understood and can result in unrealistic expectations surrounding the benefits to the community from the project. In some cases, this has led to frustration and even protest action by local communities35. Furthermore, the impact on the community in terms of consequential events,
35 http://www.financialinstitutionslegalsnapshot.com/2014/09/renewable-energy-projects-community-related-protests/

58
(for example, the influx of foreign workers resulting in increases in the cost of living such as rental housing prices), should be considered in advance, so that measures to mitigate risks to community sustainability are introduced prior to project execution.
Solution: Develop a coordinated approach through increased communication and transparency with consideration of pooled funds to achieve greater results where possible.
Some developers have suggested removing the requirement for community ownership, and suggesting that a flat fee be charged to projects, which would be similar to the DOE development fee, but earmarked specifically for economic development. This would eliminate the need for financing vehicles at the project level, and the capital could be more wisely allocated by more suitably qualified persons, perhaps within a unit of the Department of Economic Development. However, such a centralised approach may also have its drawbacks, given that such a unit may still not be close enough to the individual communities to determine their specific needs.
A decentralised approach may yield more significant results, but strong coordination is critical to its success. For example, those REIPPPP projects that are targeting the same communities (which may often be the case, given that projects are located in similar areas for resource availability), may be able to pool their SED funds and trickle dividends to achieve greater impact than on an individual basis. Taking the concept further, such dividends could be pooled into a fund. International development finance organisations who provide concessional loans could then be approached to securitise and leverage the cash flows to fund infrastructure such as electrification, water infrastucture, social housing and road construction. These key aspects may not be sufficiently addressed by individual IPP projects, given the size of investment required, and such a concept would require significant structuring and the inclusion of additional layers of credit support. However, the potential for high-impact projects in impoverished communities representing multiple billions of rand from dividends and SED obligations36 flowing from a diversified portfolio of renewable energy projects, could present an extremely attractive opportunity to multilateral and bilateral organisations, as well as international development agencies.
REFINANCINGChallenge: How to manage the liability to government in event of buyer default and ensure that project shareholders stay vested to prevent any risk of ‘white elephants’
In order to cover any government or regulatory risk of the projects, the Government stipulates in the Implementation Agreement that the DOE shall pay the seller the total debt and equity outstanding at the date of termination. In order to manage its liabilities, the DOE also stipulates that no changes to the capital structure are permitted. That is, the amount and tenor of the debt and equity after any refinancing must not increase above the amount of the debt and equity immediately prior to such refinancing.
Furthermore, the DOE puts a restriction on the sale of equity for a period of three years from COD, during which time there can be no sale of any of the equity, without prior written approval of the DOE. Lastly, for the duration of the PPA, there can be no change in control of the seller without prior written approval from the DOE. This is likely to prohibit developers from ‘flipping’ projects, avoid the risk of ‘white elephants’, and to prevent unqualified or inexperienced shareholders from gaining control of projects.
36 “Green Bond aims to raise R4bn”, Business Day, 11 July 2012

59
Consequence: Restrictions on refinancing and sale of equity result in limiting project enhancement and much-needed access to development capital.
Refinancing is a normal course of action for plants of this nature – as projects mature through the construction phase, their risk profile typically becomes more stable and cash flows become more predictable. This can lead to refinancing projects at cheaper rates and developer equity freed up to develop new projects.
Furthermore, if new strategic shareholders may improve the financial or operational standing of the project, the project may be able to achieve healthier returns and longer plant life.
Unfortunately, the current restrictions in the RFP present a hurdle, firstly to recycling developer equity to invest in new projects; and secondly to realising significant benefits that may be accrue through refinancing.
Solution: Restrictions on refinancing and sale of equity should be eased over time to allow developers to free up cash to invest in new projects, and improve the economics of well-performing assets.
While there is yet to be a change to the RFP to allow blanket refinancing approval, some exceptions for refinancing have been granted, and it is likely that the DOE has recognised the need for refinancing in order to recycle capital into development of new projects, so this requirement may change over time.
Another potential solution for the Government to consider is some element of sharing in refinancing terms, which would significantly benefit the project economics. Ultimately, it is a trade-off between the Government’s potential future exposure and the savings on the long-term cost of electricity needed to power South Africa’s economy. At a high level, the recycling of capital will be important for the sustainability of REIPPPP, and to fulfil the ambitious RE generation targets currently set in the IRP.

60
CONCLUSION AND OUTLOOKThe establishment of a comprehensive and coherent renewable energy policy in South Africa has taken a long time since first conceptualised in the White Paper policy document drafted in 2003. However, once that policy was established and a robust framework governing that policy was implemented, the renewable energy market in South Africa has grown from strength to strength. The market has expanded rapidly, with widespread participation from both local and foreign, and public and private, stakeholders. Significant capital has been mobilised and investments made, spurring economic activity and enabling skills transfer.
REIPPPP has been instrumental in facilitating this growth. While it has not been without teething issues and minor setbacks or delays, such issues should have been expected. The Programme was unprecedented in terms of the size, scale and speed with which it required market participants to work. Despite the very ambitious goals set by the Government, the Programme has received strong buy-in from various stakeholders, and has set an excellent example of how successful public-private partnerships can work, if structured correctly. These ambitious targets have by and large been met, with nearly R120 billion already committed to projects in little over three years.
Considering the significant amount of resource and capital that has been mobilised for what is still a nascent industry in South Africa, the Programme to date can be commended. In terms of its key objectives – providing a consistent framework for the establishment of a local renewable energy industry, and procuring significant renewable energy capacity in very short lead times – the Programme has also been widely lauded as successful. One must also consider that an entirely new policy framework had to be established, which required new skills to be developed.
A COHERENT POLICY FRAMEWORKKey to the success of REIPPPP has been the well-documented, transparent and consistent bidding process that was incorporated into the Programme. Again, while there was some minor confusion and need for clarification in the first round of bidding, this was quickly ironed out and participants became accustomed to the standards and protocols that the Government demanded. As previously discussed, prior to REIPPPP there existed significant policy uncertainty regarding government intentions with respect to renewable energy. REIPPPP was revolutionary in this respect, and the removal of uncertainty provided the much-needed confidence for investors and developers to commit capital to the Programme.
While some participants viewed the prescriptive nature of the framework and requirements thereof as being too rigid, such rigidity was a necessary requirement in order to incubate the fledgling industry and ensure the success of a new market. Now that nearly four gigawatts of capacity have been procured and the market grows continually more competitive, we have seen the Government begining to allow some flexibility on certain terms and/or relax bid requirements. Further concessions may follow as REIPPPP evolves.
A SUCCESSFUL PARTNERSHIPAnother pleasing aspect of the Programme has been the manner in which various stakeholders have worked together towards a common goal. While the Government set ambitious targets and minimum standards to be met, the private sector was largely receptive to most of these requirements. In particular, some projects embraced the need for BBBEE ownership of projects and exceeded the minimum targets.

61
Minimum local content requirements were initially viewed as challenging, but developers have adopted means of achieving these in a manner that adds value to the economy, while still working towards competitive tariffs.
The Government was also keen to embrace an open and consultative process as it established the Programme. Numerous public consultation sessions were arranged, and the Government was receptive to certain proposals and/or allowances requested by the private sector.
REIPPPP has proven to be a highly successful example of a working public-private partnership. There are a number of lessons learned from the process that can, and should, be used to promote other successful public-private partnerships, whose programmes are seen as a key tenet of the National Development Plan.
SKILLS TRANSFERREIPPPP has also been instrumental in achieving significant skills transfer to the local economy. A number of foreign developers and EPC contractors have seconded employees to South Africa for the duration of the period needed to commission projects. This has included employees involved across the spectrum of services required – for example, employees involved in negotiation of EPC and O&M contract agreements, construction of projects, development of supply chains, financing and legal services. The specialist RE-specific skills required for such projects were in short supply in the country, given the non-existence of the industry. Particularly at a professional services level, a significant amount of knowledge sharing has also taken place, given the numerous legal firms, banks, engineers and other advisors involved in such projects.
At a government level, as discussed above, the Programme has also helped establish a path forward for successful public-private partnerships. It is understood that the Government hired a team of international consultants to advise and guide it on its policy-setting and procurement process. Such consultants would have had significant experience in foreign and developed markets, and assisted the Government in creating a world-class procurement programme. The learning from the implementation of such a successful Programme should be adopted as a model for other similar public-private partnerships in South Africa.
Moreover, as other African countries and markets begin to think about establishing similar RE programmes, it is almost certain that they will look south to South Africa as an example of how such a programme may be established. This may also provide opportunities for South African stakeholders – in both the private and public sectors – to transfer skills or export locally-manufactured renewable energy equipment into other African markets. In this regard, REIPPPP will serve as a very good template for rolling out RE megawatts across Africa.
THE WAY FORWARDIt is sometimes difficult to consider the renewable energy market in South Africa as nascent, given the significant growth and achievements that have been made over the last three years. Perhaps ‘nascent’ is indeed no longer applicable, as the market has evolved considerably since the first round of bidding in REIPPPP.
The market will continue to evolve and mature in the coming years. As market participants become more familiar with the process and procurement framework established by REIPPPP, focus will shift from ‘establishing’ the market, to improving the market and process.

62
In particular, a key focus will be the drive to reduce the cost of capital. The high cost of debt has been somewhat of an impediment to investor returns and reductions in tariffs, but this will reduce as projects come on line and capital providers begin to build datasets with real operating history and lessons learnt from projects that have been financed and constructed, while becoming more comfortable with the inherent risk exposure in projects.
A new industry is bound to present a number of uncertainties, including, for example, political, regulatory, financial and technical risks. As market participants become more comfortable with these risks, the cost of capital is likely to reduce, particularly as the debt provider landscape expands and becomes more competitive. In this regard, a key driver of a reduction in debt costs is likely to come from the diversification of funding sources, as discussed in this document. Already we have seen corporate financing play a meaningful role alongside commercial bank finance in a number of projects. The institutional market is likely to begin playing a more meaningful role, particularly in the primary debt market.
It is likely that developers and sponsors will structure more creative solutions for financing. In addition to those solutions mentioned, this could also involve significant structured finance, offshore structures, listed funds, ECA funding and combinations thereof.
Another likely evolution is the increased flexibility that the Government allows to REIPPPP projects. While the rigid and prescriptive nature of the current procurement process was necessary to foster the industry, and was very effective in this regard, it is likely that, as the market evolves, a number of the more stringent financing qualification criteria are relaxed – particularly as regards financing structures (for example, the removal of restrictions on sales of project equity). This has already been evident in the revised RFP issued for Round 4, where a relaxation of a number of requirements has clearly transpired.
Beyond REIPPPP, the path becomes a little more difficult to foresee. Notwithstanding the important role that a centralised utility monopoly such as Eskom has played, there is potential that South Africa may move towards establishing a fully privatised and liberalised energy market, which incorporates a flexible energy trading market such as a merchant power model. This remains a source of significant debate in South Africa, and such a model is unlikely to materialise in the near term.
Until such time, REIPPPP (and its continued evolution) will provide the necessary building blocks for an ultimately diversified buyer/seller market. In the interim, it has already established a flagship public-private partnership model for South Africa, and in the process has gone a long way to alleviating Eskom’s current power crisis in a sustainable and socially responsible manner.

63
APPENDICESAppendix 1: List of REIPPPP equity investors based on presentations to NERSA
INVESTOR NO. OF PROJECTS
TOTAL MW OF ALL
PROJECTS INVESTED IN
ESTIMATE OF EQUITY INVESTED
(ZARm)
PROJECTS
IDC 10 714 2,610
Cookhouse Wind Farm; KaXu Solar One; Khi Solar One; Grassridge; Waainek; Chaba; Bokpoort CSP; Mulilo Prieska PV; Karoshoek Solar One (Ilangalethu); XiNa Solar One
Old Mutual 10 873 1,355
Cookhouse Wind Farm; Jeffreys Bay; Hopefield Wind Farm; MetroWind Van Stadens Wind Farm; Kalkbult; Neusberg Hydro Electric Project A; Khobab Wind Farm; Loeriesfontein 2 Wind Farm; Noupoort Mainstream Wind; Mulilo Prieska PV
Enel 7 491 1,741Upington Solar PV; Red Cap - Gibson Bay; Nojoli Wind Farm; Adams Solar PV 2; Electra Capital (Paleisheuwel Solar Park); Pulida Solar Park; Tom Burke Solar Park
Mainstream 6 585 1,461
Jeffreys Bay; De Aar Solar PV; SA Mainstream Renewable Power Droogfontein; Khobab Wind Farm; Loeriesfontein 2 Wind Farm; Noupoort Mainstream Wind
Thebe Investment Corporation
6 585 384
Jeffreys Bay; De Aar Solar PV; SA Mainstream Renewable Power Droogfontein; Khobab Wind Farm; Loeriesfontein 2 Wind Farm; Noupoort Mainstream Wind
Mulilo 5 415 436
Mulilo Renewable Energy Solar PV Prieska; Mulilo Renewable Energy Solar PV De Aar; Longyuan Mulilo De Aar 2 North Wind Energy Facility; Longyuan Mulilo De Aar Maanhaarberg Wind Energy Facility; Mulilo Sonnedix Prieska PV
PIC 4 335 1,204 Jasper Power Company; Boshoff Solar Park; Karoshoek Solar One (Ilangalethu); XiNa Solar One
Globeleq 4 365 859 Cookhouse Wind Farm; Jeffreys Bay; De Aar Solar PV; SA Mainstream Renewable Power Droogfontein
Scatec Solar 3 179 1,007 Kalkbult; Dreunberg; Linde
Kensani 3 203 655 Letsatsi Power Company; Lesedi Power Company; Jasper Power Company
SolarReserve 3 203 530 Letsatsi Power Company; Lesedi Power Company; Jasper Power Company
Intikon Energy 3 203 530 Letsatsi Power Company; Lesedi Power Company; Jasper Power Company
Gestamp 3 102 448Noblesfontein / Karoo Renewable Energy Facility; Mulilo Renewable Energy Solar PV Prieska; Mulilo Renewable Energy Solar PV De Aar
SunEdison 3 118 375 Witkop Solar Park; Soutpan Solar Park; Boshoff Solar Park

64
INVESTOR NO. OF PROJECTS
TOTAL MW OF ALL
PROJECTS INVESTED IN
ESTIMATE OF EQUITY INVESTED
(ZARm)
PROJECTS
EDF 3 104 362 Grassridge; Waainek; Chaba
Genesis 3 355 344 Khobab Wind Farm; Loeriesfontein 2 Wind Farm; Noupoort Mainstream Wind
Lereko Metier 3 80 237 Herbert PV Power Plant (AE-AMD IPP 3); Greefspan PV Power Plant (AE-AMD IPP 1); Bokpoort CSP
Biotherm / Denham 3 45 215 Klipheuwel-Dassiesfontein Wind Energy Facility;
Konkoonsies Solar; Aries Solar
Usizo Engineering 3 230 155 Jeffreys Bay; De Aar Solar PV; SA Mainstream
Renewable Power Droogfontein
Enzani Molene Tech 3 230 155 Jeffreys Bay; De Aar Solar PV; SA Mainstream
Renewable Power Droogfontein
Abengoa 2 250 2,816 KaXu Solar One; Khi Solar One
Cennergi 2 233 1,175 Amakhala Emoyeni (Phase 1) Eastern Cape; Tsitsikamma Community Wind Farm
Solar Capital (Phelan/
Moncada)2 150 859 Solar Capital De Aar (Pty) Ltd; Solar Capital De Aar 3
Longyuan 2 235 760Longyuan Mulilo De Aar 2 North Wind Energy Facility; Longyuan Mulilo De Aar Maanhaarberg Wind Energy Facility
Acciona 2 209 728 Gouda Wind Facility; Sishen Solar Facility
Building Energy 2 91 686 Kathu Solar Energy Facility; Mkuze
Investec 2 191 451 West Coast 1; Karoshoek Solar One (Ilangalethu)
Aveng 2 209 414 Gouda Wind Facility; Sishen Solar Facility
Pele Green Energy 2 123 300 Touwsrivier Project / CPV Power Plant No. 1; Nojoli
Wind Farm
Macquarie SA 2 200 263 Cookhouse Wind Farm; Hopefield Wind Farm
Shanduka 2 148 257 Noblesfontein / Karoo Renewable Energy Facility; Pulida Solar Park
Royal Bafokeng Holdings
2 150 253 Adams Solar PV 2; Electra Capital (Paleisheuwel Solar Park)
AMDA Energia 2 30 178 Herbert PV Power Plant (AE-AMD IPP 3); Greefspan PV Power Plant (AE-AMD IPP 1)
CHINT/Astronergy Solar Korea
2 58 154 Witkop Solar Park; Soutpan Solar Park
Kagiso 2 156 153 Hopefield Wind Farm; West Coast 1
Soul City BBIC 2 209 143 Gouda Wind Facility; Sishen Solar Facility
Solairedirect 2 18 92 Aurora Solar Project; Vredendal Solar Project
Alt-E 2 30 76 Herbert PV Power Plant (AE-AMD IPP 3); Greefspan PV Power Plant (AE-AMD IPP 1)

65
INVESTOR NO. OF PROJECTS
TOTAL MW OF ALL
PROJECTS INVESTED IN
ESTIMATE OF EQUITY INVESTED
(ZARm)
PROJECTS
Jay & Jayendra 2 18 64 Aurora Solar Project; Vredendal Solar Project
Evolution One (Inspired
Evolution)2 12 57 RustMo1 Solar Farm; SlimSun Swartland Solar Park
Winners Circle 2 19 50 Konkoonsies Solar; Aries Solar
DBSA 2 75 45 Jasper Power Company; Boshoff Solar Park
Aurora Power Solutions 2 19 20 Konkoonsies Solar; Aries Solar
ACS Cobra 1 100 538 Karoshoek Solar One (Ilangalethu)
ACWA 1 50 538 Bokpoort CSP
Emvelo 1 100 404 Karoshoek Solar One (Ilangalethu)
Sumitomo 1 97 350 Dorper Wind Farm
Redcap 1 78 346 Red Cap Kouga Wind Farm - Oyster Bay
GDF Suez 1 91 227 West Coast 1
Soitec 1 36 225 Touwsrivier Project / CPV Power Plant No. 1
Sonnedix 1 75 211 Mulilo Sonnedix Prieska PV
Ventusa 1 75 199 Kathu Solar Energy Facility
Ener-G Systems 1 18 138 Johannesburg Landfill Gas to Electricity
Google 1 75 130 Jasper Power Company
Charl Senekal Sugar Trust 1 16 127 Mkuze
Videovision Entertainment 1 30 122 Witkop Solar Park
Izingwe Capital 1 28 114 Soutpan Solar Park
Watt Energy 1 95 88 Tsitsikamma Community Wind Farm
Nehawu Investments 1 60 87 Boshoff Solar Park
Total 1 75 76 Mulilo Prieska PV
Standard Bank 1 73 76 Kalkbult
CEF 1 18 75 Johannesburg Landfill Gas to Electricity
Andisol/Calulo RE 1 75 70 Mulilo Prieska PV
Rainmaker Energy Projects
1 97 70 Dorper Wind Farm
H1 Capital 1 16 70 Mkuze

66
INVESTOR NO. OF PROJECTS
TOTAL MW OF ALL
PROJECTS INVESTED IN
ESTIMATE OF EQUITY INVESTED
(ZARm)
PROJECTS
AFPOC 1 135 61 Cookhouse Wind Farm
Power Matla Renewables 1 97 57 Dorper Wind Farm
Ule Energy 1 139 56 Longyuan Mulilo De Aar 2 North Wind Energy Facility
SARGE/ Roux Family 1 73 55 Noblesfontein / Karoo Renewable Energy Facility
Ixowave 1 75 53 Mulilo Sonnedix Prieska PV
Secure Rock Enterprises 1 18 47 Johannesburg Landfill Gas to Electricity
Nuplanet 1 4 46 Stortemelk Hydro
Spilled Water Renewables 1 26 39 MetroWind Van Stadens Wind Farm
ETU Energy Resources 1 96 39 Longyuan Mulilo De Aar Maanhaarberg Wind Energy
Facility
Hydro Tasmania 1 10 32 Neusberg Hydro Electric Project A
Basil Read Engineering 1 26 32 MetroWind Van Stadens Wind Farm
AfriCoast SA 1 26 32 MetroWind Van Stadens Wind Farm
Tomlo Commodities 1 65 30 Hopefield Wind Farm
Ikamva Labantu ET 1 26 28 Klipheuwel-Dassiesfontein Wind Energy Facility
Malibongwe Womens DT 1 26 28 Klipheuwel-Dassiesfontein Wind Energy Facility
FAT (Anthony Corin) (40%) 1 5 21 SlimSun Swartland Solar Park
Phefo Power 1 97 16 Dorper Wind Farm
MLP Family Trust 1 97 16 Dorper Wind Farm
Hydro 1 SA 1 10 16 Neusberg Hydro Electric Project A
Momentous Solar Farm 1 7 12 RustMo1 Solar Farm
Momentous Technologies 1 7 11 RustMo1 Solar Farm

67
Sources and key assumptions:
1. In preparing this table, the author has relied primarily on information publicly available in the presentations prepared by each project developer and presented to NERSA, where these have been published on the NERSA website.
2. Where presentations are not available (14 out of 64 projects to date), alternative sources of publicly available information including developer websites and published news articles relating to the specific projects have been used.
3. In the few instances where shareholding information is still not available, assumptions have been made in line with the minimum or maximum ownership requirements of the RFP (i.e. 2.5% for BBBEE ownership; 12% for BEE; 25.5% for local investors; and 60% for foreign investors).
4. Where shareholdings of joint ventures or entities with similarly joint ownership are not available (e.g. SolarReserve/Intikon; AE-AMD), equal shareholdings of the joint venture from each principal have been assumed.
5. Total capital costs per technology per round have been sourced from DOE presentations and used to determine an average ‘capital cost per MW’ for each technology per round, which is then multiplied by the capacity of each project to estimate the total cost of each project. In most cases, these estimates are in line with the actual project costs where these have been disclosed.
6. The debt:equity ratio of each project is then applied to the total project cost to estimate the equity investment. Where debt:equity ratios have not been disclosed, a 30:70 ratio has been assumed.
7. Finally, each developer’s project shareholding is then applied to the project equity investment to estimate the equity invested by each shareholder in each individual project, and these are summed to derive the estimated total equity investment per shareholder.

WWF-SA is a registered Non-Profit Organisation, number 003-226 NPO. © 1986 panda symbol and ® “WWF” Registered Trademark ofWWF-World Wide Fund For Nature (formerly World Wildlife Fund), Boundary Terraces, Bridge House, 1st Floor, Mariendahl Lane,Newlands, 7700, P O Box 23273, Claremont 7735, Tel: +27 21 657 6600, Fax: 086 535 9433, www.wwf.org.za
Wh y we are here
panda.org.za
To stop the degradation of the planet’s natural environment andto build a future in which humans live in harmony with nature.
WWF.ORG.ZA•
ENABLING RENEWABLE ENERGY IN SOUTH AFRICAZA


