Technical stream presentation
65
Transcript of Technical stream presentation


Design Patterns for Dashboards
Andy Pryke

What are Design Patterns?
Formalized best practices
Generally reusable solution to a commonly occurring problem
Not a finished design…
…[but] descriptions or templates which can be used in many different situations.
[Source:Wikipedia]

Why use Design Patterns?
To pass on experience
So we have common names to refer to designs
To encapsulate a way of doing things
What do you need to Remember?
We’ll be putting details of patterns on the portalThis presentation will be there too
Any SQL examples etc. are also included
So all you need to remember is if you found one (or more) of them interesting!

Types of Dashboard Design Pattern
• Strategic: Overall dashboard design
• Chart Level: Designing of items
• Data Level: SQL Tricks & Tips for Data Sources
• Perhaps you can identify some others?
Dashboard Patterns Covered
• Headline Charts Page
• Levels of Detail
• Multi-Level “Cheat”
• Dynamic Axes
• Defaulting Filter Variable Values
• Rotating Results
• Data Level Security

Headline Charts PageStrategic Pattern

Headline Charts Page
Motivation:
Provide a simple and informative link to dashboards covering multiple topics
Overview:
Create a dashboard featuring one key chart for each of the topics with a drilldown to the relevant dashboard
Headline Charts Page
Benefits:
Visually appealing. Can “tempt” users to visit the topic dashboards based on what they see in the headline chart
Disadvantages:
Can be hard to pick a single chart to represent the topic. You are limited by the number of charts which are easily visible on the headline dashboard.

Headline Charts Page: Example

Levels of DetailStrategic Pattern

Levels of Detail
Motivation:
Colleges often have dashboard which reflect their structure, so you drill down from whole college to department to curriculum area to course whilst displaying very similar information.
Overview: Dashboards at different levels use a series of identical items plus a single item which allows drilldown to the next level.

Levels of Detail
Applicability:This pattern works well when you wish to show the data at different levels of detail. For example, levels of an organisational structure or budget codes.
Benefits:By using this pattern you can reduce the number of data sources and items you need to create and maintain. Information is presented consistently.

Levels of Detail: Example

Levels of Detail: Example

Levels of Detail: Example

Levels of Detail: Implementation

Multi-Level “Cheat”Chart Pattern

Multi-series “Cheat”
Motivation:
You have a single row of data with several columns, and you wish to display it as a bar or column chart. Transforming the data to a single column takes a some work (see the Data Pattern: Rotating Results)
Overview:
Instead of a Single-Series chart, use a Multi-Series chart with the Multiple Values per Row setting and add each column as a series. Leave the Category field blank.

Multi-series “Cheat”
Benefits:
You don’t need to modify the data source, which could be complex.
You can use the click-able legend on Multi-Series charts.
Disadvantages:
Chart labelling is not the same as for a Single-Series chart.

Multi-series “Cheat”: Data

Multi-series “Cheat”: Settings
Note the blank “Category” field
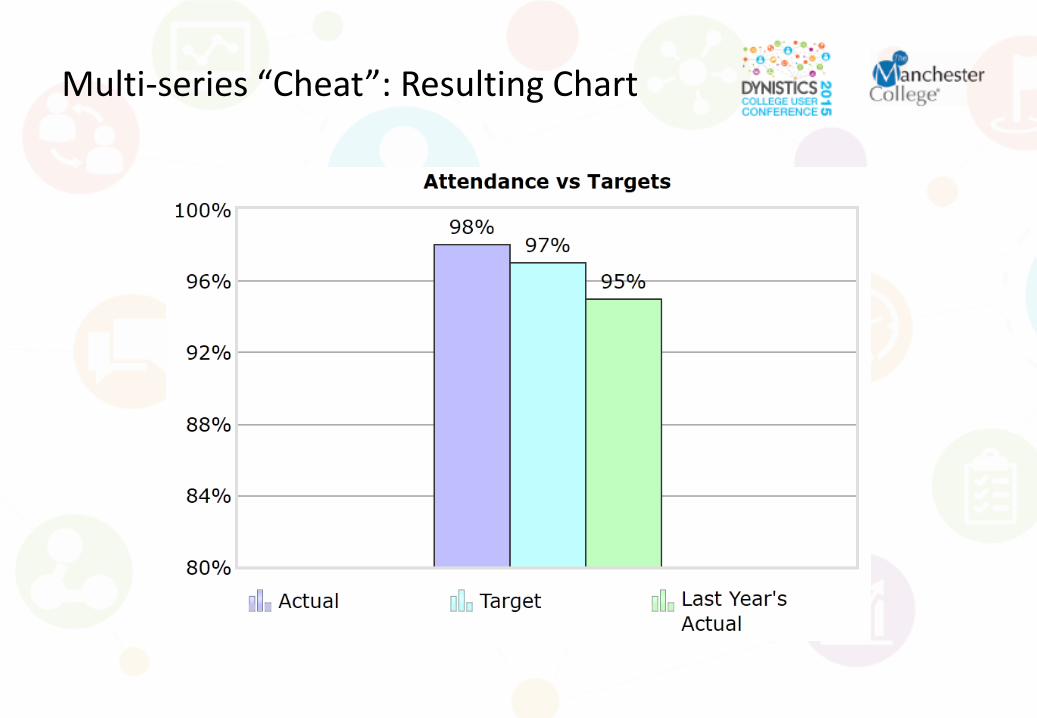
Multi-series “Cheat”: Resulting Chart

Dynamic AxesData Pattern

Dynamic Axes
Motivation:
You wish to have a single chart which can display different breakdowns of data. For example, percentage completion by gender or age group.
Overview:
We use the SQL UNION command to combine rows from multiple queries. We then use filters to dynamically select the subset we want to see.

Dynamic Axes
Benefits:
A single chart space can be used to show multiple different types of data. Alternative views of the data can be made available to users who wish to see it.
Disadvantages:
SQL is slightly more complex.
Dynamic Axes
Example:
We wish to show the number of students who stay on their course (“retention”) broken down by either the student’s age or the duration of the course.
We select the two sets of results, add a label of “Duration” or “Age” and use a SQL UNION to put them into a single result table.
Then we use an item filter to choose whether we see a breakdown by “Duration” or “Age”.

Dynamic Axes: Aim

Dynamic Axes: Data Source Result
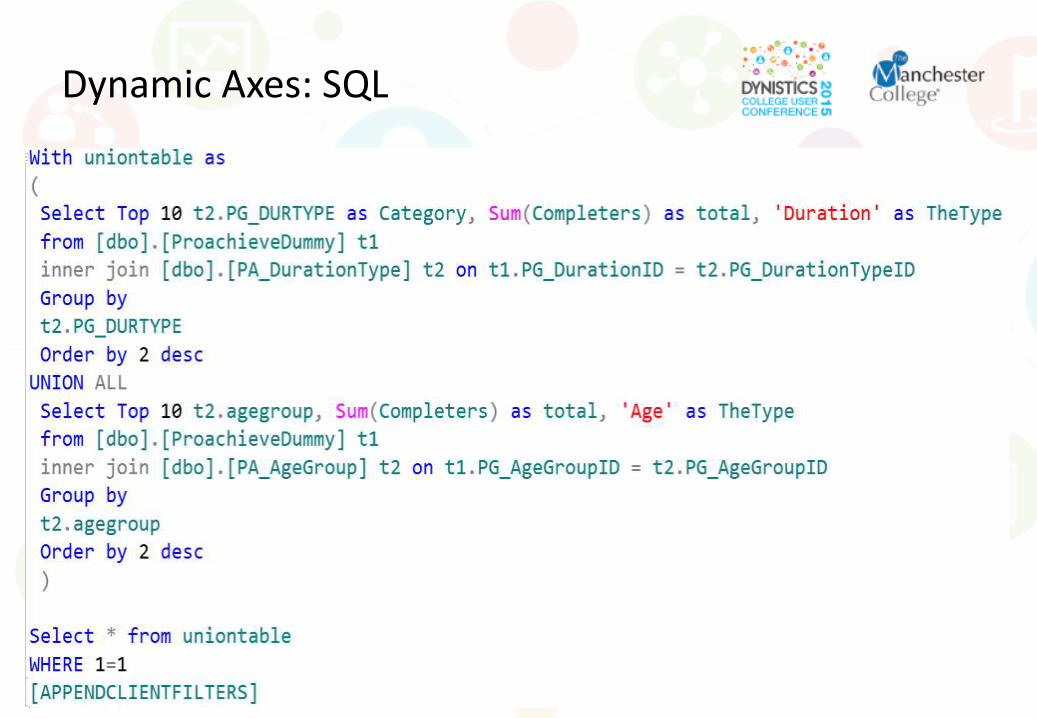
Dynamic Axes: SQL
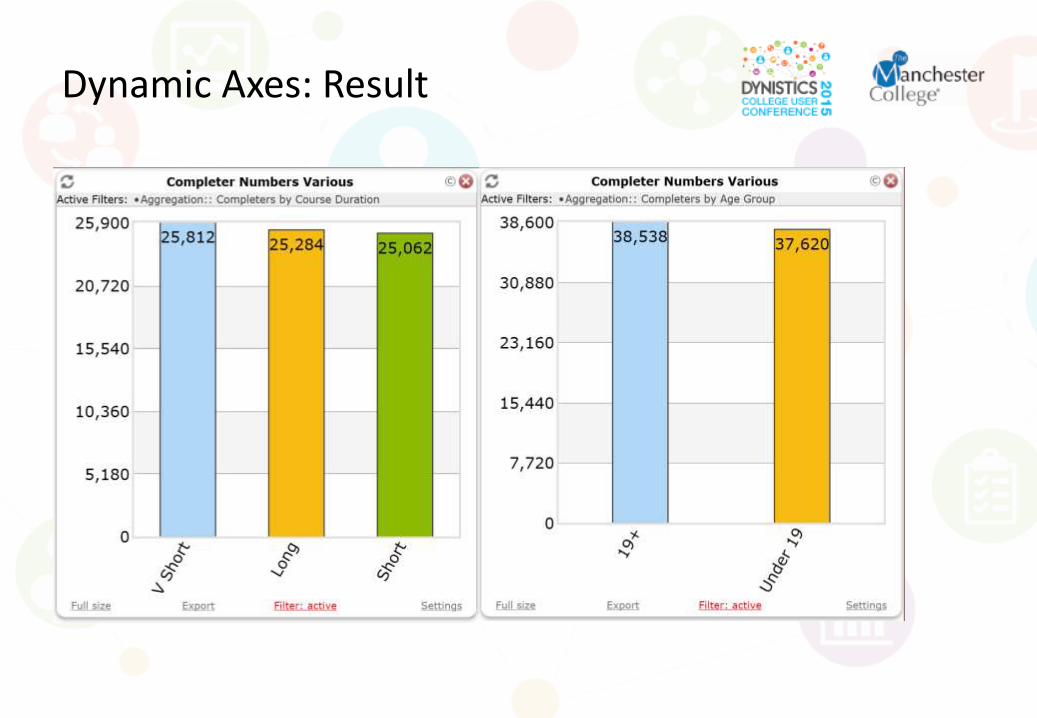
Dynamic Axes: Result

Defaulting Filter VariablesData Pattern

Defaulting Filter Variables
Motivation:
You need to use SQL variables to implement a filter, for example when calling a stored procedure. But these variables are only defined when the SQL is called by an item on a dashboard which has the filter. In Dashboard Designer(and on unfiltered dashboards) you get an error message or a blank item.
Defaulting Filter Variables
Overview:
Use the “magic” [APPENDFILTER(filterName, databaseField)]syntax to put a value into a variable. When not on a filtered dashboard we get a default value.

Defaulting Filter Variables
Benefits:
While in Dashboard Designer, SQL can be tested & Charts are visible.
Disadvantages:
Data source slightly more complex

Defaulting Filter Variables:Standard Approach
This SQL filters the data based on a dashboard filter variablenormally we would need to do this to call a stored procedure or include the filter variable in the SELECT part of the query.

Defaulting Filter Variables:Standard Approach & Problem
In the Designer or on a dashboard without the filter, we see this:
Defaulting Filter Variables:Solution
Approach:Instead of directly using the dashboard filter variable we will declare our own variable and set its value using the magic of APPENDFILTER, which is designed to cope when the item is not on a filtered dashboard.

Defaulting Filter Variables: Solution
See slide notes for copy/paste SQL Code

Defaulting Filter Variables:Solution

Rotating ResultsData Pattern

Rotating Results
Motivation:
Data is in a single column, but we need it in multiple columns (e.g. for a table) or it is in multiple columns and we want a single column.
Overview:
These transformations are slightly complex. They can be done using “standard” SQL commands like “SELECT” and “UNION”. Some variants of SQL, including MS-SQL Server’s Transact-SQL & Oracle 11g SQL implement the “PIVOT” and “UNPIVOT” commands which are designed for this task. These approaches have different benefits & disadvantages which we will discuss.
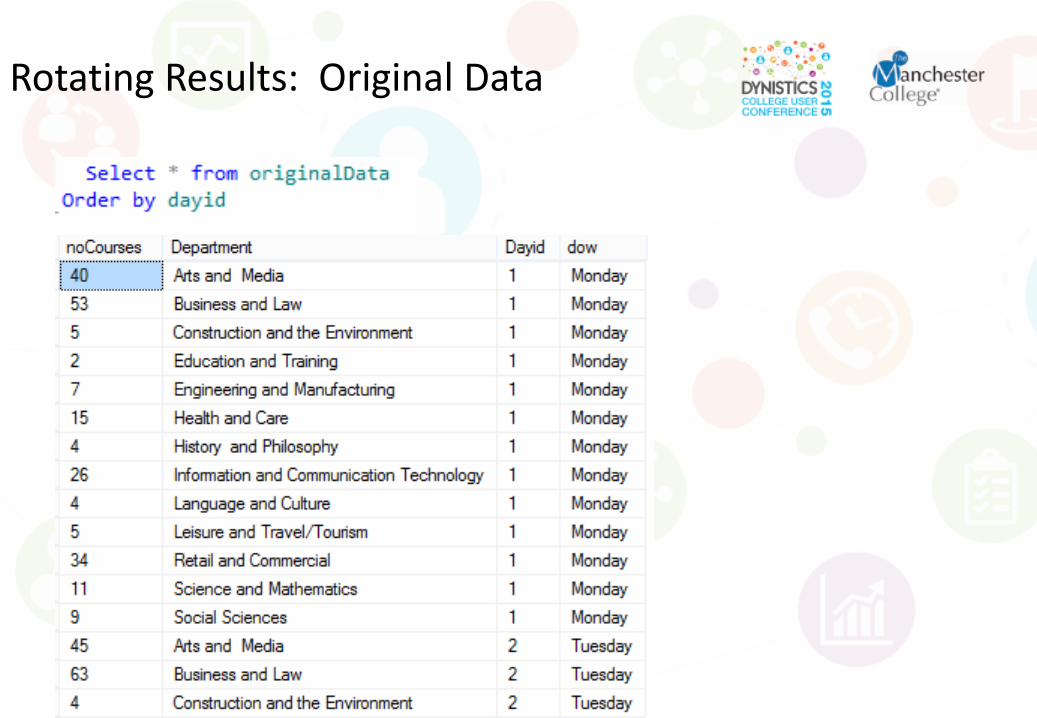
Rotating Results: Original Data

Rotating Results using Union & Select

Rotating Results: Result

Rotating Results using Pivot
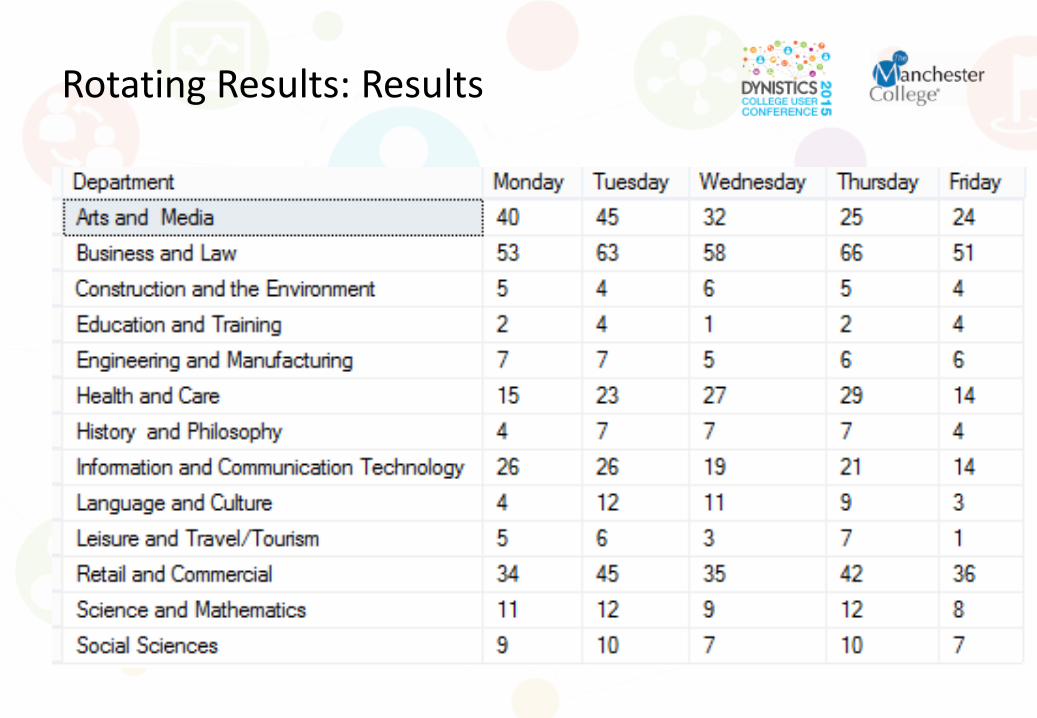
Rotating Results: Results

Rotating Results: Original Data to “Unpivot”

Rotating Results:Unpivot with Union & Select

Rotating Results: Results

Rotating Results: Using Unpivot

Rotating Results: Results

Data Level SecurityData Pattern

Data Level Security
Motivation:
You wish to restrict access to particular subsets of data to particular groups. For example, you only want information on staff sickness within a department to be available to the head of that particular department.
Overview:
We use Application Parameters to make information on a user’s ID available in SQL queries. We then lookup that ID in a table to see what information they are allowed access to.

Data Level Security
Benefits:
Restrict access to the data which appears in a dashboard (rather than to a whole dashboard or particular items).
Disadvantages:
Each filtered Data Source requires extra SQL code. Tables containing information on who can see what must be added to the database & maintained.

Data Level Security: Adding a Parameter

Data Level Security: Adding a Parameter

Data Level Security:Testing The Parameter
In Plain English:“Tell me the Active Directory name of the current viewer”
In SQL:

Data Level Security:Select “My” Department
In Plain English:“Tell me the Department of the current viewer”
In SQL:
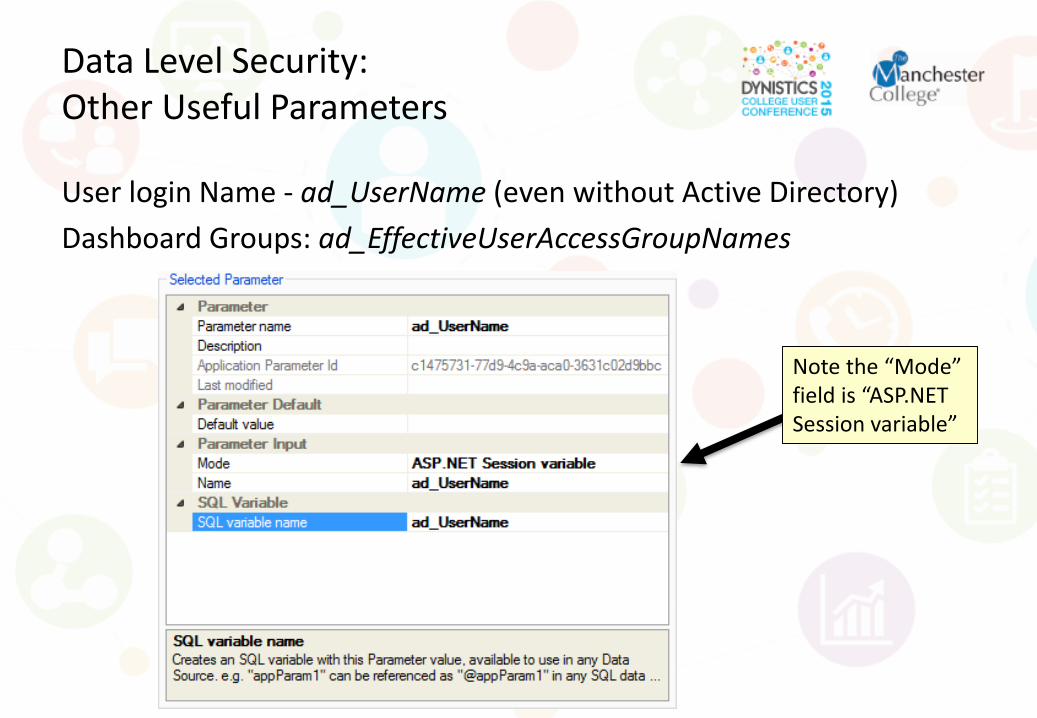
Data Level Security:Other Useful Parameters
User login Name - ad_UserName (even without Active Directory)
Dashboard Groups: ad_EffectiveUserAccessGroupNames
Note the “Mode” field is “ASP.NET Session variable”
What Next?
• Check out the portal for details ofall these patterns & these slides
• We plan to develop and documentmore dashboard patterns
• Contribute your pattern ideasusing the forums

Thank You!

Thoughts?
Questions?