Technical Review 1966-2 Sweep Random Vibration Experiments
39
Transcript of Technical Review 1966-2 Sweep Random Vibration Experiments

P R E V I O U S L Y I S S U E D N U M B E R S O F B R U E L & K J / t R T E C H N I C A L R E V I E W
1-1962 Ar t i f ic ia l Ears for the Cal ibrat ion of Earphones of the External Type, part 2.
2-1962 Loudness Evaluation. 3-1962 Testing of Stereophonic Pick-ups by means of Gl id ing
Frequency Records. 4-1962 On the Use of W a r b l e Tone and Random Noise for
Acoustic Measurement Purposes. Problems in Feedback Contro l of N a r r o w Band Random Noise.
1-1963 Miniature Pressure Microphones. Methods of Checking the RMS Properties of RMS Instruments.
2-1963 Qual i ty Contro l by Noise Analysis. A. F. Nonl inear Distort ion Measurement by W i d e Band Noise.
3-1963 Effects of Spectrum Non-l inear i t ies upon the Peak Distr ibut ion of Random Signals.
4-1963 Non- l inear Ampl i tude Distort ion in V ibrat ing Systems. 1-1964 Statistical Analysis of Sound Levels. 2-1964 Design and Use of a small Noise Test Chamber.
Sweep Random Vibra t ion. 3-1964 Random Vibra t ion of some Non-Linear Systems. 4-1964 The Accuracy of Condenser Michrophone Cal ibrat ion
Methods. Part I. 1-1965 The Accuracy of Condenser Mic rophone Cal ibrat ion
Methods. Part II. 2-1965 Direct Digi tal Comput ing of Acoustical Data.
The Use of Compar ison Bridges in Coi l Testing. 3-1965 Ana log Experiments Compare Improved Sweep Random
Tests with W i d e Band Random and Sweep Sine Tests, 4-1965 Ai rcraf t Noise Measurement, Evaluation and Contro l . 1-1966 Windscreening of Ou tdoor Microphones.
A N e w Art i f ic ia l Mouth .

TECHNICAL REVIEW No. 2 - 1966
Contents
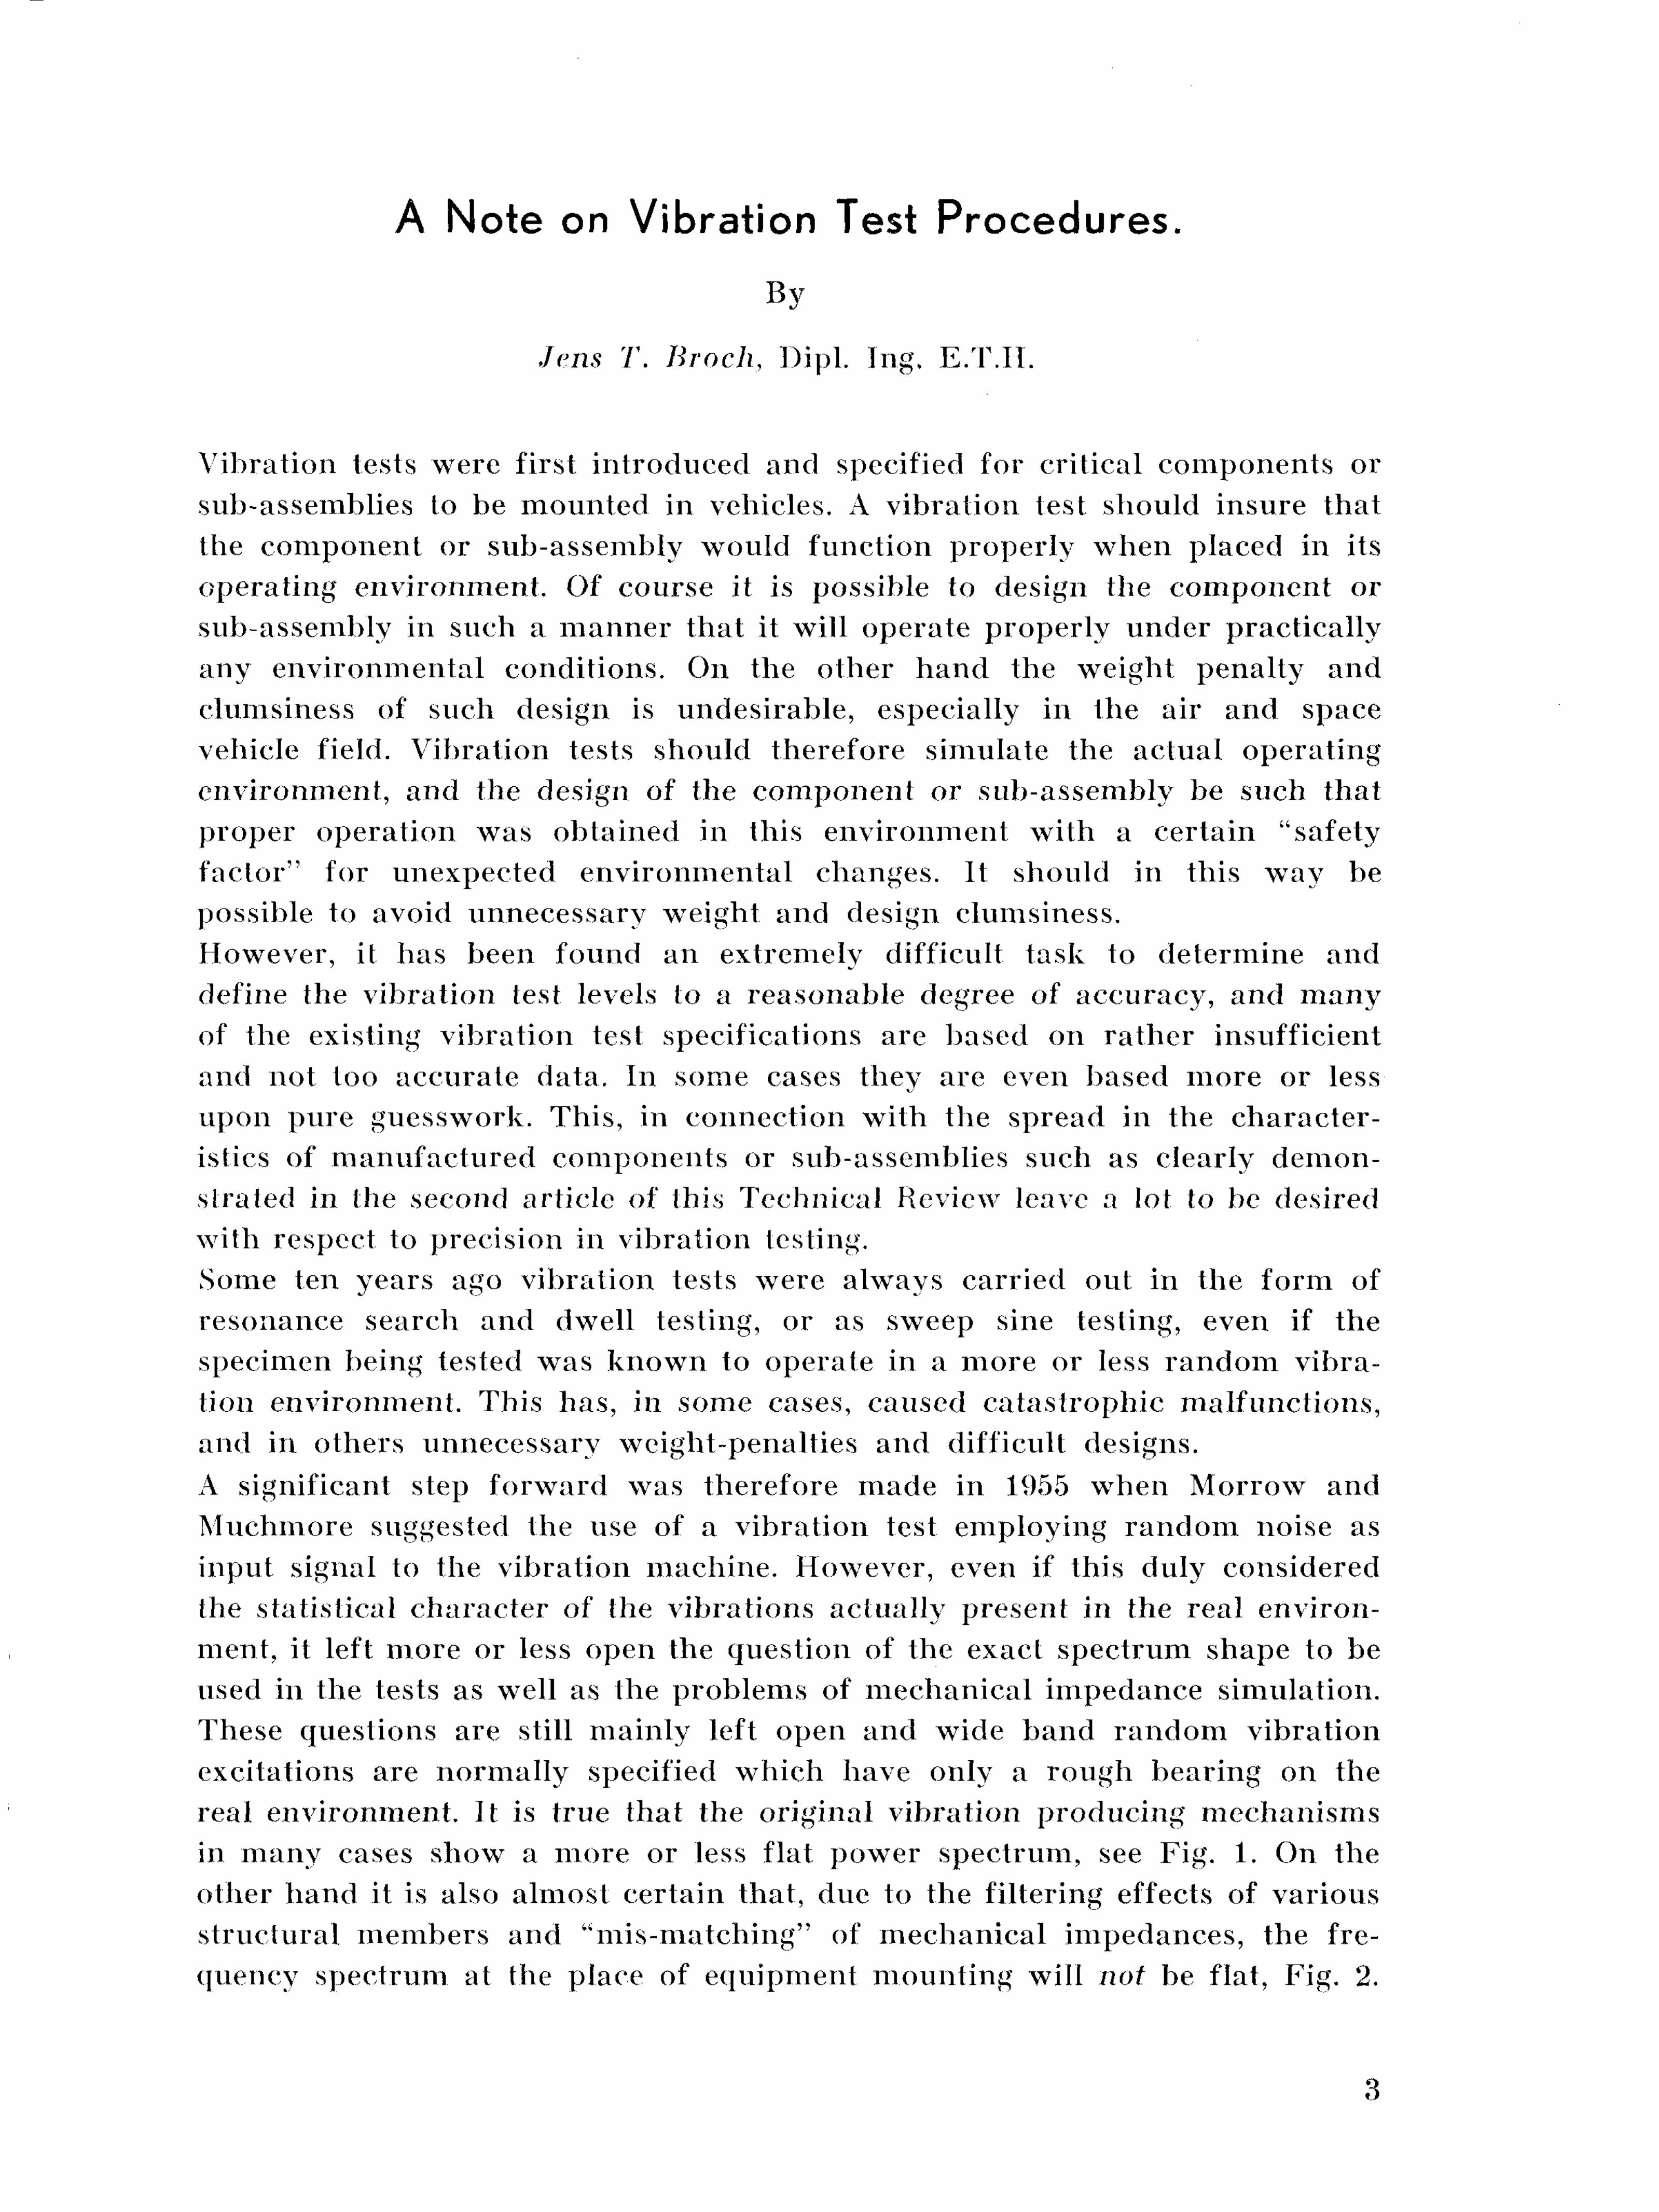
Page A Note on Vibration Test Procedures By Jens T. Broch, Dipl.Ing. E.T.H 3
Some Experimental Tests with Sweep Random Vibration By Jens T. Broch, Dipl.Ing. E.T.H 7
News from the Factory 32
K. LARSEN ft S 0 N - LYNGBY
A Note on Vibration Test Procedures.
By
Jens T. Broch, Dipl. Ing, E.T.II.
Vibration tests were first introduced and specified for critical components or sub-assemblies to be mounted in vehicles. A vibration test should insure that the component or sub-assembly would function properly when placed in its operating environment. Of course it is possible to design the component or sub-assembly in such a manner that it will operate properly under practically any environmental conditions. On the other hand the weight penalty and clumsiness of such design is undesirable, especially in the air and space vehicle field. Vibration tests should therefore simulate the actual operating environment, and the design of the component or sub-assembly be such that proper operation was obtained in this environment with a certain "safety factor" for unexpected environmental changes. It should in this way be possible to avoid unnecessary weight and design clumsiness. However, it has been found an extremely difficult task to determine and define the vibration test levels to a reasonable degree of accuracy, and many of the existing vibration test specifications are based on rather insufficient and not too accurate data. In some cases they are even based more or less upon pure guesswork. This, in connection with the spread in the characteristics of manufactured components or sub-assemblies such as clearly demonstrated in the second article of this Technical Review leave a lot to be desired with respect to precision in vibration testing. Some ten years ago vibration tests were always carried out in the form of resonance search and dwell testing, or as sweep sine testing, even if the specimen being tested was known to operate in a more or less random vibration environment. This has, in some cases, caused catastrophic malfunctions, and in others unnecessary weight-penalties and difficult designs. A significant step forward was therefore made in 1955 when Morrow and Muchmore suggested the use of a vibration test employing random noise as input signal to the vibration machine. However, even if this duly considered the statistical character of the vibrations actually present in the real environment, it left more or less open the question of the exact spectrum shape to be used in the tests as well as the problems of mechanical impedance simulation. These questions are still mainly left open and wide band random vibration excitations are normally specified which have only a rough bearing on the real environment. It is true that the original vibration producing mechanisms in many cases show a more or less flat power spectrum, see Fig. 1. On the other hand it is also almost certain that, due to the filtering effects of various structural members and "mis-matching" of mechanical impedances, the frequency spectrum at the place of equipment mounting will not be flat, Fig. 2.
3
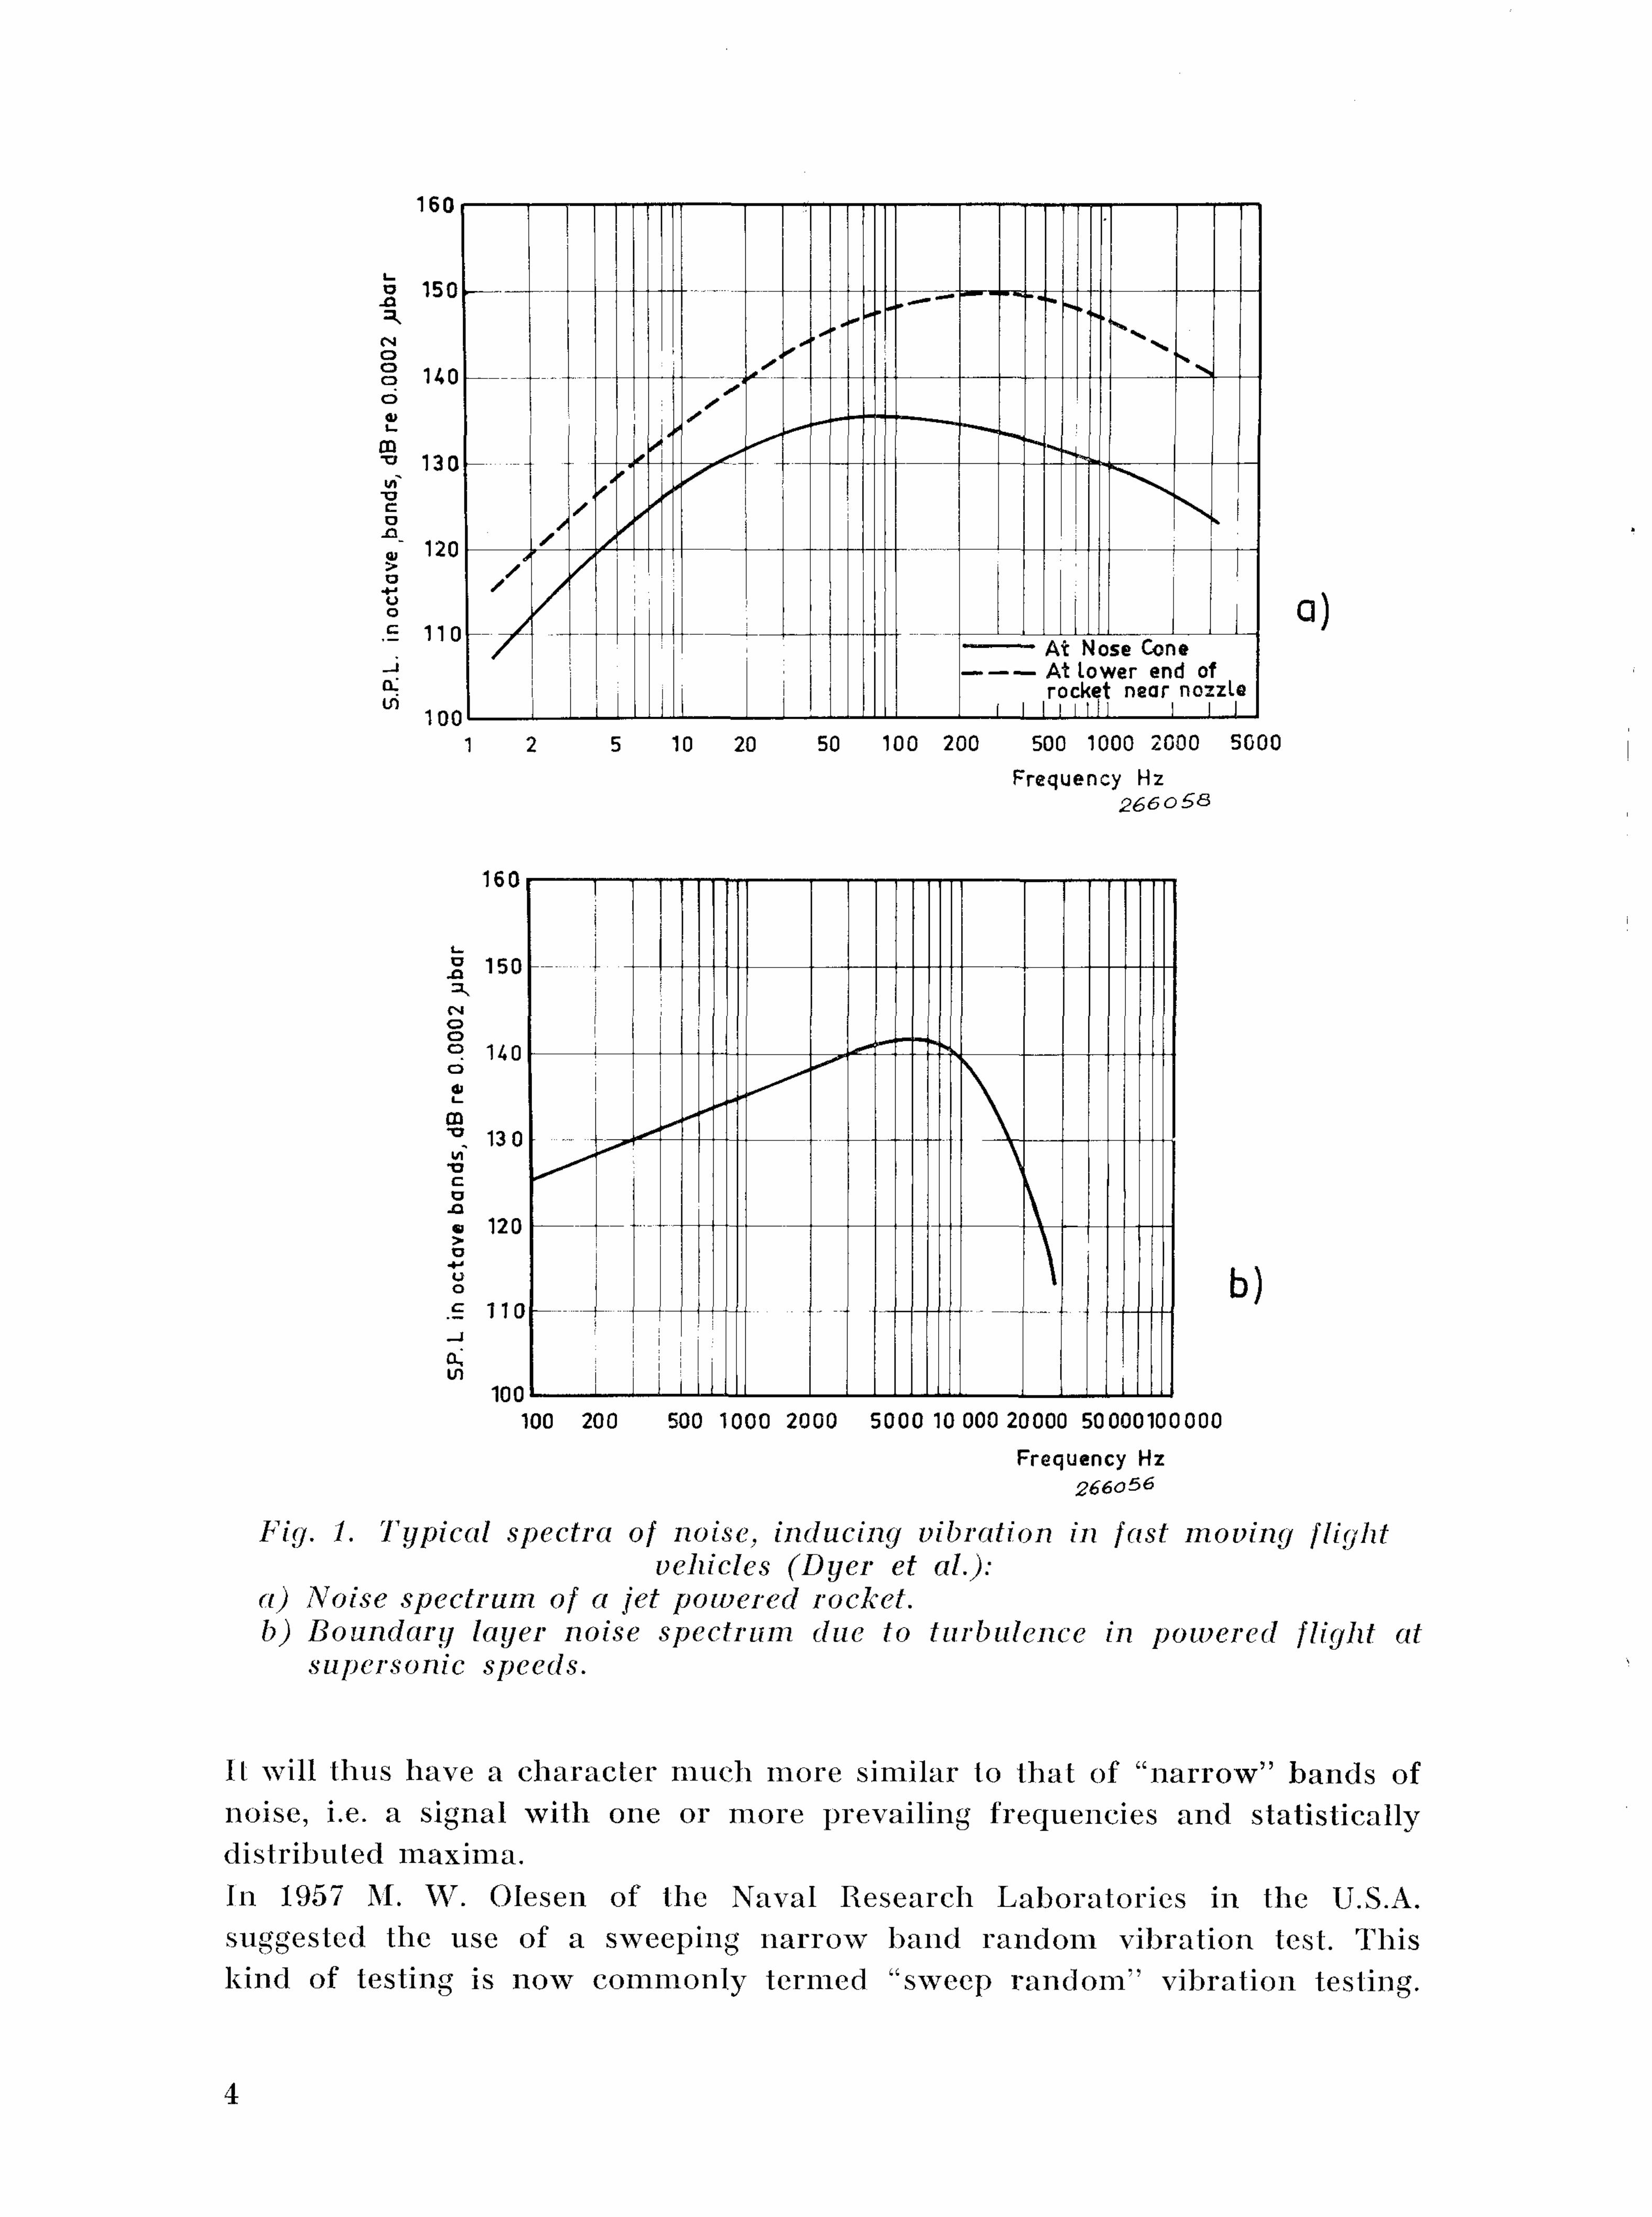
Fig. 1. Typical spectra of noise, inducing vibration in fast moving flight vehicles (Dyer et ah):
a) Noise spectrum of a jet powered rocket. b) Boundary layer noise spectrum due to turbulence in powered flight at
supersonic speeds.
It will thus have a character much more similar lo tha t of "na r row" bands of noise, i.e. a signal with one or more prevailing frequencies and statistically distr ibuted maxima. In 1957 M. W. Olesen of the Naval Research Laborator ies in the U.S.A. suggested the use of a sweeping na r row band r andom vibrat ion test. This kind of testing is now commonly termed "sweep r a n d o m " vibrat ion testing.
4
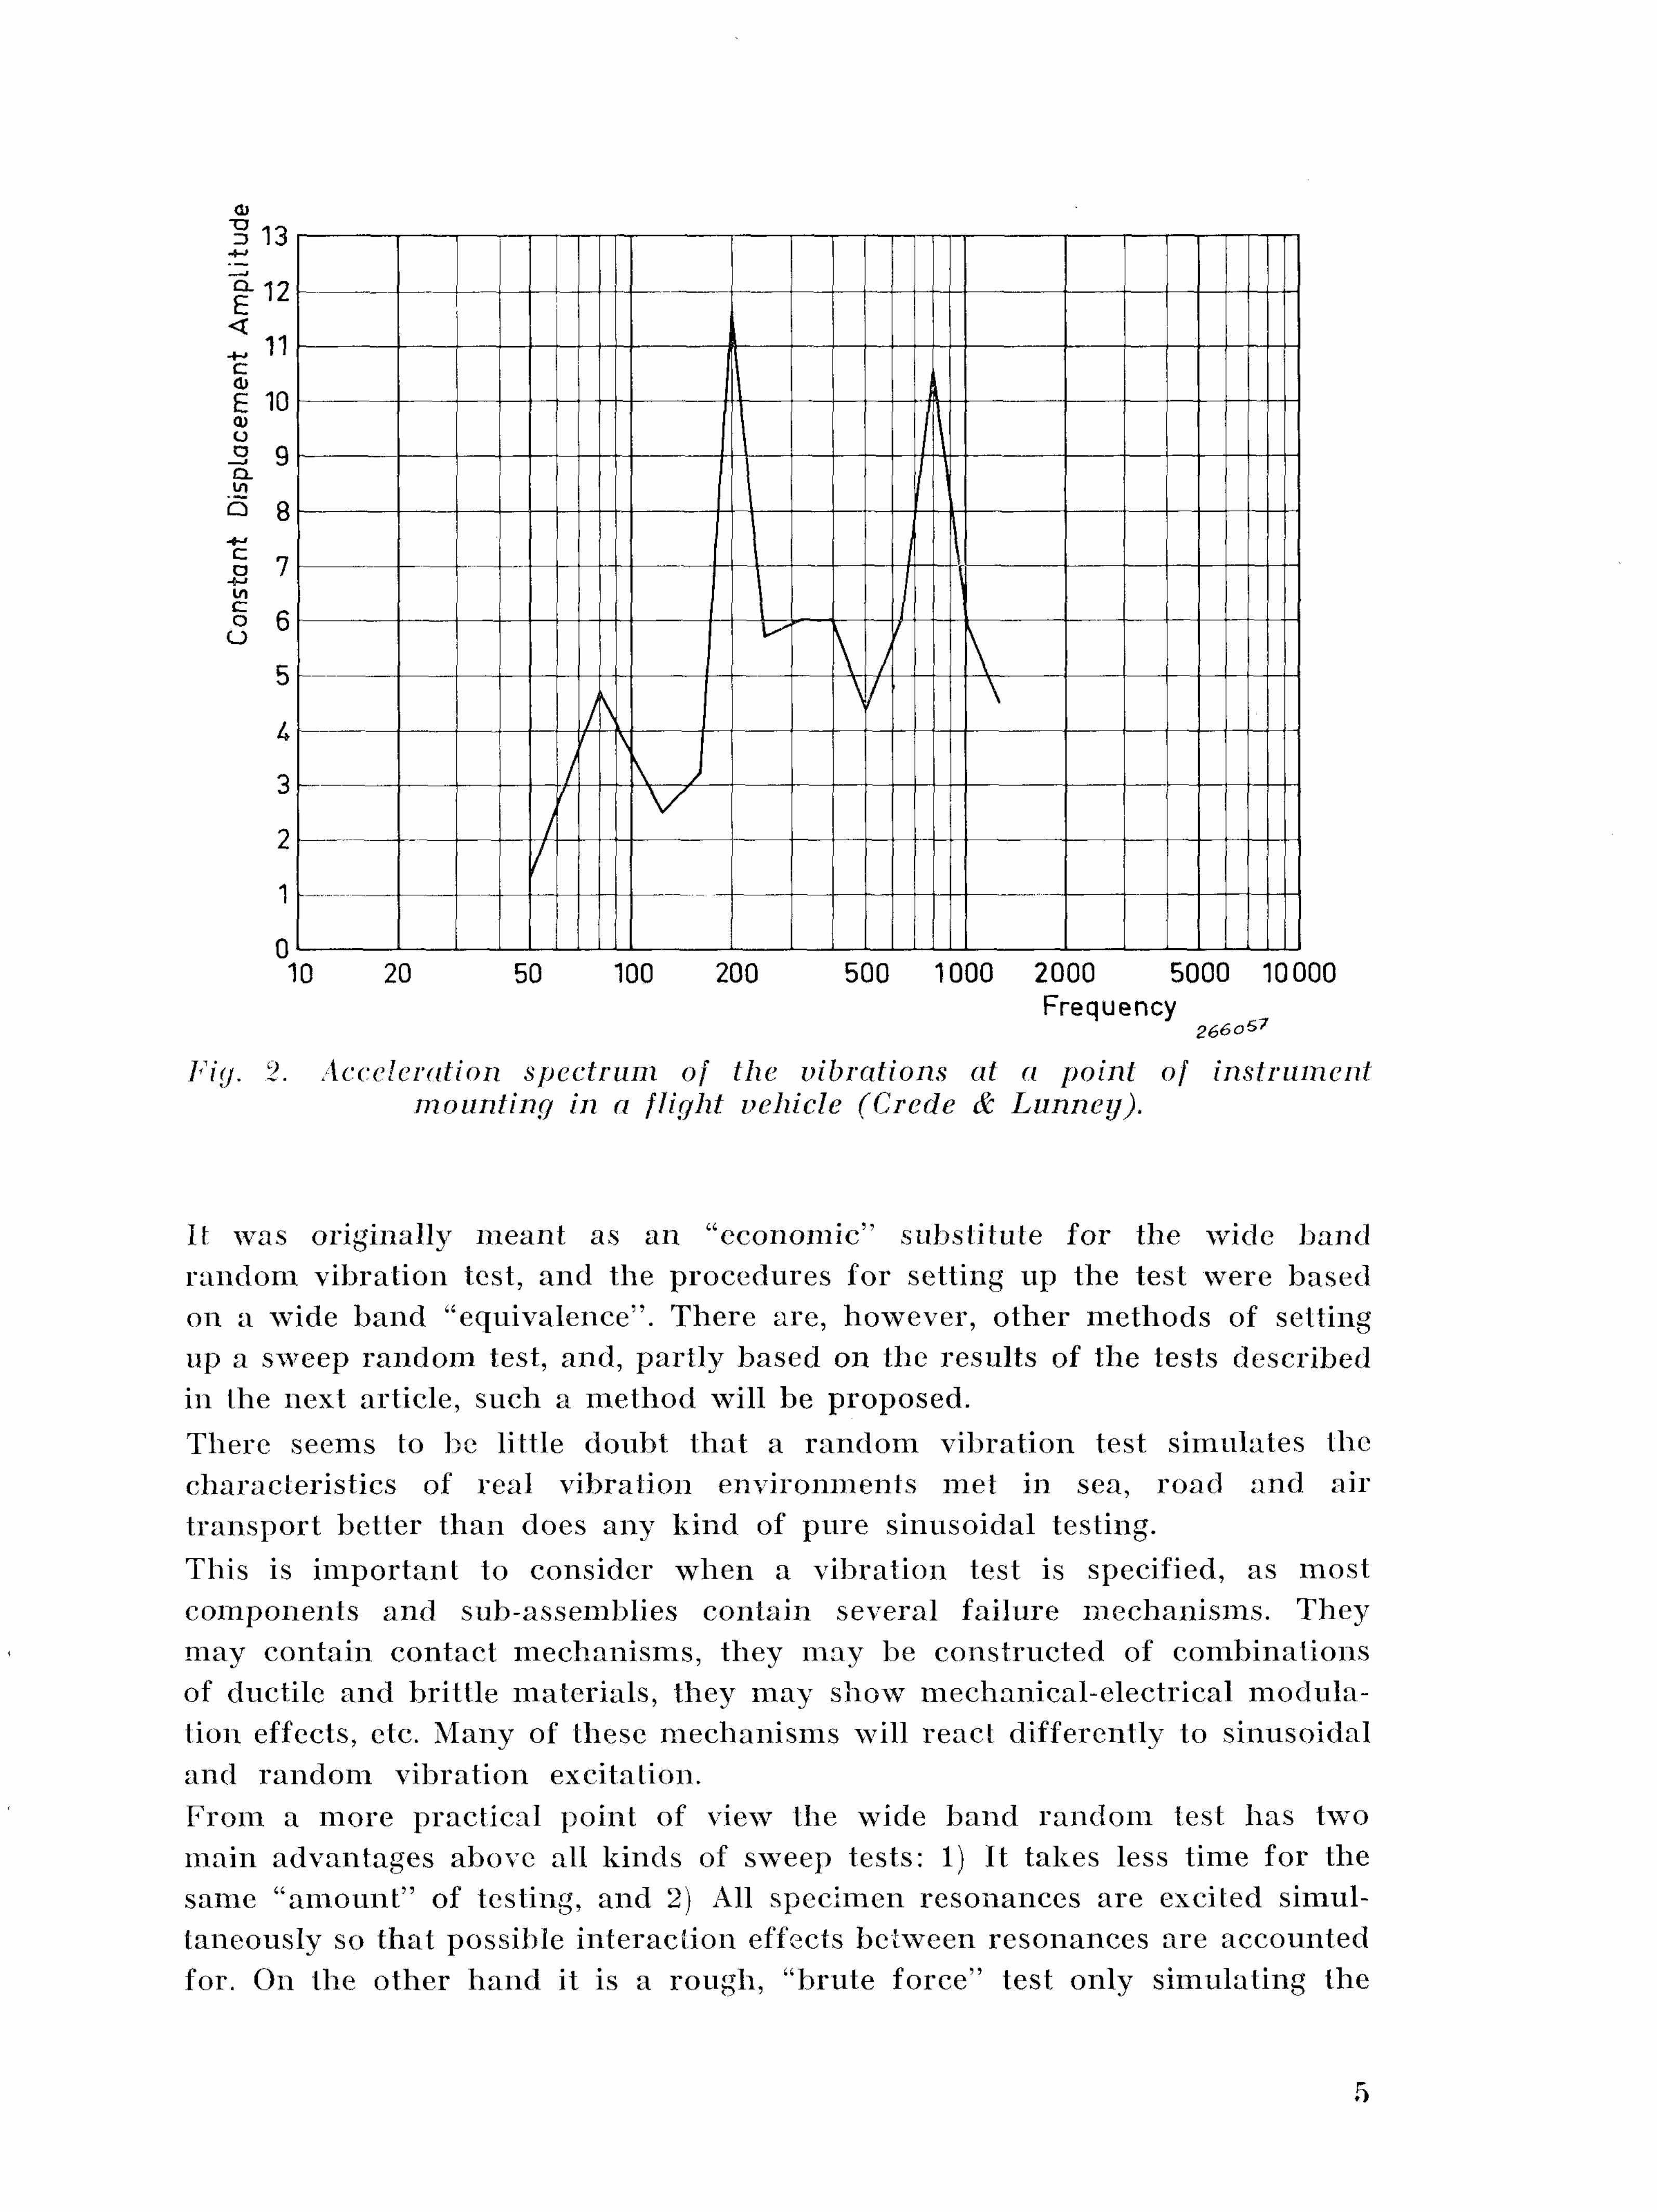
Fig. 2. Acceleration spectrum of the vibrations at a point of instrument mounting in a flight vehicle (Crcde & Lunney),
It was originally meant as an "economic" substitute for the wide band random vibration test, and the procedures for setting up the test were based on a wide band "equivalence". There are, however, other methods of setting up a sweep random test, and, part ly based on the results of the tests described in the next article, such a method will be proposed. There seems to be little doubt that a random vibration test simulates the characteristics of real vibration environments met in sea, road and air t ransport better than does any kind of pure sinusoidal testing. This is important to consider when a vibration test is specified, as most components and sub-assemblies contain several failure mechanisms. They may contain contact mechanisms, they may be constructed of combinations of ductile and brittle materials, they may show mechanical-electrical modulation effects, etc. Many of these mechanisms will react differently to sinusoidal and random vibration excitation. From a more practical point of view the wide band random test has two main advantages above all kinds of swTeep tests: 1) It takes less time for the same "amount" of testing, and 2) All specimen resonances are excited simultaneously so that possible interaction effects between resonances are accounted for. On the other hand it is a rough, "brute force" test only simulating the
5
real environment to a doubtful degree of accuracy—at least as commonly specified today, see p . 30. Leaving the sweeping sine-wave test as a more or less laboratory tool for investigation purposes, the only existing sweep test for pract ical check-out procedvires is the sweep r andom test. This lest has the deficiencies that resonances are tested sequentially, and possible interact ion effects must be investigated on a prototype development stage pr ior to product ion testing— and it takes a longer time than the wide band r andom test. Both of these deficiencies can, however, be more or less overcome by using a "multiple sweep random technique1 ' as described on p. 30, and an accelerated test procedure of the kind discussed in B & K Technical Review No. 3-1965.
The main advantages of the sweep r andom vibration test are : 1. A certain test level can be obtained bv the use of much smaller
power amplifiers and vibration machines than if the test was carried out as a "no rma l " wide band r andom test.
2. The statistical character of the test signal is retained.
3. The setting-up and control of the lest level is simpler and in many cases more accurate than in the case of wide band r andom testing.
4. It is possible to start with a simple system and add complexity as required.
References: CREDE, C. E. and LUNNEY, E. J.: Es tabl ishment of Vibration and Shock Tests for Missile
Electronics as Derived from the Measured Environment . WADC Technical Report 56-503, ASTIA Document No. AD 118133, Dec. 1956.
DYER, I., FRANKEN, P. A. and UNGAR, E. E.: Noise Envi ronments of Flight Vehicles. Noise Control, Vol.
6, No. 1, Jan . /Feb. 1960.
i .
6
Some Experimental Tests with Sweep Random Vibration. By
Jens T. Bvoch, Dipl.ing. E.T.H.
ABSTRACT A number of practical v ibrat ion test experiments have been and are being carried out in Sweden and Denmark in order to obta in an evaluation o f the so-called " sweep r a n d o m " v ibrat ion test. The test specimen and measuring arrangement used by the Danish group is described and the results obtained f rom the actual tests discussed. It was found that the spread in the results of practical v ibrat ion test ing is very great. Furthermore, it seems that more detai led environmental data and more general knowledge about the v ibrat ion response of the products being tested are necessary before v ibrat ion tests, that really f u l f i l l their actual object ive, can be der ived. The basic dif ferences between random and sinusoidal v ibra t ion test ing are b r ie f l y discussed and it is suggested that sweep random v ibrat ion test specifications are der ived direct ly f rom environmental data rather than by the use of the "accelerat ion g rad ien t " concept. Final ly, the use of a mul t ip le sweep random test technique is br ie f ly described.
SOMMAIRE Un certain nombre d'essais pratiques aux v ibrat ions ont ete, et sont encore, effectues a t i t re exper imental en Suede et au Danemark en vue de permettre une evaluat ion de 1'essai aux v ibrat ions aleatoires sous bande glissante. On decrit i 'echanti i lon pour I'essai et le disposi t i f de mesure util ises par le groupe da no is, Les resultats des essais reels sont ensuite discutes. On a trouve que la dispersion des resultats donnes par des essais pratiques aux v ibrat ions est tres grande. En outre, il semble que des donnees plus detail lees sur I 'environnement et qu'une connaissance plus genera le de la reponse en v ibra t ion des produits a I'essai sont necessaires avant que Ton puisse etabl i r des essais aux v ibrat ions atteignant reel lement leur object i f . Les differences fondamentales entre les essais aux v ibrat ions aleatoires et sinusoTdales sont brievement discutees et Ton suggere que les specifications pour I'essai aux v ibrat ions aleatoires a bande glissante soient tirees directement des donnees d 'environnement p lu tot que par le recours a la not ion de grandient d'acceleration. Finalement on decrit br ievement I 'emploi d 'une technique d'essai aux signaux aleatoires glisses mul t ip les.
ZUSAMMENFASSUNG Um den Wert des Schmalbandverfahrens bei V ibra t ionsprufungen beurtei len zu lernen, wu rden und werden in Schweden und Danemark praktische Vibrat ionsprufungs-Exper imente durchgefuhr t . Das Pri i fobjekt und die Messeinrichtung der danischen Gruppe werden kurz beschrieben, und die Ergebnisse der verschiedenen Versuche werden diskut iert . Es stellte sich heraus, dass die Ergebnisse bei den praktischen Vibrat ionsprufungen sehr we it streuen. Ausserdem sind of fenbar genauere Kentnisse uber Umgebungsbedingungen und Schwingungsverhal ten der zu pr i i fenden Produkte er forder l ich, bevor Prufmethoden, die tatsachlich auf die jewe i l ige Fragestellung zielen, entwickel t werden konnen. Die grundsatzl ichen Unterschiede zwischen der V ibrat ionsprufung mit Rauschen und mit Sinus werden kurz d iskut ier t , und es w i r d vorgeschlagen, das Prufprogramm fur Schmalbandverfahren lieber d i rekt aus den Umgebungsbedingungen abzule i ten, als nach dem Schema des »BeschIeunigungsgradienten« zu ver fahren. Schliesslich w i r d d ie Anwendung einer AAehrfach-Schmalbandverfahren-Pruftechnik kurz dargestel l t .
7
Introduction. To try to obtain a practical evaluation of the so-called "sweep random" vibration testing as compared with the more commonly known "sweep sine" and "wide-band random" vibration testing a number of experimental investigations have been carried out in Sweden and Denmark. One of the aims of these investigations has been to attempt to clearify how suitable test specifications should be derived for sweep random vibration tests, especially with a view to possible international standardization (I.E.G.). Although there are certain more or less obvious theoretical similarities and disimilarities between the sweep sine and the sweep random test as well as between the sweep random and the wide band random test it was deemed necessary for a more realistic evaluation of the sweep random vibration test to perform a number of practical experiments. It was decided, in the first instance, to use two different types of test specimens which exhibit different failure mechanisms, whereby more versatile results should be obtained and the conclusions drawn from the tests might in this way be more general. The Swedish group set out to make comparison tests using electric lamps of a part icular construction, while the Danish group concentrated on a special combination of a relay-contact and fatigue failure mechanism. Results from the Swedish tests will be described in a separate paper, while this article deals with the Danish experiments.
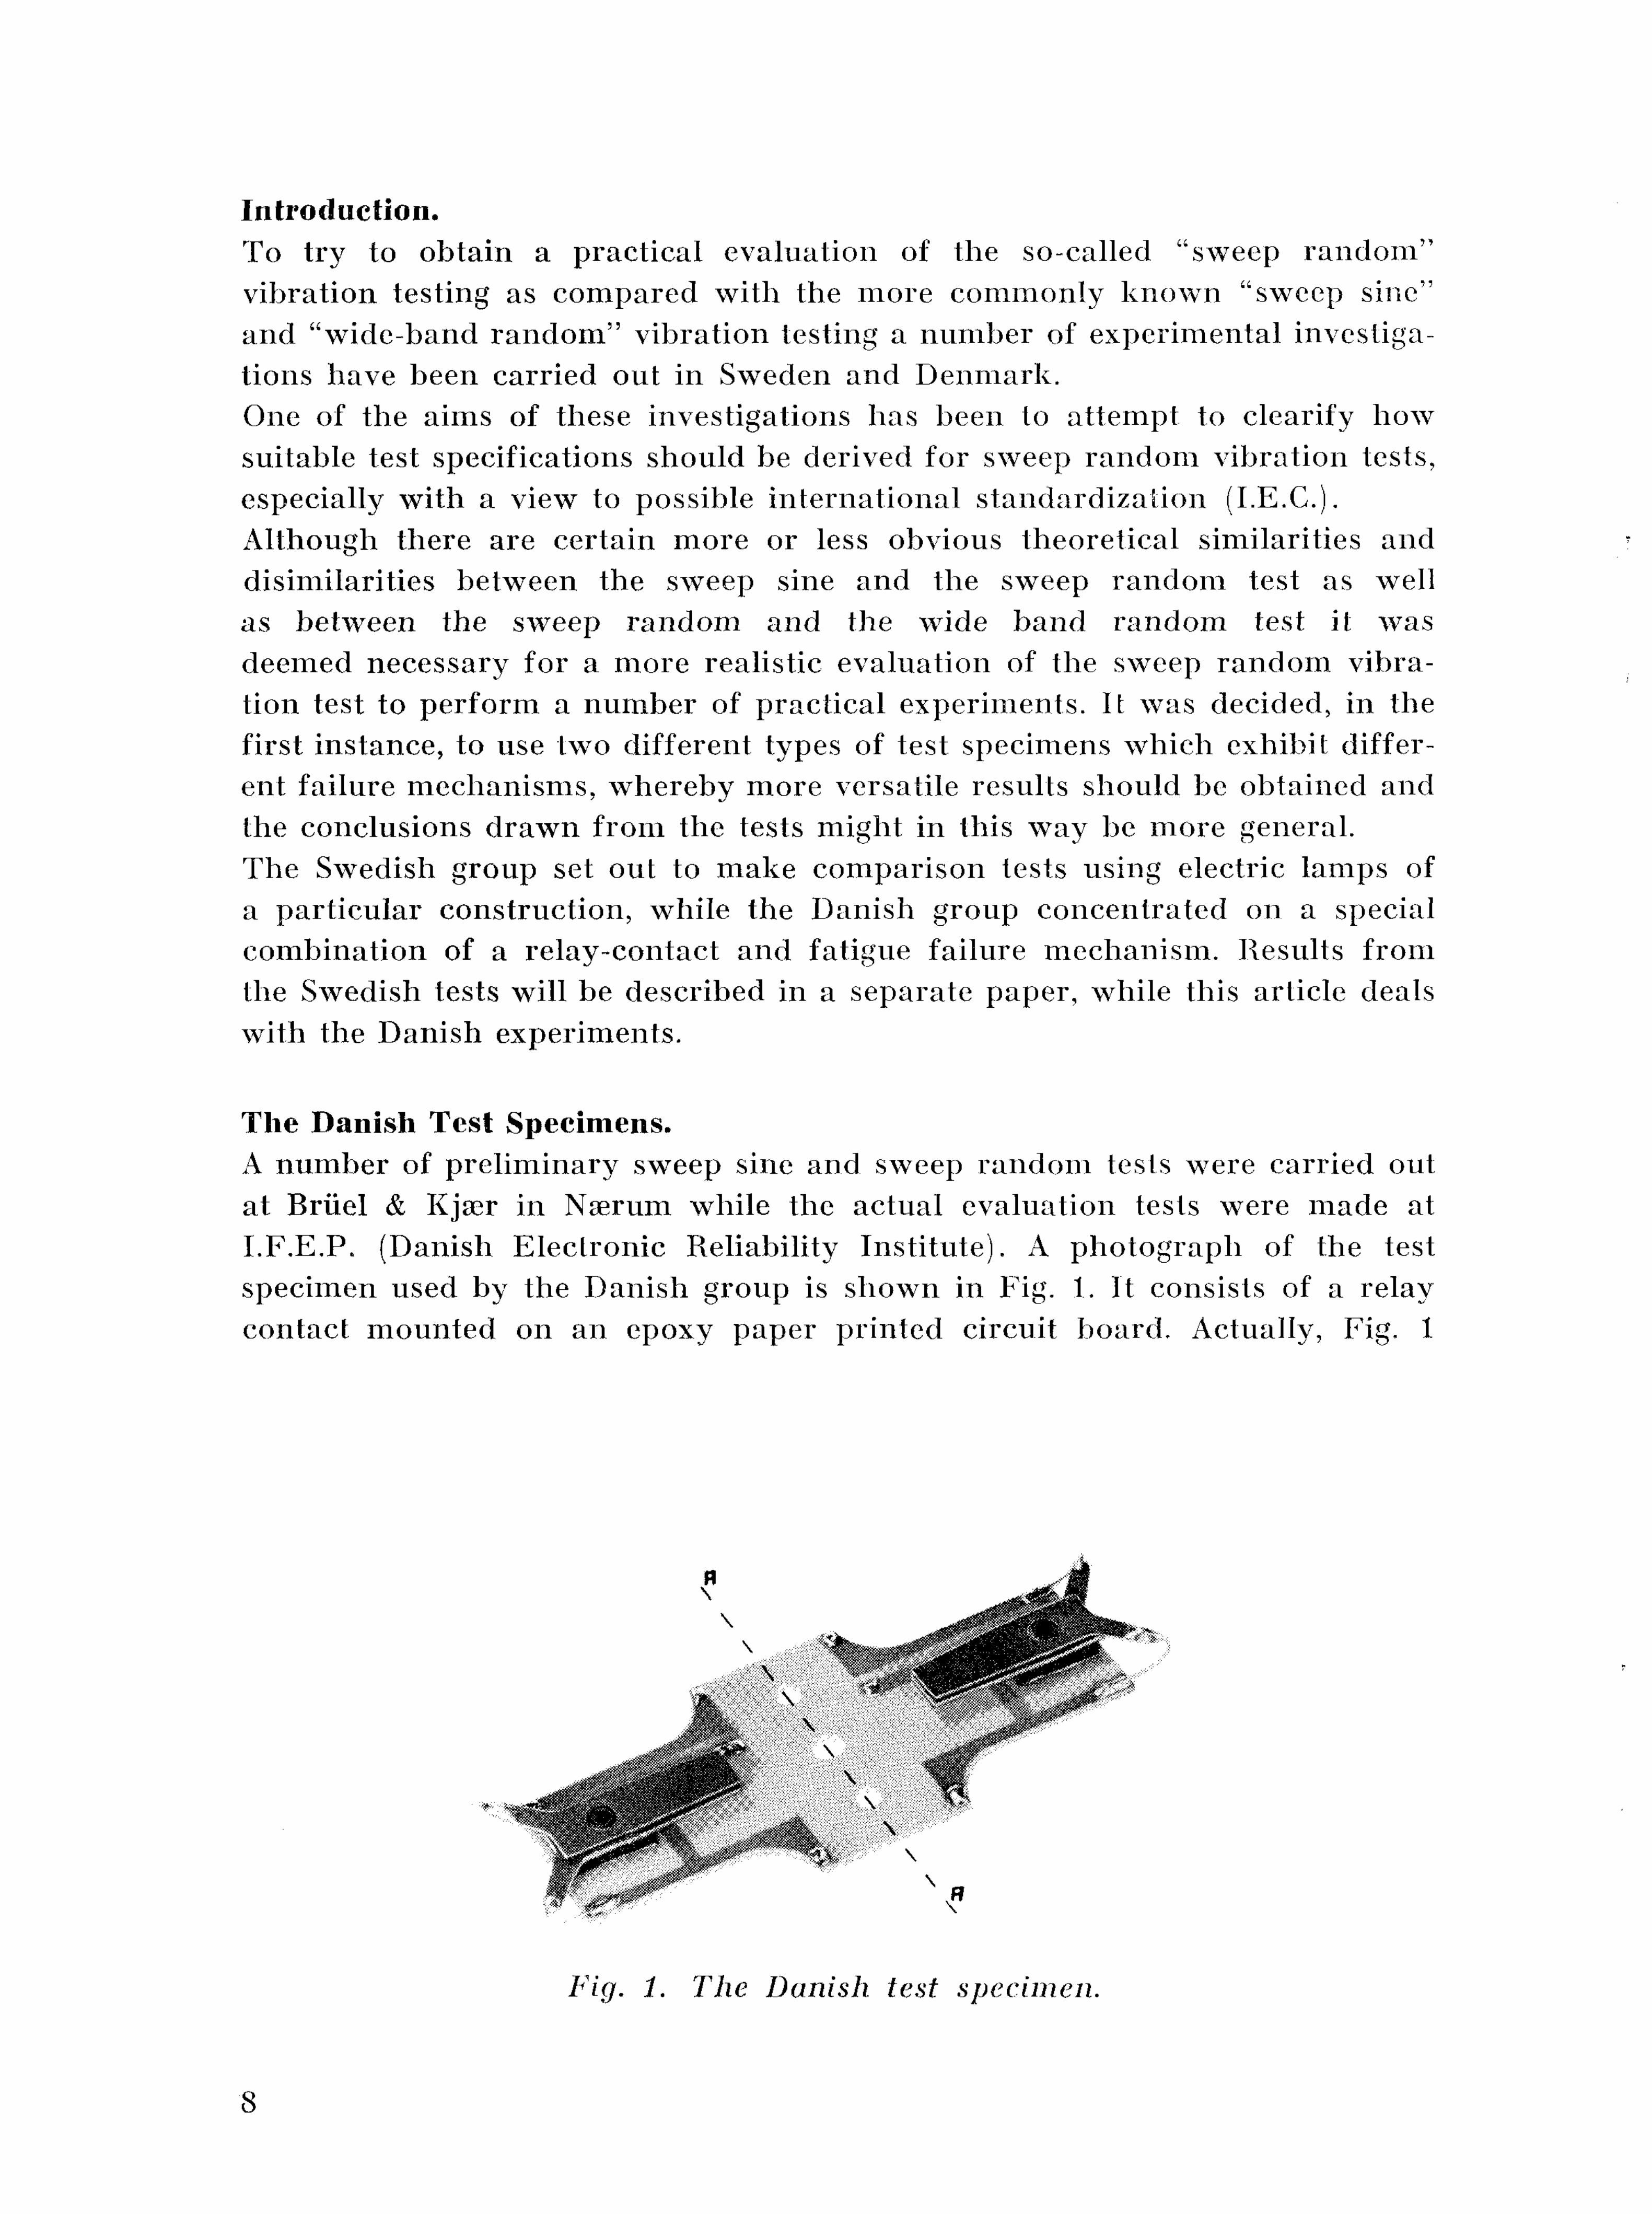
The Danish Test Specimens. A number of preliminary sweep sine and sweep random tests were carried out at Briiel & Kjser in N serum while the actual evaluation tests were made at I.F.E.P. (Danish Electronic Reliability Institute). A photograph of the test specimen used by the Danish group is shown in Fig. 1. It consists of a relay contact mounted on an epoxy paper printed circuit board. Actually, Fig. 1
H
r
J
Fig. 1. The Danish test specimen.
8
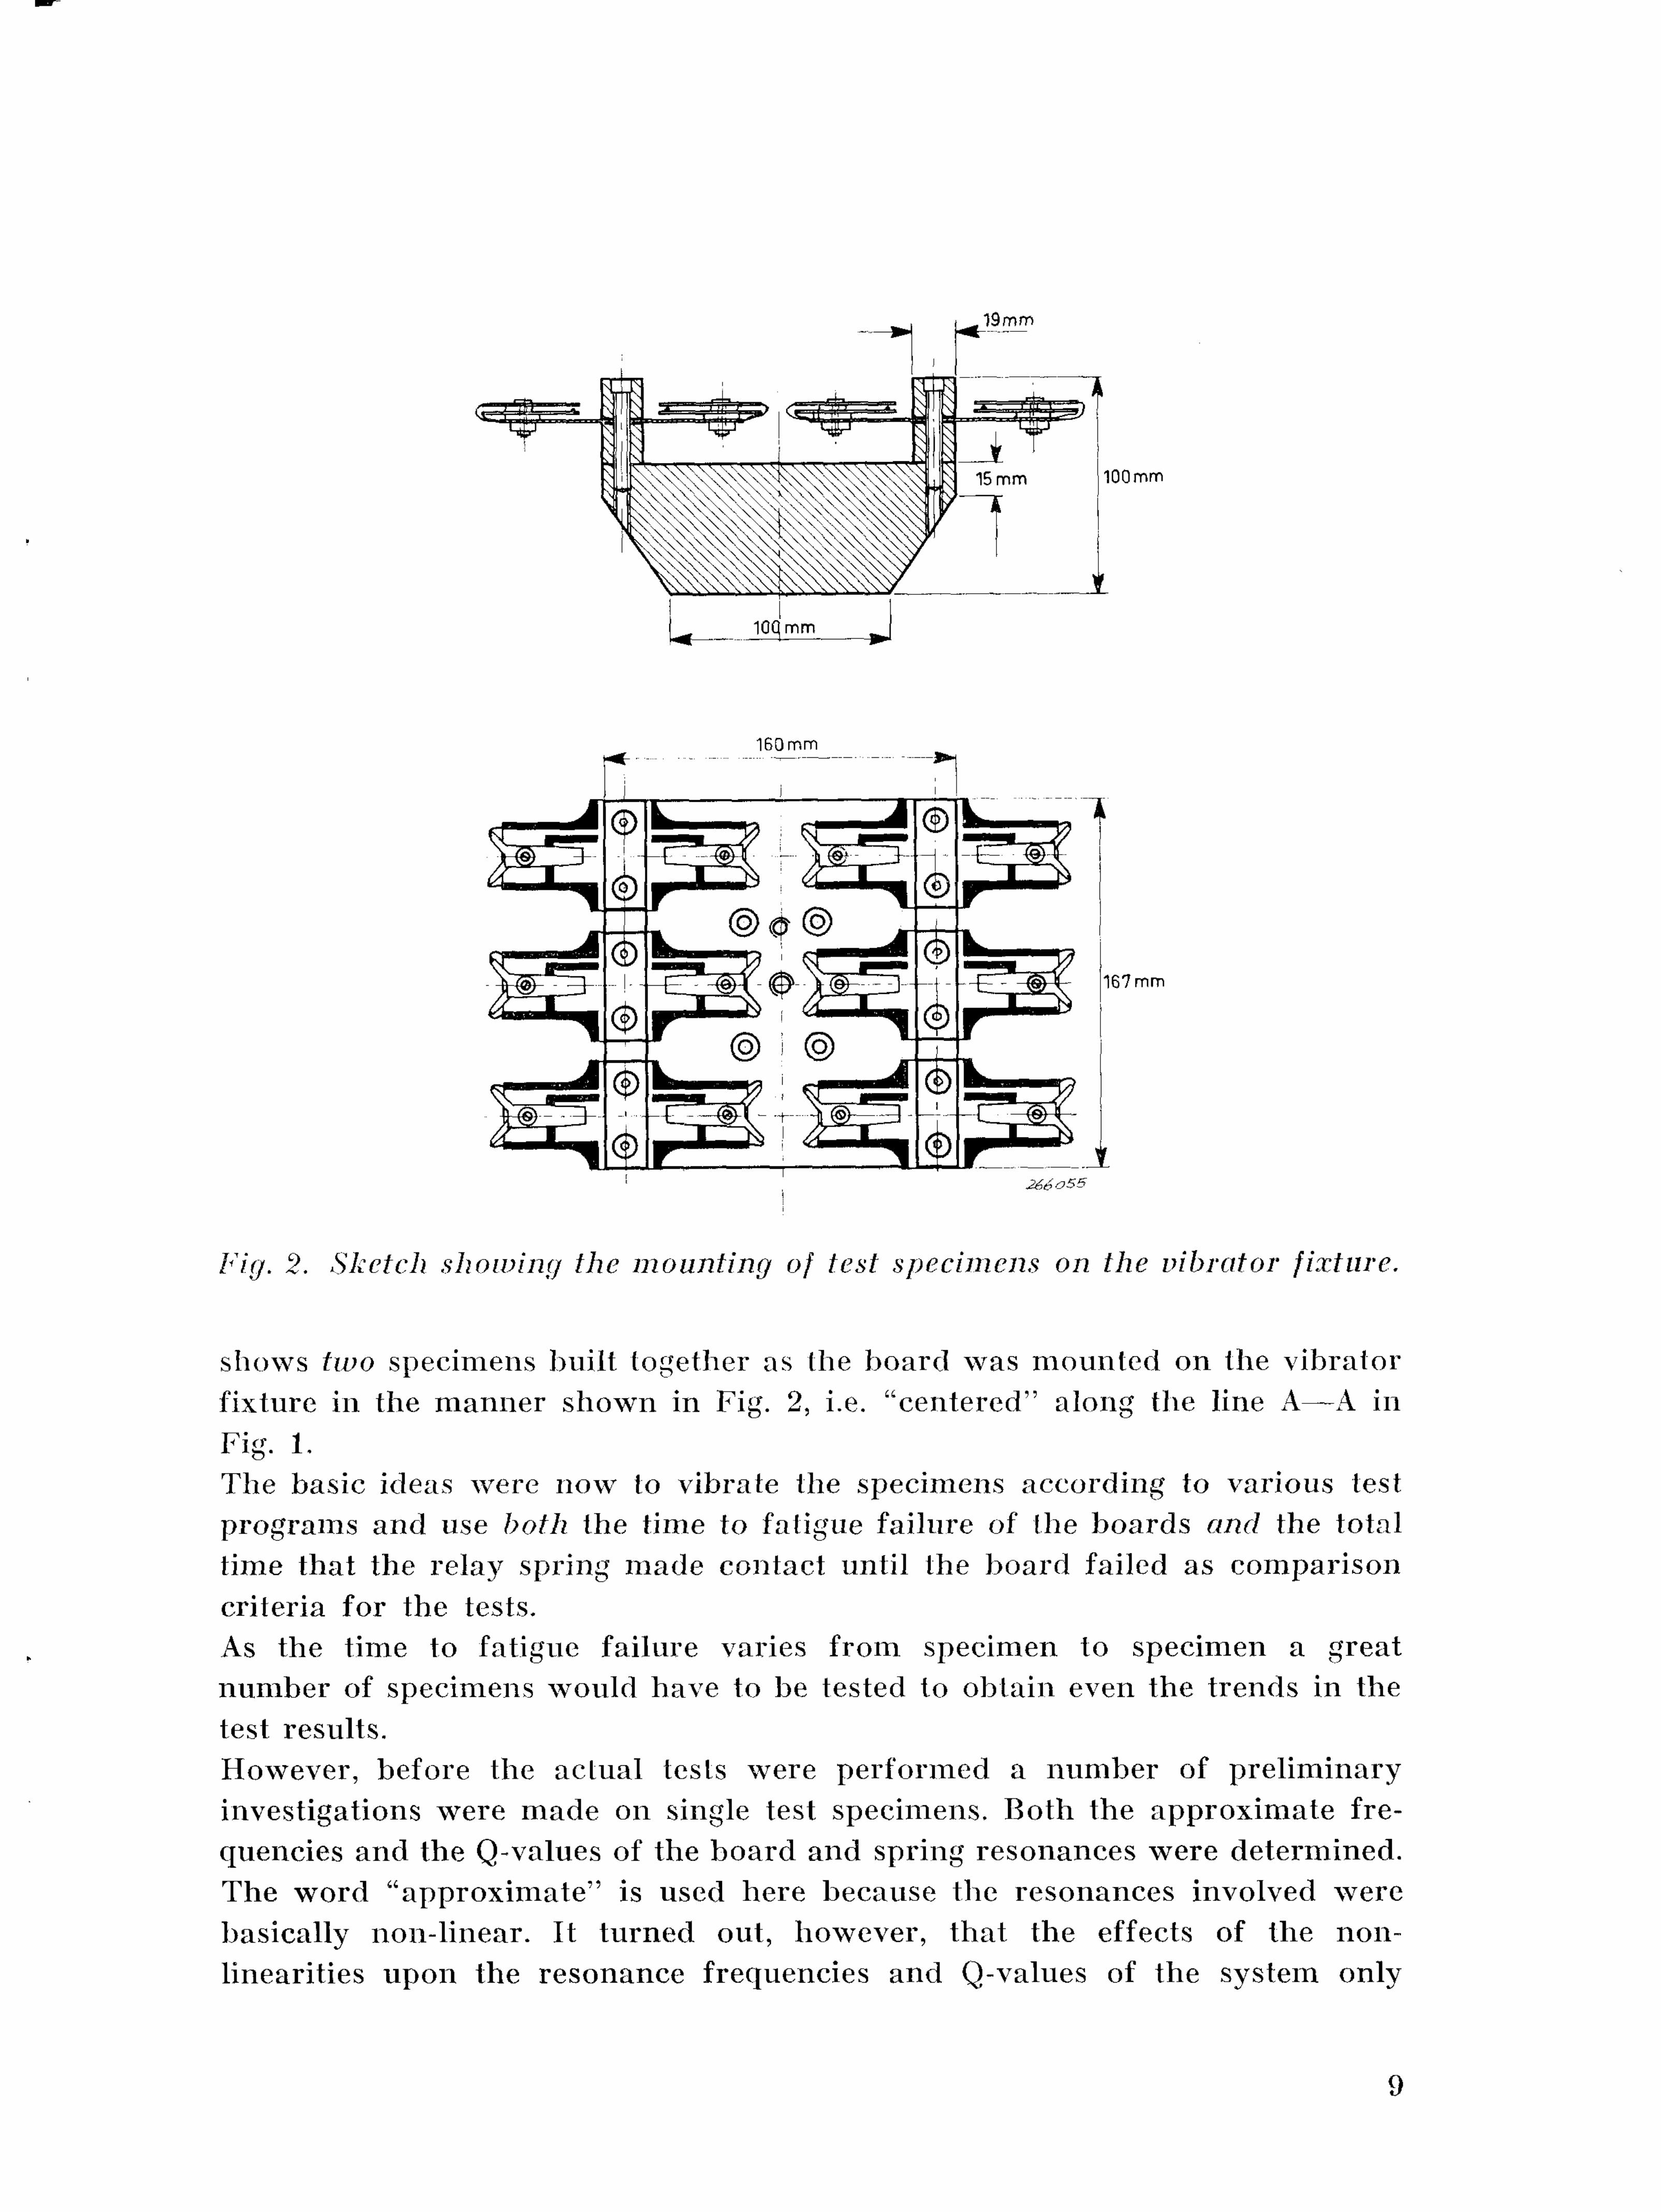
Fig. 2. Sketch showing the mounting of test specimens on the vibrator fixture.
shows two specimens built together as the board was mounted on the vibrator fixture in the manner shown in Fig. 2, i.e. "centered" along the line A—A in Fig. 1. The basic ideas were now to vibrate the specimens according to various test programs and use both the time to fatigue failure of the boards and the total time that the relay spring made contact until the board failed as comparison criteria for the tests. As the time to fatigue failure varies from specimen to specimen a great number of specimens would have to be tested to obtain even the trends in the test results. However, before the actual tests were performed a number of preliminary investigations were made on single test specimens. Both the approximate frequencies and the Q-values of the board and spring resonances were determined. The word "approximate" is used here because the resonances involved were basically non-linear. It turned out, however, that the effects of the non-linearities upon the resonance frequencies and Q-values of the system only
9
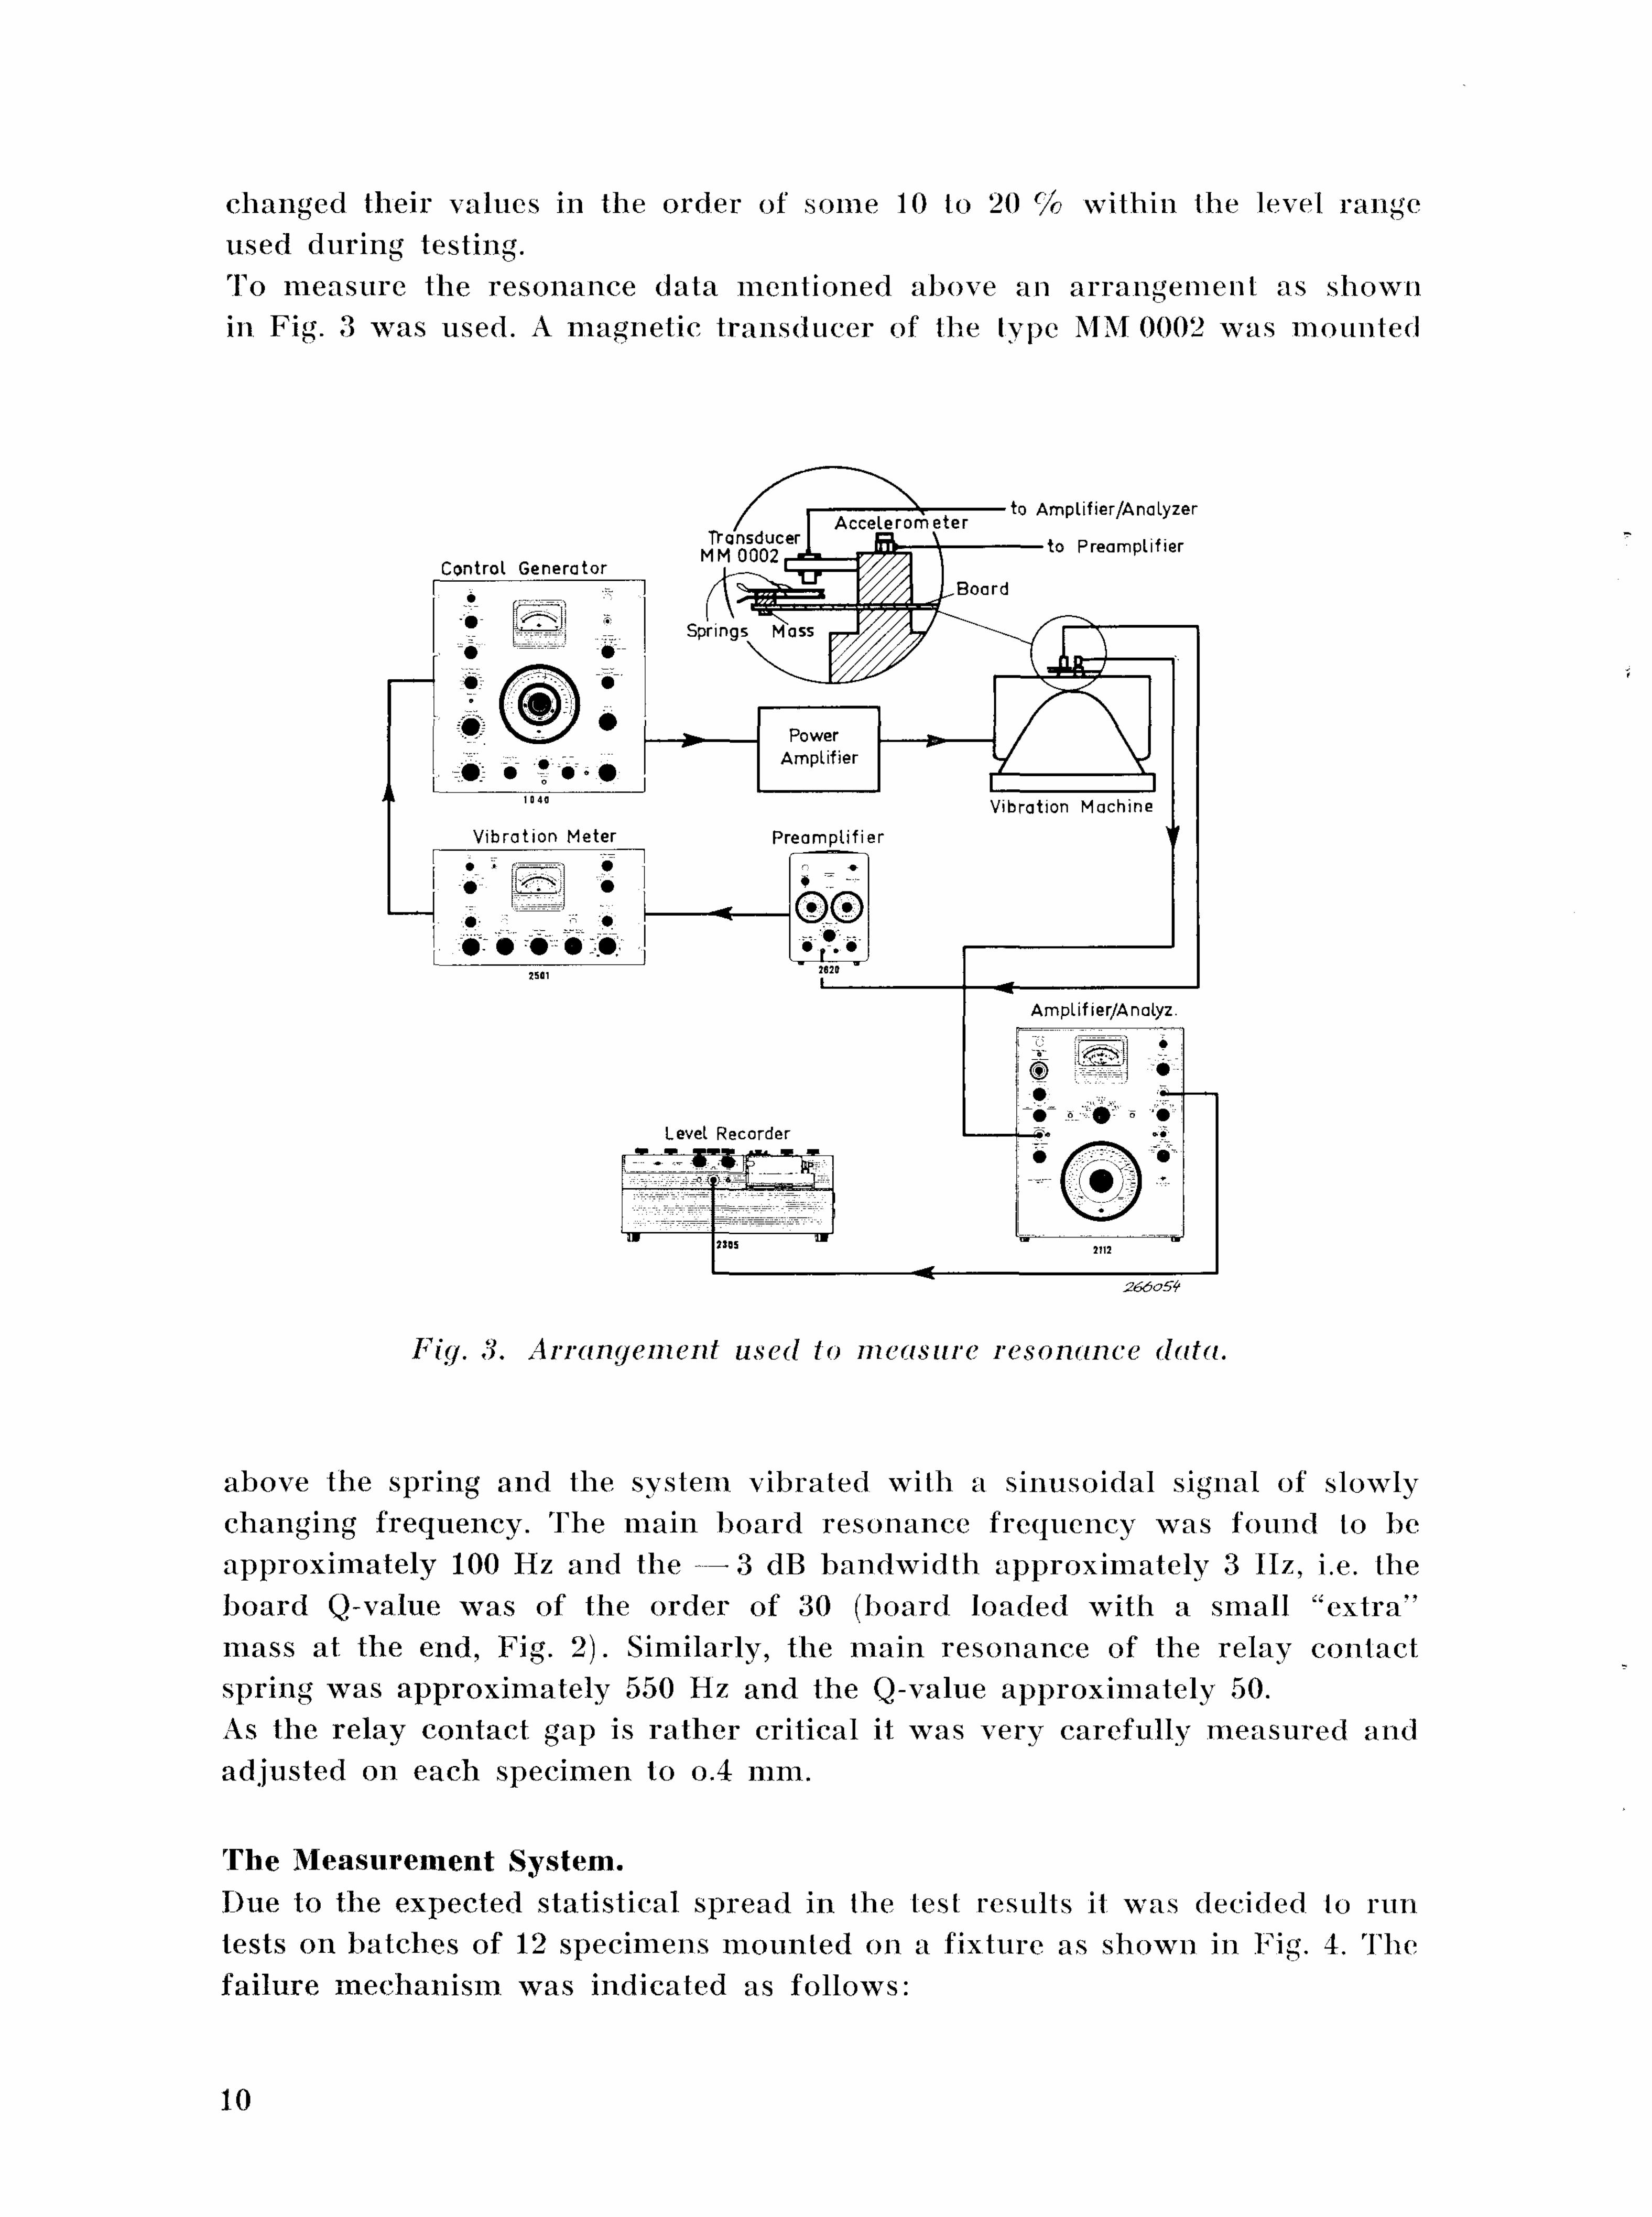
changed their values in the order of some 10 to 20 % within the level range used during testing. To measure the resonance data mentioned ahove an arrangement as shown in Fig. 3 was used. A magnetic transducer of the lypc MM 0002 was mounted
Fig. 3. Arrangement used to measure resonance data.
above the spring and the system vibrated with a sinusoidal signal of slowly changing frequency. The main board resonance frequency was found to be approximately 100 Hz and the — 3 dB bandwidth approximately 3 Hz, i.e. the board Q-value was of the order of 30 (board loaded with a small "extra" mass at the end, Fig. 2). Similarly, the main resonance of the relay contact spring was approximately 550 Hz and the Q-value approximately 50. As the relay contact gap is ra ther critical it was very carefully measured and adjusted on each specimen to o.4 mm.
The Measurement System. Due to the expected statistical spread in the test results it was decided lo run tests on batches of 12 specimens mounted on a fixture as shown in Fig. 4. The failure mechanism was indicated as follows:
10
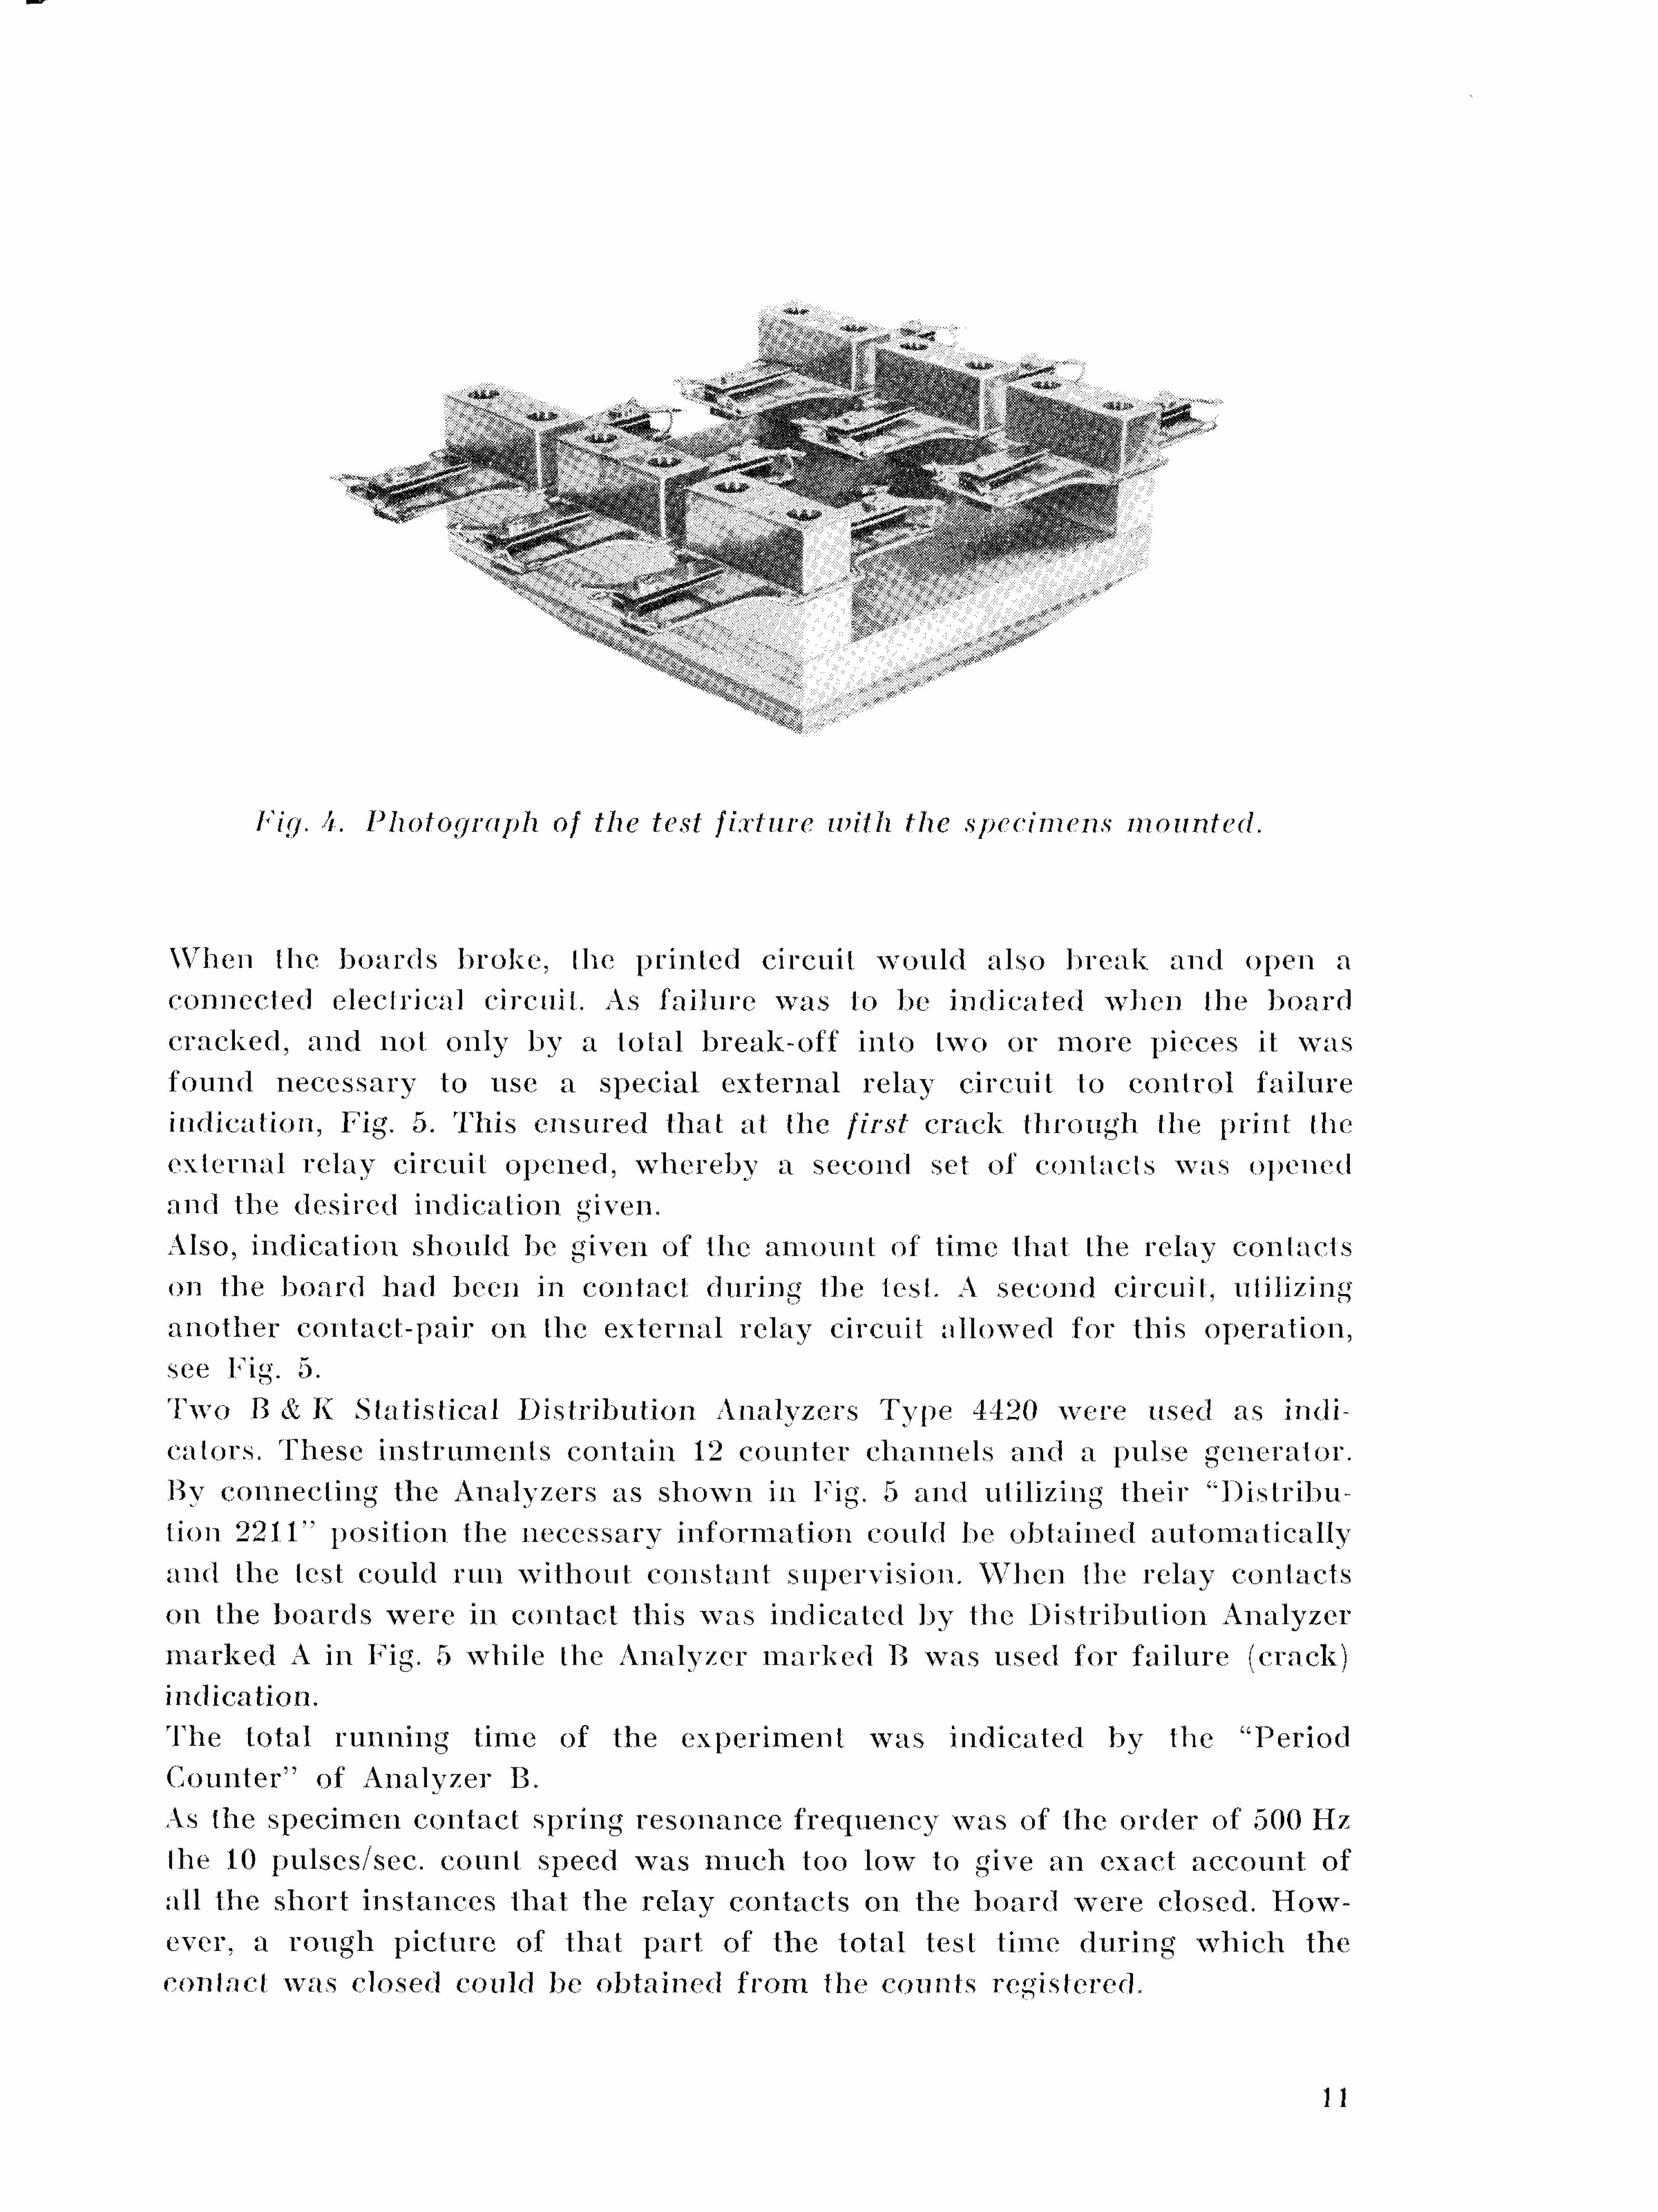
Fig. h. Photograph of the test fixture with the specimens mounted.
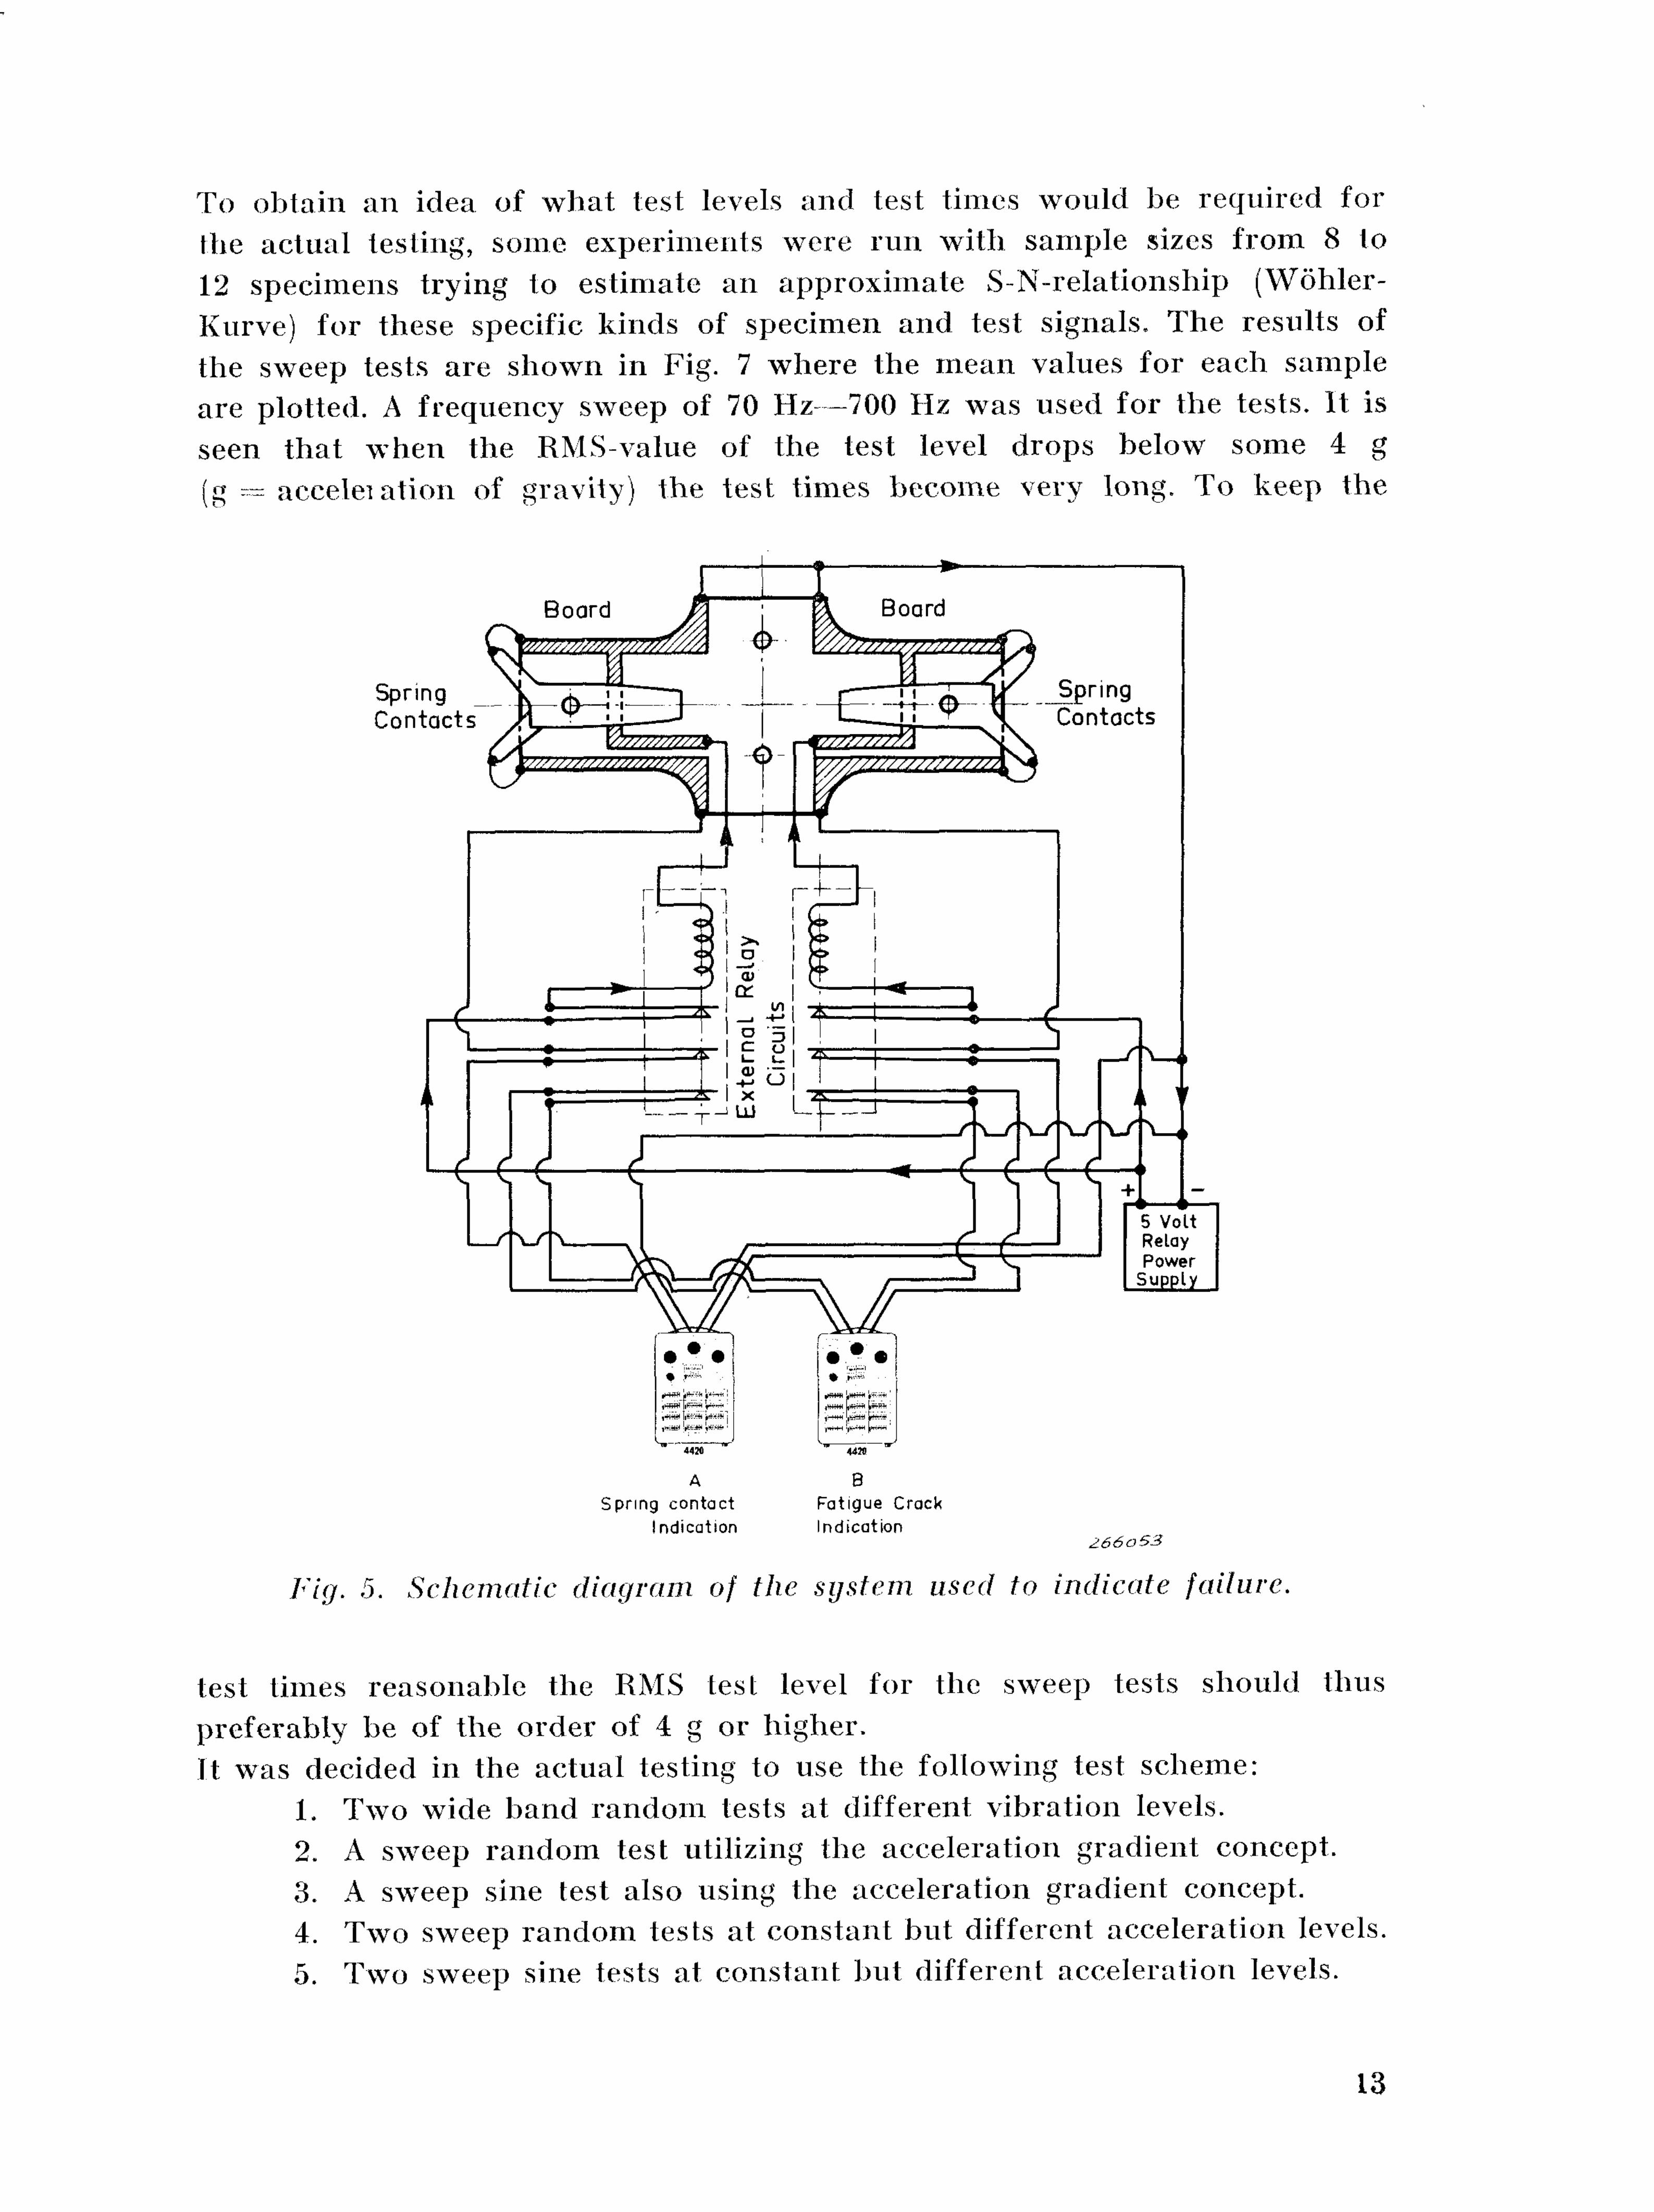
When I he boards broke, (he printed circuit would also break and open a connected electrical circuit. As failure was to be indicated when the board cracked, and not only by a lotal break-off into two or more pieces it was found necessary to rise a special external relay circuit to control failure indication, Fig. 5. This ensured that at the first crack through the print (he external relay circuit opened, whereby a second set of contacts was opened and the desired indication given. Also, indication should be given of the amount of time that the relay contacts on the board had been in contact durina the test. A second circuit, utilizing another contact-pair on the external relay circuit allowed for this operation, see Fig. 5. Two B & K Statistical Distribution Analyzers Type 4420 were used as indicators. These instruments contain 12 counter channels and a pulse generator. Bv connecting the Analyzers as shown in Fig. 5 and utilizing their "Distribu-lion 2211" position the necessary information could be obtained automatically and the lest could run without constant supervision. When the relay contacts on the boards were in contact this was indicated by the Distribution Analyzer marked A in Fig. 5 while the Analyzer marked B was used for failure (crack) indication. The lotal running time of the experiment was indicated by the "Period Counter" of Analyzer B.
M _ - -
As the specimen contact spring resonance frequency was of the order of 500 Hz the 10 pulses/sec. count speed was much too low to give an exact account of all the short instances that the relay contacts on the board were closed. However, a rough picture of that part of the total test time during which the contact was closed could be obtained from the counts registered,
11
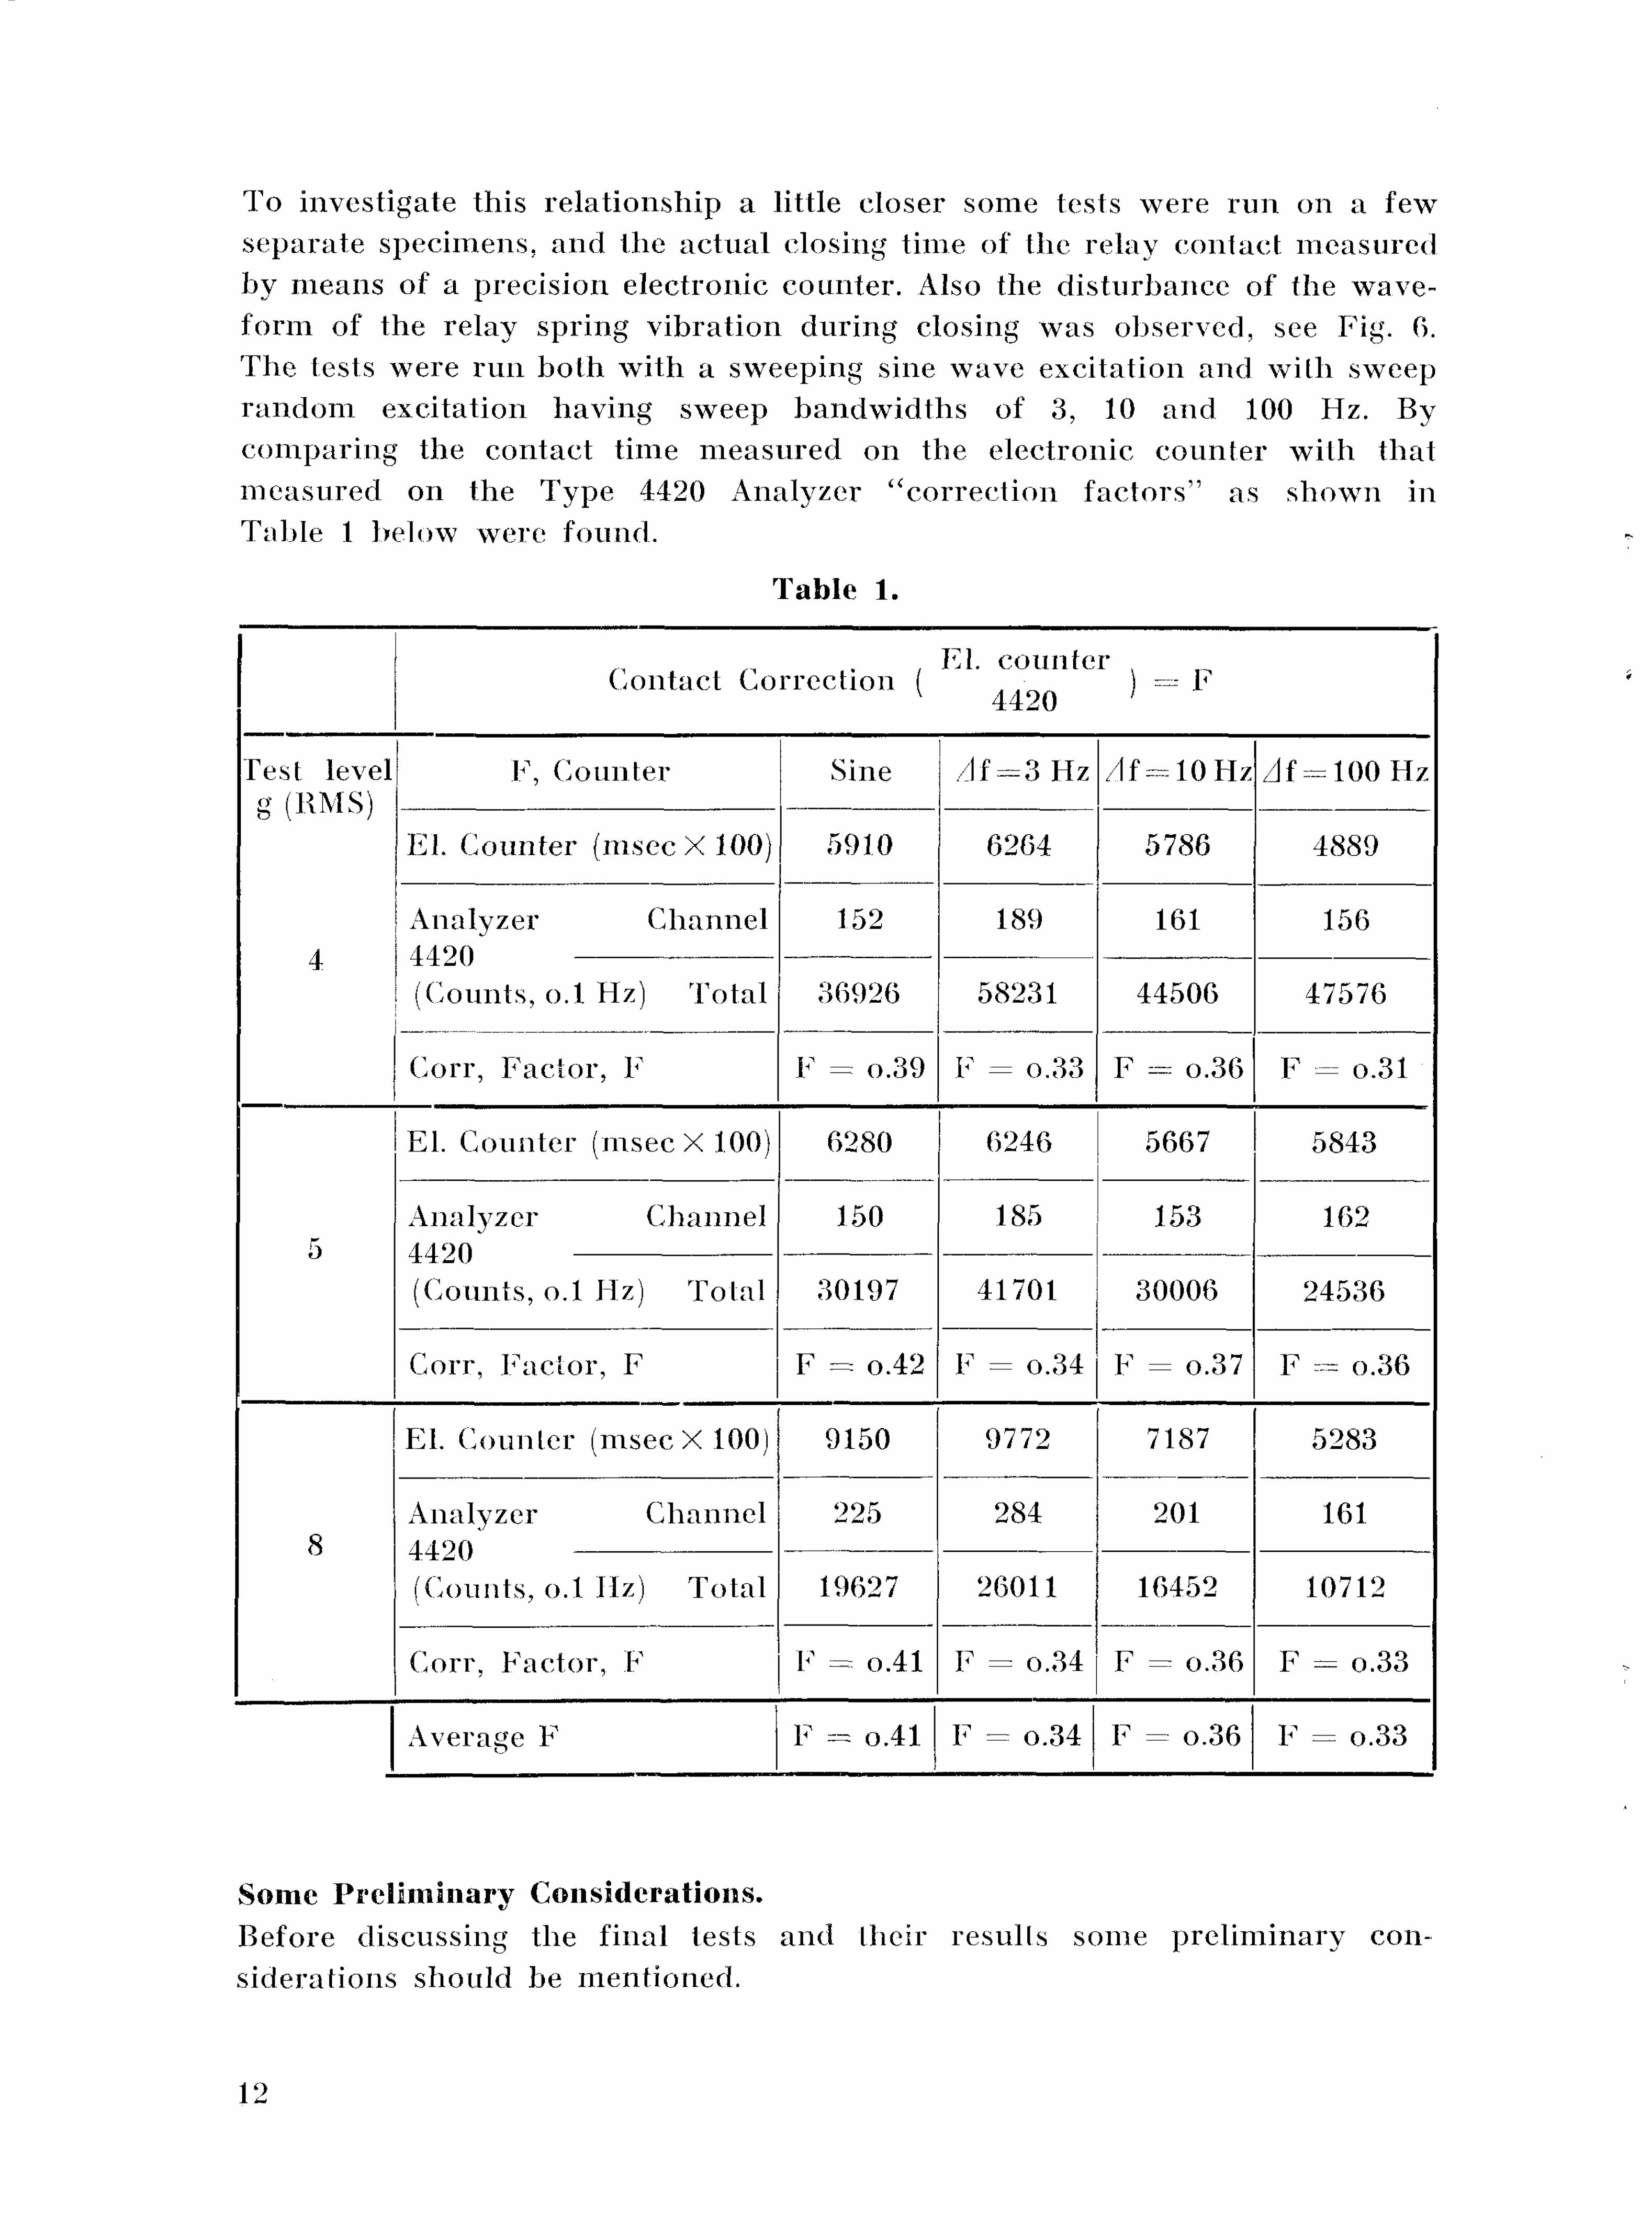
To investigate this relat ionship a little closer some tests were run on a few separate specimens, and the actual closing time of the relay contact measured by means of a precision electronic counter. Also the dis turbance of the waveform of the relay spring vibrat ion during closing was observed, see Fig. 0. The tests were run both with a sweeping sine wave excitation and with sweep r andom excitation having sweep bandwid ths of 3, 10 and 100 Hz. By comparing the contact time measured on the electronic counter with that measured on the Type 4420 Analyzer "correc t ion factors" as shown in Table 1 below were found.
Table 1.
. El. counter , Contact Correction , - = v
v 4420 ;
Test level F, Counter Sine /If = 3 Hz /If = 10 Hz /df = 100 Hz g(RMS)
El. Counter (msec X 100) 5910 6264 5786 4889
Analyzer Channel 152 189 161 156 4 4420
(Counts, o.l Hz) Total 36926 58231 44506 47576 i I
Corr, Factor , F F = o.39 F = o.33 F = o.36 F = o.31
El. Counter (msec X 100) 6280 6246 5667 5843
Analyzer Channel 150 185 153 162 5 4420
(Counts, o.l Hz) Total 30197 41701 30006 24536
Corr, Factor , F F = o.42 F = o.34 F = o.37 F =.--= o.36
EL Counter (msec X 100) 9150 9772 7187 5283 ^ 1 ■ ■ " M ^ ^ M ^ ^ ^ ^ ^ ^ ^ ^ ^ M ^ ^ ^ M ^ ^ ^ ^ ^ ^ ^ ^ ^ ^ ^ ^ M M I „ . . . . , | ^ 1 " * > ^ ■"" M l I I M M 1 1 1 1 1 Wl I ' ™ » ^ ™ - ^ ™ » ^ ^ ^ ^ ^ ^ ^ ^ ^ ^ ^ ^ ^ ^ ^ M _ ■ ■ ■ ^ ■ ■ 1 ■ ■ ■ ■ ■ ■ ■ ■ ■ I I ■ ^ l - I — ^ - l - ^ - U B ^ ^ ^ W .X ■ T 1 T I - - I I I II I I I I I ■ II I
Analyzer Channel 225 284 201 161 8 4420
(Counts, o.l Hz) Total 19627 26011 16452 10712
Corr, Factor , F F = o.41 F = o.34 F = o.36 F = o.33
Average F F = o.41 F = o.34 F = o.36 F = o.33
Some Preliminary Considerations. Before discussing the final tests and their resulls some prel iminary considerations should be mentioned.
12
X u l j l t _1_ t
Contact Correction ( El. counter
= r 4420 '
Test level g (RMS)
4
E, Counter Sine / I f - 3 Hz / I f - 1 0 Hz At =-100 Hz Test level g (RMS)
4
El. Counter (msec X 100) 5910 6264 5786 4889
Test level g (RMS)
4 Analyzer Channel 152 189 161 156
Test level g (RMS)
4 (Counts, o.l Hz) Total
i
1
36926 58231 44506 47576
Test level g (RMS)
4
Corr, Factor, E F - o.39 F - o.33 F = o.36 F - o.31
5
El. Counter (msec X 100) 6280 6246 5667 5843
5 Analyzer Channel 150 185 153 162
5 (Counts, o.l Hz) Total 30197 41701 30006 24536
5
Corr, Factor, F F = o.42 F - o.34 F - o.37 F = o.36
8
EL Counter (msec X 100) 9150 9772 7187 5283 -
8 Analyzer Channel 1 J . O O
225 284 201 161 8
(Counts, o.l Hz) Total 19627 26011 16452 10712 8
Corr, Factor, F F - o.41 F - o.34 F = o.36 F - o.33 >
Average F F - o.41 F - o.34 F - o.36 F - o.33
To obtain an idea of what test levels and test times would be required for the actual testing, some experiments were run with sample sizes from 8 to 12 specimens trying to estimate an approximate S-N-relationship (Wohler-Kurve) for these specific kinds of specimen and test signals. The results of the sweep tests are shown in Fig. 7 where the mean values for each sample are plotted. A frequency sweep of 70 Hz—700 Hz was used for the tests. It is seen that when the RMS-value of the test level drops below some 4 g (g — acceleiation of gravity) the test times become very long. To keep the
Fig. 5. Schematic diagram of the system used to indicate failure.
test times reasonable the RMS test level for the sweep tests should thus preferably be of the order of 4 g or higher. It was decided in the actual testing to use the following test scheme:
1. Two wide band random tests at different vibration levels. 2. A sweep random test utilizing the acceleration gradient concept. 3. A sweep sine test also using the acceleration gradient concept. 4. Two sweep random tests at constant but different acceleration levels. 5. Two sweep sine tests at constant but different acceleration levels.
13
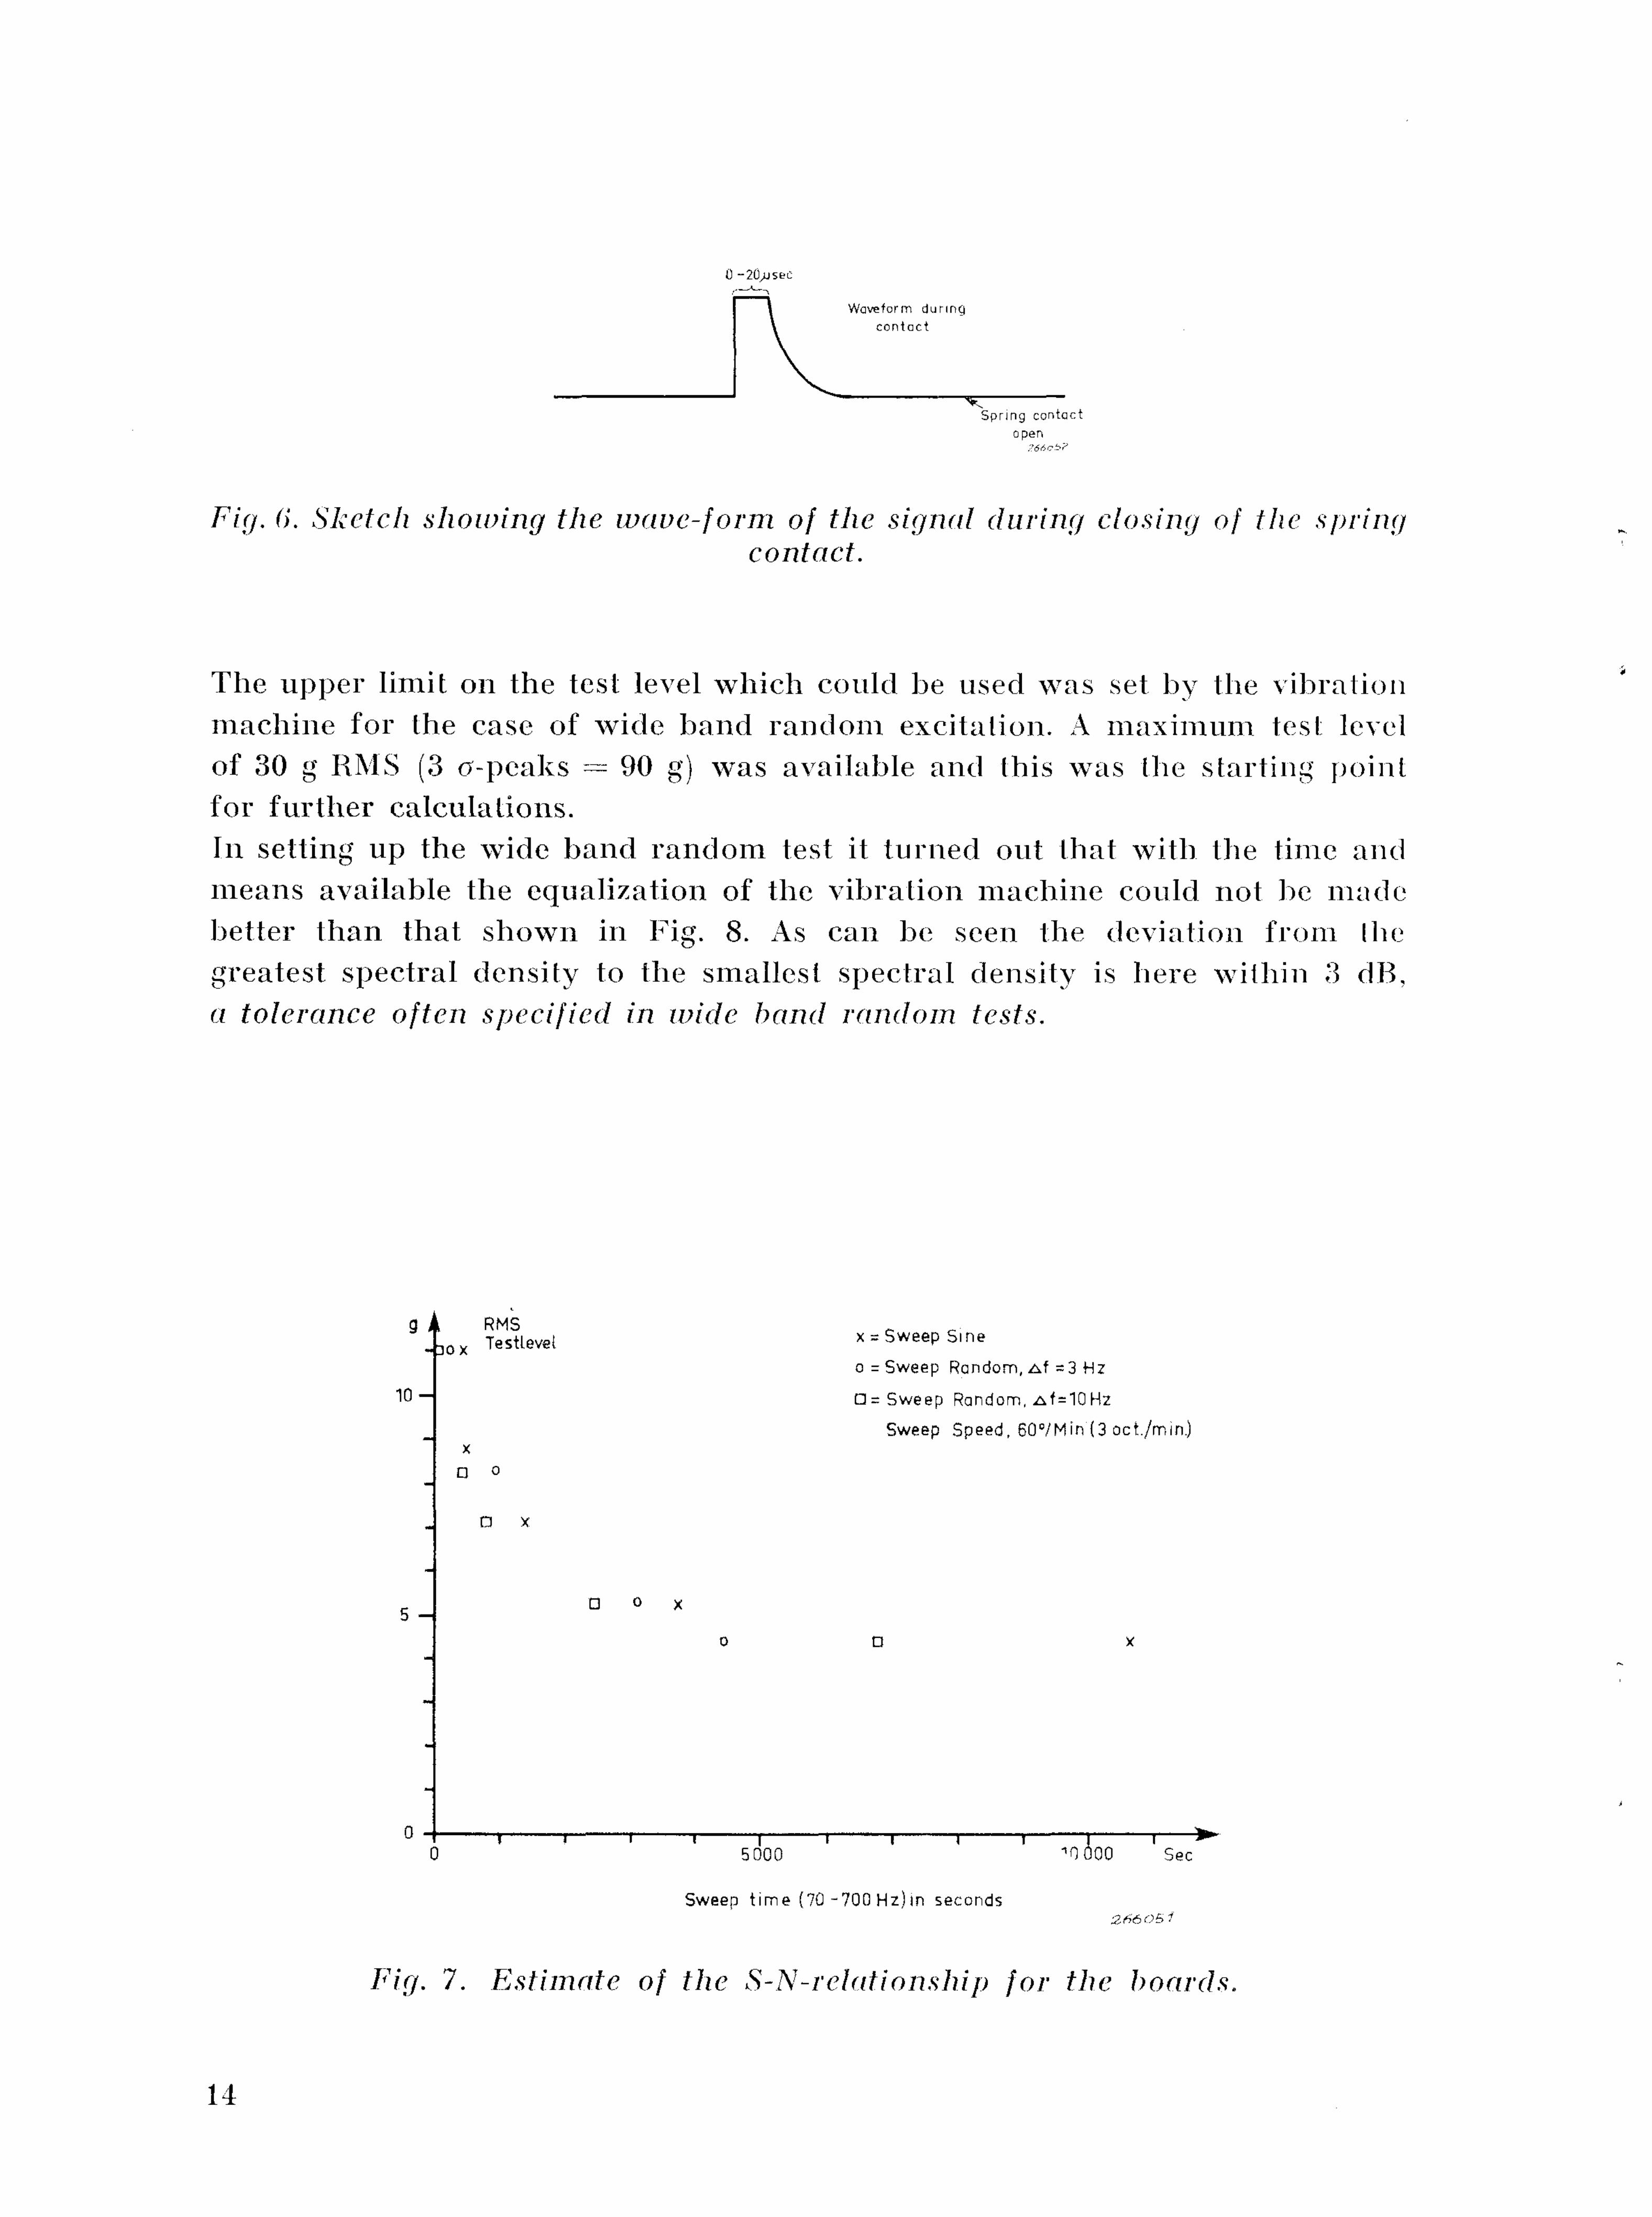
Fig. (i. Sketch showing the wave-form of the signal during closing of the spring contact.
The upper limit on the test level which could be used was set by the vibration machine for the case of wide band r andom excitation. A max imum test level of 30 g RMS (3 tr-pcaks = 90 g) was available and (his was (he start ing point for fur ther calculations. In setting up the wide band r andom test it turned out that with the time and means available the equalization of the vibrat ion machine could not be made better than that shown in Fig. 8. As can be seen the deviation from I he greatest spectral density to the smallest spectral density is here within 3 dB, a tolerance often specified in wide band random tests.
i
Fig. 7. Estimate of the S-N-rclationship for the boards.
14
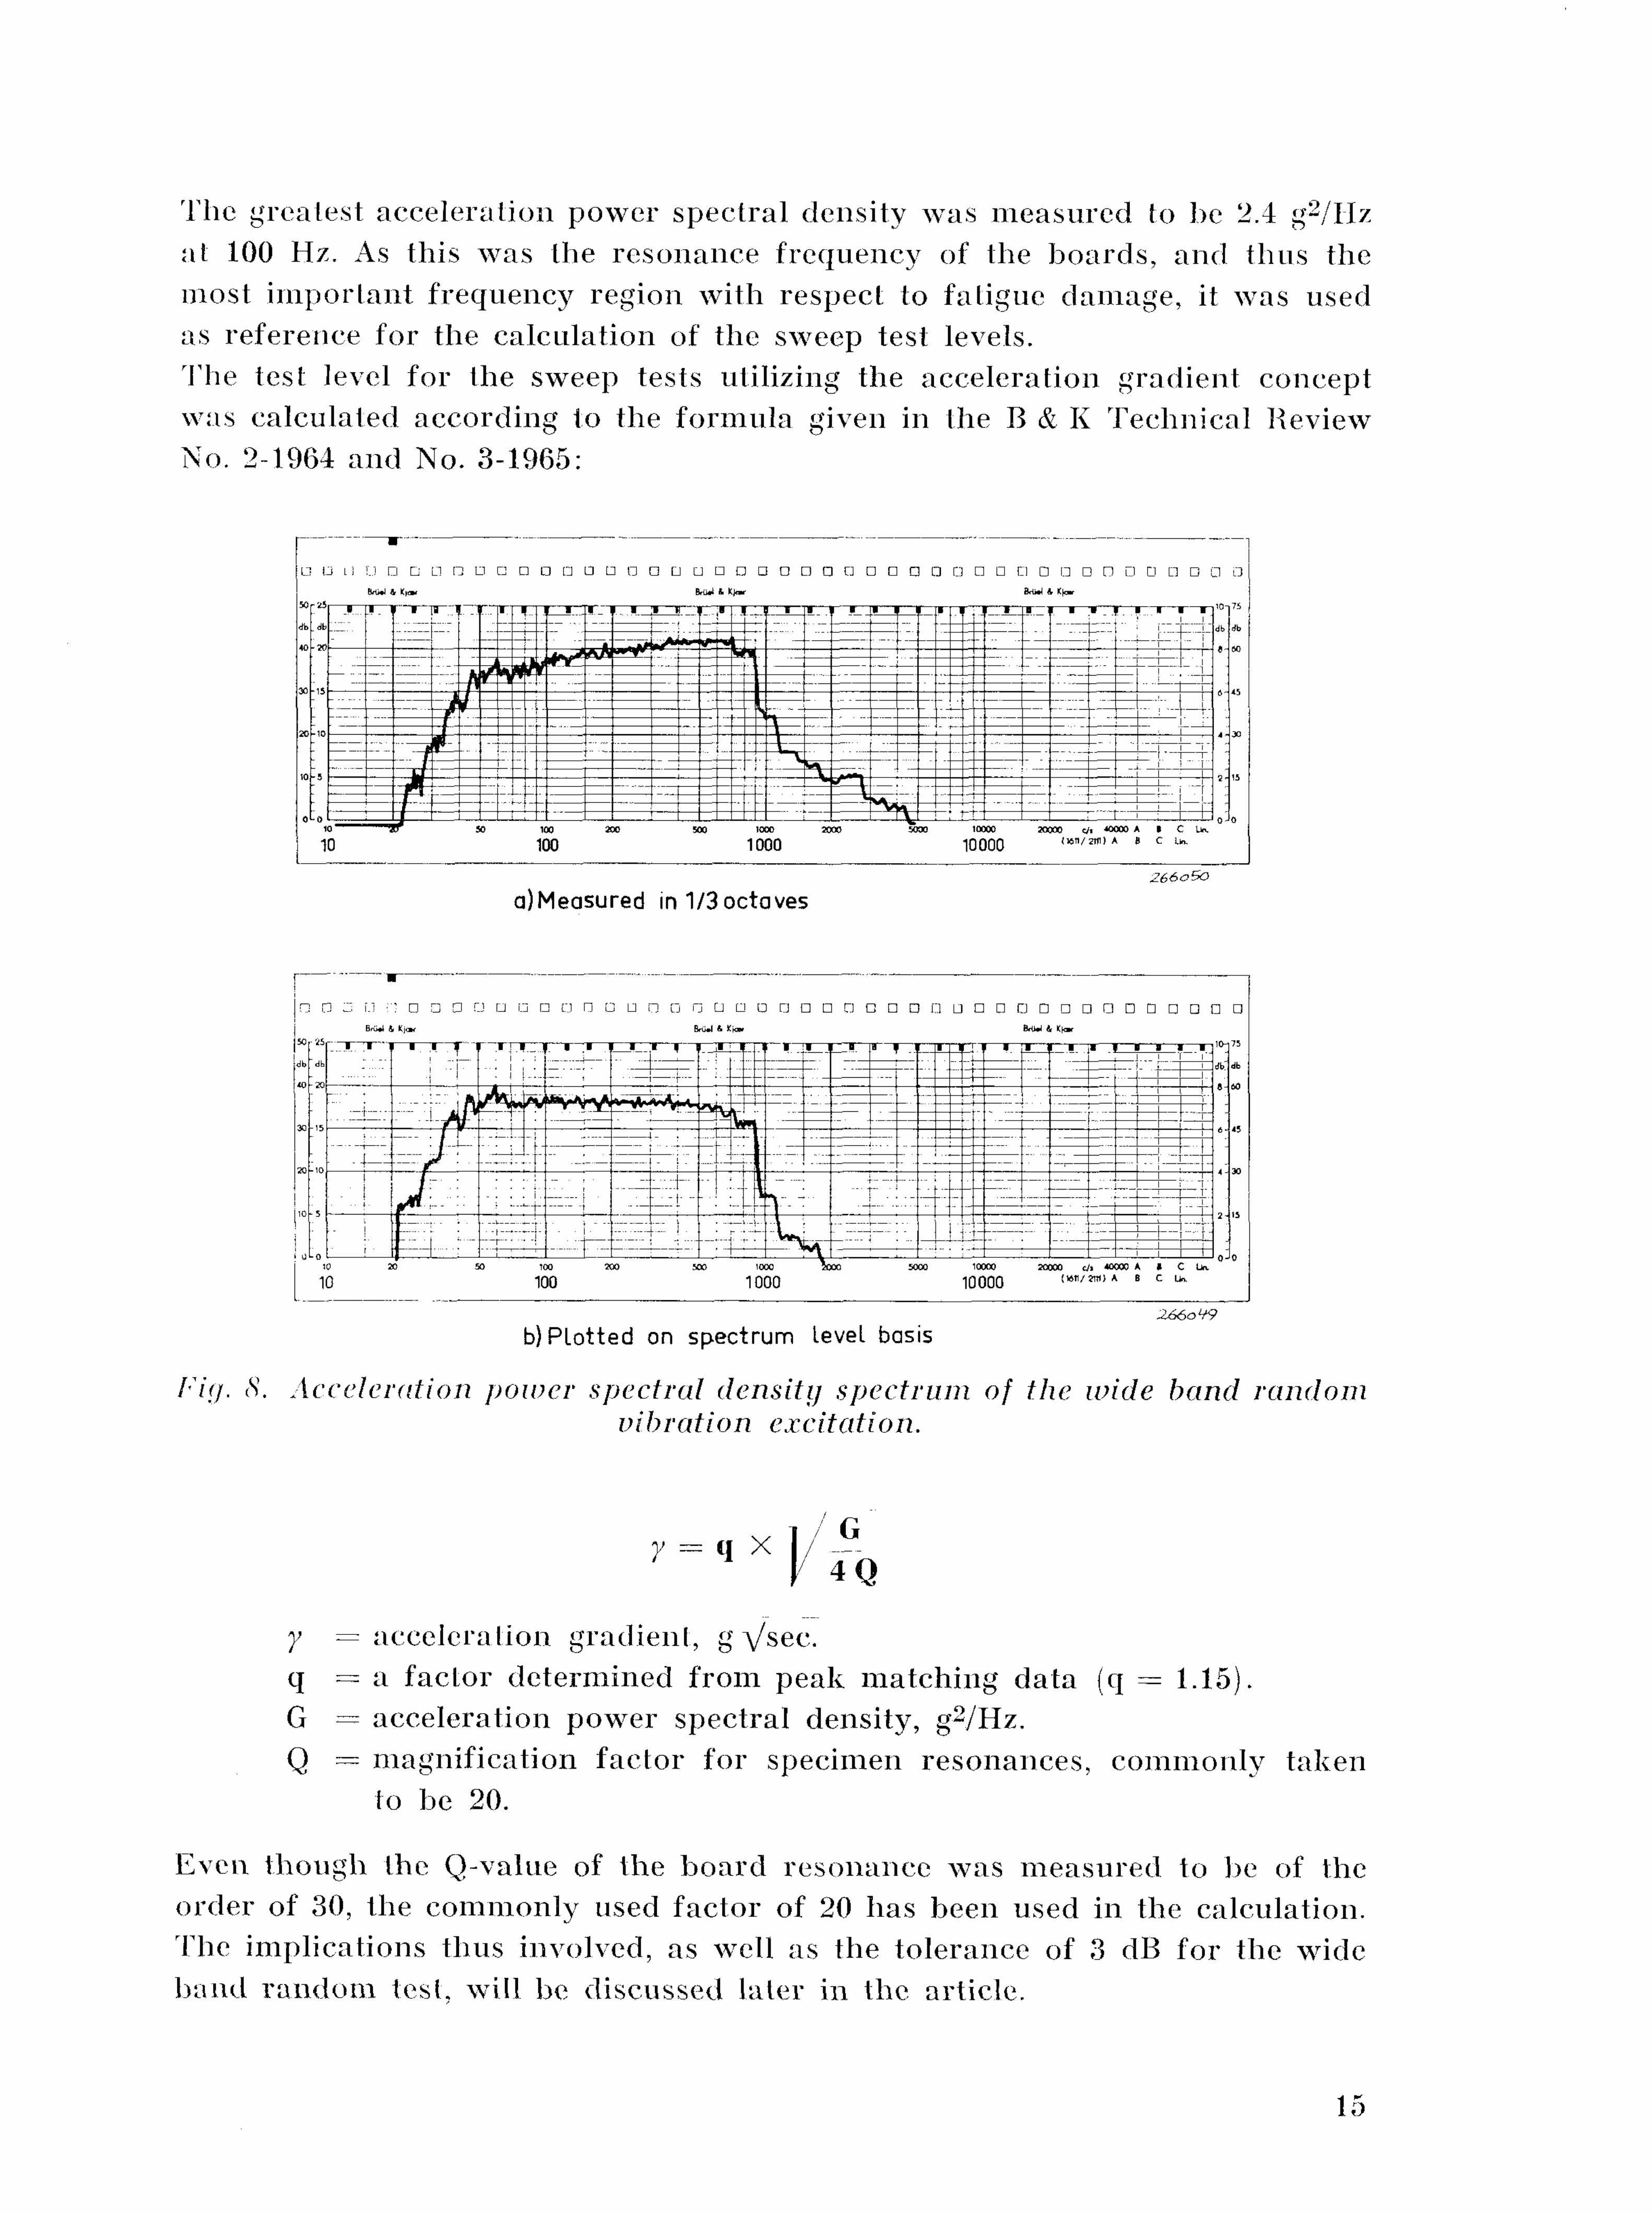
The greatest acceleration power spectral density was measured to be 2.4 g2/Hz at 100 Hz. As this was the resonance frequency of the boards , and thus the most impor tan t frequency region with respect to fatigue damage, it was used as reference for the calculation of the sweep test levels. The test level for the sweep tests utilizing the acceleration gradient concept was calculated according to the formula given in the B & K Technical Review No. 2-1964 and No. 3-1965:
Fig. <S\ Acceleration power spectral density spectrum of the wide band random vibration excitation.
y = q X / ---
y = acceleration gradient, g Vsec. q = a factor determined from peak matching data (q = 1.15). G = acceleration power spectral density, g2/Hz. Q = magnification factor for specimen resonances, commonly taken
to be 20.
Even though the Q-value of the board resonance was measured to be of the order of 30, the commonly used factor of 20 has been used in the calculation. The implications thus involved, as well as the tolerance of 3 dB for the wide band r andom test, will be discussed later in the article.
15
From the above formula the acceleration gradient to be used in the tests is:
y - 1.15 X 1/ 2A- = 1.15 X 1.76 = O.203 \ 80 y = o.2 g V sec.
The corresponding test level for the constant acceleration level tests can be found from a second formula (T.R. 2-1964):
ae = y V 2 7i f
ae = o.2 X V 2 n X 100 = o.2 X 25.1 i.e. a e « 5 g
It is seen that the sweep test levels corresponding to an acceleration power spectral density of 2.4 g2/Hz at 100 Hz are great enough (5 g) to cause the test times to be reasonable.
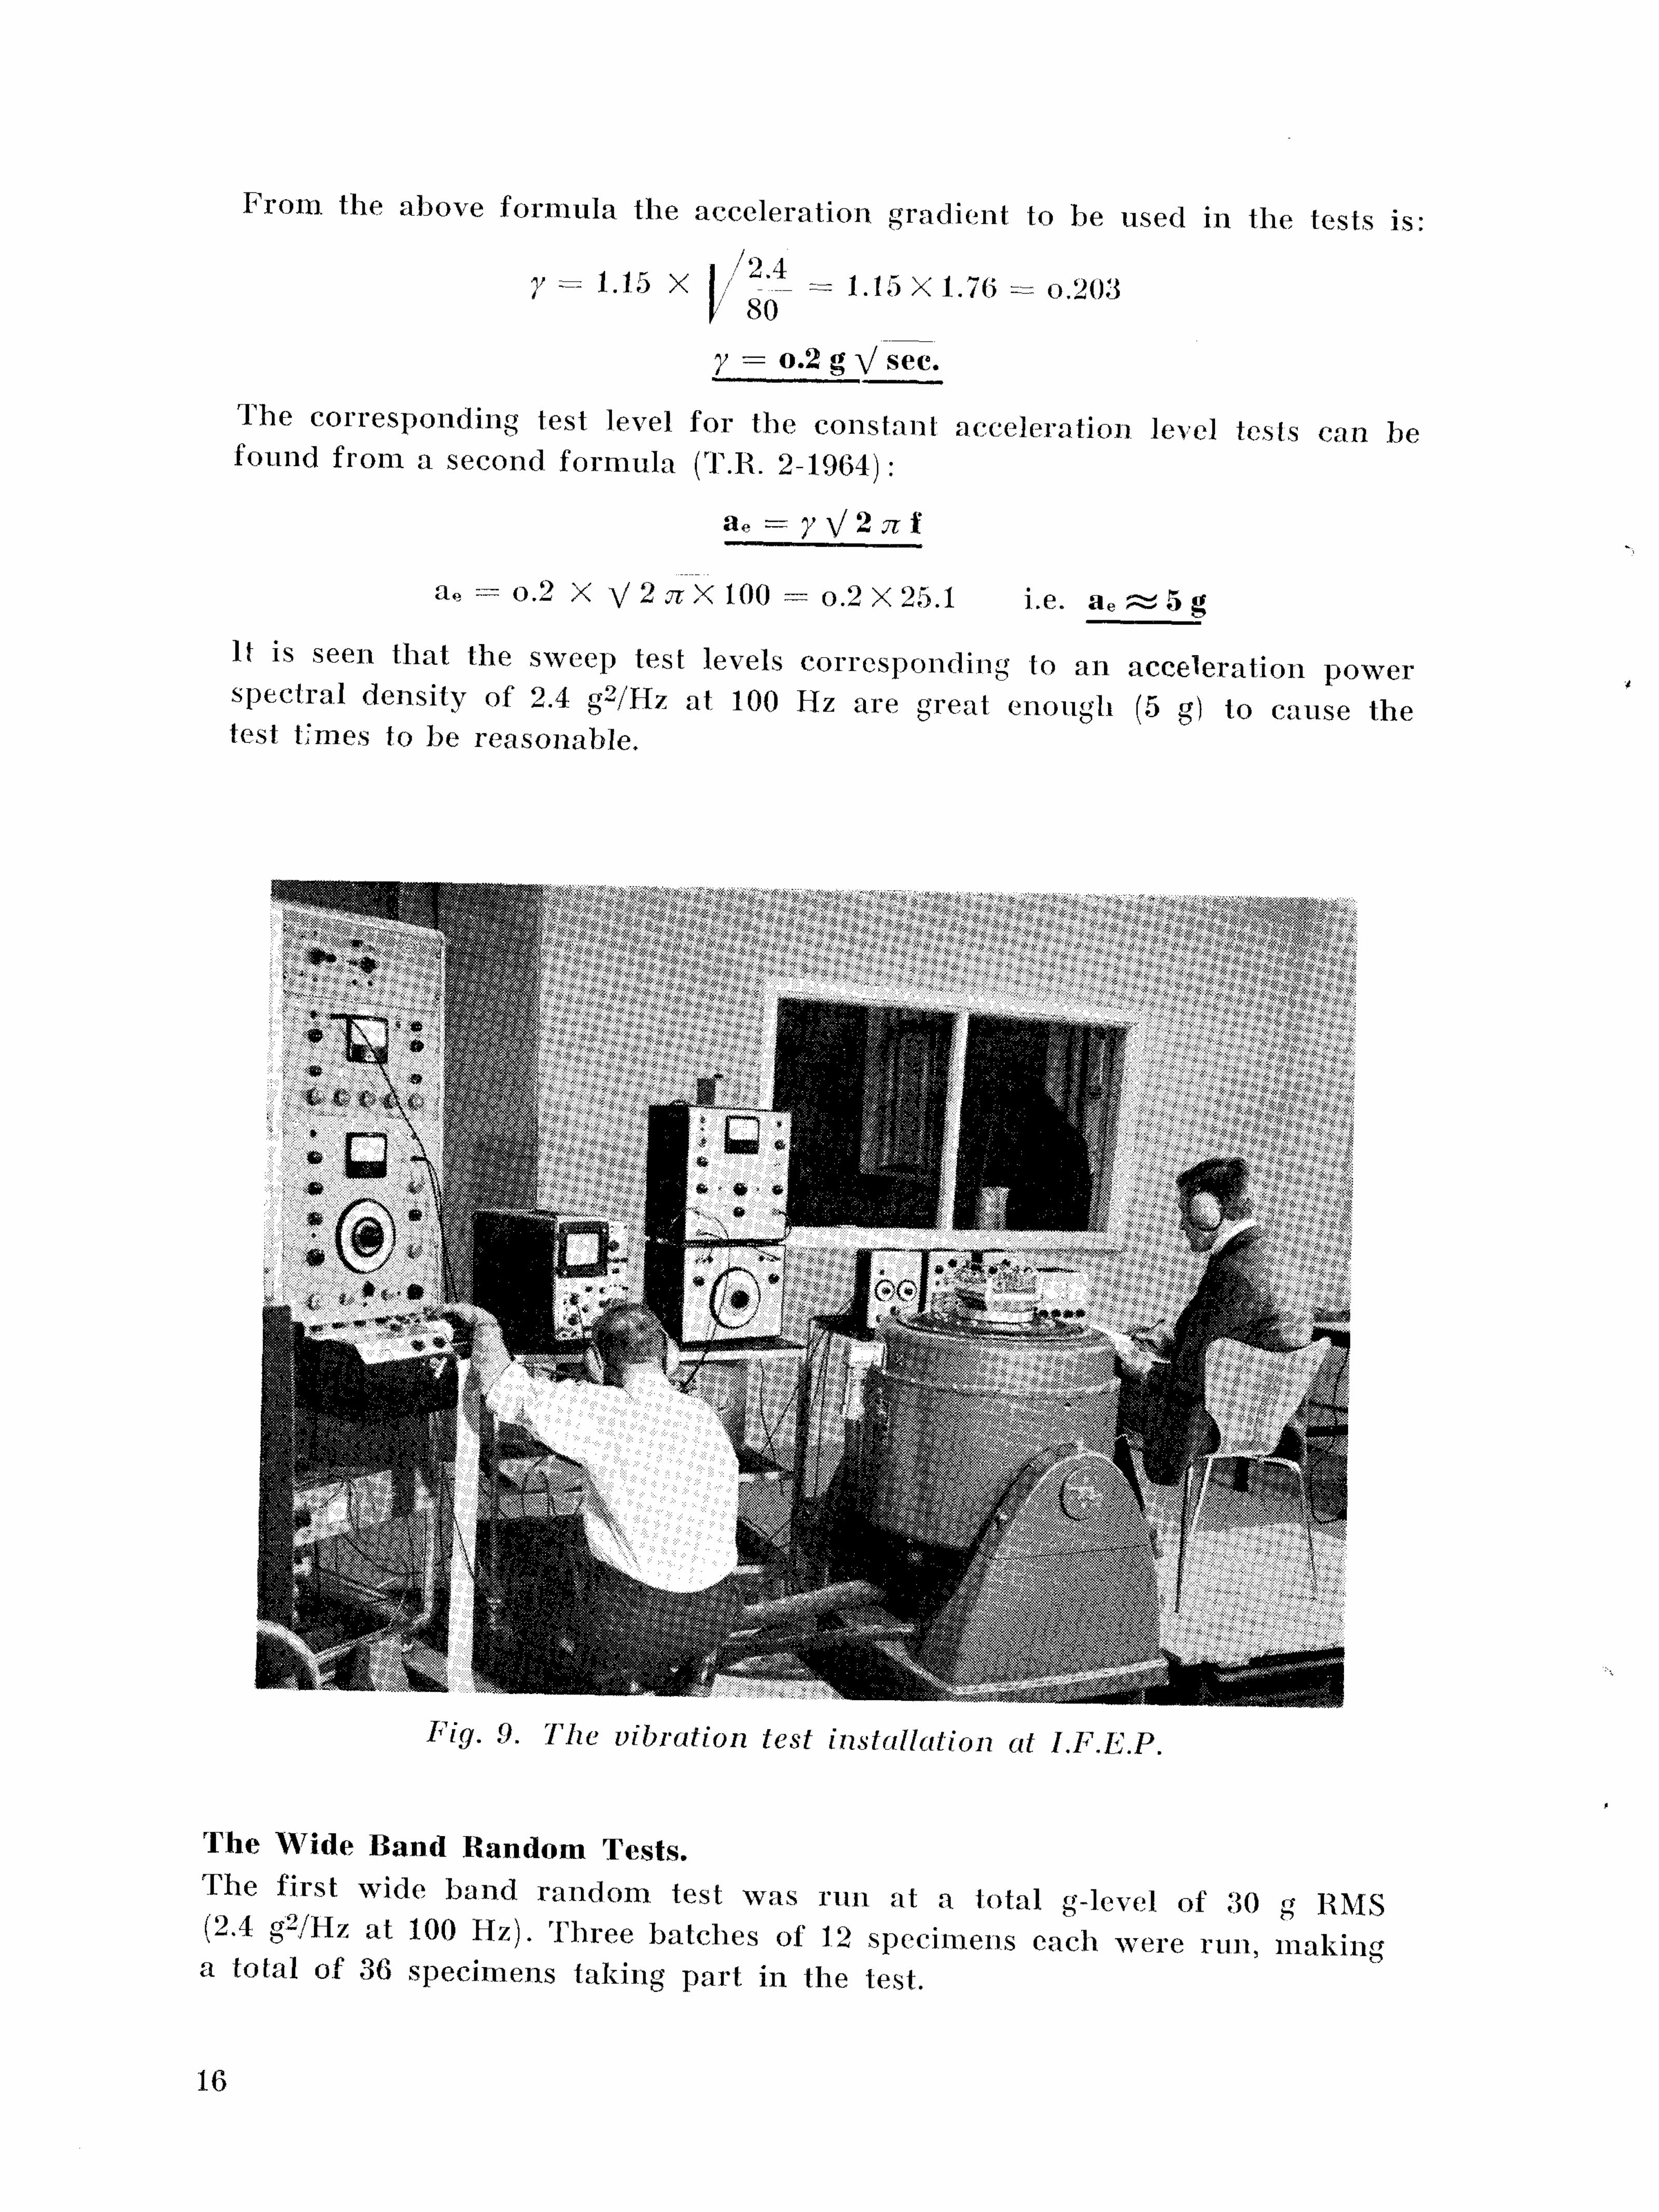
Fig. 9. The vibration test installation at LF.E.P.
The Wide Band Random Tests. The first wide band random test was run at a total g-level of 30 g RMS (2.4 g2/Hz at 100 Hz). Three batches of 12 specimens each were run, making a total of 36 specimens taking part in the test.
16
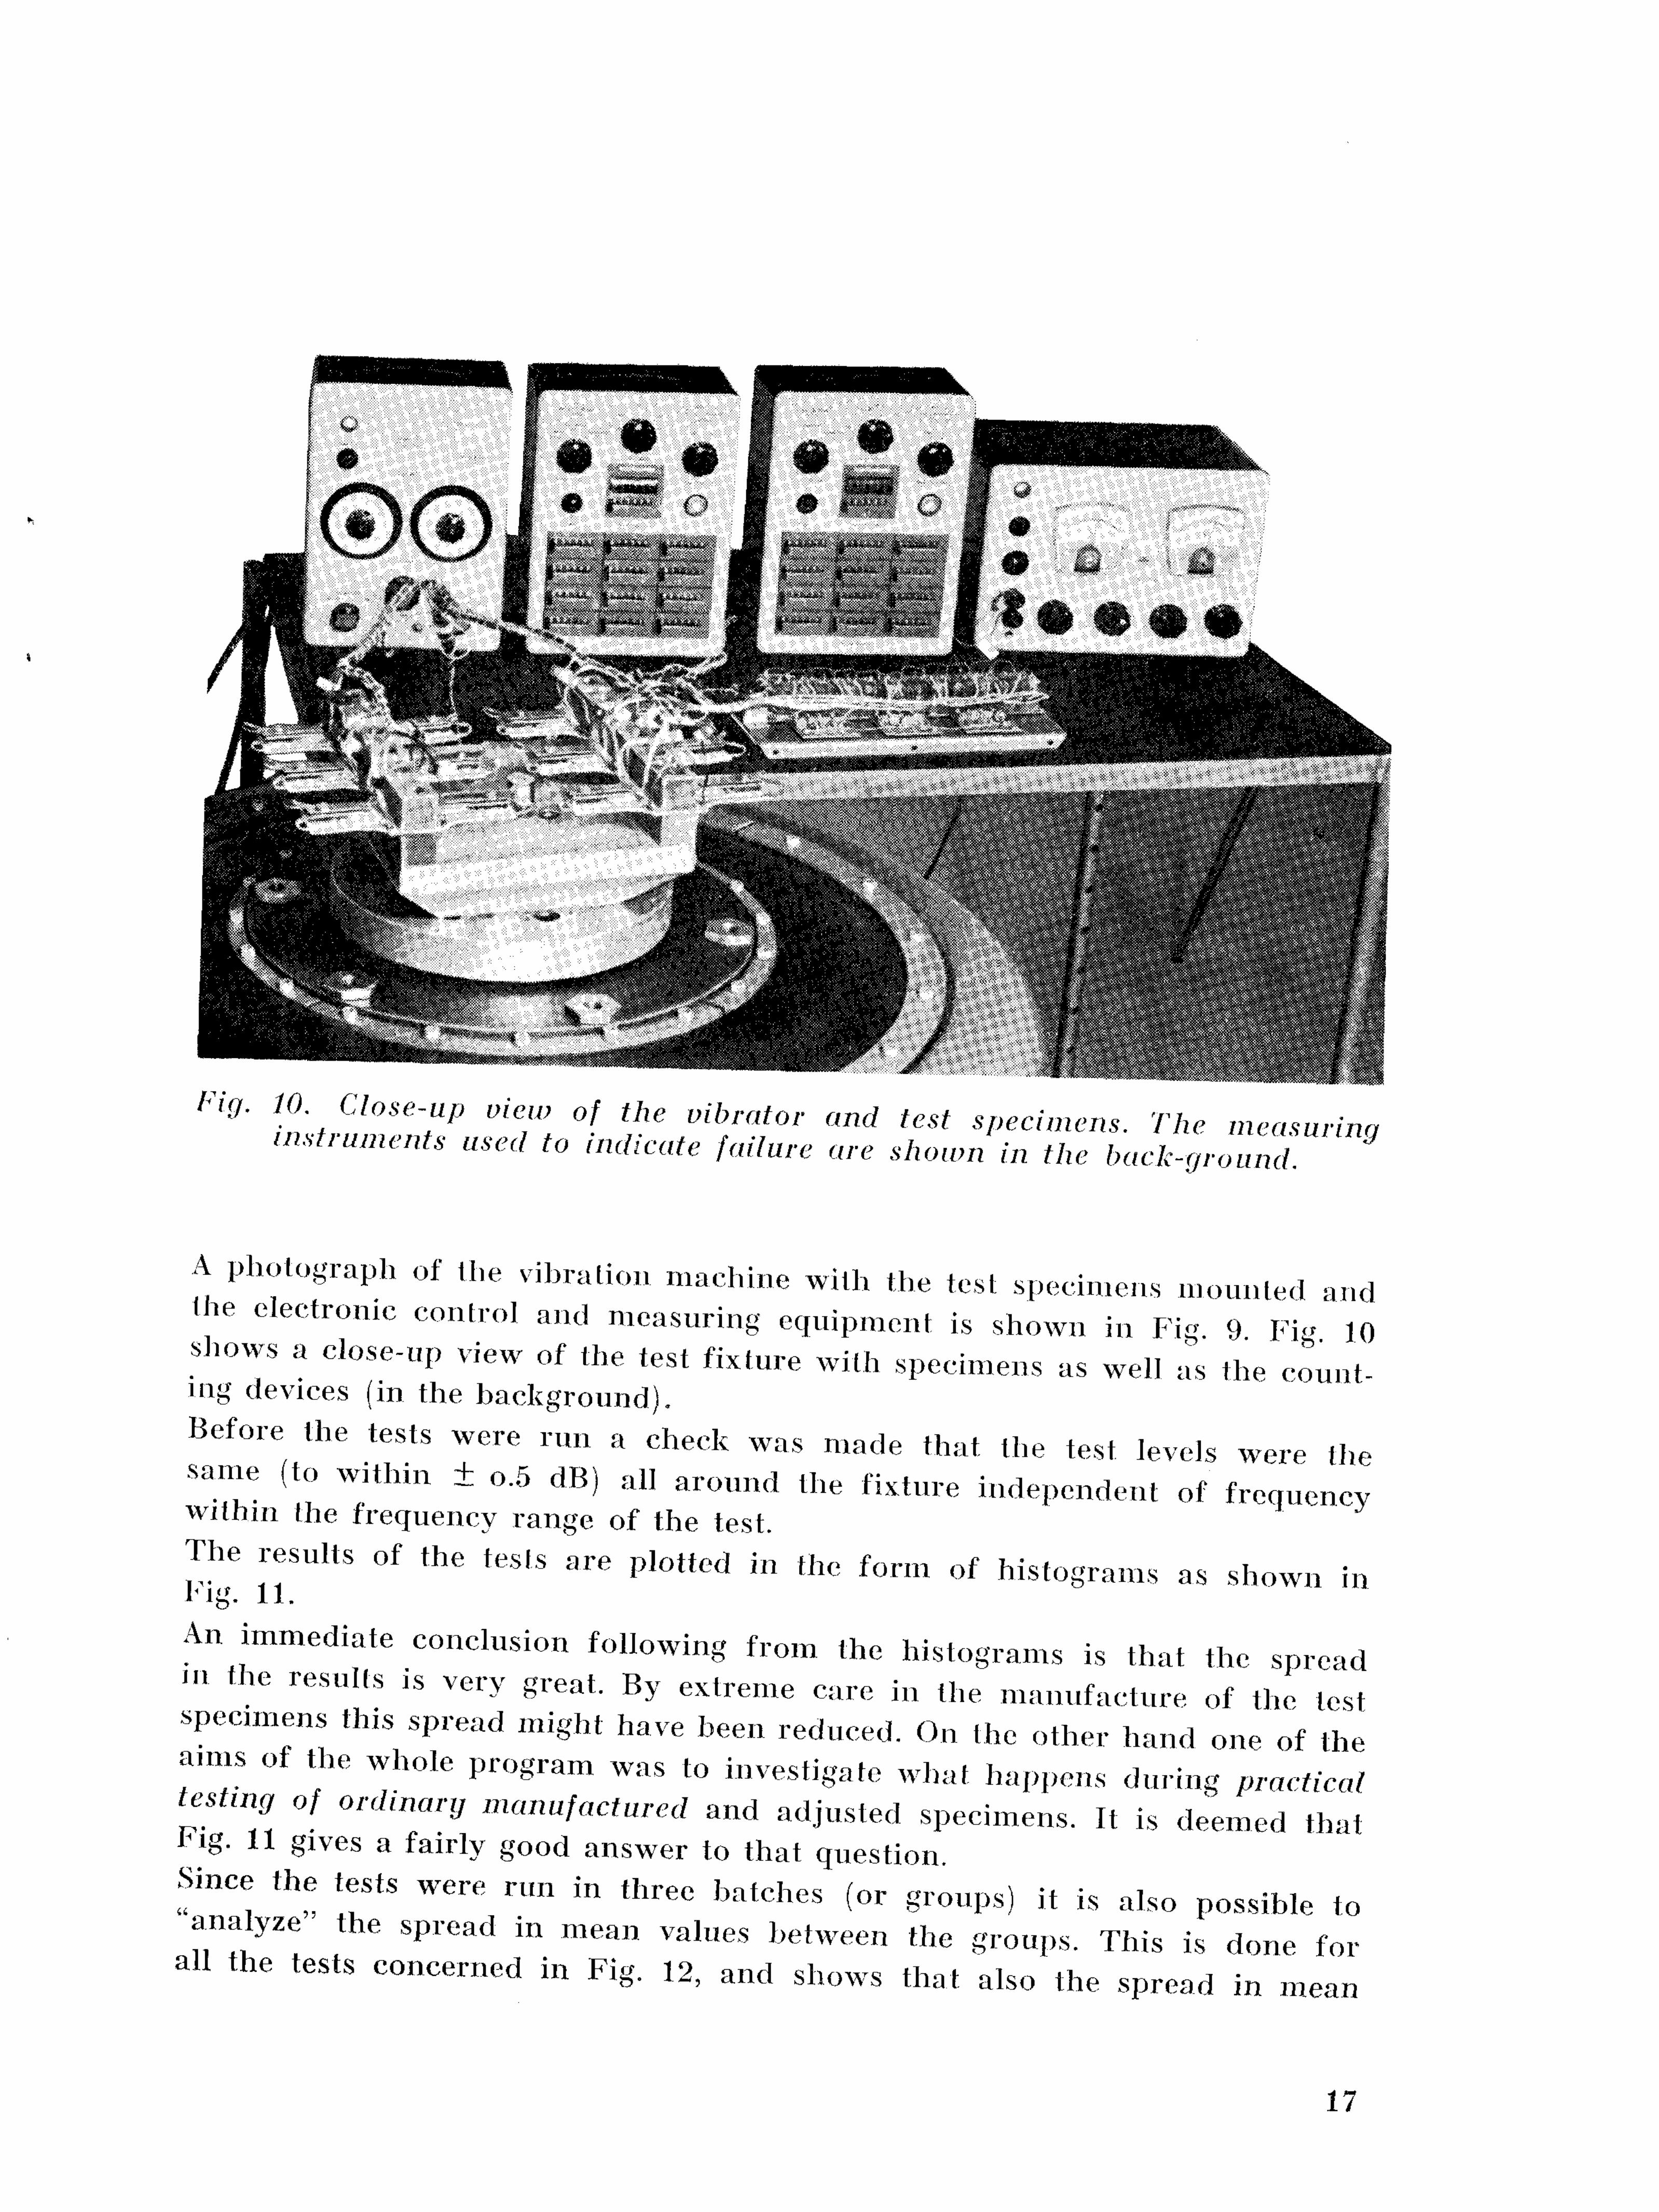
Fig. 10 Close-up view of the vibrator and test specimens. The meamrina instruments used to indicate failure are shown in the back-ground S
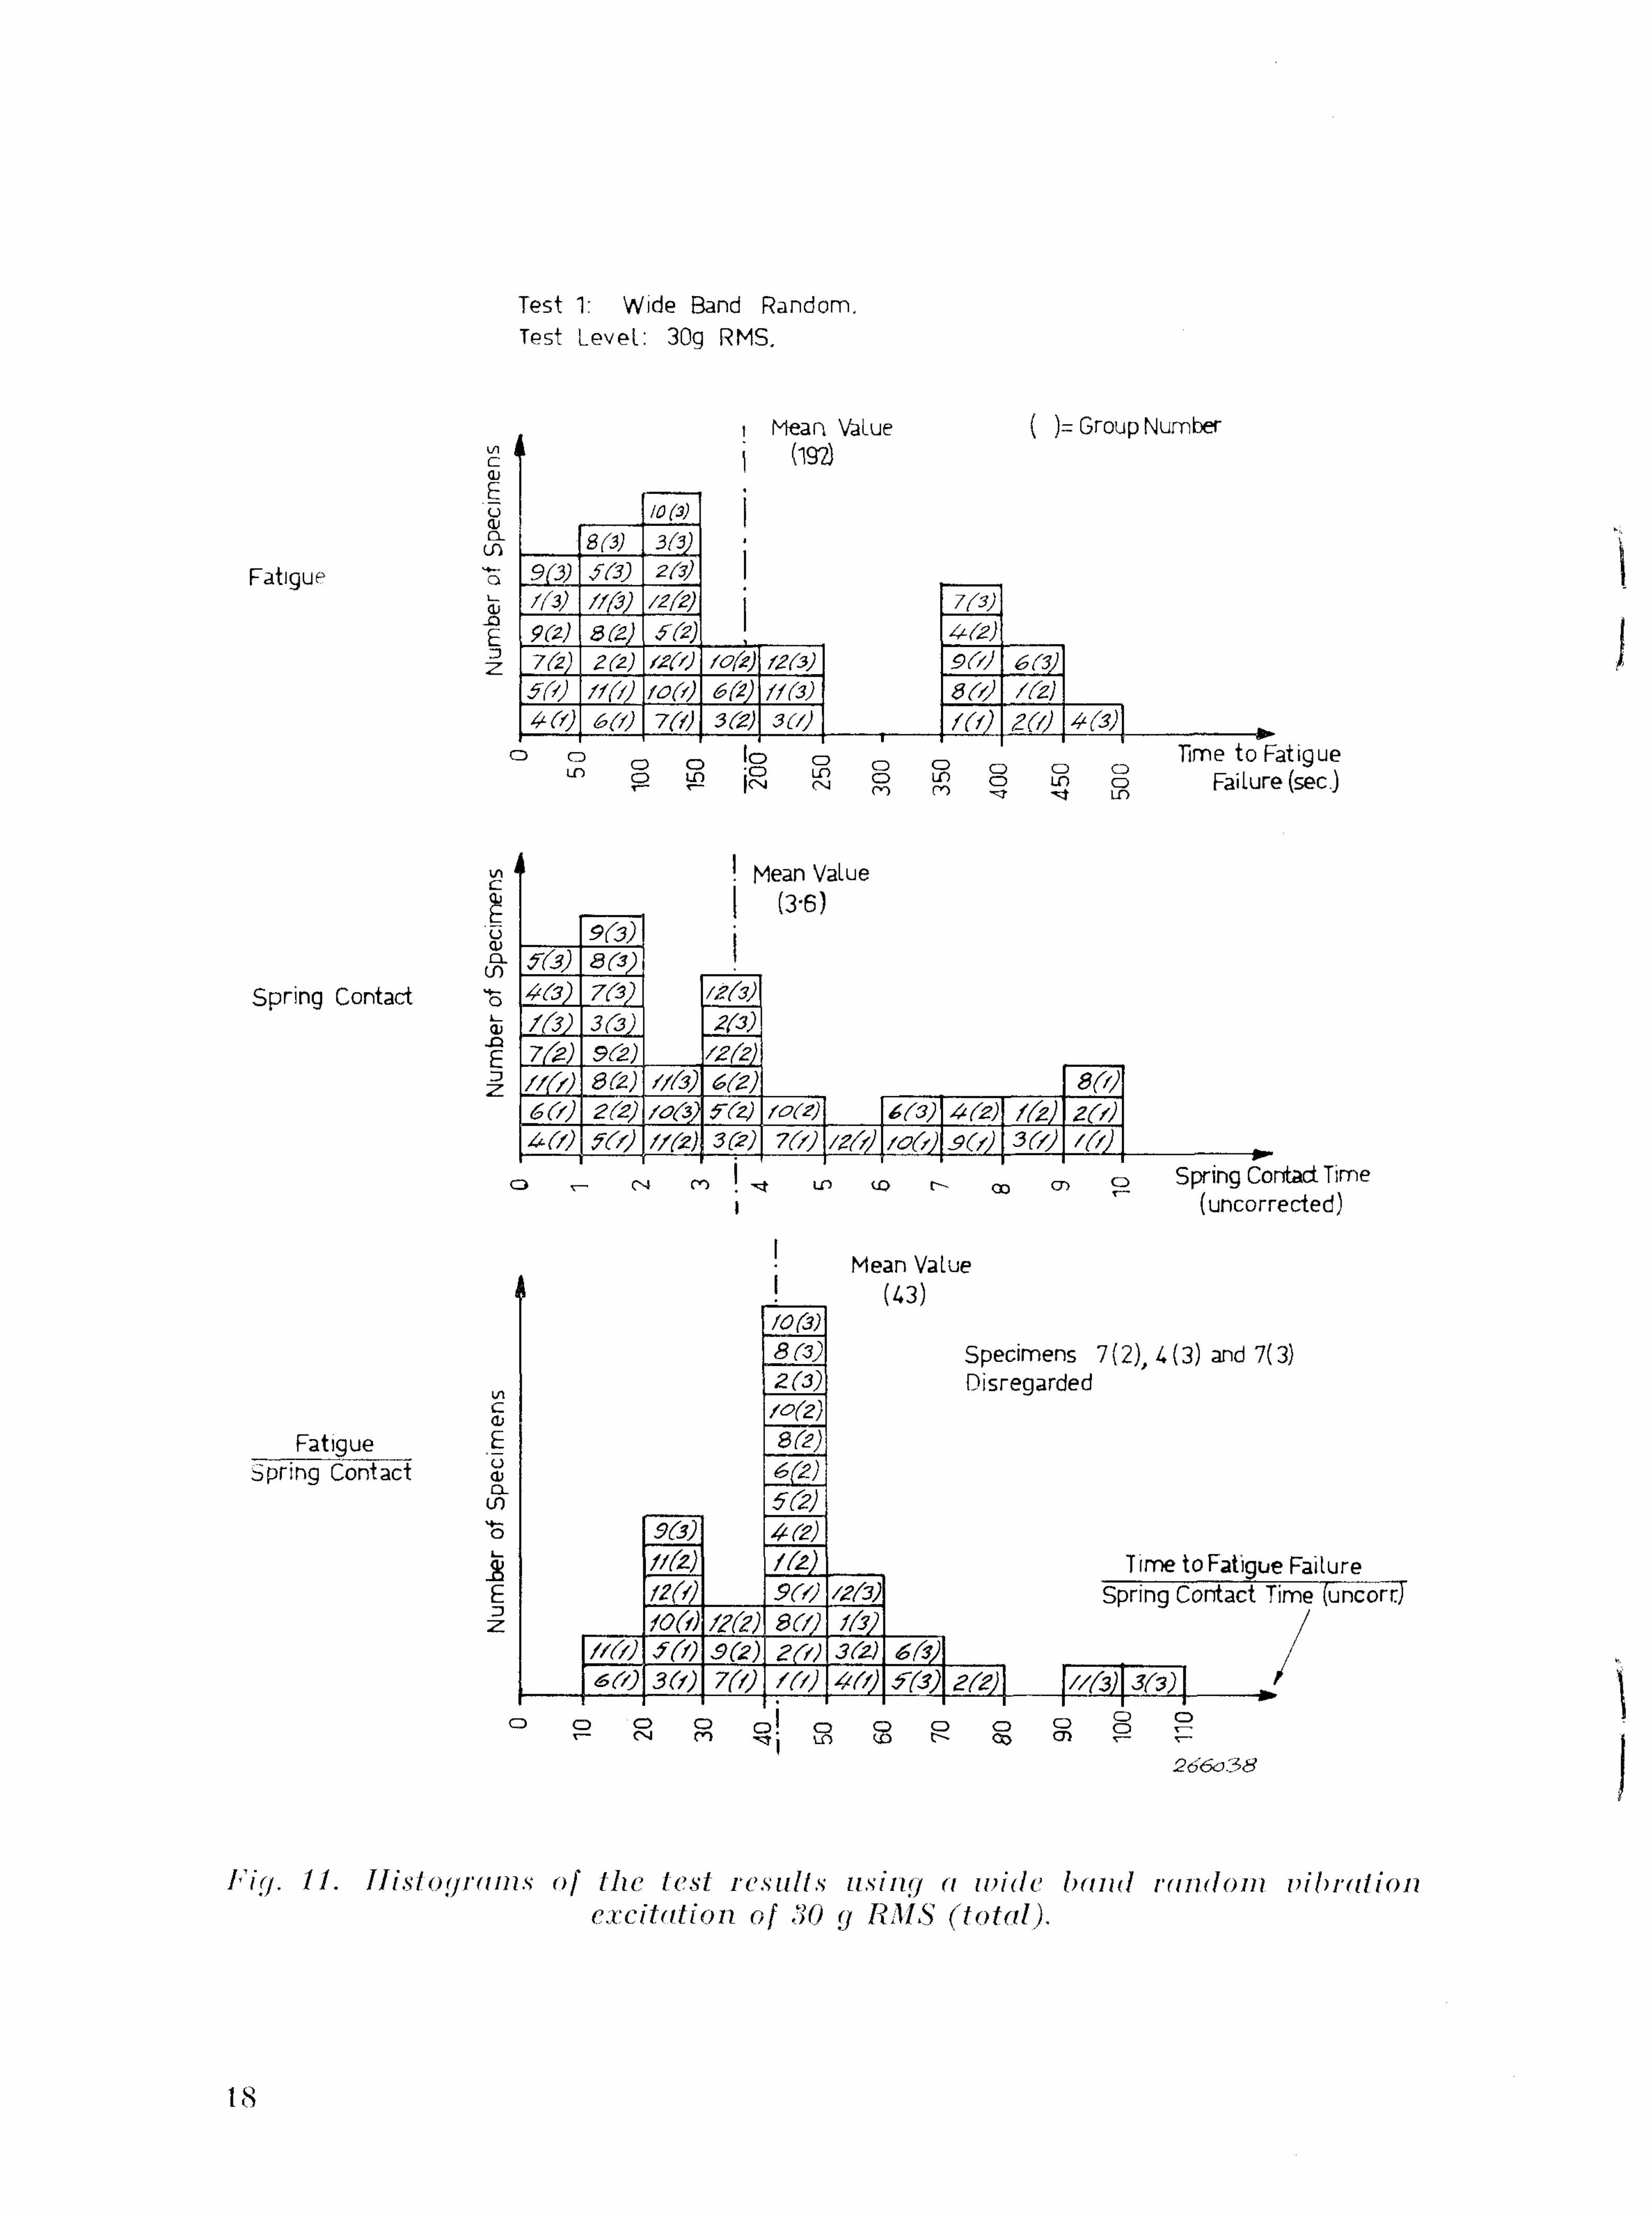
A photograph of the vibration machine with the test specimens mounted and the electronic control and measuring equipment is shown in Fig 9 Fi« 10 shows a close-up view of the test fixture with specimens as well as the counting devices (in the background) . Before the tests were run a check was made that the test levels were the same (to within ± o.5 dB) all a round the fixture independent of frequency within the frequency range of the test. The results of the tests are plotted in the form of histograms as shown in i l j - j . 1 1 .
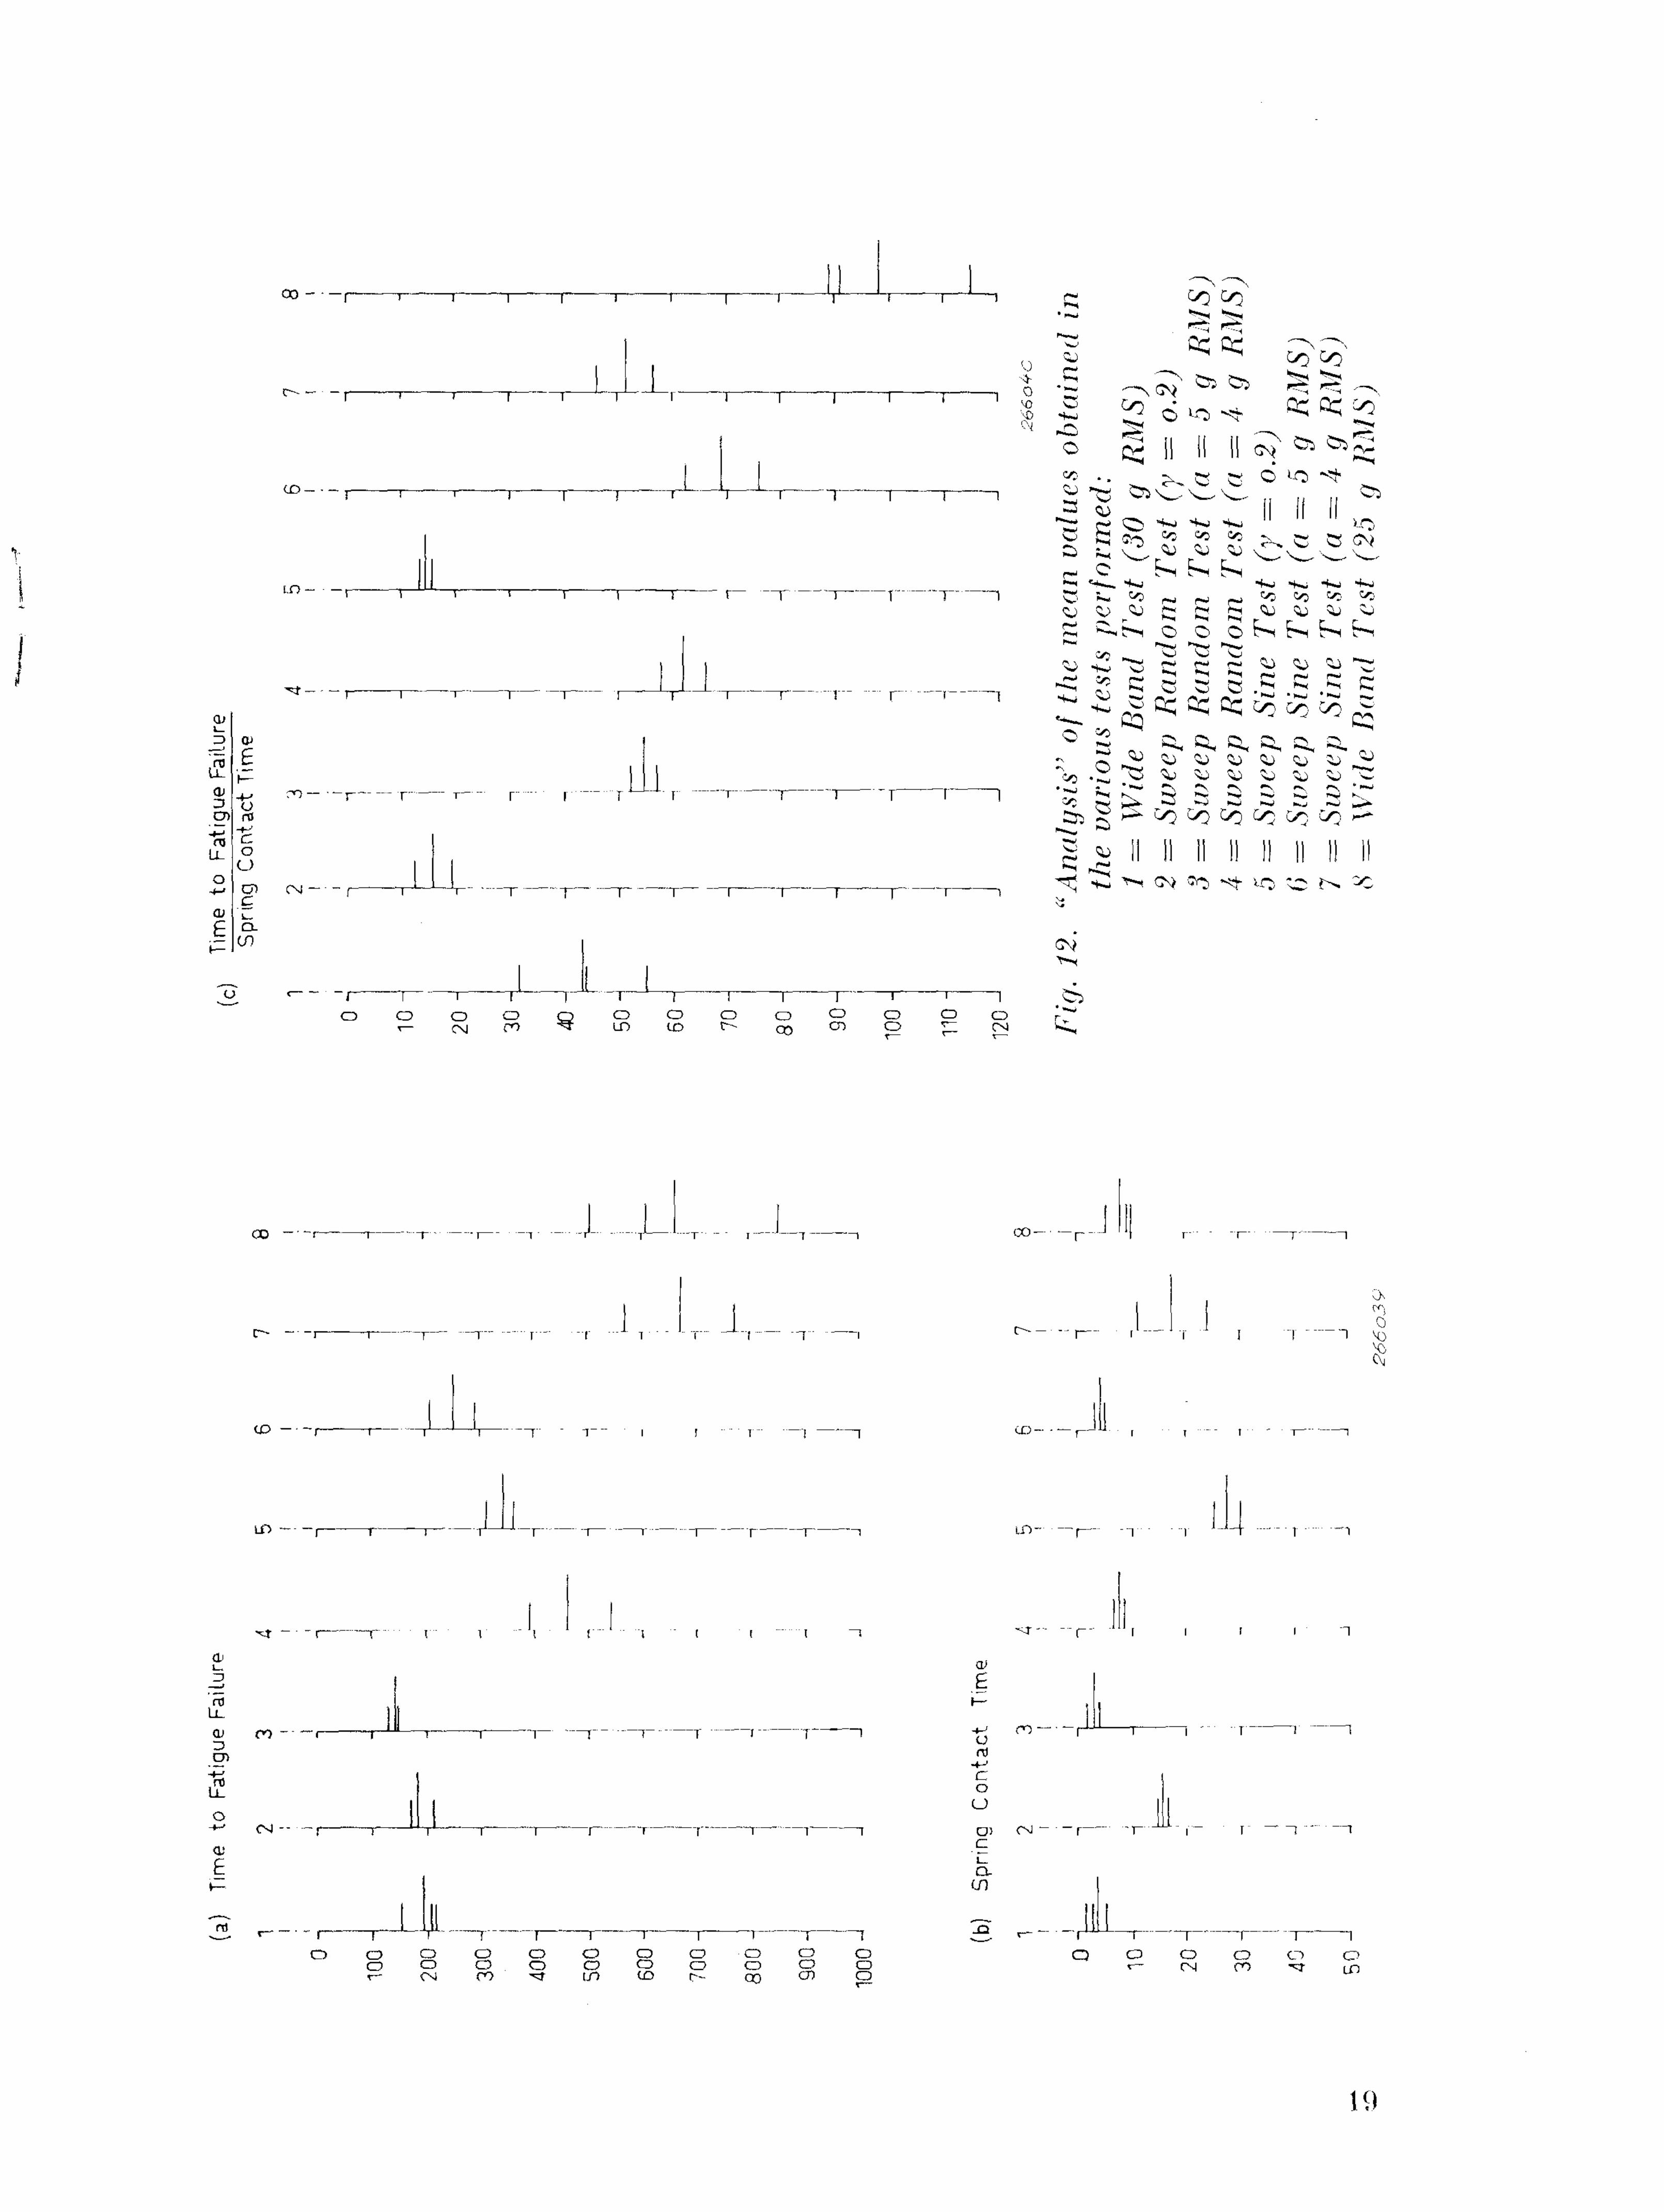
An immediate conclusion following from the histograms is that the spread "1 the results is very great. By extreme care in the manufacture of the test specimens this spread might have been reduced. On the other hand one of the aims of the whole program was to investigate what happens during practical testing of ordmary manufactured and adjusted specimens. It is deemed that l-ig. 11 gives a fairly good answer to that question Since the tests were run in three batches (or groups) it is also possible to analyze the spread in mean values between the groups. This is done for
all the tests concerned in Fig. 12, and shows that also the spread in mean
17
b
i;
\
fVry. / / . Histograms of the test results using a wide bond random vibration excitation of 30 g RMS (total).
18
19
w ^ ^ Co Co
5 ^ 6 io ̂ ^ ̂ ̂ o ^ II IMI cv ^ ̂ §
■^ ^ ( ^ *o i . 4s. ' i o
n- O ^ ^H ^
d ^ ^ © © o f^ ̂ ^ K ^ r ^ - ^ ^ h ^
^ ^ ^ ^ ^ * _
° ;£ ^ ^ ^ ^ ^ £•. ^ • ^ ^ ^ ^ ^ ^ ^ ^ ^
^ T * -< ^ - > * >-*. * * * ^ ^ i*V ^ '-C ?v w ^ O «-^ ^ ^ * ^ ^ ^ . i *
^g^cococococo^' -2 *> II II II II II II II II
I T " * > *
2660^-/
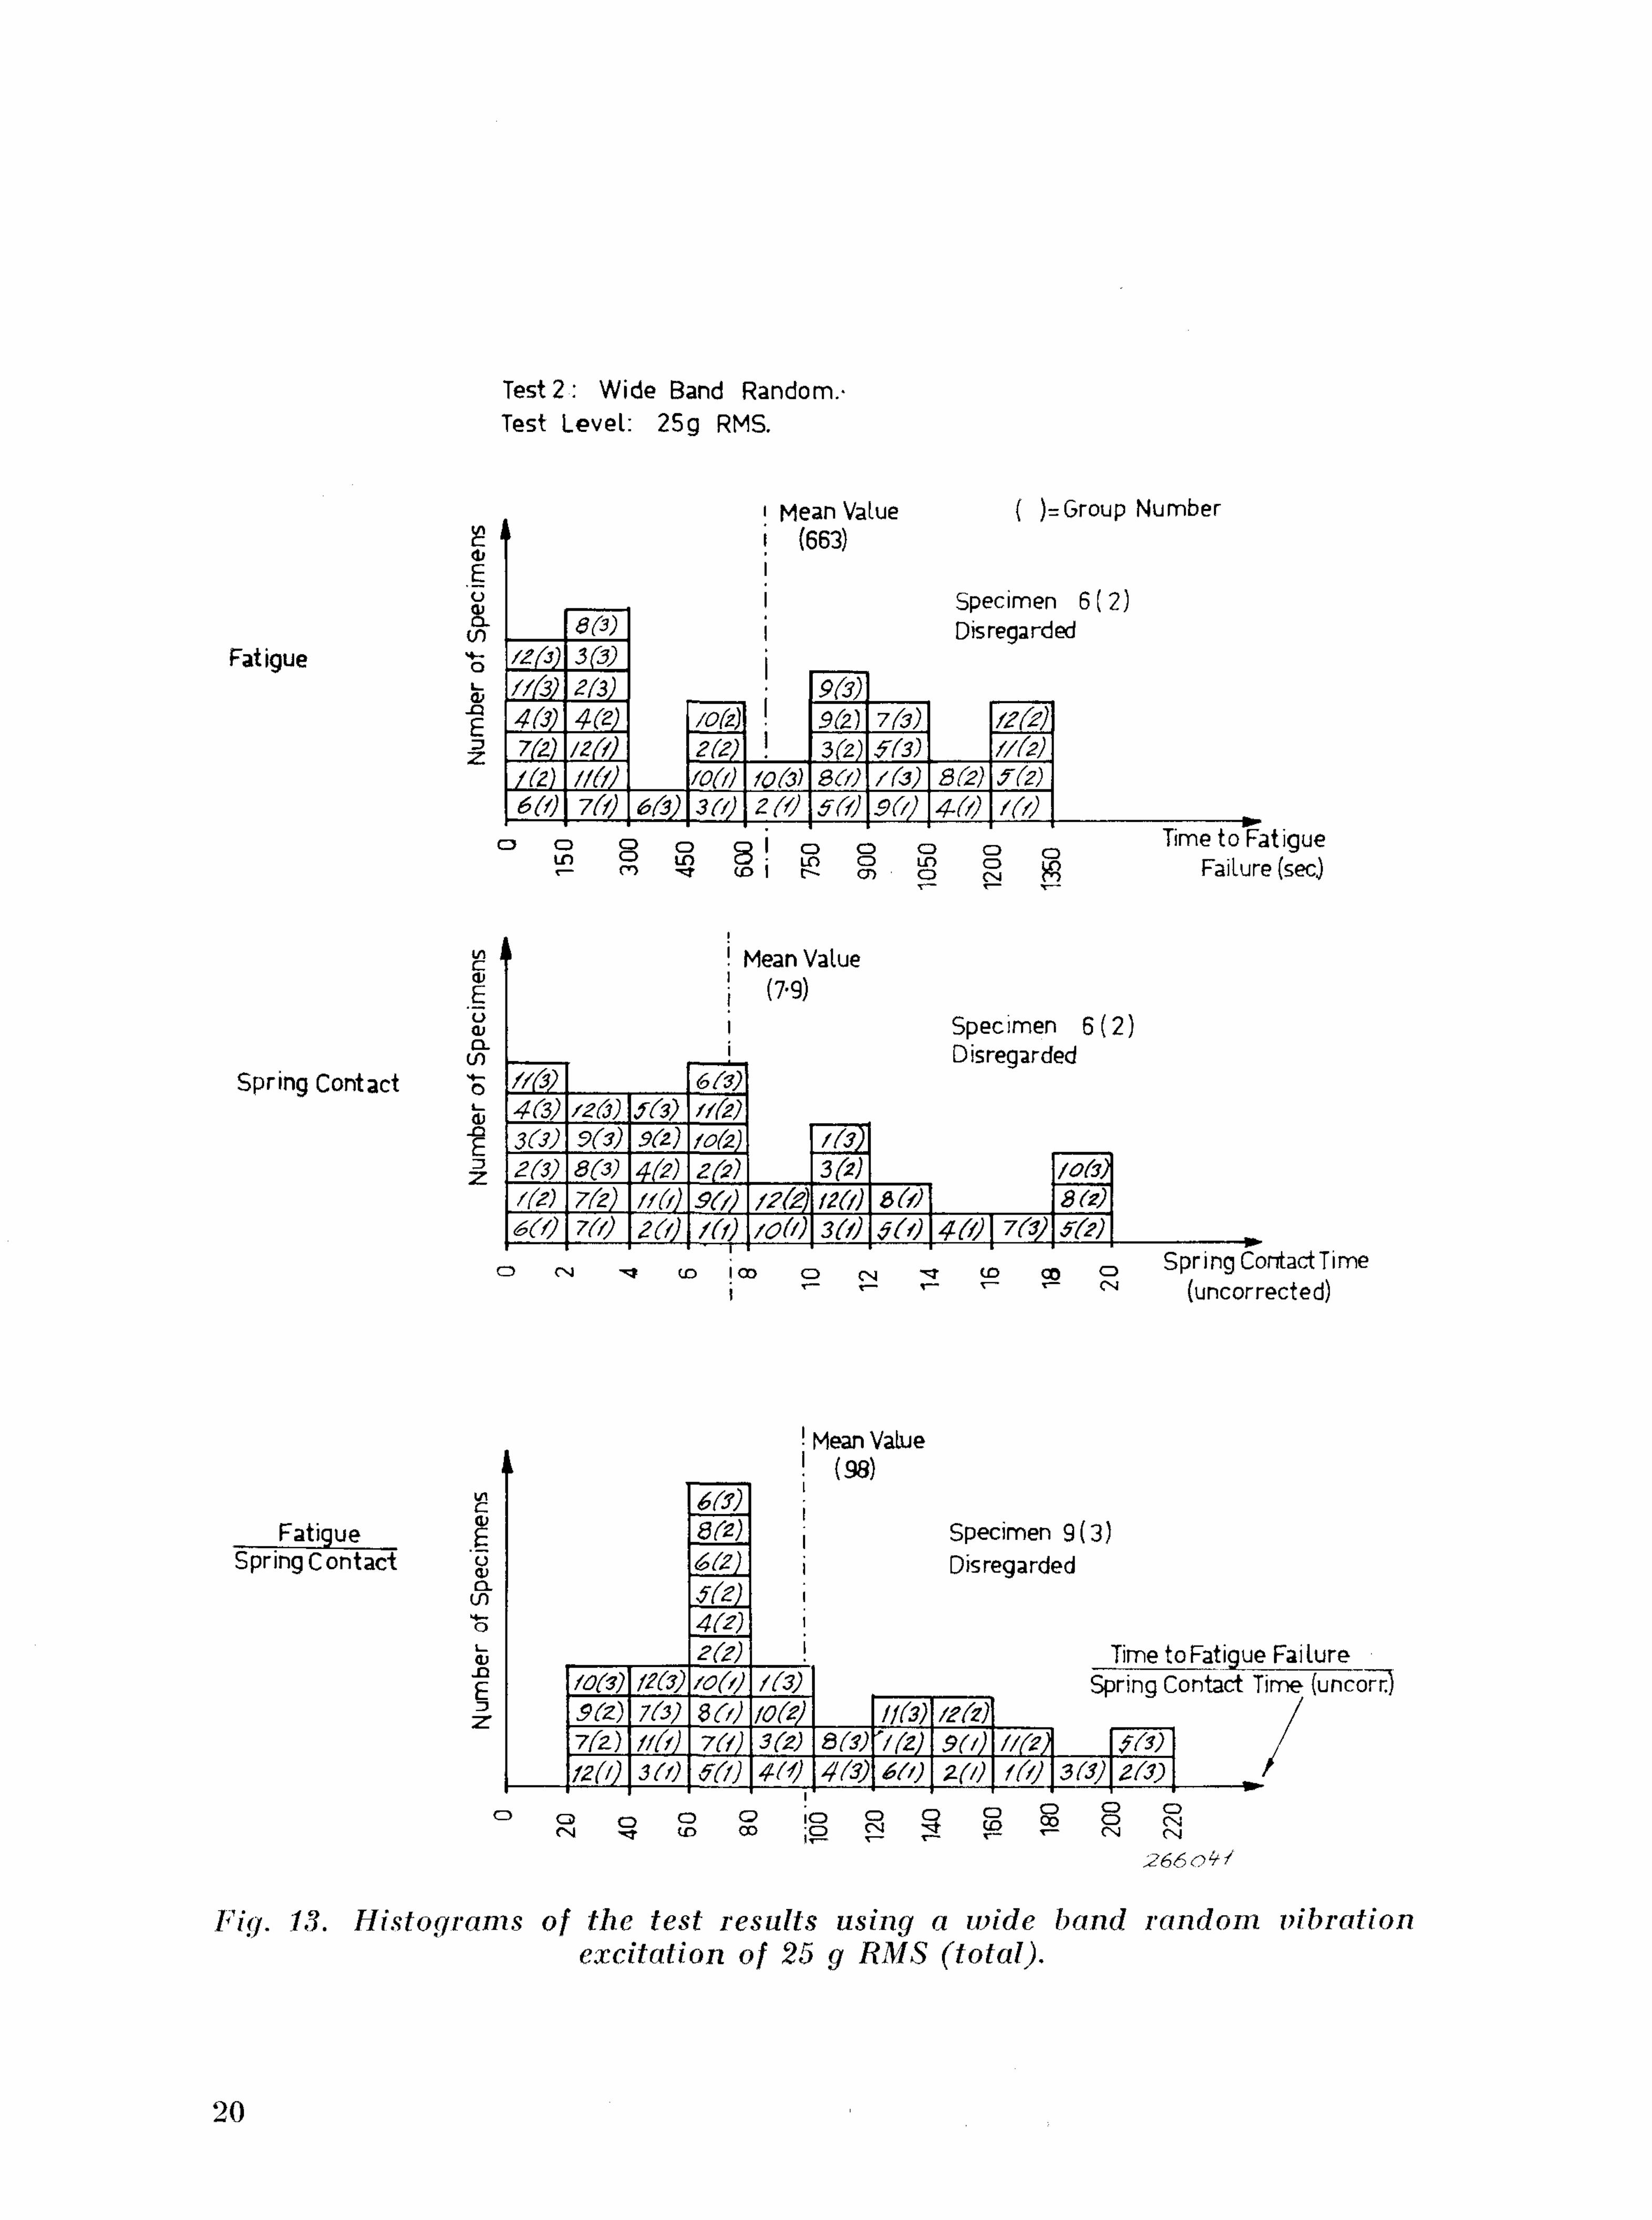
Fig. 13. Histograms of the test results using a wide band random vibration excitation of 25 g RMS (total).
20
values were quite considerable. This could, of course, have been reduced by increasing the sample size. On the other hand, since the underlying distr ibutions are not known the amount of data necessary to make a thorough statistical analysis would require sample sizes far beyond the means available for the tests. No further attempt of "analysis" has thus been made. To obtain a rough picture of the influence of test level upon the results a second set of wide band random tests were run at a total test level of 25 g RMS. The acceleration power spectral density at 100 Hz was here measured to be 1.6 g2/Hz. A set of histograms for this test is shown in Fig. 13. Also here the spread is very great and even though the difference in test level was only of the order of 1.5 dB the fatigue lives and spring contact times changed by more than 100 %. This, of course, is not unexpected but it emphasizes the great sensitivity of the test to test level inaccuracies.
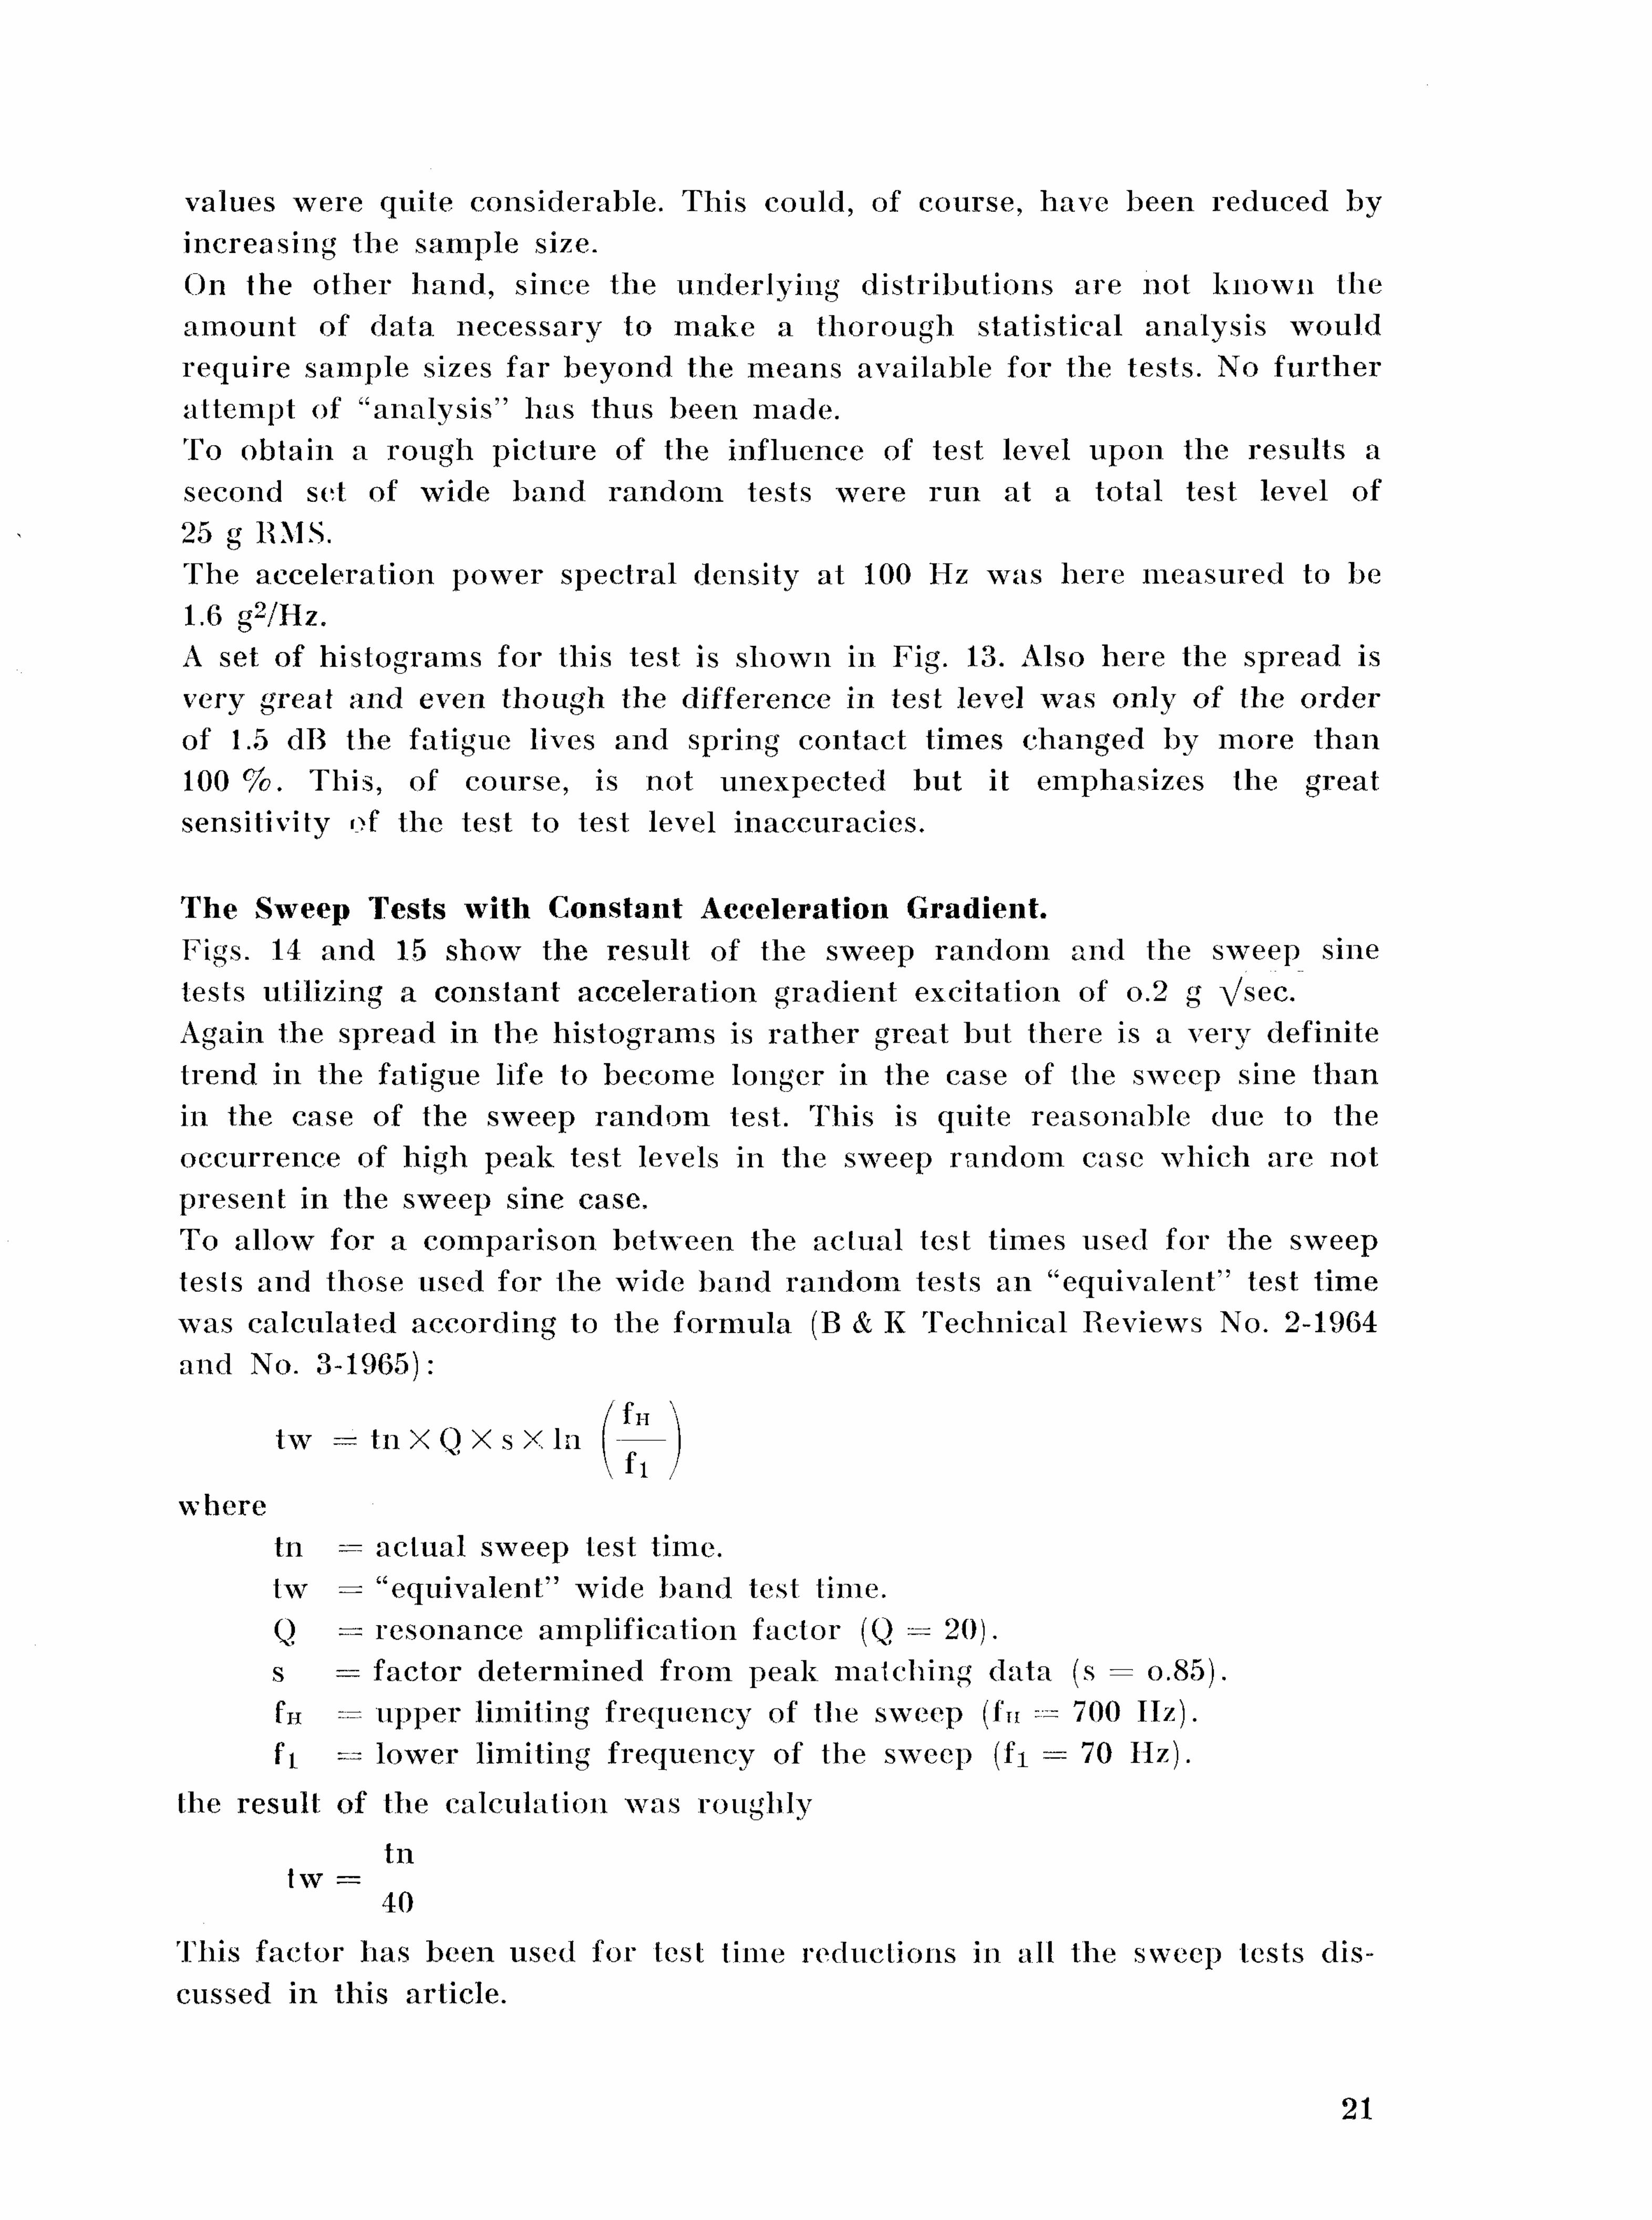
The Sweep Tests with Constant Acceleration Gradient. Figs. 14 and 15 show the result of the sweep random and the sweep sine tests utilizing a constant acceleration gradient excitation of o.2 g Vsec. Again the spread in the histograms is ra ther great but there is a very definite trend in the fatigue life to become longer in the case of the sweep sine than in the case of the sweep random test. This is quite reasonable due to the occurrence of high peak test levels in the sweep random case which are not present in the sweep sine case, To allow for a comparison between the actual test times used for the sweep tests and those used for the wide band random tests an "equivalent" test time was calculated according to the formula (B & K Technical Reviews No. 2-1964 and No. 3-1965):
/fi-i \ tw = tn X Q X s X In
\ f i / where
tn = actual sweep test time. tw = "equivalent" wide band test time. Q = resonance amplification factor (Q = 20). s = factor determined from peak matching data (s = o.85). fn — upper limiting frequency of the sweep (fn ™ 700 Hz). fi — lower limiting frequency of the sweep (fi = 70 Hz).
the result of the calculation was roughly tn
Iw = 40
This factor has been used for test time reductions in all the sweep tests discussed in this article.
21
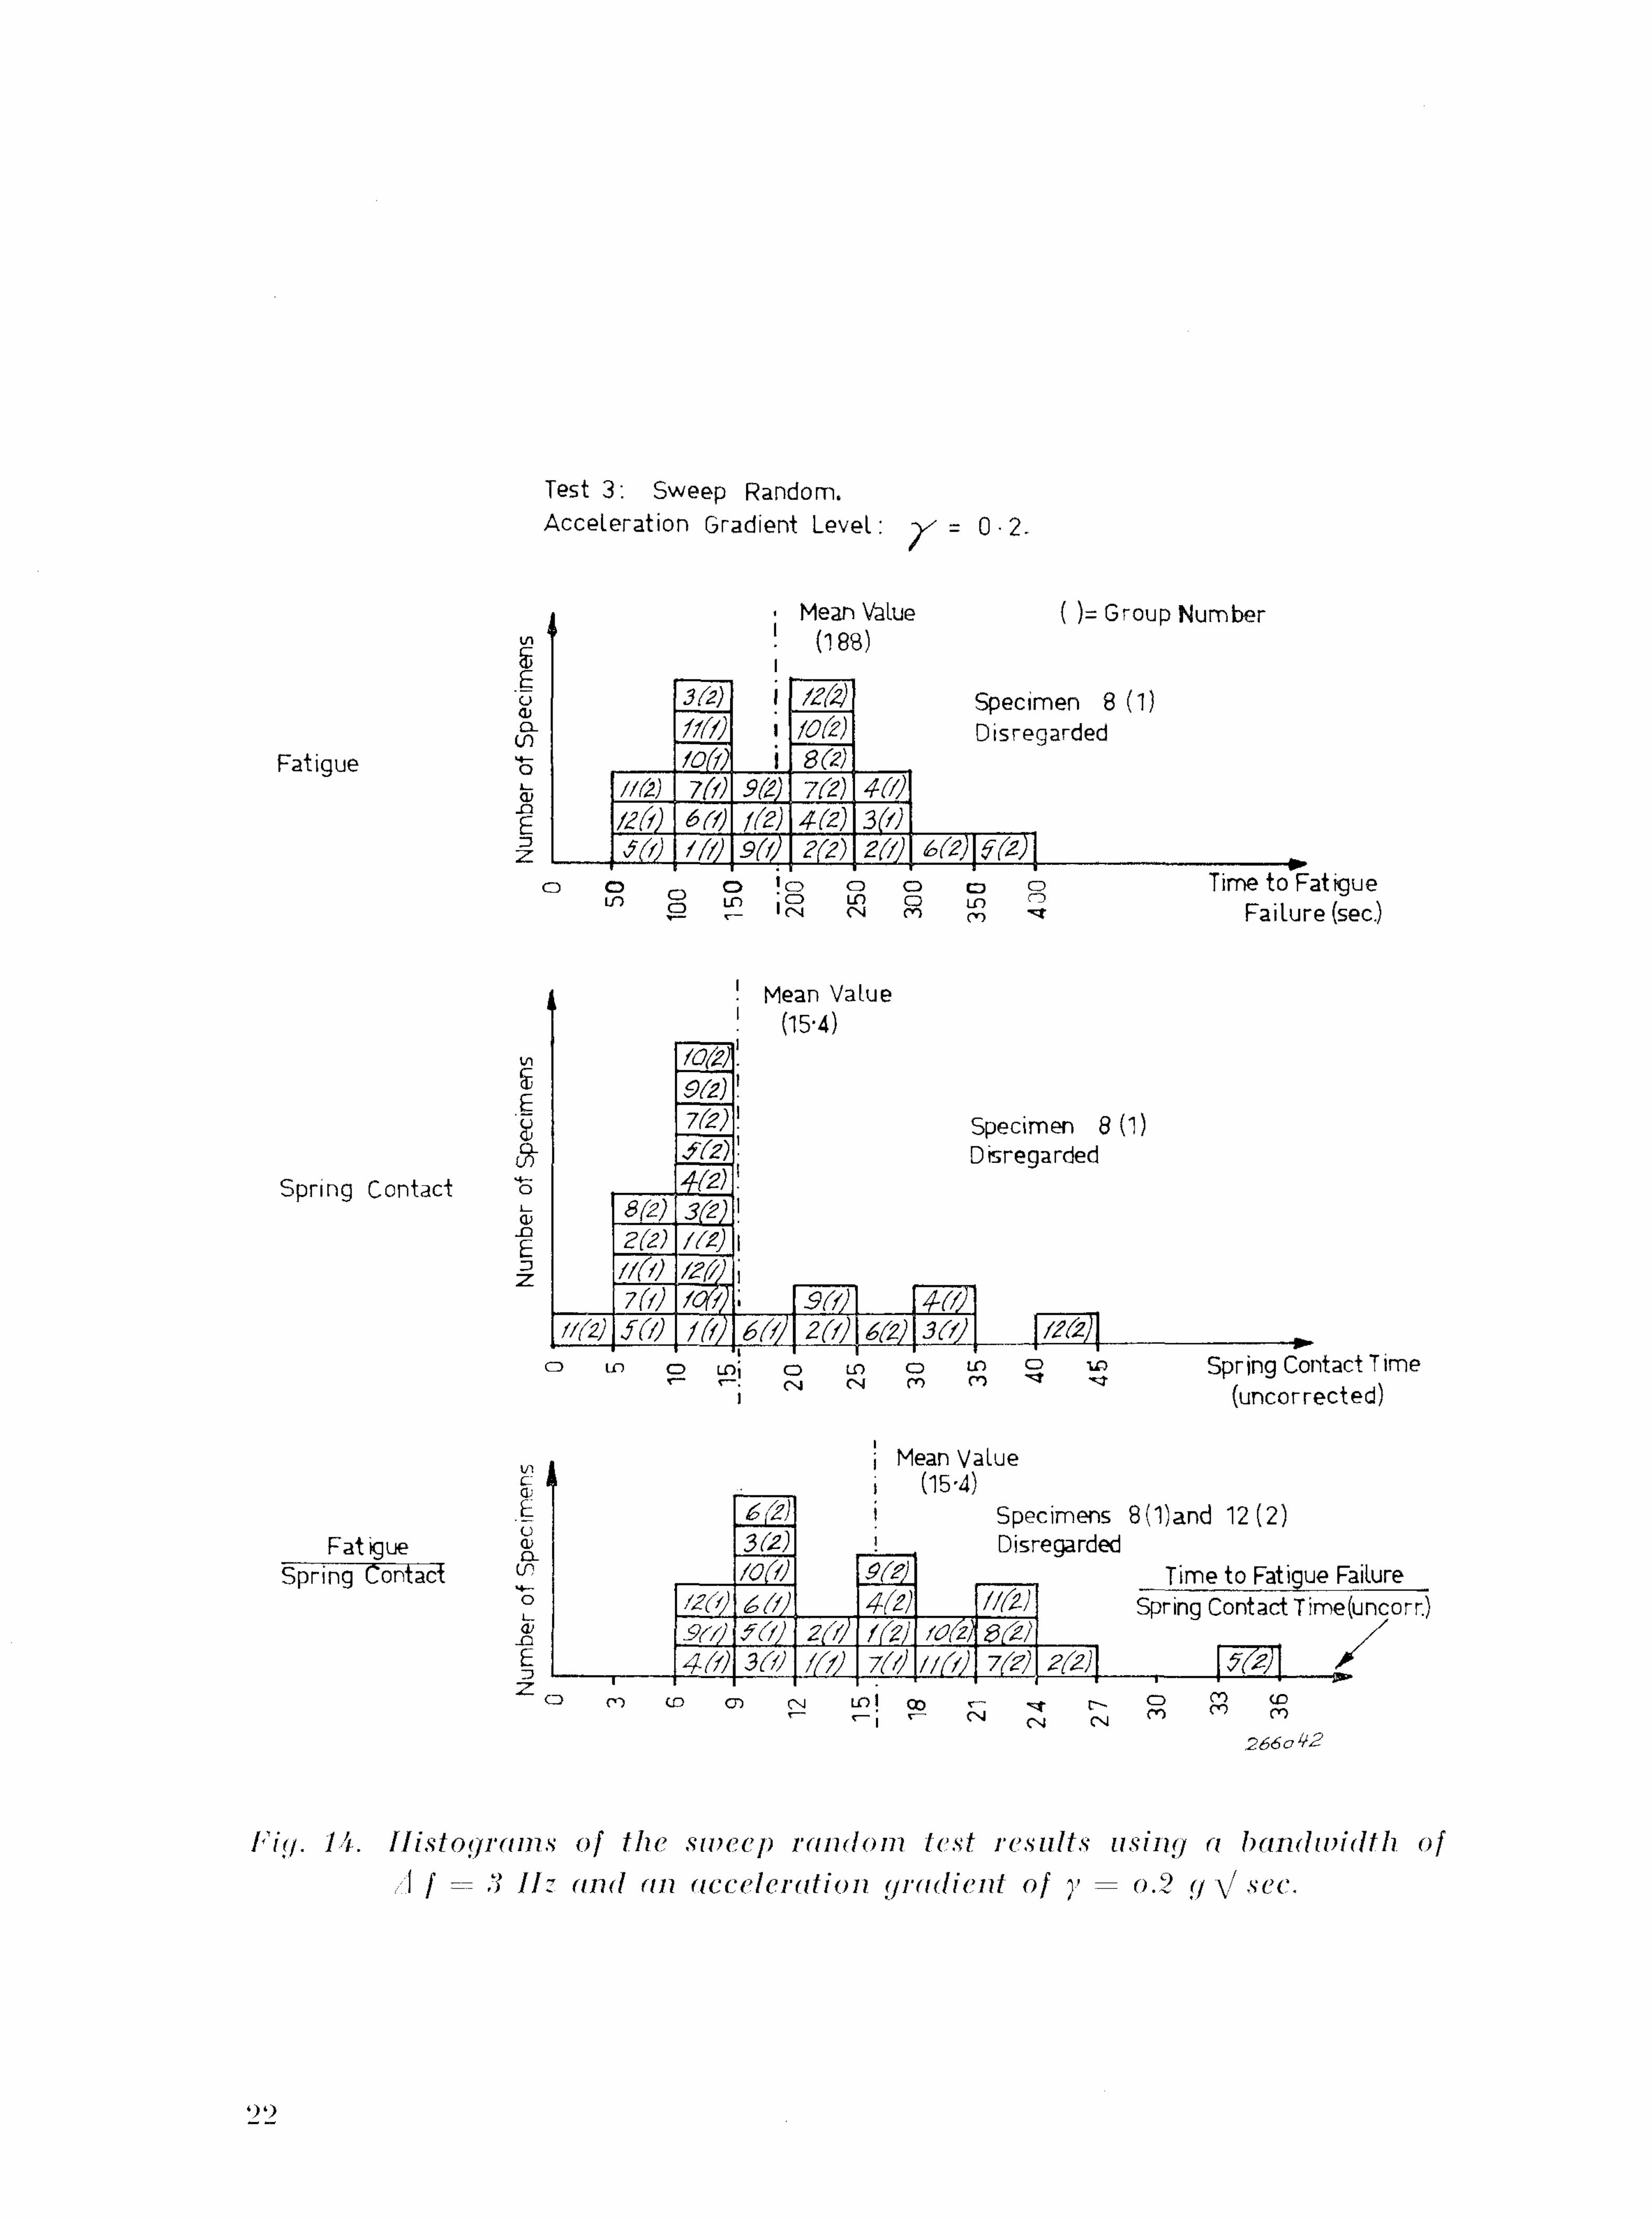
Fig. 14. Histograms of the sweep random test results using a bandwidth of 1 / = 3 Hz and an deceleration gradient of y = o.2 g \l see.
22
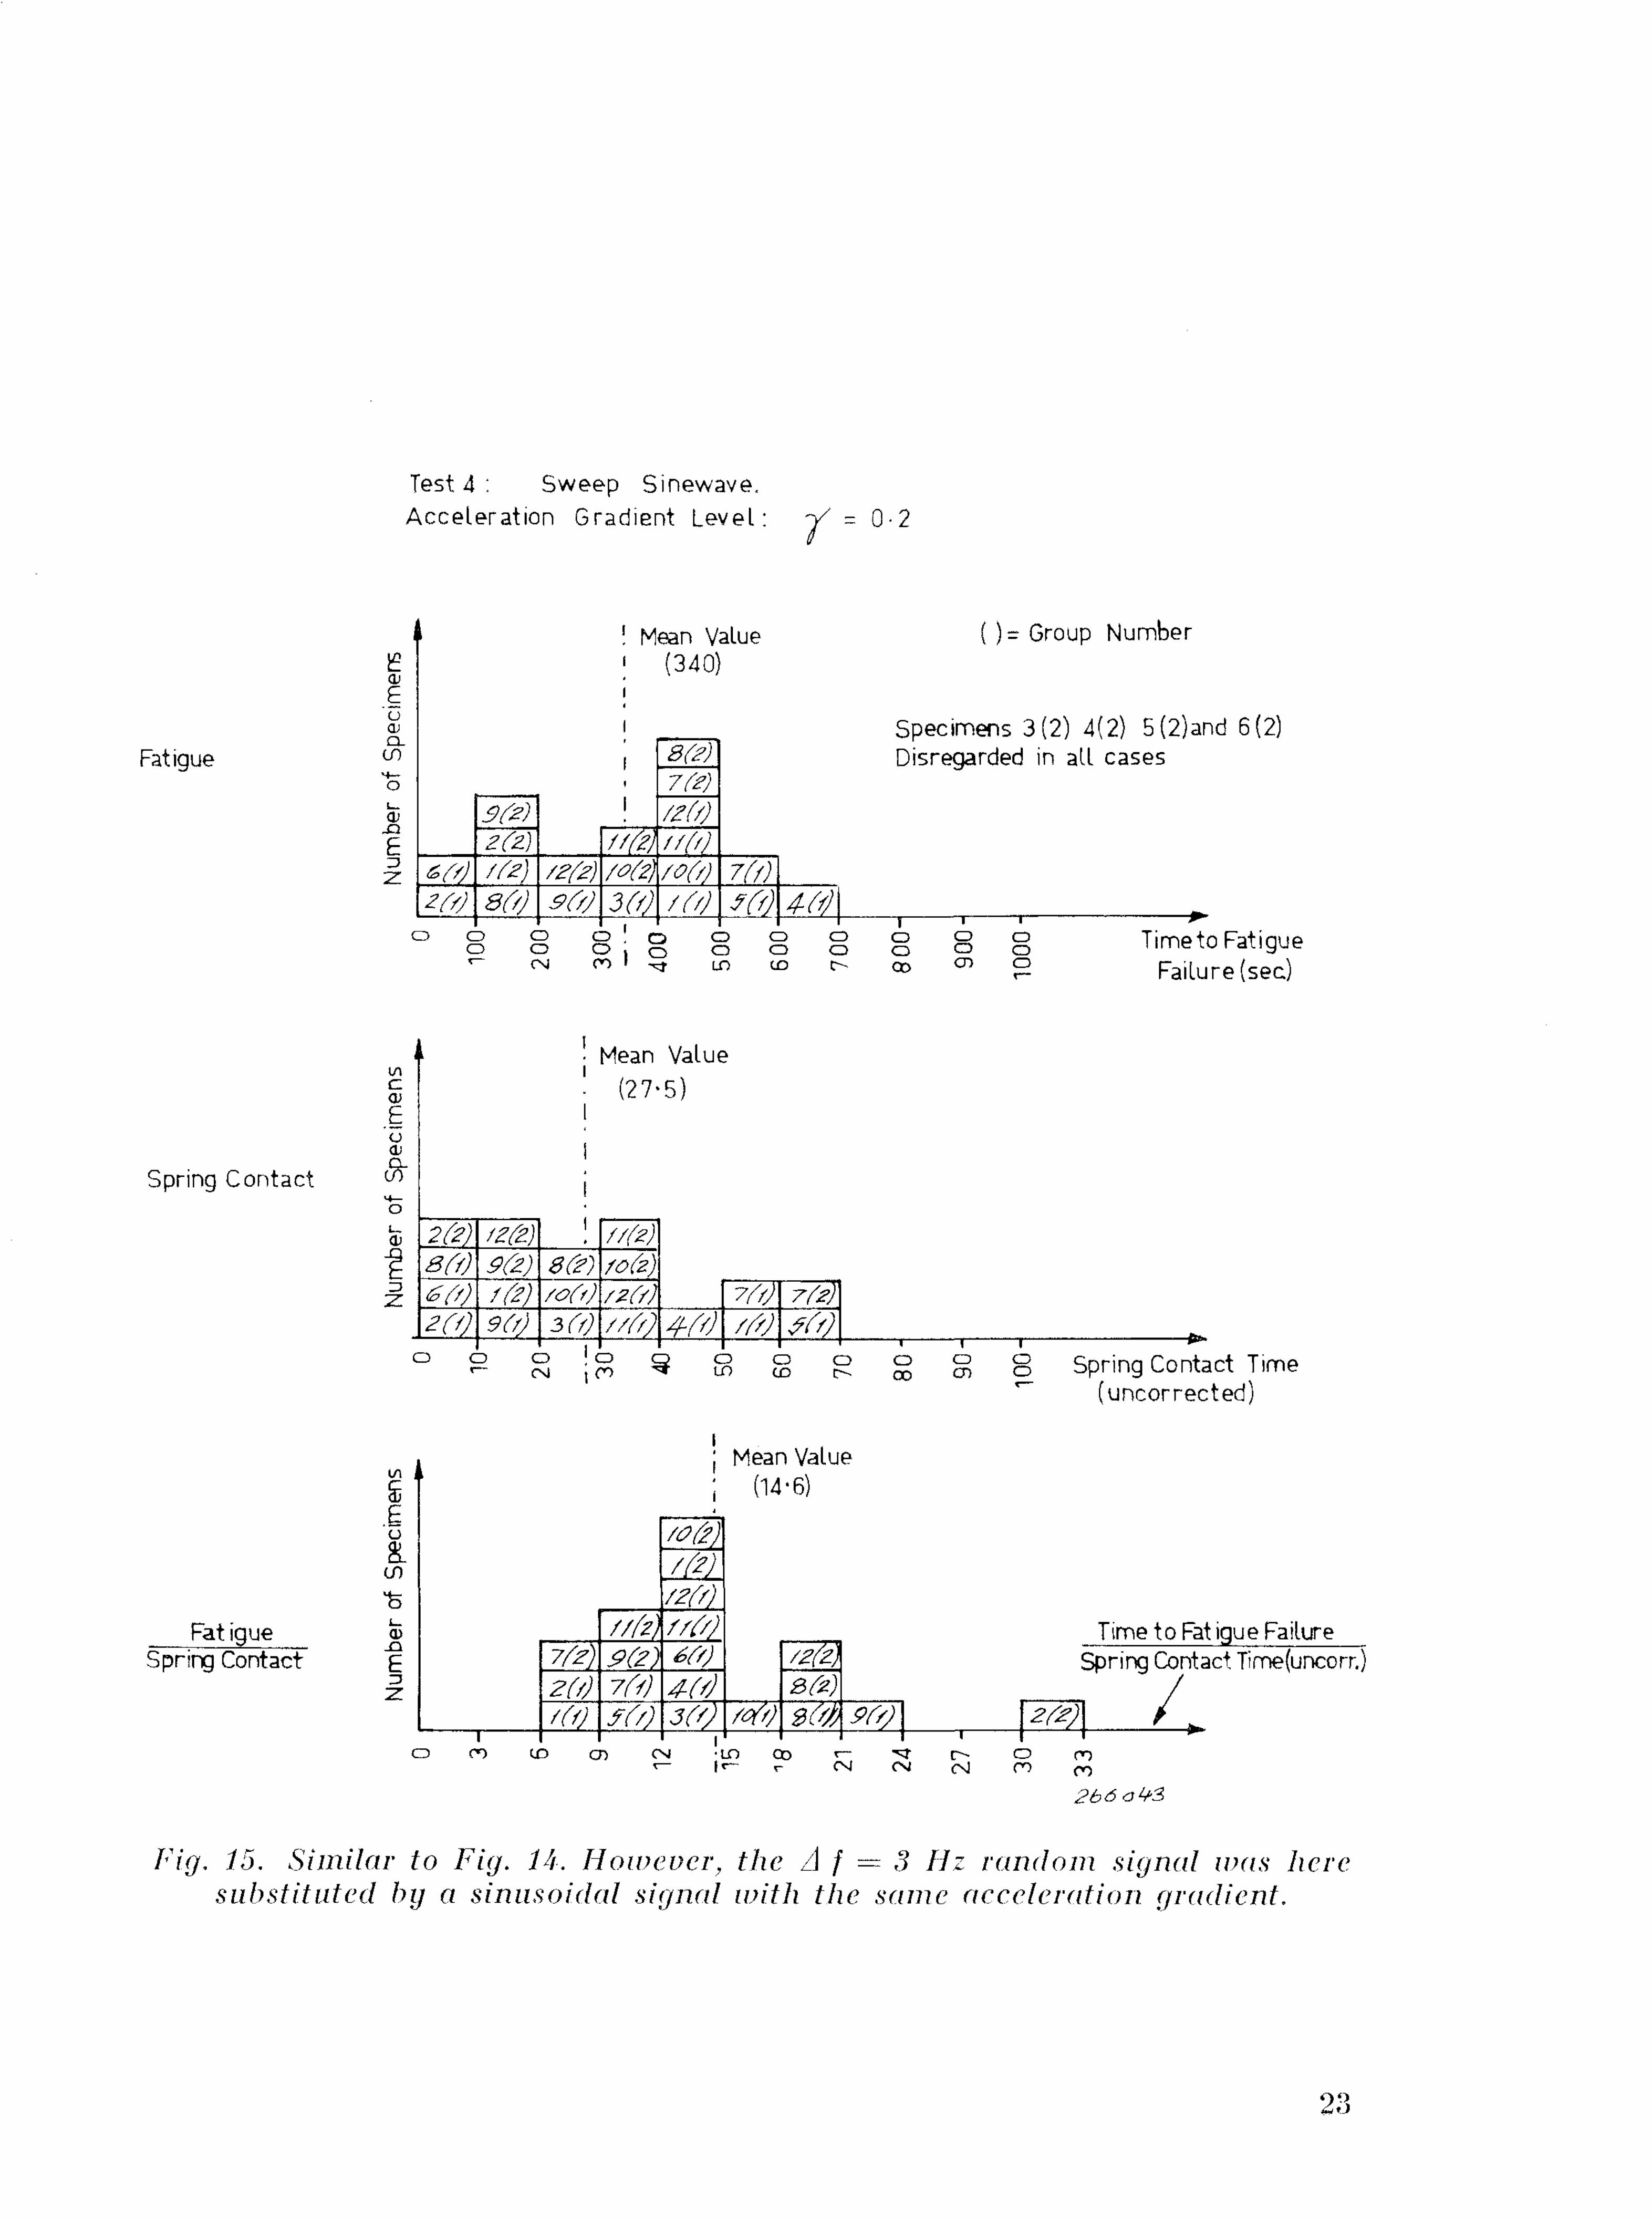
Fig. 15. Similar to Fig. 14. However, the A f — 3 FIz random signal was here substituted by a sinusoidal signal with the same acceleration gradient.
23
The Sweep Tests with Constant Acceleration (RMS) Test Levels. 11 was decided here lo run two sets of tests, one with an excitation level of 5 g RMS, corresponding to the 30 g wide band test, and one with an excitation level of approximately 4 g, roughly corresponding to the 25 g wide band test. In this way an idea of the sensitivity of the test to test level changes could also be obtained.
Fig. 1G. Histograms of the sweep random test results using a bandwidth of A f = 3 Hz and a constant acceleration level of 5 g RMS.
24
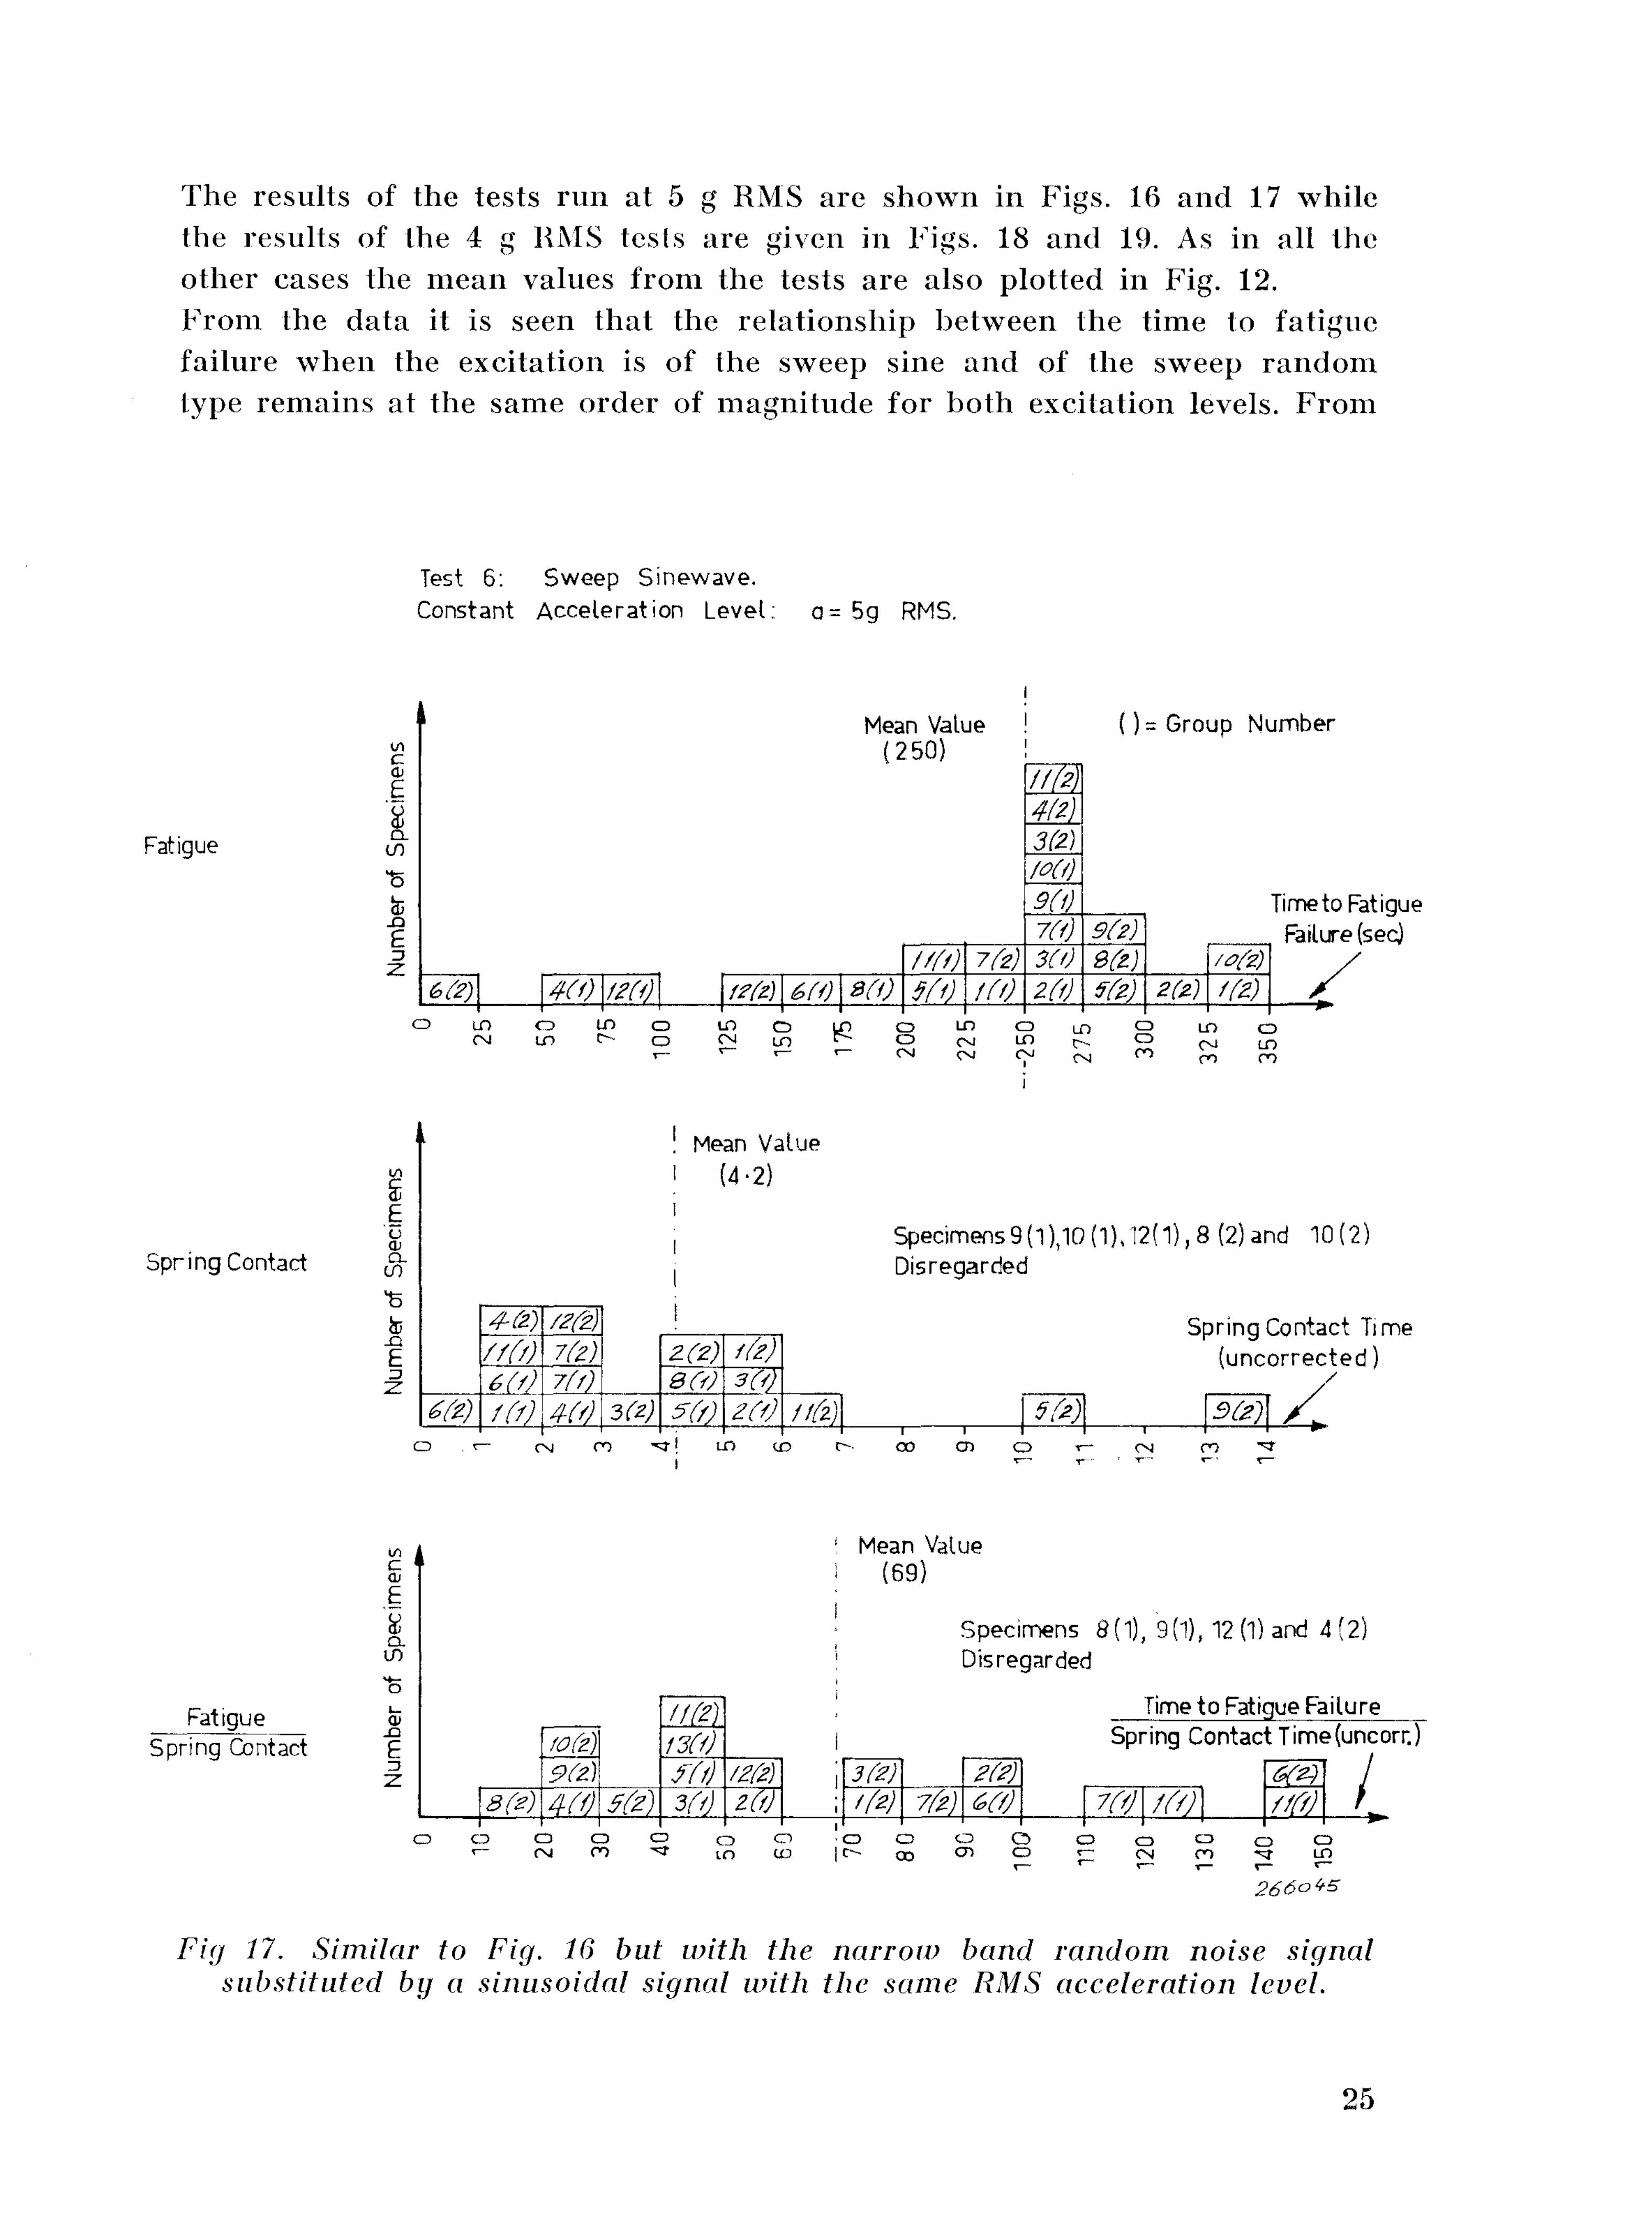
The results of the tests run at 5 g RMS are shown in Figs. 16 and 17 while the results of the 4 g RMS tests are given m Figs. 18 and 19. As in all the other cases the mean values from the tests are also plotted in Fig. 12. From the data it is seen that the relationship between the time to fatigue failure when the excitation is of the sweep sine and of the sweep random type remains at the same order of magnitude for both excitation levels. From
Fig 17. Similar to Fig. 16 but with the narrow band random noise signal substituted by a sinusoidal signal with the same RMS acceleration level.
25
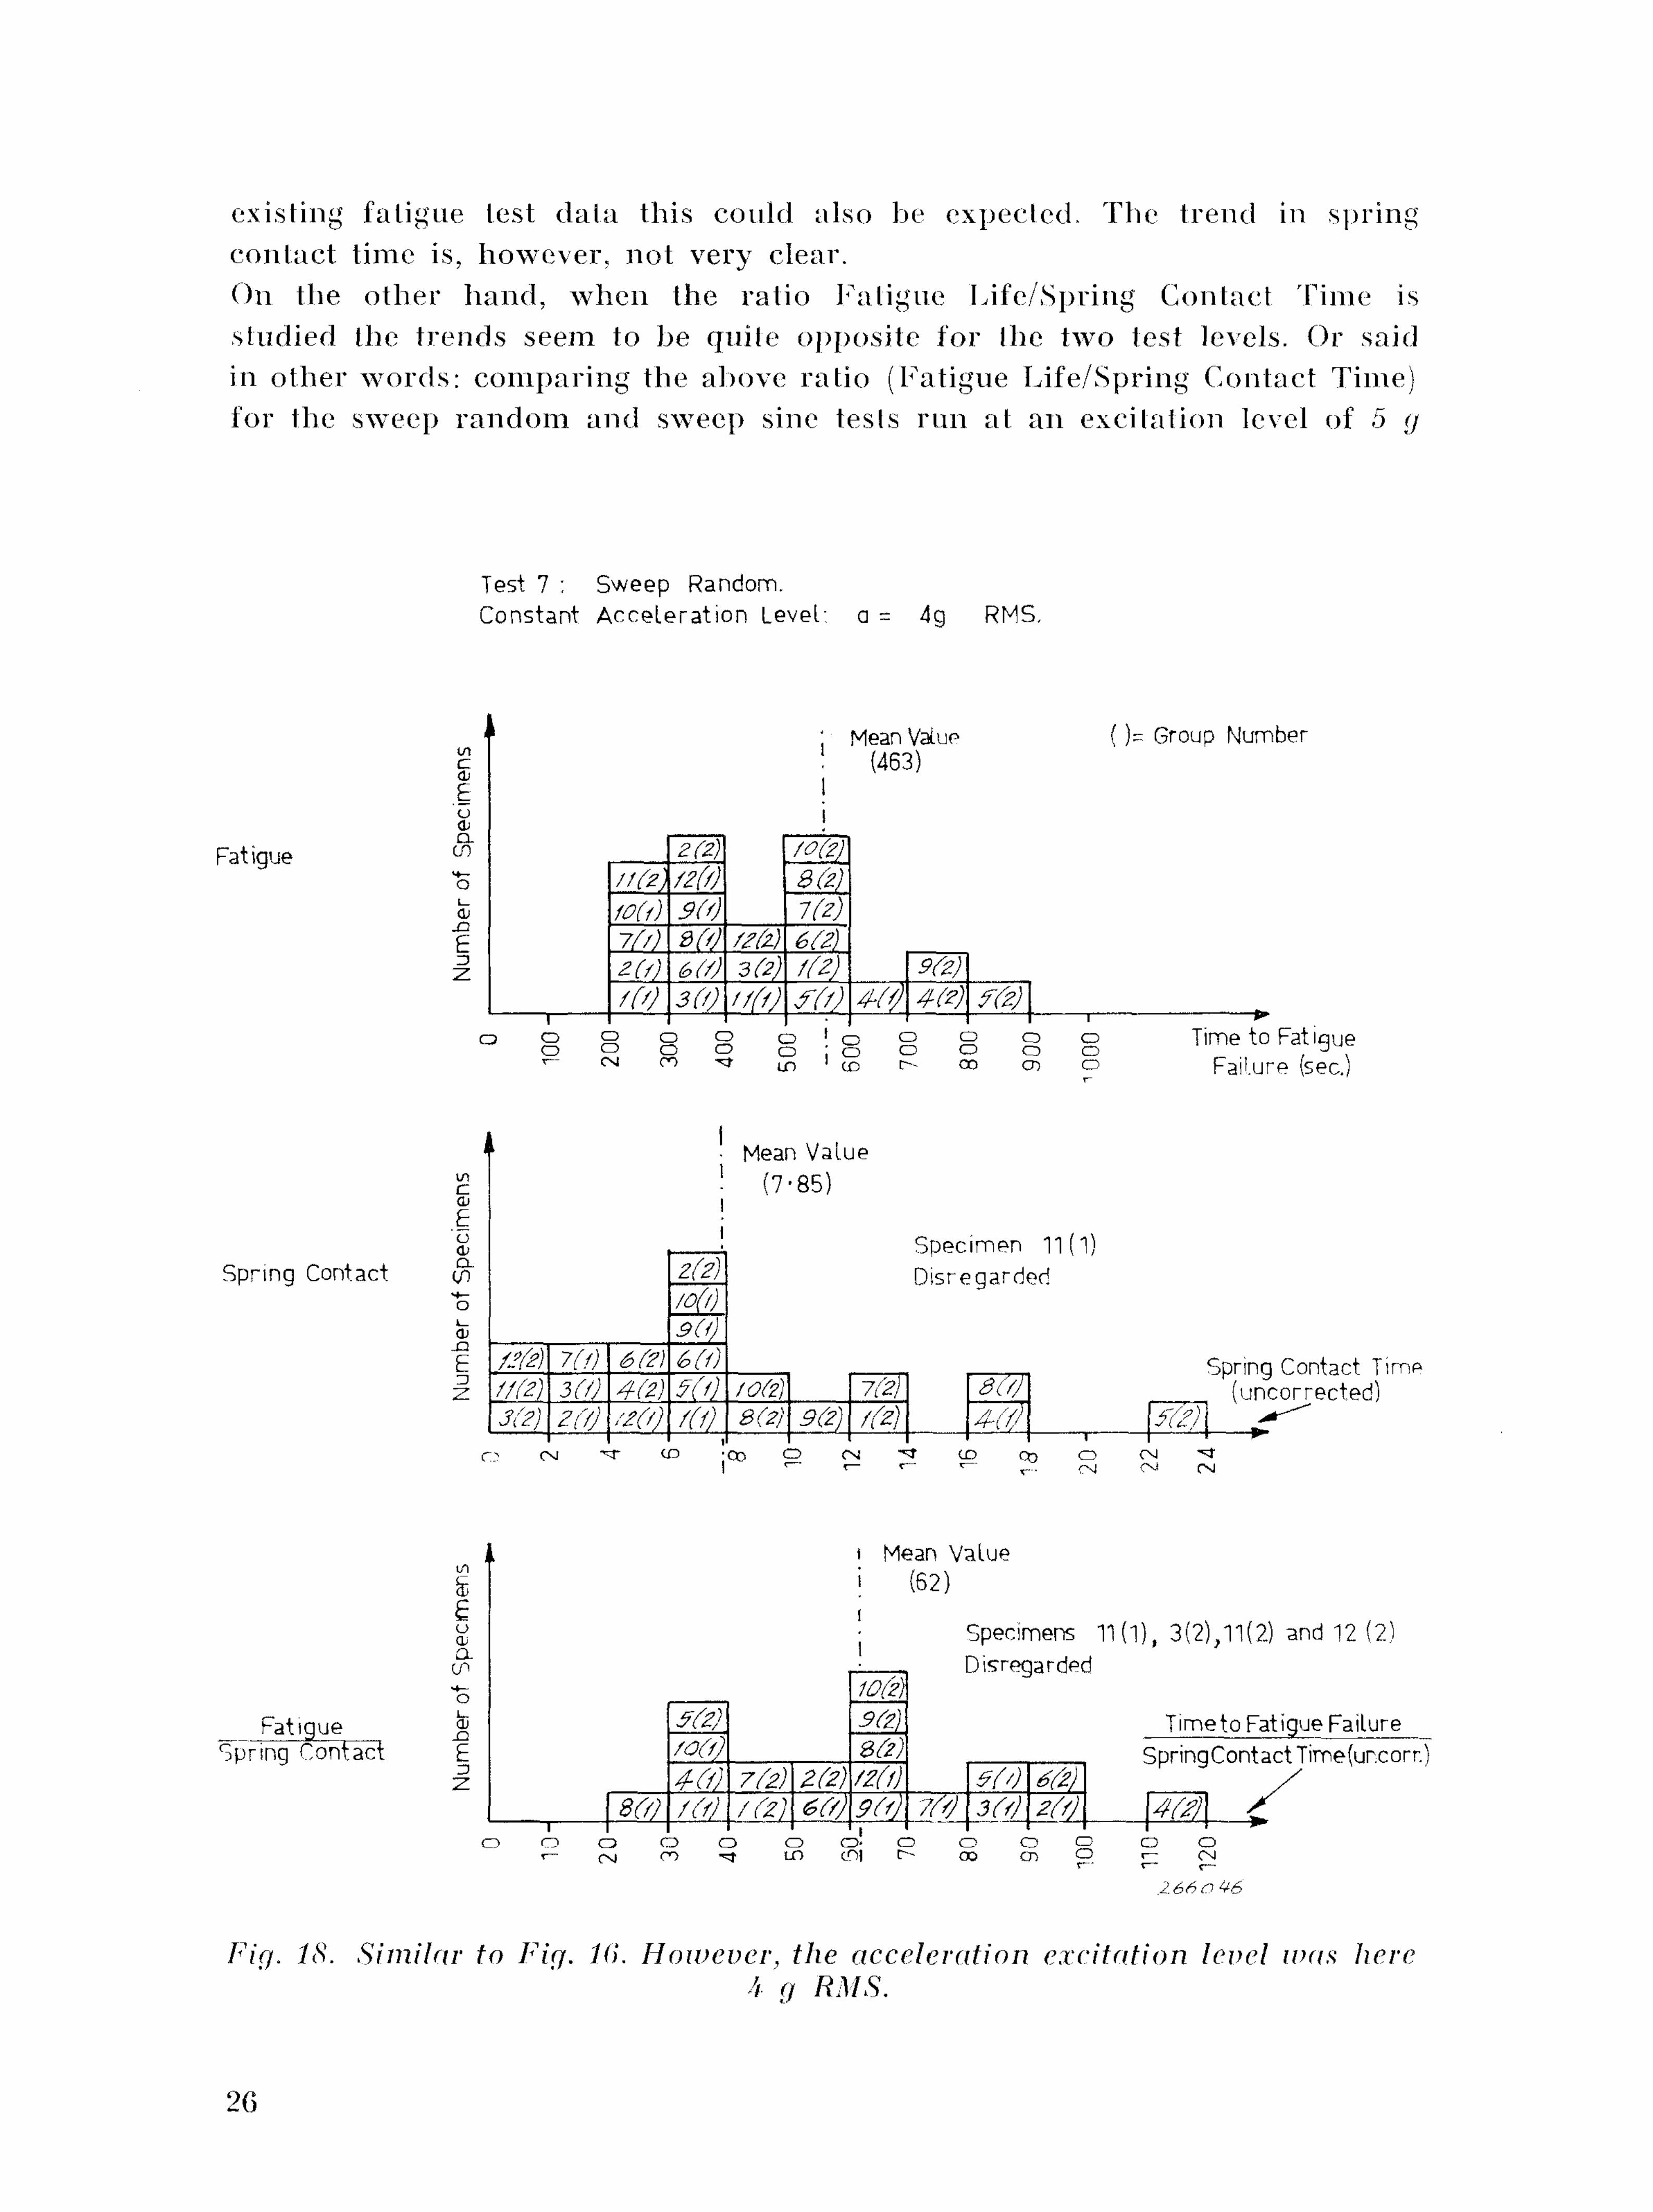
existing fatigue test data this could also be expected. The trend in spring contact time is, however, not very clear. On the other hand , Avhen the ratio Fatigue Life/Spring Contact Time is studied the t rends seem to be quite opposite for the two test levels. Or said in other words : comparing the above ratio (Fatigue Life/Spring Contact Time) for the sweep r andom and sweep sine tesls run at an excitation level of 5 g
Fig. IS. Similar to Fig. KL However, the acceleration excitation level was here h g RMS.
26
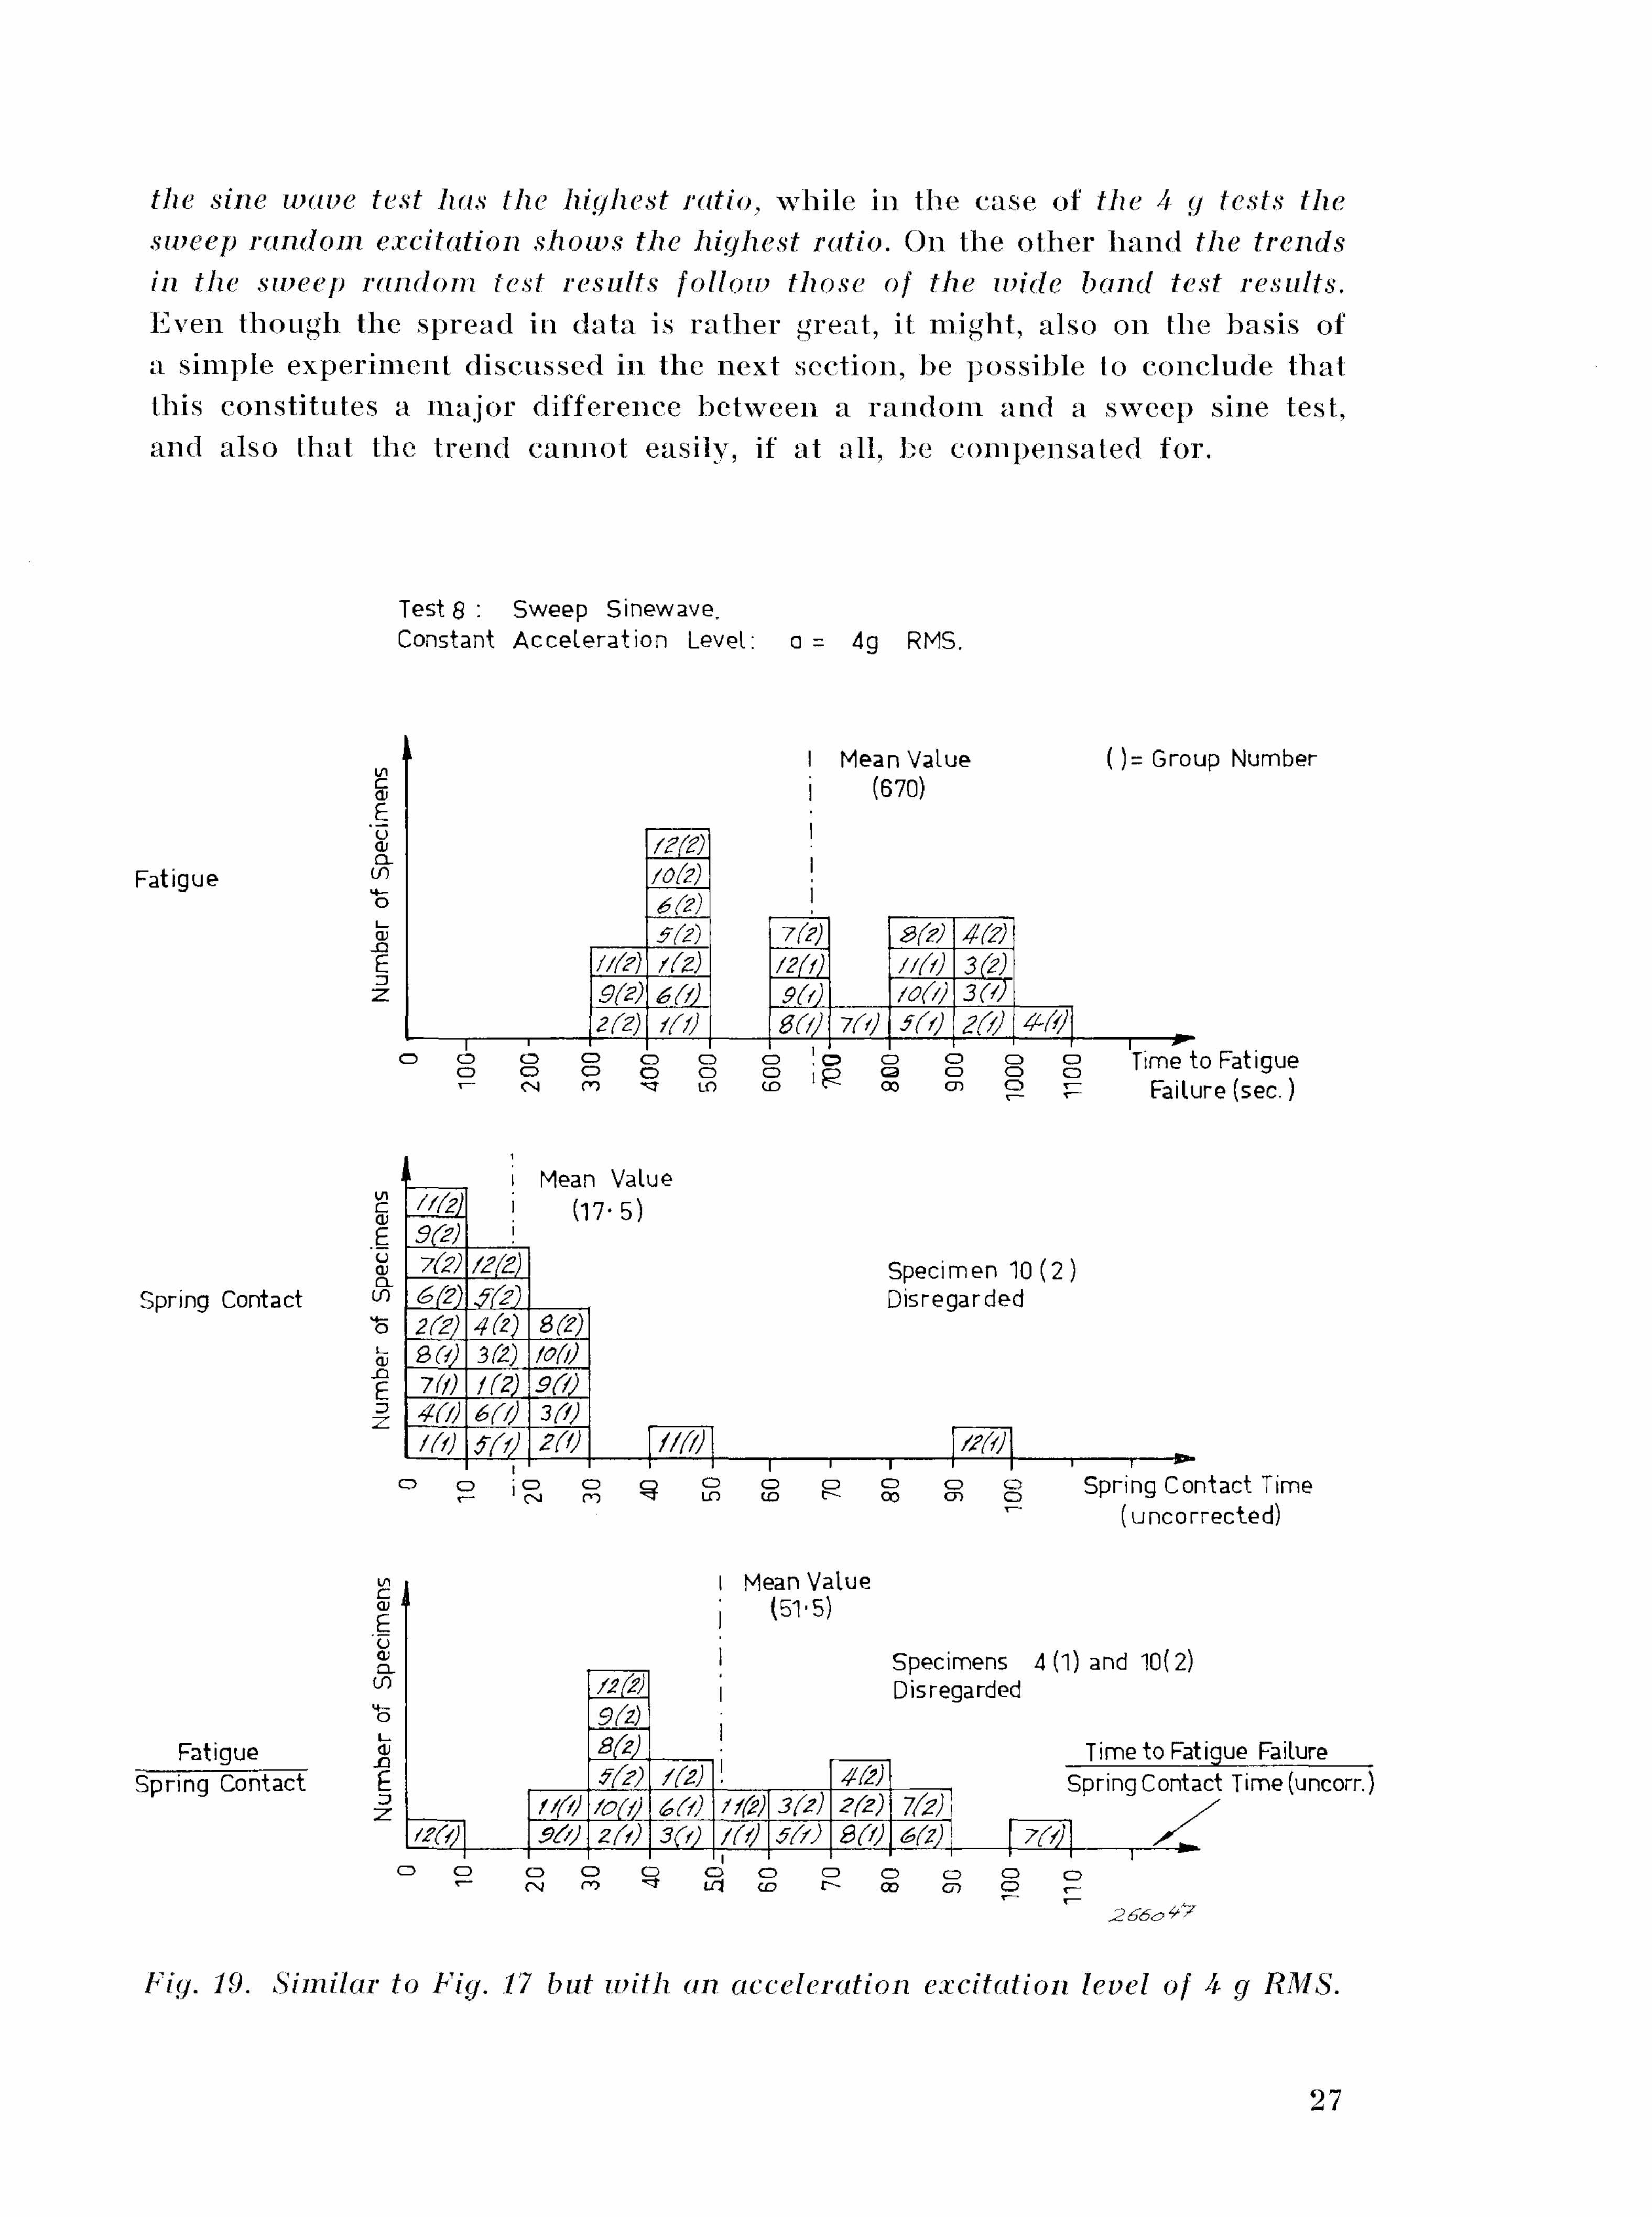
the sine wave test has the highest ratio, while in the case of the 4 g tests the sweep random excitation shows the highest ratio. On the other hand the trends in the sweep random test results follow those of the wide band test results. Even though the spread in data is ra ther great, it might, also on the basis of a simple experiment discussed in the next section, be possible to conclude that this constitutes a major difference between a r a n d o m and a sweep sine test, and also that the trend cannot easily, if at all, be compensated for.
Fig. 19. Similar to Fig. 17 but with an acceleration excitation level of 4 g RMS.
27
General Conclusions and Discussion. There are certain general conclusions which might be drawn from the tests:
1. It seems that the absolute spread in test results obtained from tests on ordinary manufactured and adjusted specimens is quite extensive.
2. The sensitivity of the results of vibration tests to test level variations is considerable.
3. A random vibration test of specimens containing contact mechanisms cannot be substituted bv a sine-wave test.
It might be worth while discussing the last one of the above general conclusions a little further in view of the experiments described in this article. It was stated on page 26 that the trends in the ratio Fatigue Life/Spring Contact Time seemed to be quite opposite for two different test levels when the sweep random and the sweep sine tests were compared. That such effects might be expected is fairly obvious as the sweep random excitation contains a number of high vibration peaks which cannot be present in the sweep sine test. A simple experiment confirms this effect. The test specimen was excited at the spring contact resonance (550 Hz) and the test level was adjusted so that no peak was registered when the specimen was excited by sine waves. This test level was found to be 1.5 g RMS. When the excitation was changed to a nar row band random signal (A f = 3 Hz) of the same RMS value, a total contact time of approximately 3 seconds in a 300 seconds test was found. Ry decreasing the test level to 1 g RMS the spring contact time was o.7 seconds in a 300 seconds test while at an excitation level of o.5 g no spring contact was registered in a 300 seconds test. While all the vibration peaks in a sinusoidal dwell test occur at 1.41 X RMS-value (1.41a) the main density of peaks in a nar row band random dwell test is found around the RMS-value (1 o level). However, a certain number of peaks exceed this level, and theoretically an infinitely small chance exists that an infinitely high peak will occur. In practice only peaks up to some 3 a-levels are considered. The effect of the random occurrence of high vibration peaks is one of the most significant differences between sine-wave and random vibration testing.
Over the last few years sweep random test specifications have been suggested which were based on an assumed "equivalence" with the commonly known wide band random test. This had led to the introduction of certain assumptions recording specimen Q-values which might be considered undesirable. However, as long as the sweep bandwidth is narrower than the specimen resonance bandwidth such assumptions are necessary as long as the "equivalence" with common wide band testing is regarded essential. On the other hand, since general equivalence between the two kinds of testing can never
28
be achieved it seems more na tura l to consider the sweep r andom test as a separate type of testing which retains the simplicity of a sweep test and adds the feature of a statistically well defined distribution of amplitude values. In view of this it is therefore suggested that sweep random test specifications should be derived in much the same way as has been usual practice for sweep sine data, i.e. directly from the measured or estimated vibration environment. The availability of modern spectrum shapers for sweep tests will also in many cases allow for a much more detailed and realistic test than one obtained from a number of "averaging" processes.
Acknowledgement. The au thor would like at this point to express his appreciat ion for the helpful work and interest of all the people who have taken par t in the experiments. He would like especially to thank Mr. T. Rasmussen and Mr. B. E. Bang of the I.F.E.P. (Danish Electronic Reliability Institute) for making their vibration test facilities available for the main testing. Thanks should also be given to Mr. P. C. Will iams who made m a n y of the prel iminary tests and to Mr. R. G. Cullum of Briiel & Kjser who carefully adjusted the lest specimens and carried out most of the pract ical testing.
References. BOOTH, G. B. and Analog Exper iments Compare Sweep Random Tests with BROCH, J . T . : Wide Band Random and Sweep Sine Tests. Briiel & Kjasr
Technical Review, No. 3-1965.
BROCH, J. T.: An Introduct ion to Sweep Random Vibration. Briiel & Kjaer Technical Review, No. 2-1964.
BROCH, J. T.: Some Aspects of Sweep Random Vibration. Journa l of Sound and Vibration, No. 2, Vol. 3, March 1966.
29
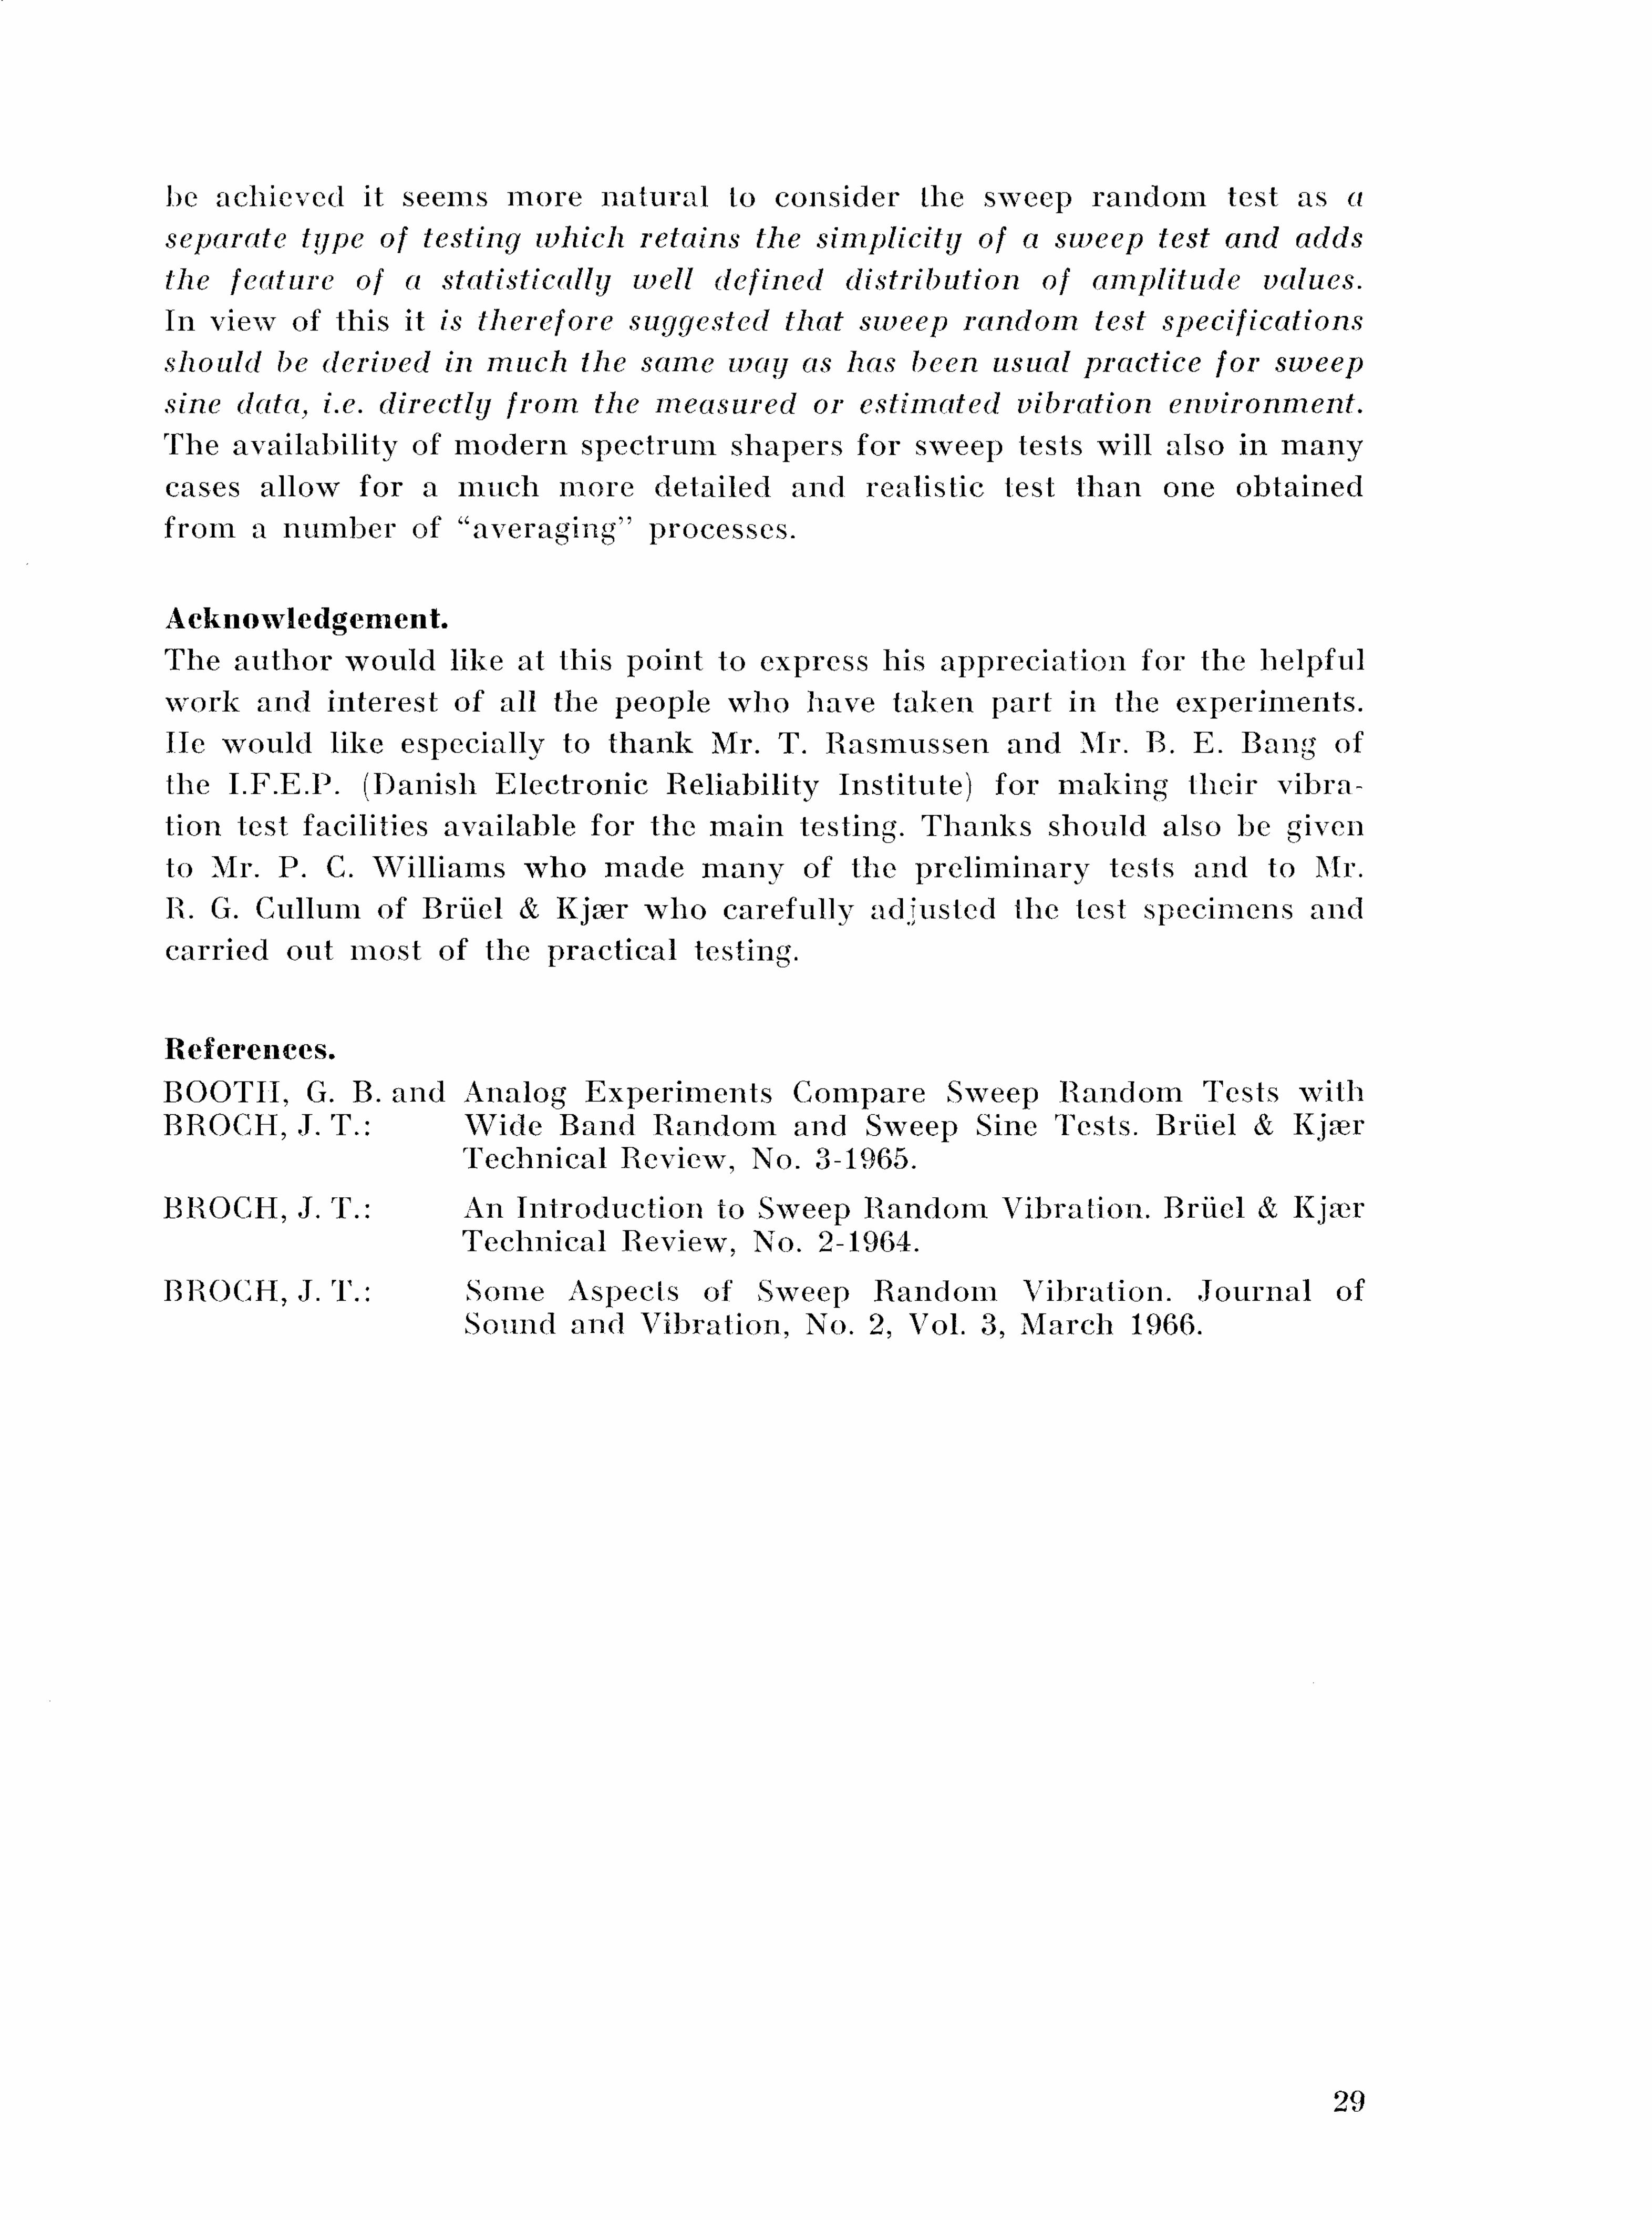
Appendix. Multiple Sweep Random. It has been stated in the preceding text that wide band random vibration test specifications normally prescribe a test-spectrum which includes the measured or estimated data points, but is much less detailed than the expected vibration environment. Such a test specification spectrum is shown in Fig. A.l. and clearly illustrates the argument. On the other hand, this spectrum is relatively easy to reproduce on a vibration machine. However, it seems necessary to be able to specify a more detailed spectrum as well as certain mechanical impedance conditions before the real objective of vibration testing can be
Fig. A.l. Typical wide band random vibration test spectrum (MIL - STD - 810 (USAF)).
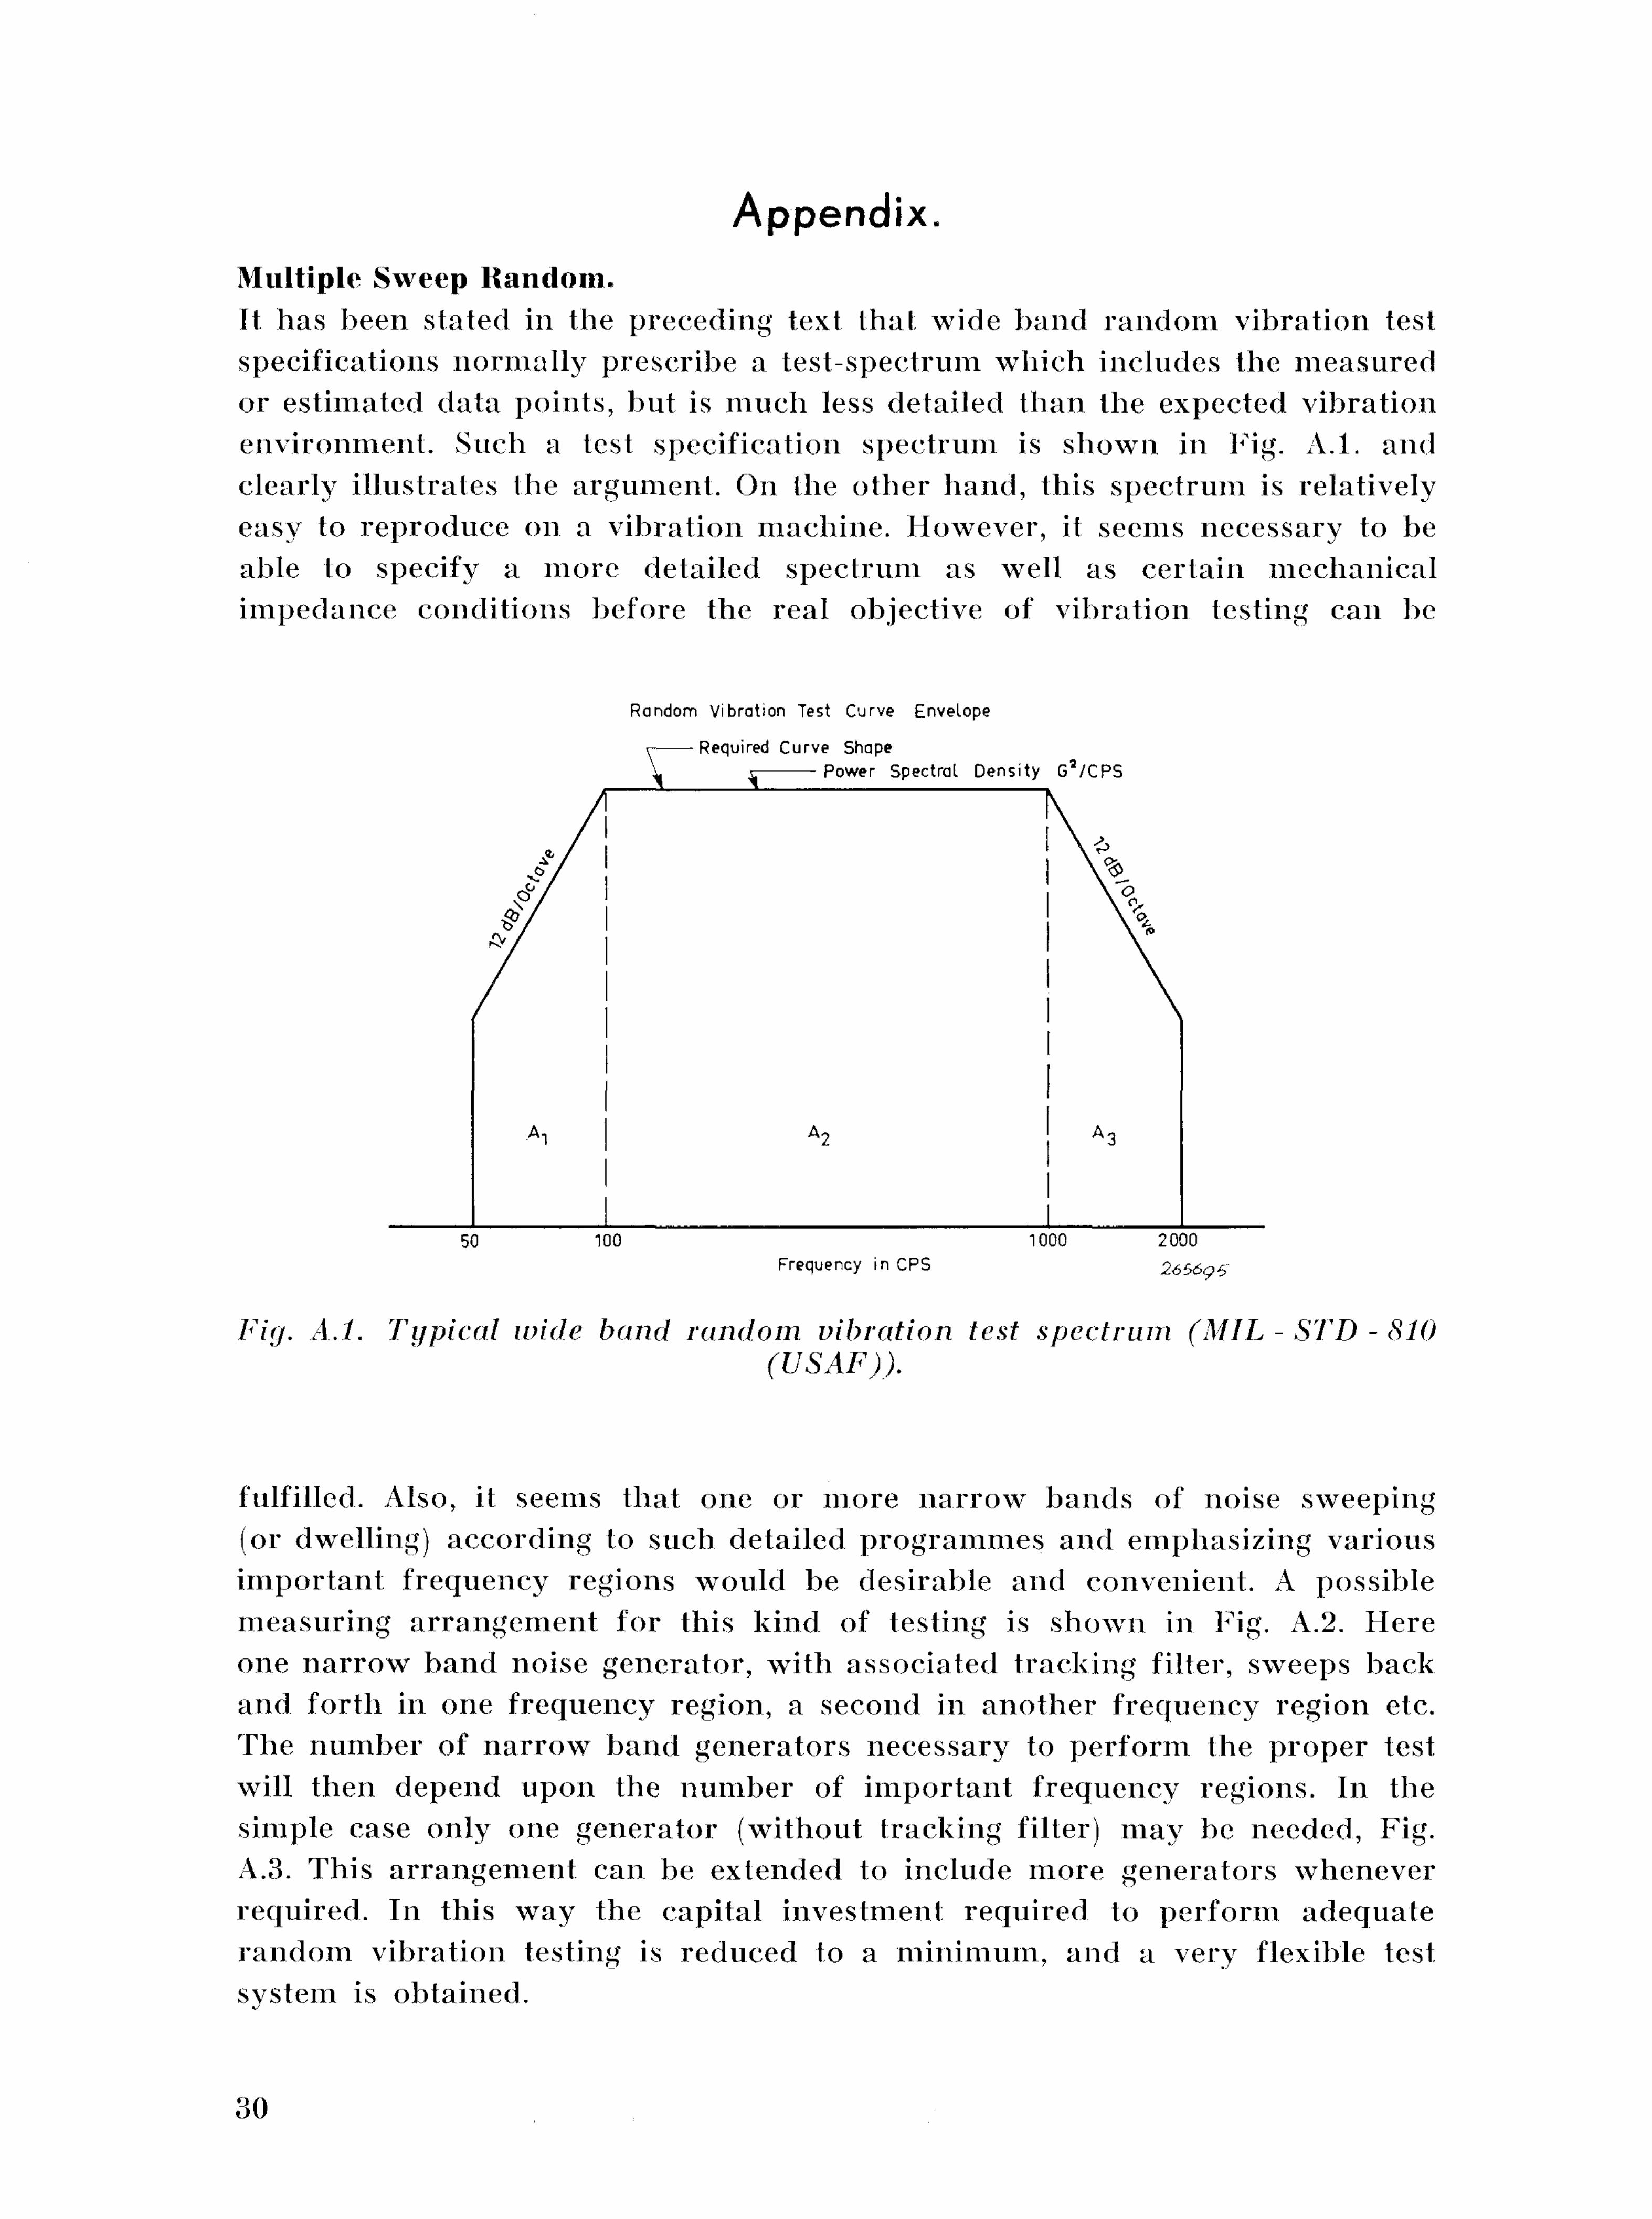
fulfilled. Also, it seems that one or more nar row bands of noise sweeping (or dwelling) according to such detailed programmes and emphasizing various important frequency regions would be desirable and convenient. A possible measuring arrangement for this kind of testing is shown in Fig. A.2. Here one nar row band noise generator, with associated tracking filter, sweeps back and forth in one frequency region, a second in another frequency region etc. The number of nar row band generators necessary to perform the proper test will then depend upon the number of important frequency regions. In the simple case only one generator (without tracking filter) may be needed, Fig. A.3. This arrangement can be extended to include more generators whenever required. In this way the capital investment required to perform adequate random vibration testing is reduced to a minimum, and a very flexible test svstem is obtained.
30
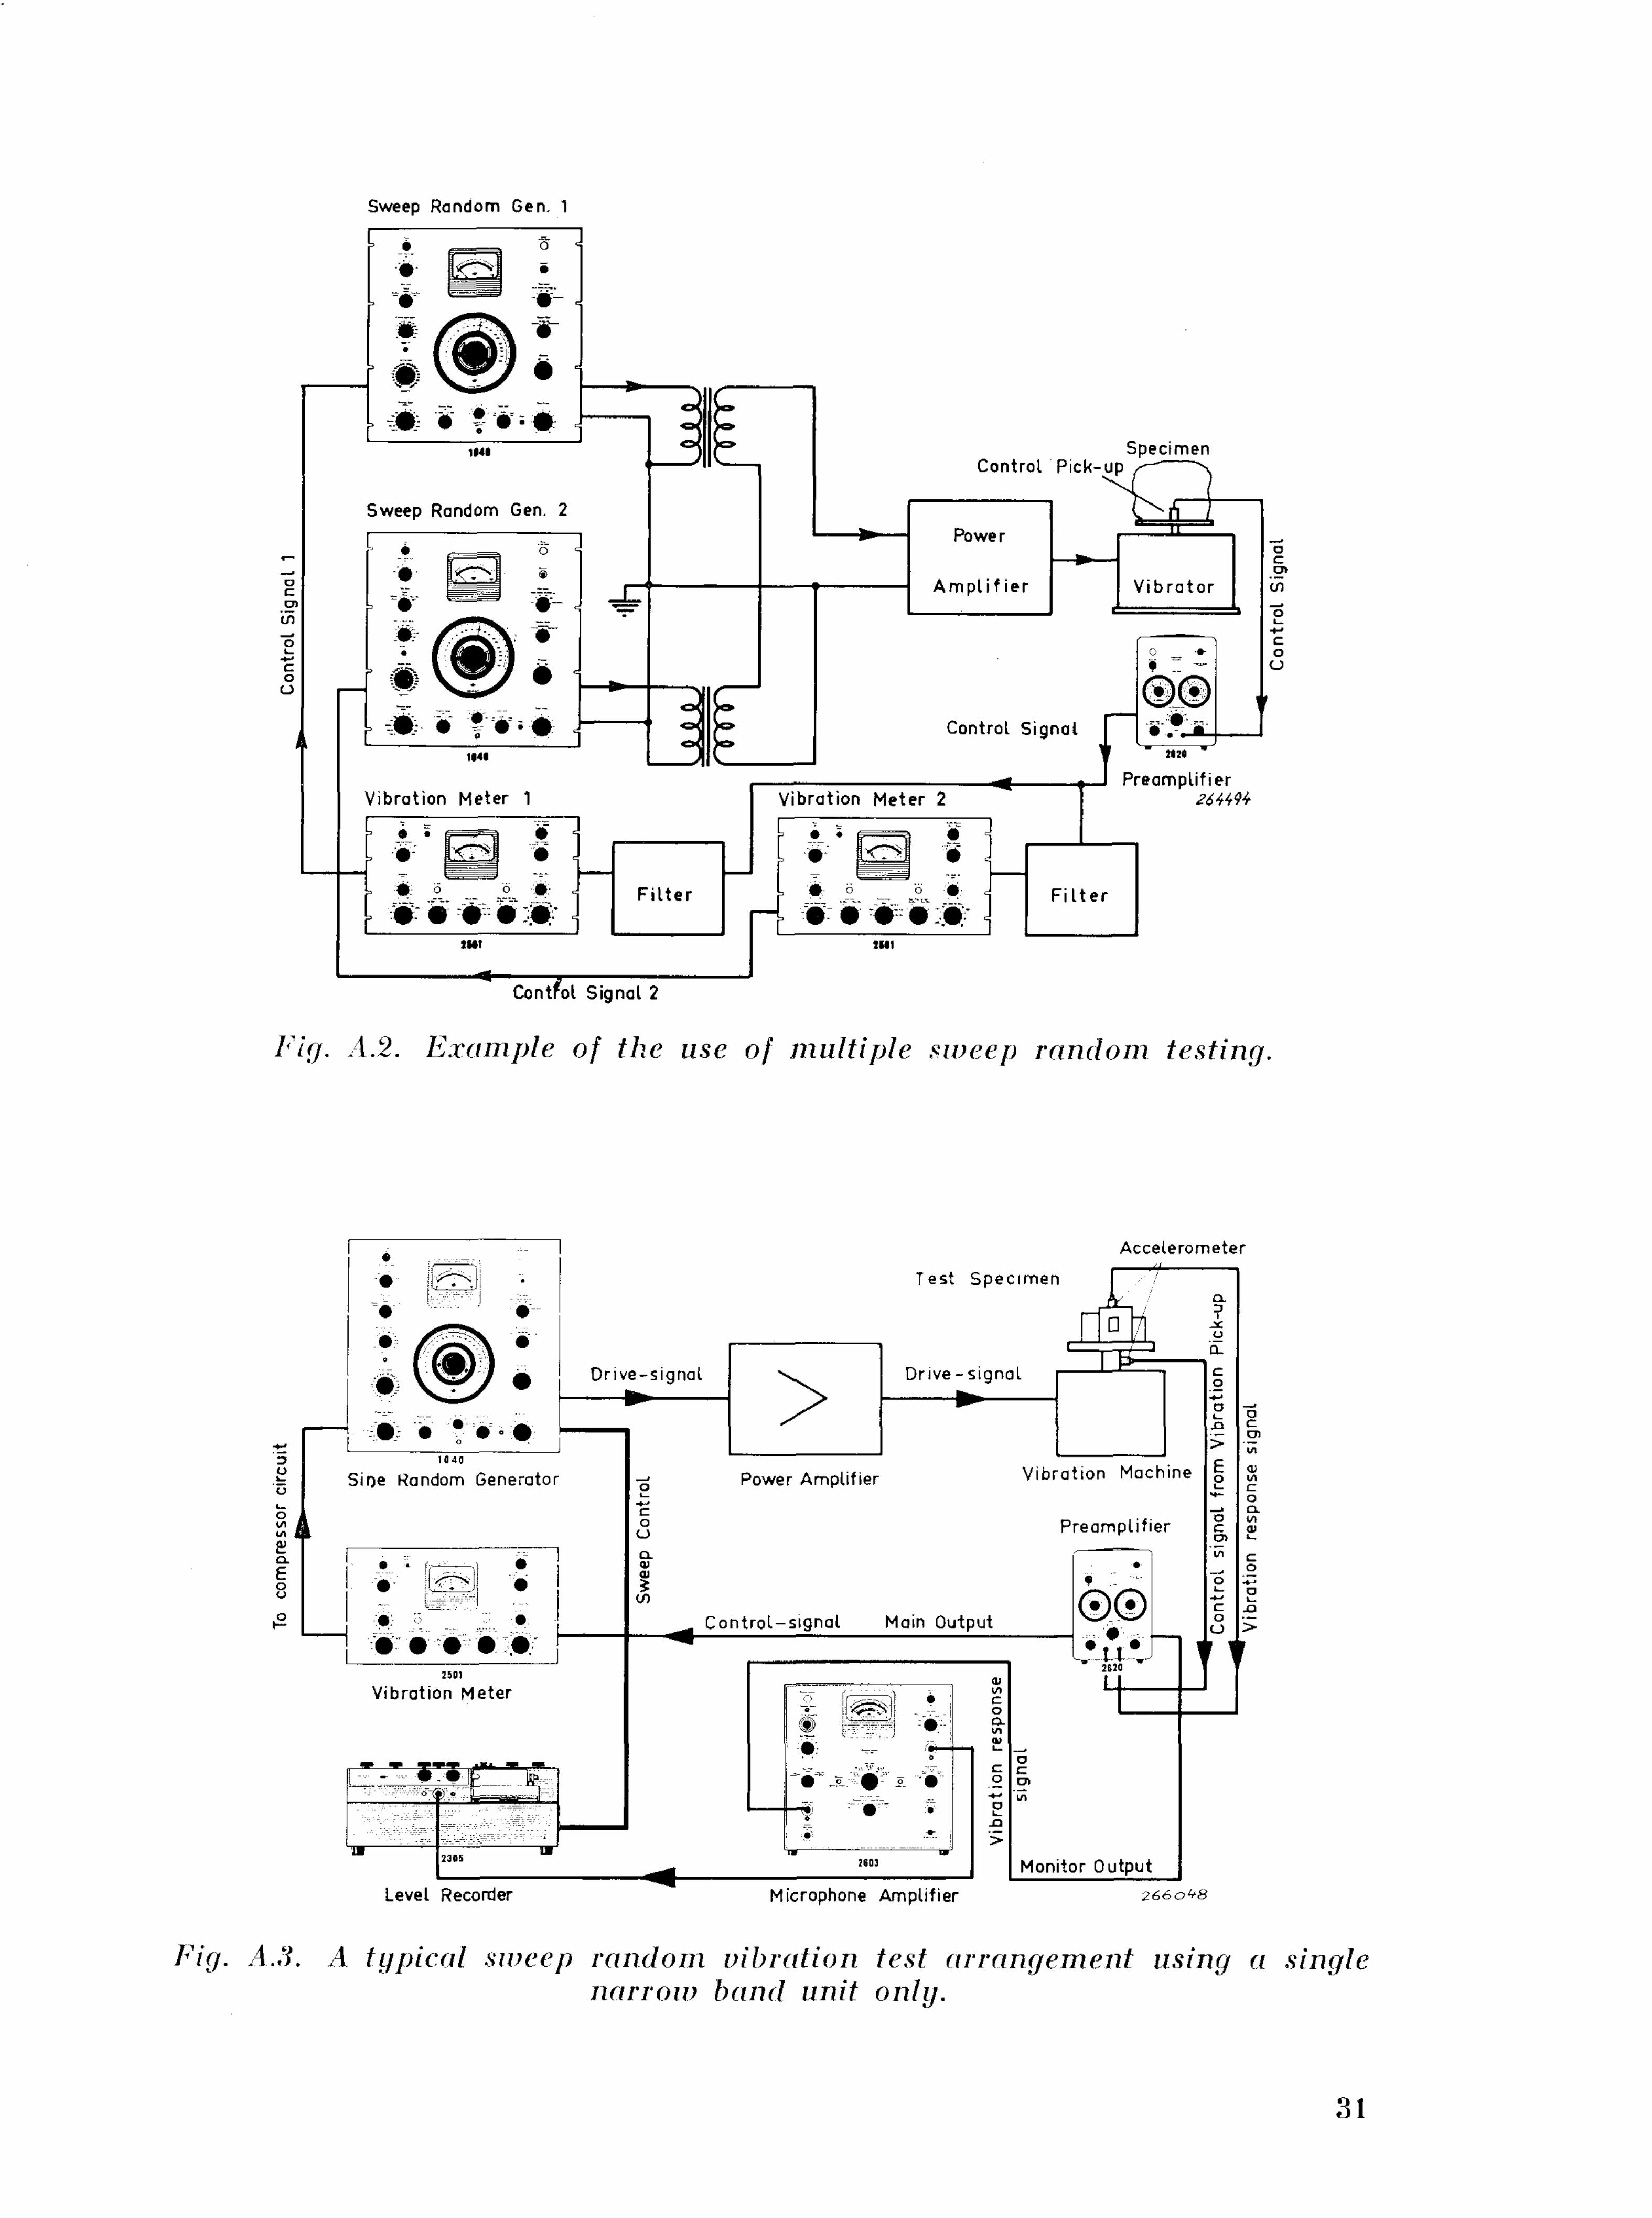
Fig. A.2. Example of the use of multiple sweep random testing.
Fig. A.3. A typical sweep random vibration test arrangement using a single narrow band unit only.
31
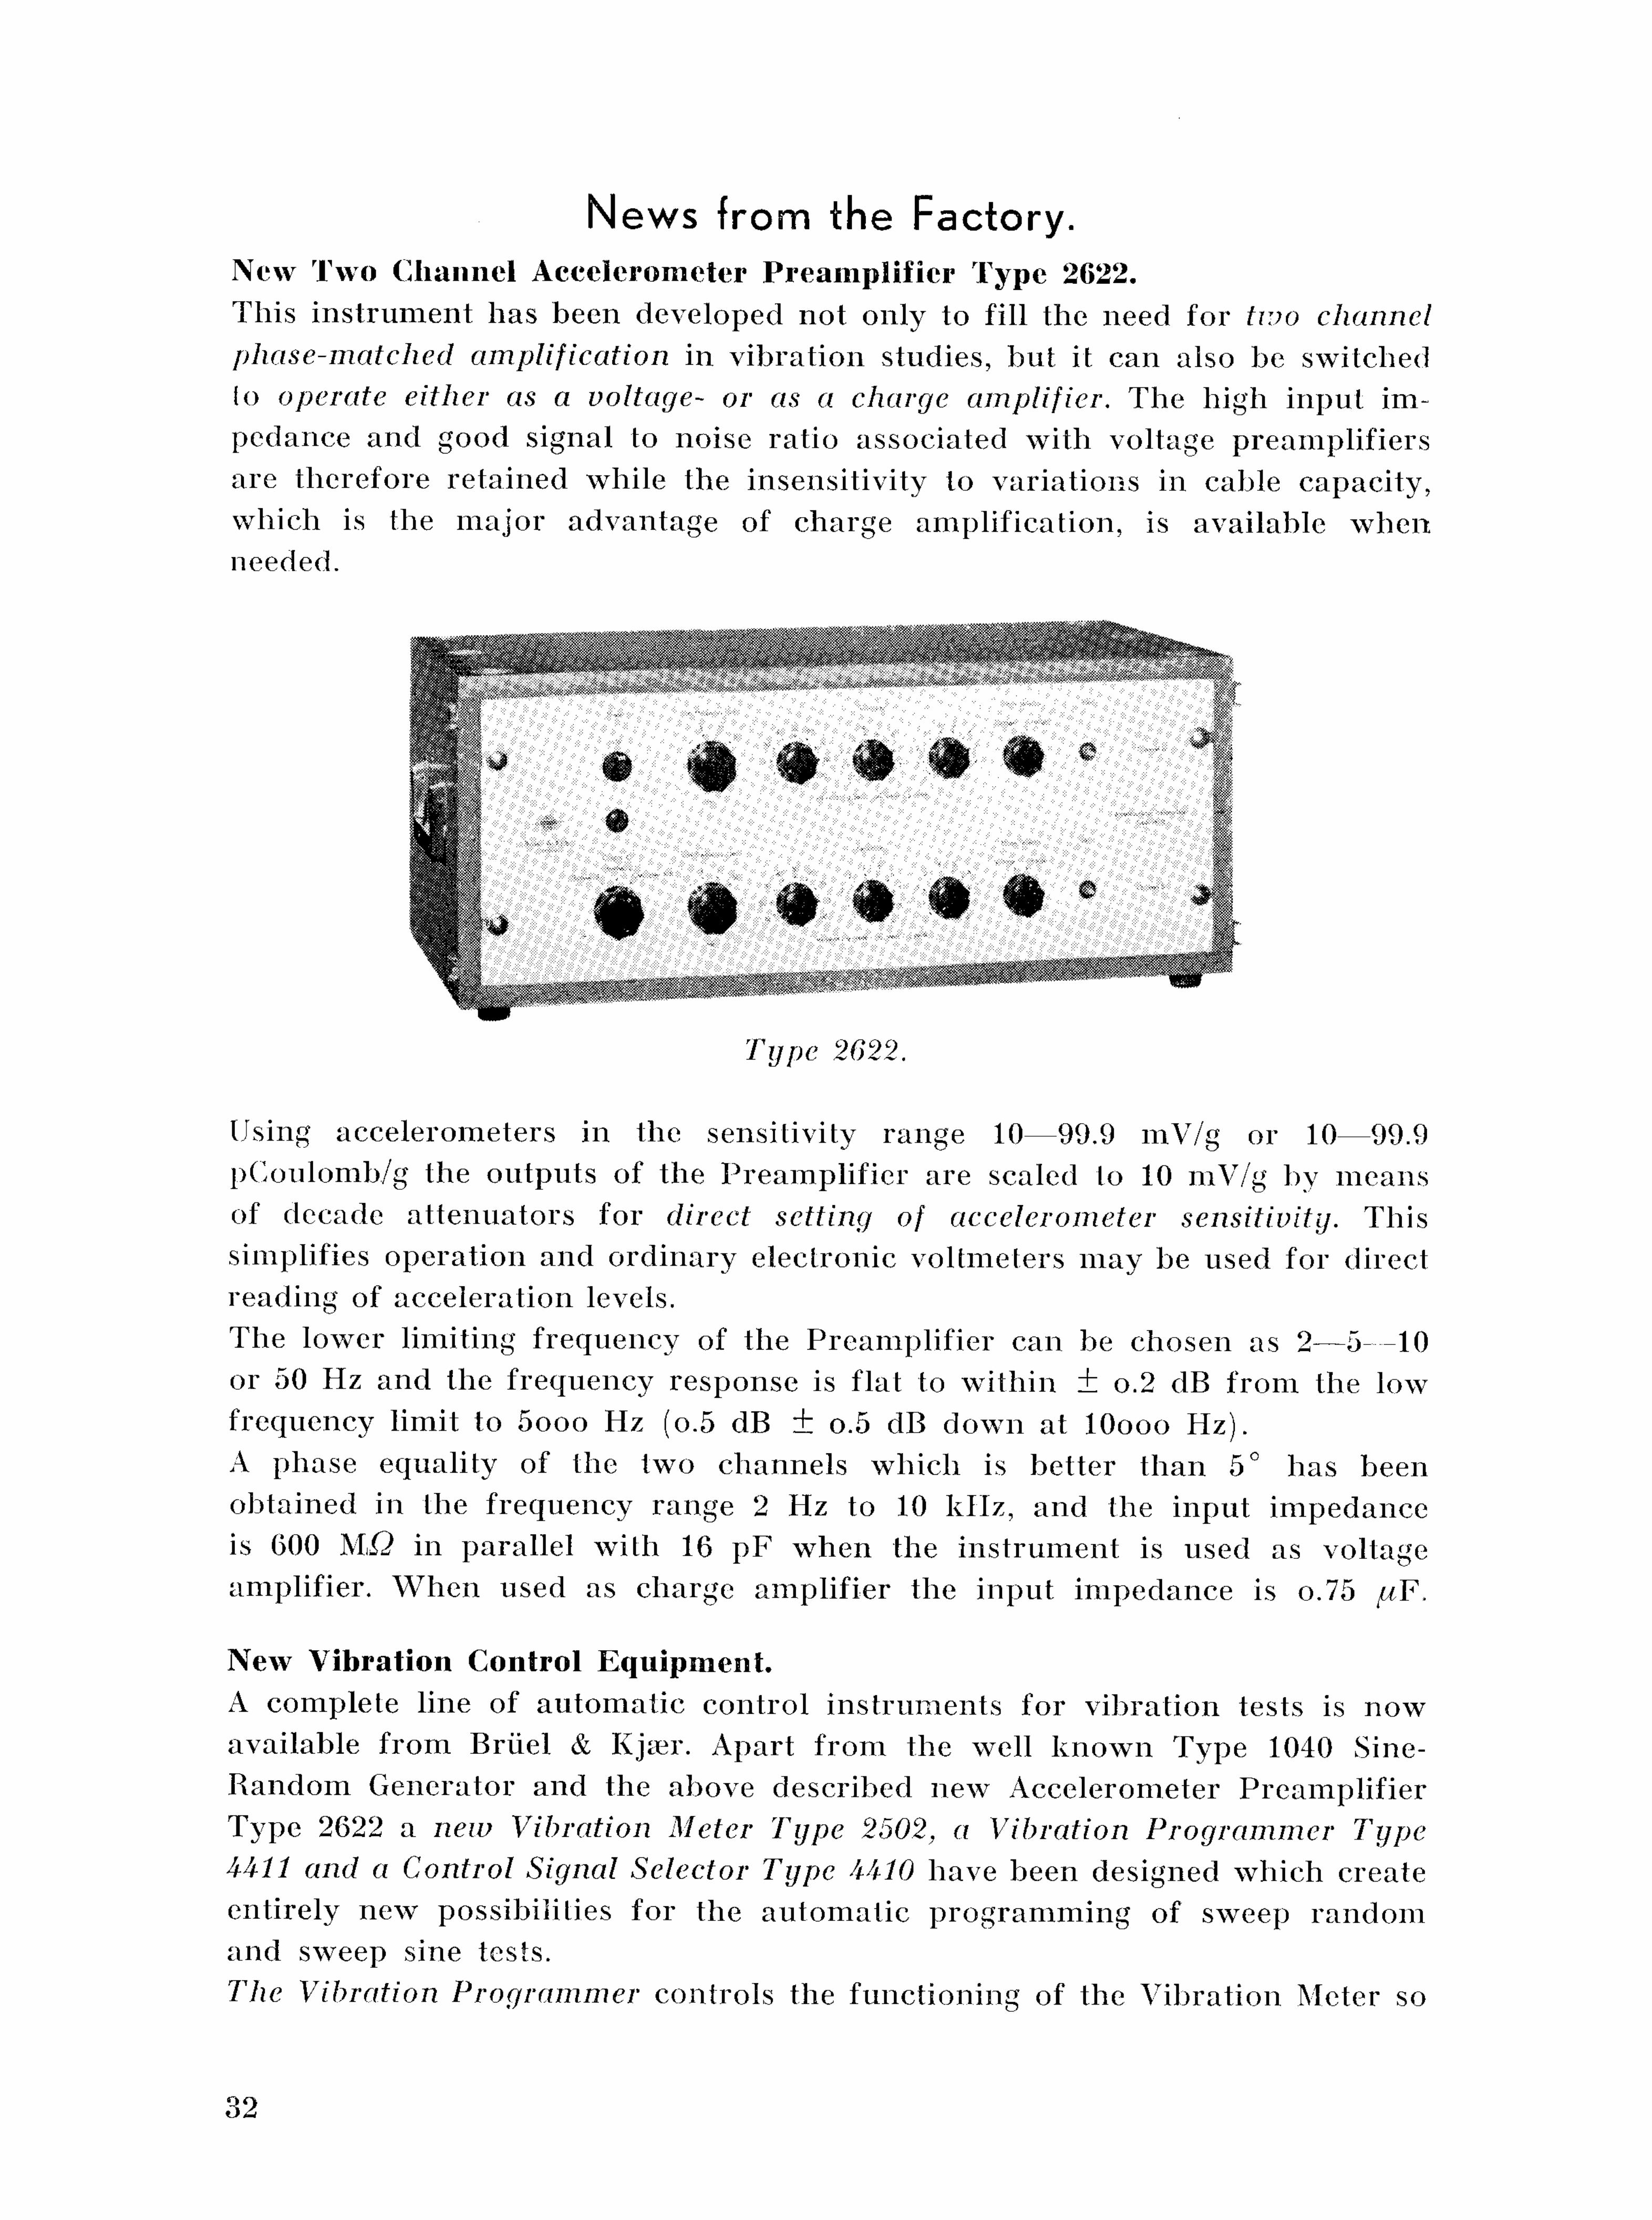
News from the Factory. New Two Channel Accelerometer Preamplifier Type 2622. This instrument has been developed not only to fill the need for two channel phase-matched amplification in vibration studies, but it can also be switched lo operate either as a voltage- or as a charge amplifier. The high input impedance and good signal to noise ratio associated with voltage preamplifiers are therefore retained while the insensitivity to variations in cable capacity, which is the major advantage of charge amplification, is available when needed.
Type 2622.
Using accelerometers in the sensitivity range 10—99.9 mV/g or 10—99.9 pCoulomb/g the outputs of the Preamplifier are scaled lo 10 mV/g by means of decade at tenuators for direct setting of accelerometer sensitivity. This simplifies operation and ordinary electronic voltmeters may be used for direct reading of acceleration levels. The lower limiting frequency of the Preamplifier can be chosen as 2 — 5 - 1 0 or 50 Hz and the frequency response is flat to within ± o.2 dB from the low frequency limit to 5ooo Hz (o.5 dB ± o.5 dB down at lOooo Hz). A phase equality of the two channels which is better than 5° has been obtained in the frequency range 2 Hz to 10 kHz, and the input impedance is GOO MQ in parallel with 16 p F when the instrument is used as voltage amplifier. When used as charge amplifier the input impedance is o.75 /^F.
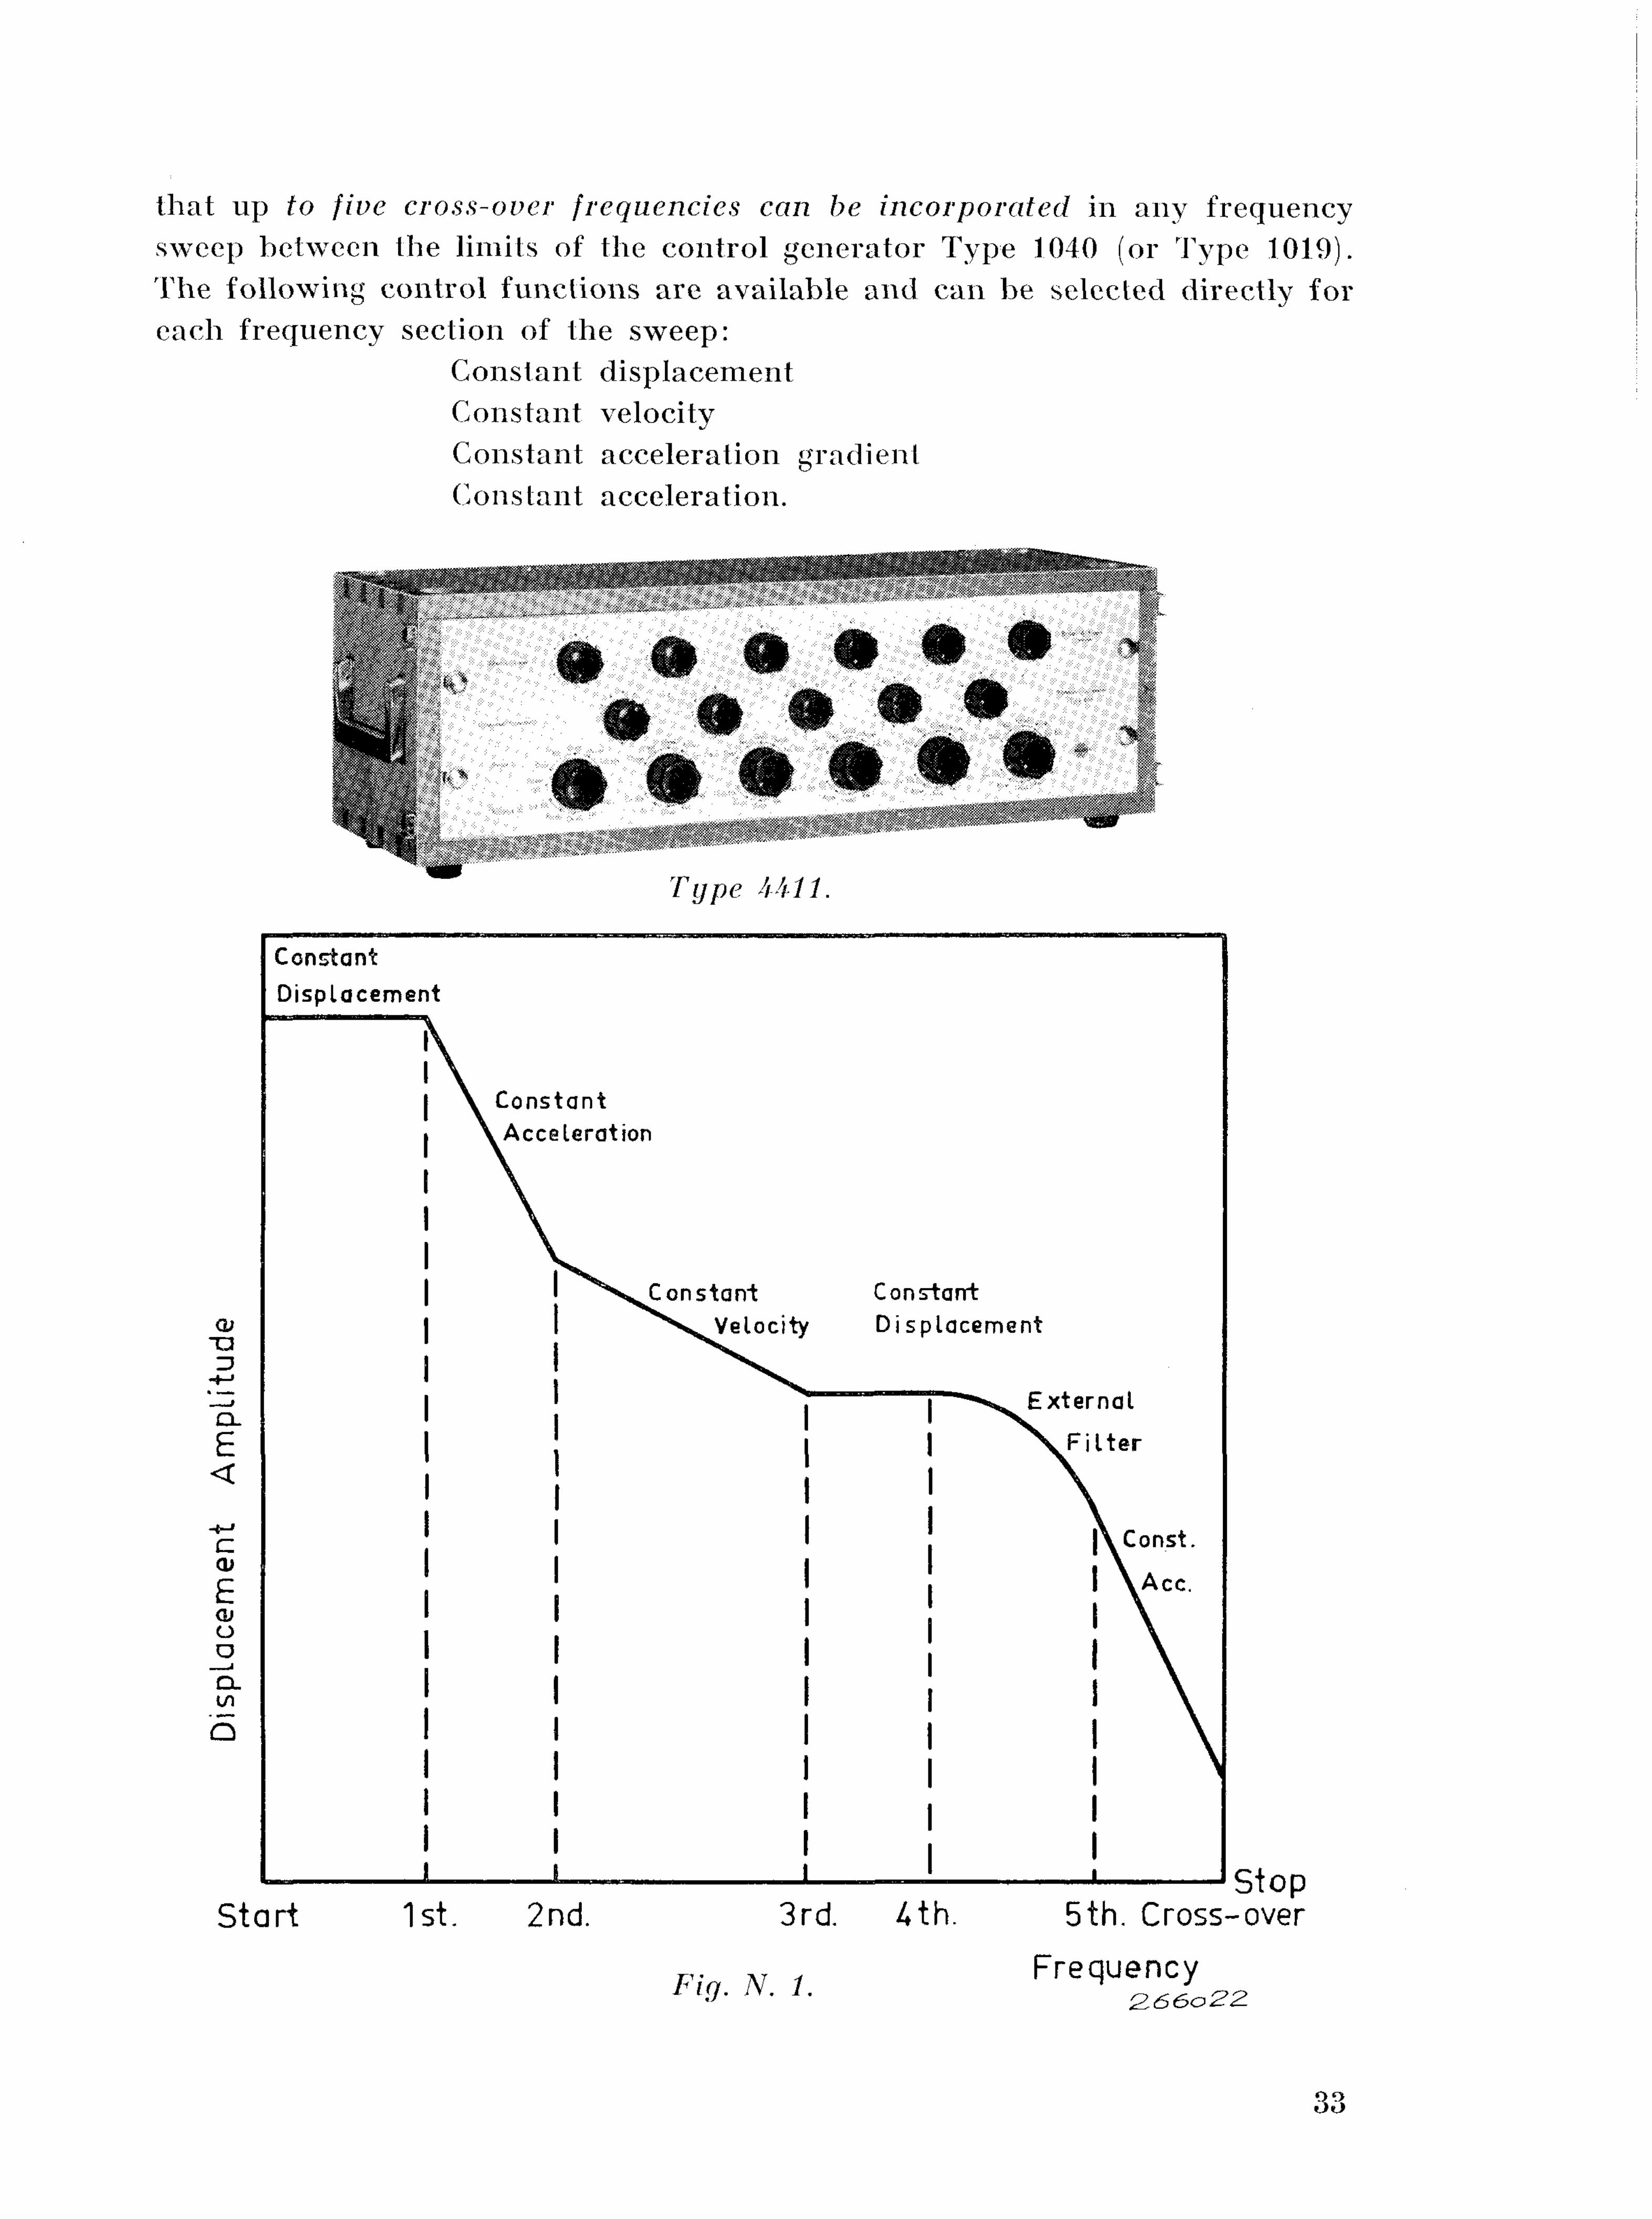
New Vibration Control Equipment. A complete line of automatic control instruments for vibration tests is now available from Briiel & Kjaer. Apart from the well known Type 1040 Sine-Random Generator and the above described new Accelerometer Preamplifier Type 2622 a new Vibration Meter Type 2502, a Vibration Programmer Type 4411 and a Control Signal Selector Type 4410 have been designed which create entirely new possibilities for the automatic programming of sweep random and sweep sine tests.
The Vibration Programmer controls the functioning of the Vibration Meter so
32
I
tha t up to five cross-over frequencies can be incorporated in any frequency r
sweep between the limits of the control generator Type 1040 (or Type 1019). The following control functions are available and can be selected directly for each frequency section of the sweep:
Constant displacement Constant velocity Constant acceleration gradient Constant acceleration.
Fig. N. 1.
33
Furthermore provision has been made for the use of external filters whereby * _ ■ ■ ■
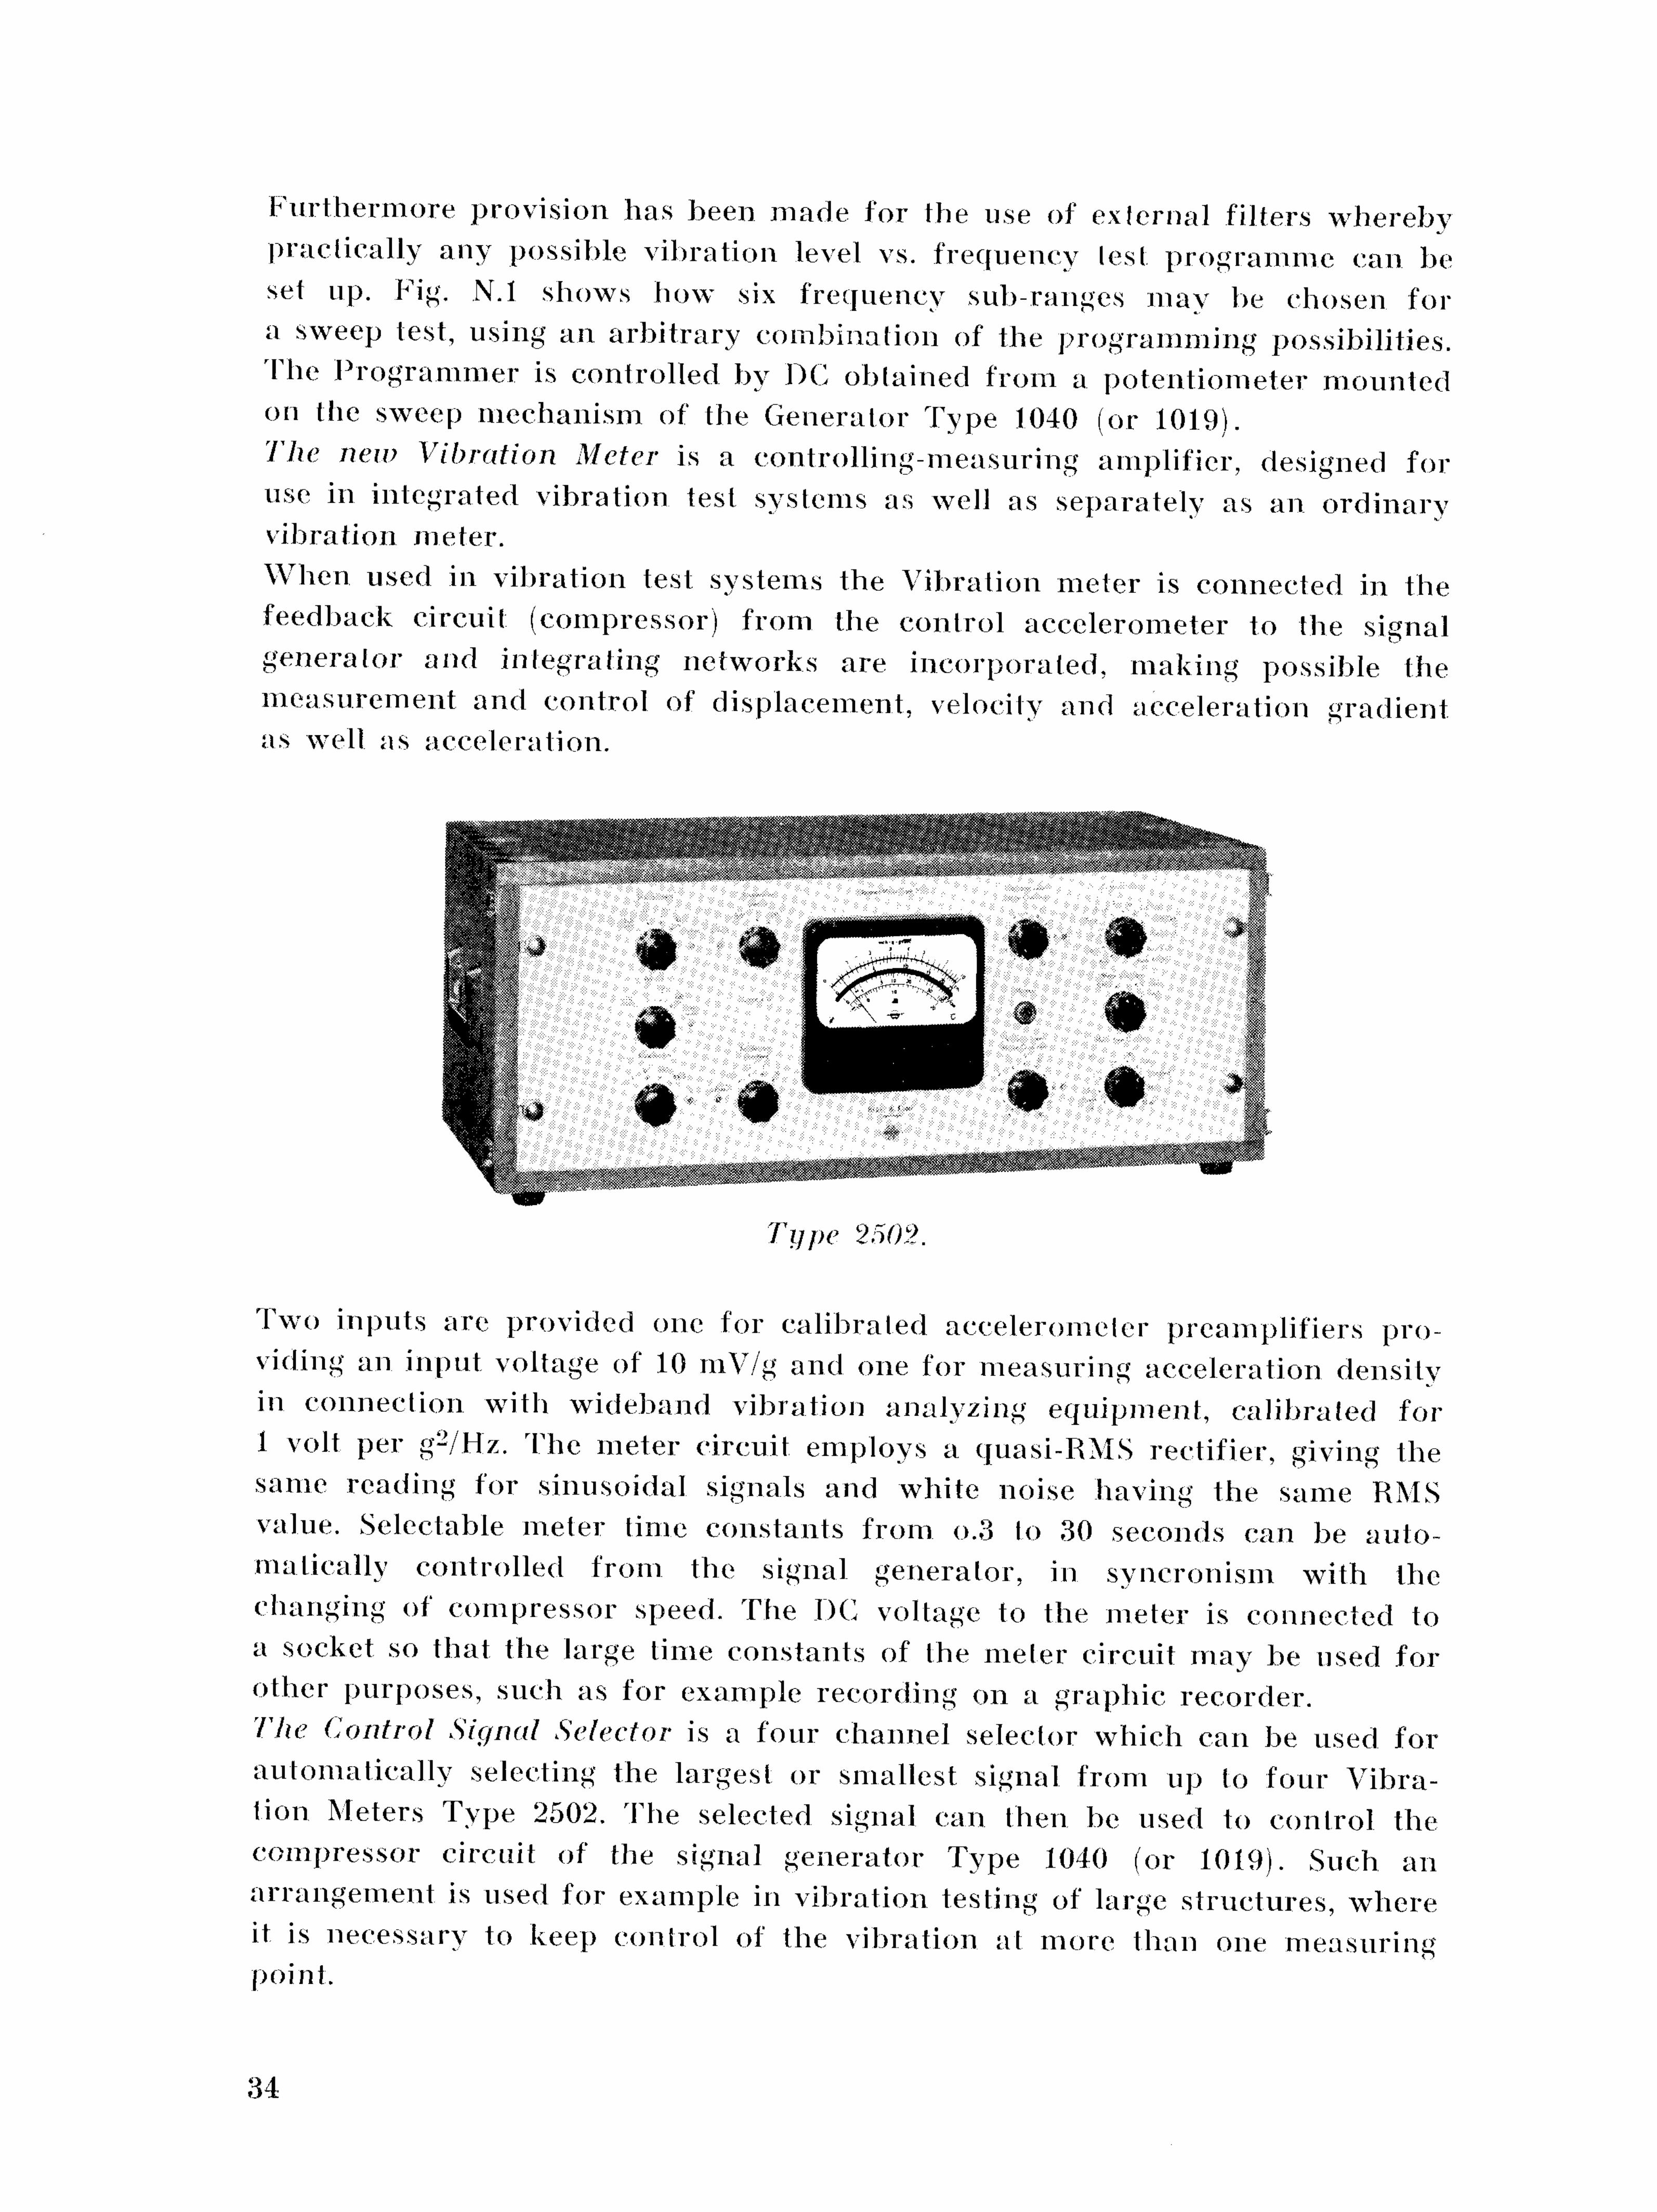
practically any possible vibration level vs. frequency lest programme can be set up. Fig. N.l shows how six frequency sub-ranges may be chosen for a sweep test, using an arbitrary combination of the programming possibilities. The Programmer is controlled by DC obtained from a potentiometer mounted on the sweep mechanism of the Generator Type 1040 (or 1019). The new Vibration Meter is a controlling-measuring amplifier, designed for use in integrated vibration test systems as well as separately as an ordinary vibration meter. When used in vibration test systems the Vibration meter is connected in the feedback circuit (compressor) from the control accclerometer to the signal generator and integrating networks are incorporated, making possible the measurement and control of displacement, velocity and acceleration gradient as well as acceleration.
Type 2509,
Two inputs are provided one for calibrated accelerometer preamplifiers providing an input voltage of 10 mV/g and one for measuring acceleration density
* _ ■ ■
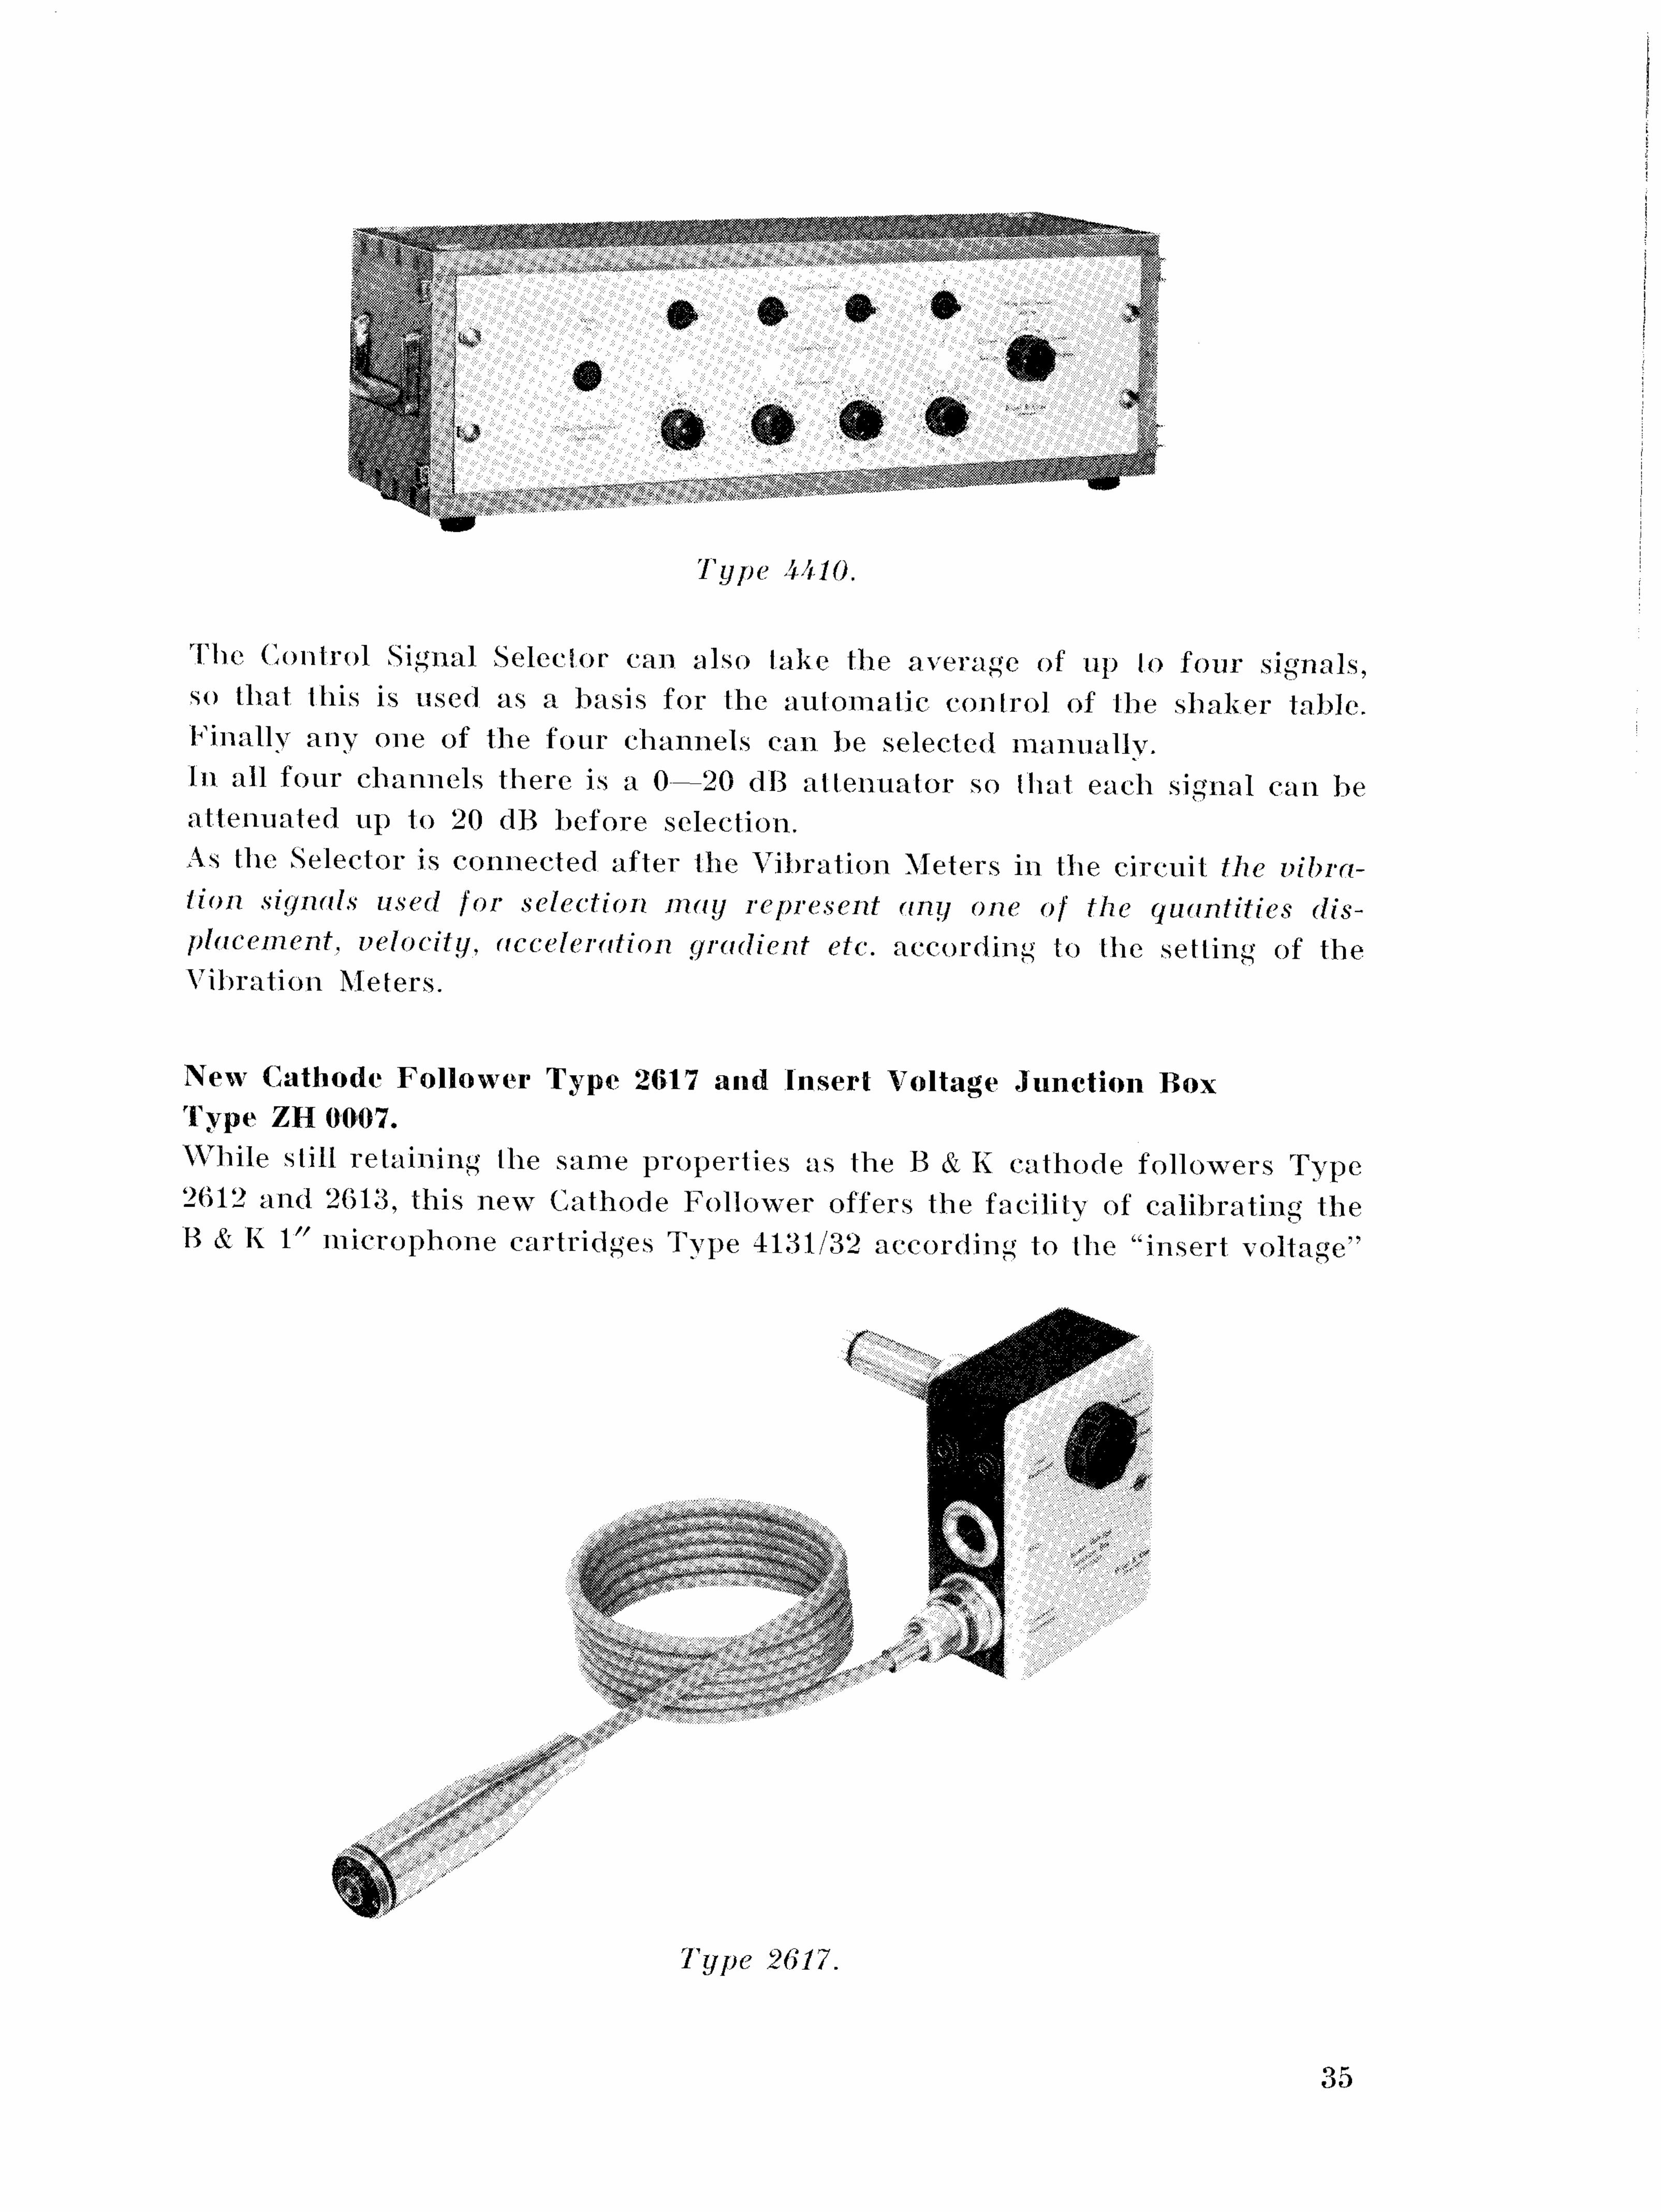
in connection with wideband vibration analyzing equipment, calibrated for 1 volt per g2/Hz. The meter circuit employs a quasi-RMS rectifier, giving the same reading for sinusoidal signals and white noise having the same RMS value. Selectable meter lime constants from o.3 to 30 seconds can be automatically controlled from the signal generator, in syncronism with the changing of compressor speed. The DC voltage to the meter is connected to a socket so that the large time constants of the meter circuit may be used for other purposes, such as for example recording on a graphic recorder. The Control Signal Selector is a four channel selector which can be used for automatically selecting the largest or smallest signal from up to four Vibration Meters Type 2502. The selected signal can then be used to control the compressor circuit of the signal generator Type 1040 (or 1019). Such an arrangement is used for example in vibration testing of large structures, where it is necessary to keep control of the vibration at more than one measuring point.
34
i
i i
1
^ a
L
1
\
I
¥ F 1 F
r
r
1
\ I I
I
I
! i I I I
j i I I I I
I I I
I
Type 4410. i
The Control Signal Selector can also take the average of up lo four signals, so that this is used as a basis for the au tomat ic con (rot of the shaker table. Finally any one of the four channels can be selected manual ly . In all four channels there is a 0—20 dB at tenuator so that each signal can be at tenuated up to 20 dB before selection. As the Selector is connected after the Vibration Meters in the circuit the vibration signals used for selection may represent any one of the quantities displacement, velocity, acceleration gradient etc. according to the setting of the Vibration Meters.
New Cathode Follower Type 2617 and Insert Voltage Junction Box Type ZH 0007. While still retaining the same propert ies as the B &K cathode followers Type 2612 and 2613, this new Cathode Follower offers the facility of calibrating the B & K 1" microphone cartridges Type 4131/32 according to the "insert voltage"
Type 2617.
35
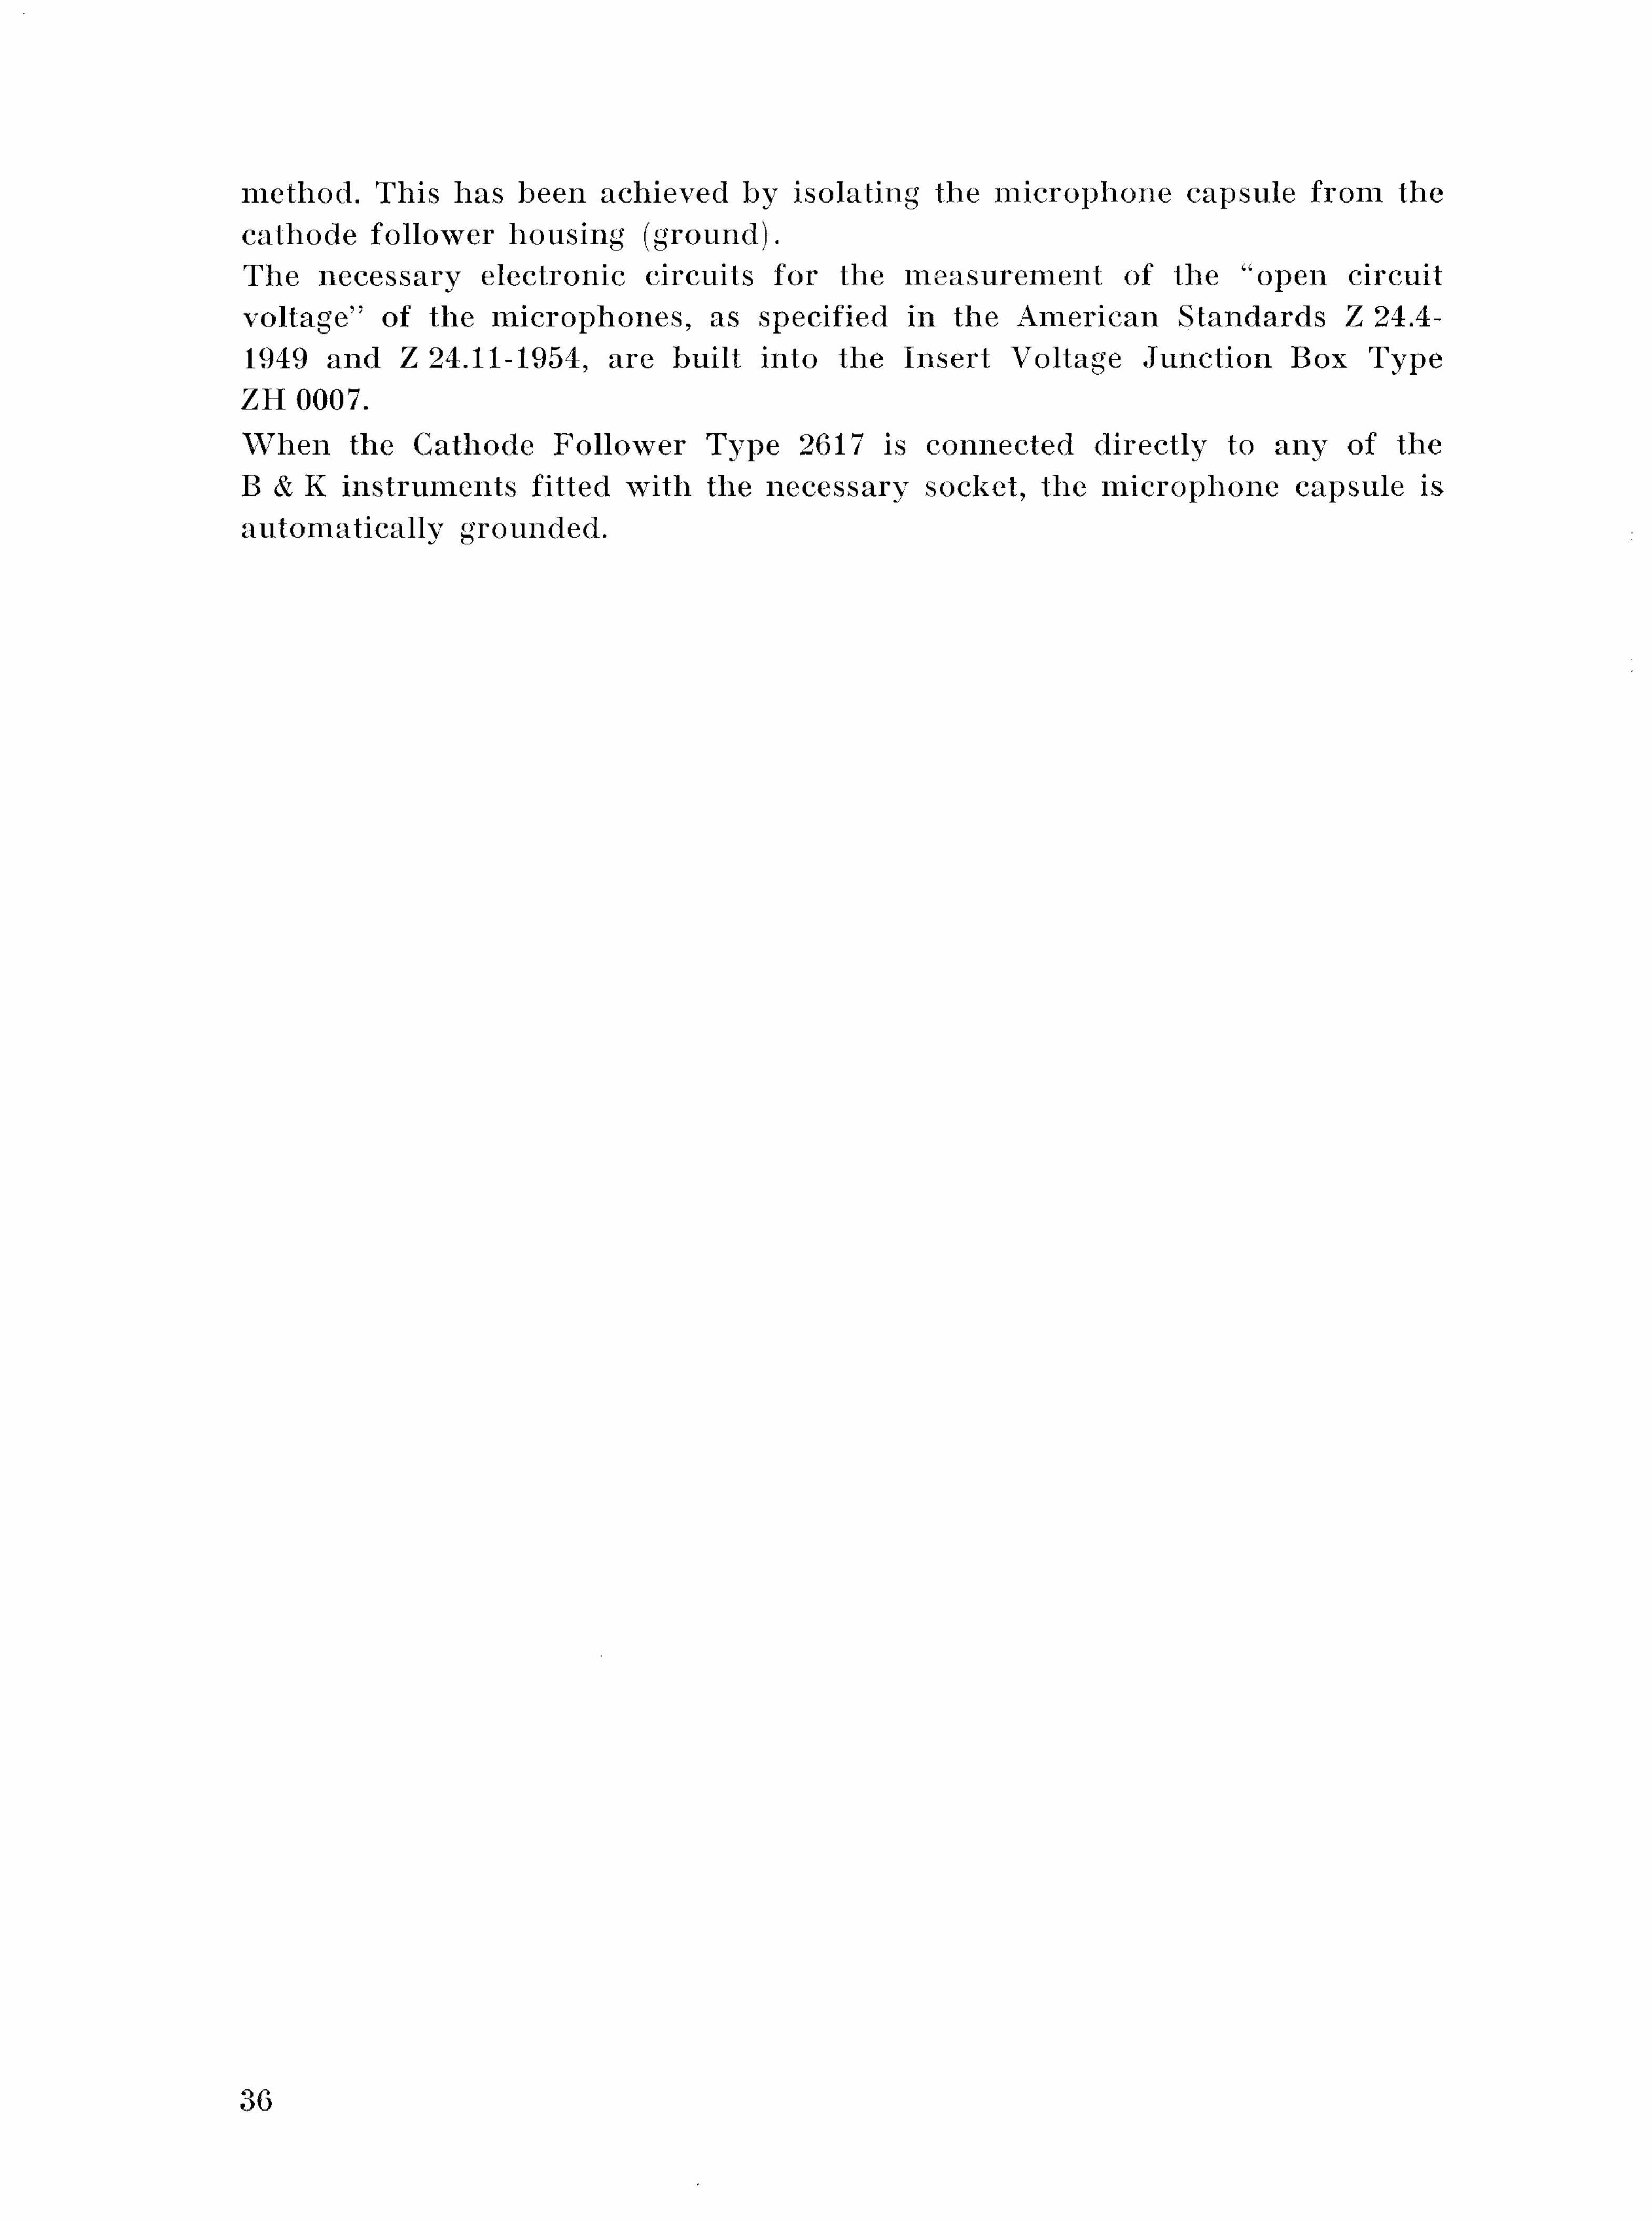
method. This has heen achieved by isolating the microphone capsule from the cathode follower housing (ground). The necessary electronic circuits for the measurement of the "open circuit voltage" of the microphones, as specified in the American Standards Z 24.4-1949 and Z 24.11-1954, are built into the Insert Voltage Junct ion Box Type ZH 0007. When the Cathode Follower Type 2617 is connected directly to any of the B & K instruments fitted with the necessary socket, the microphone capsule is automatically grounded.
36