TECHNICAL REPORT TR-2232-ENV · Printed on recycled paper TECHNICAL REPORT TR-2232-ENV COST AND...
38
Printed on recycled paper TECHNICAL REPORT TR-2232-ENV COST AND PERFORMANCE REPORT USE OF PREPUMP SEPARATION TECHNOLOGIES TO ENHANCE COST-EFFECTIVENESS OF BIOSLURPER SYSTEMS: LONG TERM DEMONSTRATION by Naval Facilities Engineering Service Center Battelle December 2003 Approved for public release; distribution is unlimited. ENGINEERING SERVICE CENTER Port Hueneme, California 93043-4370
Transcript of TECHNICAL REPORT TR-2232-ENV · Printed on recycled paper TECHNICAL REPORT TR-2232-ENV COST AND...

Printed on recycled paper
TECHNICAL REPORT
TR-2232-ENV COST AND PERFORMANCE REPORT USE OF PREPUMP SEPARATION TECHNOLOGIES TO ENHANCE COST-EFFECTIVENESS OF BIOSLURPER SYSTEMS: LONG TERM DEMONSTRATION by Naval Facilities Engineering Service Center Battelle December 2003
Approved for public release; distribution is unlimited.
ENGINEERING SERVICE CENTERPort Hueneme, California 93043-4370

REPORT DOCUMENTATION PAGE Form Approved OMB No. 0704-0811
The public reporting burden for this collection of information is estimated to average 1 hour per response, including the time for reviewing instructions, searching existing data sources, gathering and maintaining the data needed, and completing and reviewing the collection of information. Send comments regarding this burden estimate or any other aspect of this collection of information, including suggestions for reducing the burden to Department of Defense, Washington Headquarters Services, Directorate for Information Operations and Reports (0704-0188), 1215 Jefferson Davis Highway, Suite 1204, Arlington, VA 22202-4302. Respondents should be aware that notwithstanding any other provision of law, no person shall be subject to any penalty for failing to comply with a collection of information, it if does not display a currently valid OMB control number.
PLEASE DO NOT RETURN YOUR FORM TO THE ABOVE ADDRESS. 1. REPORT DATE (DD-MM-YYYY) 2. REPORT TYPE 3. DATES COVERED (From – To)
December 2003 Final 4. TITLE AND SUBTITLE 5a. CONTRACT NUMBER
5b. GRANT NUMBER
5c. PROGRAM ELEMENT NUMBER
COST AND PERFORMANCE REPORT USE OF PREPUMP SEPARATION TECHNOLOGIES TO ENHANCE COST-EFFECTIVENESS OF BIOSLURPER SYSTEMS: LONG TERM DEMONSTRATION
6. AUTHOR(S) 5d. PROJECT NUMBER
5e. TASK NUMBER
5f. WORK UNIT NUMBER
Naval Facilities Engineering Service Center Battelle
7. PERFORMING ORGANIZATION NAME(S) AND ADDRESSES 8. PERFORMING ORGANIZATION REPORT NUMBER
Commanding Officer Naval Facilities Engineering Service Center 1100 23rd Avenue Port Hueneme, CA 93043
TR-2232-ENV
9. SPONSORING/MONITORING AGENCY NAME(S) AND ADDRESS(ES) 10. SPONSOR/MONITORS ACRONYM(S)
11. SPONSOR/MONITOR’S REPORT NUMBER(S)
Environmental Security Technology Certification Program 901 North Stuart Street, Suite 303 Arlington, VA 22203
12. DISTRIBUTION/AVAILABILITY STATEMENT
Approved for public release; distribution is unlimited
13. SUPPLEMENTARY NOTES
14. ABSTRACT
Bioslurping is a demonstrated technology for removing light, nonaqueous-phase liquid (LNAPL) from contaminated aquifers. It combines vacuum-assisted LNAPL recovery with bioventing and soil vapor extraction (SVE) to simultaneously recover LNAPL and bioremediate the vadose zone. A conventional bioslurper system withdraws free-phase LNAPL from the water table, groundwater, and soil vapor in a single process stream, using the air lift created by an aboveground liquid ring pump. The recovered LNAPL is separated from the groundwater and may be recycled. The recovered groundwater and soil vapor usually are treated and discharged. Because bioslurping enhances LNAPL recovery in comparison to conventional skimming and pump-drawdown technologies, bioslurping potentially can save the U.S. Department of Defense (DoD) significant funds by reducing the amount of time required to remediate LNAPL-contaminated sites.
15. SUBJECT TERMS
Light, nonaqueous-phase liquid; LNAPL; bioslurping; bioventing; groundwater; bioremediate
16. SECURITY CLASSIFICATION OF: 19a. NAME OF RESPONSIBLE PERSON a. REPORT b. ABSTRACT c. THIS PAGE
17. LIMITATION OF ABSTRACT
18. NUMBER OF PAGES
19b. TELEPHONE NUMBER (include area code) U U U U 38
Standard Form 298 (Rev. 8/98) Prescribed by ANSI Std. Z39.18

ii
Table of Contents
Acronyms and Abbreviations ........................................................................................................ iv 1. Executive Summary ....................................................................................................................1 2. Technology Description..............................................................................................................3
2.1 Technology Development and Application....................................................................... 3 2.1.1 Conventional Bioslurping Process.......................................................................... 3 2.1.2 Previous Emulsion Treatment/Control Attempts.................................................... 3 2.1.3 Prepump Separation (Technologies used during the Demonstrations)................... 3
2.2 Process Description ........................................................................................................... 6 2.3 Previous Testing of Technology........................................................................................ 7 2.4 Advantages and Limitations of the Technology.............................................................. 11
2.4.1 Conventional Bioslurping Process........................................................................ 11 2.4.2 Prepump Separation .............................................................................................. 11
3. Demonstration Design ..............................................................................................................12
3.1 Performance Objectives................................................................................................... 12 3.2 Selection of Test Site....................................................................................................... 12 3.3 Test Facility History Characteristics ............................................................................... 12 3.4 Site Characteristics .......................................................................................................... 13 3.5 Physical Setup and Operation.......................................................................................... 14
3.5.1 Measurement of Baseline Parameters................................................................... 14 3.5.2 System Performance Parameters........................................................................... 14
3.6 Long-Term Test Sequence............................................................................................... 16 4. Performance Assessment ..........................................................................................................18
4.1 Performance Data ............................................................................................................ 18 4.2 Performance Criteria........................................................................................................ 19 4.3 Data Assessment.............................................................................................................. 20 4.4 Technology Comparison.................................................................................................. 21
5. Cost Assessment .......................................................................................................................22 6. Implementation Issues ..............................................................................................................30
6.1 Cost Observations............................................................................................................ 30 6.2 Performance Observations............................................................................................... 30 6.3 Scale-Up .......................................................................................................................... 30 6.4 Other Significant Observations ....................................................................................... 31 6.5 Lessons Learned .............................................................................................................. 31 6.6 End-User Issues ............................................................................................................... 31 6.7 Approach to Regulatory Compliance and Acceptance.................................................... 31
7. References.................................................................................................................................32

iii
Figures Figure 2-1. Vacuum-Resistant Separator........................................................................................5 Figure 2-2. In-Well Separation Design...........................................................................................6 Figure 3-1. New Fuel Farm (Site 2) is Located in the Northwestern Portion of NAS Fallon ......13
Tables Table 3-1. Sampling Schedule During Each Test.........................................................................15 Table 3-2. Long-Term Testing Sequence at NAS Fallon .............................................................17 Table 4-1. Operational Data for Long-Term Demonstration at NAS Fallon, NV........................19 Table 4-2. Process Water, Seal-Tank Water, and Off-Gas Analytical Summary for the
Long-Term Demonstration at NAS Fallon, NV ..........................................................20 Table 5-1. NAS Fallon, NV Long Term Demonstration Costs ....................................................23 Table 5-2. Estimated Full-Scale Implementation Costs for Conducting In-Well
Separation Bioslurping.................................................................................................25 Table 5-3. Estimated Full-Scale Implementation Costs for Conducting Bioslurping with
Manual Removal of Floating Solids ............................................................................28 Table 5-4. Estimated Full-Scale Implementation Costs for Conducting Bioslurping with
DAF Unit for Postpump Treatment .............................................................................29

iv
Acronyms and Abbreviations AFCEE U.S. Air Force Center for Environmental Excellence bgs below ground surface cfm cubic fee per minute CSS Coastal Systems Station DoD Department of Defense JP jet propulsion LNAPL light, nonaqueous-phase liquid MCBH Marine Corps Base Hawaii NAAS Naval Air Auxiliary Station NAS Naval Air Station NAWC Naval Air Weapons Center NCBC Naval Construction Battalion Center NFESC Naval Facilities Engineering Service Center NPDES National Pollutant Discharge Elimination System OWS oil/water separator ppm parts per million RPM remedial project manager SVE soil vapor extraction TPH total petroleum hydrocarbons USAF United States Air Force USDA United States Department of Agriculture VOA volatile organic analysis VOC volatile organic compound
Acknowledgements
Several individuals and organizations were instrumental in the success of this project.
• Ron Hoeppel, Naval Facilities Engineering Service Center (NFESC), for project management and coordination.
• Matt Place, Sarah McCall, Travis Williamson, Chris Coonfare and Abraham Chen,
Battelle Memorial Institute, and Roger Johnson, a Battelle subcontractor, for overall systems design, technical and field support, and interpreting the results of the field demonstrations.
• Tanwir Chaudhry, Intergraph Corporation, for technical and field support.
• John Spivey, Air Force Research Laboratory, Tyndall AFB, for Air Force site
coordination and technology transfer. The authors also wish to thank the following individuals for their exceptional support during field demonstrations at their activities:
• Art Fisher, NAS Fallon, NV (NAS Fallon demonstrations and leveraging) • Ken Spielman, NAVFACENGCOM West Engineering Field Activity (NFD Point
Molate, CA demonstration and leveraging) • Michelle Sondrup, NAVFACENGCOM Southwest Engineering Field Division (NFD
Point Molate demonstration) • Bill Grannis, Hickam AFB, HI (Hickam AFB demonstration and leveraging) • Jim McDonald, NAWC China Lake, CA (NAWC China Lake demonstration) • Joe McLernan, Tyndall AFB, FL (Tyndall AFB demonstration) • Agnes Peters, Bolling AFB, Washington D.C. (Bolling AFB demonstration) • John Mayhew, NAVFACENGCOM North Engineering Field Activity (NCBC
Davisville, RI demonstration) • John Meyers, MCAS Cherry Point, NC (MCAS Cherry Point demonstration)
1
1. Executive Summary
Bioslurping is a demonstrated technology for removing light, nonaqueous-phase liquid (LNAPL) from contaminated aquifers. It combines vacuum-assisted LNAPL recovery with bioventing and soil vapor extraction (SVE) to simultaneously recover LNAPL and bioremediate the vadose zone. A conventional bioslurper system withdraws free-phase LNAPL from the water table, groundwater, and soil vapor in a single process stream, using the air lift created by an aboveground liquid ring pump. The recovered LNAPL is separated from the groundwater and may be recycled. The recovered groundwater and soil vapor usually are treated and discharged. Because bioslurping enhances LNAPL recovery in comparison to conventional skimming and pump-drawdown technologies (Place, et al., 2001), bioslurping potentially can save the U.S. Department of Defense (DoD) significant funds by reducing the amount of time required to remediate LNAPL-contaminated sites. At many sites, the operation of the conventional bioslurper technology results in the formation of floating solids and stable emulsions, thereby creating significant water treatment and waste handling problems. The floating solids observed at many bioslurper sites appear as a foamy mass floating at the LNAPL/water interface in an oil/water separator (OWS). The floating solids are a mixture of extracted LNAPL, groundwater, soil gas, and sediment collected as part of the system process stream. The stable emulsions are suspended droplets of petroleum hydrocarbons in groundwater, which give the bioslurper process water a milky appearance. These emulsions may be produced during the mixing action of the liquid ring pump or from the slurping action within extraction wells. The floating solids and emulsions are relatively stable, and reduce the effectiveness of conventional gravity-driven OWSs. The emulsified materials may require costly downstream treatment, making full-scale implementation of the bioslurper technology less attractive. In addition, the bioslurping action volatilizes the LNAPL and increases the petroleum hydrocarbon concentrations in the off-gas stream from the system. Several system modifications have been attempted by Battelle, the U.S. Navy, and/or the U.S. Air Force (USAF) to mitigate the problems associated with the floating solids and emulsions before the extracted mixtures enter the liquid ring pump. The most promising modifications are the use of dual drop tubes for in-well separation of LNAPL from water (i.e., extracting LNAPL and water in two separate streams), and the use of a prepump separator (i.e., an aboveground knockout tank) to separate LNAPL from the liquid stream prior to the entry of the stream into the liquid ring vacuum pump. In addition to reducing the production of emulsions, removal of LNAPL from the process stream before the LNAPL encounters the turbulent conditions in the liquid ring pump reduces the emission of petroleum vapors by the bioslurping process. The goal of this project was to quantify the cost effectiveness of prepump LNAPL separation methods in controlling effluent emulsion formation and reducing the concentrations of petroleum hydrocarbons in the aqueous and off-gas streams from the bioslurper. The bioslurper system was operated in both short-term, single-well demonstrations and in a long-term, multiple-well demonstration to generate operational and cost data. Both in-well and aboveground prepump (knockout tank) separation were evaluated during the short-term and long-term demonstrations.

2
The cleanup of LNAPL-contaminated sites usually is driven by state or local limits on the LNAPL thickness on the water table and/or by regulations requiring the removal of LNAPL “to the extent practicable” in order to eliminate it as a potential source for groundwater and soil contamination. LNAPL removal also may be governed by human health or ecological risk-based cleanup goals. Conventional bioslurping has been used successfully to remove LNAPL from contaminated sites, and generally is accepted by regulatory agencies as the preferred method of LNAPL removal. Other regulations that potentially can apply to the use of prepump oil/water separation are con-taminant concentrations and contaminant loadings in process water and vapor discharge streams. Applicable discharge limits may be imposed by Base or municipal wastewater treatment plants, National Pollutant Discharge Elimination System (NPDES) permits, or state or local water and air quality boards. The development of prepump separation modifications was motivated primarily by these discharge requirements, as the removal of LNAPL from the process stream prior to entering the liquid ring pump would reduce contaminant concentrations in both aqueous and vapor discharge streams. The effectiveness of the two prepump separation methods was evaluated by comparing analytical results of the aqueous and vapor discharge samples collected before and after the incorporation of each method. Aqueous samples were analyzed for total petroleum hydrocarbons (TPH) and volatile organic compounds (VOCs) at a few sites. The volume of floating solids produced during the bioslurper operation was measured using graduated cylinders or drums. Qualitative judgments on the effectiveness of prepump separation were based on observations of the amount of floating solids present in the process water, and on the clarity of the aqueous discharge. Handheld TPH meters were used for routine field determinations of TPH concentrations in the vapor discharge. In addition, samples of the vapor discharge were collected using a Summa canister, and the TPH concentration was determined via laboratory analysis. The results have shown that the dual drop tube configuration is very effective at reducing the TPH concentrations in the aqueous and vapor effluent. It has also shown almost complete elimination of floating solids. At NCBC Davisville, the water samples were taken after the oil/water separator, which skewed the results. No reduction was shown in the effluent water, which we believe is partly due to the sampling location. At the other seven sites, the TPH concentration of the seal-tank water was reduced by 98% compared to a conventional bioslurper. The dual drop tube configuration works moderately well in reducing the TPH concentration of the off-gas. The average reduction at the eight sites in the TPH concentration of the off-gas was 37% compared to a conventional bioslurper. The dual drop tube configuration seems to work better at reducing the TPH concentration of the off-gas with the higher volatility fuel. The dual drop tube and knockout tank configurations did not affect the recovery of the LNAPL relative to operation in the conventional configuration. In general, the LNAPL recovery rates decreased throughout the demonstration, but did not significantly decrease when operating in the dual drop tube configuration. In addition, the dual drop tube configuration did not appear to alter the groundwater recovery rate.

3
2. Technology Description 2.1 Technology Development and Application This section describes the conventional bioslurper process, previous attempts to control/treat emulsion, and the development of the prepump separation technologies that were used during this demonstration. 2.1.1 Conventional Bioslurping Process. The bioslurping process combines vacuum-assisted LNAPL recovery with bioventing and SVE to simultaneously recover LNAPL and bioremediate the vadose zone. The process has been shown to improve LNAPL recovery efficiency compared to other recovery technologies (Battelle, 1997). The conventional system uses a single drop tube in each of the extraction wells to “slurp” LNAPL, groundwater, and soil gas. The system may pull a vacuum of up to 25 ft of water on the recovery wells in order to create the pressure gradient required to force movement of LNAPL into the wells. The system is operated to minimize drawdown of the water table, thus reducing the further creation of LNAPL smear zones. Preliminary data from short-term pilot tests performed by Battelle for the Naval Facilities Engineering Service Center (NFESC) and the Air Force Center for Environmental Excellence (AFCEE) indicate that the LNAPL recovery rate achieved through bioslurping is up to six times greater than attainable through skimming and drawdown pumping. Mathematical modeling of drawdown pumping and bioslurping (Parker, 1995) predicts that bioslurping will remove free product three times faster than with drawdown pumping, while withdrawing seven times less groundwater. A preliminary analysis of the available data indicates that bioslurping is a cost-effective technol-ogy for LNAPL recovery, with the benefit of simultaneous bioremediation of the vadose zone (Battelle, 1997). The process has been applied at sites with groundwater tables up to 210 ft below ground surface (bgs). Sites with deeper groundwater tables also may be managed after adjustments of some system components. A more detailed description of the bioslurping process can be found in Principles and Practices of Bioslurping (Place, et al., 2001 ). 2.1.2 Previous Emulsion Treatment/Control Attempts. Although conventional bioslurping has been demonstrated to be more effective at LANPL recovery than traditional technologies, the simultaneous extraction of LNAPL, groundwater, and soil gas in the same process stream results in the production of floating solids and emulsions. Several technologies have been tested to treat or control the emulsions and floating solids that are formed. In early attempts, emulsions and floating solids were allowed to separate in several settling tanks that were added between the conventional OWS and the final discharge point (such as a sanitary sewer). This method, however, not only failed to remove the floating solids from the process stream, but also significantly increased waste handling problems because the floating solids and LNAPL were carried over from the OWS to all downstream settling tanks. Further, this technique had limited ability to separate the stable emulsions from the process stream. 2.1.3 Prepump Separation (Technologies used during the Demonstrations). Prepump separation of LNAPL prevents the formation of emulsions and floating solids in the bioslurper

4
process effluent, thus minimizing/eliminating the need for downstream water treatment before disposal. An additional benefit of the prepump separation is the decreased contaminant concentrations in the process off-gas discharge. Several prepump separation methods have been developed and demonstrated by Battelle, the Navy, and ESTCP. The most promising methods include the use of dual drop tubes for in-well separation of LNAPL from water and soil gas (i.e., extracting LNAPL and water/soil gas in two separate streams), and the use of a prepump knockout tank to separate LNAPL from the liquid stream prior to the entry of the stream into the liquid ring pump. The knockout tanks have been modified to eliminate an initially devised level-control device (common to most commercial knockout tank designs), thus simplifying the operation of the tanks. This modification improved the separation capability of the tanks and significantly minimized the operation and maintenance (O&M) requirements. The extracted LNAPL, groundwater, and soil gas from the extraction manifold enter the tank through a tee located above the LNAPL level in the tank (Figure 2-1). The top section of the tee allows soil gas to vent into the top one-third portion of the tank. The bottom section of the tee extends about 0.5 to 1 ft below the water level and allows LNAPL and groundwater to drain into the bottom two-thirds portion of the tank. The liquid level is maintained by the location of a tee fitting on the effluent side of the tank. Soil gas exits the tank via a pipe located near the top of the tank. Groundwater exits through a similar pipe located near the bottom of the tank. The soil-gas and groundwater streams meet at the tee fitting before being vacuumed into the liquid ring pump. The LNAPL that accumulates in the tank overflows a weir into a fuel storage tank that also is maintained under vacuum. The LNAPL may be manually drained (if the LNAPL-recovery rate is relatively low) from the fuel storage tank and transferred to a large LNAPL storage tank. Field demonstrations indicate that the use of a knockout tank can control the formation of emulsions and floating solids and decrease TPH concentrations in the liquid ring pump stack gas and effluent water. The use of an in-well separation configuration placed in front of the liquid ring pump also significantly reduces the formation of stable emulsions and floating solids. This method prevents mixing of LNAPL and groundwater during the slurping action in the extraction manifold, thereby minimizing/eliminating the potential formation of emulsions and floating solids. Similar to the conventional single drop tube configuration, the pressure gradient induced by the vacuum draws LNAPL, groundwater, and soil gas to the extraction wells. However, LNAPL is removed from the wells via one drop tube while groundwater and soil gas are removed via the other (Figure 2-2). The drop tube that extracts groundwater and soil gas is guarded by a shield. This arrangement allows groundwater to be drawn through the bottom of the shield and soil gas through the top. The drop tube that extracts LNAPL is located outside the shield, with the opening of the tube generally placed approximately 0.25 inch above the oil/water interface. The recovered groundwater and soil gas enter the liquid ring pump. The groundwater then exits the pump to the OWS, and the soil gas exits the pump out of a stack. The recovered LNAPL, drawn to the surface by the bioslurper vacuum pump, is captured in a separate tank (under vacuum) for temporary storage. Because the mixing between LNAPL and groundwater is minimized in the extraction manifold, downstream treatment of groundwater may not be required before final discharge.

5
Figure 2-1. Vacuum-Resistant Separator

6
Figure 2-2. In-Well Separation Design
2.2 Process Description The theory of the technologies is provided in Section 2.1, and summarizes the similarity between the operation of the conventional bioslurper and the use of the bioslurper with the prepump separation technologies The addition of the prepump separation systems does not significantly increase the mobilization, installation or operational requirements over the conventional bioslurper technology. Once the prepump systems are constructed, they only need to be connected to the bioslurper system. The in-well separation system does, however, require the addition of another extraction manifold for LNAPL removal. This additional manifold only slightly increases the labor and materials cost for installation. Once the in-well separation system is installed, slightly more frequent monitoring and adjustment of the drop tubes may be required compared to the conventional bioslurper to maximize the in-well separation system

7
operation. Again, this additional labor is only slightly greater than conventional operation (as presented in Section 5). The key design parameters for the operation of the prepump separation systems are the LNAPL contaminated area, radius of influence, LNAPL-recovery rate, groundwater-recovery rate, and soil gas recovery rate. As the overall size of the LNAPL plume increases, the size of the liquid ring vacuum pump needs to increase to provide detectable vacuum levels at the wells. The radius of influence determines the number of wells required to cover the site. Short-term demonstration data indicate that the radius of influence is equal for the conventional and prepump separation technologies. The LNAPL, groundwater, and soil gas recovery rates should be used to determine the sizes of the prepump separation equipment. 2.3 Previous Testing of Technology In the mid-1990s, systems were designed in an attempt to control the problems associated with the emulsions and floating solids produced during bioslurper activities. These systems included large-volume tanks for increased retention and separation time, tanks equipped with filter media to filter out the floating solids, and bag filters to strain the floating solids from the aqueous stream. In 1996, knockout tanks were designed by the U.S. Air Force and Battelle, which would allow for prepump separation of the oil from the liquid stream. This knockout tank was equipped with level sensors and solenoid valves to “control” the liquid levels in the tank. However, the sensors and valves did not function quickly and the liquid levels could not be controlled. In 1997, Battelle modified the knockout tanks by removing the level sensors and valves and designed the in-well oil/water separation system. The knockout tank system was tested at Naval Air Station (NAS) Fallon and Marine Corps Base Hawaii (MCBH) Kaneohe and used in full-scale operation at NAS Fallon, NAS Keflavik, and Marine Corps Base Hawaii (MCBH) Kaneohe. The short-term tests of the knockout tank indicated that the tank was effective at reducing the formation of floating solids, and decreased TPH concentrations in the bioslurper process water by 79%. The in-well separation system was tested short-term in a single well configuration at Coastal Systems Station (CSS) Panama City, MCBH Kaneohe, Naval Construction Battalion Center (NCBC) Davisville, and NAS Fallon. Tests of the in-well separation technology demonstrated that the system decreased TPH concentrations in the process water by an average of 88%. Short-term testing of both the knockout tank and in-well separation systems demonstrated that both systems would reduced the formation of the floating solids and minimize operation and maintenance efforts. For the ESTCP-funded, short – term demonstrations, the prepump separation systems were tested at eight sites to determine the efficiency of the systems to reduce the petroleum hydrocarbons in the aqueous and vapor streams and reduce the production of floating concentration of solids. The eight sites were selected to represent different types of geology, hydrogeology, and contaminants. The results of the short-term demonstrations indicate that the dual drop tube configuration works well at a variety of sites that include tidal influence, varied geologic conditions (sandy to clay-rich soils), varied hydrogeologic conditions (groundwater depth from 3 ft to 50 ft), and varied LNAPL types (JP-4 to Bunker) and thickness (1.0 ft to 3.5 ft).

8
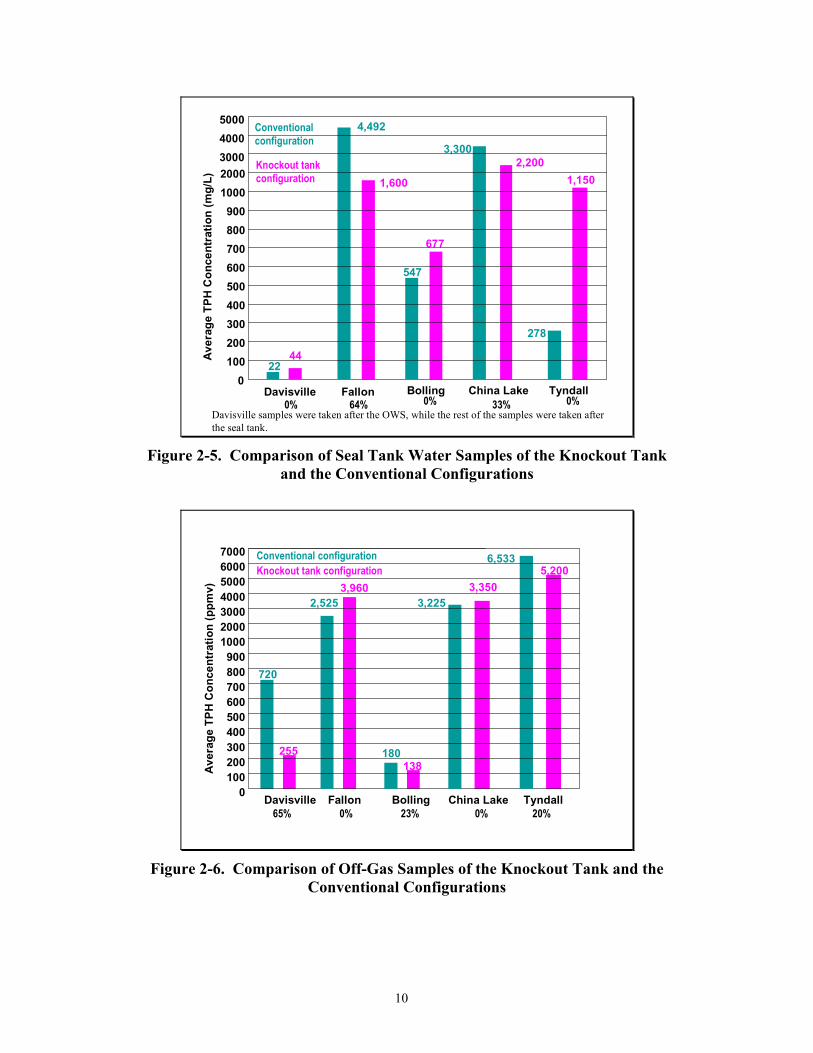
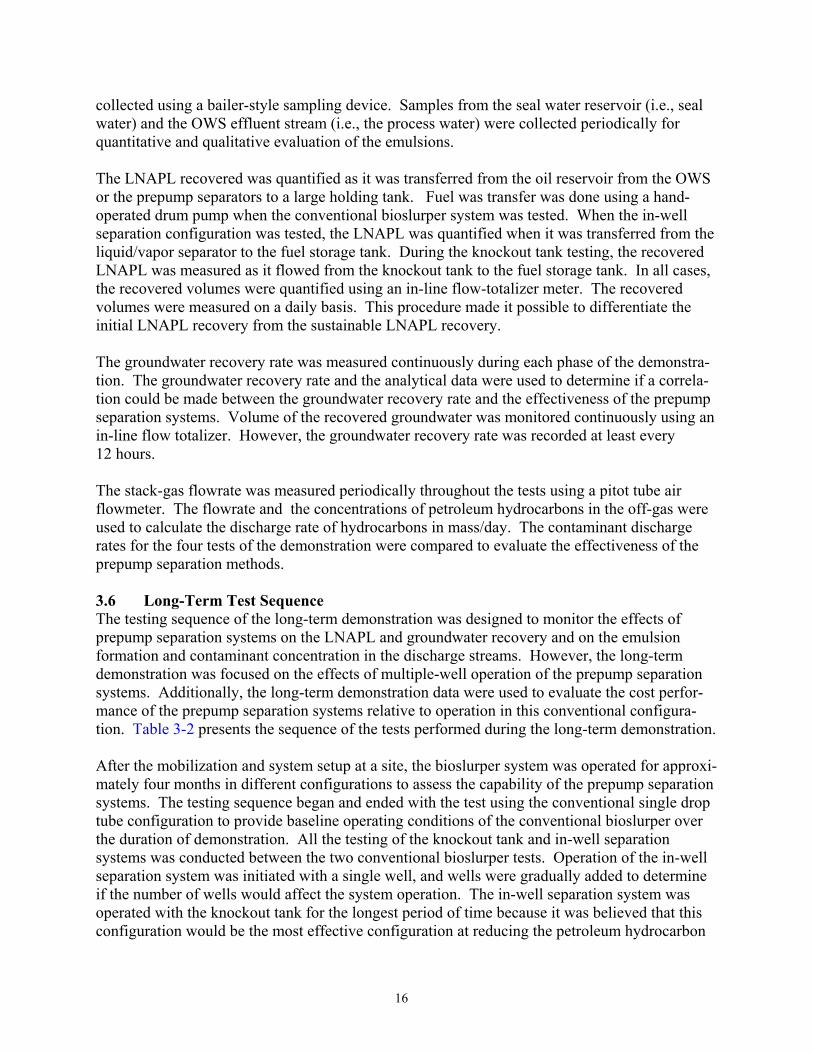
The results of the short-term demonstration indicated that the dual drop tube configuration is very effective at reducing the TPH concentrations in the aqueous and vapor effluent (Figures 2.3 through 2.6). It has also shown almost completely eliminated the floating solids. At NCBC Davisville, the water samples were collected after the oil/water separator that skewed the results. No reduction in the effluent water was shown, which we believe is due partly to the sampling location. In the other seven sites, the TPH concentration of the seal-tank water was reduced by 98% compared to a conventional bioslurper. The dual drop tube configuration works moderately well to reduce the TPH concentration of the off-gas. The average reduction at the eight sites in the TPH concentration of the off-gas was 37% compared to a conventional bioslurper. The dual drop tube configuration seems to work better at reducing the TPH concentration of the off-gas with the higher volatility fuel. The dual drop tube configuration did not affect the recovery of the LNAPL relative to operation in the conventional configuration. In general, the LNAPL recovery rates decreased throughout the demonstration, but did not significantly decrease when operating in the dual drop tube configuration. In addition, the dual drop tube configuration did not appear to alter the groundwater recovery rate. During the short-term demonstrations, the aboveground prepump knockout tank separators performed less efficiently than the dual drop tube configuration, probably due to periodic failure to completely remove all LNAPL and emulsions from the water phase. The knockout tank technology was only performed at five of the sites. Of the three sites where the knockout tank was not performed, two had little LNAPL recovery and the third site had a tight time constraint which made us exclude the knockout tank test. At half the sites, there was a reduction in the production of the floating solids. The average reduction in the TPH concentration of the seal-tank water was 24% compared to the conventional configuration. At NCBC Davisville, no reduction in the effluent water was shown as the water was sampled after the oil/water separator. The results from the knockout tank configuration demonstrate an average reduction in the TPH concentration of the off-gas of 22% compared to the conventional configuration. The knockout tank configuration did not affect the recovery of the LNAPL relative to operation in the conventional configuration. In general, the LNAPL recovery rates decreased throughout the demonstration, but did not significantly decrease when operating using the knockout tank. In addition, the knockout tank configuration did not appear to alter the groundwater recovery rate. The knockout tank configuration had essentially the same capital costs and O&M costs as the operation of the conventional configuration with no downstream treatment of the aqueous or vapor streams. The knockout tank configuration is less complicated than the dual drop tube.

9
Fallon Bolling China Lake Tyndall Point MolateCherry Point
Aver
age
TPH
Con
cent
ratio
n (m
g/L)
0
100
200
300
400
500
600
1000
2000
7.2 1.52.6ND2.1
Conventional configuration
Dual drop-tube configuration
33
547
4,4923,300
278
9228
99.3% 99.6% 99.8% 100% 97% 95%Davisville Hickam
94%0%
22 23
3000
4000
5000
1,717
102
The Point Molate conventional TPH concentration was corrected due to dilution.
Davisville samples were taken after the OWS, while the rest of the samples were taken after the seal tank.
Figure 2-3. Comparison of Seal Tank Water Samples of the Dual Drop Tube
and the Conventional Configurations
Fallon Bolling China Lake Tyndall Point Molate Cherry Point
Aver
age
TPH
Con
cent
ratio
n (p
pmv)
0
100
200
800
900
1,000
4,000
5,000
6,000
2,250
314
100
4,000
100
Conventional configurationDual drop-tube configuration
2,350
180
2,525
3,225
6,533
131
899
7% 44% 30% 39% 24% 65%Davisville Hickam
22%67%
7,000
31,00032,000
300
400
500
600
700
2,000
3,000
24,000
25,000
240
720
31,333
24,333
Figure 2-4. Comparison of Off-Gas Samples of the Dual Drop Tube and the
Conventional Configurations
10
Fallon Bolling China Lake Tyndall
Aver
age
TPH
Con
cent
ratio
n (m
g/L)
0100200300400500600
10002000
2,2001,150
677
Conventionalconfiguration
Knockout tank configuration 1,600
547
4,492
3,300
278
64% 0% 33% 0%Davisville
0%
2244
300040005000
900800700
Davisville samples were taken after the OWS, while the rest of the samples were taken after the seal tank.
Figure 2-5. Comparison of Seal Tank Water Samples of the Knockout Tank and the Conventional Configurations
Fallon Bolling China Lake Tyndall
Aver
age
TPH
Con
cent
ratio
n (p
pmv)
0100200
200030004000
7000
3,3505,200
138
Conventional configurationKnockout tank configuration
3,960
180
2,525 3,225
6,533
0% 23% 0% 20%Davisville
65%
300400500600700
50006000
255
720
1000
800900
Figure 2-6. Comparison of Off-Gas Samples of the Knockout Tank and the Conventional Configurations

11
2.4 Advantages and Limitations of the Technology This section describes the advantages and limitations of the conventional and prepump separation technologies. 2.4.1 Conventional Bioslurping Process. The major advantage of the bioslurping process is that the technology provides LNAPL recovery while simultaneously remediating vadose zone soils through bioventing and SVE. Bioslurping has been demonstrated to exceed skimming and pump drawdown as an LNAPL-recovery technology. It is applicable to many LNAPL-contaminated sites, and can be converted easily to a bioventing system when LNAPL recovery is complete. The major limitations of the process include reduced effectiveness in low-permeability soils and the tendency to form stable oil/water emulsions and floating solids in the aqueous discharge from the liquid ring vacuum pump. The process also increases TPH concentrations in the stack gas. The presence of emulsions and floating solids often impedes the effectiveness of the OWS and requires complex and expensive water treatment processes before the process water can be discharged. The TPH-rich stack gas also may need treatment before its final discharge. 2.4.2 Prepump Separation. Both prepump separation technologies reduced petroleum hydrocarbon concentrations in the discharge streams from the bioslurper and reduced the amount of stable emulsions and floating solids in the process water are the primary advantages of the prepump separation modifications. Prepump separation technologies remove recovered LNAPL from the liquid stream prior to the entry of the stream into the liquid ring pump, thus preventing the turbulent mixing of LNAPL and process water within the pump head. These advantages make the bioslurping process a more attractive option for implementation because of reduced needs for downstream water and stack gas treatment. When the in-well separation technology is operated in a multiple-well configuration, the depth of the drop tubes may need to be monitored and adjusted on a routine basis to achieve proper flow of the fluids out of the well and optimum performance of the system. If drop tubes are not properly set, the dual drop system will not perform to its potential, and the petroleum hydrocarbon concentrations in the discharge streams will be more similar to those during operation in the conventional bioslurper configuration. The effects of water table fluctuation on the placement of drop tubes are not completely clear either, especially when a large number of extraction wells are joined by a manifold during the full-scale implementation. Based on observations at previous prepump separator demonstrations, however, fluctuations in the water table have had little effect on these operating parameters.

12
3. Demonstration Design
3.1 Performance Objectives The goal of this project was to quantify the effectiveness of prepump LNAPL separation methods in controlling effluent emulsion formation and reducing the concentrations of petroleum hydrocarbons in the aqueous and off-gas streams from the bioslurper. The system was operated in both short-term, single-well demonstrations and in a long-term, multiple-well demonstration to generate operational and cost data. Both in-well and aboveground prepump (knockout tank) separation were evaluated during the short-term and long-term demonstrations. 3.2 Selection of Test Site Several criteria were considered during the site selection for the long-term demonstration. This information primarily came from the data generated during the short-term demonstrations. The overriding requirement was the site needed to contain sufficient LNAPL to sustain recovery for approximately four months of bioslurper operation. Also, conditions at this site were selected to allow the use of the bioslurper system to recover LNAPL (i.e., soils must be sufficiently permeable to permit LNAPL flow while still being “tight” enough to allow the bioslurper system to create a vacuum-induced pressure gradient). NAS Fallon was selected for the long-term demonstration. NAS Fallon was selected because it was the most likely site to produce LNAPL over the four-month demonstration and the plume was large enough to install several wells. Although the site at NAS Fallon appeared to contain sufficient LNAPL, the site was not optimal because a significant volume of floating solids was not produced during the short-term demonstration. In addition, the limits for aqueous discharge to the Base’s sewer system are not as stringent as those at many federal facilities. Therefore, some of the costs associated with the tasks of removing and disposing the floating solids and the post-bioslurper treatment of the aqueous waste had to be estimated 3.3 Test Facility History Characteristics NAS Fallon is located in the State of Nevada, 6 miles southeast of the town of Fallon and 60 miles east of Reno. NAS Fallon was established originally as a military facility in 1942 as part of the Western Defense Program. The Base was commissioned as a Naval Air Auxiliary Station (NAAS) in 1944, and went through varying degrees of activity through the 1950s and 1960s before being upgraded to Naval Air Station in 1972. NAS Fallon currently serves as an aircraft weapons delivery and tactical air combat training facility.
The New Fuel Farm (Site 2) is located in the northwestern portion of NAS Fallon, as shown in Figure 3-1. Approximately 3,300,500 gallons of jet propulsion (JP)-8 jet fuel currently is stored in three underground and three aboveground storage tanks located at Site 2. However, until a few years ago, the primary fuel at the fuel farm was JP-5 jet fuel. Most of the contamination around the fuel farm appears to be JP-5 with minor amounts of gasoline. The New Fuel Farm at Site 2 reportedly was constructed in 1957 to provide fuel delivery services for NAS Fallon. Stored fuels include jet fuel, aviation gasoline, diesel, and motor gasoline.

13
Figure 3-1. New Fuel Farm (Site 2) is Located in the Northwestern Portion of NAS Fallon
3.4 Site Characteristics The Fallon area is in the northwestern part of the Great Basin. This area consists of layered deposits of lacustrine and Aeolian deposits. Soils in the developed part of NAS Fallon are primarily of the Appian complex, and consist of fine sand and clay loam to a depth of approximately 6 ft. Underlying these soils are alternating layers of clay, silty/clayey sand, and sand. The local groundwater table is situated at depths ranging from 7 to 15 ft bgs, and is located at the top of a 3-ft-thick sand layer that overlies a thick regional lacustrine clay stratum. The vadose zone is composed primarily of soils classified as clay loam. Seasonal groundwater temperature varies from 12-18°C and is of brackish salinity (averaging 23 mmho/cm conductivity and 38,000 mg/L total dissolved solids). Soil pH is high, ranging between 9.1 and 9.3, but groundwater pH varies seasonally from 7.8 to 9.0. The climate at NAS Fallon is characterized as semiarid with approximately 5 inches of precipitation per year. Average summer high temperatures are in the low 90s (°F) with low

14
humidity, and average winter lows are in the upper teens accompanied by moderate snowfall. Strong winds at the ground surface can cause moderate sandstorms. 3.5 Physical Setup and Operation The bioslurper system used for the demonstrations was designed to allow convenient and quick conversion from one configuration of the bioslurper to another configuration. For example, the extraction manifolds, liquid ring pump, and OWS of the system were thoroughly cleaned to avoid cross contamination when used to perform prepump separation options. If the thorough cleaning of the equipment was not possible, the system was designed so that these materials were replaceable. The primary components of the bioslurper system (liquid ring pump, OWS, and piping) were the same for all tests conducted during the demonstration to remain consistent throughout the demonstration (with the only modifications being the addition of the prepump separation systems). In addition, the bioslurper system was equipped with hour meters and liquid totalizers to accurately track the LNAPL, groundwater, and soil-gas recovery rates over the operation time. Also, the operating conditions of the system were kept as constant as possible, so the system maintained nearly the same vacuum during all configurations. 3.5.1 Measurement of Baseline Parameters. The following baseline parameters were measured prior to long-term demonstration or obtained from pre-demonstration activities:
• Depth to groundwater and LNAPL thickness in the proposed extraction wells • Lateral extent of the LNAPL plume • TPH concentrations in the groundwater • Subsurface vacuum.
Baseline data also were collected when the bioslurper system was operated in the conventional configuration. System operating parameters such as LNAPL-recovery rate, groundwater recov-ery rate, emulsion production, and petroleum hydrocarbon concentration in the process water were measured to provide baseline data for the conventional bioslurper system. Groundwater samples were collected prior to initiating the first test of the demonstration to pro-vide background concentrations of petroleum hydrocarbons. Results of the groundwater analyses were compared to those for the process water to indicate the degree of emulsification produced by the bioslurper process. 3.5.2 System Performance Parameters. Following the measurement of baseline parameters, the field tests were initiated. Key parameters that were measured or monitored include:
• Petroleum hydrocarbon concentrations in the seal water reservoir (designated as seal water samples) and the discharge water from the OWS unit of the bioslurper system (designated process water samples)
• Petroleum hydrocarbon concentrations in the stack-gas stream from the liquid ring pump • Emulsions and floating solids formed • LNAPL-recovery rate • Groundwater-recovery rate • Stack-gas flowrate.

15
Samples of the bioslurper seal water, process water, and stack-gas streams were routinely collected during each test. The seal water and process water samples were analyzed for TPH using EPA Method SW846-8015B and . Petroleum hydrocarbon concentrations in the stack gas also were analyzed for TPH as jet fuel using EPA Method TO-3 and were measured in the field using a calibrated, handheld meter. Sampling methods and sampling frequency are presented below. Samples of the bioslurper seal water and process water were collected routinely during each test. The timetable for sample collection is presented in Table 3-1. The water was collected in 40-mL volatile organic analysis (VOA) vials and shipped via express delivery to the laboratory for analysis. Both the seal and process water samples were analyzed for TPH-JF using a modified method SW-8260. Due to the high levels of petroleum hydrocarbons in the seal and process water samples collected during operation in the conventional configuration, a special extraction process was performed by the laboratory to accurately quantify the total concentration of petroleum hydrocarbons.
Table 3-1. Sampling Schedule During Each Test
Sample Type Sample Location Sampling Frequency Groundwater Extraction well through
drop tube Prior to initiating testing phases
Process water OWS effluent sampling port Two times per week Discharge water Point of discharge As required by regulators Stack gas with handheld meter
Sampling port in off-gas stack
Daily
Stack gas with Summa canisters
Sampling port in off-gas stack
Two times per week
Emulsions and floating solids
In OWS Two times per day
Samples of the off-gas from the stack were routinely collected during each test configuration. A grab sample was collected every 48 and 96 hours and sent to a qualified laboratory for analysis of TPH as jet fuel using EPA Method TO-3. To augment the laboratory samples, TPH concentrations in the stack gas were quantified using a calibrated, handheld meter at 2, 4, 8, 12, and 24 hours after the start of each test. After 24 hours, the TPH was monitored on a 24-hour interval. Stack gas was routinely monitored using a handheld meter (GasTech or equivalent), which measures TPH concentrations in vapor streams using a hot wire sensor. The meter was calibrated using a 4,800-mg/L hexane standard immediately before use. The formation of stable emulsions and floating solids were monitored to evaluate the effec-tiveness of the prepump separation methods. Samples of the floating solids were collected 2, 4, 8, 12, 24, 48, 72, and 96 hours after the startup of the demonstration (Table 3-1). The appear-ance of the emulsions and floating solids formed in the OWS and the OWS effluent stream were recorded and photographed. Samples of the emulsions and floating solids in the OWS were
16
collected using a bailer-style sampling device. Samples from the seal water reservoir (i.e., seal water) and the OWS effluent stream (i.e., the process water) were collected periodically for quantitative and qualitative evaluation of the emulsions. The LNAPL recovered was quantified as it was transferred from the oil reservoir from the OWS or the prepump separators to a large holding tank. Fuel was transfer was done using a hand-operated drum pump when the conventional bioslurper system was tested. When the in-well separation configuration was tested, the LNAPL was quantified when it was transferred from the liquid/vapor separator to the fuel storage tank. During the knockout tank testing, the recovered LNAPL was measured as it flowed from the knockout tank to the fuel storage tank. In all cases, the recovered volumes were quantified using an in-line flow-totalizer meter. The recovered volumes were measured on a daily basis. This procedure made it possible to differentiate the initial LNAPL recovery from the sustainable LNAPL recovery. The groundwater recovery rate was measured continuously during each phase of the demonstra-tion. The groundwater recovery rate and the analytical data were used to determine if a correla-tion could be made between the groundwater recovery rate and the effectiveness of the prepump separation systems. Volume of the recovered groundwater was monitored continuously using an in-line flow totalizer. However, the groundwater recovery rate was recorded at least every 12 hours. The stack-gas flowrate was measured periodically throughout the tests using a pitot tube air flowmeter. The flowrate and the concentrations of petroleum hydrocarbons in the off-gas were used to calculate the discharge rate of hydrocarbons in mass/day. The contaminant discharge rates for the four tests of the demonstration were compared to evaluate the effectiveness of the prepump separation methods. 3.6 Long-Term Test Sequence The testing sequence of the long-term demonstration was designed to monitor the effects of prepump separation systems on the LNAPL and groundwater recovery and on the emulsion formation and contaminant concentration in the discharge streams. However, the long-term demonstration was focused on the effects of multiple-well operation of the prepump separation systems. Additionally, the long-term demonstration data were used to evaluate the cost perfor-mance of the prepump separation systems relative to operation in this conventional configura-tion. Table 3-2 presents the sequence of the tests performed during the long-term demonstration. After the mobilization and system setup at a site, the bioslurper system was operated for approxi-mately four months in different configurations to assess the capability of the prepump separation systems. The testing sequence began and ended with the test using the conventional single drop tube configuration to provide baseline operating conditions of the conventional bioslurper over the duration of demonstration. All the testing of the knockout tank and in-well separation systems was conducted between the two conventional bioslurper tests. Operation of the in-well separation system was initiated with a single well, and wells were gradually added to determine if the number of wells would affect the system operation. The in-well separation system was operated with the knockout tank for the longest period of time because it was believed that this configuration would be the most effective configuration at reducing the petroleum hydrocarbon
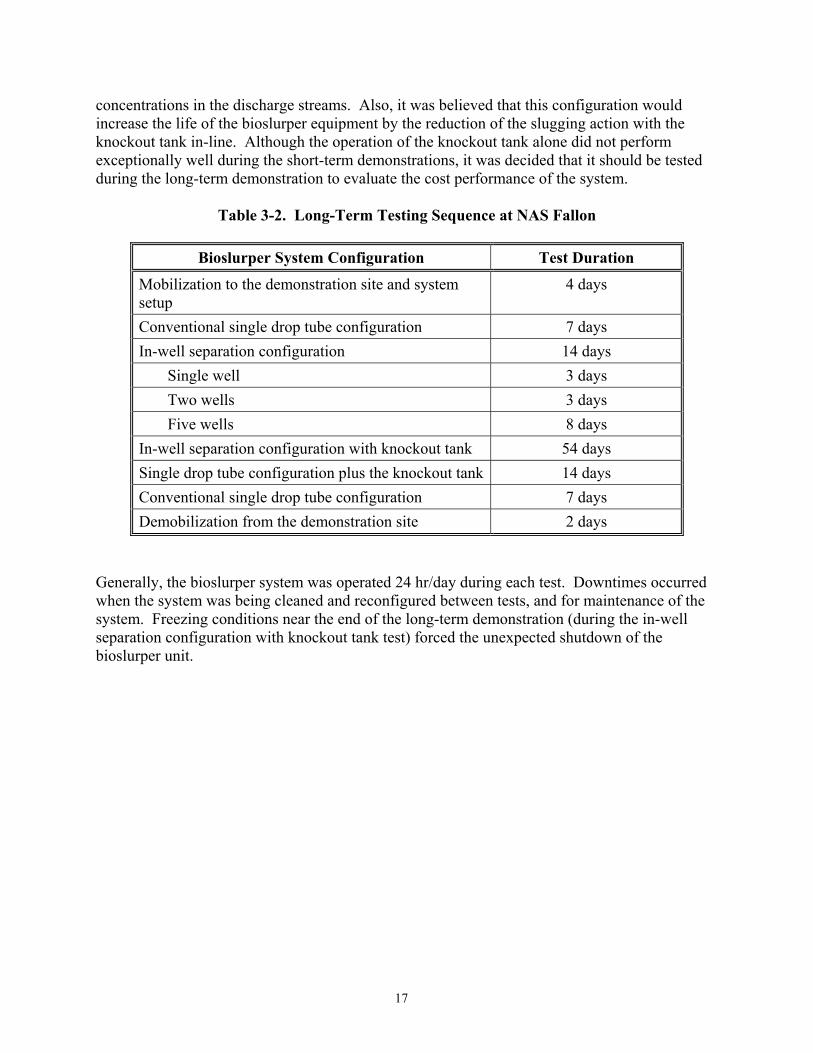
17
concentrations in the discharge streams. Also, it was believed that this configuration would increase the life of the bioslurper equipment by the reduction of the slugging action with the knockout tank in-line. Although the operation of the knockout tank alone did not perform exceptionally well during the short-term demonstrations, it was decided that it should be tested during the long-term demonstration to evaluate the cost performance of the system.
Table 3-2. Long-Term Testing Sequence at NAS Fallon
Bioslurper System Configuration Test Duration
Mobilization to the demonstration site and system setup
4 days
Conventional single drop tube configuration 7 days In-well separation configuration 14 days Single well 3 days Two wells 3 days Five wells 8 days In-well separation configuration with knockout tank 54 days Single drop tube configuration plus the knockout tank 14 days Conventional single drop tube configuration 7 days Demobilization from the demonstration site 2 days
Generally, the bioslurper system was operated 24 hr/day during each test. Downtimes occurred when the system was being cleaned and reconfigured between tests, and for maintenance of the system. Freezing conditions near the end of the long-term demonstration (during the in-well separation configuration with knockout tank test) forced the unexpected shutdown of the bioslurper unit.

18
4. Performance Assessment 4.1 Performance Data The performance of the prepump separation systems was based primarily on the petroleum hydrocarbon concentrations in the effluent vapor and aqueous streams. The analytical data generated while operating in the in-well separation and knockout tank configurations were compared to those data generated while operating in the conventional configuration. A secondary evaluation of system performance was performed by sampling the liquid stream in the bioslurper system for the presence and consistency of floating solids. The operational data for the long-term demonstration at NAS Fallon, Nevada, is presented in Table 4-1. The total amount of LNAPL recovered from the subsurface for the four months of the long-term demonstration is approximately 6,845 gallons. The first conventional configuration had the greatest recovery with approximately 155 gpd with a total of approximately 1,062 gal-lons of LNAPL over 164 hours. The next three tests used the in-well separation configuration without the knockout tank and additional wells were gradually connected to the bioslurper over a period of 5 days. For the single well in-well separation, approximately 73 gallons were recovered with an average of 39 gpd LNAPL recovery over 44 hours. The in-well separation with two wells and all five wells recovered approximately 63 and 641 gallons, respectively, with an average LNAPL recovery of 29 and 80 gpd, respectively. The in-well separation configuration with two wells lasted 57 hours while the in-well separation configuration with five wells lasted approximately 192 hours. The in-well separation configuration with five wells with the use of the knockout tank was the next configuration that was tested. This configuration was conducted for approximately 1,183 hours and recovered 3,434 gallons of LNAPL with an average LNAPL recovery of 70 gpd. The knockout tank was the next configuration that was tested and recovered 894 gallons over 333 hours with an average LNAPL recovery of 64 gpd. The last configuration tested was a second conventional configuration, which lasted approximately 161 hours and recovered 516 gallons of LNAPL with a recovery of 77 gpd. The total groundwater recovery during the long-term demonstration is approximately 252,700 gallons. The average groundwater recovery was approximately 1.9 gpm over the length of the demonstration ranging from 1.2 gpm during the second conventional configuration to 2.9 gpm during the single well in-well separation configuration test without the knockout tank. Floating solids were not formed in any recoverable amounts in any configuration during the demonstration. Table 4-2 summerizes the analytical results of the process water and seal-tank water samples that were collected during the demonstration. The concentration of TPH in the groundwater was measured at 0.59 mg/L. The average seal-tank water TPH concentration in the first conven-tional, single well in-well separation, two wells in-well separation, five wells in-well separation, five wells in-well separations with knockout tank, knockout tank, and second conventional are 10,067, 15, 63, 180, 109, 855, and 4,800 mg/L, respectively.

19
Table 4-1. Operational Data for Long-Term Demonstration at NAS Fallon, NV
Test Configuration
Test Duration
(hrs)
Water Recovered
(gal)
Fuel Recovered
(gal)
1st Conventional 164.2 19,463.9 1,062.0 Single Well in-well separation w/o Knockout Tank 44.4 8,075.7 72.6
Two Wells in-well separation w/o Knockout Tank 57.4 5,127.8 63.0
Five Wells in-well separation w/o Knockout Tank 191.7 24,651.6 640.5
Five Wells in-well separation w/ Knockout Tank 1,183.2 139,844.9 3,433.6
Knockout Tank 332.7 28,312.1 893.6 2nd Conventional 160.8 11,720.2 515.5
Cumulative bioslurper operation 2,134.4 252,705.3 6,844.8 The average process water TPH concentration in the first conventional, single well in-well separation, two wells in-well separation, five wells in-well separation, five wells in-well separation with knockout tank, knockout tank, and second conventional are 780, 1.9, 26, 78.5, 33, 290, and 390 mg/L, respectively. The stack-gas discharge rate was not dependent on the number of wells that were being used. The average discharge rate was approximately 35 scfm for the different configurations. Table 4-3 presents the off-gas analytical summary. The average off-gas TPH concentrations for the first conventional, single well in-well separation, five wells in-well separation, five wells in-well separation with knockout tank, knockout tank, and second conventional are 780, 1,900, 2,000, 704, 620, and 520 ppmv, respectively. 4.2 Performance Criteria The primary performance criteria to which the system were to be evaluated was the effectiveness of prepump LNAPL separation methods in controlling effluent emulsion formation and reducing the concentrations of petroleum hydrocarbons in the aqueous and off-gas streams from the bioslurper. In order to evaluate the success at meeting these criteria, samples of the aqueous and vapor discharge streams were collected while operating in the conventional bioslurper configuration and with the prepump separation systems attached to the bioslurper. In addition, samples of the groundwater were collected to provide a baseline level of petroleum hydrocarbons in the groundwater. These baseline results could then be compared to the effluent discharge samples in both the conventional and prepump separation configurations. There were no significant deviations from the expected performance criteria described in the Demonstration Plan.

20
Table 4-2. Process Water, Seal-Tank Water, and Off-Gas Analytical Summary for the Long-Term Demonstration at NAS Fallon, NV
Test Configuration
Avg. TPH-E (Jet Fuel)
mg/L
Avg. TPH (C2+ ref. JP-4)
ppmv - Seal Tank Water 10,067 1st Conventional - Process Water 780
780
- Seal Tank Water 15 Single Well In-Well Separation w/o Knockout Tank - Process Water 1.9
1,900
- Seal Tank Water 63 Two Wells In-Well Separation w/o Knockout Tank - Process Water 26
NS
- Seal Tank Water 180 Five Wells In-Well Separation w/o Knockout Tank - Process Water 78.5
2,000
- Seal Tank Water 109 Five Wells In-Well Separation w/ Knockout Tank - Process Water 33
704
- Seal Tank Water 855 Knockout Tank - Process Water 290
620
- Seal Tank Water 4,800 2nd Conventional - Process Water 390
520
4.3 Data Assessment The assessment of the eight short-term demonstration sites and the long-term demonstration site was based primarily on the aqueous and vapor TPH concentrations. A secondary assessment was done on the production (volume and appearance) of floating solids and emulsions formed by the different configurations. Data was also taken on the different configurations, recovery of the LNAPL, and groundwater. The LNAPL recovery remained consistent throughout the demonstration except for the first conventional configuration, which had double the gallons per day at 155 gpd than the rest of the demonstration which averaged 75 gpd. For comparison purposes, the prepump separations data were compared to the second conventional configuration data because of the similar LNAPL recovery rates. The groundwater recovery remained relatively constant over the course of the demonstration. The average groundwater recovery rate was 2 gpm.
The prepump separation techniques reduced the TPH concentrations in the seal-tank water compared to the second conventional configuration. The average TPH concentration reduction when using the dual drop tube configuration was 98% compared to the second conventional configuration. The reduction did not seem to be dependent on the number of wells or the use of a surge tank. The knockout tank configuration had a TPH concentration reduction of 82% relative to the second conventional configuration.

21
The concentration of TPH in the off-gas did not seem to be affected by the use of the prepump separation technologies. The second conventional configuration had the lowest TPH concentration for the off-gas. The dual drop tube configuration and the knockout tank configurations had the same or higher TPH concentrations in the off-gas stream. NAS Fallon did not seem to produce floating solids. The dual drop tube and the knockout tank configuration did reduce the formations of the milky emulsions. 4.4 Technology Comparison Very little analytical data exists for other innovative candidate technologies. The analytical data that do exist are from a remediation site that the prepump separation systems have not been used. Therefore, comparison of the pre-pump separation systems to other innovative technologies would be difficult. Comparison of the prepump separation systems to operation of the bioslurper in the traditional configuration was completed for the short-term demonstrations. The data indicate that both of the dual drop tube and knockout tank separation systems are effective at reducing the production of emulsions and the concentration of the TPH in the liquid stream passing through the bioslurper system. During the short-term demonstrations, the average reduction of the TPH in the process water with and without the dual drop tube system was 98%. The knockout tank was capable of reducing the TPH concentration in the seal water tank by 24% compared to the conventional bioslurper system. Results from the demonstration at NCBC Davisville were not included in the average because the samples were not collected in from the seal water tank (where the samples were collected for the remainder of the demonstrations). The sample location during the NCBC Davisville test skewed the results for this demonstration. The dual drop tube configuration works moderately well in reducing the TPH concentration of the off-gas. The average reduction at the eight sites in the TPH concentration of the off-gas was 37% compared to a conventional bioslurper. The dual drop tube configuration seems to work better at reducing the TPH concentration of the off-gas with the higher volatility fuel. The results from the knockout tank configuration demonstrate an average reduction in the TPH concentration of the off-gas of 22% compared to the conventional configuration. The results from the demonstrations indicate that the dual drop tube configuration works well at a variety of sites that include tidal influence, varied geologic conditions (sandy to clay-rich soils), varied hydrogeologic conditions (groundwater depth from 3 ft to 50 ft), and varied LNAPL types (JP-4 to Bunker) and thickness (1.0 ft to 3.5 ft).

22
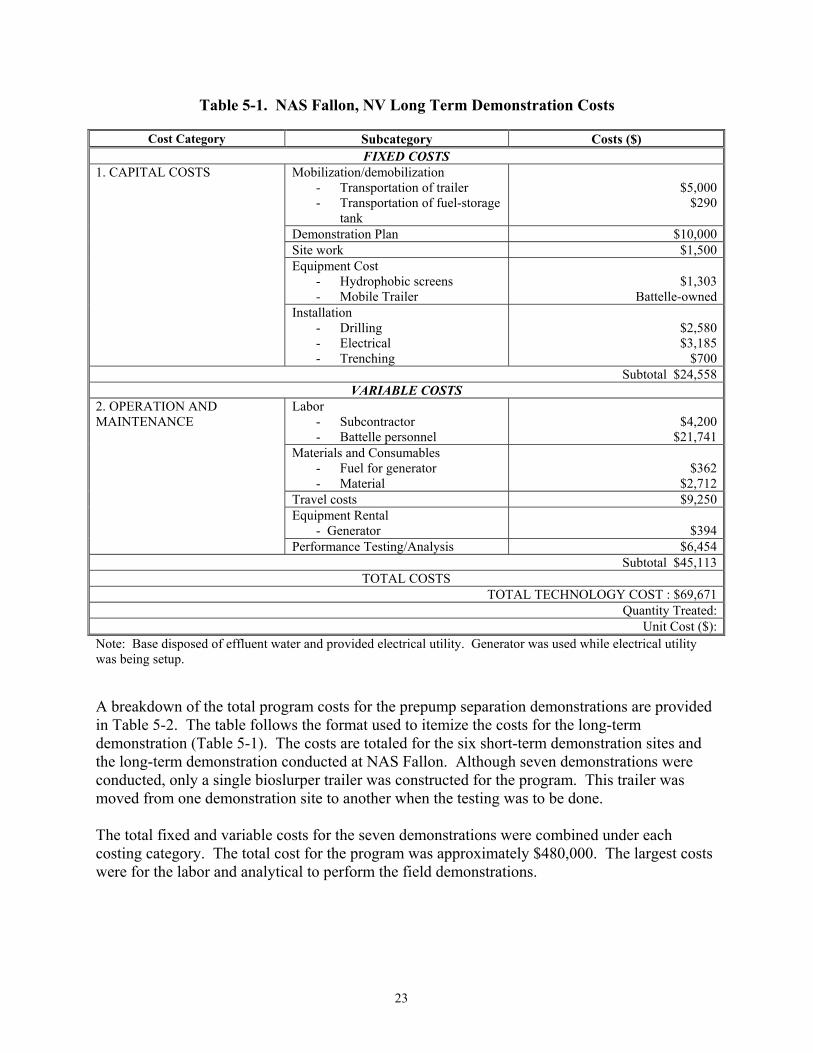
5. Cost Assessment The long-term demonstration at NAS Fallon was conducted primarily to investigate the cost-effectiveness of the prepump separation operation compared to operation in the conventional configuration. During the long-term demonstration, the system was operated in a multiple well (five well) configuration to simulate full-scale design. Also, the test duration was approximately four months, so more accurate costs for “long-term” operation could be assessed. All of the tests were designed to provide a side-by-side comparison of the performance and operational requirements in each configuration. For example, operational and maintenance labor requirements were recorded for each of the configurations to determine if one of the configurations was more cost-effective than the other configuration. The prepump separation systems were designed to improve the operation of the bioslurper system and reduce operating costs by preventing the formation of the floating solids and emulsions present in the discharge streams from the bioslurper system. Therefore, all of the demonstrations were conducted to compare the bioslurper performance with and without prepump separation systems. The data presented in this section will compare the cost performance of the bioslurping technology in the conventional configuration with the in-well separation configuration. The cost assessment of the conventional bioslurper system includes two scenarios: 1) with manual removal and disposal of the floating solids and 2) treatment of the aqueous discharge stream with a dissolved air flotation (DAF) system. Treatment costs in the conventional configuration are estimated because the site at NAS Fallon did not produce a significant amount of floating solids that needed to be removed. Additionally, the aqueous discharge limits were relatively high, so the aqueous discharge stream did not require treatment past the OWS. Although the knockout tank was tested alone during the long-term demonstration, the cost and performance data did not indicate that it performed adequately. Therefore, costs for the knockout tank operation alone were not calculated. 5.1 Cost Reporting Table 5-1 displays the costs for the long-term demonstration at NAS Fallon. The demonstration plan for the long-term test was estimated at $10,000, which includes detailed plans for monitoring, sampling, and analyses. Mobilization costs included transporting the trailer and a fuel-storage tank from Columbus, Ohio, to Fallon, Nevada. The trailer and tank are owned by Battelle; therefore, costs for these pieces of equipment were not included in the cost summary. The majority of the site costs include the construction costs for preparing the site, such as drilling, trenching, and electrical installation. The labor costs are the dominant part of the variable costs, where the equipment and materials costs are much lower. Although this demonstration included a significant amount of analytical work, the cost for analyses was much lower then the labor and travel costs. The total cost of the long-term demonstration was approximately $70,000. The unit cost per gallon of fuel removed is $10/gallon.
23
Table 5-1. NAS Fallon, NV Long Term Demonstration Costs
Cost Category Subcategory Costs ($) FIXED COSTS
Mobilization/demobilization - Transportation of trailer - Transportation of fuel-storage
tank
$5,000
$290
Demonstration Plan $10,000Site work $1,500Equipment Cost
- Hydrophobic screens - Mobile Trailer
$1,303
Battelle-owned
1. CAPITAL COSTS
Installation - Drilling - Electrical - Trenching
$2,580 $3,185
$700Subtotal $24,558
VARIABLE COSTS Labor
- Subcontractor - Battelle personnel
$4,200
$21,741
2. OPERATION AND MAINTENANCE
Materials and Consumables - Fuel for generator - Material
$362
$2,712 Travel costs $9,250 Equipment Rental
- Generator
$394 Performance Testing/Analysis $6,454
Subtotal $45,113TOTAL COSTS
TOTAL TECHNOLOGY COST : $69,671 Quantity Treated:
Unit Cost ($):Note: Base disposed of effluent water and provided electrical utility. Generator was used while electrical utility was being setup. A breakdown of the total program costs for the prepump separation demonstrations are provided in Table 5-2. The table follows the format used to itemize the costs for the long-term demonstration (Table 5-1). The costs are totaled for the six short-term demonstration sites and the long-term demonstration conducted at NAS Fallon. Although seven demonstrations were conducted, only a single bioslurper trailer was constructed for the program. This trailer was moved from one demonstration site to another when the testing was to be done. The total fixed and variable costs for the seven demonstrations were combined under each costing category. The total cost for the program was approximately $480,000. The largest costs were for the labor and analytical to perform the field demonstrations.

24
Table 5-2. Costs for the Entire ESTCP Prepump Separation Program
Cost Category Subcategory Costs ($) FIXED COSTS
Mobilization/demobilization $58,000Demonstration Plans Reporting
$38,000 $45,000
Materials - Dual-Drop Tube Assembly - Gauges
$22,000
$2,300Bioslurper Cost
- 20-hp Liquid-ring pump - Oil/water separator - Knockout Tanks (2) - Piping and Dual Drop Tubes - Fuel Trap - Sump and Transfer Pumps - Hardware - Labor
$12,200 $11,500
$4,000 $2,000
$800 $2,000 $1,500
$10,000
1. CAPITAL COSTS
Installation - Drilling - Electrical - Trenching
$7,500 $5,000 $1,000
Subtotal $222,800VARIABLE COSTS
Labor - Technician (b) - Engineer (c)
$129,134
$67,230
2. OPERATION AND MAINTENANCE
Materials and Consumables - Carbon treatment of effluent
water and offgas (6 sites) - Equipment rental
$5,000
$7,500
Analysis - Effluent water sampling (d) - Off-gas sampling (e)
$34,000 $14,000
Subtotal $256,864TOTAL TECHNOLOGY COST: $479,664
The estimated full-scale costs for performing in-well separation operation at a generic site is provided in Table 5-3. This generic site contains an LNAPL plume that covers an area of 2 acres with the water table at a depth of 15 feet bgs. The radius of influence from each extraction well is estimated to be 40 feet. This generic site is based on the average conditions found at 40 LNAPL-contaminated DoD sites that bioslurping has been performed. The in-well separation assembly was estimated at $17,000 to install the device in each one of the extraction wells. The other costs are universal to bioslurper system operation. The total cost for implementation of the in-well separation system and to remediate the site is $309,000, and the unit cost for treating 1 acre is approximately $155,000. Here the unit cost is calculated on the surface area of the LNAPL contamination, and is somewhat independent on the thickness of LANPL at the site.

25
Table 5-3. Estimated Full-Scale Implementation Costs for Conducting In-Well Separation Bioslurping(a)
Cost Category Subcategory Costs ($)
FIXED COSTS Mobilization/demobilization $15,000Demonstration Plan $10,000Materials
- Dual-Drop Tube Assembly - Manifold - Gauges
$17,000
$8,000 $2,300
Bioslurper Cost - 20-hp Liquid-ring pump - Oil/water separator - Surge Tank - Fuel Trap - Sump Pumps - Hardware - Labor
$12,200 $11,500
$2,000 $800 $500
$7,500 $10,000
1. CAPITAL COSTS
Installation - Drilling - Electrical - Trenching
$41,000
$5,000 $1,000
Subtotal $143,800VARIABLE COSTS
Labor - Technician (b) - Engineer (c)
$74,128 $26,112
2. OPERATION AND MAINTENANCE
Materials and Consumables - Carbon treatment of effluent
water - Other
$40,000
$5,000
Analysis - Effluent water sampling (d) - Off-gas sampling (e)
$10,000 $10,000
Subtotal $165,240TOTAL COSTS
TOTAL TECHNOLOGY COST: $309,040 Quantity Treated: 2 acre
Unit Cost ($):154,520/acre(a) Based on a 2-acre area with 50 wells (4” diameter at 15 ft depth) operating for 2 years. (b) Technician time for full-time for the first month, then 2 days per week for rest of project. (c) Engineer time for 40 hours for first month, then 16 hours per month for rest of project. (d) Effluent water will be tested weekly for first month, then monthly for rest of project. (e) Air sampling will be conducted weekly for first month, then monthly for rest of project.
The fixed costs of the operation of a conventional bioslurper with manual removal of the floating solids is essentially the same as those with the in-well separation system. However, once the variable costs (with additional labor) are included, the costs increase. The additional labor is required to have a technician visit the system on a daily basis to manually remove the floating solids from the postpump equipment (primarily the OWS) as well as disposing of this waste. Generally, the manual removal of the floating solids consists of scraping the floating solids from

26
the top of the aqueous stream and separating the floating solids from the pure product. After the floating solids have been removed from the aqueous stream, suspended droplets of LNAPL are emulsified within the aqueous stream. These emulsions generally are removed by passing the water through filters of activated carbon and clay media. Additional costs for operation in the conventional configuration with DAF treating the aqueous stream appear in both the fixed and variable costs. The DAF unit is relatively expensive at a cost of $77,000. However, the operation of the DAF unit is relatively expensive, as well. The DAF unit requires costly chemicals for proper operation. Even after the water is treated with the DAF unit, it still will generally require some polishing prior to meeting acceptable discharge requirements. For this cost analysis, the polishing is performed with activated carbon. 5.2 Cost Analysis The costs for utilizing the prepump separation systems are generally driven by the potential for emulsion formation at a particular site, the free product recovery rates, and the groundwater recovery rates. Other factors such as dimensions of the free product plume, depth to groundwater and free product, and soil conditions at the site do not significantly affect the cost of using the prepump separation systems compared to the conventional bioslurper configuration. The greatest cost benefit of the pre-pump separation systems comes from the reduced costs of the post-bioslurper treatment of the process water and from minimization of labor needed to handle the floating solids produced during conventional bioslurper operation. Therefore, as the fuel, groundwater, and emulsion production rates increase during conventional operation, the cost-savings from the use of the pre-pump separation systems increases. The cost for installing in-well separation systems in each extraction well is very low (approximately $10/well). Therefore, adding wells to the system will not dramatically increase project costs. Further, as the depth to the water table increases, the costs for installing the in-well separation system only slightly increases over the cost of installing a conventional bioslurper system by the cost of installing stainless steel tubing to the water table. The free product recovery rate determines the size of the knockout tank. Therefore, once the tank is properly sized and purchased, the costs are not affected by the number of wells and other similar factors. The mass removal rate achieved by bioslurping and other LNAPL extraction technologies varies over time. Typically, a period of relatively rapid and steady mass removal rate is followed by a period of exponential decay. This reflects the relative availability of gross contaminant reservoirs compared to less accessible stores of contaminants. As more remote locations of the site are accessed by the extraction mechanisms, the mass removal rate decreases and eventually approaches zero. The objective of life-cycle cost analysis is to determine the appropriate ratio between capital equipment and O&M commitments to achieve the greatest mass removal in the most cost-effective manner. Capital outlays can be underutilized at sites where the plateau period is brief because the purchased componentry is operated well below its design capacity for the majority of the operational period. Systems designed to accommodate extraction rates near the maximum may achieve the desired mass removal in a shorter operational period.

27
A cost-effective approach operation of the bioslurper involves renting of appropriately sized equipment during the period of high mass removal. When the mass removal rates decrease, the large equipment may be returned. Following this period of high LNAPL-recovery rates, smaller equipment (including knockout tanks and pumps) may be purchased. This approach reduces the cost of purchase oversized equipment that would only be used for a limited amount of time.
5.3 Cost Comparison The data in the full-scale implementation of in-well separation bioslurping can then be compared to the data for full-scale bioslurper operation with manual removal (Table 5-4) of the floating solids and full-scale bioslurper operation with DAF for floating solids treatment and removal (Table 5-5). Comparison of the cost data in these tables demonstrates the cost-effectiveness of bioslurper operation with the in-well separation system relative to operation with more conventional treatment and/or removal of the floating solids. Over the expected duration of the LNAPL-recovery effort (2 years), the in-well separation system saves approximately $306,432 relative to conventional bioslurping with manual removal of the floating solids and approximately $336,432 relative to conventional bioslurping with DAF for the postpump treatment of the aqueous stream. With each of these configurations, the quality of the discharge is the same, and satisfactory for discharge to the facilities wastewater treatment plant. Additionally, the remediation times for each of the configurations is the same because the in-well separation system does not affect the LNAPL-recovery rate relative to conventional bioslurping.
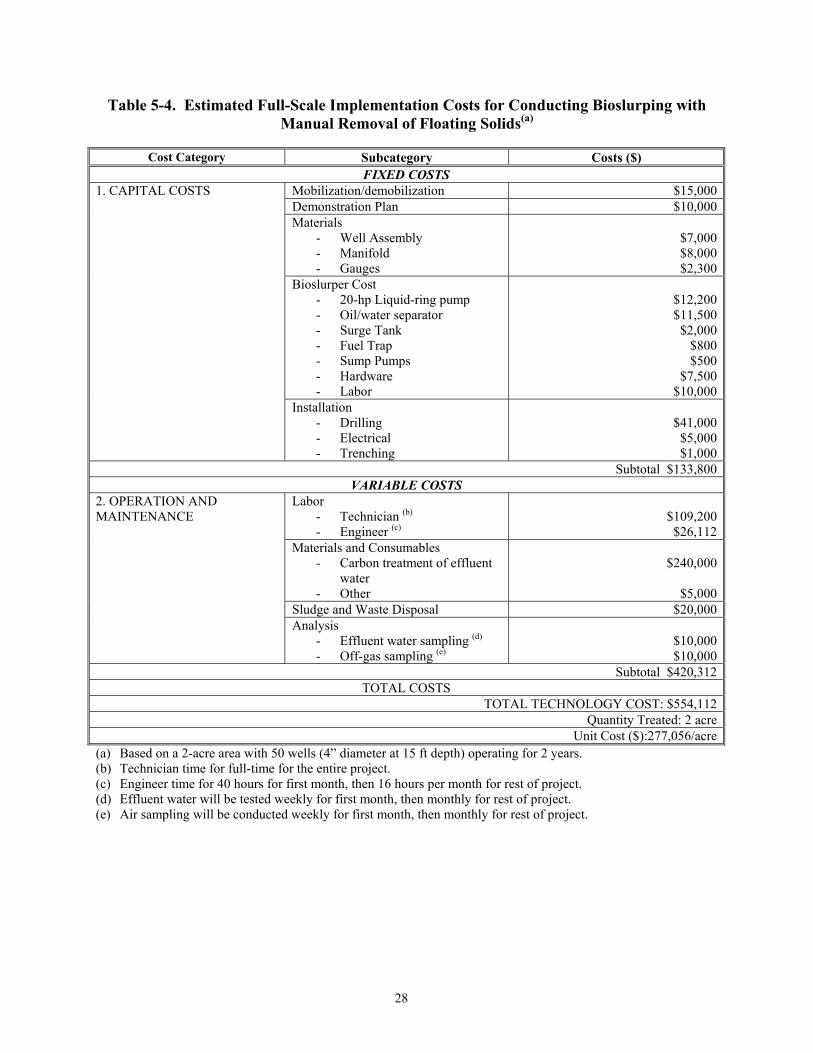
28
Table 5-4. Estimated Full-Scale Implementation Costs for Conducting Bioslurping with Manual Removal of Floating Solids(a)
Cost Category Subcategory Costs ($)
FIXED COSTS Mobilization/demobilization $15,000Demonstration Plan $10,000Materials
- Well Assembly - Manifold - Gauges
$7,000 $8,000 $2,300
Bioslurper Cost - 20-hp Liquid-ring pump - Oil/water separator - Surge Tank - Fuel Trap - Sump Pumps - Hardware - Labor
$12,200 $11,500
$2,000 $800 $500
$7,500 $10,000
1. CAPITAL COSTS
Installation - Drilling - Electrical - Trenching
$41,000
$5,000 $1,000
Subtotal $133,800VARIABLE COSTS
Labor - Technician (b) - Engineer (c)
$109,200
$26,112
2. OPERATION AND MAINTENANCE
Materials and Consumables - Carbon treatment of effluent
water - Other
$240,000
$5,000
Sludge and Waste Disposal $20,000 Analysis
- Effluent water sampling (d) - Off-gas sampling (e)
$10,000 $10,000
Subtotal $420,312TOTAL COSTS
TOTAL TECHNOLOGY COST: $554,112 Quantity Treated: 2 acre
Unit Cost ($):277,056/acre(a) Based on a 2-acre area with 50 wells (4” diameter at 15 ft depth) operating for 2 years. (b) Technician time for full-time for the entire project. (c) Engineer time for 40 hours for first month, then 16 hours per month for rest of project. (d) Effluent water will be tested weekly for first month, then monthly for rest of project. (e) Air sampling will be conducted weekly for first month, then monthly for rest of project.

29
Table 5-5. Estimated Full-Scale Implementation Costs for Conducting Bioslurping with DAF Unit for Postpump Treatment(a)
Cost Category Subcategory Costs ($)
FIXED COSTS Mobilization/demobilization $15,000Demonstration Plan $10,000Materials
- Well Assembly - Manifold - Gauges - DAF Unit
$7,000 $8,000 $2,300
$77,000Bioslurper Cost
- 20-hp Liquid-ring pump - Oil/water separator - Surge Tank - Fuel Trap - Sump Pumps - Hardware - Labor
$12,200 $11,500
$2,000 $800 $500
$7,500 $10,000
1. CAPITAL COSTS
Installation - Drilling - Electrical - Trenching
$41,000
$5,000 $1,000
Subtotal $210,800VARIABLE COSTS
Labor - Technician (b) - Engineer (c)
$43,680 $26,112
2. OPERATION AND MAINTENANCE
Materials and Consumables - Carbon treatment of effluent
water - Chemicals - Other
$40,000
$153,000
$5,000 Sludge and Waste Disposal $20,000 Analysis
- Effluent water sampling (d) - Off-gas sampling (e)
$10,000 $10,000
Subtotal $307,792TOTAL COSTS
TOTAL TECHNOLOGY COST: $518,592 Quantity Treated: 2 acre
Unit Cost ($):259,296/acre(a) Based on a 2-acre area with 50 wells (4” diameter at 15 ft depth) operating for 2 years. (b) Technician time for full-time for the entire project. (c) Engineer time for 40 hours for first month, then 16 hours per month for rest of project. (d) Effluent water will be tested weekly for first month, then monthly for rest of project. (e) Air sampling will be conducted weekly for first month, then monthly for rest of project.

30
6. Implementation Issues 6.1 Cost Observations In general, the estimated project costs were very similar to the actual project cost. In part, this is due to the fact that prepump separation systems were a minor modification to the conventional bioslurper system, and the cost for operating bioslurper systems is relatively well known. Due to the simplicity of the in-well separation system, the costs for conducting in-well separation bioslurping are not significantly different than those of conventional bioslurper operation. The site-specific conditions do not dramatically affect the cost to perform bioslurping with prepump separation relative to conventional bioslurping. With both the conventional bioslurping and with the use of prepump separation, the site conditions will influence cost, but the site conditions influence the costs of prepump separation and conventional bioslurping equally. For example, if soils at a site are relatively fine-grained and the radius of influence from the extraction well is small, then the number of wells required to provide adequate LNAPL capture increases with both the prepump and conventional bioslurper systems. One site-specific condition that will alter the cost of prepump separation relative to conventional bioslurping is the LNAPL-production rate. At sites where the LNAPL-production rates are high, the liquid traps and knockout tanks need to be larger in order to handle the additional flow. It is believed that the operational costs of bioslurping with prepump separation will decrease as it is implemented at additional sites. The operation of the systems will become more predictable, and labor costs should decrease as a result. 6.2 Performance Observations Overall, the performance criteria set in the Demonstration Plan were successfully achieved during both the short- and long-term demonstrations. The demonstration at NCBC Davisville, Rhode Island, was the only test site that did not successfully meet the performance criteria. It is believe that the lack of experience at sampling the discharge streams, the low baseline concentrations in the groundwater, and the low groundwater recovery rate at the site contributed to the failure to achieve acceptable performance criteria. To evaluate the failure/success of the prepump separation systems, duplicate samples were collected. In addition, multiple samples were collected during each phase of the demonstration to measure the capability of the systems over time and to provide essentially duplicate data. 6.3 Scale-Up The long-term demonstration was performed specifically to generate cost and engineering data in a full-scale configuration. The costing data in Tables 5-1 and 5-2 provide estimates to perform full-scale operation. Again, there are items such as liquid ring extraction pumps, oil/water separators, and liquid traps/knockout tanks that would need to be properly sized for full-scale operation. It is recommended that a pilot-scale test be performed to determine the feasibility of bioslurping and the scale-up engineering evaluation.

31
6.4 Other Significant Observations The major factors that influenced the implementation of the technology resulted from the relative recovery rates of LNAPL to groundwater. When the LNAPL recovery rates were high (>1 gallon/hour) and the groundwater recovery rates were low (<0.5 gallon/minute), the extraction efforts needed to be focused on the recovery of LNAPL. For example, at Hickam AFB the LNAPL-recovery rates were high and the groundwater recovery rates were low. In this situation, the size of the LNAPL-extraction tube was increased to ½-inch diameter to focus the extraction efforts on the LNAPL. The groundwater extraction tube remained 1-inch diameter because this size pipe would adequately carry the groundwater flowrate. When the LNAPL-recovery rates are relatively high with high groundwater-recovery rates, the systems may need to be engineered to control this situation. At Naval Air Weapons Center (NAWC) China Lake, the LNAPL-recovery rates into the well were high and the LNAPL-extraction rates out of the well were low, so LNAPL accumulated in the well. The thickness of LNAPL increased to greater than the length of the LNAPL-extraction shield on the groundwater/soil-gas drop tube. In this case the length of the shield and the diameter of the LNAPL-extraction drop tube were increase to correct the situation. 6.5 Lessons Learned Some of most important lessons learned during the demonstration of this technology were:
• The in-well separation system was extremely effective at reducing the production of floating solids and suspended emulsions. While the knockout tank was not as effective at reducing the TPH concentrations, it was effective at reducing the groundwater surges through the liquid ring pump.
• The prepump separation units function the same as the conventional bioslurper systems (i.e., the radii of influence are the same, the LNAPL- and groundwater-extraction rates are the same, and equipment sizing should be the same for both configurations).
• The dimensions of the prepump separation equipment may need to be modified to control certain situations with LNAPL or groundwater extraction (as described in Section 6.4).
6.6 End-User Issues Several remedial project managers (RPMs) and environmental contractors were involved in the short-term demonstrations. Of eight sites at which the demonstrations were performed, RPMs at five of the sites continued LNAPL removal at the sites with the dual drop tube system. At the sites that were not selected for further operation with the dual drop tube system, either no further LNAPL recovery was required or a contractor had been selected to perform a different type of LNAPL recovery. 6.7 Approach to Regulatory Compliance and Acceptance As mentioned previously, the prepump separation systems are simple devices added to the conventional bioslurper to minimize TPH concentrations in the aqueous and vapor discharge streams. The conventional bioslurper system has universally gained regulatory approval for LNAPL extraction. The prepump separation systems likely will improve the ease of regulatory acceptance at specific sites because they improve the quality of the discharge streams.

32
7. References
Battelle. 1997. Engineering Evaluation and Cost Analysis for Bioslurper Initiative. Air Force
Center for Environmental Excellence, Brooks Air Force Base, TX. Parker, J.C. 1995. "Evaluating the Effectiveness of Product Recovery, Bioventing, and
Bioslurping Systems." Environmental Systems and Technology News 4:4-6. Place, M., C.T. Coonfare, A.S.C. Chen, R.E. Hoeppel, S.H. Rosansky, 2001. Principles and
Practices of Bioslurping. Battelle Press, Columbus, OH.