TECHNICAL REPORT TPRI PROGRESS MONITORING … · procedures of the TPRI™-PMBR to facilitate...
25
TECHNICAL REPORT TPRI™ PROGRESS MONITORING FOR BEGINNING READERS (2006-2008 EDITION) Center for Academic and Reading Skills University of Texas-Houston Health Science Center And Texas Institute for Measurement, Evaluation, and Statistics University of Houston
Transcript of TECHNICAL REPORT TPRI PROGRESS MONITORING … · procedures of the TPRI™-PMBR to facilitate...

TECHNICAL REPORT
TPRI™ PROGRESS MONITORING FOR BEGINNING READERS
(2006-2008 EDITION)
Center for Academic and Reading Skills
University of Texas-Houston Health Science Center
And
Texas Institute for Measurement, Evaluation, and Statistics
University of Houston

2
TABLE OF CONTENTS
LIST OF TABLES .......................................................................................................................... 3 INTRODUCTION .......................................................................................................................... 4 Overview of TPRI™ Progress Monitoring For Beginning Readers Kit ..........................................4 Components of the TPRI™ PMBR Kit ...........................................................................................5 TPRI™-PMBR Development Study ................................................................................................5
RELIABILITY OF TPRI™–PMBR ............................................................................................... 7 VALIDITY OF TPRI™–PMBR ..................................................................................................... 8 SUMMARY RELIABILITY AND VALIDITY ............................................................................ 9 Equipercentile equating ................................................................................................................ 10

3
LIST OF TABLES
Table 1. Demographic information for the TPRI™-PMBR study .............................................. 12
Table 2. Internal consistency reliability* of the TPRI™-PMBR forms ... 1Error! Bookmark not
defined. Table 3. Correlation of Word List with Test of Word Reading Efficiency ..................................14
Table 4. Correlations of Story Fluency with Test of Word Reading Efficiency ..........................15
Table 5. Equipercentile Equating Chart Grade 1 ......................................................................... 16
Table 6. Equipercentile Equating Chart Grade 2 ......................................................................... 18
Table 7. Equipercentile Equating Chart Grade 3 ......................................................................... 22

4
INTRODUCTION
The TPRI™ Progress Monitoring for Beginning Readers is designed to help teachers
measure first, second, and third grade students’ progress in reading fluency. Proficient reading
entails consolidation of the alphabetic principle and extraction of meaning at the word level.
Fluency, or the ability to read connected text quickly and accurately, is an important component
of proficiency. Fluent readers recognize words in text quickly and automatically, allowing them
to focus attention on the meaning of the passage and on reading with expression.
Research on poor readers in third grade and above shows that intensive intervention can
remediate accuracy, but that fluency gains are more difficult to achieve (Torgesen et al., 2001;
Torgesen, 2002). To develop fluency, children must be engaged in reading and need a strong
sight word vocabulary. This vocabulary develops partly as a result of repeated exposures to
words. If a child is delayed in access to print, or does not spend enough time reading, fluent
reading skills may not emerge. Thus, it is important to prevent reading difficulties from
occurring with effective classroom instruction and early intervention. By identifying students for
whom fluency is an issue, and monitoring fluency as a marker for progress in reading
development, early intervention is facilitated. The TPRI™ Fluency Kit is an individually
administered oral reading fluency assessment that provides teachers with useful information to
ensure that students receive targeted reading instruction that promotes fluency and ensures that
progress can be frequently assessed.
Overview of TPRI™ Progress Monitoring For Beginning Readers Kit
The TPRI™ Progress Monitoring for Beginning Readers (PMBR) Kit is a research-based
assessment tool designed to monitor student progress in Reading Fluency. An accurate and
reliable source of information about student progress, the PMBR Kit is designed to monitor three

5
core aspects of student reading in grades 1, 2, and 3: 1) Reading Accuracy, 2) Reading Fluency,
and 3) Reading Comprehension. Included in the fluency assessment is a timed Word List for
Story Placement that assesses word-reading fluency and also places students into a Story at their
Instructional or Independent Level. Also, reading accuracy and fluency of connected text are
assessed by having students read short and engaging passages. Further, comprehension is
assessed through the use of explicit and implicit comprehension questions. Questions of this
nature enable a teacher to monitor students’ understanding of word meanings, ability to extract
meaning from groups of words (e.g., clauses, sentences, and paragraphs), and ability to draw
inferences.
Components of the TPRI™ PMBR Kit
In order to achieve these assessment goals, the TPRI™ PMBR Kit has three main components:
1. Word List for Story Placement: A list of 50 words selected for high accuracy and
comparable difficulty to word-reading fluency. This list is identical for all grades and
is used in the 6-week schedule only.
2. Reading Accuracy and Fluency Stories: Short passages written to conform to specific
word-level features and story structure based on what is taught at different points at
each grade level.
3. Reading Comprehension: Explicit and implicit questions designed to assess how well
students understand the meaning of the text. For the 2-week schedule, two generic
questions are provided as a tool to keep the focus on reading comprehension.
TPRI™-PMBR Development Study
During the Spring of 2003, the Center for Academic and Reading Skills (CARS) at the
University of Texas Health Science Center–Houston and the Texas Institute for Measurement,

6
Evaluation, and Statistics (TIMES) at the University of Houston conducted a study with 1785
students from grades 1 to 3 to develop forms for regular progress monitoring of young readers’
fluency. Study examiners visited 96 classrooms at 9 schools around Houston Independent
School District. The sample was roughly comparable in gender representation (48% female) and
ethnically diverse across three grades of study. Table 1 shows the ethnicities represented in this
study delineated by gender and also by grade.
Students were asked to complete: (a) Sight Word Efficiency Subtest A from the Test of
Word Reading Efficiency (Torgeson, Wagner, & Rashotte, 1999); (b) a timed sightword list
developed by CARS and TIMES; (c) 2 randomly assigned stories; and (d) eight Reading
Comprehension questions for each of the stories. Stories were randomly assigned within grade
levels. Students unable to read the text were read the story by examiners and comprehension
was administered as Listening Comprehension. On seven of the stories, five comprehension
questions were administered. Reliability and validity information is presented on the 24 stories
that comprise the TPRI™-PMBR. Stories with 5 comprehension items are noted.
After conducting the development study, the centers revised the forms and administration
procedures of the TPRI™-PMBR to facilitate effective classroom use. To this end, procedures
for the two schedules (2-week and 6-week) described above were created. For more frequent
progress monitoring (i.e., every 2 weeks), some elements of the assessment, such as the Word
List for Story Placement, were eliminated in favor of a simpler and time-saving selection of
passages. Also for more frequent progress monitoring less focus is placed upon reading
comprehension. However, reading for meaning is still emphasized by asking students two
generic comprehension questions, such as “What is this story mainly about,” although answers
are not recorded. Thus, the current edition of the TPRI™-PMBR uses the following procedural

7
heuristics: (1) every 2 weeks, students read the next story for 2 minutes and answer 2 questions,
or (2) every 6 weeks, students place into a story using the word list, read the story, and answer 6
questions.
Also, to facilitate meaningful comparisons across forms, an equipercentile equating
procedure has been employed to develop a fluency conversion table. Equipercentile equating
accounts for differences between stories when considering fluency rates and gives educators a
relative assessment of fluency. The rationale and results of the equating are presented below.
RELIABILITY OF TPRI™–PMBR
There are three grade levels the in TPRI™–PMBR: Grade 1, Grade 2, and Grade 3 with
eight stories within each grade. For each story eight (8) Reading Comprehension items were
evaluated. However, on seven (7) of the stories, data were only collected on 5 comprehension
items and have been noted in the tables. Additionally there is a 50-item Word List for Story
Placement; the same items are used for all grades. Thus, there are 25 different forms (3 grades x
8 stories + 1 word list) evaluated for reliability. The teacher’s manual provides explanations for
when to administer each of these forms and the rationale underlying their development.
For each form, a Kuder-Richardson 20 (KR-20) coefficient was computed. For
dichotomously scored items, the KR-20 is analogous to Cronbach’s alpha. The alpha coefficient
ranges from 0 to 1.0 and was reported as the index of internal consistency. High alpha
coefficients indicate that item variability is small relative to total test variability, or that all items
perform similarly, and were all measuring the same construct. We evaluated the practical
significance of the reliability coefficients as follows: Poor (0-.39), Adequate (.40-.59), Good
(.60-.79) and Excellent (.80-1.0). These estimates of practical significance are arbitrary, but
conventional, and provide a useful heuristic for interpreting the reliability data. Since there are

8
only 8 items for the comprehension component and somewhat small samples for individual
stories, we expected a varied range of coefficients across the 24 story forms.
Table 2 shows the reliabilities for the Word List for Story Placement and the 24 story
forms. The Word List for Story Placement has excellent internal consistency reliability, α = .85.
As expected, the 24 story forms range from α = .25 to α = .77. Using the conventions listed
above, the majority (16 or 67%) of the stories show “Adequate” reliability, 5 stories show
“Good” reliability, and 3 stories show “Poor” reliability.
VALIDITY OF TPRI™–PMBR
The TPRI™-PMBR Word List for Story Placement from empirical work across several
prior studies conducted by CARS and TIMES. Item Response Theory (IRT) was used to
establish an item difficulty parameter for each item. Items on this list were chosen for their low
difficulty levels for beginning readers. By parsing “item-difficulty” from “student ability” the
word list is able to disentangle rapid word recognition from decoding. Stories in the TPRI™-
PMBR are linked to the Word List for Story Placement using multiple regression models. The
upper quartile (i.e., 75th percentile) for student’s fluency (words correct per minute, or WCPM)
was identified for each story. Stories that had lower 75th percentile scores indicated a more
difficult story because fewer WCPM indicates that students read such passages slower than those
with higher WCPM scores. For each story a prediction model was run with fluency (WCPM)
rates from the Word List for Story Placement predicted by fluency (WCPM) rates from each
story. From these prediction models, a WCPM value from the Word List for Story Placement
could be identified that corresponds to the 75th percentile score for each passage. Thus, for each
story there is a value that represents the 75th percentile score and a corresponding value on the
Word List for Story Placement. Subsequently, ranges of WCPM rates were created such that

9
each range contained the cutoff for a specific story. Thus, a student’s WCPM on the Word List
for Story Placement can be linked to 75th percentile performance on the story indicated on the
placement criteria. Performance on these items is then used to place students into stories of
appropriate difficulty.
Correlations between the Word List for Story Placement and the Sight Word Efficiency
Subtest A from the Test of Word Reading Efficiency (Torgeson, Wagner, & Rashotte, 1999) for
the three different grade levels are presented in Table 3. At all three grade levels the Word List
for Story Placement correlates highly (>.80) with the Test of Word Reading Efficiency.
Fluency estimates from each of the 24 stories in the PMBR were also correlated with the
TOWRE – Sight Word Efficiency Subtest A and are presented in Table 4. All correlations are
significantly greater than zero at p < .01 and range from .43 to .90. Twenty of the 24 stories
(83%) were correlated greater than .70, three (13%) between .50 and .70, and one story
correlated .43 with TOWRE.
SUMMARY RELIABILITY AND VALIDITY
To summarize, the 25 forms of the TPRI™-PMBR show varied internal consistency
reliability and excellent validity. The majority of forms (22/25 or 88%) show “Adequate” or
“Good” reliability using the heuristics above. Similarly, all but 2 of the forms show excellent
validity, correlating with the TOWRE around r = .70 or above. While these demonstrate
minimally adequate properties, refinement is necessary. Further developmental work is being
undertaken to improve the reliability, validity, and usability of future editions of the TPRI™-
PMBR.

10
EQUIPERCENTILE EQUATING
In order to equate fluency scores (WCPM) across the different stories, we used an equipercentile
equating method rather than linear equating. Linear equating would adjust scores for differences
across forms in the mean and standard deviation, such that the resultant scale scores for different
forms will have the same mean and standard deviation. However, linear equating assumes that
the same adjustment should be made throughout the distribution of WCPM scores in order to
equate fluency scores taken from different stories. In contrast, equipercentile equating is more
general in that it allows that the relation between the two forms may change across the range of
scores on the base form. For example, it could be that Chirp is more difficult over one score
range than the passage to be equated, but easier over another score range. Alternatively, it could
be that the difference between forms is not consistent throughout the range of WCPM scores
such that one adjustment is needed for the lowest scores and another adjustment is needed for
scores near the center, and still another adjustment for scores at or near the top. Equipercentile
equating can take these differences into account.
To calculate the equiperentile rank for a target score, the cumulative percentage of the
scores below the target score is added to one half the percentage of cases who obtained the target
score. For example, if 70% of test takers achieve a score 19 or less on a given test and 5% of
individuals earn a score of 20, then the equipercentile rank of 20 is 72.5. The reason that the
equipercentile ranking is not equal to the cumulative percent at a given score draws from
psychological measurement theory (Blommers & Forsyth, 1977).
Through the conversion of raw scores to equipercentile ranks, students’ scores on
nonequivalent forms can be compared. However, when comparing scores across a large number
of tests it may be more useful to determine the raw scores that correspond to specific integer

11
percentiles. These conversions utilize a similar rationale to the raw score conversions to
equipercentile ranks described above, but determine the WCPM score on a given form that is
associated with specific percentiles. This latter approach facilitates the creation of conversion
tables that can handle multiple forms at the same time.
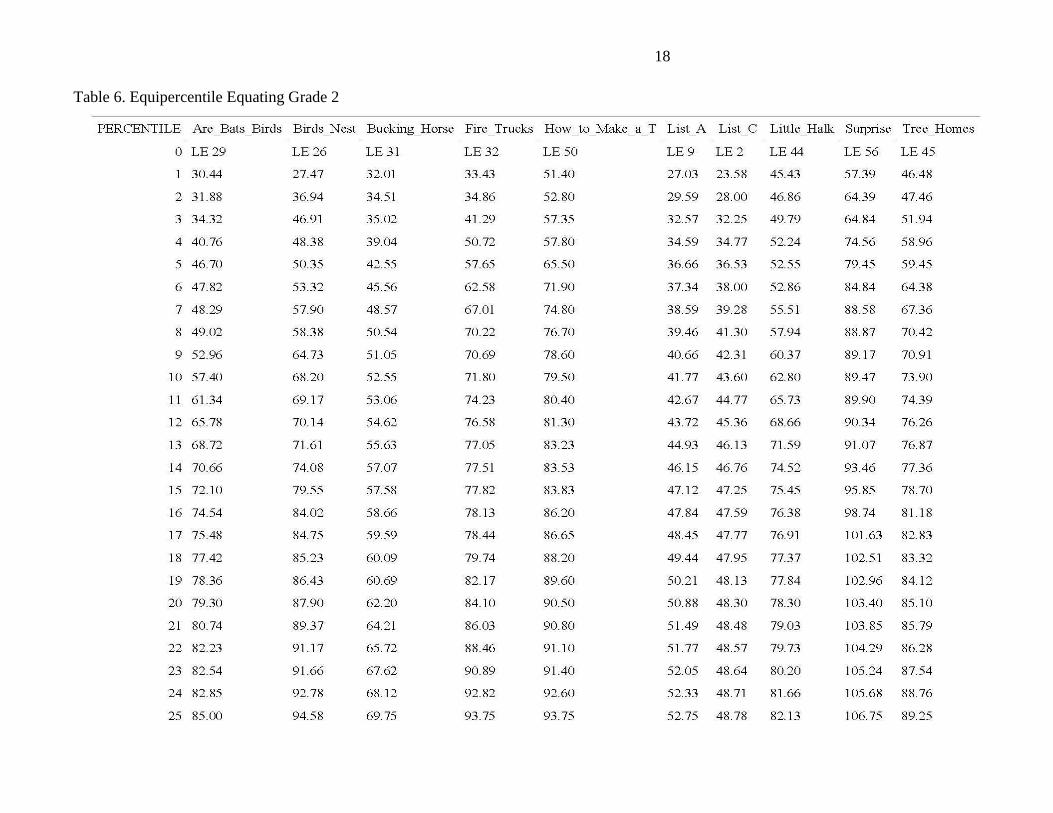
Tables 5-7 provide equipercentile conversions for the eight fluency stories per grade back
to a common scale score where the scale score gives the percentile rank for the student. That is,
the columns of Tables 5-7 give scores for each of the eight stories per grade associated with a
particular integer percentile rank. To use the table, a teacher would simply locate the title of the
story that the child had been asked to read. The teacher would then read down the column until
she/he found the WCPM score for the specific child or, more commonly, found the two rows that
bracket the student’s score. The teacher would then read across the rows to the column marked
percentile and find the entry in the percentile column associated with the row (or set of rows) for
the student’s score. To get the most precise score, linear interpolation could be used. However,
teachers could also round up or down with only slight loss of accuracy.

12
Table 1. Demographic information for the TPRI™-PMBR study.
Grade Gender Ethnicity
Unreported
African-
American Caucasian Hispanic Other Total
Grade
1
Unreported 11 0 0 0 1 12
Female 2 90 136 41 37 306
Male 2 101 138 45 43 329
Total Grade 1 15 191 274 86 81 647
Grade
2
Unreported 2 0 0 0 0 2
Female 2 94 138 44 28 306
Male 1 74 148 52 25 300
Total Grade 2 5 168 286 96 53 608
Grade
3
Unreported 4 0 1 1 0 6
Female 0 75 101 48 21 245
Male 0 95 120 46 18 279
Total Grade 3 4 170 222 95 39 530
Total 24 529 782 277 173 1785

13
Table 2. Internal consistency reliability* of the TPRI™-PMBR forms.
Alpha N
Word List for Story Placement (50 items) .85 1448
Reading Comprehension by Grade by Story†
Grade 1–1 My Cat Sam (8 items) .57 94
Grade 1–2 Bud Gets the Ball (8 items) .45 99
Grade 1–3 Fun in the Sand (8 items) .56 98
Grade 1–4 Running (8 items) .70 93
Grade 1–5 Big Dog (8 items) .53 83
Grade 1–6 Playing House (5 items)† .59 86
Grade 1–7 The Goat (8 items) .66 74
Grade 1–8 Chirp (5 items)† .33 82
Grade 2–1 Surprise (8 items) .25 91
Grade 2–2 How to Make a Telephone(8 items) .51 90
Grade 2–3 Bird’s Nest (5 items)
† .52 96
Grade 2–4 Bucking Horse (5 items)† .55 100
Grade 2–5 Are Bats Birds? (8 items) .57 95
Grade 2–6 Tree Homes (5 items)† .36 98
Grade 2–7 Fire Trucks (8 items) .77 91
Grade 2–8 Little Hawk (5 items)† .58 94
Grade 3–1 Animals (8 items) .67 74
Grade 3–2 Michelangelo (5 items)† .41 72
Grade 3–3 Frogs and Toads (8 items) .55 79
Grade 3–4 Catching Grasshoppers (8 items) .41 94
Grade 3–5 Lakes and Streams (8 items) .54 94
Grade 3–6 Trees (8 items) .59 73
Grade 3–7 Swimming Pool (8 items) .75 82
Grade 3–8 Robins (8 items) .48 84
* Reliabilities reported are Kuder-Richardson 20 (KR20) coefficients for internal
consistency of dichotomous items, analogous to coefficient alpha.
† Additional questions have been added and are currently under evaluation.

14
Table 3. Correlation of Word List with Test of Word Reading Efficiency.
Grade
Word List for Story Placement &
TOWRE Sight Word Efficiency Form A
All Grades .90
1 .93
2 .82
3 .85
All correlations are significant at p < .01.

15
Table 4. Correlations of Story Fluency with Test of Word Reading Efficiency.
Story Word List for Story Placement &
TOWRE Sight Word Efficiency Form A
Grade 1–1 My Cat Sam .90
Grade 1–2 Bud Gets the Ball .85
Grade 1–3 Fun in the Sand .87
Grade 1–4 Running .82
Grade 1–5 Big Dog .59
Grade 1–6 Playing House .74
Grade 1–7 The Goat .79
Grade 1–8 Chirp .77
Grade 2–1 Surprise .69
Grade 2–2 How to Make a Telephone .69
Grade 2–3 Bird’s Nest .80
Grade 2–4 Bucking Horse .76
Grade 2–5 Are Bats Birds? .78
Grade 2–6 Tree Homes .79
Grade 2–7 Fire Trucks .80
Grade 2–8 Little Hawk .75
Grade 3–1 Animals .73
Grade 3–2 Michelangelo .77
Grade 3–3 Frogs and Toads .82
Grade 3–4 Catching Grasshoppers .75
Grade 3–5 Lakes and Streams .43
Grade 3–6 Trees .84
Grade 3–7 Swimming Pool .72
Grade 3–8 Robins .78
All correlations are significant at p < .01.

Table 5. Equipercentile Equating Grade 1

17
Table 5. Equipercentile Equating Grade 1 – Cont.
18
Table 6. Equipercentile Equating Grade 2

19
Table 6. Equipercentile Equating Grade 2

20
Table 6. Equipercentile Equating Grade 2

21
Table 6. Equipercentile Equating Grade 2

22
Table 7. Equipercentile Equating Grade 3

23
Table 7. Equipercentile Equating Grade 3

24
Table 7. Equipercentile Equating Grade 3

25
Table 7. Equipercentile Equating Grade 3