
Technical Report TA User Project 4D-Power · Document Version: 1 Revision / Status: draft All...
39
ERIGrid GA No: 654113 11/1/2015 TA User Project: 01.012-2016 Revision / Status: draft 1 of 39 European Research Infrastructure supporting Smart Grid Systems Technology Development, Validation and Roll Out Technical Report TA User Project 4D-Power Grant Agreement No: 654113 Funding Instrument: Research and Innovation Actions (RIA) – Integrating Activity (IA) Funded under: INFRAIA-1-2014/2015: Integrating and opening existing national and regional research infrastructures of European interest Starting date of project: 01.11.2015 Project Duration: 54 month Contractual delivery date: 01/10/2017 Actual delivery date: 05/12/2015 Name of lead beneficiary for this deliverable: Dr. Reza Arghandeh, Florida State University Deliverable Type: Report (R) Security Class: Confidential, only for members of the consortium (including the Commission Services) (CO) Revision / Status: draft Project co-funded by the European Commission within the H2020 Programme (2014-2020)
Transcript of Technical Report TA User Project 4D-Power · Document Version: 1 Revision / Status: draft All...

ERIGrid GA No: 654113 11/1/2015
TA User Project: 01.012-2016 Revision / Status: draft 1 of 39
European Research Infrastructure supporting Smart Grid Systems Technology Development, Validation and Roll Out
Technical Report TA User Project
4D-Power
Grant Agreement No: 654113
Funding Instrument: Research and Innovation Actions (RIA) – Integrating Activity (IA)
Funded under: INFRAIA-1-2014/2015: Integrating and opening existing national and regional research infrastructures of European interest
Starting date of project: 01.11.2015
Project Duration: 54 month
Contractual delivery date: 01/10/2017
Actual delivery date: 05/12/2015
Name of lead beneficiary for this deliverable: Dr. Reza Arghandeh, Florida State University
Deliverable Type: Report (R)
Security Class: Confidential, only for members of the consortium (including the Commission Services) (CO)
Revision / Status: draft
Project co-funded by the European Commission within the H2020 Programme (2014-2020)

ERIGrid GA No: 654113 11/1/2015
TA User Project: 01.012-2016 Revision / Status: draft 2 of 39
Document Information Document Version: 1
Revision / Status: draft All Authors/Partners Reza Arghandeh/ FSU
Jose Cordova/ FSU
Distribution List EriGrid consortium members Document History
Revision Content / Changes Resp. Partner Date
1 The full report Reza Arghandeh 05/10/2018
Document Approval
Final Approval Name Resp. Partner Date
Disclaimer This document contains material, which is copyrighted by certain ERIGrid consortium parties and may not be reproduced or copied without permission. The information contained in this document is the proprietary confidential information of certain ERIGrid consortium parties and may not be disclosed except in accordance with the consortium agreement. The commercial use of any information in this document may require a licence from the proprietor of that information. Neither the ERIGrid consortium as a whole, nor any single party within the ERIGrid consortium warrant that the information contained in this document is capable of use, nor that the use of such information is free from risk. Neither the ERIGrid consortium as a whole, nor any single party within the ERIGrid consortium accepts any liability for loss or damage suffered by any person using the information. This document does not represent the opinion of the European Community, and the European Community is not responsible for any use that might be made of its content. Copyright Notice © The ERIGrid Consortium, 2015 – 2020

ERIGrid GA No: 654113 11/1/2015
TA User Project: 01.012-2016 Revision / Status: draft 3 of 39
Abbreviations
DER Distributed Energy Resource
TA Trans-national Access
PMU Phasor Measurement Units
uPMU Micro Phasor Measurement Units
AIT Austrian Institute of Technology
FSU Florida State University
PDC Phasor Data Concentrator

ERIGrid GA No: 654113 11/1/2015
TA User Project: 01.012-2016 Revision / Status: draft 4 of 39
Table of Contents Table of Contents ......................................................................... Error! Bookmark not defined.
List of Figures .............................................................................................................................. 5
Executive Summary ........................................................................................................................ 7
1 General Information of the User Project ................................................................................... 9
2 Research Motivation .............................................................................................................. 10
2.1 Objectives ....................................................................................................................... 10
2.2 Scope ............................................................................................................................. 11
3 State-of-the-Art and State-of-Technology ............................................................................... 12
4 Executed Tests and Experiments ........................................................................................... 14
4.1 Test Plan ........................................................................................................................ 14
4.2 Standards, Procedures, and Methodology ...................................................................... 15
4.2.1 Standards used in the tests ..................................................................................... 15
4.2.2 Network Models ....................................................................................................... 15
4.2.3 Description of Testbed Components ........................................................................ 17
4.3 Testbed Configuration ..................................................................................................... 23
4.3.1 Test Procedures ...................................................................................................... 24
5 Executed Tests and Experiments ........................................................................................... 26
5.1 Experiment 1 through 5 - Simulating fault events with 8 virtual PMUs and 2 physical PMUs 26
5.1.1 Short description ...................................................................................................... 26
5.1.2 Setup ....................................................................................................................... 26
5.1.3 Scenarios................................................................................................................. 27
5.1.4 Models ..................................................................................................................... 27
5.1.8 Results .................................................................................................................... 31
6 Conclusions ........................................................................................................................... 33
7 Open Issues and Suggestions for Improvements ................................................................... 34
7.1 Issues and Problems during test-setup ........................................................................... 34
7.1.1 API Python for fault simulation..................................................................................... 34
7.2 Established, ongoing and future collaborations ............................................................... 35
7.3 Open Issues and Future Works ...................................................................................... 36
7.4 Dissemination Planning .................................................................................................. 36
8 References ............................................................................................................................ 36
9 Annex .................................................................................................................................... 38
9.1 Python code for Fault Sequence ..................................................................................... 38

ERIGrid GA No: 654113 11/1/2015
TA User Project: 01.012-2016 Revision / Status: draft 5 of 39
List of Figures Figure A: Overall Scheme of 4D-Power Testbed Tasks .................................................................. 7 Figure 1. Scheme of the real-time evaluation framework (4D-Power)............................................ 11 Figure 2: Overall Scheme of 4D-Power Testbed Tasks ................................................................. 12 Figure 3: Overall Scheme of 4D-Power Testbed Equipment ......................................................... 15 Figure 4: IEEE 123-Nodes Test Feeder [13]. ................................................................................ 16 Figure 5: Voltage Drop Diagram (balanced) of the IEEE 123-Nodes Test Feeder. ........................ 17 Figure 6. PSL MicroPMU .............................................................................................................. 18 Figure 7: Web interface for PSL PQube mPMU ............................................................................ 19 Figure 8: Artemes AM-10-PA2 providing 2 MSamples/Sec/channel .............................................. 20 Figure 9: Web interface for Artemes AM-10-PA2 providing real time visualization and offline analysis ......................................................................................................................................... 20 Figure 10: GPS antenna installation .............................................................................................. 23 Figure 11: Detailed setup for most of the experiments .................................................................. 24 Figure 12: Virtual and Real PMU measurements setup using FPGA outputs ................................ 25 Figure 13: 4D-Power Physical Setup. ............................................................................................ 26 Figure 14: IEEE 123 bus test feeder: Single line diagram with fault locations ................................ 27 Figure 15: IEEE 123-nodes test feeder model in ePhasorsim with 8 virtual PMUs ........................ 28 Figure 16: Model of the probes and controls of IEEE 123-nodes test feeder. ................................ 29 Figure 17: Model Configuration: Connections of the PMU signals to the C37.118 slave driver (above) ......................................................................................................................................... 29 Figure 18: OpenPDC (example screenshot) for receiving, concentrating and streaming ............... 30 Figure 19: Jupyter notebook for Python processing ...................................................................... 31 Figure 20: PgAdmin for PostgreSQL database management. ....................................................... 31 Figure 21: Three-phase Voltage Magnitude of one virtual PMU. ................................................... 32 Figure 22: Phase A Voltage Magnitude for PMUs connected at Nodes 95 (OPALRT-PMU_2), 197 (OPALRT-PMU_3), and 250 (OPALRT-PMU_4). .......................................................................... 32 Figure 23: Phase B Voltage Magnitude for Real PMUs connected at Nodes 149 (ARTEMES-PM2), and 13 (PSL_UPMU-PM2). ........................................................................................................... 32 Figure 24: Three-phase Voltage Magnitude of one real PMU (PSL_UPMU). ................................ 33 Figure 25: Three-phase Voltage Magnitude of one real PMU (ARTEMES). .................................. 33 Figure 26: Error in API Python using ePhasorsim library. .............................................................. 34 Figure 27: API Python in RT-Lab working properly. ....................................................................... 35 Figure 28: Seconds time lead for Artemes device ......................................................................... 35

ERIGrid GA No: 654113 11/1/2015
TA User Project: 01.012-2016 Revision / Status: draft 6 of 39
List of Tables Table 1: Number of FPGA outputs ................................................................................................ 21 Table 2: Configuration of Opal-RT I/O Interface FPGA outputs ..................................................... 21 Table 3: Timeline of 3D-Power Experiment Setup ......................................................................... 24

ERIGrid GA No: 654113 11/1/2015
TA User Project: 01.012-2016 Revision / Status: draft 7 of 39
Executive Summary Distribution networks are increasingly turning to dynamic and complex systems as new paradigms are becoming more ubiquitous such as the integration of distributed energy sources, software enabled power electronic inverters and controllable loads. The interconnectivity and interdependency of all these newcomers introduce numerous novel events in dynamic, transient and steady state scales which are unknown for the conventional monitoring, diagnostics, protection and distribution automation systems. Measurement devices like synchrophasors (e.g., PMU) together with real-time data processing and analysing are becoming more and more important to tackle these challenges even in distribution systems. This project is an effort to leverage the PMU sensing devices for distribution networks. The study takes advantage of a realistic experimental setup by AIT SmartEST together with the new advancements in machine learning, signal processing, and time series analysis for fault detection in distribution networks.. This will be achieved with the sophisticated Hardware-in-the-Loop (HIL) and Software-in-the-Loop (SIL) facilities in the AIT under the ERIGrid Transnational Access program. Figure A presents a graphical view of the proposed scheme of real-time evaluation framework for the development of the 4D-Power project.
Figure A: Overall Scheme of 4D-Power Testbed Tasks
The main objective of the Data-Driven Detection of Events in Distribution Power Systems (4D-Power) project is fault detection in power distribution networks using PMU measurements in a hardware-in-the-loop (HIL) setup that resemble the real-life communication streaming conditions. A real-time simulated distribution grid, the IEEE 123-nodes test feeder is modeled inside the OPAL-RT multicore target in real-time. The 4D-Power is an extension to the 3D-Power ERIGrid TA project in Summer 2017 by the FSU user group in collaboration with AIT, ARTEMES, OPAL-RT, PSL and Siemens. The 4D-Power will include the generation of 10,000 fault events in order to build a large data repository for Machine Learning algorithms training and validation. 4D-Power is an international team including FSU (USA), AIT (Austria), Opal-RT (Canada), and got support from two PMU manufactures, PSL (USA), and ARTEMES (Austria). In general, the 4D-Power project is divided in the following steps:
Objective 1: Expanding the fault detection scenarios to real world condition using a distribution network model on OPAL-RT HIL and actual PMUs.
Objective 2: develop a large set of fault events that resemble the real-field mining and streaming of measurements obtained in distribution networks for training, testing and subsequent validation of machine learning algorithms. In that sense, 4D-power has created approximately 10,000 fault events that emulate a network’s random conditions.
Objective 3: analysing the PMU streams collected data using the advanced machine learning algorithms for event detection developed by the user group.

ERIGrid GA No: 654113 11/1/2015
TA User Project: 01.012-2016 Revision / Status: draft 8 of 39
Objective 4: working closely with industry partners and measurement device manufacturers for analysing impact of multi-vendor PMU desynchronization on event detection.

ERIGrid GA No: 654113 11/1/2015
TA User Project: 01.012-2016 Revision / Status: draft 9 of 39
1 General Information of the User Project
USER PROJECT INFORMATION
User Project Acronym 4D-Power
User Project Title Data-Driven Detection of Events in Distribution Power Systems (4D-Power):
Event Detection in Power Distribution Networks Using PMU Measurement and HIL Test beds.
Main scientific/technical field
Distribution Network Monitoring, Phasor Measurement Units, Synchronization, Hardware-in-the-Loop Tests, Data Analysis, Event Detection
Keywords (5 max., free
text) Monitoring, Diagnostics, Synchronization, PMU, Networked Inverters
Host Research Infrastructures
Austrian Institute of Technology (AIT)
Starting date for the access
July 18th 2018

ERIGrid GA No: 654113 11/1/2015
TA User Project: 01.012-2016 Revision / Status: draft 10 of 39
2 Research Motivation
2.1 Objectives
The objective of the Data-Driven Detection of Events in Distribution Power Systems (4D-Power) project is event detection in power distribution networks using PMU measurements in a hardware-in-the-loop (HIL) setup that resemble the real-life PMU monitoring systems. The IEEE 123-nodes test feeder is modeled inside the OPAL-RT multicore target in real-time coupled with PSL and ARTEMES PMUs. Fig. 1 shows the overall scheme of the fully-synchronized multi vendors PMU real-time testbed for diagnostics. The 4D-Power is an extension to the 3D-Power ERIGrid TA project in Summer 2017 by the FSU user group in collaboration with AIT, ARTEMES, OPAL-RT, PSL, and Siemens. The network model operates under normal conditions before setting different fault types (balanced and unbalanced) for events detection and classification purposes. The user group used the API Python in the Opal-RT Target to generate approximately 10,000 fault events with randomly-generated fault impedances in different locations across the IEEE 123-nodes test feeder.
The user group used the open-source phasor data concentrator (OpenPDC) to retrieve the synchrophasor readings and store them in a database with support for free alternatives such PostgreSQL and CSV files creation. The collected data in this project will utilize the continuous research of FSU team on advanced machine learning for real-time diagnostic applications (e.g., HS3M [15], CHMM [16], RFRM-HCA [7], etc.). In summary, this EriGrid project (4D-Power) objecives are as follow:
Objective 1: Expanding the fault detection scenarios to real world condition using a distribution network model on OPAL-RT HIL and actual PMUs.
Task 1.1. Create different fault scenarios across the IEEE 123-nodes test feeder network for data streaming.
Task 1.2. Making fault scenarios more realistic by changing fault impedance randomly to resemble real life operational conditions in distribution networks.
Objective 2: develop a large set of fault events that resemble the real-field mining and streaming of measurements obtained in distribution networks for training, testing and subsequent validation of machine learning algorithms.
Task 2.1 Implement the developed machine learning methods in FSU for event detection on data streams from OPAL-RT setup. Some Preliminary options are algorithms that have been developed previously by FSU team such as Shape Data Analysis (SDA) and other classical machine learning algorithms.
Objective 3: analysing the PMU streams collected data using the advanced machine learning algorithms for event detection developed by the user group.
Objective 4: working closely with industry partners and measurement device manufacturers for analysing impact of multi-vendor PMU desynchronization on event detection.

ERIGrid GA No: 654113 11/1/2015
TA User Project: 01.012-2016 Revision / Status: draft 11 of 39
Figure 1. Scheme of the real-time evaluation framework (4D-Power)
2.2 Scope The smart grid revolution is creating a paradigm shift in distribution networks including the dramatic increase in the adoption of distributed energy resources (DER), electric vehicles, energy storage, and controllable loads. This transformation imposes new challenges on existing distribution infrastructure and system operations for stockholders, engineers, operators and customers. Unfortunately, distribution networks historically lag behind transmission networks in terms of observability, measurement accuracy, and data granularity. The changes in the operation of the electric grid dramatically increase the need for tools to monitor and manage distribution networks in a fast, reliable and accurate fashion. The introduction of powerful and accurate measurement devices in the distribution network side such as Phasor Measurement Units (PMU) and the recently introduced Micro-PMU (uPMU) [2], support these tools as a reliable solution. This project intends to advance towards the applications of high-precision PMUs using an Opal-RT Hardware-In-the-Loop setup combined with the OpenPDC platform to emulate the actual Phasor Data Concentrator (PDC) that collects data from multiple actual PMU made by different vendors, including PSL, and ARTEMES. Furthermore, this work is focused on producing realistic data set of different fault events in distribution networks. Data sets that include the different faults are scarce and often unlabelled. Therefore, it is challenging for new machine learning, signal processing, and statistical methods to be tested and validated for fault detection applications. Hence the proposed experiment paves the way for understanding needs and requirements for PMU data in laboratory setups for future standardization related testing objectives.
This project was performed during the summer 2018 in four main tasks:

ERIGrid GA No: 654113 11/1/2015
TA User Project: 01.012-2016 Revision / Status: draft 12 of 39
1. Expanding the created experimental setup by the team in 2017 and use the scaled up testbed to provide realistic scenarios in distribution networks using actual and virtual PMU data streams.
2. Develop a data repository resembling the real-field PMU streams for different fault events visualization and future statistical analysis. The PMU streams are collected with an online Phasor Data Concentrator that relocates the timestamped measurement to a database.
3. Data mining, data repository and data analysis for produced real-time PMU data stream from tasks 1. Then, apply the developed machine learning sis algorithms in FSU to explore advantages of PMU devices for fault detection in distribution networks.
4. Reporting the results and provide future plan for expanding the study in 2019, and future publication plan.
Figure 2: Overall Scheme of 4D-Power Testbed Tasks
3 State-of-the-Art and State-of-Technology
Synchrophasors (PMUs), which provide 60-120 measurements per second, have been introduced to the grid in the last decade [1]. However, thus far, they have not been utilized to observe the entire grid. Historically, distribution networks have lagged behind transmission systems regarding observability and data granularity. Considering a large number of connected DER Inverters and controllable loads in distribution networks in coming years, the lack of observability will create more challenges for distribution network reliability, stability, and security. Additionally, data processing techniques need to be adapted for power distribution system applications.
The actual monitoring systems in distribution networks lack the integrity to observe interdependency between different components or the dynamics of the grid under various conditions.
The PI, Dr. Arghandeh, has an extensive experience in distribution monitoring system design, power systems transparency, power system physical-based modeling, and data analysis applications. With the UC Berkeley team and PSL, he was involved in the development of the “Microsynchrophasor (uPMU) for distribution network” with a U.S. DOE ARPA-E grant [2]. Micro-PMUs are high accuracy, high-resolution PMUs customized for power distribution systems [3]. The actual data from μPMUs enables visualization of never before observable quantities, and to develop novel applications in power distribution networks. Using the PMU data, the PI has developed topology detection [4], state estimation [5], phase identification [6] and fault event classification [7] applications for distribution networks. Additionally, the “IEEE Working Group on Distribution Power Quality Monitoring,” of which Dr. Arghandeh serve as secretary, is in the process of revising the IEEE-1159 standard for monitoring systems to include new types of sensors. The proposed research in AIT if success will provide a valuable dataset for the IEEE WG of Monitoring standard revision. The available hardware-in-the-loop (HIL) and software-in-the-loop (SIL) facilities in AIT in SmartEST along with their power quality measurement devices will help us to emulated and record the different high-frequency data mentioned for further analysis.

ERIGrid GA No: 654113 11/1/2015
TA User Project: 01.012-2016 Revision / Status: draft 13 of 39
There is a necessity for a Hardware-In-the-Loop (HIL) and Software-In-the-Loop (SIL) testbed setup for providing realistic electricity flows in different scenarios. Moreover, a testbed for validating PMUs from different vendors side by side did not exist to the knowledge of this team. In fact, none of the studies from the literature introduces a real-life, and controlled PMU measurements approach necessary for validating different Machine Learning algorithms.
One of the main goals of this project is expanding the outcomes of the 3D-Power project, performed by FSU and AIT in Summer 2017, and creating an experimental HIL setup for diagnostics and studying the behaviour of distribution networks using the time-synchronized measurement from real and virtual PMUs. Moreover, simulating a large number of events is a key to provide training and validation dataset for machine learning techniques.
Several real-time platforms have been developed for HIL simulation mostly for action-control setup and tuning. The FSU user group suggested using of OPAL-RT/RT-Lab as a solution for modeling different fault event scenarios. RT-Lab is fully integrated with MATLAB/Simulink that has been used widely in many fields of engineering. Additionally, it provides a real-time power systems simulation environment along with a reliable PMU model that works under the IEEE C37.118 protocol. In addition to supporting real-time EMT simulation of networks with hundreds of nodes, the OPAL-RT platform also has the ability to simulate networks with thousands of nodes in the phasor domain in real-time. This capability will be explored in the context of scaling up the application of the machine learning algorithms to utility scale.
The team have developed an HIL-SIL testbed environment during the EriGrid 3D-Project and addressed the practical challenges for GPS and FPGA clock synchronization for the integration of real and virtually modeled PMUs, using the Precision Time Protocol (PTP). PTP is a network-based standard that provides nanosecond accuracy of synchronization needed for PMU synchronization applications. As a result of the 3D-Power execution, the user group has published their findings in [20] and [21].
Regarding the data analysis, several work studies have been performed in the field of machine learning and data-driven modeling of power systems with PMU data streams. Brahma et al. [10], proposed PMU data streams as the solution to visualize the dynamics in Power Systems with several machine learning methods such as SVM, Shapelet, and Slope Shapelet based methods. However, they performed an offline simulation to manage the ML task. In [11], Innah et al. proposed a simulated testbed consisting only of virtual PMUs in a 14 Nodes test feeder. A similar approach was performed by Chandra et al. in [12] for real-time state estimation in a 39 nodes test grid. In [13], Liang et al. present an expert system approach for fault types classification that does not require the topology of the network. This method was validated with a small dataset of 60 fault events recorded by BPA’s power grid. Another Wavelet-based approach by Kim et al. in [14]. In this approach, a large number of PMUs were required for testing and validating their technique for generator trip detection (anomaly), as well as having real-field data measurements.
In recent years, the availability of massive streaming data from the smart grid imposes new algorithms and optimization for machine learning frameworks. The FSU team has expertise and track of research in the area of machine learning method application for event detection and diagnostics in power system.
In our recent study to minimize the need for expert knowledge, we proposed a novel semi-supervised/unsupervised learning method for event detection using the topological distribution of data sets with partial information. It is called the Hidden Structure Semi-Supervised Machine (HS3M) [17]. Furthermore, the encapsulated interdependency among data streams from different
ERIGrid GA No: 654113 11/1/2015
TA User Project: 01.012-2016 Revision / Status: draft 14 of 39
PMUs in different location of the grid makes the fault detection and diagnostics a complex task. However, it can reveal tremendous information on events occurrence and their propagation throughout the network. We have developed the Contextual Hidden Markov Model (CHMM) that allows revealing infinite temporal and spatial dependence among real-time data streams from distributed sensors in networked systems [C36]. The idea is to use hidden Markovian variables as the core for modelling temporal dependence and to combine observation nodes together with contextual hidden variables to include spatial/channel dependence. The other study by FSU team to minimize the need for expert knowledge proposed a novel a shape-based analysis used for fault type classification has been developed by the user group. The method uses a novel approach based on a time-alignment under Fisher-Rao metric technique to preserve the time-series shape of a fault signal and performs a classification process with hierarchical clustering [7]. In [21], the FSU group expanded the work presented in [7] by adding an incremental learning layer based on the Karcher mean, a method for retaining the characteristic shape of the clustered events.
The ERIGRID support for 4D-Power gave the FSU team a chance to collect realistic fault data from a network of PMUs. The team will use the dataset from AIT SmartEST HIL to validate his novel data-driven event detection methods. 4 Executed Tests and Experiments 4.1 Test Plan
Figure 3 shows the overall scheme of the evaluation framework for the experimental setup of real-time PMU data streaming under fault conditions. A real-time simulated distribution grid (e.g. IEEE test feeders) was modelled in the multicore Opal-RT real-time simulator provided by the Smart Electricity Systems and Technologies Laboratory (SmartEST) connected to two PMUs from different vendors. The solver of choice for the real-time simulation is ePhasorsim, an Opal-RT tool that has the advantage of having an Application Programming Interface (API) in Python. This feature allows running a script with different control signals in an automatic manner. In 4D-Power, the user group utilized the API Python to execute a sequence of faults with randomly-generated impedances in order to have a large dataset for event detection algorithms’ training and testing purposes. There are several virtual PMUs using PMU model provided by Opal-RT/ePhasorsim. The network of virtual and actual PMUs operates under normal conditions prior to setting different fault types (balanced and unbalanced) to obtain random fault scenarios for detection and classification testing purposes. Communication setup complies with the IEC 61850 and the phasor magnitude, and angle measurements are then streamed under the IEEE standard C37.118. An open-source phasor data concentrator (i.e., OpenPDC) used to retrieve the synchrophasor readings and store them in the database with support for free alternatives such as PostgreSQL. Finally, the machine learning and statistical algorithms in R and Python are executed to determine the fault event locations and classification.

ERIGrid GA No: 654113 11/1/2015
TA User Project: 01.012-2016 Revision / Status: draft 15 of 39
Figure 3: Overall Scheme of 4D-Power Testbed Equipment
The following section describes different test experiment setups while also presents their primary objectives, standards used, lessons learned and results. Additionally, an outline of the components used and equipment setup is also provided.
4.2 Standards, Procedures, and Methodology
4.2.1 Standards used in the tests IEEE C37.118.2-2011 Time synchronization allows the monitoring network to locate phasors in the same network, with more precise frequency, and shift angle readings. Synchronized electrical parameters are obtained from the network by Phasor Measurement Unit (PMU) which can stream data with highly accurate GPS clock time stamps. Standard C37.118.2-2011 is intended to cover synchrophasor measurements and synchrophasor data transfer for power systems. The standard specifies messaging including types, use, contents and data formats for its use with any suitable real-time communication protocol between PMUs, phasor data concentrators (PDC), and other applications [13]. 4.2.2 Network Models Test Feeder IEEE 123-nodes
ERIGrid GA No: 654113 11/1/2015
TA User Project: 01.012-2016 Revision / Status: draft 16 of 39
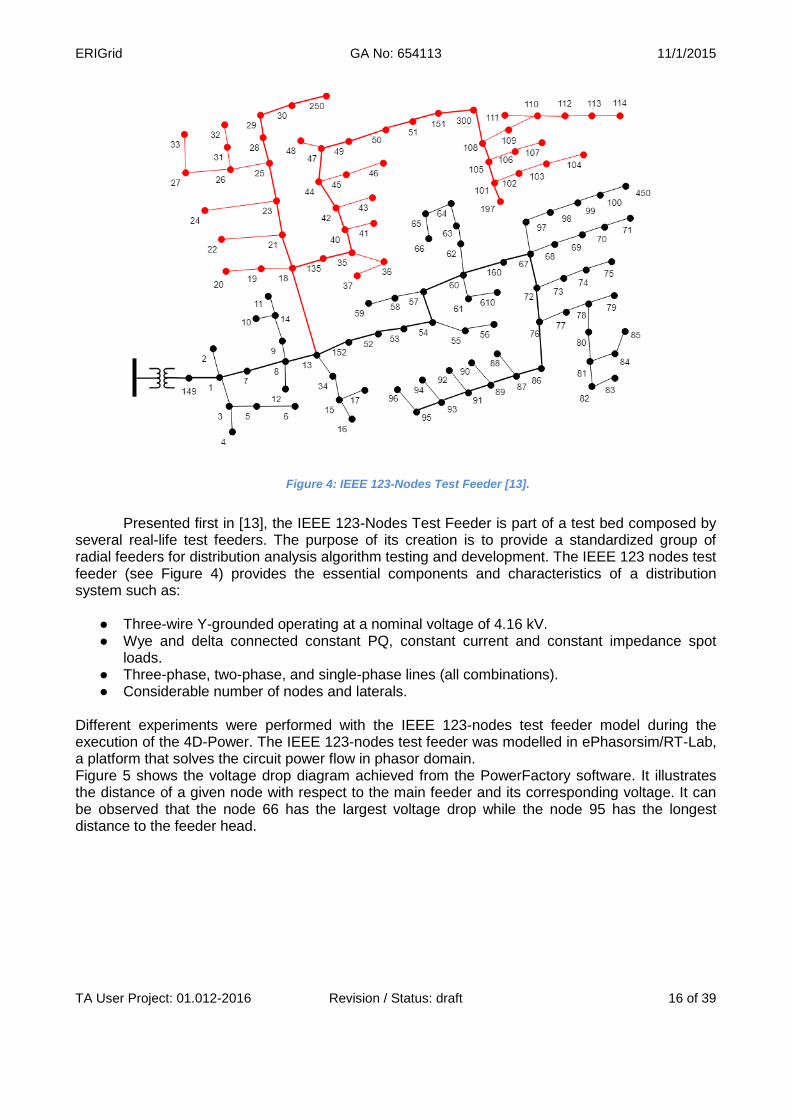
Figure 4: IEEE 123-Nodes Test Feeder [13].
Presented first in [13], the IEEE 123-Nodes Test Feeder is part of a test bed composed by
several real-life test feeders. The purpose of its creation is to provide a standardized group of radial feeders for distribution analysis algorithm testing and development. The IEEE 123 nodes test feeder (see Figure 4) provides the essential components and characteristics of a distribution system such as:
● Three-wire Y-grounded operating at a nominal voltage of 4.16 kV. ● Wye and delta connected constant PQ, constant current and constant impedance spot
loads. ● Three-phase, two-phase, and single-phase lines (all combinations). ● Considerable number of nodes and laterals.
Different experiments were performed with the IEEE 123-nodes test feeder model during the execution of the 4D-Power. The IEEE 123-nodes test feeder was modelled in ePhasorsim/RT-Lab, a platform that solves the circuit power flow in phasor domain. Figure 5 shows the voltage drop diagram achieved from the PowerFactory software. It illustrates the distance of a given node with respect to the main feeder and its corresponding voltage. It can be observed that the node 66 has the largest voltage drop while the node 95 has the longest distance to the feeder head.

ERIGrid GA No: 654113 11/1/2015
TA User Project: 01.012-2016 Revision / Status: draft 17 of 39
Figure 5: Voltage Drop Diagram (balanced) of the IEEE 123-Nodes Test Feeder.
4.2.3 Description of Testbed Components This section provides descriptions regarding main components of 4D-Power testbed. The catalogue and fact sheet for each component is available in the appendix. PSL MicroPMU Traditionally, Phasor Measurement Units or PMUs have been largely utilized for monitoring transmission networks providing magnitude and voltage angles location across an specific grid. The big advantage of using PMU, and their key feature, is that the timestamps are provided by a GPS locked signal. This feature makes accurate power flow possible between two different locations as they deliver precise angle different (up to 1/360 of a cycle). To measure effectively the effects of distributed generation, a PSL microPMU has been introduced as a powerful accurate and reliable tool. These devices are used in distribution networks for providing the same kind of measurements that a transmission side PMU could provide.

ERIGrid GA No: 654113 11/1/2015
TA User Project: 01.012-2016 Revision / Status: draft 18 of 39
Figure 6. PSL MicroPMU
The microPMU is capable of measuring both voltage and current measurement from the line at 120V-230V while also being able to use analog inputs for lower ranges of voltage. The microPMU complies with IEEE C37.118 protocol for PDC streaming. It is worth remarking that while using the analog inputs, the microPMU is not able to stream its data as it is working as a power quality meter and not a PMU. Some of the most general features of the microPMU are listed below:
- Phasor measurements/second: 10, 25, 50, 100 - Analog inputs: 3 - Rate of data frames transmission: 10, 25, 50, 100 - Range: 100V~690V
Figure 7 shows the web interface of the microPMU where it can be seen the different measurement options that this can provide. This interface is constantly updating within seconds to show the most recent measurements. Find more information at: https://www.powerstandards.com/product/micropmu/highlights/

ERIGrid GA No: 654113 11/1/2015
TA User Project: 01.012-2016 Revision / Status: draft 19 of 39
Figure 7: Web interface for PSL PQube mPMU
Artemes AM-10-PA2 The AM-10-PA2 power quality measurement device with PMU functionality was provided for the experiments from company Artemes. Originally only providing the protocol implementation of the C37.118 2005 standard it was extended by the developer team to provide more than 50 fps reporting rate. It was focus and intended to test and benchmark the system and the extended functionalities in the validation test bed. Below is a list of some of the specifications from the Artemes AM-10-PA2. For further information, please refer to the appendix section for the catalogue.
- 24 bit - 10K samples/sec/channel - 4V, 5C, 4 low voltage inputs - DC - Range +/-1600 V, 6kV isolation - Options: GPS, CAN, MODBUS

ERIGrid GA No: 654113 11/1/2015
TA User Project: 01.012-2016 Revision / Status: draft 20 of 39
Figure 8: Artemes AM-10-PA2 providing 2 MSamples/Sec/channel
Figure 9 shows the online web interface for visualizing and displaying data during recording as well as offline analysis and time series analysis. For more information on this, please refer to: https://www.artemes.org/index.php/en/130-artemes-pmu
Figure 9: Web interface for Artemes AM-10-PA2 providing real time visualization and offline analysis

ERIGrid GA No: 654113 11/1/2015
TA User Project: 01.012-2016 Revision / Status: draft 21 of 39
Opal-RT FPGA Input/Output Interface The SmartEST lab has an Opal-RT target with a PF610095S01 system capable of holding the following input and output (I/O) configuration:
Table 1: Number of FPGA outputs
Slot Number Function
1 16 Analog Out, 16 Analog In
2 16 Analog Out, 16 Analog In
3 32 TSDIn, 32 TSDOut
4 32 TSDIn, 32 TSDOut
For 3D-Power, only the analog outputs are necessary for streaming the measurements of the Opal-RT/RT-LAb model. Table below shows how the channels were connected to the FPGA PF610095S01 system. It is worth mentioning that each analog output used was required to be configured in the model to have the Opal-RT target send the signals required to measure.
Table 2: Configuration of Opal-RT I/O Interface FPGA outputs
Relation between Simulink blocks and OP5330
Simulink block library path:
RT-LAB I/O \ Opal-RT \ OP5142 \ OP5142EX1 OP5142EX1AnalogOut
OP5142_1-EX-0000-1_3_4-C3_C1_C3_C1_EB_EA_EB_EA-01-01.bin
Slot #
(Block
#)
Description
Channel Name Measurement
Icon Name: OP5142EX1 AnalogOut
1(1)
OpFcnOP5142EX1AnalogOut Parameters
Controller Name ‘OP5142EX1 Ctrl’
DataIn port number 1
Number of AOut channels 8
0 +CH00/-CH00 ARTEMES VOLTAGE PHASE A
1 +CH01/-CH01 ARTEMES VOLTAGE PHASE B
2 +CH02/-CH02 ARTEMES VOLTAGE PHASE C
3 +CH03/-CH03 ARTEMES CURRENT PHASE A

ERIGrid GA No: 654113 11/1/2015
TA User Project: 01.012-2016 Revision / Status: draft 22 of 39
4 +CH03/-CH03 ARTEMES CURRENT PHASE B
5 +CH03/-CH03 ARTEMES CURRENT PHASE C
6 +CH03/-CH03
7 +CH03/-CH03
2(3)
OpFcnOP5142EX1AnalogOut Parameters
Controller Name ‘OP5142EX1 Ctrl’
DataIn port number 3
Number of AOut channels 8
0 +CH00/-CH00 PSL uPMU VOLTAGE PHASE A
1 +CH01/-CH01 PSL uPMU VOLTAGE PHASE B
2 +CH02/-CH02 PSL uPMU VOLTAGE PHASE C
3 +CH03/-CH03 PSL uPMU CURRENT PHASE A
4 +CH03/-CH03 PSL uPMU CURRENT PHASE B
5 +CH03/-CH03 PSL uPMU CURRENT PHASE C
6 +CH03/-CH03
7 +CH03/-CH03
GPS Signal Receiver In order to receive GPS signal for PMUs to work properly, the two different GPS antennae (Artemes and PSL) have been installed outside the lab to have direct view on the satellite.

ERIGrid GA No: 654113 11/1/2015
TA User Project: 01.012-2016 Revision / Status: draft 23 of 39
Figure 10: GPS antenna installation
4.3 Testbed Configuration Figure 11 depicts the detailed setup of 4D-Power testbed configuration. The Table 3 indicates the time plan and additional information on the data and model for different expriments. Although many tests were performed daily, five experiments involving the major progress and results will be presented in the following sections of this report.

ERIGrid GA No: 654113 11/1/2015
TA User Project: 01.012-2016 Revision / Status: draft 24 of 39
Figure 11: Detailed setup for most of the experiments, Eth: Ethernet
The following table shows the timeline of the performed experiments.
Table 3: Timeline of 3D-Power Experiment Setup
Date Name Description RT-Model Components
19.07 Test 1: PMU Data stream while
changing lines impedance.
Number of Faults: 140 Fault types: 7 Locations: 149 & 97 Impedance Changes: 50-100 S Number of vPMUs: 8 Number of rPMUs: 2
Project: IEEE123_8PMUs Model: phasor10_IEEE123 Script: test.py
Opal-RT Target FPGA I/O interface Artemes PMU PSL MicroPMU
25.07 Experiment 1:
timeseriesmeasurement_fault_149_97
Number of Faults: 1400 Fault types: 7 Locations: Nodes 149 & 97 Impedance Changes: 0.02-100 S Number of vPMUs: 8 Number of rPMUs: 2
Project: IEEE123_8PMUs_V_I Model: phasor10_IEEE123
Opal-RT Target FPGA I/O interface Artemes PMU PSL MicroPMU
25.07 Experiment 2:
timeseriesmeasurement_fault_21_94
Number of Faults: 1400 Fault types: 7 Locations: Nodes 21 & 94 Impedance Changes: 0.02-100 S Number of vPMUs: 8 Number of rPMUs: 2
Project: IEEE123_8PMUs_V_I Model: phasor10_IEEE123
Opal-RT Target FPGA I/O interface Artemes PMU PSL MicroPMU
25.07 Experiment 3:
timeseriesmeasurement_fault_47_80
Number of Faults: 1400 Fault types: 7 Locations: Nodes 47 & 80 Impedance Changes: 0.02-100 S Number of vPMUs: 8 Number of rPMUs: 2
Project: IEEE123_8PMUs_V_I Model: phasor10_IEEE123
Opal-RT Target FPGA I/O interface Artemes PMU PSL MicroPMU
26.07 Experiment 4:
timeseriesmeasurement_fault_60_100
Number of Faults: 1400 Fault types: 7 Locations: Nodes 60 & 100 Impedance Changes: 0.02-100 S Number of vPMUs: 8 Number of rPMUs: 2
Project: IEEE123_8PMUs_V_I Model: phasor10_IEEE123
Opal-RT Target FPGA I/O interface Artemes PMU PSL MicroPMU
26.07 Experiment 5:
timeseriesmeasurement_fault_SLG
Number of Faults: 1400 Fault types: 7 Locations: Nodes 33, 37, 46, 71, 88, and 114. Impedance Changes: 0.02-100 S Number of vPMUs: 8 Number of rPMUs: 2
Project: IEEE123_8PMUs_V_I Model: phasor10_IEEE123
Opal-RT Target FPGA I/O interface Artemes PMU PSL MicroPMU
4.3.1 Test Procedures The main objective of the test setups was to determine the different synchronization challenges

ERIGrid GA No: 654113 11/1/2015
TA User Project: 01.012-2016 Revision / Status: draft 25 of 39
and complexities of having different vendors equipment for power distribution monitoring. Therefore, it was crucial to have a benchmark monitoring system for correct time stamps, magnitude, and angle measurements without having the real world latencies and limitation such as transmission lines losses and noise. Combining real PMU and virtual PMU measurements
Figure 12 shows the general scheme for comparing the real and virtual PMU measurements. For this case, measurements are streamed to the real and PMUs while the virtual PMU model from the RT-Lab/Simulink library is used for comparison. The output analog channels from the FPGA I/O interface were used to connect the different PMU devices used in the experiment. Moreover, the two PMU brands used (PSL and ARTEMES) were connected in order to compare their signals with the virtual ones provided by Opal-RT. PSL and ARTEMES units have both voltage and current measurements and the timestamps are provided by the GPS signals provided by each PMU device. All measurements are collected by OpenPDC through a C37.118 protocol and then stored in a database managed by PostgreSQL. Figure 13 shows the actual physical setup of the testbed.
Figure 12: Virtual and Real PMU measurements setup using FPGA outputs

ERIGrid GA No: 654113 11/1/2015
TA User Project: 01.012-2016 Revision / Status: draft 26 of 39
Figure 13: 4D-Power Physical Setup.
5 Executed Tests and Experiments
5.1 Experiment 1 through 5 - Simulating fault events with 8 virtual PMUs and 2 physical PMUs
5.1.1 Short description
Name Fault event simulation with virtual & real PMUs
Objective Simulate various fault types under different conditions
Duration Minutes to several hours (Approx. 10,000 fault sequences)
Results Data set with different fault scenarios and results for identifying faults based on measurements
Challenges Modeling, real time simulation, scripting of fault sequences, stable simulation, parameter change
Lessons Learnt RT-Lab API Python scripting, data handling, data analysis, method application and analysis
Outlook Automate and change parameters during real time simulation with ePhasorsim
5.1.2 Setup
Equipment - OpalRT with IEEE 123-nodes model in RT-Lab/ePhasorsim - PMUs: Artemes and PSL uPMU - Python script for fault sequence simulation and logging for event labeling
Connectivity OpenPDC, PostgreSQL (localhost)
PMU setup 120 samples per second reporting rate
Database PostgreSQL on localhost VM

ERIGrid GA No: 654113 11/1/2015
TA User Project: 01.012-2016 Revision / Status: draft 27 of 39
5.1.3 Scenarios
Fault sequences of different types, fault locations and random fault impedances have been
simulated to generate a dataset which is used to train and apply fault identification algorithm. The
single line diagram of the IEEE 123-nodes test feeder is shown in figure 14. A description of the
fault sequences and combination as shown below:
- Fourteen fault locations on lines 21,33,37,46,47,60,71,80,88,94,97, 103,114, and 149 (see
Fig. 38).
- Fault types are line-to-ground, double-line-to-ground and three-line-to-ground (A-G, B-G, C-
G, AB-G, BC-G, AC-G, and ABC-G).
- Fault impedances: values of fault impedance are random following an uniform distribution in
the range of 0.01- 50 Ohms.
In total the number of sequences is: 7 fault types x 14 fault location x 100 fault impedances
sequences where fault distance and ground impedance should have changed for each of the 9,800
fault events.
5.1.4 Models
Figure 14: IEEE 123 bus test feeder: Single line diagram with fault locations
Figure 15 shows the model for the 123-nodes test feeder in Opal-RT/ePhasorsim. This picture
depicts the grid model in a block that is configured with additional configuration files (*.cyme) that
have the different electrical parameters such as line connections and impedances, transformer
ratings, load types and KVA, etc.

ERIGrid GA No: 654113 11/1/2015
TA User Project: 01.012-2016 Revision / Status: draft 28 of 39
Figure 15: IEEE 123-nodes test feeder model in ePhasorsim with 8 virtual PMUs
The following code is an example on how ePhasorsim reads the parameter values for line joining
nodes 31 phase C and node 32 phase C. The parameters consist of length, buses connected,
resistances/km, reactances/km, etc. The ePhasorsim solver calls a file containing the description of
each electrical parameter in the grid. Then, it is possible to change some of the parameters in real-
time.
SinglePhasePiLine {
name=line_config_11_31_32
length=0.05681832507252693
mode=full
buses {
bus_31_c
bus_32_c
}
resistances=1.3296730518341064
reactances=1.347516655921936
charges=4.5223
Additionally, it is possible to create monitoring probes in ePhasorsim by stating them in an xls file
by specifying the line number, the type of measurement and the quantity to be measured. As an
example, Fig. 40 shows an ‘outgoing’ probe created that measures the magnitude of the current
flowing on line 149-1 phase A. This creates an output of the real-time current in the line that can be
monitored. The ‘incoming’ signals shown in Figure 16 determine the control signals for the different
parameters we would like to modify in real-time. For example, the incoming signal
bus_60_a/activate3PGfault is the control port for a fault at bus 60. The values for these signals
are either set to 0 or 1, meaning turning the fault on and off respectively.

ERIGrid GA No: 654113 11/1/2015
TA User Project: 01.012-2016 Revision / Status: draft 29 of 39
Figure 16: Model of the probes and controls of IEEE 123-nodes test feeder.
Figure 17 shows the PMU block configuration for each signal streamed with the C37.118 slave
block provided by Opal-RT. Each PMU has a number of signals that are streamed having their own
signal ID that identifies the correspondent measurement taken.
Figure 17: Model Configuration: Connections of the PMU signals to the C37.118 slave driver (above)
5.1.5 OpenPDC - PMU data concentrator
An application for concentrating and streaming phasor data is free available software

ERIGrid GA No: 654113 11/1/2015
TA User Project: 01.012-2016 Revision / Status: draft 30 of 39
package OpenPDC (https://openpdc.codeplex.com/). It is capable of taking input streams from PMUs with various settings and protocol standards. It was also used to convert and stream PMU data to various connectors, namely PostgreSQL, local historian and CSV file. With the graphical interface and visualization it supports the workflow, setup and verification of the experiment (see Figure 18).
Figure 18: OpenPDC (example screenshot) for receiving, concentrating and streaming
5.1.6 Python processing
In order to analyse the data by performing statistical analysis and visualization, the user group utilized mainly the Python open source software. Python features many useful tools and packages for managing databases, functional programming, clean data visualization in a dynamic type system and automatic memory management Its reliability comes from its large and comprehensive standard library.

ERIGrid GA No: 654113 11/1/2015
TA User Project: 01.012-2016 Revision / Status: draft 31 of 39
Figure 19: Jupyter notebook for Python processing
5.1.7 PostgreSQL - Database management The user group utilized an open source database manager to store the data and perform fast and accurate queries. PostgreSQL is a object-relational database system that works with SQL language with a comfortable interface for data processing and storing. The user group has developed a set of time series measurements tables that come directly from the streams configured in OpenPDC. As it can be observed in Figure 20 below, the values for the PMU streams are shown with timestamp, value and their signal id that corresponds to the PMU channels. In addition, the user group has utilized Python to connect to the databases setup in PostgreSQL and performed queries for data analysis and preprocessing.
Figure 20: PgAdmin for PostgreSQL database management.
5.1.8 Results
A data set was created through the measurements of 8 virtual PMUs modelled in Opal-RT. Also, two actual PMUs were connected in HIL setup for monitoring the IEEE 123-nodes test feeder. The user group repeated a similar setup for the five experiments achieved, where each experiment varied the fault location and fault impedances. The following figures show the time series of the fault sequences for different fault scenarios for the real and simulated measurements.

ERIGrid GA No: 654113 11/1/2015
TA User Project: 01.012-2016 Revision / Status: draft 32 of 39
Figure 21: Three-phase Voltage Magnitude of one virtual PMU.
The figure above show the three-phase voltage for the virtual PMU located at node 95. It can be observed that the single line fault (A-N) sequence takes place approximately every 0.2 seconds and that voltage values vary with the impedance changes applied to every fault event.
Figure 22: Phase A Voltage Magnitude for three PMUs connected at Nodes 95 (OPALRT-PMU_2), 197
(OPALRT-PMU_3), and 250 (OPALRT-PMU_4).
The figure above depicts the measurements taken for phase A at nodes 95, 197, and 250. This figure shows how the voltage is different at every node since the faults are applied close or far from the measurement device. However, the shape of the signal (sag or swell) remains constant. The monitored fault was able to be visualized through OpenPDC as expected. This was a clear sign that the user group was able to configure the C37.118 slave driver inside the Opal-RT correctly. As expected, there was full synchronization in the clocks between virtual PMUs inside the target. Additionally, real PMU devices where configured to stream their measurements from the IEEE 123-nodes test feeder setup in Opal-RT. The figure 23 below shows different measurements taken at various nodes inside the model. It shows the phase B measurements at nodes 149 and 13 taken by the real PMUs (ARTEMES and PSL). It can be observed that there exists a shift in the horizontal measurements which is due the specific firmware utilized by each of the PMU vendors.
Figure 23: Phase B Voltage Magnitude for Real PMUs connected at Nodes 149 (ARTEMES-PM2), and 13
(PSL_UPMU-PM2).
Figures 24 and 25 show the measurements for the three phases monitored by the real PMUs. Once again, we can observe that the phases react according to the occurred fault. The random changes in the fault impedances make it almost impossible to have two identical fault events. This is an important issue that need to be considered in creating realistic fault data repository for machine learning training and testing purposes. It prevents overfitting in the machine learning training process which improve the fault detection performance accordingly. Comparing measurements from different PMU vendors, (Artemes and PSL), it observed that the ARTEMES PMU has an oscillation artefact. In an investigation, it was found that the oscillation was occurred only with 60 Hz test network. The issue will be communicated with the company for further investigation.

ERIGrid GA No: 654113 11/1/2015
TA User Project: 01.012-2016 Revision / Status: draft 33 of 39
Figure 24: Three-phase Voltage Magnitude of one real PMU (PSL_UPMU).
Figure 25: Three-phase Voltage Magnitude of one real PMU (ARTEMES).
6 Conclusions
In the 4D-Power, we made a testbed that provides realistic scenarios of a distribution test feeder model with PMU data streams simulations. The primary objective was providing a testbed for the integration of multi vendors PMU devices that are already used in power distribution networks monitoring. Also integrating virtual PMUs in Opal-RT environment with actual PMUs.
One of the major contributions of this project, is the expansion of the testbed to a larger grid,
the IEEE 123 test-feeder, which is more realistic given its size and its characteristics. Another contribution is the creation of a large dataset of fault events in this model, with approximately 10,000 fault events of line-to-ground faults.
Moreover, the major contribution of 4D-power is the inclusion of fault impedances changes
when simulating this large number of faults. This was a limitation in 3D-power, where the Artemis solver could not change the impedance in real-time without recompiling or reloading the model. This presented a challenge, as the RT-Lab environment “hanged” when performing a big sequence of faults. This challenged was overcome in 4D-power with the use of ePhasorsim as the solver of choice. The IEEE 123-nodes test feeder was simulated with a large sequence of faults that were controlled from a Python API inside RT-Lab. Although the user group encountered many challenges such as version compatibility between Python and RT-Lab, the User group was able to perform the simulations successfully. Regarding hardware setup, utilizing different PMU devices from multiple manufacturers (PSL, Artemes, Arbiter) inherently introduces dealing with different sampling rates, configurations, calculation algorithms, and as it was determined, different time synchronization references. For power systems applications, time synchronization is crucial and developing a testbed of real field resemblance should include precise time stamps. In the end, this challenge was resolved by the user group. The user group is working closely with the different PMU manufacturers involved in the development of this project. PSL microPMU and Artemes have shown interest in testing their devices in the 4D-project setup. An Opal-RT team was part of the User group in a collaboration to perform this project. This demonstrates the importance of having a testbed as a tool for power systems algorithm validation. Additionally, there is a potential in searching for bugs and troubleshooting the different technologies utilized in 4D-Power. Part of integrating different brands is the challenge of working with different firmwares, interfaces and calculation algorithms that are owned by the manufacturers. 4D-Power integrates the software, hardware and labor work of different manufacturers, AIT and Universities.

ERIGrid GA No: 654113 11/1/2015
TA User Project: 01.012-2016 Revision / Status: draft 34 of 39
7 Open Issues and Suggestions for Improvements 7.1 Issues and Problems during test-setup 7.1.1 API Python for fault simulation Issue: Utilizing API Python with ePhasorsim library.
Figure 26: Error in API Python using ePhasorsim library.
Challenges
1. The API Python is not currently working as the 'get' function does not recognize the values
monitored (i.e. V, I or switch status) showing a "NaN" error when parameters are tried to be
obtained. We had a WebEx session with the team in Montreal where they obtained all the
diagnostics logs for solving the problem. We will follow the issue on Tuesday (Monday is a
holiday in Montreal).
2. The work around on the "./," seemed to work well when adding pins to the .xls models we
used, however, further test with the Cyme models is needed. I will add more pins to the
123-nodes model on Monday and get back on this.
3. The model can only perform line-to-ground faults. Further follow up on how to modify the
Cyme file to support line-to-line faults will be performed by Nikola and the Montreal team.
Solution:
1. Test RT lab python API on AIT Computer
a. API Python responds correctly which leads to think that the ePhasorsim cannot
handle the API-Python correctly.
2. Test ephasorim python API with RT lab installed on Jose’s Computer (with target) if he
manages to get a license from his University (Matlab 2015a 32 bit)
a. RT-Lab version 11.2.2.108
b. Matlab version 2013b.
c. The API Python script returns the same issue showing a “NAN”.
3. Test ephasorim python API with RT lab installed on another computer (with localhost)

ERIGrid GA No: 654113 11/1/2015
TA User Project: 01.012-2016 Revision / Status: draft 35 of 39
4. In the end, the solution was to bypass the ePhasorsim library in the API Python and use the
library built in RT-Lab.
Figure 27: API Python in RT-Lab working properly.
5. The IEEE 123 bus (Phasor10) model runs with the following
a. I/O with phasor to sinewave conversion
b. Faults and fault impedances could be changed using the RTLAB python API
Artemes The PMU standard has been adapted for the experiments to support the new 2011 standard with higher reporting rates. This caused some internal signal processing problems especially with timing and sensing. The Figure 28 shows and the problem of 2 seconds time lead and the fact of spiking exactly after on seconds back to the old value. The problems and bugs have been fixed together with decent support, testing and collaboration efforts.
Figure 28: Seconds time lead for Artemes device
7.2 Established, ongoing and future collaborations
- PSL: The commercial available PMU device is a measure for the industry and opens up many applications in the distribution network. The project gained a lot of insight in using high precision and reporting PMUs for various experiments. Even though PSL did not have a team on-site, they helped remotely in the uPMU setup.
- Artemes: The Austrian based company lend the PQ/PMU device which we used for all the
ERIGrid GA No: 654113 11/1/2015
TA User Project: 01.012-2016 Revision / Status: draft 36 of 39
experiments. We are very thankful lending a PMU device for second year in a row.
- Opal-RT: Opal-RT provided a comprehensive on-site support for better assessment of the project’s goals. Working closely with Opal-RT engineers, as well as feedback on possible issues and potential applications have been reached. With sharing of models and knowledge during the project, by Opal-RT support team in Canada and Europe, the user group made progress toward the project goals. Further work on Machine learning were discussed as a possible research route.
7.3 Open Issues and Future Works
The User group submitted a paper to the IEEE Transactions on Smart Grid: Special Section on Theory and Application of PMUs in Power Distribution Systems. It utilized the dataset created in 4D-Power to classify and identify different types of faults using a novel multi-task learning approach.. 7.4 Dissemination Planning The expected outcomes of this research project including but not limited to: (1) Explore the impact of time synchronized measurements in distribution networks on event detection. (2) Joint publication, seminars and organizing a workshop in an IEEE PES conference such as PESGM, PowerTech and PSCC in 2018 as well as input for ongoing reports in IEEE working groups and task forces. 8 References
1. A. von Meier, M. Brown, R. Arghandeh, L. Cibulka, and L. Mehrmanesh. Distribution system field study with california utilities to assess capacity for renewables and electric vehicles. Report, California Energy Commission, 2015.
2. A. von Meier, D. Culler, A. McEachen, and R. Arghandeh. Micro-synchrophasors for distribution systems. In IEEE PES Innovative Smart Grid Technologies Conference (ISGT), 2014, pages 1–5. IEEE, 2014.
3. PSL uPMU catalog, online: http://www.powerstandards.com
4. Arghandeh, Reza et al. "Topology detection in microgrids with micro-synchrophasors." PES General Meeting, 2015 IEEE 26 Jul. 2015: 1-5.
5. Schenato, Luca et al. "Bayesian linear state estimation using smart meters and pmus measurements in distribution grids." Smart Grid Communications (SmartGridComm), Nov. 2014: 572-577
6. M. H. F. Wen, R. Arghandeh, A. von Meier, K. Poolla, and V. O. K. Li. Phase identification in distribution networks with micro-synchrophasors. In Power & Energy Society General Meeting, 2015 IEEE, pages 1–5, 2015.
7. J. Cordova, S. Wesolowski, W. Wu, R. Arghandeh, “Shape-based Data Analysis for Event Detection in Power Systems,” PES PowerTech Conference, Manchester, UK, June, 2017.
8. Y. Zhou, R. Arghandeh, I. C. Konstantakopoulos, S. Abdullah, A. von Meier, and C. J. Spanos. Abnormal event detection with high resolution micro-pmu measurement. In IEEE Power Systems Computation Conference. IEEE, 2016. 9. Y. Zhou, R. Arghandeh, I. C. Konstantakopoulos, S Abdullah, and C. J. Spanos. Data-driven event detection with partial knowledge: A hidden structure semi-supervised learning method. In IEEE, editor, American Control Conference (ACC16), 2016.
10. Y. Zhou, R. Arghandeh, and C. J. Spanos. Online learning of contextual hidden markov models for temporal-spatial data analysis. In IEEE Conference on Decision and Control (CDC 2016), 2016.
11. J. Cordova, S. Wesolowski, W. Wu, R. Arghandeh, “Shape-based Data Analysis for Event Detection in Power Systems,” PES PowerTech Conference, Manchester, UK, June, 2017.

ERIGrid GA No: 654113 11/1/2015
TA User Project: 01.012-2016 Revision / Status: draft 37 of 39
12. “IEEE Standard for Synchrophasor Data Transfer for Power Systems,” IEEE Std C37.118.2-2011 (Revision of IEEE Std C37.118-2005), pp. 1–53, Dec. 2011.
13. W. H. Kersting, “Radial distribution test feeders,” IEEE Transactions on Power Systems, vol. 6, no. 3, pp. 975–985, Aug. 1991.
14. S. Brahma, R. Kavasseri, H. Cao, N. R. Chaudhuri, T. Alexopoulos, and Y. Cui, “Real-Time Identification of Dynamic Events in Power Systems Using PMU Data, and Potential Applications #8212;Models, Promises, and Challenges,” IEEE Transactions on Power Delivery, vol. 32, no. 1, pp. 294–301, Feb. 2017.
15. H. Innah and T. Hiyama, “A real time PMU data and neural network approach to analyze voltage stability,” in 2011 International Conference on Advanced Power System Automation and Protection, 2011, vol. 2, pp. 1263–1267.
16. A. Chandra, A. K. Pradhan, and A. K. Sinha, “PMU based real time power system state estimation using ePHASORsim,” in 2016 National Power Systems Conference (NPSC), 2016, pp. 1–6.
17. X. Liang, S. A. Wallace, and D. Nguyen, “Rule-Based Data-Driven Analytics for Wide-Area Fault Detection Using Synchrophasor Data,” IEEE Transactions on Industry Applications, vol. 53, no. 3, pp. 1789–1798, May 2017.
18. D. I. Kim, T. Y. Chun, S. H. Yoon, G. Lee, and Y. J. Shin, “Wavelet-Based Event Detection Method Using PMU Data,” IEEE Transactions on Smart Grid, vol. 8, no. 3, pp. 1154–1162, May 2017.
19.“syn1588®PCIe NIC Oregano Systems.” [Online]. Available: http://www.oreganosystems.at/?page_id=71. [Accessed: 05-Nov-2017].
20.“RSG2488-Industrial Communication Siemens.” [Online]. Available: http://w3.siemens.com/mcms/industrial-communication/en/rugged-communication/ruggedcom-portfolio/switches-routers-layer-2/rack-switches/pages/rsg2488.aspx. [Accessed: 05-Nov-2017].
21. J. Cordova, C. Soto, M. Gilanifar, Y. Zhou, A. Srivastava and R. Arghandeh, "Shape Preserving Incremental Learning for Power Systems Fault Detection," in IEEE Control Systems Letters, vol. 3, no. 1, pp. 85-90, Jan. 2019.
22. J. Cordova, C. Soto, M. Gilanifar, Y. Zhou, A. Srivastava and R. Arghandeh, "Shape Preserving Incremental Learning for Power Systems Fault Detection," in IEEE Conference on Decision and Controls, Miami, Dec 2019.

ERIGrid GA No: 654113 11/1/2015
TA User Project: 01.012-2016 Revision / Status: draft 38 of 39
9 Annex 9.1 Python code for Fault Sequence from time import sleep
import RtlabApi
import glob
import sys
import os
Projects=RtlabApi.GetActiveProjects()
ProjectName=Projects[0][0] #Change this to the active project
RtlabApi.OpenProject(ProjectName)
realTimeMode = RtlabApi.HARD_SYNC_MODE
timeFactor = 1
#===========Defining the variables for control==========
sw_151_300 =
('phasor10_IEEE123/sc_console/port3(1)','phasor10_IEEE123/sc_console/port3(2)','phasor10_IEEE123/sc_
console/port3(3)')
sw_97_197 =
('phasor10_IEEE123/sc_console/port4(1)','phasor10_IEEE123/sc_console/port4(2)','phasor10_IEEE123/sc_
console/port4(3)')
RtlabApi.SetSignalsByName((sw_151_300),[1,1,1])
RtlabApi.SetSignalsByName((sw_97_197),[1,1,1])
##Fault switches
v149_a = 'phasor10_IEEE123/Ss_slave/bus149_a/Value' #Changes this to the address in the excel file
v149_b = 'phasor10_IEEE123/Ss_slave/bus149_b/Value'
v149_c = 'phasor10_IEEE123/Ss_slave/bus149_c/Value'
##Fault Impedance
G149_a = 'phasor10_IEEE123/Ss_slave/bus149_a_G/Value'
G149_b = 'phasor10_IEEE123/Ss_slave/bus149_b_G/Value'
G149_c = 'phasor10_IEEE123/Ss_slave/bus149_c_G/Value'
#=========== Defining the ports for output ==========
Vmag149=("phasor10_IEEE123/Ss_slave/Solver/port1(1)","phasor10_IEEE123/Ss_slave/Solver/port1(2)","ph
asor10_IEEE123/Ss_slave/Solver/port1(3)") #This starts in 1 bc it is in MATLAB
RtlabApi.GetSignalsByName(Vmag149)
#=========== Applying the fault ==========
f_switches = [['phasor10_IEEE123/Ss_slave/bus149_a/Value',
'phasor10_IEEE123/Ss_slave/bus149_b/Value',
'phasor10_IEEE123/Ss_slave/bus149_c/Value'],
['phasor10_IEEE123/Ss_slave/bus97_a/Value',
'phasor10_IEEE123/Ss_slave/bus97_b/Value',
'phasor10_IEEE123/Ss_slave/bus97_c/Value' ]]
num_locations = len(f_switches)
fault_sequence = [[0,0,1],[0,1,0],[0,1,1],[1,0,0],[1,0,1],[1,1,0],[1,1,1],[0,0,0]]
num_ftypes = len(fault_sequence)
sleeptime = 1.0
#print fault_sequence[0]
#print 'Starting fault sequence: ' + str(faultsequence) + ' on ' + str(len(ports)) + ' fault ports
...'
for location in range(num_locations):

ERIGrid GA No: 654113 11/1/2015
TA User Project: 01.012-2016 Revision / Status: draft 39 of 39
print 'Location: ' + str(location+1)
for ftype in range(num_ftypes):
print 'Fault type: ' + str(ftype+1)
values = fault_sequence[ftype]
RtlabApi.SetParametersByName(f_switches[location], values)
#for fault in faultsequence:
# SetSignalsByName
## Initializations
#SignalNames = (port, )
#SignalValues = (fault,)
## Sleep
sleep(sleeptime)
## Call
#RtlabApi.SetSignalsByName( SignalNames, SignalValues )
#ts = str(datetime.now())
#line = ts + ", " + port + ", " + str(fault)
#logfile.write(line + "\n")
#print line
## "Fault type %f is being applied." % SignalValues
print 'Fault sequence done.'


![The Cordova daily times. (Cordova, Alaska). 1922-02-01 [p 2]....Title The Cordova daily times. (Cordova, Alaska). 1922-02-01 [p 2]. Subject Page from The Cordova daily times. (Cordova,](https://static.fdocuments.in/doc/165x107/5f8f03bfcfa04450ab46065f/the-cordova-daily-times-cordova-alaska-1922-02-01-p-2-title-the-cordova.jpg)