Pest Control Moray Anderson Technical Director Killgerm Group.

TECHNICAL REPORT on theANDERSON URANIUM PROJECT
Yavapai County, Arizona, USA ______________________________________________
NI 43-101 Technical Report
QUALIFIED PERSONS:
Bruce Davis, BD Resource Consulting Inc.Robert Sim, SIM Geological Inc.
Effective Date: 15 APRIL 2012Release Date: 19 JUNE 2012
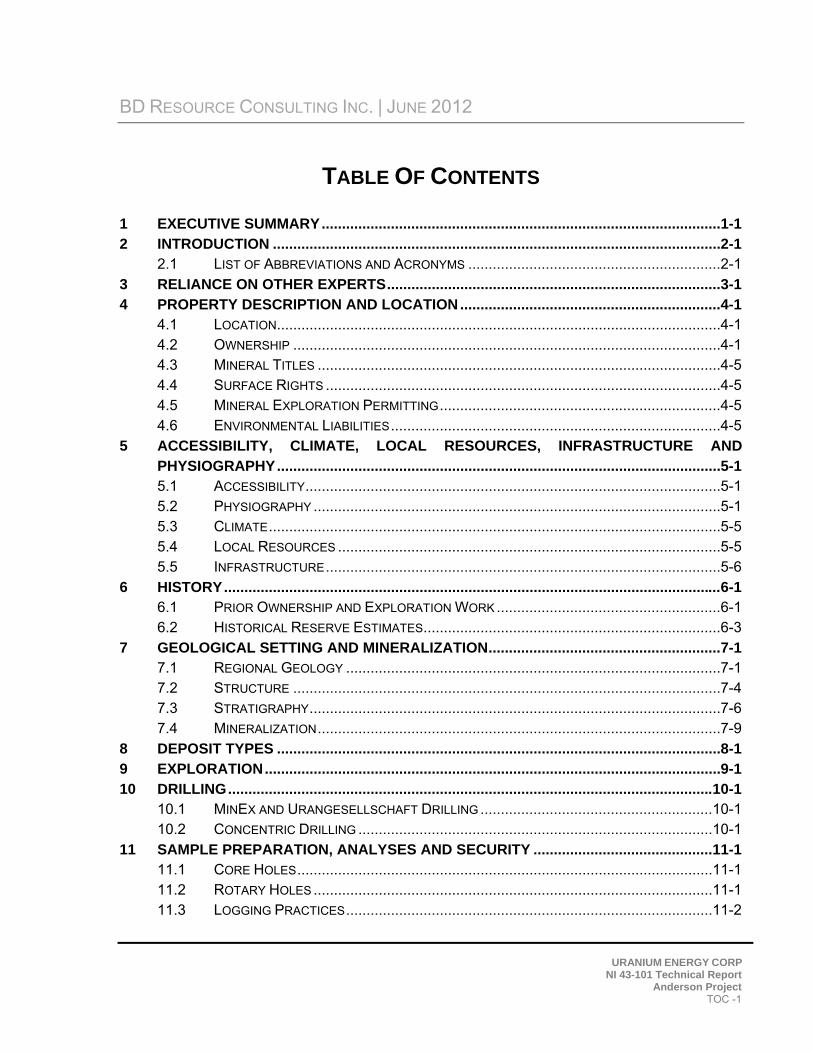
BD RESOURCE CONSULTING INC. | JUNE 2012
URANIUM ENERGY CORP NI 43-101 Technical Report
Anderson Project TOC -1
TABLE OF CONTENTS
1 EXECUTIVE SUMMARY .................................................................................................. 1-1 2 INTRODUCTION .............................................................................................................. 2-1
2.1 LIST OF ABBREVIATIONS AND ACRONYMS .............................................................. 2-1 3 RELIANCE ON OTHER EXPERTS .................................................................................. 3-1 4 PROPERTY DESCRIPTION AND LOCATION ................................................................ 4-1
4.1 LOCATION ............................................................................................................. 4-1 4.2 OWNERSHIP ......................................................................................................... 4-1 4.3 MINERAL TITLES ................................................................................................... 4-5 4.4 SURFACE RIGHTS ................................................................................................. 4-5 4.5 MINERAL EXPLORATION PERMITTING ..................................................................... 4-5 4.6 ENVIRONMENTAL LIABILITIES ................................................................................. 4-5
5 ACCESSIBILITY, CLIMATE, LOCAL RESOURCES, INFRASTRUCTURE AND PHYSIOGRAPHY ............................................................................................................. 5-1 5.1 ACCESSIBILITY ...................................................................................................... 5-1 5.2 PHYSIOGRAPHY .................................................................................................... 5-1 5.3 CLIMATE ............................................................................................................... 5-5 5.4 LOCAL RESOURCES .............................................................................................. 5-5 5.5 INFRASTRUCTURE ................................................................................................. 5-6
6 HISTORY .......................................................................................................................... 6-1 6.1 PRIOR OWNERSHIP AND EXPLORATION WORK ....................................................... 6-1 6.2 HISTORICAL RESERVE ESTIMATES ......................................................................... 6-3
7 GEOLOGICAL SETTING AND MINERALIZATION ......................................................... 7-1 7.1 REGIONAL GEOLOGY ............................................................................................ 7-1 7.2 STRUCTURE ......................................................................................................... 7-4 7.3 STRATIGRAPHY ..................................................................................................... 7-6 7.4 MINERALIZATION ................................................................................................... 7-9
8 DEPOSIT TYPES ............................................................................................................. 8-1 9 EXPLORATION ................................................................................................................ 9-1 10 DRILLING ....................................................................................................................... 10-1
10.1 MINEX AND URANGESELLSCHAFT DRILLING ......................................................... 10-1 10.2 CONCENTRIC DRILLING ....................................................................................... 10-1
11 SAMPLE PREPARATION, ANALYSES AND SECURITY ............................................ 11-1 11.1 CORE HOLES ...................................................................................................... 11-1 11.2 ROTARY HOLES .................................................................................................. 11-1 11.3 LOGGING PRACTICES .......................................................................................... 11-2
BD RESOURCE CONSULTING INC. | JUNE 2012
URANIUM ENERGY CORP NI 43-101 Technical Report
Anderson Project TOC -2
11.4 PROBE CALIBRATION .......................................................................................... 11-2 11.5 GAMMA LOG DIGITIZING ...................................................................................... 11-3 11.6 CONCENTRIC DRILLING ....................................................................................... 11-7
11.6.1 Collection of Dry Samples ................................................................... 11-7 11.6.2 Collection of Wet Samples .................................................................. 11-8
11.7 HISTORICAL CHEMICAL ASSAYING ....................................................................... 11-9 11.7.1 Assay Practices .................................................................................. 11-9 11.7.2 Assay Quality Control ....................................................................... 11-10
11.8 CONCENTRIC CHEMICAL ASSAYING ................................................................... 11-11 11.8.1 Sample Preparation .......................................................................... 11-11 11.8.2 Sample Security ................................................................................ 11-12 11.8.3 Assaying Procedures ........................................................................ 11-12 11.8.4 Laboratory Certifications ................................................................... 11-12 11.8.5 Quality Assurance/Quality Control .................................................... 11-13
12 DATA VERIFICATION.................................................................................................... 12-1 13 MINERAL PROCESSING AND METALLURGICAL TESTING ..................................... 13-1
13.1 ACID LEACHING .................................................................................................. 13-1 13.2 ALKALINE LEACHING ........................................................................................... 13-2 13.3 HEAP LEACHING ................................................................................................. 13-3
14 MINERAL RESOURCE ESTIMATE ............................................................................... 14-1 14.1 INTRODUCTION ................................................................................................... 14-1 14.2 GEOLOGIC MODEL, DOMAINS AND CODING .......................................................... 14-1 14.3 AVAILABLE DATA ................................................................................................. 14-5 14.4 COMPOSITING ..................................................................................................... 14-5 14.5 EXPLORATORY DATA ANALYSIS ........................................................................... 14-6
14.5.1 Basic Statistics by Domain .................................................................. 14-6 14.5.2 Contact Profiles ................................................................................... 14-7 14.5.3 Conclusions and Modeling Implications .............................................. 14-8
14.6 BULK DENSITY DATA ........................................................................................... 14-8 14.7 EVALUATION OF OUTLIER GRADES ...................................................................... 14-9 14.8 TREND CONTROLS AND RELATIVE ELEVATIONS .................................................. 14-10 14.9 VARIOGRAPHY .................................................................................................. 14-10 14.10 MODEL SETUP AND LIMITS ................................................................................ 14-11 14.11 INTERPOLATION PARAMETERS ........................................................................... 14-12 14.12 VALIDATION ...................................................................................................... 14-13 14.13 RESOURCE CLASSIFICATION ............................................................................. 14-20 14.14 MINERAL RESOURCES ...................................................................................... 14-21
15 MINERAL RESERVE ESTIMATE .................................................................................. 15-1
BD RESOURCE CONSULTING INC. | JUNE 2012
URANIUM ENERGY CORP NI 43-101 Technical Report
Anderson Project TOC -3
16 MINING METHODS ........................................................................................................ 16-1 17 RECOVERY METHODS ................................................................................................. 17-1 18 PROJECT INFRASTRUCTURE ..................................................................................... 18-1 19 MARKET STUDIES AND CONTRACTS ........................................................................ 19-1 20 ENVIRONMENTAL STUDIES, PERMITTING AND SOCIAL OR COMMUNITY IMPACT
........................................................................................................................................ 20-1 21 CAPITAL AND OPERATING COSTS ............................................................................ 21-1 22 ECONOMIC ANALYSIS ................................................................................................. 22-1 23 ADJACENT PROPERTIES ............................................................................................ 23-1 24 OTHER RELEVANT DATA AND INFORMATION ......................................................... 24-1 25 INTERPRETATION AND CONCLUSIONS .................................................................... 25-1 26 RECOMMENDATIONS .................................................................................................. 26-1 27 REFERENCES ............................................................................................................... 27-1 28 CERTIFICATE OF QUALIFIED PERSONS ................................................................... 28-1
LIST OF TABLES
Table 1.1: Exploration History .................................................................................................... 1-2 Table 1.2: Summary of Mineral Resources ................................................................................ 1-4 Table 1.3: Exploration Budget .................................................................................................... 1-6 Table 1.4: Environmental Baseline Budget ................................................................................ 1-7 Table 6.1: Historical Production at the Anderson Mine (Arseneau, 2011) ................................. 6-1 Table 6.2: Exploration History at the Anderson Property (Arseneau, 2011) .............................. 6-2 Table 6.3: Historical Reserve Estimates for the Anderson Project (Arseneau, 2011) ................ 6-4 Table 11.1: Comparison of GAMLOG and Excel Grade Calculations from CPS Data ............ 11-5 Table 14.1: Domains and Coding ............................................................................................. 14-2 Table 14.2: Basic Summary of Sample Data ........................................................................... 14-5 Table 14.3: Summary of Outlier Limitations ............................................................................. 14-9 Table 14.4: Variogram Parameters – eU3O8 .......................................................................... 14-11 Table 14.5: Block Model Limits .............................................................................................. 14-12 Table 14.6: Summary of Mineral Resources .......................................................................... 14-23 Table 26.1: Exploration Budget ................................................................................................ 26-1 Table 26.2: Environmental Baseline Budget ............................................................................ 26-2
BD RESOURCE CONSULTING INC. | JUNE 2012
URANIUM ENERGY CORP NI 43-101 Technical Report
Anderson Project TOC -4
LIST OF FIGURES
Figure 4-1: Project Location Map ............................................................................................... 4-3 Figure 4-2: Project Land Position Map ....................................................................................... 4-4 Figure 5-1: Project Road Access Map ....................................................................................... 5-3 Figure 5-2: Project Location within Date Creek Basin ................................................................ 5-4 Figure 7-1A: Geologic Map of Date Creek Basin ....................................................................... 7-2 Figure 7-1B: Legend for Figure 7-1A ......................................................................................... 7-3 Figure 7-2: Surface Trace of Faulting on Anderson Project ...................................................... 7-5 Figure 7-3: Stratigraphic Column from the Anderson Project (Schneider, 1979) ...................... 7-8 Figure 7-4: Secondary Uranium Mineralization in Float ............................................................ 7-9 Figure 10-1: Concentric’s 2006 Borehole Locations ................................................................ 10-3 Figure 11-1: Scatter Plot of eU3O8 and U3O8 for Core Holes (Arseneau, 2011) ...................... 11-6 Figure 11-2: Comparison of Q-Q Plot and Relative Differences Between eU3O8 and U3O8 Assay
Values (Arseneau, 2011) ...................................................................................... 11-7 Figure 14-1: Plan Showing Zone Domains, DH Collars and Extents of the Resource Model .. 14-3 Figure 14-2: Isometric View of Zone Domains and eU3O8 Grades in Drill Holes (View NW) ... 14-3 Figure 14-3: Isometric View of Zone Domains and eU3O8 Grades in Drill Holes (View West) . 14-4 Figure 14-4: Isometric View of Zone Domains and eU3O8 Grades in Drill Holes (View South) 14-4 Figure 14-5: Boxplot of eU3O8 Grades by Zone Domain .......................................................... 14-7 Figure 14-6: Contact Profile eU3O8 Grades Inside and Outside Zone Domains ...................... 14-8 Figure 14-7: Sectional View of eU3O8 Grades in Drill Holes and Model Blocks ..................... 14-14 Figure 14-8: Herco Zone 1 ..................................................................................................... 14-16 Figure 14-9: Herco Zone 2 ..................................................................................................... 14-16 Figure 14-10: Herco Zone 3 ................................................................................................... 14-17 Figure 14-11: Herco Zones 4-8 .............................................................................................. 14-17 Figure 14-12: Grade Tonnage Comparison of Model Types .................................................. 14-18 Figure 14-13: W-E Swath Plot of Zone 2 ............................................................................... 14-19 Figure 14-14: W-E Swath Plot of Zone 3 ............................................................................... 14-20 Figure 14-15: Distribution of Resource Categories in the Deposit Area ................................ 14-21 Figure 14-16: Distribution of Base Case Resources .............................................................. 14-24

BD RESOURCE CONSULTING INC. | JUNE 2012
URANIUM ENERGY CORP NI 43-101 Technical Report
Anderson Project 1-1
1 EXECUTIVE SUMMARY
This Technical Report was prepared by BD Resource Consulting Inc. (BDRC) for Uranium Energy Corporation (UEC) and provides an updated mineral resource for the Anderson Uranium Project (Anderson Project). The report was written under the direction of Robert Sim P.Geo. and Bruce Davis, F.AusIMM; both are independent “qualified persons” as defined by CSA National Instrument 43-101 Standards of Disclosure for Mineral Projects (NI 43-101) and described in
Section 28.
The Anderson Project covers 9,852 acres (15.4 square miles) and is comprised of 459 contiguous, unpatented lode mining and placer claims and two Arizona State land sections. It is located in western Yavapai County approximately 75 miles northwest of Phoenix and approximately 180 miles from UEC’s Workman Creek Project. The northern section of the Anderson Project area
holds the open-pit resource and the adjacent southern section holds the underground resource.
In May 2011, UEC acquired the Anderson property after their merger with Concentric Energy Corporation (Concentric). According to the terms of the agreement, UEC Concentric Merge Corp., a wholly-owned subsidiary of UEC, was vested with all of Concentric’s assets and property. At this same time, Uranium Energy Corp. completed the full assignment to UEC of Global Uranium Corporation (Global) rights under the terms and conditions of an underlying Option and Joint Venture Agreement dated 13 April 2010 between Global and Concentric with
respect to the Anderson property.
In January 1955, T. R. Anderson of Sacramento, California detected anomalous radioactivity in the vicinity of the Anderson Project using an airborne scintillometer. After a ground check revealed uranium oxide in outcrop, numerous claims were staked. The “Anderson Mine,” as the operation was known at the time, was drilled and mined by Mr. Anderson (MinEx, 1978a). Work between 1955 and 1959 resulted in 10,758 tons that averaged 0.15% U3O8 and 33,230 pounds of U3O8 (Table 6.1) were shipped to Tuba City, Arizona for custom milling. In 1959, production
stopped when the Atomic Energy Commission (AEC) ended the purchasing program.
Between 1967 and 2006, the property was explored by several companies including: Getty Oil Company, Urangesellschaft USA, Inc., Minerals Exploration Company, and Concentric Energy
Corp. Details of exploration activity are presented in Table 1.1.
BD RESOURCE CONSULTING INC. | JUNE 2012
URANIUM ENERGY CORP NI 43-101 Technical Report
Anderson Project 1-2
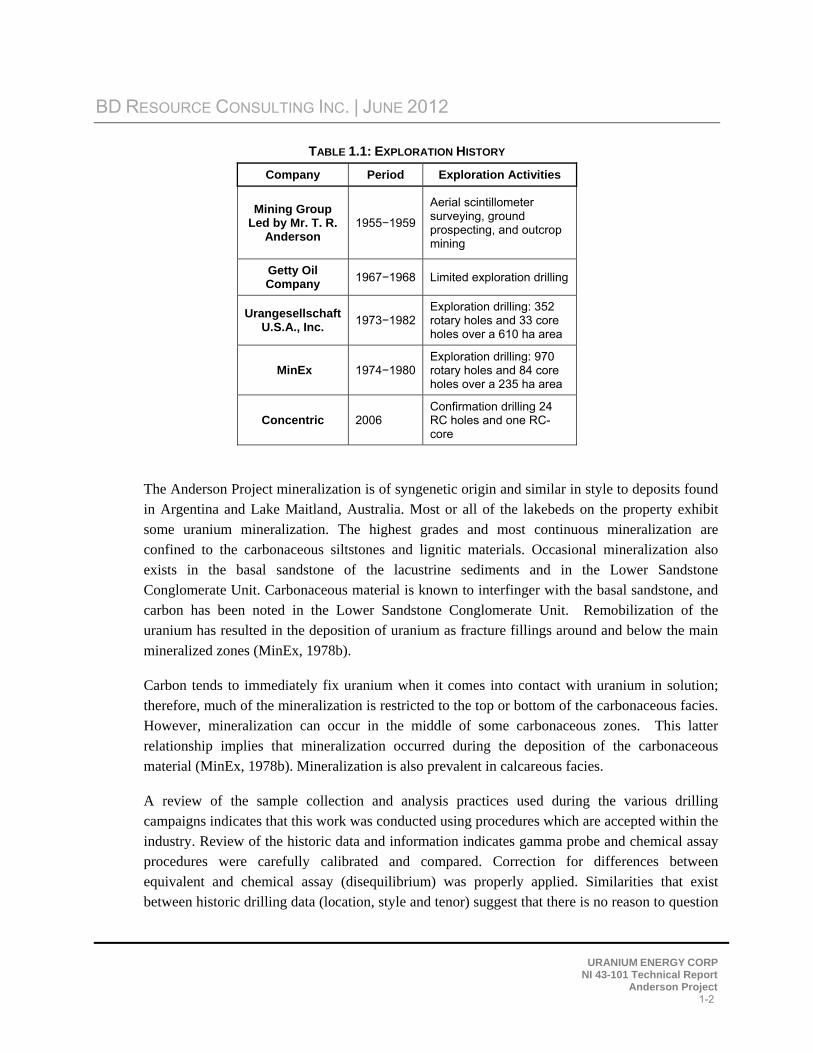
TABLE 1.1: EXPLORATION HISTORY
Company Period Exploration Activities
Mining Group Led by Mr. T. R.
Anderson 1955−1959
Aerial scintillometer surveying, ground prospecting, and outcrop mining
Getty Oil Company
1967−1968 Limited exploration drilling
Urangesellschaft U.S.A., Inc.
1973−1982 Exploration drilling: 352 rotary holes and 33 core holes over a 610 ha area
MinEx 1974−1980 Exploration drilling: 970 rotary holes and 84 core holes over a 235 ha area
Concentric 2006 Confirmation drilling 24 RC holes and one RC-core
The Anderson Project mineralization is of syngenetic origin and similar in style to deposits found in Argentina and Lake Maitland, Australia. Most or all of the lakebeds on the property exhibit some uranium mineralization. The highest grades and most continuous mineralization are confined to the carbonaceous siltstones and lignitic materials. Occasional mineralization also exists in the basal sandstone of the lacustrine sediments and in the Lower Sandstone Conglomerate Unit. Carbonaceous material is known to interfinger with the basal sandstone, and carbon has been noted in the Lower Sandstone Conglomerate Unit. Remobilization of the uranium has resulted in the deposition of uranium as fracture fillings around and below the main
mineralized zones (MinEx, 1978b).
Carbon tends to immediately fix uranium when it comes into contact with uranium in solution; therefore, much of the mineralization is restricted to the top or bottom of the carbonaceous facies. However, mineralization can occur in the middle of some carbonaceous zones. This latter relationship implies that mineralization occurred during the deposition of the carbonaceous
material (MinEx, 1978b). Mineralization is also prevalent in calcareous facies.
A review of the sample collection and analysis practices used during the various drilling campaigns indicates that this work was conducted using procedures which are accepted within the industry. Review of the historic data and information indicates gamma probe and chemical assay procedures were carefully calibrated and compared. Correction for differences between equivalent and chemical assay (disequilibrium) was properly applied. Similarities that exist between historic drilling data (location, style and tenor) suggest that there is no reason to question
BD RESOURCE CONSULTING INC. | JUNE 2012
URANIUM ENERGY CORP NI 43-101 Technical Report
Anderson Project 1-3
the results from earlier drilling programs. It is the qualified person’s opinion that the sample
database is of sufficient accuracy and precision to generate a mineral resource estimate.
The uranium mineral resource estimate was based on a total of 202,707 meters of drilling from 1,464 holes, including 1,054 holes drilled by Minerals Exploration Company (MinEx), 385 holes by Urangesellschaft U.S.A. Inc. (Urangesellschaft) and 25 holes drilled by Concentric Energy Corp. (Concentric) as of 15 April 2012, the effective date for this estimate. The mineral resource estimate was generated from drill hole sample assay results and the interpretation of a geologic model which relates to the spatial distribution of uranium in the deposit. Interpolation characteristics were defined based on the geology, drill hole spacing and geostatistical analysis of the data. U3O8 grades were estimated in the resource model using ordinary kriging with a nominal
block size measuring 10 meters long, 10 meters wide and 2 meters high.
Potentially anomalous outlier grades were identified and their effects were controlled during interpolation. Average bulk density values, based on analysis of available data, were used to
estimate resource tonnage.
The results of the modeling process were validated using a series of methods; the results indicate that the resource model is an appropriate estimation of global resources based on the underlying
database.
The resources were classified by their proximity to sample locations and are reported according to the Canadian Institute of Mining, Metallurgy and Petroleum’s definition standards on Mineral
Resources and Reserves.
As required under NI 43-101, mineral resources must exhibit reasonable prospects for economic viability. This report segregates resources into two types: those potentially amenable to open pit extraction methods versus deeper resources that would be exploited through underground methods. The 2012 Anderson mineral resource estimates are summarized at various cut-off grades for comparison purposes in Table 1.2. The “base case” cut-off grade of 0.01% eU3O8 for potential open pit mineralization and 0.035% eU3O8 for potential underground mineralization is bolded in each section of Table 1.2. These assumptions are derived from operations with similar characteristics, scale and location. Note that the mineral resources stated below are not mineral
reserves as they have not demonstrated economic viability.
There are no known factors relating to environmental, permitting, legal title, taxation, socio-economic, marketing or political issues which could materially affect the mineral resource
estimates.

BD RESOURCE CONSULTING INC. | JUNE 2012
URANIUM ENERGY CORP NI 43-101 Technical Report
Anderson Project 1-4
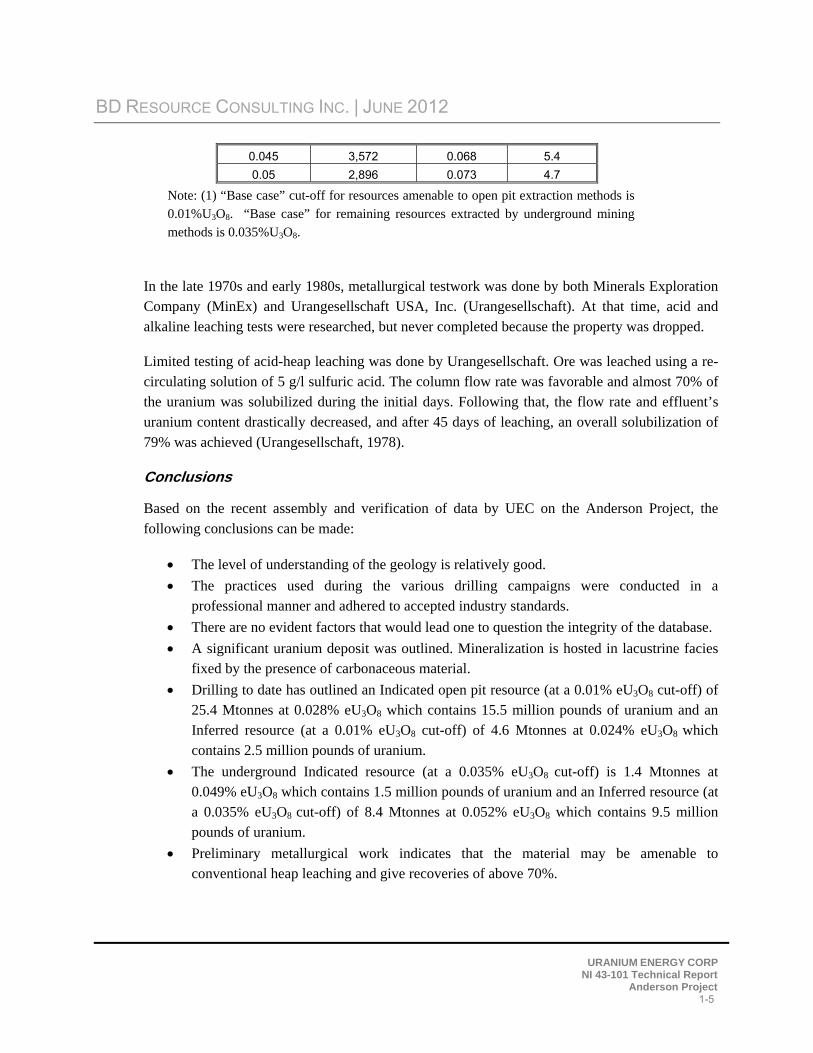
TABLE 1.2: SUMMARY OF MINERAL RESOURCES
Cut-off Grade eU3O8%
ktonnes eU3O8 (%) Contained
U3O8 (Mlbs)
OPEN PIT RESOURCES
INDICATED
0.005 28,034 0.026 16.0
0.01 25,422 0.028 15.5 0.015 19,834 0.032 14.0
0.02 15,008 0.037 12.3
0.025 11,355 0.042 10.5
0.03 8,584 0.047 8.9
0.035 6,445 0.052 7.3
INFERRED
0.005 5,478 0.022 2.6
0.01 4,633 0.024 2.5 0.015 3,341 0.029 2.2
0.02 2,324 0.035 1.8
0.025 1,670 0.040 1.5
0.03 1,192 0.045 1.2
0.035 897 0.049 1.0
UNDERGROUND RESOURCES
INDICATED
0.005 38,177 0.015 12.5
0.01 25,209 0.019 10.5
0.015 15,213 0.024 7.9
0.02 8,570 0.029 5.4
0.025 4,494 0.035 3.5
0.03 2,555 0.042 2.3
0.035 1,426 0.049 1.5 0.04 871 0.057 1.1
0.045 581 0.065 0.8
0.05 382 0.074 0.6
INFERRED
0.005 123,286 0.016 44.6
0.01 85,483 0.021 38.8
0.015 52,298 0.026 30.2
0.02 32,330 0.032 22.8
0.025 20,423 0.038 17.1
0.03 12,164 0.045 12.1
0.035 8,362 0.052 9.5 0.04 6,046 0.057 7.6
BD RESOURCE CONSULTING INC. | JUNE 2012
URANIUM ENERGY CORP NI 43-101 Technical Report
Anderson Project 1-5
0.045 3,572 0.068 5.4
0.05 2,896 0.073 4.7
Note: (1) “Base case” cut-off for resources amenable to open pit extraction methods is 0.01%U3O8. “Base case” for remaining resources extracted by underground mining methods is 0.035%U3O8.
In the late 1970s and early 1980s, metallurgical testwork was done by both Minerals Exploration Company (MinEx) and Urangesellschaft USA, Inc. (Urangesellschaft). At that time, acid and
alkaline leaching tests were researched, but never completed because the property was dropped.
Limited testing of acid-heap leaching was done by Urangesellschaft. Ore was leached using a re-circulating solution of 5 g/l sulfuric acid. The column flow rate was favorable and almost 70% of the uranium was solubilized during the initial days. Following that, the flow rate and effluent’s uranium content drastically decreased, and after 45 days of leaching, an overall solubilization of
79% was achieved (Urangesellschaft, 1978).
Conclusions
Based on the recent assembly and verification of data by UEC on the Anderson Project, the
following conclusions can be made:
The level of understanding of the geology is relatively good.
The practices used during the various drilling campaigns were conducted in a professional manner and adhered to accepted industry standards.
There are no evident factors that would lead one to question the integrity of the database.
A significant uranium deposit was outlined. Mineralization is hosted in lacustrine facies fixed by the presence of carbonaceous material.
Drilling to date has outlined an Indicated open pit resource (at a 0.01% eU3O8 cut-off) of 25.4 Mtonnes at 0.028% eU3O8 which contains 15.5 million pounds of uranium and an Inferred resource (at a 0.01% eU3O8 cut-off) of 4.6 Mtonnes at 0.024% eU3O8 which contains 2.5 million pounds of uranium.
The underground Indicated resource (at a 0.035% eU3O8 cut-off) is 1.4 Mtonnes at 0.049% eU3O8 which contains 1.5 million pounds of uranium and an Inferred resource (at a 0.035% eU3O8 cut-off) of 8.4 Mtonnes at 0.052% eU3O8 which contains 9.5 million pounds of uranium.
Preliminary metallurgical work indicates that the material may be amenable to conventional heap leaching and give recoveries of above 70%.
BD RESOURCE CONSULTING INC. | JUNE 2012
URANIUM ENERGY CORP NI 43-101 Technical Report
Anderson Project 1-6
Recommendations
The following actions are recommended for the Anderson Project:
Additional drilling to expand confirmation results from historic drilling in both the open pit and underground portions of the deposit. The use of both PFN and chemical assay should be used for the confirmation of grade. A budget of US$780,000 has been proposed to complete this test work (Table 1.3).
Additional metallurgical testing on both open pit and underground areas. A budget of US$100,000 has been proposed to complete this work (Table 1.3).
After drilling is completed, an updated resource estimate should be prepared. A budget of US$75,000 has been proposed to complete this work (Table 1.3).
Environmental studies to provide a baseline for future exploration and possible development work on the project. A budget of $675,000 has been proposed to complete this work (Table 1.4).
Recommended drilling and assaying will aim to further confirm historic results and upgrade the classification of resources in some areas. The Prompt Fission Neutron (PFN) logging will also be used to confirm historic results and determine the propriety of the disequilibrium correction
applied to current eU3O8 grades.
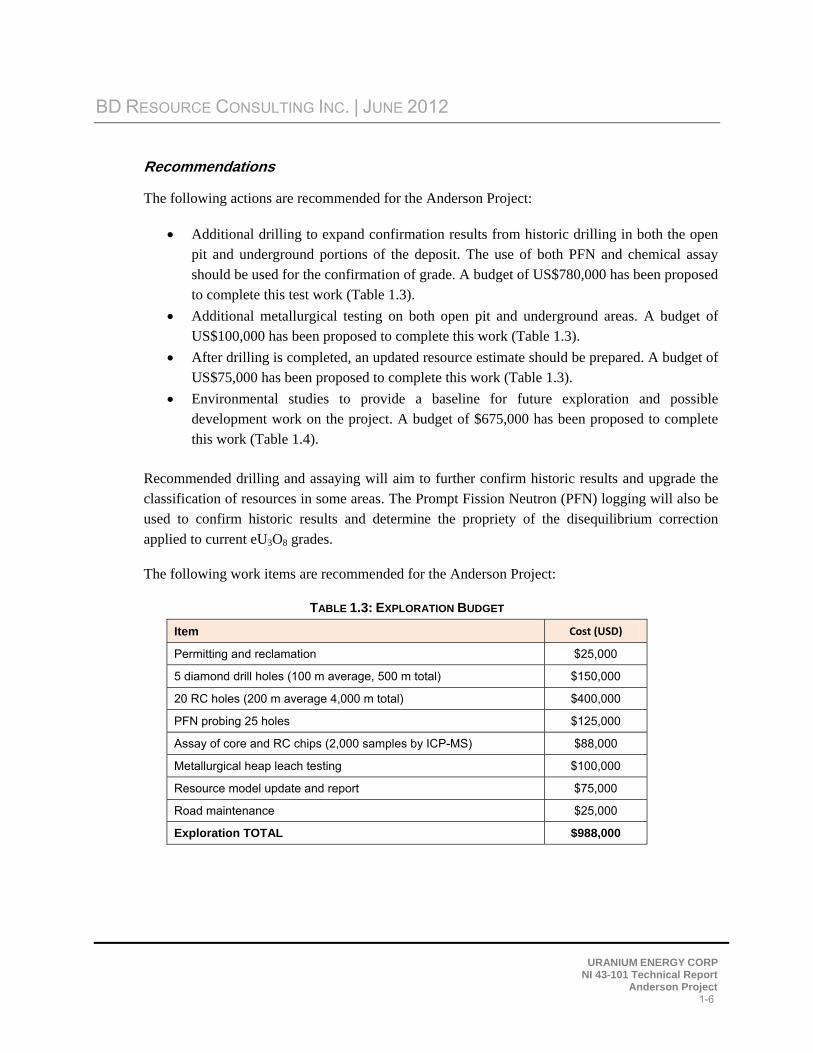
The following work items are recommended for the Anderson Project:
TABLE 1.3: EXPLORATION BUDGET
Item Cost (USD)
Permitting and reclamation $25,000
5 diamond drill holes (100 m average, 500 m total) $150,000
20 RC holes (200 m average 4,000 m total) $400,000
PFN probing 25 holes $125,000
Assay of core and RC chips (2,000 samples by ICP-MS) $88,000
Metallurgical heap leach testing $100,000
Resource model update and report $75,000
Road maintenance $25,000
Exploration TOTAL $988,000
BD RESOURCE CONSULTING INC. | JUNE 2012
URANIUM ENERGY CORP NI 43-101 Technical Report
Anderson Project 1-7
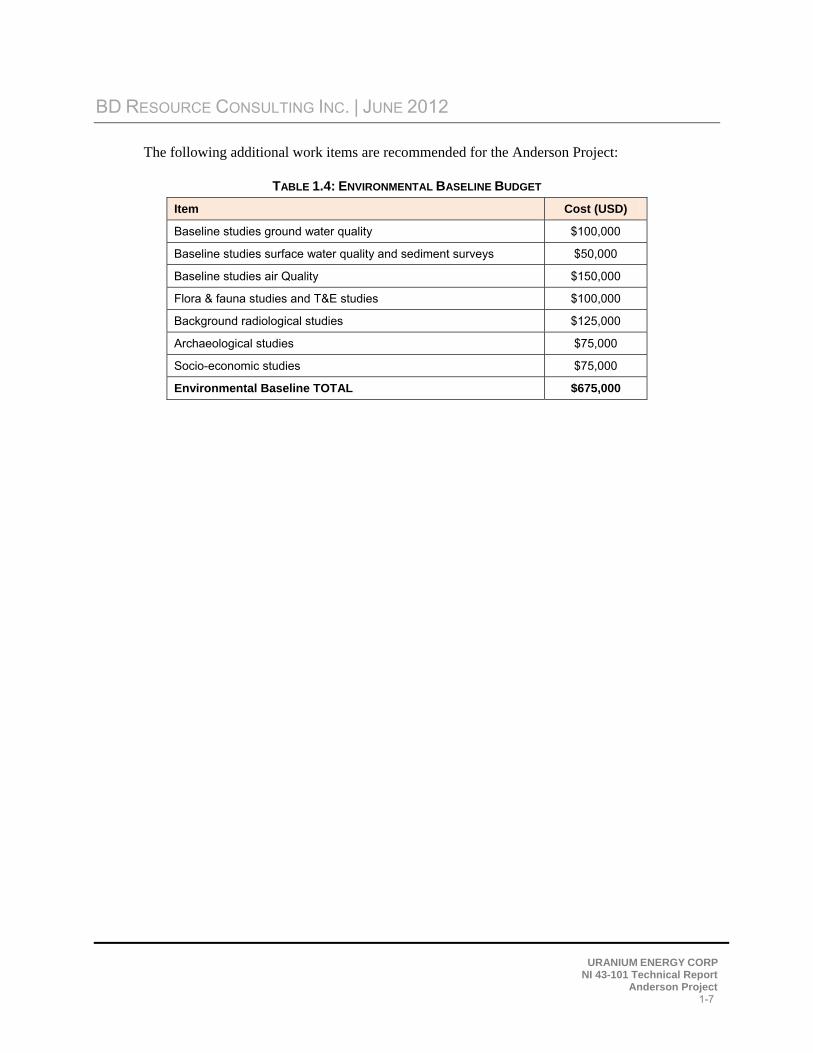
The following additional work items are recommended for the Anderson Project:
TABLE 1.4: ENVIRONMENTAL BASELINE BUDGET
Item Cost (USD)
Baseline studies ground water quality $100,000
Baseline studies surface water quality and sediment surveys $50,000
Baseline studies air Quality $150,000
Flora & fauna studies and T&E studies $100,000
Background radiological studies $125,000
Archaeological studies $75,000
Socio-economic studies $75,000
Environmental Baseline TOTAL $675,000
BD RESOURCE CONSULTING INC. | JUNE 2012
URANIUM ENERGY CORP NI 43-101 Technical Report
Anderson Project 2-1
2 INTRODUCTION
Uranium Energy Corporation (UEC) commissioned Robert Sim, P.Geo. of SIM Geological Inc. and Bruce Davis, F.AusIMM of BD Resource Consulting Inc. (BDRC) to provide an updated mineral resource for the Anderson Uranium Project (Anderson Project). Robert Sim, P. Geo. and Bruce Davis, F.AusIMM are both independent “qualified persons”, within the meaning of National Instrument 43-101, Standards of Disclosure for Mineral Projects (NI 43-101). They are responsible for the preparation of this Technical Report on the Anderson property (Technical
Report) which has been prepared in accordance with NI 43-101 and Form 43-101F1.
Bruce Davis, F.AusIMM visited the site on 8 May 2012, inspected uranium mineralization in outcrop, reviewed sampling procedures, inspected historical information and visited selected drill
sites.
To prepare this Technical Report, the authors relied on geological reports, maps and miscellaneous technical papers listed in the References section of this Technical Report. This report is based on drilling and sampling data available as of 01 April 2012. The resource model, including subsequent validation and review, was completed in mid-April and released in a UEC
press release on 8 May 2012.
The information in Sections 4, 5, 6, 7, 8, 10, 11 and 13 is taken from the Agapito NI 43-101
(Gilbride et al., 2010) and the SRK NI 43-101 (Arseneau, 2011).
Unless otherwise noted, all historic measurements reported in this document have been converted to metric units. All currency in this report is expressed in US dollars (US$) unless otherwise
noted.
The effective date for the mineral resource estimate is 15 April 2012.
2.1 LIST OF ABBREVIATIONS AND ACRONYMS
.txt text file °F degree Fahrenheit ASCII American Standard Code for Information Interchange cm Centimeter cps counts per second dpi dots per inch ft Foot
ft2 square foot
BD RESOURCE CONSULTING INC. | JUNE 2012
URANIUM ENERGY CORP NI 43-101 Technical Report
Anderson Project 2-2
ft3/t cubic foot per short ton g/l grams per liter gpm grams per meter gpt grams per tonnes ha Hectare in Inch KB Kilobyte kg Kilogram ktonnes Kilotonnes lbs Pounds MB Megabyte Mtonnes million tonnes PFN prompt fission neutron ppm parts per million QA/QC quality assurance/quality control t/m3 tonnes per cubic meter TIFF tagged image file format tpd tonnes per day US$ US dollar
BD RESOURCE CONSULTING INC. | JUNE 2012
URANIUM ENERGY CORP NI 43-101 Technical Report
Anderson Project 3-1
3 RELIANCE ON OTHER EXPERTS
The report was prepared by Robert Sim, P.Geo. of SIM Geological Inc. and Bruce Davis, F.AusIMM of BD Resource Consulting Inc. (BDRC), both independent “qualified persons” for the purposes of NI 43-101. The information, conclusions, opinions and estimates contained herein are based on the qualified person’s field observations and data, reports and other information
supplied by UEC and other third parties.
For the purpose of Sections 4.1 (Property Location) and 4.2 (Property Ownership) of this report, BDRC relied on the ownership data (mineral, surface and access rights) provided by UEC (Harris and Thompson, 2007). BDRC believes that this data and information are essentially complete and correct to the best of its knowledge and that no information has been intentionally withheld that would affect the conclusions made herein. BDRC has not researched the property title or mineral rights for the Anderson Project and expresses no legal opinion as to the ownership status of the
property.

BD RESOURCE CONSULTING INC. | JUNE 2012
URANIUM ENERGY CORP NI 43-101 Technical Report
Anderson Project 4-1
4 PROPERTY DESCRIPTION AND LOCATION
4.1 LOCATION
The Anderson Project is located in Yavapai County, west-central Arizona, approximately 75 miles northwest of Phoenix and 43 miles northwest of Wickenburg (latitude 34°18'29" N and longitude 113°16'32" W, datum WGS84) (Figure 4-1). The general area is situated along the northeast margin of the Date Creek Basin. The Anderson Project is located on the south side of the Santa Maria River approximately 13 miles west of State Highway 93. The Anderson Project occupies part or all of Sections 1 and 3, 9 through 16, 21 through 27, and 34 through 36 of Township 11 North, Range 10 West and portions of Sections 18, 19, and 30 of
Township 11 North Range 9 West of the Gila and Salt River Base Meridian.
4.2 OWNERSHIP
The Anderson Project comprises the majority of the claim positions historically held by Minerals Exploration Company (MinEx) and Urangesellschaft USA, Inc. (Urangesellschaft) in the 1970s. In 1995, Hanson Exploration, Inc. (Hanson) of Phoenix, Arizona consolidated these claim positions. By 1998, Hanson dropped the claims and Concentric Energy Corp. (Concentric) restaked them in 2001. Concentric’s claim holdings consisted of 370 contiguous, unpatented, lode mining claims and 9 placer claims that superimpose part of the lode claim block. On 15 April 2010, Global Uranium Corporation (Global) entered into an option and joint venture agreement to acquire the property. Under the terms of the agreement, Global would earn a 70% in the Anderson property over a six year period by paying $80,000 on signing and issuing 11.3 million shares incrementally over the six year period. Global had to spend at least $2 million on the property before the fifth year of the agreement. After completing their commitment to acquire a 70% interest, Global had the option to acquire the
remaining 30% by issuing an additional 2.7 million shares.
In May of 2011, Uranium Energy Corp. (UEC) entered into a merger agreement with Concentric. According to the terms of the agreement, UEC Concentric Merge Corp., a wholly-owned subsidiary of UEC, was the surviving corporation of the merger and was
vested with all of Concentric’s assets and property.
Pursuant to the merger agreement:
1. Concentric’s stockholders received 0.1075 of one share of UEC’s common stock for every one share of Concentric’s common stock. With 11,659,905 shares of Concentric common stock outstanding immediately prior to the merger, UEC issued
BD RESOURCE CONSULTING INC. | JUNE 2012
URANIUM ENERGY CORP NI 43-101 Technical Report
Anderson Project 4-2
1,253,440 of its own common shares to former Concentric stockholders. This
represented approximately 1.7% of the issued and outstanding stock of UEC.
2. UEC issued 375,834 common stock purchase warrants to the former holders of Concentric’s common stock purchase warrants based on the exchange ratio of 0.1075 of one UEC Exchange Warrant for every one Concentric Exchange Warrant. The exercise price of each UEC Exchange Warrant was determined by dividing the per share exercise price of the corresponding Concentric Warrant by 0.1075, yielding
exercise prices that ranged between $9.30 and $65.12.
3. At this same time, UEC completed the full assignment to UEC of Global’s rights under the terms and conditions of an underlying Option and Joint Venture Agreement dated 13 April 2010 between Global and Concentric with respect to the Anderson property. Pursuant to an Acquisition Agreement with Global to acquire the rights, UEC delivered to Global an initial payment of $150,000, an additional $200,000 that released and assigned to UEC the security previously assigned to Global by Concentric, and 350,000 restricted shares of UEC’s stock along with a final payment
of $150,000.
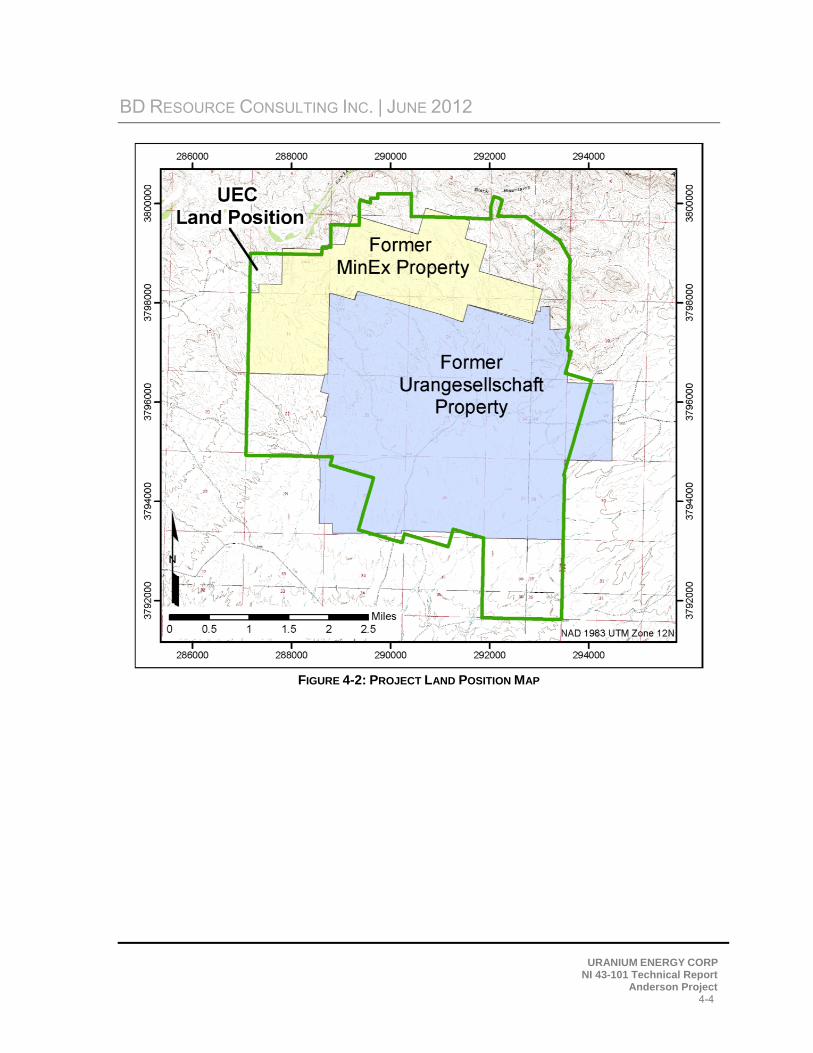
UEC staked an additional 89 lode mining claims in June and July of 2011 and acquired mineral leases on Arizona State Sections 16 (exploration permit 08-115674) and 36 (exploration permit 08-115675) of Township 11 North Range 10 West, Gila and Salt River Base Meridian (Figure 4-2). The entire claim block and the two State mineral leases comprise
an area of approximately 9,852 acres (15.4 square miles).

BD RESOURCE CONSULTING INC. | JUNE 2012
URANIUM ENERGY CORP NI 43-101 Technical Report
Anderson Project 4-3
FIGURE 4-1: PROJECT LOCATION MAP
BD RESOURCE CONSULTING INC. | JUNE 2012
URANIUM ENERGY CORP NI 43-101 Technical Report
Anderson Project 4-4
FIGURE 4-2: PROJECT LAND POSITION MAP
BD RESOURCE CONSULTING INC. | JUNE 2012
URANIUM ENERGY CORP NI 43-101 Technical Report
Anderson Project 4-5
4.3 MINERAL TITLES
Unpatented mining claims, either lode or placer, are located under the authority of the Mining Law of 1872 on Federal lands administered by the Bureau of Land Management (BLM). Under the Mining Law, the locator has the right to explore, develop and mine minerals on unpatented mining claims without paying production royalties to the Federal Government. Claim maintenance fees of $140 per claim are due on September 1 of each year. Unpatented federal lode mining claims in Arizona are designated in the field by four corner posts, two end-center posts and a location monument. Claim location notices for each unpatented claim are recorded in the county recorder’s office of the county in which the claims are located, and
then filed with the BLM Arizona State office.
Arizona State mineral leases are held with an exploration permit. There is a $500 annual fee for the exploration permit plus $1 per acre rental for the first five years. For the first two years there is also a minimal exploration expenditure requirement of $10 per acre per year. For years three through five, there is a $20 per acre minimum exploration expenditure
requirement. Each state section requires a separate exploration permit.
4.4 SURFACE RIGHTS
All of the Anderson Project mining claims are on public lands administered by the BLM. Arizona State sections are administered by the Arizona State Land Department; UEC has
surface rights on these lands as outlined in their exploration permits.
4.5 MINERAL EXPLORATION PERMITTING
Exploration and mining activities for the mining claims of the Anderson Project are administrated by the BLM, Kingman Field Office. Exploration drilling and associated activities require an exploration permit and a reclamation bond must be posted. Exploration and mining activities on Arizona State land are administrated by the Arizona State Land Office. This project was drilled as recently as 2006, and it is not expected that any of these requirements will have an effect on the ability to conduct exploration activities. UEC has exploration permits on the two State sections. In order conduct the recommended program for BLM ground, as outlined in Section 26, UEC needs to submit a plan of operations, a minimal
impact exploration permit and a special use permit. There are no royalties.
4.6 ENVIRONMENTAL LIABILITIES
UEC is not aware of significant environmental liabilities on the property. However, it is important to note that 195 acres in the northern part of the project area were classified as
BD RESOURCE CONSULTING INC. | JUNE 2012
URANIUM ENERGY CORP NI 43-101 Technical Report
Anderson Project 4-6
“disturbed” by the BLM. The disturbed area is a result of minor production dozer cuts from
surface mining in the 1950s.
BD RESOURCE CONSULTING INC. | JUNE 2012
URANIUM ENERGY CORP NI 43-101 Technical Report
Anderson Project 5-1
5 ACCESSIBILITY, CLIMATE, LOCAL RESOURCES, INFRASTRUCTURE AND PHYSIOGRAPHY
5.1 ACCESSIBILITY
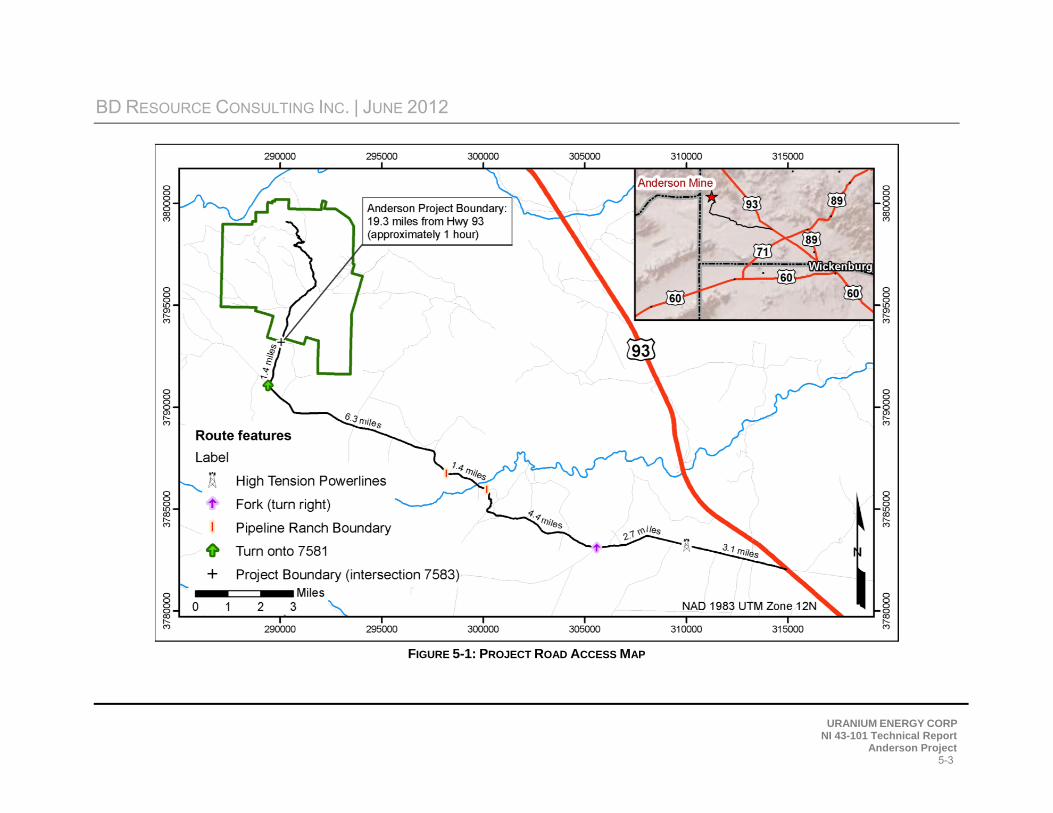
The Anderson Project is accessed by paved, all-weather gravel and dirt roads. The property is reached by taking the Alamo Lake turnoff, located approximately 21 miles northwest of Wickenburg on Arizona State Highway 93 (Joshua Tree Parkway), then driving 0.25 miles north of mile marker 179, and then following the Alamo Road for 5.8 miles to the Pipeline Ranch Road turnoff. The road passes through the Pipeline Ranch, located in the bottom of Date Creek Wash and continues for approximately 6.3 miles to FR 7581. The Anderson Project property boundary is located 1.4 miles north on FR 7581. There are alternate dirt roads, including a 15 mile primitive road from Highway 93 over Aso Pass (2,900 ft elevation)
(Figure 5-1).
5.2 PHYSIOGRAPHY
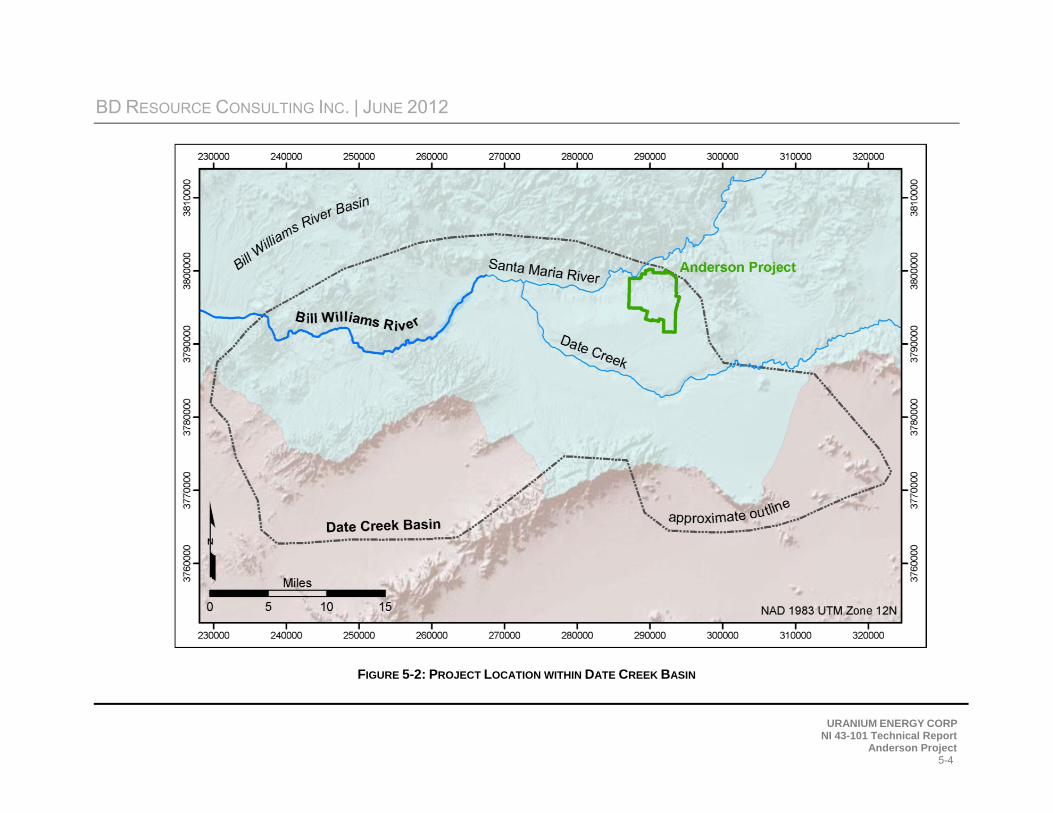
The Anderson Project is located in the northeast portion of the Date Creek Basin (Figure 5-2). The basin consists of low undulating terrain, centrally dissected by Date Creek Wash. The site lies along the south bank of the Santa Maria River which runs along the northern edge of
the basin.
The majority of the Anderson Project drains northward to the Santa Maria River. Headward erosion of these tributaries has produced a series of sub-parallel gullies and ridges trending north to northwest. The southern quarter of the Anderson Project drains southward to Date Creek Wash. Both the Santa Maria River and Date Creek Wash are generally intermittent. Significant flows can occur in Santa Maria River during winter and spring run-off months. Elevations above sea level are between 1,700 ft and 2,400 ft. Maximum local topographic
relief at the site is approximately 700 ft.
Vegetation on the property is typical of the Sonoran Desert of central Arizona and consists predominately of Joshua trees, palo verde bushes, saguaro, cholla, ocotillo, creosote bushes and desert grasses. Fauna include: jackrabbits, rattlesnakes, roadrunners, desert tortoise,
various lizards, and less common mule deer, wild burros and mules (Hertzke, 1997).
The alluvial valley of the Santa Maria River varies substantially in width and depth to bedrock. The volume of alluvium, and particularly the depth of the material, influences the proportion of surface flow to underflow in the river valley. The groundwater in the alluvium
BD RESOURCE CONSULTING INC. | JUNE 2012
URANIUM ENERGY CORP NI 43-101 Technical Report
Anderson Project 5-2
consists of underflow that is forced toward the surface as the depth of the alluvium decreases
(MinEx, 1978b).
BD RESOURCE CONSULTING INC. | JUNE 2012
URANIUM ENERGY CORP NI 43-101 Technical Report
Anderson Project 5-3
FIGURE 5-1: PROJECT ROAD ACCESS MAP
BD RESOURCE CONSULTING INC. | JUNE 2012
URANIUM ENERGY CORP NI 43-101 Technical Report
Anderson Project 5-4
FIGURE 5-2: PROJECT LOCATION WITHIN DATE CREEK BASIN
BD RESOURCE CONSULTING INC. | JUNE 2012
URANIUM ENERGY CORP NI 43-101 Technical Report
Anderson Project 5-5
5.3 CLIMATE
The climate is arid, with hot summers and mild winters. Annual rainfall averages 10 to 12 inches with rain showers from January through March and during summer thunderstorms. Snowfall is rare. On average, temperatures range between a low of 31°F during winter months and a high of 104°F during summer months. Temperature extremes of 10°F in winter and 120°F in summer have been recorded. The climate is favorable for year-round mining operations and requires no special operational or infrastructure provisions that relate to weather.
5.4 LOCAL RESOURCES
Various water wells exist on and near the Anderson Project that can support large-scale mining operations. There is plenty of usable land space to locate processing plants, heap leach pads, tailings storage areas, waste disposal areas and other infrastructure development associated with large-scale mining. The Anderson Project includes most of a 195 acre area designated by the BLM as “disturbed” resulting from surface mining in the 1950s. It may be possible to expedite the permitting process for future metallurgical exploration and mining
activities, including waste disposal within the disturbed area.
Both Urangesellschaft and MinEx investigated the groundwater in the immediate vicinity of the Anderson Project. Hydrologic studies were conducted by the Water Development
Corporation of Tucson, Arizona in 1978 and 1979.
Two aquifers contain most of the groundwater: the Barren Sandstone Unit and the Lower Sandstone Conglomerate Unit. Water occurs near the base of the Lower Sandstone Conglomerate Unit at the contact with the lacustrine sediments. A pump test conducted in this zone by MinEx yielded an average flow rate of 57 gpm. The initial and final water depths in this test were 56.2 and 78.6 ft, respectively, yielding a total drawdown of 22.4 ft, and a specific capacity of 2.5 gpm/ft of drawdown (MinEx, 1978b). This low yield did not warrant the calculation of formation constants. Drill holes to the south on the former Urangesellschaft property yielded an average flow of 5 to 10 gpm from the same unit (Urangesellschaft,
1979a).
The deeper Barren Sandstone Unit is generally permeable and contains an artesian system. Groundwater in this unit is expected to produce 50 to 100 gpm. The artesian head stands at 300 to 450 ft above the level at which the aquifer is encountered. Urangesellschaft’s drill water supply well produced water from the Barren Sandstone Unit at an estimated 80 to 100 gpm (Urangesellschaft, 1979a). Specific capacity of the unit is approximately 1.4 gpm/ft of
BD RESOURCE CONSULTING INC. | JUNE 2012
URANIUM ENERGY CORP NI 43-101 Technical Report
Anderson Project 5-6
drawdown based on well pump measurements conducted by Urangesellschaft (MinEx,
1978b).
Considerable faulting and fracturing in the vicinity of the Anderson Project has resulted in sufficient movement of water between these units so they will not be treated independently; this applies particularly to the north of the former MinEx property where faults cut the Lower Sandstone Conglomerate Unit. To the south of the former Urangesellschaft property, the
Lower Sandstone Conglomerate Unit occurs well above the water table.
The lacustrine sequence hosting the uranium mineralization is thought to be saturated but, due to poor permeability, water does not move readily through the unit. Faults in the lacustrine sequence in the deep areas to the south are considered too tight to allow significant
water movement (Urangesellschaft, 1979a).
5.5 INFRASTRUCTURE
The Anderson Project area is undeveloped with the exception of various access and drill roads and various water wells previously constructed. No utilities exist on or adjacent to the area. A transmission power line runs northwest-southeast along Highway 93, approximately 8 miles to the east; however, direct access to the power line may be obstructed by the Arrastra Mountain Wilderness and Tres Alamos Wilderness located between the power line and the Anderson Project. The construction of a power line would require routing along one of the
existing road corridors, a distance of 16.2 miles to the project boundary.
The nearest town is Congress (population 1,700) located 32 road miles to the east. The nearest major housing, supply center and rail terminal is in Wickenburg (population 6,363) located approximately 43 miles from the Anderson Project by road. Phoenix (population 1.45 million), approximately 100 miles to the southeast by road, is the nearest major industrial and commercial airline terminal. Kingman (population 24,000) is located approximately 110 miles to the northwest by road. UEC’s surface rights encompass 15.4 square miles; this is
sufficient for the surface structures associated with any proposed mining operation.
Arizona currently has a number of operating open pit mines and, historically, has had a number of operating underground mines. As a result, personnel with the required skill set
exist in the State.

BD RESOURCE CONSULTING INC. | JUNE 2012
URANIUM ENERGY CORP NI 43-101 Technical Report
Anderson Project 6-1
6 HISTORY
6.1 PRIOR OWNERSHIP AND EXPLORATION WORK
In January 1955, T.R. Anderson of Sacramento, California detected anomalous radioactivity in the vicinity of the Anderson Project using an airborne scintillometer. After a ground check revealed uranium oxide in outcrop, numerous claims were staked. The “Anderson Mine,” as the operation was known at the time, was drilled and mined by Mr. Anderson (MinEx, 1978a). Work between 1955 and 1959 resulted in 10,758 tons that averaged 0.15% U3O8 and 33,230 pounds U3O8 (Table 6.1) were shipped to Tuba City, Arizona for custom milling (Gilbride et al, 2010). In 1959, production stopped when the Atomic Energy Commission (AEC) ended the purchasing
program.
TABLE 6.1: HISTORICAL PRODUCTION AT THE ANDERSON MINE (ARSENEAU, 2011)
Year Tons Grade
(%U3O8) Pounds (U3O8)
1955 9 0.56 101
1956 31 0.21 130
1957 3,614 0.19 14,043
1958 725 0.27 3,928
1959 6,379 0.12 15,028
Totals 10,758 0.15 33,230
During 1967 and 1968, Getty Oil Company (Getty) secured an option on claims in the northern portion of the Anderson Project. Some drilling and downhole gamma logging was conducted during the option period, but this failed to locate a sizeable uranium deposit. In 1968, Getty
dropped their option.
In 1974, the increasing price of uranium created a renewed interest in the vicinity of the Anderson Project. Following a field check and an evaluation of the 1968 Getty drill data, MinEx optioned
the northern portion of the current Anderson Project (MinEx, 1978a).
In 1975, MinEx purchased the northern portion of the current Anderson Project after a 53-hole, 5,800 m (19,000ft) drilling program on 250 m centers confirmed a much greater uranium resource potential than had been interpreted from the 1968 Getty gamma log data. Further exploration work, consisting of a 180-hole, 22,555 m (74,000 ft) drill and core program on 120 m centers was conducted from November 1975 through February 1976 to further delineate the uranium
BD RESOURCE CONSULTING INC. | JUNE 2012
URANIUM ENERGY CORP NI 43-101 Technical Report
Anderson Project 6-2
resources (MinEx, 1978a). By 1980, MinEx had completed a total of 1,054 holes by rotary and
core drilling.
In 1977, the Palmerita Ranch, located 11 km west of the deposit along the Santa Maria River, was acquired by MinEx to provide a water source for the operations in the event that closer sources proved inadequate. Based on favorable economics, indicated in a Preliminary Feasibility Study completed by Morrison-Knudsen Company, Inc. in December 1977, a detailed Final Feasibility Study was undertaken early in 1978 to evaluate the MinEx holdings on the northern portion of the
current Anderson Project (MinEx, 1978a-c).
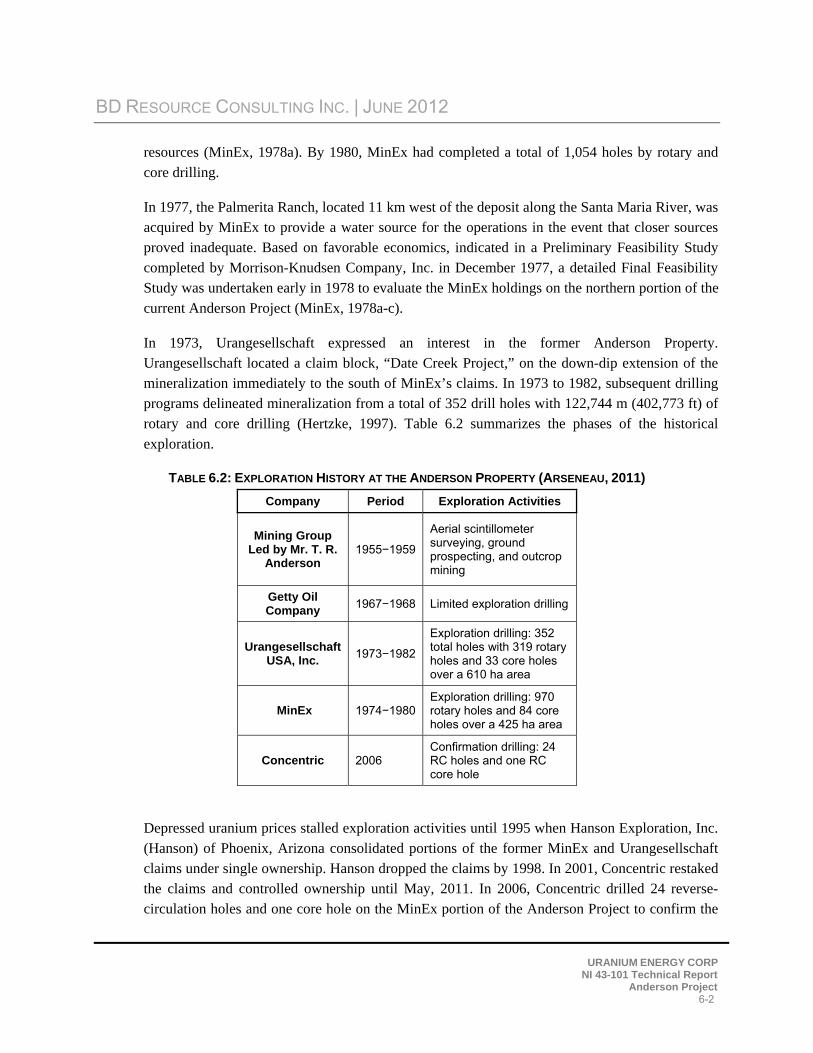
In 1973, Urangesellschaft expressed an interest in the former Anderson Property. Urangesellschaft located a claim block, “Date Creek Project,” on the down-dip extension of the mineralization immediately to the south of MinEx’s claims. In 1973 to 1982, subsequent drilling programs delineated mineralization from a total of 352 drill holes with 122,744 m (402,773 ft) of rotary and core drilling (Hertzke, 1997). Table 6.2 summarizes the phases of the historical
exploration.
TABLE 6.2: EXPLORATION HISTORY AT THE ANDERSON PROPERTY (ARSENEAU, 2011)
Company Period Exploration Activities
Mining Group Led by Mr. T. R.
Anderson 1955−1959
Aerial scintillometer surveying, ground prospecting, and outcrop mining
Getty Oil Company
1967−1968 Limited exploration drilling
Urangesellschaft USA, Inc.
1973−1982
Exploration drilling: 352 total holes with 319 rotary holes and 33 core holes over a 610 ha area
MinEx 1974−1980 Exploration drilling: 970 rotary holes and 84 core holes over a 425 ha area
Concentric 2006 Confirmation drilling: 24 RC holes and one RC core hole
Depressed uranium prices stalled exploration activities until 1995 when Hanson Exploration, Inc. (Hanson) of Phoenix, Arizona consolidated portions of the former MinEx and Urangesellschaft claims under single ownership. Hanson dropped the claims by 1998. In 2001, Concentric restaked the claims and controlled ownership until May, 2011. In 2006, Concentric drilled 24 reverse-circulation holes and one core hole on the MinEx portion of the Anderson Project to confirm the

BD RESOURCE CONSULTING INC. | JUNE 2012
URANIUM ENERGY CORP NI 43-101 Technical Report
Anderson Project 6-3
reproducibility and authenticity of the historical MinEx exploration database. Concentric had planned a similar confirmation drilling campaign on the former Urangesellschaft portion of the Anderson Project for the 2007 field season, but the drill program was never done. UEC has not
conducted any drilling activity to date.
The data generated from this level of historic drilling activity resulted in numerous reports and required additional studies by outside consulting firms such as Chapman, Wood & Griswold; Morrison Knudson; Hazen Research, Inc.; and many others. These reports and studies are listed
in the References section of this report.
6.2 HISTORICAL RESERVE ESTIMATES
Pre-feasibility and feasibility level studies were completed by MinEx (1978a-c) and Urangesellschaft (1979a-c); these studies included reported and published mineral reserve estimates. Note that the previous mineral reserves are quoted here for historical purposes only.
There are no current mineral reserves as defined by NI 43-101 for the Anderson Project.
The historical mineral reserves are relevant because they are an indication of the size and grade of the uranium mineralization found on the property. The historical mineral reserves were estimated by major mining companies using the best methodologies available at the time, but they were prepared before the implementation of NI 43-101 and do not necessarily use the categories for mineral reserve and mineral resource reporting as defined in NI 43-101. The reader should not rely on the historical reserve estimates as they are superseded by the mineral resource estimate
presented in Section 14 of this report.
Mineable reserves, as reported by MinEx, were to be mined using open pit methods.
Urangesellschaft reported reserves using two scenarios:
expansion of MinEx’s proposed open pit onto Urangesellschaft property
stand-alone underground mine on Urangesellschaft property
Mineable reserves defined by MinEx (1978b) were estimated using radiometric and chemical data from 513 MinEx drill holes; a cut-off thickness of 0.6 m (2.0 ft) and a cut-off grade of 0.04% U3O8 were used to define the open pit limit, and an internal cut-off of 0.028% U3O8 was used to define reserves within the pit. A dry tonnage factor of 20.46 ft3/ton (1.58 t/m3) was used to calculate pounds of uranium. At that time, the reserve base was drilled using a 60 m spacing; MinEx considered this sufficient to classify the reserve as “Indicated.” This use of the term “Indicated reserve” does not correspond to a “reserve” as defined by the CIM Definition Standards.
BD RESOURCE CONSULTING INC. | JUNE 2012
URANIUM ENERGY CORP NI 43-101 Technical Report
Anderson Project 6-4
Urangesellschaft used the same cut-off criteria to define reserves for the open pit expansion (0.60 m thickness and 0.04% U3O8 grade). A smaller tonnage factor of 19.3 ft3/ton (1.68 t/m3) was used to reflect changing lithologies in the south compared to MinEx in the north. Underground mining reserves were defined by a cut-off thickness of 1.8 m (6.0 ft) and a cut-off grade of 0.05% U3O8. The underground reserve was based on the same ore tonnage factor as the open pit. Urangesellschaft classified 26% of the reserve pounds U3O8 as “Indicated” based on 60 m (200 ft) drill hole centers and the remaining 74% as “Inferred” based on 122 m (400 ft) drill hole centers. Note that the terms “Indicated reserve” and “Inferred reserve” are not categories used in NI 43-
101.
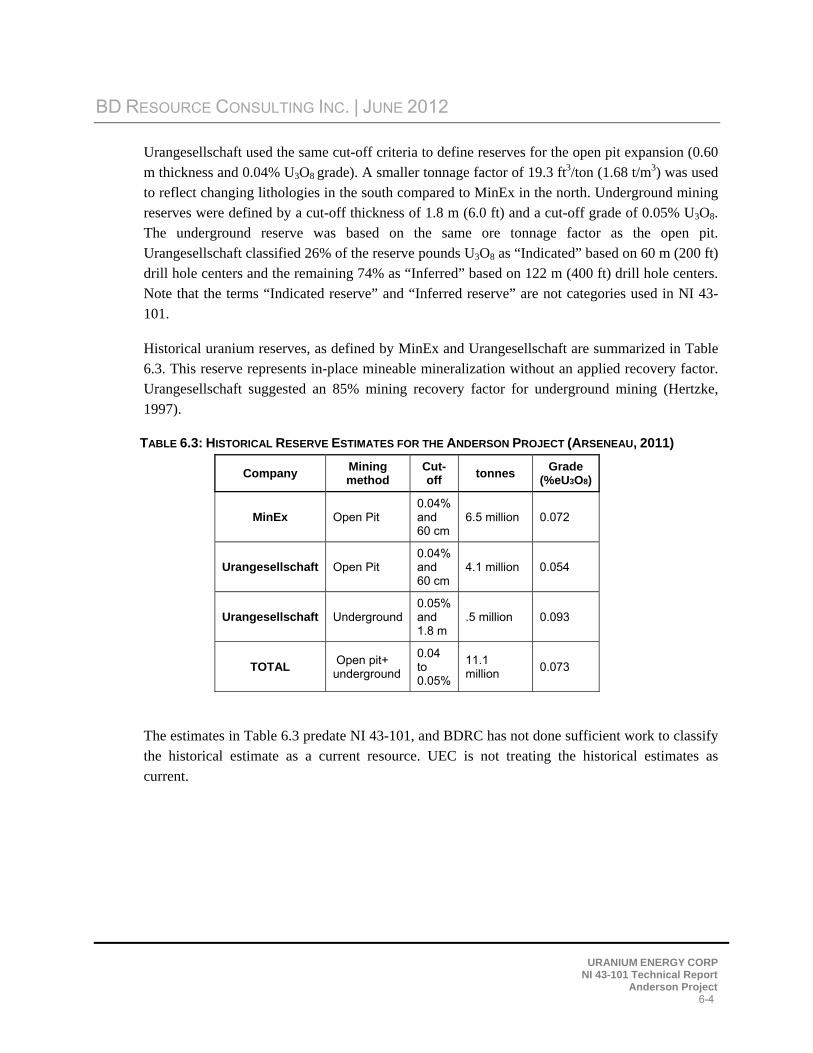
Historical uranium reserves, as defined by MinEx and Urangesellschaft are summarized in Table 6.3. This reserve represents in-place mineable mineralization without an applied recovery factor. Urangesellschaft suggested an 85% mining recovery factor for underground mining (Hertzke,
1997).
TABLE 6.3: HISTORICAL RESERVE ESTIMATES FOR THE ANDERSON PROJECT (ARSENEAU, 2011)
Company Mining method
Cut-off
tonnes Grade
(%eU3O8)
MinEx Open Pit 0.04% and 60 cm
6.5 million 0.072
Urangesellschaft Open Pit 0.04% and 60 cm
4.1 million 0.054
Urangesellschaft Underground 0.05% and 1.8 m
.5 million 0.093
TOTAL Open pit+ underground
0.04 to 0.05%
11.1 million
0.073
The estimates in Table 6.3 predate NI 43-101, and BDRC has not done sufficient work to classify the historical estimate as a current resource. UEC is not treating the historical estimates as
current.

BD RESOURCE CONSULTING INC. | JUNE 2012
URANIUM ENERGY CORP NI 43-101 Technical Report
Anderson Project 7-1
7 GEOLOGICAL SETTING AND MINERALIZATION
7.1 REGIONAL GEOLOGY
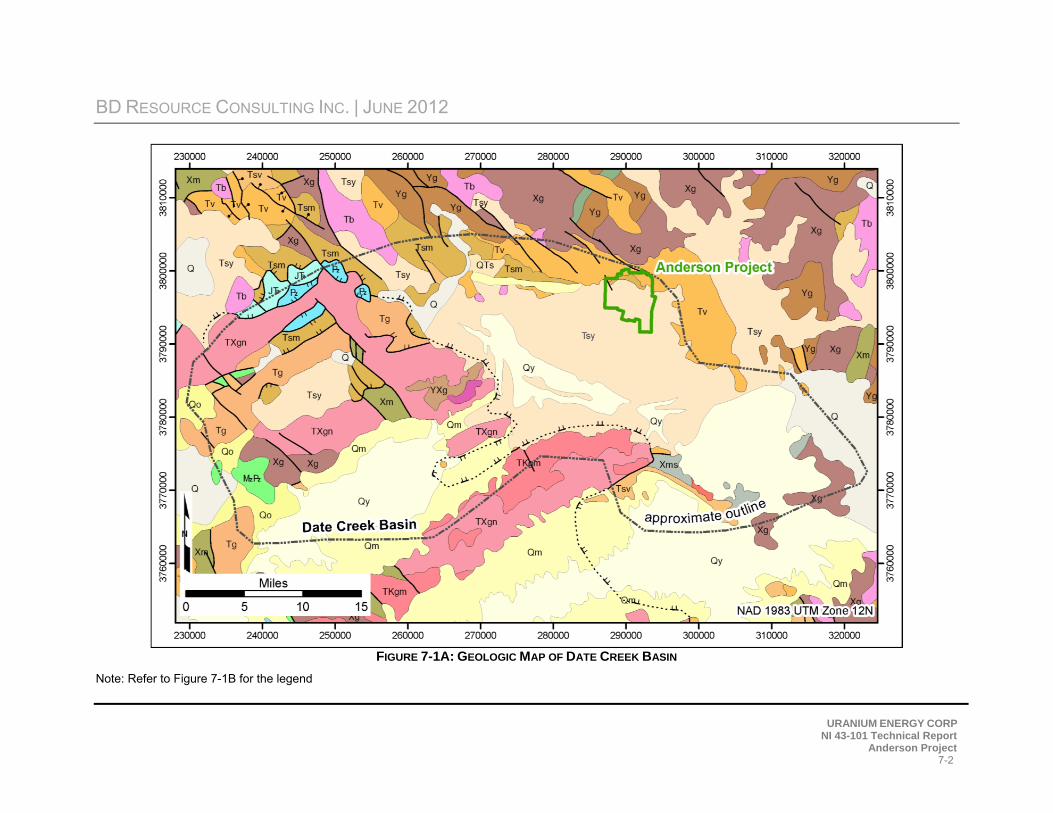
The Anderson Project is located along the northeast margin of the Date Creek Basin of the Basin and Range Province of the western United States. The Date Creek Basin is one of hundreds of Paleogene basins throughout western Arizona, southeastern California, Nevada and western Utah. Paleogene lacustrine and fluvial sediments, and Quaternary gravels have filled these basins to depths of several thousand meters (Urangesellschaft, 1979a). The approximate location of the
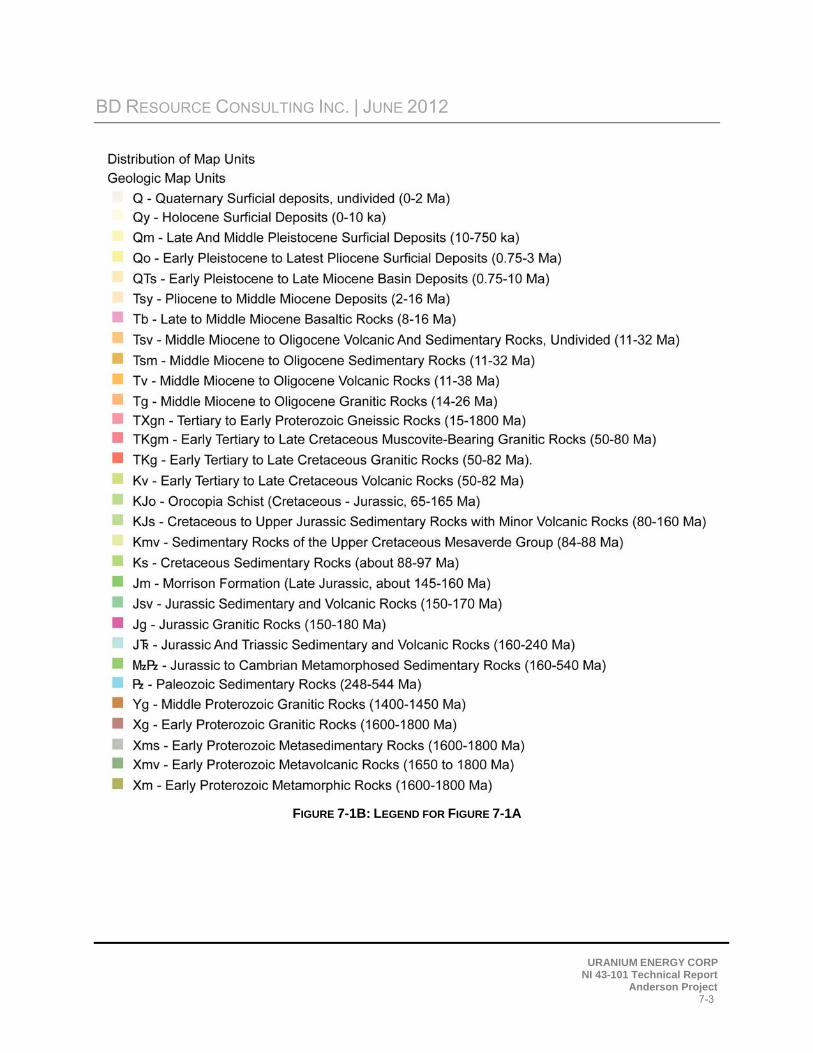
Basin boundaries is shown in Figures 7-1A (with the legend shown in Figure 7-1B).
The basin is surrounded by dissected mountain ranges containing Precambrian metamorphic rocks and granites. Surrounding mountain ranges include the Black Mountains to the north and northeast, and the Rawhide, Buckskin and McCracken Mountains to the west. To the south and southeast, the basin is bordered by a low drainage divide imposed by the Harcuvar and the Black Mountains (MinEx, 1978). Margins of the basin are filled with early Paleogene volcanic flows and volcaniclastic sediments. The basin itself is filled with Oligocene to Miocene lacustrine and
deltaic sediments covered by a thick mantle of Quaternary valley fill (Urangesellschaft, 1979a).
BD RESOURCE CONSULTING INC. | JUNE 2012
URANIUM ENERGY CORP NI 43-101 Technical Report
Anderson Project 7-2
FIGURE 7-1A: GEOLOGIC MAP OF DATE CREEK BASIN
Note: Refer to Figure 7-1B for the legend
BD RESOURCE CONSULTING INC. | JUNE 2012
URANIUM ENERGY CORP NI 43-101 Technical Report
Anderson Project 7-3
FIGURE 7-1B: LEGEND FOR FIGURE 7-1A
BD RESOURCE CONSULTING INC. | JUNE 2012
URANIUM ENERGY CORP NI 43-101 Technical Report
Anderson Project 7-4
The Date Creek Basin was an area of active volcanism during Paleogene time. A thick series of volcanic flows and associated sediments of volcanic ash and clastics were deposited on the pre-existing surface. During a quiescent period, the Date Creek Basin was covered by a shallow lake or swamp in which a thick sequence of fine-grained sediments was deposited. Interbedded coarse sediments, volcanic basalt flows and conglomerates overlay the lake-bed sediments. This sequence of stratified volcanic and sedimentary rocks is 3,000 to 5,000 ft thick in the central
portion of the Date Creek Basin (Hertzke, 1997).
The regional stratigraphic sequence was summarized, from oldest to youngest by MinEx (1978b),
as follows:
Precambrian or Jurassic granitic basement complex
Lacustrine clastic and volcanic members of the Palaeocene-Eocene Artillery Peak Formation
Arrastra Volcanic Complex, including dacitic intrusions, andesitic flows and volcaniclastic members of Paleogene age
Chapin Wash Formation, Anderson Mine lacustrine sediments of Miocene age
Conglomeratic-sandstone unit, possibly equivalent to upper Chapin Wash Formation
Miocene basalt
Pliocene-Pleistocene conglomerate
Quaternary alluvium
7.2 STRUCTURE
The Date Creek Basin has been on the margin of several regional deformations. The basin was located on the northwestern margin of Mazatzal Land and the southeastern margin of the Cordilleran Geosyncline, and was subsequently deformed by the Laramide Orogeny. The Date Creek Basin is presently located on the margin of the Basin and Range Province and exhibits structural deformation typical of the province. Basin and Range deformation is the dominant expression evident at the Anderson property today. Structural trends of this deformation comprise a dominant northwest-southeast trend of parallel to sub-parallel hinged block faults and a less dominant west-northwest, east-southeast fault system. Many of these faults exhibit recurrent
movements (MinEx, 1978).
Three major faults cross the Anderson Project: the East Boundary Fault System, Fault 1878 and the West Boundary Fault System (MinEx, 1978b). Faults trend predominantly N30ºW to N55ºW
and dip steeply (approximately 80º) to the southwest.
Another set of faults trending more westerly (N65ºW) are present in the south-central portion of the Anderson Project. A fault set trending northeast-southwest has been speculated by

BD RESOURCE CONSULTING INC. | JUNE 2012
URANIUM ENERGY CORP NI 43-101 Technical Report
Anderson Project 7-5
Urangesellschaft and others, but has not been observed in the field (MinEx, 1978b). Many of the north-westerly surface water drainage tributaries are developed partially along fault traces (Figure
7-2).
Minor faults and shear zones occur throughout the Anderson Project. These probably represent fractures with slight offset of strata during differential compaction of the underlying sediments or
local adjustment to major faulting.
The largest fold in the area is a broad, gentle, northwest-trending syncline in the south-eastern quarter of Section 9, T11N, R10W. Dips reach a maximum of 13º except where modified by shearing. Many smaller folds with amplitudes of several feet are present in the lacustrine strata
(MinEx, 1978b).
FIGURE 7-2: SURFACE TRACE OF FAULTING ON ANDERSON PROJECT
(ARROWS INDICATE DOWN DROPPED SIDE WHERE KNOWN)

BD RESOURCE CONSULTING INC. | JUNE 2012
URANIUM ENERGY CORP NI 43-101 Technical Report
Anderson Project 7-6
Fault displacements range from a few centimetres to more than 100 m. Fault movement is generally of normal displacement resulting in stair-stepped fault blocks. Local faults also have a tendency to hinge. Minor faulting across the mineralized area is often difficult to discern from variations in sedimentary dips. The lacustrine sediments dip south to south-westerly from 2º to 5º, to a maximum of 15º (Urangesellschaft, 1979a). Much of this dip is attributed to recurrent
faulting during deposition.
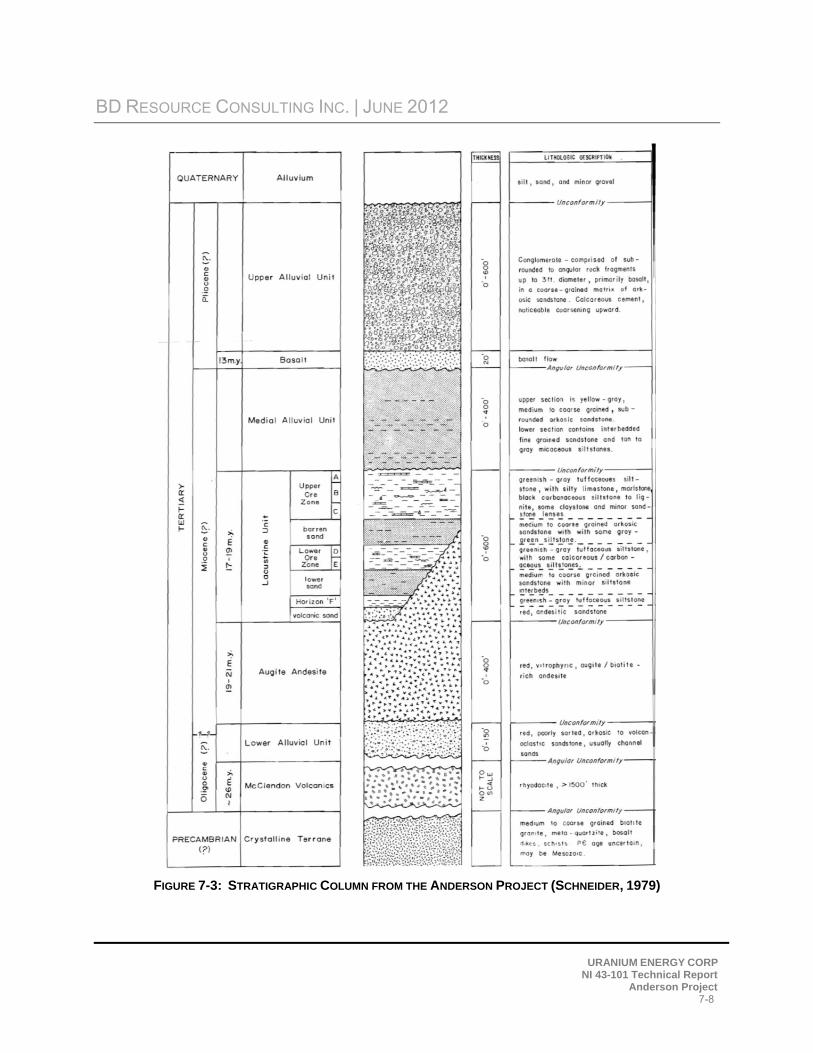
7.3 STRATIGRAPHY
Nine stratigraphic units were identified on the Anderson Project (MinEx, 1978b). Listed from
oldest to youngest, they are as follows:
Crystalline Intrusive Rocks: coarse-grained to pegmatitic Precambrian granite
Felsic to Intermediate Volcanic: flows, breccias, tuffs and minor intrusive
Felsic to Intermediate Volcaniclastic: ash flows, tuffaceous beds and arkosic sandstone
Andesitic Volcanic: porphyritic andesitic flows with a paleosurface and locally reddish-brown paleosols
Lacustrine Sedimentary rocks: micaceous siltstones and mudstone, calcareous siltstones and silty limestone, thin beds of carbonaceous siltstone and lignitic material and host of uranium mineralization, averaging about 60 to 100 m thick
Lower Sandstone Conglomerate: arkosic sandstones and conglomerate, averaging about 60 to 100 m thick
Basaltic Flows and Dikes: amygdular basalt, averaging about 20 m thick
Upper Conglomerate: cobble and boulder conglomerate, partly indurate and locally calcite cemented, averaging about zero to 60 m thick
Quaternary Alluvium: unconsolidated sand and gravel, caliche formed where calcite-cemented
A representative, stratigraphic column of the Anderson Project is shown in Figure 7-3.
Uranium mineralization at the Anderson Project occurs exclusively in the sequence of Miocene-age lacustrine lakebed sediments. The lacustrine sediments unconformably overlie the andesitic volcanic unit over most of the Anderson Project. However, to the east of the Anderson Project,
they overlie the felsic to intermediate volcanic unit.
Evidence suggests that deposition of the lacustrine sediments occurred in a restricted basin less than 5 km wide by 10 to 12 km long on the northern edge of an old Paleogene lake (Chapman, Wood & Griswold Inc., 1977). Moving southward, these sediments inter-tongue with siltstones and sandstones. The lakebed sediments represent time-transgressive facies deposited within a
BD RESOURCE CONSULTING INC. | JUNE 2012
URANIUM ENERGY CORP NI 43-101 Technical Report
Anderson Project 7-7
narrow, probably shallow, basinal feature. This type of depositional environment exhibits complex relationships between individual facies, lensing out, vertical and horizontal gradation,
and interfingering (MinEx, 1978b).
The lake sediments include green siltstones and mudstones, white calcareous siltstones, and silty limestone or calcareous tuffaceous material. Much of this material is silicified to varying extents and was derived in part from volcanic ashes and tuffs common throughout the lakebeds. Also present in the lacustrine sequence are zones of carbonaceous siltstone and lignitic material. Along the boundary between the former MinEx and Urangesellschaft properties, drill holes encounter the basal arkosic sandstone. To the south and southwest, lakebeds interfinger with and eventually
are replaced by a thick, medium to coarse-grained, arkosic sandstone unit (MinEx, 1978b).
BD RESOURCE CONSULTING INC. | JUNE 2012
URANIUM ENERGY CORP NI 43-101 Technical Report
Anderson Project 7-8
FIGURE 7-3: STRATIGRAPHIC COLUMN FROM THE ANDERSON PROJECT (SCHNEIDER, 1979)
BD RESOURCE CONSULTING INC. | JUNE 2012
URANIUM ENERGY CORP NI 43-101 Technical Report
Anderson Project 7-9
7.4 MINERALIZATION
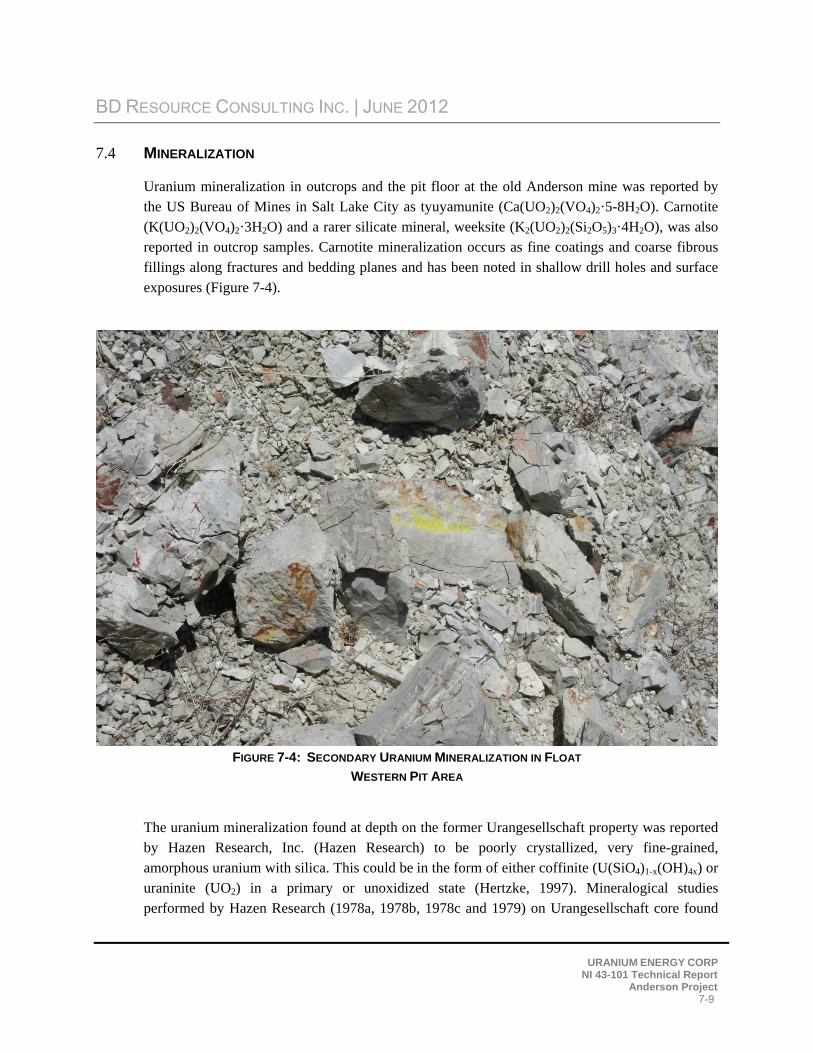
Uranium mineralization in outcrops and the pit floor at the old Anderson mine was reported by the US Bureau of Mines in Salt Lake City as tyuyamunite (Ca(UO2)2(VO4)2·5-8H2O). Carnotite (K(UO2)2(VO4)2·3H2O) and a rarer silicate mineral, weeksite (K2(UO2)2(Si2O5)3·4H2O), was also reported in outcrop samples. Carnotite mineralization occurs as fine coatings and coarse fibrous fillings along fractures and bedding planes and has been noted in shallow drill holes and surface
exposures (Figure 7-4).
FIGURE 7-4: SECONDARY URANIUM MINERALIZATION IN FLOAT
WESTERN PIT AREA
The uranium mineralization found at depth on the former Urangesellschaft property was reported by Hazen Research, Inc. (Hazen Research) to be poorly crystallized, very fine-grained, amorphous uranium with silica. This could be in the form of either coffinite (U(SiO4)1-x(OH)4x) or uraninite (UO2) in a primary or unoxidized state (Hertzke, 1997). Mineralogical studies performed by Hazen Research (1978a, 1978b, 1978c and 1979) on Urangesellschaft core found
BD RESOURCE CONSULTING INC. | JUNE 2012
URANIUM ENERGY CORP NI 43-101 Technical Report
Anderson Project 7-10
that mineralization was associated, for the most part, with organic-rich fractions of the samples. Specifically, the uraniferous material occurs as stringers, irregular masses and disseminations in carbonaceous veinlets with uranium up to 54% as measured by microprobe analysis. X-ray diffraction identified the mineral as coffinite. It is possible that an amorphous, ill-defined uranium silicate with a variable U:Si ratio is precipitated and, under favorable conditions, develops into an
identifiable crystalline form (coffinite).
Of special note is the detection of high-grade, low-reflecting uraniferous material occurring with carbonaceous material in the siltstone. Similar assemblages in unoxidized mineralization have
also been reported for the former MinEx property (Hertzke, 1997).
Urangesellschaft (1979a) distinguished seven mineralized zones, identified as Horizons A, B, C, D, E, F and G, with the youngest (uppermost) being Horizon A and the oldest (deepest) being Horizon G. The majority of uranium occurs in Horizons A, B and C within the property. A conglomeratic sandstone unit interbeds with these units, but does not contain uranium mineralization; it is referred to as the Barren Sandstone Unit and it lies between Horizon C and Horizon D. Consequently, Horizons A through C have been called the Upper Lakebed Sequence
and Horizons D through G have been called the Lower Lakebed Sequence.
Grades of mineralization range from 0.025% U3O8 to normal highs of 0.3 to 0.5% U3O8 with intercepts on occasion of 1.0% to 2.0% U3O8. Secondary enrichment of the syngenetic
mineralization is observed along faults and at outcrops (Hertzke, 1997).
BD RESOURCE CONSULTING INC. | JUNE 2012
URANIUM ENERGY CORP NI 43-101 Technical Report
Anderson Project 8-1
8 DEPOSIT TYPES
The uranium host rock sequence consists predominantly of a green to gray-green tuffaceous mudstone, which is interbedded with calcareous mudstone, carbonaceous mudstone, limestone, marl, lignite, chert and minor sand lenses. This sequence has been called the Anderson Mine Formation by Sherborne (1979) and ranges from 100 m to more than 500 m in thickness. This section has been tentatively correlated westward with the Chapin Wash Formation and most
probably inter-tongues with the Chapin Wash Formation (Hertzke, 1997).
The Anderson Project mineralization is of syngenetic origin and similar in style to deposits found in Argentina and Lake Maitland Australia. Most or all of the lakebeds on the property facies exhibit some uranium mineralization. The highest grades and most continuous mineralization are confined to the carbonaceous siltstones and lignitic materials. Occasional mineralization has also been noted in the basal sandstone of the lacustrine sediments and in the Lower Sandstone Conglomerate Unit. Carbonaceous material is known to interfinger with the basal sandstone, and carbon has been noted in the Lower Sandstone Conglomerate Unit. Remobilization of the uranium has resulted in the deposition of uranium as fracture fillings around and below the main
mineralized zones (MinEx, 1978b).
Carbon tends to immediately fix uranium when it comes into contact with uranium in solution; therefore, much of the mineralization is restricted to the top or bottom of the carbonaceous facies. However, mineralization can occur in the middle of some carbonaceous zones; this relationship implies that mineralization occurred during the deposition of the carbonaceous material (MinEx,
1978b). Mineralization is also prevalent in calcareous facies.
Various origins were suggested for the uranium mineralization (Arseneau, 2011):
1. Devitrification of volcanic tuffs in and around the lacustrine environment that hosted the mineralized sediments
2. Solution, mobilization, and deposition from coarse-grained Precambrian biotite granites (with anomalous uranium values as high as 0.025%) that occur along the northern margins of the Date Creek Basin
3. A combination of 1 and 2 4. Hot springs that may have been present along tectonically active zones 5. Hypogene deposition
The most likely scenario for mineralization may be from alteration of tuffaceous sediments which were deposited in the lacustrine environment combined with solution, mobilization and deposition of uranium contained in the granitic highlands to the north. Liberation of uranium in
BD RESOURCE CONSULTING INC. | JUNE 2012
URANIUM ENERGY CORP NI 43-101 Technical Report
Anderson Project 8-2
proximity to organic material resulted in the formation of the semi-cyclic blanket deposits with the richer grades being associated with organic-rich facies. The uranium in the lacustrine host rocks has not been remobilized by geochemical cells such as those responsible for the well-known roll-front deposits of Wyoming and south Texas. This lack of mobility is demonstrated by the absence of uranium mineralization in the barren sandstone unit which should be an ideal host
for roll-front type deposits (Hertzke, 1997).
BD RESOURCE CONSULTING INC. | JUNE 2012
URANIUM ENERGY CORP NI 43-101 Technical Report
Anderson Project 9-1
9 EXPLORATION
A Light Detection and Ranging (LiDAR) survey was performed over the entire project area by Cooper Aerial Surveys Co. (Cooper Aerial) on 9 July 2011, between 13:07 UTC and 15:14 UTC (6:07 A.M. and 8:14 A.M., MST). Aerial imagery was collected at the same time. Data was processed using one of two base stations to obtain positional accuracies of between 3 and10 cm. Twenty-four ground control points showed a root mean square error of 0.219 ft (6.7 cm) between predicted and measured elevations. Cooper Aerial provided UEC with a one meter pixel digital elevation model (DEM) and a 2 ft contour shape-file derived from the LiDAR data. Cooper Aerial also corrected orthoimagery with a 0.15 m pixel size. Coordinates were converted from WGS84 to NAD 1983 UTM Zone 12N in meters, and elevation was reported in NAVD 1988
international feet. The conversion caused no distortion in elevations used in the resource model.
UEC has not performed any drilling to date on the Anderson Project.
BD RESOURCE CONSULTING INC. | JUNE 2012
URANIUM ENERGY CORP NI 43-101 Technical Report
Anderson Project 10-1
10 DRILLING
10.1 MINEX AND URANGESELLSCHAFT DRILLING
Between 1974 and 1980, MinEx drilled a total of 970 rotary holes and 84 core holes on the northern portion of the Anderson Project, covering an area of approximately 425 ha. In the area that MinEx proposed as an open pit resource, MinEx’s drill spacing was approximately 60 m (200 ft), the remainder of the MinEx property was drilled at nominal 120 m spacing. A total of 84 core holes, approximately 8%, were drilled as twins to rotary holes; of these, 72 had sufficient records to include in the resource database. Core holes were typically located 2 to 3 m from the twinned
rotary hole.
Drill depths to mineralized intervals ranged from surface outcrop to about 250 m along the southern boundary of the historical Urangesellschaft property. Hole diameters varied, ranging
from 10 to 16 cm. Drilling was stopped in 1980.
Between 1973 and 1982, Urangesellschaft drilled the southern portion of the Anderson Project. Rotary and core drilling on a 125 m (400 ft) spacing was completed over an area of approximately 610 ha. Between 1978 and 1979, an additional 70 ha was drilled on 60 m (200 ft) spacing near the northern boundary of the historical Urangesellschaft property in the vicinity of
MinEx’s proposed open pit area.
Drilling totalled more than 122,744 m (402,773 ft) in 319 rotary holes and more than 1,615 m (5,300 ft) in 33 core holes. Drill depths to mineralized intervals ranged from 120 m on the northern boundary of the historical Urangesellschaft property to over 600 m in the southern
portion (Hertzke, 1997).
All Urangesellschaft and MinEx holes were drilled vertically. The average dip of the mineralized beds ranged from approximately 2º to more than 15º across the deposit. The true thickness of the beds is typically 96.5% to 99.9% of the apparent intercept length, based on a stratigraphic dip ranging from 2º to 15º. Occasionally, holes are believed to intercept mineralized high-angle faults at shallow angles and, therefore, report intercept lengths are not representative of true bed thickness. Fault intercepts are generally recognizable by non-corroborating intercepts in
surrounding holes and the proximity of fault traces on the surface.
10.2 CONCENTRIC DRILLING
In 2006, Concentric conducted the first drilling program on the Anderson Project since the field exploration programs of MinEx and Urangesellschaft were stopped in 1980 and 1982,
respectively.
BD RESOURCE CONSULTING INC. | JUNE 2012
URANIUM ENERGY CORP NI 43-101 Technical Report
Anderson Project 10-2
The 2006 drilling program was designed to confirm the authenticity of the historical MinEx exploration database by twinning a spatially distributed and statistically significant number of existing drill holes. A total of 24 vertical rotary holes and one rotary-core hole were drilled between 23 June and 26 September 2006, totaling 2,465 m (8,087 ft) of drilling. All rotary holes were drilled 14 cm in diameter. Drill depths varied from 30 to 200 m depending on location along dip. The core hole was rotary-drilled to the top of a target radiometric zone and then cored between 23 and 29 m of depth. The core was split and shipped for assaying. The location of the 2006 confirmation holes is shown in Figure 10-1. No confirmation holes were drilled on the former Urangesellschaft portion of the Anderson Project. Drilling was completed by Layne Christensen Company, Exploration and Environmental Division, of Chandler, Arizona under the supervision of Exploration Geologist, Ed Huskinson, Jr. of Kingman, Arizona. Lithologic logging
of the drill cuttings was performed on site by Mr. Huskinson.

BD RESOURCE CONSULTING INC. | JUNE 2012
URANIUM ENERGY CORP NI 43-101 Technical Report
Anderson Project 10-3
FIGURE 10-1: CONCENTRIC’S 2006 BOREHOLE LOCATIONS
BD RESOURCE CONSULTING INC. | JUNE 2012
URANIUM ENERGY CORP NI 43-101 Technical Report
Anderson Project 11-1
11 SAMPLE PREPARATION, ANALYSES AND SECURITY
11.1 CORE HOLES
Historical core holes were drilled alongside approximately 7% of the MinEx rotary holes and 9% of the Urangesellschaft rotary holes to verify the geophysical logs. Chemical assaying of the core measured the concentration of uranium and other constituents, including metals, such as vanadium, and trace elements, such as lithium and manganese. Various sized core bits and core barrels were tried by MinEx contractors; the best recovery was obtained using a 7.6 cm diameter
core barrel (NQ core) (Roberts, 1978).
The core from each run was measured, labelled and boxed for shipment. When the core arrived at MinEx office, it was split length wise, and half of each core was dried and pulverized. Pulverized core, representing 15 to 30 cm intervals, was analyzed on a Blake Beta-Gamma scaler (Roberts, 1978). Each interval was analyzed three times and an average was taken. Subsequently, core was
sent to a laboratory for closed-can analyses.
Based on the work performed by MinEx, there are elevated levels of vanadium associated with zones of uranium mineralization. Manganese also showed a direct relationship with higher grade uranium mineralization; lithium and fluorine showed an indirect relationship. All rotary and core holes were probed with downhole gamma ray probes. Concentric acquired most of the original
paper logs for the MinEx and Urangesellschaft drilling.
11.2 ROTARY HOLES
All of the Urangesellschaft holes were drilled and logged by Century Geophysical Corporation (Century Geophysical) based in Grants, New Mexico and Tulsa, Oklahoma. MinEx conducted electric logging using Century Geophysical, based in Denver, Colorado, and other unidentified
contractors. Based on log results, equivalent logging methods were employed by all parties.
In order to use the historical gamma ray logs, Agapito developed a procedure to digitize the existing hard copy geophysical logs: converting the digitized logs to numerical values and processing the values to calculate radiometric-equivalent uranium grades, designated as % eU3O8. The Agapito procedure is based on an historical FORTRAN computer code, GAMLOG, designed
by the United States Atomic Energy Commission (Scott, 1962).
BD RESOURCE CONSULTING INC. | JUNE 2012
URANIUM ENERGY CORP NI 43-101 Technical Report
Anderson Project 11-2
11.3 LOGGING PRACTICES
All holes were logged for gamma ray, resistivity, and self-potential (SP) curves plotted by depth. The resistivity and SP curves provide bed boundaries and were mainly used for correlation. The resistivity curve, calibrated in ohms, is a measure of the formation water resistivity. Generally, sandstones show a deflection to the right or a greater resistivity than shale. The spontaneous, or SP curve, indicates the natural potential differences, in millivolts, between an electrode at the surface and an electrode in the probe within the drill hole fluid that is pulled up past different beds. This potential depends on a number of factors, but it generally indicates the permeable
zones, or sandstones, as a deflection left from the shale baseline.
The gamma ray (radiometric) log is used to interpret the amount of equivalent U3O8 in a zone by measuring the gamma radiation of radioactive uranium decay products. Measurement units are in counts of gamma radiation per second (cps); these are converted to an equivalent percentage of uranium by weight (% eU3O8). The scintillation probes can delineate anomalous uranium
mineralization to approximately 7 to 15 parts per million (ppm) eU3O8.
The logs comprised a hard-copy continuous-line plot of the values for gamma radiation, resistivity and SP. Resistivity and SP were logged only in select holes. Vertical deviation surveys
were also completed in some holes, although survey data are not readily available.
In 1977, Century Geophysical introduced computerized logging (Compu-Log) to the Urangesellschaft exploration program; this allowed equivalent uranium grades to be calculated at
the time of logging.
Field data were produced in four forms:
the regular gamma electric log
the digital printout of gamma data in cps
an ore grade analysis printout (% eU3O8)
a magnetic cartridge tape containing all data contained in the electric log
Downhole measurements were reported for 0.5 ft intervals.
11.4 PROBE CALIBRATION
The principal quality control element that affects the accuracy of radiometric sampling data is the calibration of the logging probe. Records indicate that all logging was conducted with probes that were calibrated by Century Geophysical and other contractors. With only minor exceptions, probe
BD RESOURCE CONSULTING INC. | JUNE 2012
URANIUM ENERGY CORP NI 43-101 Technical Report
Anderson Project 11-3
calibration parameters, including k-factor and dead-time factor, were reported with each gamma
log.
Probe calibration was audited by Chapman, Wood & Griswold Inc. (1977) on the MinEx project. Prior to the audit, two different series of radiometric probes were used to log MinEx holes AM-1 through AM-515. One series of probes was shielded (three probes) and the other unshielded (one probe). The audit evaluated calibration data from 24 June 1976 and 07 June 1977 and tested one probe as part of the audit at the Grand Junction, Colorado, N-3 test pit maintained by Bendix Field Engineering Corporation for the US Department of Energy (DOE). The audit did not identify any deficiencies within the calibration practices of the exploration program and
determined the tested probe to be accurate (Chapman, Wood & Griswold, 1977).
11.5 GAMMA LOG DIGITIZING
No digital gamma logs were available from the MinEx and Urangesellschaft exploration programs. A total of 1,049 paper strip logs from the former MinEx property (including 2 repeats) and 336 from the former Urangesellschaft property (8 holes missing logs) were available and used by Agapito. For the purpose of converting the paper logs to digital values, Agapito scanned all strip logs to digital raster images using a high resolution flatbed scanner, producing black and white, 200- or 400-dpi TIFF files. Files ranged from 100 KB to 4 MB depending on the scanning
resolution and length of the log.
Didger, version 3.0 (Golden Software, Inc., 2006), a commercially available digitizing program, was used. The digitizing procedure involved registering multiple calibration points at known positions around the on-screen gamma log. Calibration points normally included the corners and midpoints of the gamma versus depth chart. Positions X and Y were manually entered for each calibration point. X-values were entered in inches; these corresponded to a recorded scaling factor in cps/in. Y-values were entered in feet of depth below the hole collar. The calibration points allowed the software to automatically adjust for misalignment and distortion in the scanned logs. A total of 57 MinEx logs and 16 Urangesellschaft logs were eliminated from the dataset due to
illegibility, excessive distortion, incomplete information or other reasons.
Once calibrated, the gamma trace was manually digitized on-screen by sampling points along the trace with the cursor. Points were sampled with sufficient resolution to represent the highs (peaks) and lows (valleys) of the trace. Between points, the digitized trace was treated as linear. Intermediate points were sampled where additional definition was required. The density of points was adjusted based on the variability of the trace. Care was taken to include enough points to capture the “peak” of spikes and the “tails” of the spikes to avoid over- or under-representation of the gamma signature. A typical digitized log included 50 to 1,500 points per hole depending on
the variability of the log and its length.

BD RESOURCE CONSULTING INC. | JUNE 2012
URANIUM ENERGY CORP NI 43-101 Technical Report
Anderson Project 11-4
The majority of logs contained “reruns,” where the original trace exceeded the range of the log strip at high gamma intercepts and required replotting at smaller scales. Reruns were superimposed on the original trace in the logs. A rerun required that the entire calibration and digitizing process be repeated separately for each alternative X-scale used. Typically, two to four
reruns were encountered per hole.
Digitizing coordinates were temporarily stored in ASCII (.txt) files and later compiled into a single, dedicated MS Office Excel® spreadsheet per drill hole. The X-coordinate, expressed in inches, was converted to cps by multiplying the X-coordinate by the recorded cps/in scaling factor. A Rerun was converted to cps by multiplying the X-coordinate by its respective scaling factor and manually adding the rerun to the original trace listing; this ultimately produced a
continuous listing of cps versus depth.
Finally, all header information associated with the log was entered into a standardized header in the Excel® log file and combined with the gamma trace listing. Key header information included drill hole collar coordinates, hole diameter, water factor, k-factor and dead-time factor. Blank or
illegible log entries were left blank in the Excel® file.
Digitizing was completed by Concentric personnel. Agapito and SRK personnel were responsible
for error checking and quality assurance (QA).
Instead of attempting a line-by-line translation of the original GAMLOG FORTRAN code, Agapito used the algorithm described by Scott (1962) to develop an independent code within Excel®, with spreadsheet rows representing depth intervals and columns representing successive
iterations of the composite grades for each interval.
UEC and SRK reviewed the Excel® code and did not identify any errors in logic; they found that the macro appeared to perform as intended. Agapito tested their macro against five example logs included with the original GAMLOG program to illustrate various input and output options: each example was processed using the new procedure. Table 11.1 shows the comparison of grades
which confirms close agreement between the two calculation methods.

BD RESOURCE CONSULTING INC. | JUNE 2012
URANIUM ENERGY CORP NI 43-101 Technical Report
Anderson Project 11-5
TABLE 11.1: COMPARISON OF GAMLOG AND EXCEL GRADE CALCULATIONS FROM CPS DATA
(GILBRIDE ET AL, 2010)
Depth (ft)
Excel® Original
GAMLOG
Difference (GAMLOG vs. Excel®)
Depth (ft)
Excel® Original
GAMLOG
Difference (GAMLOG vs. Excel®)
Hole 1 Hole 4
0 0.002 0 0 4.7 0.057 0.05 -0.01
0.5 1.069 1.07 0 5.2 0.068 0.07 0
1 0.375 0.37 -0.01 5.7 0.26 0.26 0
1.5 0.011 0.01 0 6.2 0.322 0.32 0
2 0.56 0.56 0 6.7 0.256 0.26 0
2.5 0.764 0.76 0 7.2 0.336 0.34 0
3 0.544 0.54 0 7.7 0.478 0.47 -0.01
3.5 0.098 0.1 0 8.2 0.159 0.17 0.01
4 0.206 0.21 0 8.7 0.273 0.27 0
Hole 2 9.2 0.094 0.1 0.01
0 0.226 0.23 0 Hole 5
1 0.454 0.45 0 0 0.02 0.02 0
2 0.487 0.49 0 0.5 0.015 0.02 0.01
3 0.528 0.51 -0.02 1 0.052 0.04 -0.01
4 0.121 0.13 0.01 1.5 0.007 0.02 0.01
Hole 3 2 0.009 0.01 0
10 0.121 0.12 0 17.2 0.002 0.02 0.02
10.5 0.144 0.14 0 17.7 0.01 0.04 0.03
11 0.115 0.13 0.02 18.2 0.002 0.04 0.04
11.5 0.33 0.32 -0.01 18.7 0.003 0.02 0.02
12 0.157 0.17 0.01 12.5 0.092 0.07 -0.02 13 0 0.03 0.03
13.5 0.008 0.04 0.03 14 0 0.02 0.02
14.5 0.001 0.02 0.02 15 0.016 0 -0.02
15.5 0 0 0 16 0.217 0.2 -0.02
16.5 0.057 0.07 0.01 17 0.007 0 -0.01
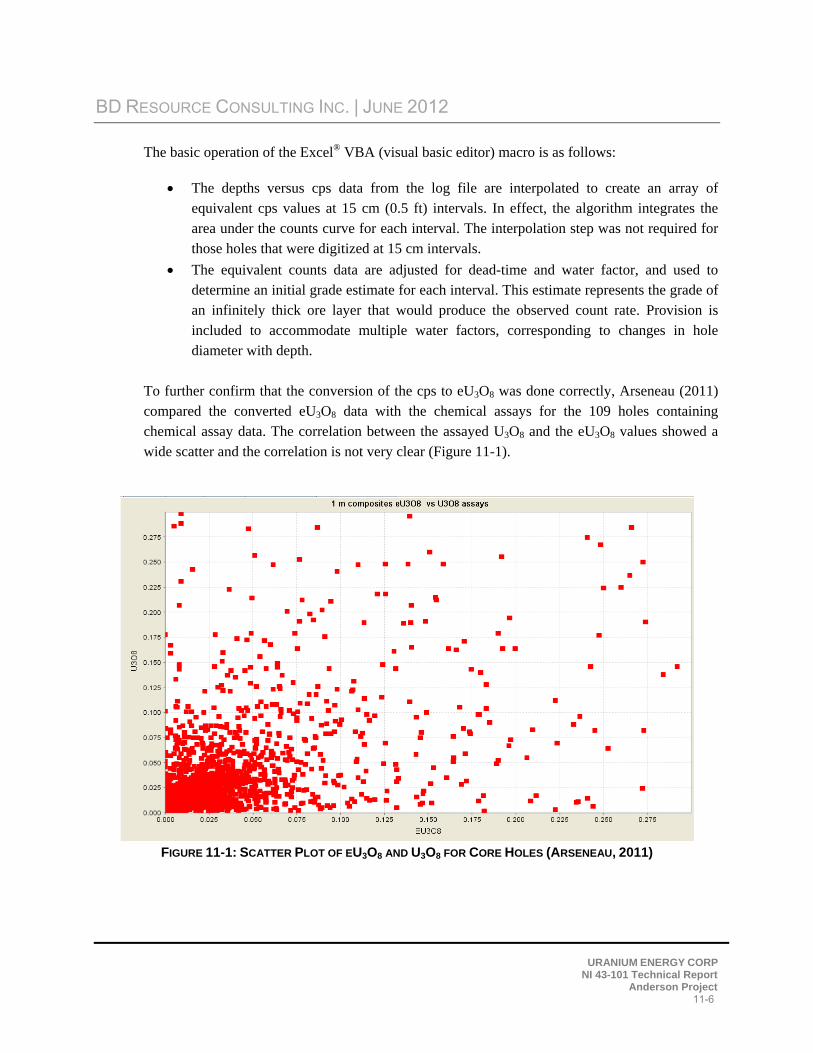
BD RESOURCE CONSULTING INC. | JUNE 2012
URANIUM ENERGY CORP NI 43-101 Technical Report
Anderson Project 11-6
The basic operation of the Excel® VBA (visual basic editor) macro is as follows:
The depths versus cps data from the log file are interpolated to create an array of equivalent cps values at 15 cm (0.5 ft) intervals. In effect, the algorithm integrates the area under the counts curve for each interval. The interpolation step was not required for those holes that were digitized at 15 cm intervals.
The equivalent counts data are adjusted for dead-time and water factor, and used to determine an initial grade estimate for each interval. This estimate represents the grade of an infinitely thick ore layer that would produce the observed count rate. Provision is included to accommodate multiple water factors, corresponding to changes in hole diameter with depth.
To further confirm that the conversion of the cps to eU3O8 was done correctly, Arseneau (2011) compared the converted eU3O8 data with the chemical assays for the 109 holes containing chemical assay data. The correlation between the assayed U3O8 and the eU3O8 values showed a
wide scatter and the correlation is not very clear (Figure 11-1).
FIGURE 11-1: SCATTER PLOT OF EU3O8 AND U3O8 FOR CORE HOLES (ARSENEAU, 2011)
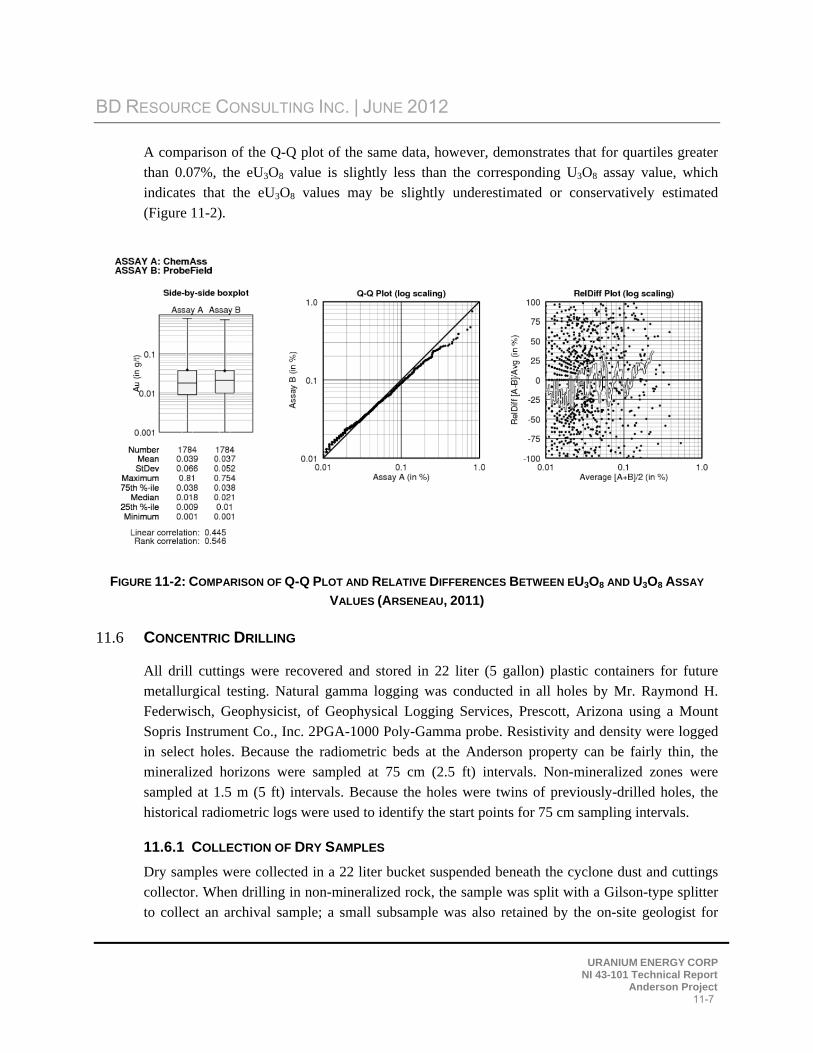
BD RESOURCE CONSULTING INC. | JUNE 2012
URANIUM ENERGY CORP NI 43-101 Technical Report
Anderson Project 11-7
A comparison of the Q-Q plot of the same data, however, demonstrates that for quartiles greater than 0.07%, the eU3O8 value is slightly less than the corresponding U3O8 assay value, which indicates that the eU3O8 values may be slightly underestimated or conservatively estimated
(Figure 11-2).
FIGURE 11-2: COMPARISON OF Q-Q PLOT AND RELATIVE DIFFERENCES BETWEEN EU3O8 AND U3O8 ASSAY
VALUES (ARSENEAU, 2011)
11.6 CONCENTRIC DRILLING
All drill cuttings were recovered and stored in 22 liter (5 gallon) plastic containers for future metallurgical testing. Natural gamma logging was conducted in all holes by Mr. Raymond H. Federwisch, Geophysicist, of Geophysical Logging Services, Prescott, Arizona using a Mount Sopris Instrument Co., Inc. 2PGA-1000 Poly-Gamma probe. Resistivity and density were logged in select holes. Because the radiometric beds at the Anderson property can be fairly thin, the mineralized horizons were sampled at 75 cm (2.5 ft) intervals. Non-mineralized zones were sampled at 1.5 m (5 ft) intervals. Because the holes were twins of previously-drilled holes, the
historical radiometric logs were used to identify the start points for 75 cm sampling intervals.
11.6.1 COLLECTION OF DRY SAMPLES
Dry samples were collected in a 22 liter bucket suspended beneath the cyclone dust and cuttings collector. When drilling in non-mineralized rock, the sample was split with a Gilson-type splitter to collect an archival sample; a small subsample was also retained by the on-site geologist for
BD RESOURCE CONSULTING INC. | JUNE 2012
URANIUM ENERGY CORP NI 43-101 Technical Report
Anderson Project 11-8
logging purposes. In mineralized zones, an assay sample was captured in a clean bucket and poured into the hopper at the top of a Gilson-type splitter. The dividers below the hopper were set to provide about 1 to 2 kg of dry samples for assays. These dry samples were collected in large pans and then poured into orange buckets that were emptied into plastic bags; the sample numbers were recorded on the bag. Tear out sample tags with the sample numbers were placed in the bags and the bags were immediately sealed with blue zip-ties. After each sample was collected, the Gilson splitter and the orange sample buckets were cleaned with a high-pressure air
hose and/or steel brush.
The remaining, much larger archival split was collected in a large pan that was emptied into a new, clean, pre-numbered white bucket with the sample number written on the side. Before the archival bucket was sealed, a logging subsample was collected from the archival bucket, lightly washed through a 12- to16-mesh standard sieve, and placed into a sample container that held one dozen samples representing 20 m of drill hole. Oversized material from the wet sieving operation was placed back into the archival bucket. The logging subsample was delivered to the on-site geologist who logged the borehole in real time, but never more than 20 or 30 m from the advancing bit. Often, if the drill penetration rate was low, samples would be logged at 6 m intervals (at the end of each drill steel). Geologic control and understanding of the units was
strictly maintained in the field.
After the logging subsample had been collected, the archival sample bucket was sealed with a new lid with the sample number written on it; this was checked against the number on the bucket. The on-site geologist recorded the sample number on the field logging form. Each night, the samples from the mineralized zones were transported to and locked in the Concentric Energy's office/warehouse. Usually the entire sample run for the day was transported to the warehouse, but occasionally only the mineralized zones would be carried back. On two occasions, samples from
mineralized zones were left at the drill site overnight in a locked, steel container.
11.6.2 COLLECTION OF WET SAMPLES
Below the water table, the following modified sampling protocol was used: after passing through the cyclone receiver, the wet cutting was sent through an Anaconda wet splitter (a hydraulic wet splitter that turns under the cyclone receiver) where it was divided into 16 pie-shaped segments that could be covered. If all the wedges were left uncovered, then 100% of the sample was recovered at the bottom of the splitter. If eight of the wedges were covered up, then the splitter yields an 8/16, or 50/50 split. The material that passed through the uncovered open wedge fell through the splitter and was collected in a bucket suspended beneath the outlet pipe. The other half passed outside the sampling area and was directed to a pipe on the side of the wet splitter.
That side could be sampled as well by suspending a bucket under the discharge pipe.
BD RESOURCE CONSULTING INC. | JUNE 2012
URANIUM ENERGY CORP NI 43-101 Technical Report
Anderson Project 11-9
In non-mineralized zones, the splitter was adjusted to yield a quantity sufficient to fill a standard polypropylene sample bag. After the sample was collected, the sample bag was lifted out of the
pipe, the sample tag is inserted, and the bag is sealed and set aside for temporary storage.
In mineralized zones, the number of covered wedges was regulated to yield a split that could be collected in a bucket suspended underneath the splitter. At the end of the 75 cm sample interval, the bucket was removed and a waterproof sample tag was placed in the bucket before the bucket
was sealed with a new lid; the sample number was recorded on the lid.
The logging subsample was collected using a standard 12- to 16-mesh testing sieve placed under the Anaconda splitter’s side discharge. A representative sample from the sieve was placed into a
12-compartment tray for future logging.
Using both wet and dry samples, the on-site geologist prepared a 20-compartment, plastic archival chip tray using the chip samples that were used to log the geology and mineralogy of the borehole. Each compartment was labelled with the footage interval and the unique sample number. These chip trays provided quick and easy access to the borehole geology for subsequent review or examination, and acted as a field check on sample continuity and accuracy at the drill
site.
The mineralized samples were always under the control of the site geologist, either locked in Concentric Energy's warehouse, or, as they had been in two instances, locked at the drill site
overnight before being transported to the warehouse the following day.
11.7 HISTORICAL CHEMICAL ASSAYING
MinEx and Urangesellschaft both conducted chemical assays on core recovered from exploration core holes. Approximately 3,125 individual chemical assays were completed by MinEx from 72 core holes. Approximately 2,471 individual chemical assays were completed by Urangesellschaft from 33 core holes. Tables containing historical assay values are provided in MinEx and Urangesellschaft historical reports. The Original assay certificates were not reviewed for this report because they are not available. Arseneau (2011) compiled all the historical assay data and imported the data in Gemcom to use in resource estimation and validation. A total of 3,577 historical assays were imported: 1,610 from MinEx drill holes and 1,967 from Urangesellschaft
drill holes.
11.7.1 ASSAY PRACTICES
Two types of quantitative chemical assays were performed: fluorimetric (X-ray fluorescence) and
colorimetric (wet) assays. Both methods reported percent uranium by weight.

BD RESOURCE CONSULTING INC. | JUNE 2012
URANIUM ENERGY CORP NI 43-101 Technical Report
Anderson Project 11-10
The vast majority of chemical assays were fluorimetric, a rapid and inexpensive replacement for conventional wet chemical analyses. With fluorimetric assays, the sample is irradiated by X-rays that cause elements within the sample to fluoresce X-rays in turn. Characteristic spectra are emitted for each element. The numbers of emitted X-rays per characteristic wave length are proportional to the amount of the element present. A spectrometer is used to measure the count
rate of emitted radiation at various wave lengths.
Chemical assays were cross-checked in some cases with closed-can (sealed) and open-can gamma assays where the same piece of core was used in both tests. Closed-can or open-can assays measure gamma radiation in the laboratory, from which equivalent uranium grade is computed as a function of the amount of radiation and mass of the specimen. Hazen Research, Inc. (Hazen Research) performed a limited number of semi-quantitative X-ray fluorescence analyses of minor
elements for MinEx.
Almost all chemical assays were performed on 30 cm (1.0 ft) core lengths. MinEx performed
chemical assays on 15 cm (0.5 ft) core lengths in limited capacity on early holes.
The MinEx chemical assays were performed by Hazen Research of Golden, Colorado. Hazen Research is certified under the United States Environmental Protection Agency (USEPA). Additional assays were completed at Chemical & Geochemical Laboratories in Casper, Wyoming and check assays were completed at Skyline Assayers and Laboratories, Inc. (Skyline Labs) in
Tucson, Arizona.
Skyline Labs hold a State of Arizona Board of Technical Registration certification and ISO 17025 certification, but Arseneau (2011) was not aware of this certification in 1979 when most of the
samples were processed.
All Urangesellschaft samples were processed at Hazen Research or Skyline Labs.
Both Hazen Research and Skyline Labs are long-established laboratories that have provided assay
services to the mining industry for many years.
11.7.2 ASSAY QUALITY CONTROL
For the purposes of quality control, MinEx conducted cross-checks of assays between the three laboratories used during the exploration program. Originally, average grade equilibrium factors calculated from chemical and closed-can results were compared to check the consistency of chemical and radiometric data between laboratories. Equilibrium factors were compared based on 429 colorimetric and closed-can radiometric assays from Chemical & Geochemical Laboratories and 1,619 fluorimetric assays and 838 closed-can assays from Hazen Research (Lucht, 1978).
BD RESOURCE CONSULTING INC. | JUNE 2012
URANIUM ENERGY CORP NI 43-101 Technical Report
Anderson Project 11-11
MinEx determined that equilibrium factors varied by location and did not provide a meaningful
basis to compare consistency between laboratories.
MinEx achieved tight consistency between laboratories by establishing a set of 30 standardized pulp samples, referred to as the “Anderson Standards.” The standard samples ranged in grade from 0.009% to 0.450% chemical U3O8 (Lucht, 1978). Chemical U3O8 (cU3O8) is the grade determined by chemical assay. The samples were first assayed by fluorimetric method at either Chemical & Geochemical Laboratories or Hazen Research, and then re-assayed by Skyline Labs. The re-assayed results were found to be within ± 0.002% cU3O8 of the original assays. Assays over 0.1% cU3O8 were confirmed using long-term, wet-chemical assays (volumetric analyses). MinEx concluded that the three laboratories were producing uranium assays with sufficient
consistency to validate the results of their sampling program.
Urangesellschaft’s sampling program was conducted at the same time as MinEx’s program and produced the same type of fluorimetric chemical assays from Chemical & Geochemical
Laboratories and Hazen Research.
11.8 CONCENTRIC CHEMICAL ASSAYING
Anderson Mining Company, a wholly-owned subsidiary of Concentric Energy, conducted a due diligence drilling program on the northern portion of the Anderson Project. The program involved
drilling holes adjacent to selected historical exploration holes to confirm stratigraphy and grade.
These twinned holes were selected by an independent consultant, Don Earnest of Resource
Evaluation, Inc., Tucson, Arizona.
11.8.1 SAMPLE PREPARATION
The Concentric samples were collected at the drill rig at 0.75 m intervals (2.5 ft) and shipped to Jacobs Laboratory in Tucson for drying and preparation. At Jacobs Laboratory, each sample bag was opened and the contents were carefully poured into large drying pans. The enclosed sample field tag accompanied the sample throughout the lab. The drying pans were placed in an oven, and dried for a minimum of 24 hours. After cooling, the contents of the pans were put into larger pans, then passed through a jaw roll crusher and reduced to nominal 10 mesh. The sample was
then homogenized by pouring it from pan to pan, back and forth, several times.
After homogenization, the sample was passed through a Jones-type riffle splitter to produce a 300 gram (gm) subsample. The subsample was pulverized to 80% passing -100 mesh with a disc pulverizer. The splitter reject was placed back in the bucket, sealed and stored in the warehouse. The pulp sample was homogenized and a 10 gm subsample was collected and shipped to ACTLABS in Ancaster, Ontario, Canada for DNC (Delayed Neutron Count) analysis for U3O8
BD RESOURCE CONSULTING INC. | JUNE 2012
URANIUM ENERGY CORP NI 43-101 Technical Report
Anderson Project 11-12
determination. Pulps for ICP were shipped to American Assay Lab (AAL) in Sparks, Nevada for
multi-element (package ICP-2A) analysis.
11.8.2 SAMPLE SECURITY
After collection at the drill site, the samples were logged on a sample submittal sheet that accompanied the samples when they were either picked up by Jacobs Lab personnel or were transported to the Jacobs Lab facility in Tucson, Arizona, by Concentric Energy personnel. On arrival at Jacobs Lab’s facility, the samples were placed in numerical order and logged into the
computer system.
After the samples were prepared for analysis, the individual sample containers were placed in a container and shipped to a laboratory together with blanks, duplicates and standards, with a copy of the sample log sheet. The containers and the pulp samples were shipped by UPS to ACTLABS for DNC analysis or AAL for ICP analysis. A copy of the UPS tracking number was kept at Jacobs Lab with a copy of the sample submittal sheet in the respective shipment. When the shipment was received at the lab, a copy of the sample submittal sheet was sent back to Concentric to indicate that they had been received. At each transfer, the transferor and the recipient both signed the sample log sheet. When the lab results were submitted to Concentric, a
copy of the sample submittal sheet was attached to complete the chain of custody.
11.8.3 ASSAYING PROCEDURES
Samples shipped to ACTLABS were analyzed by neutron-activated DNC. The technique consists of dual cyclic neutron activation in a differentiated neutron flux spectrum at bare and cadmium-covered irradiation positions and subsequent delayed-fission neutron counting. Uranium
concentrations are determined from calibration curves determined for samples of known activity.
Samples shipped to AAL were analyzed by ICP-atomic emission spectrometry (ICP-AES). Detection limits, sensitivity, and the optimum and linear concentration ranges of the elements can vary with the wavelength, spectrometer, matrix and operating conditions. Prior to analysis, samples must be solubilized or digested using appropriate sample preparation methods. The instrument measures characteristic emission spectra by optical spectrometry. Samples are nebulized and the resulting aerosol is transported to the plasma torch. Element-specific emission spectra are produced by a radio-frequency ICP. The spectra are dispersed by a grating spectrometer, and the intensities of the emission lines are monitored by photosensitive devices.
Background correction is required for trace element determination.
11.8.4 LABORATORY CERTIFICATIONS
Jacobs Labs, of Tucson, Arizona, (520 622 0813) is a recognized and registered State of Arizona Board of Technical Registration lab on the list of recommended assay labs issued by the Arizona
BD RESOURCE CONSULTING INC. | JUNE 2012
URANIUM ENERGY CORP NI 43-101 Technical Report
Anderson Project 11-13
Department of Mines and Mineral Resources. ACTLABS in Ancaster, Ontario, Canada L9G 4V5 is used as a check lab by many of the uranium companies in Canada. They are accredited for
assaying by the Standard Council of Canada, ISO 17025 (266).
AAL is a registered and approved assay lab located in Sparks, Nevada with the following
accreditations:
• Certificate of International Standards Organization (ISO)\IEC 17025 • Certificate of Laboratory Proficiency PTP-MAL, accredited by Standards Council of
Canada • Geostats of Australia certificate • Society of Mineral Analysts, Round Robin testing
11.8.5 QUALITY ASSURANCE/QUALITY CONTROL
Standards were obtained from CANMET Mining and Mineral Sciences Laboratories in Ottawa, Ontario, Canada for use in calibration of the analysis equipment. Standard #BL-1, which grades 0.022% (± 0.001%) U was used to verify the DNC results. Because the results of DNC analysis of the calibration standard always fell within the acceptable range, no changes or adjustments to the
sample preparation were deemed necessary.
BDRC believes that all sample preparation, security and analytical procedures are adequate for
the purposes of this Technical Report.
BD RESOURCE CONSULTING INC. | JUNE 2012
URANIUM ENERGY CORP NI 43-101 Technical Report
Anderson Project 12-1
12 DATA VERIFICATION
UEC validated the collar locations provided by Concentric using aerial image interpretation/remote sensing and global navigation satellite system measurements. The first phase of data validation used the database coordinate locations: each drill hole location was reviewed in relation to the high-resolution orthoimagery in ESRI ArcMap. Drill pads and areas of disturbance are easily identified on the orthoimagery. The location was deemed to be valid based on the following criteria: if the location of the drill hole matched a drill pad, the location and the elevation from the DEM were accepted; if the location of a drill hole did not match an area of disturbance in the image, the drill hole was flagged and rechecked in the field. Of the 1,336 drill hole locations originally provided in the database, approximately 20% (269 drill holes) were flagged for field-checking. An additional 27 areas were identified on the orthoimagery that
showed disturbance but were not correlated with a drill hole location.
The second phase of data validation involved locating and measuring drill hole locations in the project area using a Trimble GeoXH mapping-grade GPS unit. The following drill hole
classifications were used:
located, if the drill hole was found and measured
location probable, if the original location was accepted after relocation in the field
wrong location, if the drill hole could not be relocated or the site was obviously not suitable for drilling, such as on a steep hillside.
Fourteen drill holes were found in the field that were ultimately not included in the database; they were classified as “unknowns”. One of these unknowns was identified from a Minex drill hole map. The drill hole database was updated with measured horizontal coordinates from the field work. Collar elevations were taken from the Cooper Aerial DEM unless it was determined that subsequent earth works covered the drill hole; in this case, the original collar elevation was used. The author believes that UEC has done a very good job in verifying and validating the physical
locations of all drill holes in the database.
In March 2012, additional historical data was obtained by UEC from the archives at the Arizona Geological Survey (AZGS). This included locations, lithology and downhole data for seven drill holes completed by Minex in 1980 that were not included in the database. One of the new locations was confirmed during fieldwork as an unknown drill hole.
UEC also obtained locations, lithology, and downhole data for six Urangesellschaft drill holes completed in 1980-1982 that were not in the original database. One of these locations was also
previously confirmed by fieldwork as an unknown drill hole.
BD RESOURCE CONSULTING INC. | JUNE 2012
URANIUM ENERGY CORP NI 43-101 Technical Report
Anderson Project 12-2
During his site visit in May 2012, the qualified person observed numerous drill hole collars in the field and verified that these correlate with the digital database and are representative of the extent of drilling coverage over the deposit area. The archived rock chips from drilling on the property were inspected at UEC’s storage facilities in Wickenburg, Arizona. Hardcopy (paper) gamma logs from storage were also reviewed and correlated with results in the digital database. Orange to greenish-yellow uranium-bearing minerals were observed in outcrop and in rocks located in the dumps remaining from historic production on the property. Observations and inspection during the site visit convinced the qualified person that data collected to characterize uranium
mineralization on the property is adequate for resource estimation.

BD RESOURCE CONSULTING INC. | JUNE 2012
URANIUM ENERGY CORP NI 43-101 Technical Report
Anderson Project 13-1
13 MINERAL PROCESSING AND METALLURGICAL TESTING
Between 1977 and 1979, MinEx and Urangesellschaft conducted mineral processing and metallurgical test work. No additional mineral processing work has been conducted. Consequently, the historical mineral processing and metallurgical test work has not been verified. Testing for both companies was completed by Hazen Research, Inc. of Golden, Colorado. Testing focused on acid and alkaline leaching, with minor testing on heap leaching. Research had advanced to a relatively mature stage, culminating in a conventional acid-leach mill process
flowsheet for the MinEx Final Feasibility Study (MinEx, 1978).
Prior to mid-1978, MinEx and Urangesellschaft conducted independent investigations on mineralized material from their respective properties. By late-1978, MinEx and Urangesellschaft began negotiations on a joint venture. From that point, metallurgical research was conducted cooperatively, with Urangesellschaft modifying its testing program to demonstrate the amenability of the Date Creek ore to MinEx’s process flowsheet. It was concluded that the MinEx acid-leach process, although viable, was costly due to the high reagent consumption and, considering the wide chemical variability of the mineralized material across both properties (Urangesellschaft, 1980), it was not the optimum process. MinEx and Urangesellschaft outlined additional research to address outstanding technical concerns, including further research into the
feasibility of alkaline leaching.
13.1 ACID LEACHING
The host rock consists mostly of carbonaceous shale, siltstone and limestone, with both relatively hard and soft layers. The deposit consists mainly of two mineralized horizons, referred to as the Middle Zone and the Lower Zone. These are highly variable with respect to both carbonate and uranium content. The CO2 content varies from 0.03% to 32% and U3O8 ranges from 0.03% to
0.5% with no apparent correlation between the two (MinEx, 1978).
MinEx and Urangesellschaft performed leach amenability tests on representative core samples from mineralized horizons. This was complicated by the variability in Corg (lignite) and CO3 (limestone) contents. Uranium extraction through acid leaching varied from 80% to 95%, with most samples exceeding 90%. Acid consumption ranged from 50 kg/ t (110 lbs/ton) to over 490 kg/t (1,080 lbs/ton) of ore (average 270 kg/t) (Urangesellschaft, 1980). Analysis of leach solutions showed Na2CO3 consumptions of 17 to 37 kg/t. Roasting of the ore lowered acid consumptions by approximately 6% to 21%. Testing also showed increased uranium solubility with decreasing particle size through minus 28-mesh. Thickening characteristics for high-lime

BD RESOURCE CONSULTING INC. | JUNE 2012
URANIUM ENERGY CORP NI 43-101 Technical Report
Anderson Project 13-2
composites were generally poor (6 to 14 ft2/tpd), but improved with roasting (3 to 9 ft2/tpd)
(Hertzke, 1997).
Metallurgical analyses by Hazen Research established near-optimum, acid-leach conditions for the northern portion of the Anderson property, capable of 90% uranium extraction (Hertzke, 1997). The metallurgical programs concluded that substantial quantities of sulfuric acid would be required to sustain extraction rates above 90%. Typical ore was estimated to contain a minimum of 19% to 20% calcium carbonate (CaCO3), corresponding to a minimum acid consumption of 180 kg (400 lbs) of sulfuric acid (H2SO4) per ton of ore. Leachability was further complicated by
carbonate contents which varied from 0% to over 50% CaCO3 (Urangesellschaft, 1980).
Using acid-leach parameters employed by MinEx, comparative results were obtained (Hertzke,
1997):
• Average uranium solubility of 86.2% for Urangesellschaft ore versus 88.5% for MinEx ore
• Average acid consumption of 250 kg (551 lbs/ton) for Urangesellschaft ore versus 188 kg (415 lbs/ton) for MinEx ore
Further investigations to optimize leaching were briefly evaluated. One test involved the use of Caro’s acid instead of sulfuric acid. This resulted in higher initial uranium dissolution rates, suggesting the possibility of significantly shorter leaching times. Another study involved preliminary flotation tests to remove significant portions of the acid-consuming minerals by calcite flotation prior to acid leaching. Results proved inconclusive and suggested that further innovation and study are required to optimize the acid-leach process (Urangesellschaft, 1980).
13.2 ALKALINE LEACHING
Alkaline leach tests on bulk samples from the MinEx deposit showed uranium extractions of 96%. Lower zone extractions ranged from 94% to 95% (Hazen, 1977). Alkaline leaching tests conducted by Urangesellschaft resulted in early-term uranium extraction rates of 81% to 94%. Final-stage uranium dissolutions ranged from 84% to 97% (Urangesellschaft, 1980). Settling rates for four of five composites tested by Urangesellschaft were relatively good with unit area
requirements of 1.6 to 3.7 sq ft/tpd.
Studies determined that the feasibility of alkaline leaching was limited by the high organic carbon content, primarily in the form of lignite (Corg), which poses a potential for significant problems during uranium solvent extraction by inhibiting the precipitation of sodium diuranate. Typical Date Creek ore is estimated to contain 2.6% Corg on average. Actual values varied widely, ranging
from 0% to over 15% Corg (Urangesellschaft, 1980).
BD RESOURCE CONSULTING INC. | JUNE 2012
URANIUM ENERGY CORP NI 43-101 Technical Report
Anderson Project 13-3
The program concluded that additional research was required to improve the understanding of the relationship between U3O8 grade and associated CO3 and Corg, and that future test work should be focused on reducing the carbonate and/or lignite content of the ore before leaching. Preliminary research by MinEx determined that activated carbon or surfactants, Aerosol C-61 and Arquad T-2C-50, are effective in removing the alkaline soluble organics, but the amounts are not likely to be economically viable. Roasting was determined to be effective in eliminating the organics, but
proved detrimental to uranium solubilization at temperatures above 350ºC (Hazen, 1977).
13.3 HEAP LEACHING
Limited testing of acid-heap leaching was done by Urangesellschaft. Ore was leached using a recirculating solution of 5 g/l sulfuric acid. The column flow rate was favorable and almost 70% of the uranium was solubilized during the initial days. The flow rate and uranium content of the effluent decreased drastically, and after 45 days of leaching, an overall solubilization of 79% was
achieved (Urangesellschaft, 1978).
The metallurgical test work currently available is limited and may not be representative of all types and styles of mineralization on the Anderson property; however, there is nothing in the test work that suggests economic extraction of the mineralization will not be possible. More extensive
testing will be required in order to determine this.
BD RESOURCE CONSULTING INC. | JUNE 2012
URANIUM ENERGY CORP NI 43-101 Technical Report
Anderson Project 14-1
14 MINERAL RESOURCE ESTIMATE
14.1 INTRODUCTION
The mineral resource estimate was prepared by Robert Sim, P.Geo and Bruce Davis, FAusIMM. Both are independent Qualified Persons within the meaning of NI 43-101 for the purposes of mineral resource estimates contained in this report. Estimations are made from 3-dimensional block models based on geostatistical applications using commercial mine planning software (MineSight® v7.0-3). The project limits are based in the UTM coordinate system using a nominal block size of 10 x 10 x 2 m (L x W x H). All drill holes are vertically oriented with variably spaced holes throughout the deposit: 30 m spacing in the northern area, 60 m spacing in the
central area and 120-150 m spacing or more in the southern area.
The resource estimate was generated using drill hole sample results and the interpretation of a geologic model that relates to the spatial distribution of eU3O8. Interpolation characteristics were defined based on the geology, drill hole spacing and geostatistical analysis of the data. The resources were classified according to their proximity to the sample locations and are reported, as required by NI 43-101, according to the CIM standards on Mineral Resources and Reserves
(CIM, 2005).
14.2 GEOLOGIC MODEL, DOMAINS AND CODING
Uranium mineralization occurs within a host sequence of lacustrine sediments that dip gently towards the south. These sediments become interfingered with siltstones and sandstones toward the south resulting in a more layered distribution of uranium-bearing zones. A series of eight individual, uranium-bearing zones were been interpreted from the drill hole sample data. These domains generally define zones that exceed 0.005% eU3O8. This threshold ensures that the domains capture all zones of mineralized material, but also allow for the inclusion of some internal lower-grade dilution in the model. It is common that some of the thicker parts of individual zones are comprised of central low-grade samples flanked by high-grade along the upper and lower contacts. Other areas show a series of three or more high grade bands intercalated with low-grade patches. Overall, the eight individual zone domains are separated by intervals with little to no eU3O8 mineralization. These barren intervals between Zone domains are
variable and range from a few meters to over 50 m in some areas.
The interpretation of the Zone domains honors two NW-SE striking, sub-vertical faults running through the northeastern part of the deposit area. There is relatively little displacement of the main mineralized zones as a result of these faults (other than some apparent local curving of the typically planar bands of mineralization). As a result, the geologic model has been interpreted to
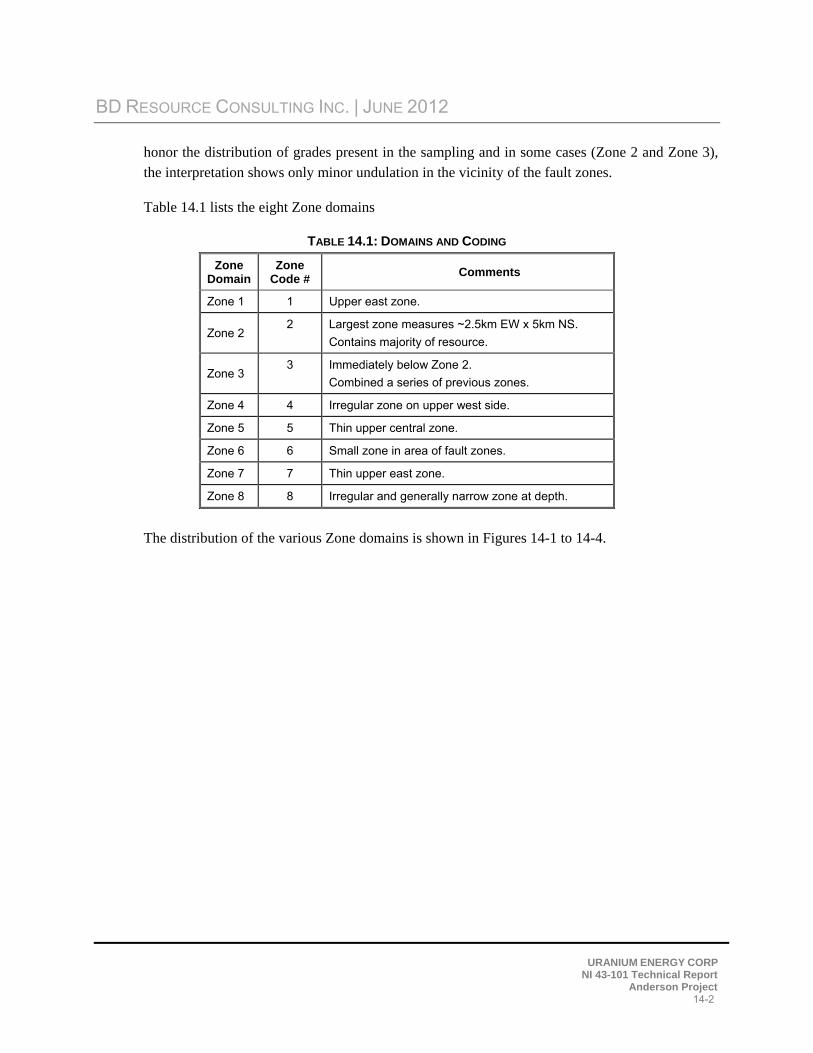
BD RESOURCE CONSULTING INC. | JUNE 2012
URANIUM ENERGY CORP NI 43-101 Technical Report
Anderson Project 14-2
honor the distribution of grades present in the sampling and in some cases (Zone 2 and Zone 3),
the interpretation shows only minor undulation in the vicinity of the fault zones.
Table 14.1 lists the eight Zone domains
TABLE 14.1: DOMAINS AND CODING
Zone Domain
Zone Code #
Comments
Zone 1 1 Upper east zone.
Zone 2 2 Largest zone measures ~2.5km EW x 5km NS.
Contains majority of resource.
Zone 3 3 Immediately below Zone 2.
Combined a series of previous zones.
Zone 4 4 Irregular zone on upper west side.
Zone 5 5 Thin upper central zone.
Zone 6 6 Small zone in area of fault zones.
Zone 7 7 Thin upper east zone.
Zone 8 8 Irregular and generally narrow zone at depth.
The distribution of the various Zone domains is shown in Figures 14-1 to 14-4.
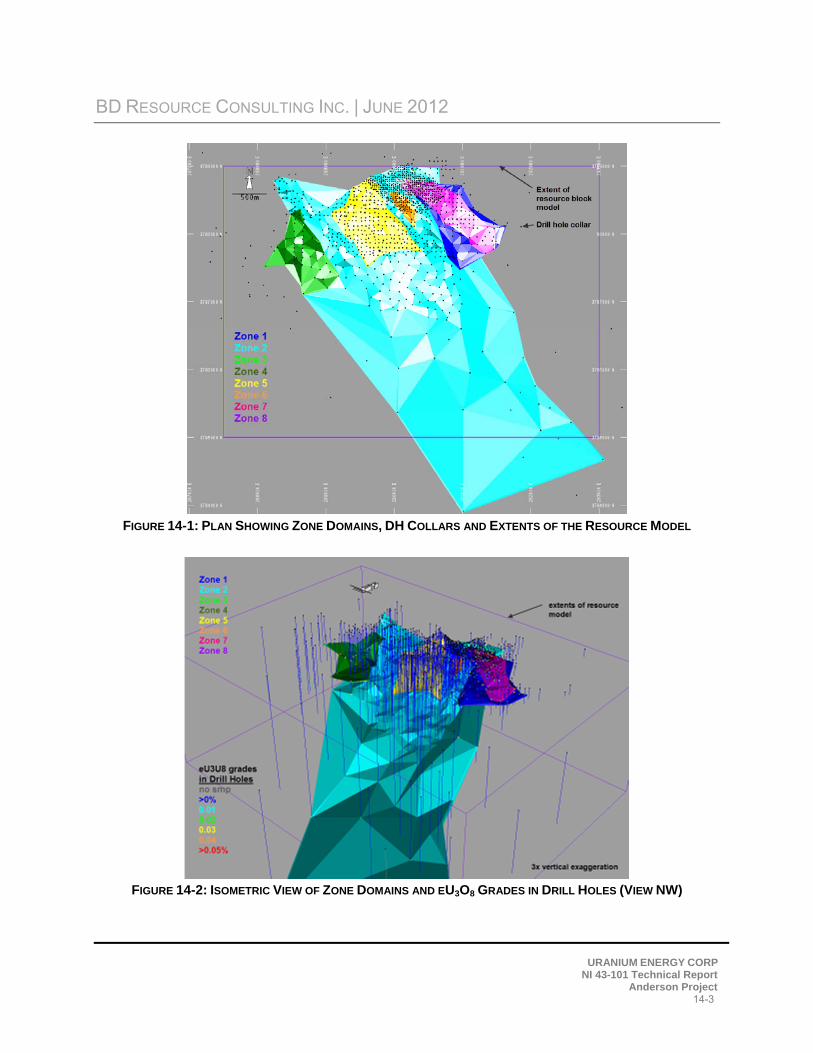
BD RESOURCE CONSULTING INC. | JUNE 2012
URANIUM ENERGY CORP NI 43-101 Technical Report
Anderson Project 14-3
FIGURE 14-1: PLAN SHOWING ZONE DOMAINS, DH COLLARS AND EXTENTS OF THE RESOURCE MODEL
FIGURE 14-2: ISOMETRIC VIEW OF ZONE DOMAINS AND EU3O8 GRADES IN DRILL HOLES (VIEW NW)
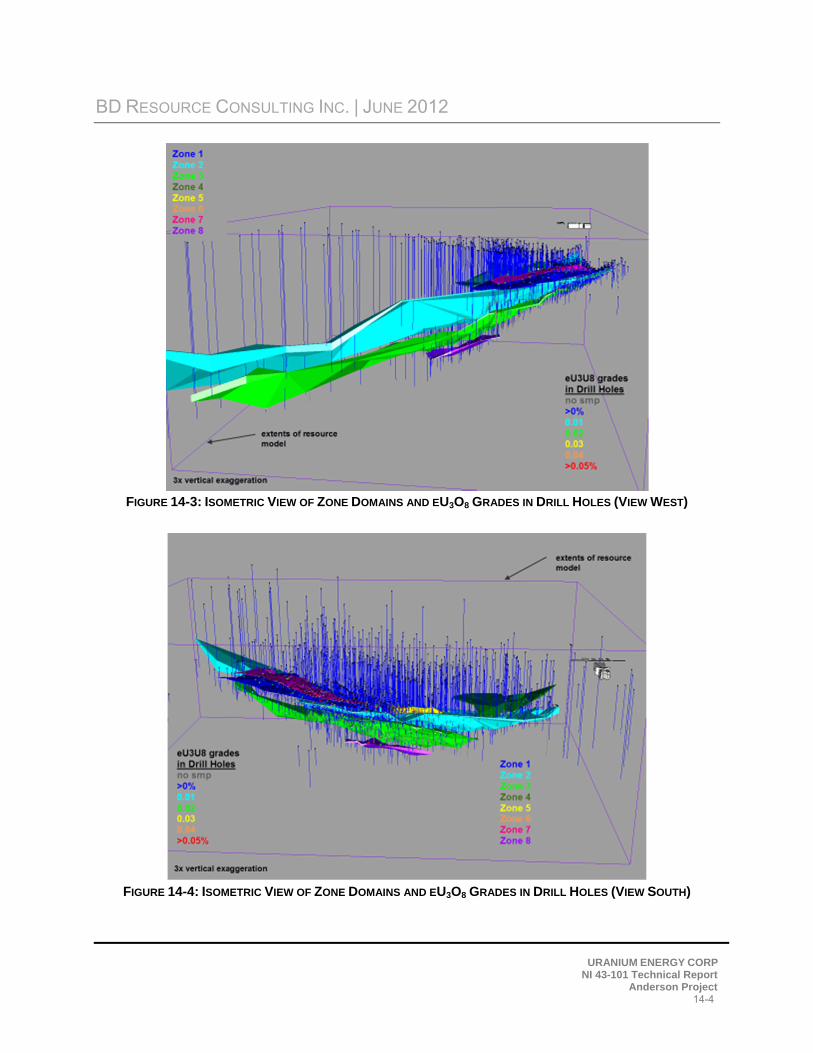
BD RESOURCE CONSULTING INC. | JUNE 2012
URANIUM ENERGY CORP NI 43-101 Technical Report
Anderson Project 14-4
FIGURE 14-3: ISOMETRIC VIEW OF ZONE DOMAINS AND EU3O8 GRADES IN DRILL HOLES (VIEW WEST)
FIGURE 14-4: ISOMETRIC VIEW OF ZONE DOMAINS AND EU3O8 GRADES IN DRILL HOLES (VIEW SOUTH)
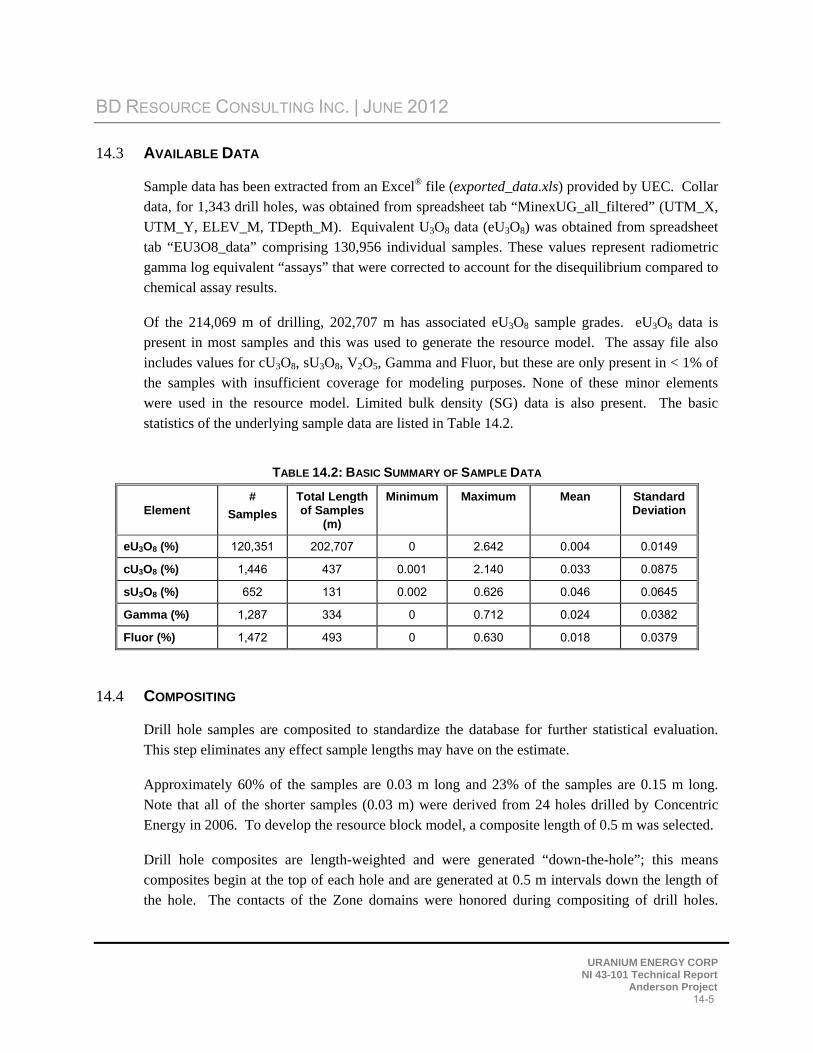
BD RESOURCE CONSULTING INC. | JUNE 2012
URANIUM ENERGY CORP NI 43-101 Technical Report
Anderson Project 14-5
14.3 AVAILABLE DATA
Sample data has been extracted from an Excel® file (exported_data.xls) provided by UEC. Collar data, for 1,343 drill holes, was obtained from spreadsheet tab “MinexUG_all_filtered” (UTM_X, UTM_Y, ELEV_M, TDepth_M). Equivalent U3O8 data (eU3O8) was obtained from spreadsheet tab “EU3O8_data” comprising 130,956 individual samples. These values represent radiometric gamma log equivalent “assays” that were corrected to account for the disequilibrium compared to
chemical assay results.
Of the 214,069 m of drilling, 202,707 m has associated eU3O8 sample grades. eU3O8 data is present in most samples and this was used to generate the resource model. The assay file also includes values for cU3O8, sU3O8, V2O5, Gamma and Fluor, but these are only present in < 1% of the samples with insufficient coverage for modeling purposes. None of these minor elements were used in the resource model. Limited bulk density (SG) data is also present. The basic
statistics of the underlying sample data are listed in Table 14.2.
TABLE 14.2: BASIC SUMMARY OF SAMPLE DATA
Element #
Samples
Total Length of Samples
(m)
Minimum Maximum Mean Standard Deviation
eU3O8 (%) 120,351 202,707 0 2.642 0.004 0.0149
cU3O8 (%) 1,446 437 0.001 2.140 0.033 0.0875
sU3O8 (%) 652 131 0.002 0.626 0.046 0.0645
Gamma (%) 1,287 334 0 0.712 0.024 0.0382
Fluor (%) 1,472 493 0 0.630 0.018 0.0379
14.4 COMPOSITING
Drill hole samples are composited to standardize the database for further statistical evaluation.
This step eliminates any effect sample lengths may have on the estimate.
Approximately 60% of the samples are 0.03 m long and 23% of the samples are 0.15 m long. Note that all of the shorter samples (0.03 m) were derived from 24 holes drilled by Concentric
Energy in 2006. To develop the resource block model, a composite length of 0.5 m was selected.
Drill hole composites are length-weighted and were generated “down-the-hole”; this means composites begin at the top of each hole and are generated at 0.5 m intervals down the length of the hole. The contacts of the Zone domains were honored during compositing of drill holes.
BD RESOURCE CONSULTING INC. | JUNE 2012
URANIUM ENERGY CORP NI 43-101 Technical Report
Anderson Project 14-6
Several holes were randomly selected and the composited values were checked for accuracy. No
errors were found.
14.5 EXPLORATORY DATA ANALYSIS
Exploratory data analysis (EDA) involves statistically summarizing the database to quantify the characteristics of the data. One of the main purposes of EDA is to determine if there is any evidence of spatial distinctions in grade; this would require the separation and isolation of domains during interpolation. The application of separate domains prevents unwanted mixing of data during interpolation; this will result in a grade model that better reflects the unique properties of the deposit. However, applying domain boundaries in areas where the data is not statistically
unique may impose a bias in the distribution of grades in the model.
A domain boundary, segregating the data during interpolation, is typically applied if the average grade in one domain is significantly different from that of another. A boundary may also be
applied where a significant change in the grade distribution exists across the contact.
14.5.1 BASIC STATISTICS BY DOMAIN
The basic statistics for the distribution of eU3O8 were generated by Zone domain and are shown in the boxplot in Figure 14-5. Zone 2 is the thickest and most extensive domain interpreted from the sample data. It contains few internal low-grade samples and, as a result, shows a relatively high mean eU3O8 grade. Zone 3 also contains a large proportion of the sample data, but drill holes often show two or more higher-grade bands separated by low-grade intervals. As a result,
the overall eU3O8 mean grade of Zone 2 is relatively low.
Zones 1, 5, 6 and 7 are all relatively thin domains that contain moderate to high-grade eU3O8 samples with only rare to no internal low-grade zones. As a result, the mean grades for these thinner zones tend to be higher. Zones 4 and 8 are smaller, somewhat irregular zones with a mix of samples across the grade range. The boxplots show that frequency distributions tend to
overlap; this suggests that the domains are spatially, rather than statistically, controlled.

BD RESOURCE CONSULTING INC. | JUNE 2012
URANIUM ENERGY CORP NI 43-101 Technical Report
Anderson Project 14-7
FIGURE 14-5: BOXPLOT OF EU3O8 GRADES BY ZONE DOMAIN
14.5.2 CONTACT PROFILES
Contract profiles evaluate the nature of grade trends between two domains; they graphically display the average grades at increasing distances from the contact boundary. Those contact profiles that show a marked difference in grade across a domain boundary indicate that the two datasets should be isolated during interpolation. Conversely, if a more gradual change in grade occurs across a contact, the introduction of a “hard” boundary (i.e., segregation during interpolation) may result in much different trends in the grade model; in this case, the change in grade between model domains is often more abrupt than the trends seen in the raw data. Finally, a flat contact profile indicates that there are no grade changes across the boundary; in this case,
“hard” or “soft” domain boundaries will produce similar results in the model.
A combined contact profile compares the grades inside the interpreted Zone domains with surrounding samples (Figure 14-6). There is a distinct change in eU3O8 grade across the Zone domain contacts indicating that the domains host samples are distinctly different from those outside the domains. This difference supports the use of the Zone domains as hard boundaries
during model grade estimations.
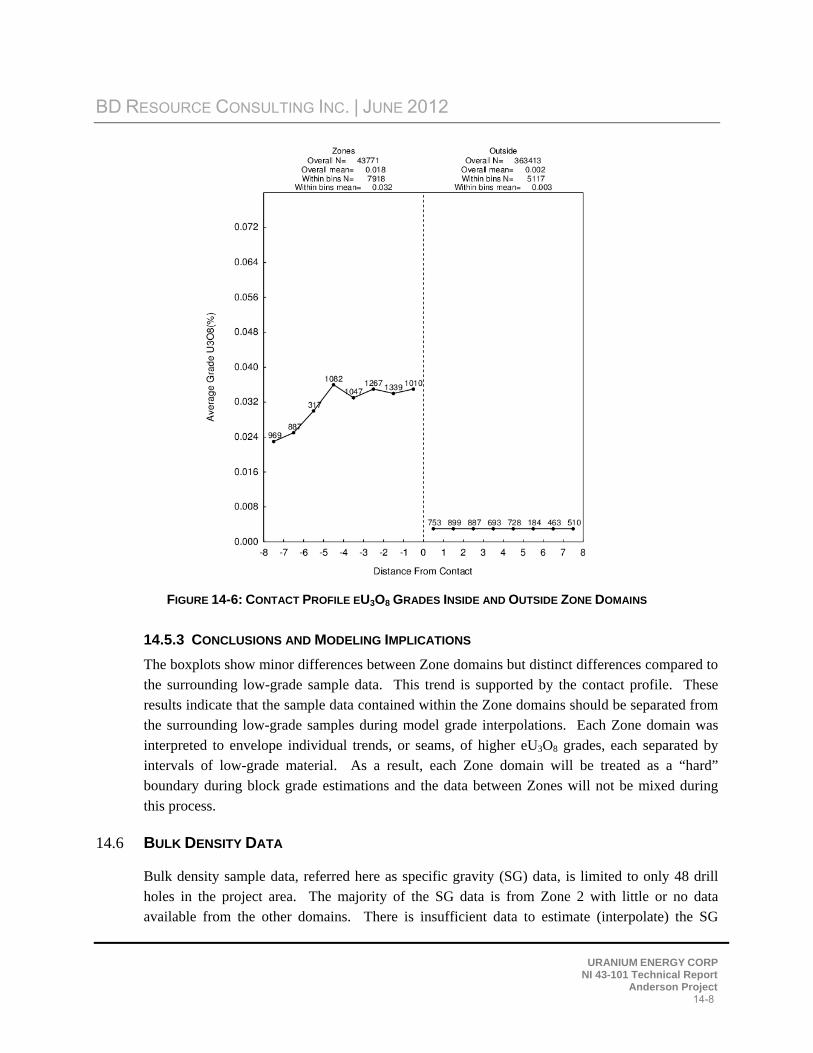
BD RESOURCE CONSULTING INC. | JUNE 2012
URANIUM ENERGY CORP NI 43-101 Technical Report
Anderson Project 14-8
FIGURE 14-6: CONTACT PROFILE EU3O8 GRADES INSIDE AND OUTSIDE ZONE DOMAINS
14.5.3 CONCLUSIONS AND MODELING IMPLICATIONS
The boxplots show minor differences between Zone domains but distinct differences compared to the surrounding low-grade sample data. This trend is supported by the contact profile. These results indicate that the sample data contained within the Zone domains should be separated from the surrounding low-grade samples during model grade interpolations. Each Zone domain was interpreted to envelope individual trends, or seams, of higher eU3O8 grades, each separated by intervals of low-grade material. As a result, each Zone domain will be treated as a “hard” boundary during block grade estimations and the data between Zones will not be mixed during
this process.
14.6 BULK DENSITY DATA
Bulk density sample data, referred here as specific gravity (SG) data, is limited to only 48 drill holes in the project area. The majority of the SG data is from Zone 2 with little or no data available from the other domains. There is insufficient data to estimate (interpolate) the SG
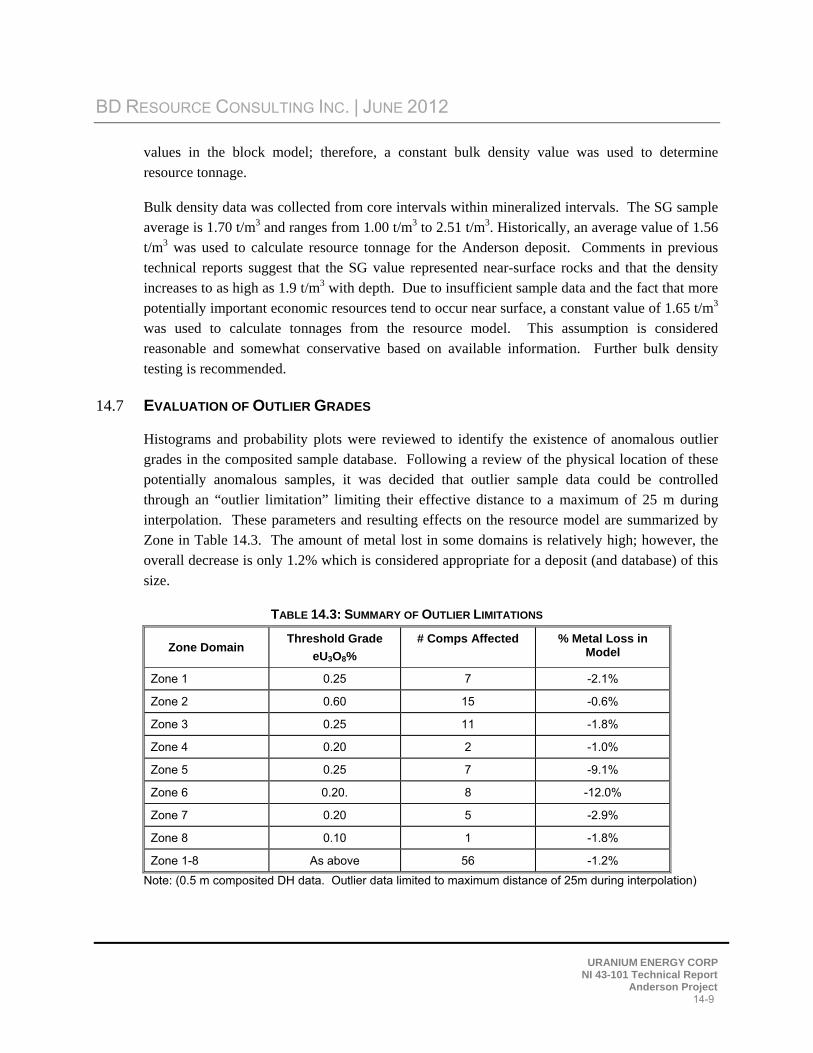
BD RESOURCE CONSULTING INC. | JUNE 2012
URANIUM ENERGY CORP NI 43-101 Technical Report
Anderson Project 14-9
values in the block model; therefore, a constant bulk density value was used to determine
resource tonnage.
Bulk density data was collected from core intervals within mineralized intervals. The SG sample average is 1.70 t/m3 and ranges from 1.00 t/m3 to 2.51 t/m3. Historically, an average value of 1.56 t/m3 was used to calculate resource tonnage for the Anderson deposit. Comments in previous technical reports suggest that the SG value represented near-surface rocks and that the density increases to as high as 1.9 t/m3 with depth. Due to insufficient sample data and the fact that more potentially important economic resources tend to occur near surface, a constant value of 1.65 t/m3 was used to calculate tonnages from the resource model. This assumption is considered reasonable and somewhat conservative based on available information. Further bulk density
testing is recommended.
14.7 EVALUATION OF OUTLIER GRADES
Histograms and probability plots were reviewed to identify the existence of anomalous outlier grades in the composited sample database. Following a review of the physical location of these potentially anomalous samples, it was decided that outlier sample data could be controlled through an “outlier limitation” limiting their effective distance to a maximum of 25 m during interpolation. These parameters and resulting effects on the resource model are summarized by Zone in Table 14.3. The amount of metal lost in some domains is relatively high; however, the overall decrease is only 1.2% which is considered appropriate for a deposit (and database) of this
size.
TABLE 14.3: SUMMARY OF OUTLIER LIMITATIONS
Zone Domain Threshold Grade
eU3O8%
# Comps Affected % Metal Loss in Model
Zone 1 0.25 7 -2.1%
Zone 2 0.60 15 -0.6%
Zone 3 0.25 11 -1.8%
Zone 4 0.20 2 -1.0%
Zone 5 0.25 7 -9.1%
Zone 6 0.20. 8 -12.0%
Zone 7 0.20 5 -2.9%
Zone 8 0.10 1 -1.8%
Zone 1-8 As above 56 -1.2%
Note: (0.5 m composited DH data. Outlier data limited to maximum distance of 25m during interpolation)
BD RESOURCE CONSULTING INC. | JUNE 2012
URANIUM ENERGY CORP NI 43-101 Technical Report
Anderson Project 14-10
14.8 TREND CONTROLS AND RELATIVE ELEVATIONS
The distribution of eU3O8 in the deposit tends to occur in a series of bands roughly parallel to the overall trend of the interpreted Zone domains at a general orientation of -10 degrees to the south. However, local undulations occur within individual Zones. To replicate these trends in the resource block model, a series of “trend” planes were generated in the center of each Zone domain (the hanging wall and footwall contacts of each domain were averaged to create the trend planes). These trend planes are used to control search orientations during block grade interpolations. Referred to as “relative elevations”, these values are used to match composited sample data and blocks in the model during grade interpolations that result in search orientations that conform to the natural undulations present throughout the deposit area. The resulting models retain more of the inherent banded nature of the deposit. Without relative elevations, simple search ellipses would be very difficult to orient during interpolation, resulting in excessive smoothing (averaging) of sample data. Using relative elevations allows for reproduction of
vertical grade trends within the domains.
14.9 VARIOGRAPHY
The degree of spatial variability in a mineral deposit depends on both the distance and direction between points of comparison. Typically, the variability between samples is proportionate to the distance between samples. If the degree of variability is related to the direction of comparison, then the deposit is said to exhibit anisotropic tendencies which can be summarized with the search ellipse. The semi-variogram is a common function used to measure the spatial variability
within a deposit.
The components of the variogram include the nugget, the sill and the range. Often samples compared over very short distances (including samples from the same location) show some degree of variability. As a result, the curve of the variogram often begins at some point on the y-axis above the origin; this point is called the nugget. The nugget is a measure of not only the natural variability of the data over very short distances, but also a measure of the variability
which can be introduced due to errors during sample collection, preparation and assaying.
The amount of variability between samples typically increases as the distance between the samples increases. Eventually, the degree of variability between samples reaches a constant or maximum value. This is called the sill and the distance between samples at which this occurs is
called the range. The variogram parameters for each zone are summarized in Table 14.4.
The spatial evaluation of the data was conducted using a correlogram instead of the traditional variogram. The correlogram is normalized to the variance of the data and is less sensitive to
outlier values; this generally gives cleaner results.
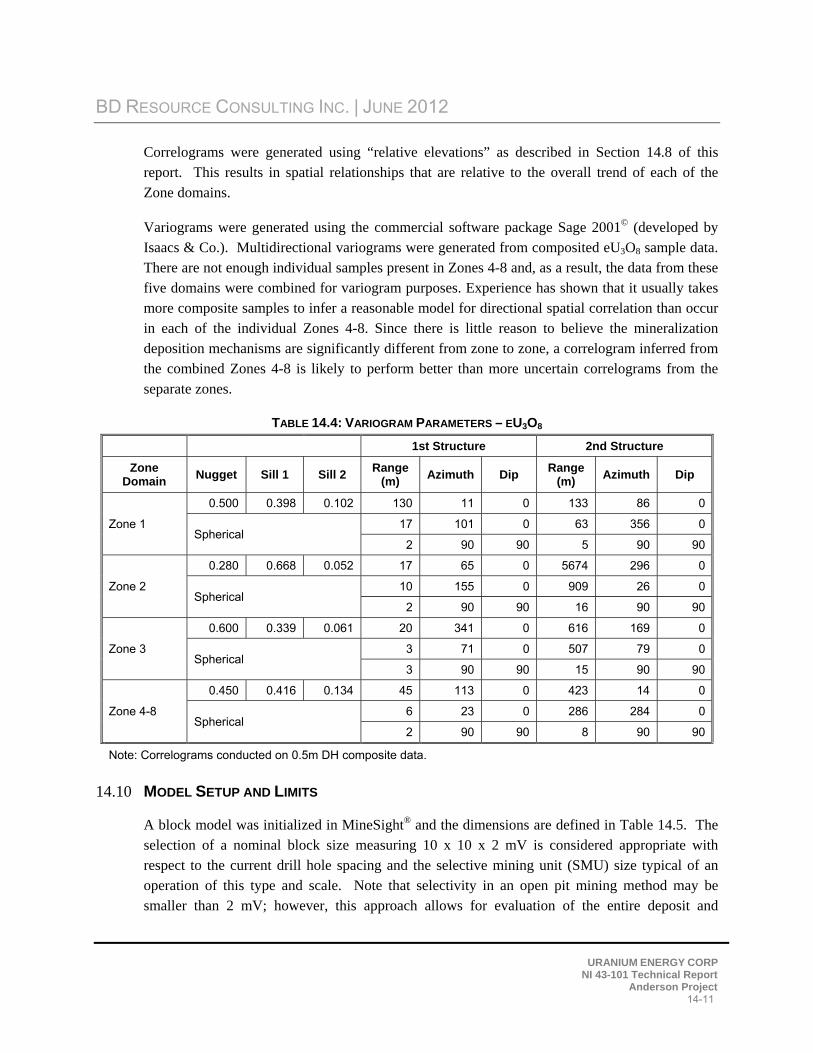
BD RESOURCE CONSULTING INC. | JUNE 2012
URANIUM ENERGY CORP NI 43-101 Technical Report
Anderson Project 14-11
Correlograms were generated using “relative elevations” as described in Section 14.8 of this report. This results in spatial relationships that are relative to the overall trend of each of the
Zone domains.
Variograms were generated using the commercial software package Sage 2001© (developed by Isaacs & Co.). Multidirectional variograms were generated from composited eU3O8 sample data. There are not enough individual samples present in Zones 4-8 and, as a result, the data from these five domains were combined for variogram purposes. Experience has shown that it usually takes more composite samples to infer a reasonable model for directional spatial correlation than occur in each of the individual Zones 4-8. Since there is little reason to believe the mineralization deposition mechanisms are significantly different from zone to zone, a correlogram inferred from the combined Zones 4-8 is likely to perform better than more uncertain correlograms from the
separate zones.
TABLE 14.4: VARIOGRAM PARAMETERS – EU3O8
1st Structure 2nd Structure
Zone Domain
Nugget Sill 1 Sill 2 Range
(m) Azimuth Dip
Range (m)
Azimuth Dip
Zone 1
0.500 0.398 0.102 130 11 0 133 86 0
Spherical 17 101 0 63 356 0
2 90 90 5 90 90
Zone 2
0.280 0.668 0.052 17 65 0 5674 296 0
Spherical 10 155 0 909 26 0
2 90 90 16 90 90
Zone 3
0.600 0.339 0.061 20 341 0 616 169 0
Spherical 3 71 0 507 79 0
3 90 90 15 90 90
Zone 4-8
0.450 0.416 0.134 45 113 0 423 14 0
Spherical 6 23 0 286 284 0
2 90 90 8 90 90
Note: Correlograms conducted on 0.5m DH composite data.
14.10 MODEL SETUP AND LIMITS
A block model was initialized in MineSight® and the dimensions are defined in Table 14.5. The selection of a nominal block size measuring 10 x 10 x 2 mV is considered appropriate with respect to the current drill hole spacing and the selective mining unit (SMU) size typical of an operation of this type and scale. Note that selectivity in an open pit mining method may be smaller than 2 mV; however, this approach allows for evaluation of the entire deposit and

BD RESOURCE CONSULTING INC. | JUNE 2012
URANIUM ENERGY CORP NI 43-101 Technical Report
Anderson Project 14-12
provides an indication of what portion may be amenable to open pit versus underground mining
methods.
TABLE 14.5: BLOCK MODEL LIMITS
Direction Minimum Maximum Block size
(m) # Blocks
East 287500 293000 10 550
North 3795000 3799000 10 400
Elevation 50 750 2 350
(Note: block model is not rotated)
Using the domain wireframes, blocks in the model are assigned Zone code values on a majority basis. During this stage, blocks that occur within two Zone domains are coded if greater than 50% of the block occurs within the boundaries of that domain. The percentage of each block inside the Zone domains is also stored in each block in the model. Zone percent values allow for
the accurate determination of resource tonnage that occurs along Zone domain boundaries.
The proportion of blocks which occur below the topographic surface are also calculated and stored within the model as individual percentage items. These values are used as a weighting
factor to determine the in-situ resources for the deposit.
14.11 INTERPOLATION PARAMETERS
The block model grades for eU3O8 were estimated using Ordinary Kriging (OK). The results of the OK estimation were evaluated using a series of validation approaches (described in the Section 14.12 of this report). The interpolation parameters were adjusted until the appropriate
results were achieved.
The Anderson model was generated with relatively few (less than a maximum of 25 per block) samples. This approach reduces the amount of smoothing (or averaging) in the model and, while there may be some uncertainty on a localized scale, this approach produces reliable recoverable grade and tonnage estimates for the overall deposit. (The method is outlined in Isaaks & Co.,
“The Kriging Oxymoron”, SME Preprint, 1999)
The interpolation parameters are summarized here:
Search ellipse: 200 x 200 x 50 mV. Long axis oriented at -10 degrees to the south. Vertical range also limited to 10 m based on vertical distances relative to the local trend planes of each Zone domain.
BD RESOURCE CONSULTING INC. | JUNE 2012
URANIUM ENERGY CORP NI 43-101 Technical Report
Anderson Project 14-13
Maximum of 6 sample composites from a single drill hole, minimum of 1 composite to estimate the grade in a block and a maximum of 18 composites to estimate the grade of a block.
Quadrant search limitation with a maximum of 1 drill hole per quadrant.
“Hard” boundaries between Zone domains (no mixing of data between Zone domains).
14.12 VALIDATION
The results of the modeling process were validated through several methods including a thorough visual review of the model grades in relation to the underlying drill hole sample grades; comparisons with the change of support model; comparisons with other estimation methods; and
grade distribution comparisons using swath plots.
VISUAL INSPECTION
A detailed visual inspection of the block model was conducted in both cross section and plan to ensure the desired results following interpolation. This included confirmation of the proper coding of blocks within the respective Zone domains and below the topographic surface. The distribution of block grades was also compared relative to the drill hole samples to ensure the
proper representation in the model.
In general, all grade models showed the desired degree of correlation with the underlying sample data. An example of the distribution of block grades in the model is shown in a north-south
oriented vertical section in Figure 14-7.
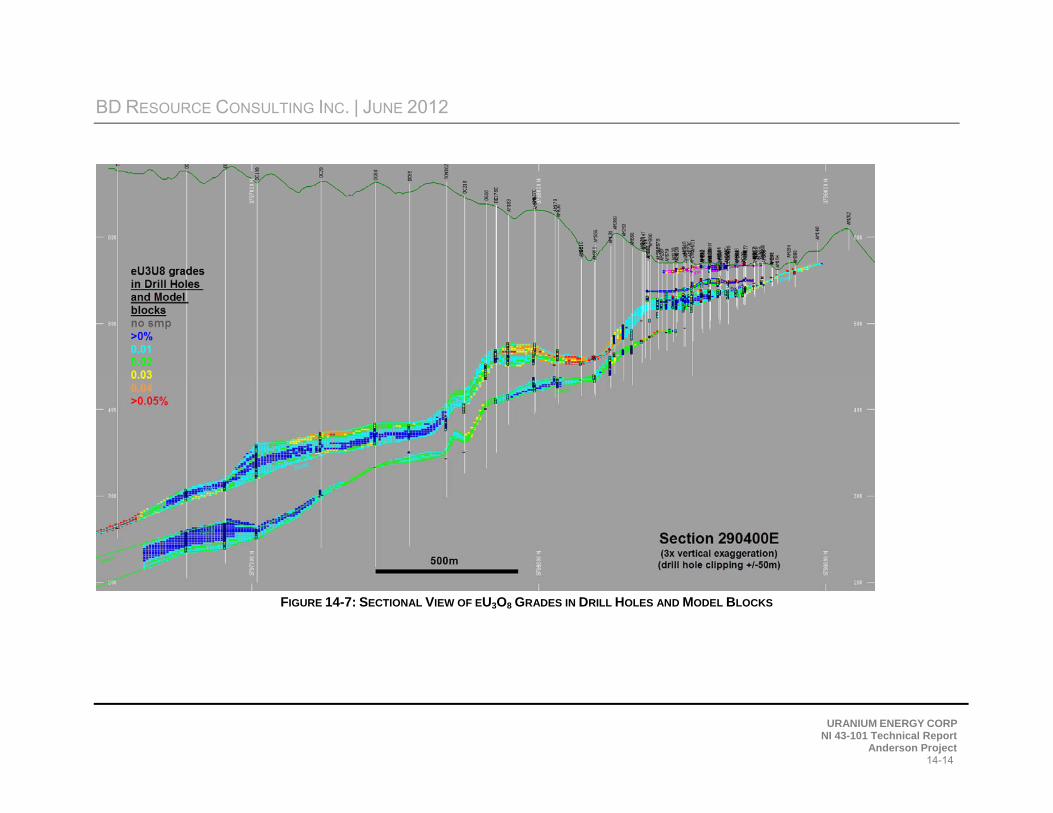
BD RESOURCE CONSULTING INC. | JUNE 2012
URANIUM ENERGY CORP NI 43-101 Technical Report
Anderson Project 14-14
FIGURE 14-7: SECTIONAL VIEW OF EU3O8 GRADES IN DRILL HOLES AND MODEL BLOCKS
BD RESOURCE CONSULTING INC. | JUNE 2012
URANIUM ENERGY CORP NI 43-101 Technical Report
Anderson Project 14-15
MODEL CHECKS FOR CHANGE OF SUPPORT
The relative degree of smoothing in the block model estimates were evaluated using the Discrete Gaussian or Hermitian Polynomial Change of Support (Herco) method (Journel and Huijbregts, Mining Geostatistics, 1978). With this method, the distribution of the hypothetical block grades is directly compared to the estimated (OK) model using of pseudo-grade/tonnage curves. Adjustments are made to the block model interpolation parameters until an acceptable match is made with the Herco distribution. In general, the estimated model should be slightly higher in tonnage and slightly lower in grade when compared to the Herco distribution at the projected cut-off grade. These differences account for selectivity and other potential ore-handling issues which
commonly occur during mining.
The Herco (Hermitian correction) distribution is derived from the declustered composite grades which were adjusted to account for the change in support moving from smaller drill hole composite samples to the larger blocks in the model. The transformation results in a less skewed
distribution but with the same mean as the original declustered samples.
Herco and model grade-tonnage plots were generated for the distribution of eU3O8 in the main Zone domains (Zones 1, 2, and 3, and combined 4-8). The results are shown in Figures 14-8 to 14-11. Overall, there is an acceptable degree of correlation between the models. The results for Zones 2 and 3 are very good. These domains represent the majority of the potential resource in this deposit. Zone 1 is somewhat thin and represents a smaller portion of resources and, as a
result, shows somewhat more erratic results.
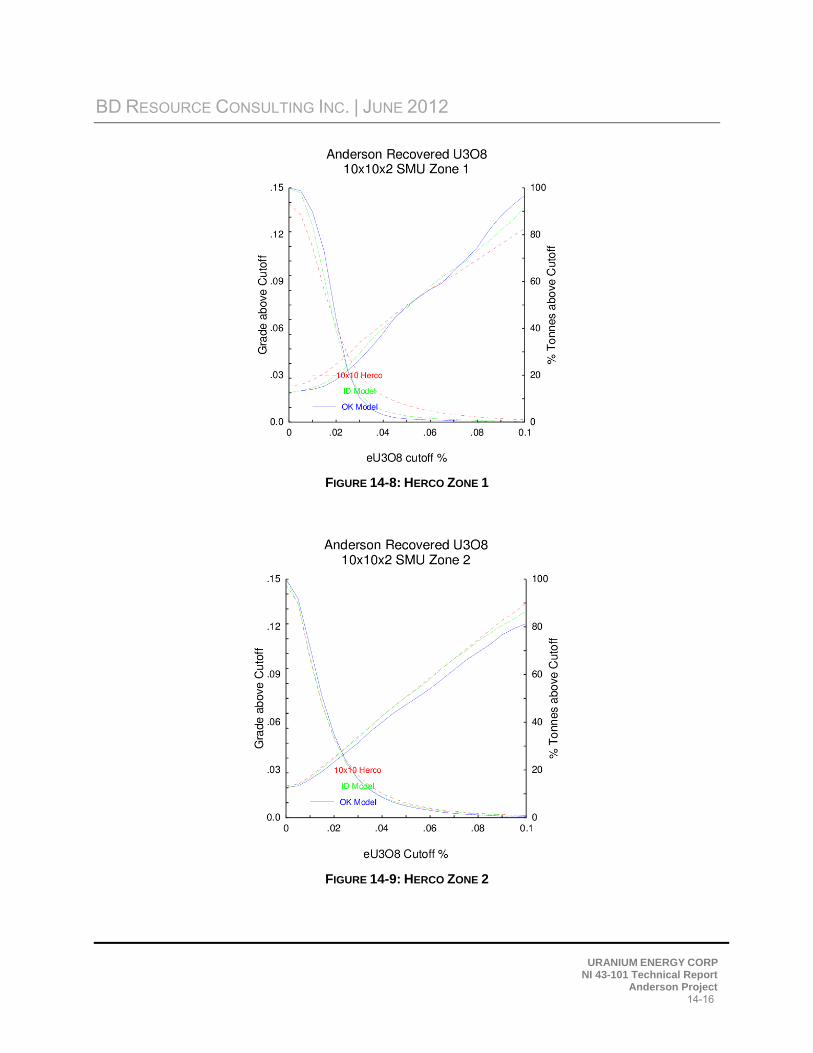
BD RESOURCE CONSULTING INC. | JUNE 2012
URANIUM ENERGY CORP NI 43-101 Technical Report
Anderson Project 14-16
FIGURE 14-8: HERCO ZONE 1
FIGURE 14-9: HERCO ZONE 2
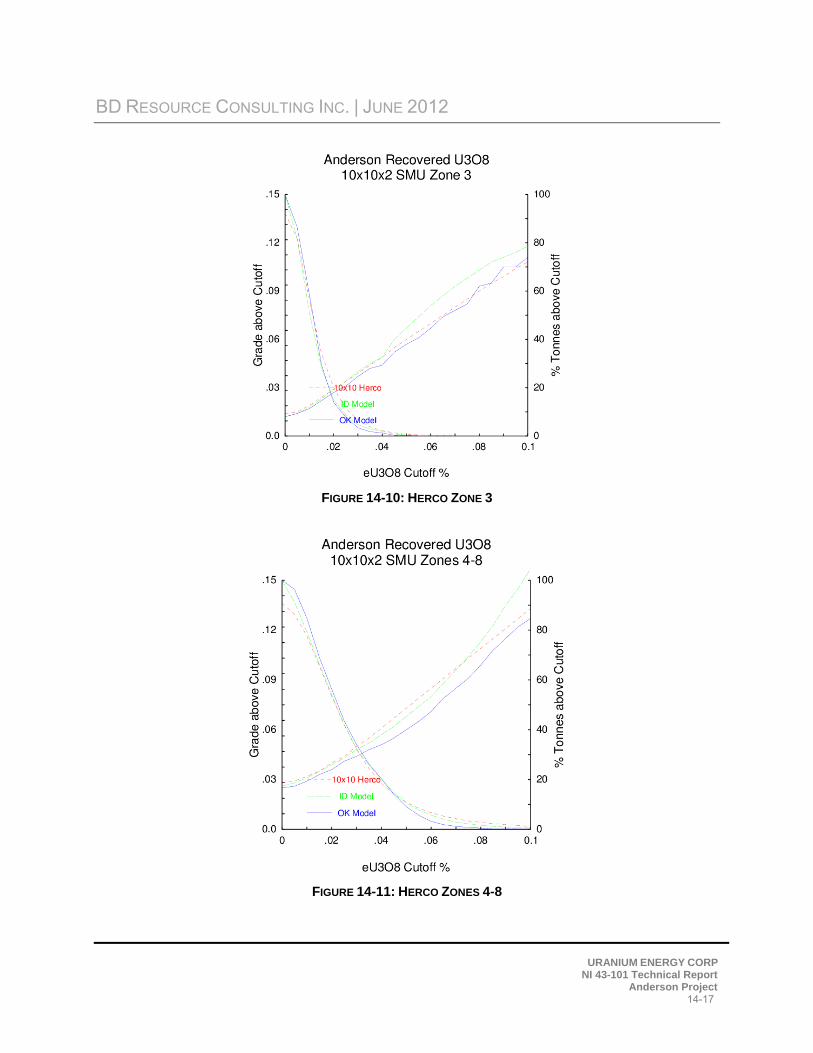
BD RESOURCE CONSULTING INC. | JUNE 2012
URANIUM ENERGY CORP NI 43-101 Technical Report
Anderson Project 14-17
FIGURE 14-10: HERCO ZONE 3
FIGURE 14-11: HERCO ZONES 4-8
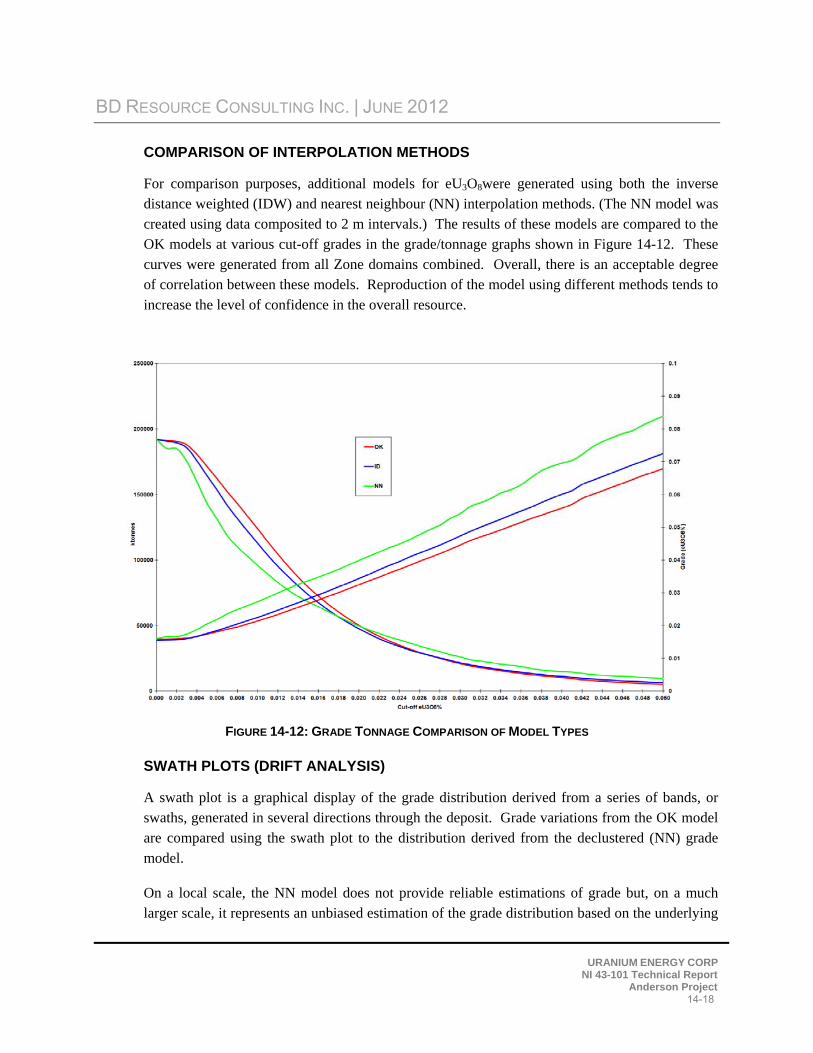
BD RESOURCE CONSULTING INC. | JUNE 2012
URANIUM ENERGY CORP NI 43-101 Technical Report
Anderson Project 14-18
COMPARISON OF INTERPOLATION METHODS
For comparison purposes, additional models for eU3O8were generated using both the inverse distance weighted (IDW) and nearest neighbour (NN) interpolation methods. (The NN model was created using data composited to 2 m intervals.) The results of these models are compared to the OK models at various cut-off grades in the grade/tonnage graphs shown in Figure 14-12. These curves were generated from all Zone domains combined. Overall, there is an acceptable degree of correlation between these models. Reproduction of the model using different methods tends to
increase the level of confidence in the overall resource.
FIGURE 14-12: GRADE TONNAGE COMPARISON OF MODEL TYPES
SWATH PLOTS (DRIFT ANALYSIS)
A swath plot is a graphical display of the grade distribution derived from a series of bands, or swaths, generated in several directions through the deposit. Grade variations from the OK model are compared using the swath plot to the distribution derived from the declustered (NN) grade
model.
On a local scale, the NN model does not provide reliable estimations of grade but, on a much larger scale, it represents an unbiased estimation of the grade distribution based on the underlying
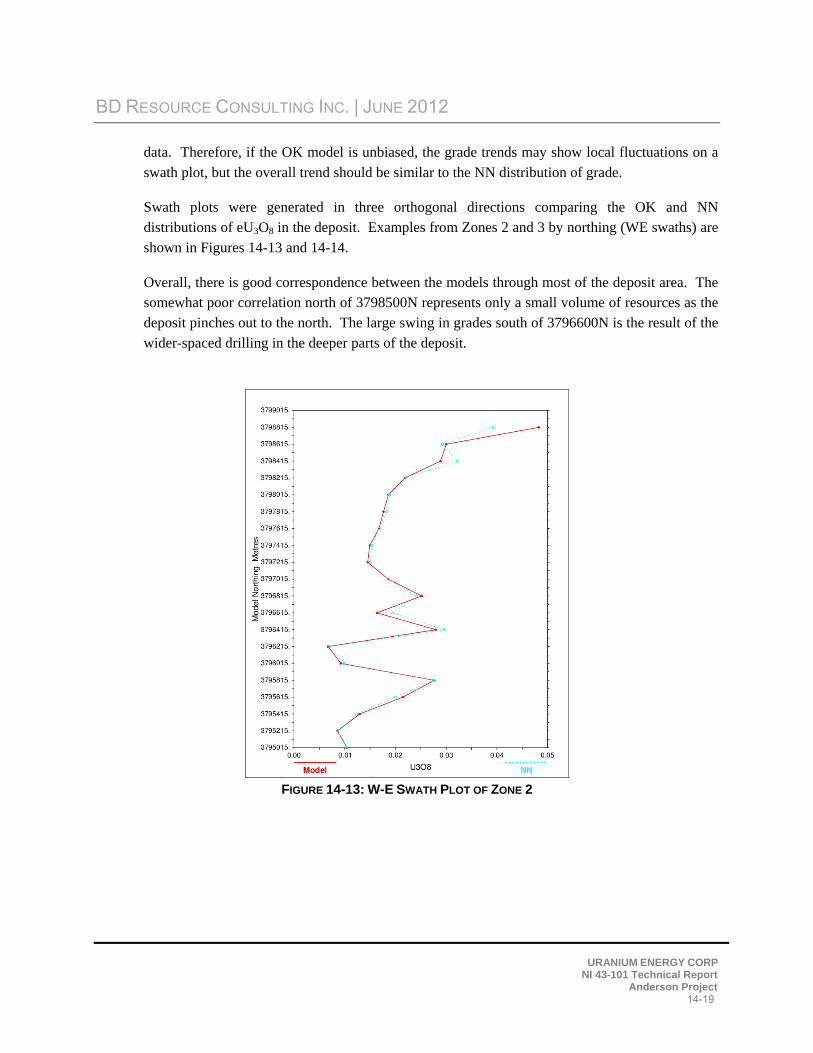
BD RESOURCE CONSULTING INC. | JUNE 2012
URANIUM ENERGY CORP NI 43-101 Technical Report
Anderson Project 14-19
data. Therefore, if the OK model is unbiased, the grade trends may show local fluctuations on a
swath plot, but the overall trend should be similar to the NN distribution of grade.
Swath plots were generated in three orthogonal directions comparing the OK and NN distributions of eU3O8 in the deposit. Examples from Zones 2 and 3 by northing (WE swaths) are
shown in Figures 14-13 and 14-14.
Overall, there is good correspondence between the models through most of the deposit area. The somewhat poor correlation north of 3798500N represents only a small volume of resources as the deposit pinches out to the north. The large swing in grades south of 3796600N is the result of the
wider-spaced drilling in the deeper parts of the deposit.
FIGURE 14-13: W-E SWATH PLOT OF ZONE 2
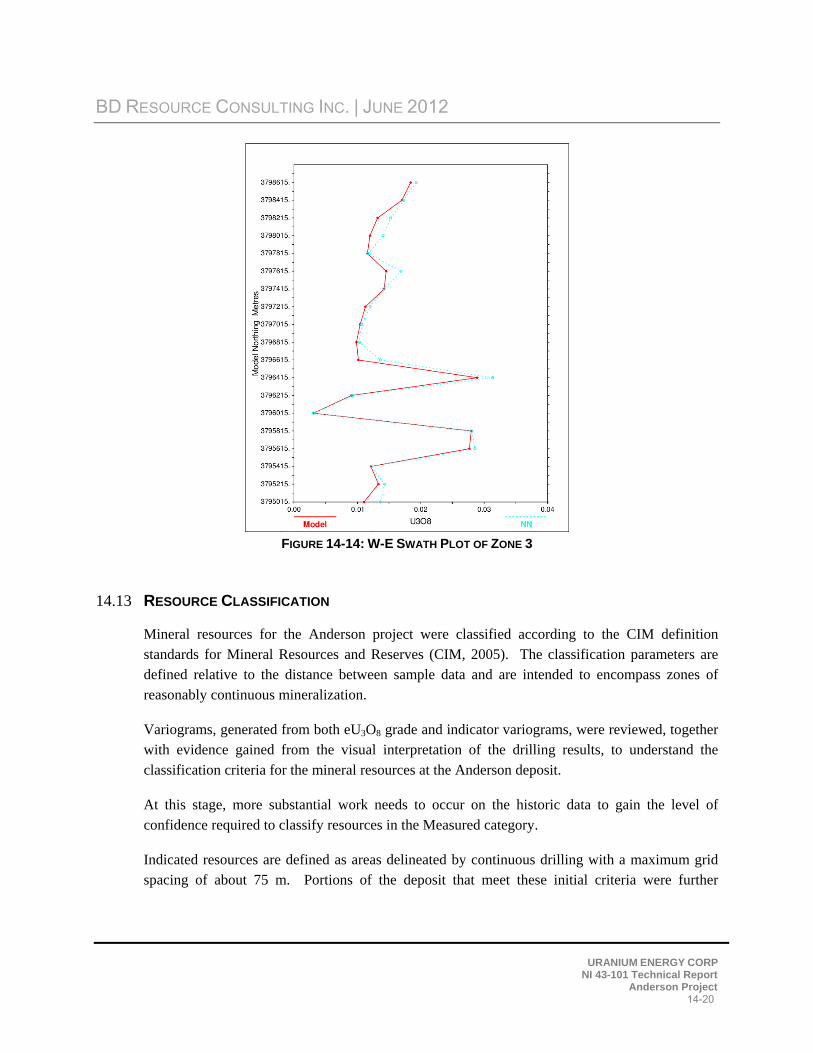
BD RESOURCE CONSULTING INC. | JUNE 2012
URANIUM ENERGY CORP NI 43-101 Technical Report
Anderson Project 14-20
FIGURE 14-14: W-E SWATH PLOT OF ZONE 3
14.13 RESOURCE CLASSIFICATION
Mineral resources for the Anderson project were classified according to the CIM definition standards for Mineral Resources and Reserves (CIM, 2005). The classification parameters are defined relative to the distance between sample data and are intended to encompass zones of
reasonably continuous mineralization.
Variograms, generated from both eU3O8 grade and indicator variograms, were reviewed, together with evidence gained from the visual interpretation of the drilling results, to understand the
classification criteria for the mineral resources at the Anderson deposit.
At this stage, more substantial work needs to occur on the historic data to gain the level of
confidence required to classify resources in the Measured category.
Indicated resources are defined as areas delineated by continuous drilling with a maximum grid spacing of about 75 m. Portions of the deposit that meet these initial criteria were further
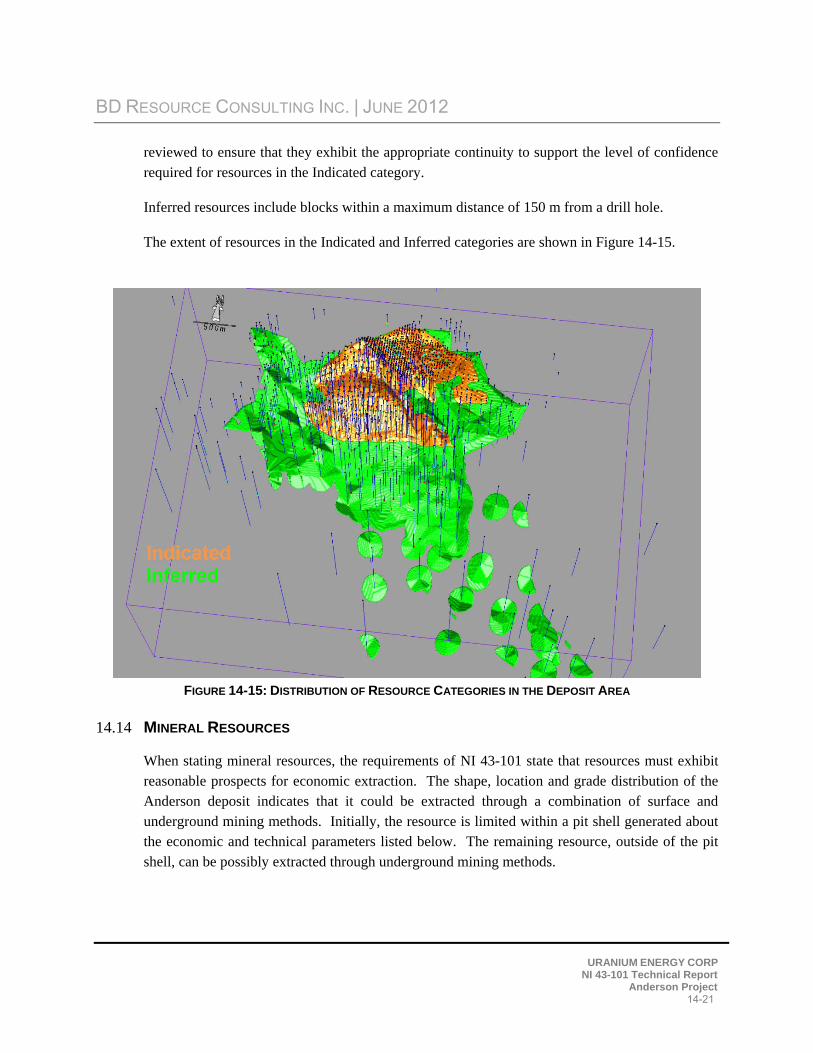
BD RESOURCE CONSULTING INC. | JUNE 2012
URANIUM ENERGY CORP NI 43-101 Technical Report
Anderson Project 14-21
reviewed to ensure that they exhibit the appropriate continuity to support the level of confidence
required for resources in the Indicated category.
Inferred resources include blocks within a maximum distance of 150 m from a drill hole.
The extent of resources in the Indicated and Inferred categories are shown in Figure 14-15.
FIGURE 14-15: DISTRIBUTION OF RESOURCE CATEGORIES IN THE DEPOSIT AREA
14.14 MINERAL RESOURCES
When stating mineral resources, the requirements of NI 43-101 state that resources must exhibit reasonable prospects for economic extraction. The shape, location and grade distribution of the Anderson deposit indicates that it could be extracted through a combination of surface and underground mining methods. Initially, the resource is limited within a pit shell generated about the economic and technical parameters listed below. The remaining resource, outside of the pit
shell, can be possibly extracted through underground mining methods.

BD RESOURCE CONSULTING INC. | JUNE 2012
URANIUM ENERGY CORP NI 43-101 Technical Report
Anderson Project 14-22
It is believed that these parameters represent reasonable assumptions based on the type, scale,
shape and location of this deposit:
U3O8 Price: US$65/lb
Open Pit Operating Costs: Mining $2/tonne
Total Site Operating Costs $14/tonne Pit Slope Angle: 45 degrees
Underground Operating Costs: Total Site Operating Costs $50/tonne
In the southeastern part of the deposit, the wider drill hole spacing results in a discontinuous or patchy distribution of potential resources that does not fulfill the requirements for mineral resources under NI 43-101. Additional drilling is required in this part of the deposit area to
demonstrate continuity of the mineralization.
Mineral resources for the Anderson Project are summarized at various cut-off grades for comparison purposes in Table 14.6. These resources were separated into two categories: Open Pit and Underground resources. These two resources have different operating costs and the respective “base case” cut-off grades are highlighted in Table 14.6. The assumed base case cut-off for open pit mining is 0.01%U3O8, and the base case for potential underground resources is
0.035%U3O8. The distribution of base case resources is shown in Figure 14-16.
There are no known factors related to environmental, permitting, legal, title, taxation, socio-
economic, marketing or political issues which could materially affect the mineral resource.

BD RESOURCE CONSULTING INC. | JUNE 2012
URANIUM ENERGY CORP NI 43-101 Technical Report
Anderson Project 14-23
TABLE 14.6: SUMMARY OF MINERAL RESOURCES
Cut-off Grade eU3O8%
ktonnes eU3O8 (%) Contained
U3O8 (Mlbs)
OPEN PIT RESOURCES
INDICATED
0.005 28,034 0.026 16.0
0.01 25,422 0.028 15.5 0.015 19,834 0.032 14.0
0.02 15,008 0.037 12.3
0.025 11,355 0.042 10.5
0.03 8,584 0.047 8.9
0.035 6,445 0.052 7.3
INFERRED
0.005 5,478 0.022 2.6
0.01 4,633 0.024 2.5 0.015 3,341 0.029 2.2
0.02 2,324 0.035 1.8
0.025 1,670 0.040 1.5
0.03 1,192 0.045 1.2
0.035 897 0.049 1.0
UNDERGROUND RESOURCES
INDICATED
0.005 38,177 0.015 12.5
0.01 25,209 0.019 10.5
0.015 15,213 0.024 7.9
0.02 8,570 0.029 5.4
0.025 4,494 0.035 3.5
0.03 2,555 0.042 2.3
0.035 1,426 0.049 1.5 0.04 871 0.057 1.1
0.045 581 0.065 0.8
0.05 382 0.074 0.6
INFERRED
0.005 123,286 0.016 44.6
0.01 85,483 0.021 38.8
0.015 52,298 0.026 30.2
0.02 32,330 0.032 22.8
0.025 20,423 0.038 17.1
0.03 12,164 0.045 12.1
0.035 8,362 0.052 9.5 0.04 6,046 0.057 7.6
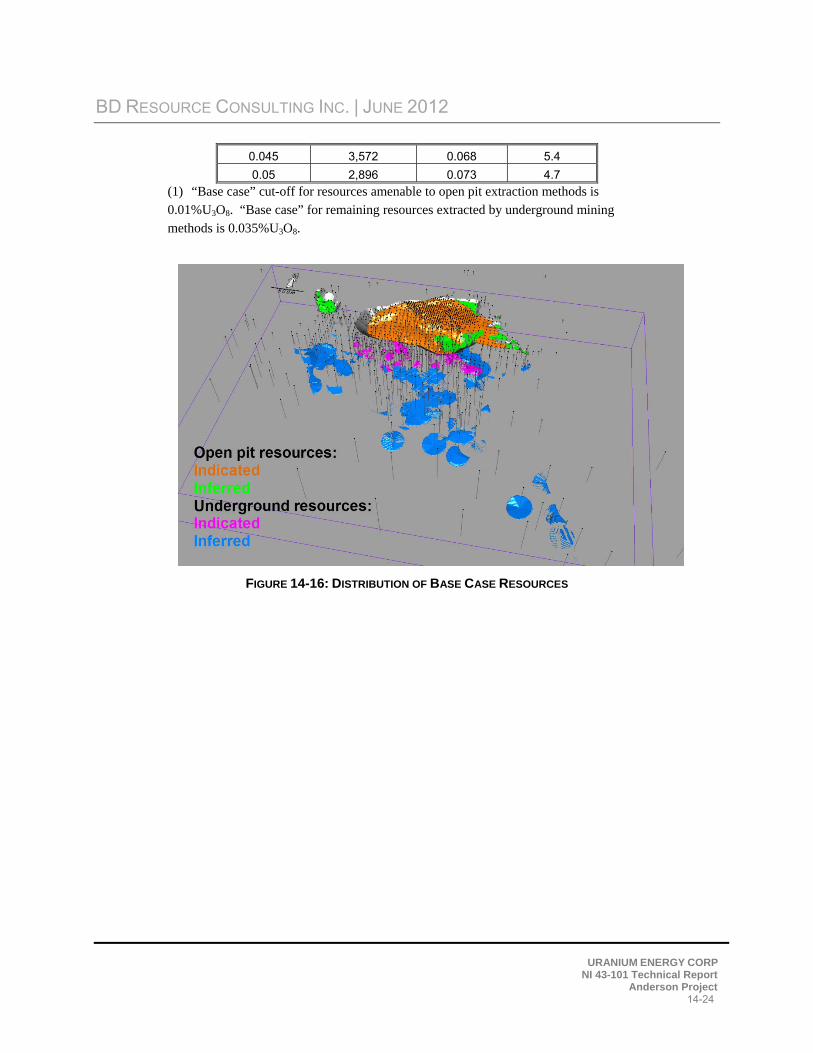
BD RESOURCE CONSULTING INC. | JUNE 2012
URANIUM ENERGY CORP NI 43-101 Technical Report
Anderson Project 14-24
0.045 3,572 0.068 5.4
0.05 2,896 0.073 4.7
(1) “Base case” cut-off for resources amenable to open pit extraction methods is 0.01%U3O8. “Base case” for remaining resources extracted by underground mining methods is 0.035%U3O8.
FIGURE 14-16: DISTRIBUTION OF BASE CASE RESOURCES

BD RESOURCE CONSULTING INC. | JUNE 2012
URANIUM ENERGY CORP NI 43-101 Technical Report
Anderson Project 15-1
15 MINERAL RESERVE ESTIMATE
This section is not applicable.

BD RESOURCE CONSULTING INC. | JUNE 2012
URANIUM ENERGY CORP NI 43-101 Technical Report
Anderson Project 16-1
16 MINING METHODS
This section is not applicable.
BD RESOURCE CONSULTING INC. | JUNE 2012
URANIUM ENERGY CORP NI 43-101 Technical Report
Anderson Project 17-1
17 RECOVERY METHODS
This section is not applicable.
BD RESOURCE CONSULTING INC. | JUNE 2012
URANIUM ENERGY CORP NI 43-101 Technical Report
Anderson Project 18-1
18 PROJECT INFRASTRUCTURE
This section is not applicable.
BD RESOURCE CONSULTING INC. | JUNE 2012
URANIUM ENERGY CORP NI 43-101 Technical Report
Anderson Project 19-1
19 MARKET STUDIES AND CONTRACTS
This section is not applicable.

BD RESOURCE CONSULTING INC. | JUNE 2012
URANIUM ENERGY CORP NI 43-101 Technical Report
Anderson Project 20-1
20 ENVIRONMENTAL STUDIES, PERMITTING AND SOCIAL OR COMMUNITY IMPACT
UEC is not aware of significant environmental liabilities on the property. However, it is important to note that 195 acres in the northern part of the project area were classified as “disturbed” by the Bureau of Land Management. The disturbed area is a result of minor production via dozer cuts
from surface mining done in the 1950s.

BD RESOURCE CONSULTING INC. | JUNE 2012
URANIUM ENERGY CORP NI 43-101 Technical Report
Anderson Project 21-1
21 CAPITAL AND OPERATING COSTS
This section is not applicable.
BD RESOURCE CONSULTING INC. | JUNE 2012
URANIUM ENERGY CORP NI 43-101 Technical Report
Anderson Project 22-1
22 ECONOMIC ANALYSIS
This section is not applicable.
BD RESOURCE CONSULTING INC. | JUNE 2012
URANIUM ENERGY CORP NI 43-101 Technical Report
Anderson Project 23-1
23 ADJACENT PROPERTIES
The Anderson Project is located approximately 180 miles from Uranium Energy Corp’s
Workman Creek Project. There has been no adjacent property information used in this report.
BD RESOURCE CONSULTING INC. | JUNE 2012
URANIUM ENERGY CORP NI 43-101 Technical Report
Anderson Project 24-1
24 OTHER RELEVANT DATA AND INFORMATION
This section is not applicable.
BD RESOURCE CONSULTING INC. | JUNE 2012
URANIUM ENERGY CORP NI 43-101 Technical Report
Anderson Project 25-1
25 INTERPRETATION AND CONCLUSIONS
Based on the recent assembly and verification of data by UEC on the Anderson Uranium Project,
the following conclusions can be made:
The level of understanding of the geology at Anderson Project is relatively good.
The practices used during the various drilling campaigns were conducted in a professional manner and adhered to accepted industry standards.
There are no evident factors that would lead one to question the integrity of the database.
There are no unusual risks associated with the resource estimates.
A significant uranium deposit was outlined. Mineralization is hosted in lacustrine facies fixed by the presence of carbonaceous material.
Drilling to date has outlined an Indicated open pit resource (at a 0.01% eU3O8 cut-off) of 25.4 Mtonnes at 0.028% eU3O8 which contains 15.5 million pounds of uranium, and an Inferred resource (at a 0.01% eU3O8 cut-off) of 4.6 Mtonnes at 0.024% eU3O8 which contains 2.5 million pounds of uranium.
The underground Indicated resource (at a 0.035% eU3O8 cut-off) is 1.4 Mtonnes at 0.049% eU3O8 which contains 1.5 million pounds of uranium, and an Inferred resource (at a 0.035% eU3O8 cut-off) of 8.4 Mtonnes at 0.052% eU3O8 which contains 9.5 million pounds of uranium.
Preliminary metallurgical work indicates that the material may be amenable to conventional heap leaching and produces recoveries of above 70%.

BD RESOURCE CONSULTING INC. | JUNE 2012
URANIUM ENERGY CORP NI 43-101 Technical Report
Anderson Project 26-1
26 RECOMMENDATIONS
The following actions are recommended for the Anderson Project:
Additional drilling to expand confirmation results from historic drilling in both the open pit and underground portions of the deposit. The use of both PFN and chemical assay should be used for the confirmation of grade. A budget of US$780,000 has been proposed to complete this test work (Table 26.1).
Additional metallurgical testing on both open pit and underground areas. A budget of US$100,000 has been proposed to complete this work (Table 26.1).
After drilling is completed, an updated resource estimate should be prepared. A budget of US$75,000 has been proposed to complete this work (Table 26.1).
Environmental studies to provide a baseline for future exploration and possible development work on the project. A budget of US$675,000 has been proposed to complete this work (Table 26.2).
The recommended drilling and assaying will further confirm historic results and upgrade the classification of resources in some areas. The Prompt Fission Neutron (PFN) logging will also be used to confirm historic results and determine the propriety of the disequilibrium correction
applied to current eU3O8 grades.
The following work items are recommended for the Anderson Project:
TABLE 26.1: EXPLORATION BUDGET
Item Cost (USD)
Permitting and reclamation $25,000
5 diamond drill holes (100 m average, 500 m total) $150,000
20 RC holes (200 m average 4,000 m total) $400,000
PFN probing 25 holes $125,000
Assay of core and RC chips (2,000 samples by ICP-MS) $88,000
Metallurgical heap leach testing $100,000
Resource model update and report $75,000
Road maintenance $25,000
Exploration TOTAL $988,000
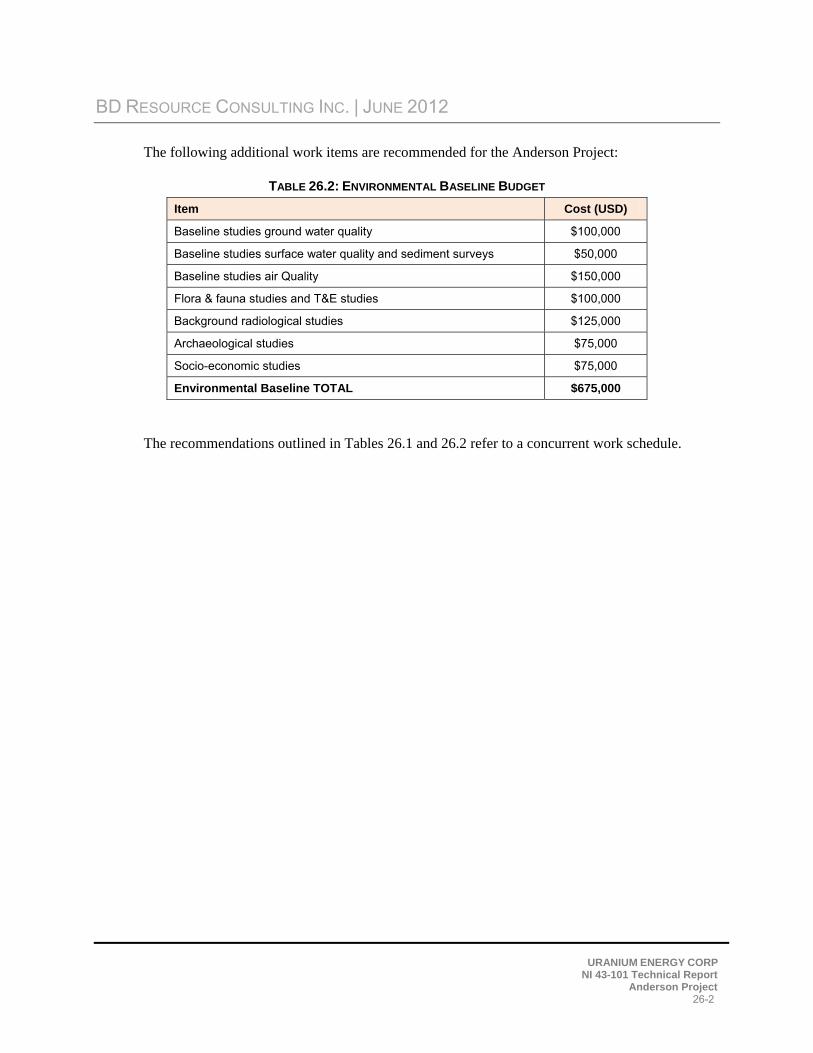
BD RESOURCE CONSULTING INC. | JUNE 2012
URANIUM ENERGY CORP NI 43-101 Technical Report
Anderson Project 26-2
The following additional work items are recommended for the Anderson Project:
TABLE 26.2: ENVIRONMENTAL BASELINE BUDGET
Item Cost (USD)
Baseline studies ground water quality $100,000
Baseline studies surface water quality and sediment surveys $50,000
Baseline studies air Quality $150,000
Flora & fauna studies and T&E studies $100,000
Background radiological studies $125,000
Archaeological studies $75,000
Socio-economic studies $75,000
Environmental Baseline TOTAL $675,000
The recommendations outlined in Tables 26.1 and 26.2 refer to a concurrent work schedule.

BD RESOURCE CONSULTING INC. | JUNE 2012
URANIUM ENERGY CORP NI 43-101 Technical Report
Anderson Project 27-1
27 REFERENCES
Arseneau, G. (2011), “Anderson Uranium Project, Yavapai County, Arizona, USA.” Report prepared for Global Uranium Corporation by SRK Consulting (Canada) Inc., May.
Chapman, Wood & Griswold Inc. (1977), “A Review of Estimated Mineable Uranium Reserves,
Anderson Mine Project, Yavapai County, Arizona,” September. COLEDT (1978), Minerals Exploration Company Exploration Drill Holes Coordinate Database Printout. Gilbride, P.E., Hardy, M.P., and Hambley, D. (2010), “Mineral Resources of the Anderson Uranium
Property Yavapai County, Arizona, USA” Report prepared for Global Uranium Corporation by Agapito Associates, Inc., July 01.
Harris and Thompson (2007), “Updated title opinion on Anderson mine project, Yavapai County,
Arizona,” Richard W. Harris letter to Ralph W. Kettel, June 26, 14pp. Hazen Research, Inc. (1977), “Alkaline Leaching of Anderson Mine Samples for Minerals Exploration
Company,” August. Hazen Research, Inc. (1978a), “Mode of Occurrence of Uranium in Core Samples From Date Creek
Property, Arizona,” February. Hazen Research, Inc. (1978b ), “Uranium Recovery From Anderson Mine Ore- Laboratory Studies,” March. Hazen Research, Inc. (1978c), “Mode of Occurrence of Uranium in Core Sample DC-77C from Date
Creek Property, Arizona,” October. Hazen Research, Inc. (1979), “Analytical Results of Date Creek Drill Cores,” February. Hertzke, D. C. (1997), “Summary Report on the Uranium Potential of the Anderson Uranium Property,
Yavapai County, Arizona,” July 28. Lucht, Robert F. (1978), “Development Report on Equilibrium at the Anderson Mine Project,” April 28. Minerals Exploration Company of Union 76 Minerals (1978a), “Feasibility Study, Anderson Project,”
Volume 1, Executive Summary, July. Minerals Exploration Company of Union 76 Minerals (1978b), “Feasibility Study, Anderson Project,”
Volume 2, Geology and Mining, July. Minerals Exploration Company of Union 76 Minerals (1978c), “Feasibility Study, Anderson Project,”
Volume 3, Ore Processing, July.
BD RESOURCE CONSULTING INC. | JUNE 2012
URANIUM ENERGY CORP NI 43-101 Technical Report
Anderson Project 27-2
Roberts, John C. (1978) “Anderson Mine Bulk Density Study,” Minerals Exploration Company of Union 76 Minerals, January.
Scott, James H. (1962), “The GAMLOG Computer Program,” Report RME-143, US Atomic Energy
Commission, Grand Junction, CO, 43pp. Sherborne, J.E., Jr. (1979), “Major Uranium Discovery in Volcaniclastic Sediments, Basin and Range
Province, Yavapai County, Arizona.” A.A.P.G. Bulletin, Vol. 63, No. 4, pp. 621-646. Urangesellschaft USA, Inc. (1979a), “Date Creek Project Preliminary Evaluation for Prospective
Underground Mine,” September. Urangesellschaft USA, Inc. (1979b), “1978 Annual Report, Date Creek Project,” February. Urangesellschaft USA, Inc. (1979c), “Mineable Ore Reserves by Polygon. Underground Mining Areas.
Cutoff: 6’ min. mining width 0.05% eU3O8,” August 8. Urangesellschaft USA, Inc. (1980), “1979 Date Creek Project, Annual Report,” January. Water Development Corporation (1978), “Ground Water Hydrology of Anderson Mine Area, Arizona,”
D.K. Greene, L.C. Halpenny, and S.D. Clark authors, February. Water Development Corporation, (1979), “Hydrogeology of Anderson Mine Area, Arizona,” D.K.
Greene, S.D. Clark, and L.C. Halpenny authors, August.
BD RESOURCE CONSULTING INC. | JUNE 2012
URANIUM ENERGY CORP NI 43-101 Technical Report
Anderson Project 28-1
28 CERTIFICATE OF QUALIFIED PERSONS
CERTIFICATE of AUTHOR I, Bruce Davis, FAusIMM, do hereby certify that:
1. I am an independent consultant of BD Resource Consulting, Inc., located at 4253 Cheyenne Drive,
Larkspur, CO, U.S.A., 80118, incorporated January 18, 2008.
2. I graduated with a Doctor of Philosophy degree from the University of Wyoming in 1978.
3. I am a fellow of the Australasian Institute of Mining and Metallurgy, Registration Number 2111185.
4. I have practiced my profession continuously for 33 years and have been involved in geostatistical studies, mineral resource and reserve estimations and feasibility studies on numerous underground and open pit base metal and gold deposits in Canada, the United States, Central and South America, Europe, Asia, Africa and Australia.
5. I have read the definition of “qualified person” set out in National Instrument 43-101 (“NI 43-101”) and certify that by reason of my education, affiliation with a professional association (as defined in NI 43-101) and past relevant work experience, I fulfill the requirements to be a “qualified person” for the purposes of NI 43-101.
6. I am responsible for the Technical Report titled “Technical Report on the Anderson Uranium Project Yavapai County, Arizona” dated June 15, 2012, with an effective date of April 15, 2012 (the “Technical Report”). I personally visited the site May 8, 2012.
7. I have had no prior involvement with the property that is the subject of the Technical Report.
8. I am independent of the issuer applying all of the tests in Section 1.5 of National Instrument 43-101.
9. I have read National Instrument 43-101 and Form 43-101F1, and the Technical Report has been prepared in compliance with that instrument and form.
10. As of the date of this certificate, to the best of my knowledge, information and belief, the Technical Report contains all scientific and technical information that is required to make the Technical Report not misleading.
11. I consent to the filing of the Technical Report with any stock exchange and other regulatory authority and any publication by them, including electronic publication in the public company files on their websites accessible by the public, of the Technical Report
Dated this 8th day of June, 2012.
_ Bruce M. Davis, FAusIMM
BD RESOURCE CONSULTING INC. | JUNE 2012
URANIUM ENERGY CORP NI 43-101 Technical Report
Anderson Project 28-2
ROBERT SIM, P.Geo. SIM Geological Inc.
6810 Cedarbrook Place, Delta, British Columbia, Canada V4E 3C5 Telephone: 604-596-6339 Fax: 604-596-6367
Email: [email protected]
CERTIFICATE OF QUALIFIED PERSON
I, Robert Sim, P.Geo., do hereby certify that:
1. I am an independent consultant of:
SIM Geological Inc. 6810 Cedarbrook Place
Delta, British Columbia, Canada V4E 3C5
2. I graduated from Lakehead University with an Honours Bachelor of Science (Geology) in 1984.
3. I am a member, in good standing, of the Association of Professional Engineers and Geoscientists of British Columbia, License Number 24076.
4. I have practiced my profession continuously for 28 years and have been involved in mineral exploration, mine site geology and operations, mineral resource and reserve estimations and feasibility studies on numerous underground and open pit base metal and gold deposits in Canada, the United States, Central and South America, Europe, Asia, Africa and Australia.
5. I have read the definition of “qualified person” set out in National Instrument 43-101 (“NI 43-101”) and certify that by reason of my education, affiliation with a professional association (as defined in NI 43-101) and past relevant work experience, I fulfill the requirements to be a “qualified person” for the purposes of NI 43-101.
6. I am responsible for the preparation of section 14 of the technical report titled “Technical Report on the Anderson Uranium Project, Yavapai County, Arizona, USA” dated June 08, 2012, with an effective date of April 15, 2012 (the “Technical Report”).
7. I have not visited the property.
8. I have not had any prior involvement with the property that is the subject of the Technical Report.
BD RESOURCE CONSULTING INC. | JUNE 2012
URANIUM ENERGY CORP NI 43-101 Technical Report
Anderson Project 28-3
9. As of as of the effective date of the Technical Report, to the best of my knowledge, information and belief, the Technical Report contains all scientific and technical information that is required to be disclosed to make the Technical Report not misleading.
10. I am independent of the issuer applying all of the tests in Section 1.5 of NI 43-101.
11. I have read NI 43-101 and Form 43-101F1, and the Technical Report has been prepared in compliance with that instrument and form.
Dated this 8th day of June, 2012.
“original signed” _____________________________________ Robert Sim, P.Geo.