Technical Report for the Diabetes Prevention Impact Toolkit · PDF filevii Acknowledgments The...
61
Technical Report for the Diabetes Prevention Impact Toolkit December 2016
Transcript of Technical Report for the Diabetes Prevention Impact Toolkit · PDF filevii Acknowledgments The...

Technical Report for the Diabetes
Prevention Impact Toolkit
December 2016


iii
CONTENTS
Section Page
1. Introduction 1
2. Input Dashboard 1
2.1 State Module Population Characteristics ......................................................... 1
2.2 Employer Module Population Characteristics ................................................... 9
2.2.1 Assume National Average for Population Characteristics ....................... 10
2.2.2 Assume State Average for Population Characteristics ........................... 10
2.2.3 Assume Industry Average for Population Characteristics....................... 12
2.2.4 Assume Occupation Average for Population Characteristics ................... 15
2.2.5 Entering Employee Population Characteristics ..................................... 16
2.3 Insurer Module Population Characteristics .................................................... 17
2.3.1 Assume National Average for Population Characteristics ....................... 18
2.3.2 Assume State Average for Population Characteristics ........................... 18
2.3.3 Assume Industry Average for Population Characteristics....................... 20
2.3.4 Assume Occupation Average for Population Characteristics ................... 21
2.3.5 Entering Insured Population Characteristics ........................................ 21
2.4 Diabetes Incidence Rates for Each Risk Group .............................................. 21
2.4.1 Persons with Prediabetes .................................................................. 23
2.4.2 Persons with Prediabetes and Other Persons at Risk for Type 2
Diabetes ........................................................................................ 24
2.4.3 Persons with High-Risk Prediabetes ................................................... 25
2.5 Additional Impact Toolkit Inputs ................................................................. 26
2.5.1 Screening ....................................................................................... 29
2.5.2 Program Enrollment and Participation ................................................ 30
2.5.3 Intervention Weight Loss and Regain Schedule ................................... 32
2.5.4 Program Budget .............................................................................. 34
2.5.5 Program Costs ................................................................................ 34
2.5.6 Medical Costs .................................................................................. 36
2.5.7 Productivity Costs (Employer Module Only) ......................................... 38
3. Output Dashboard 39
3.1 Projected Participants ................................................................................ 39
3.2 Cumulative Projected Cases of Diabetes ....................................................... 40
3.3 Cumulative Medical Costs per Participant ..................................................... 42
iv
3.4 Net Costs (Program Costs minus Medical and Productivity Cost Savings)
per Participant .......................................................................................... 43
3.4.1 Productivity Costs in the Employer Module ......................................... 44
3.5 Cumulative Quality Adjusted Life Years (QALYs) Gained ................................. 45
3.6 Incremental Cost-Effectiveness Ratios (ICERs) ............................................. 46
3.7 Cumulative Years of Life Gained .................................................................. 48
References R-1
v
FIGURES
Number Page
1. Three Risk Groups Eligible to Participate in National DPP ....................................... 2
2. Employer Input Dashboard Collapsed ................................................................ 26
3. Employer Input Dashboard (Expanded) ............................................................. 28
4. Program Cost Inputs Showing Average Screening Cost Calculation ....................... 30
5. Program Enrollment and Participation Inputs ..................................................... 31
6. Projected Participants ..................................................................................... 40
7. Projected Cases of Diabetes and Years with Diabetes Averted by Participating
in the National DPP or Similar Programs ............................................................ 41
8. Cumulative Medical Costs per Participant .......................................................... 42
9. Net Costs (Program Costs minus Medical and Productivity Cost Savings) per
Participant ..................................................................................................... 43
10. Cumulative Quality Adjusted Life Years (QALYs) Gained ...................................... 46
11. Incremental Cost-Effectiveness Ratios (ICERs) ................................................... 47
12. Cumulative Years of Life Gained ....................................................................... 49

vi
TABLES
Number Page
1. National Estimates of Prediabetes and Diabetes (NHANES 2011–2014) ................... 4
2. National Estimates of “Persons with Prediabetes” and BMI≥24 (NHANES
2011–2014) .................................................................................................... 5
3. National Estimates of “Persons with Prediabetes,” “Persons with Prediabetes
and Other Persons at Risk for Type 2 Diabetes,” and Related Estimates
(NHANES 2011–2014) ...................................................................................... 5
4. State-level Predicted Prevalence across Impact Toolkit Risk Groups (Full Adult
Population) ...................................................................................................... 6
5. National and State-Level Adult Population Estimates for Calculating Risk
Group Size (BRFSS 2014) ................................................................................. 7
6. State-level Predicted Prevalence across Impact Toolkit Risk Groups (Adult
Employed Population) ..................................................................................... 11
7. Industry Group Predicted Prevalence across Impact Toolkit Risk Groups ................ 14
8. Occupation Group Predicted Prevalence across Impact Toolkit Risk Groups ............ 15
9. State-level Predicted Prevalence across Impact Toolkit Risk Groups (Adult
Privately Insured Population) ........................................................................... 19
10. Annual Incidence Probability of Diabetes by A1c Category ................................... 22
11. Low, High, and Midpoint Annual Incidence Probability Estimates by A1C from
Zhang et al. (2010) ........................................................................................ 23
12. Persons with Prediabetes: Calculation of a Weighted Average Annual
Probability of Diabetes by A1C Category ............................................................ 24
13. Persons with Prediabetes and Other Persons at Risk for Type 2 Diabetes:
Calculation of a Weighted Average Annual Probability of Diabetes by A1C
Category ....................................................................................................... 24
14. Default Intervention Weight Loss and Weight Regain Schedule ............................ 34
15. Estimated Diabetes Attributable Medical Costs by Year and Duration of
Diabetes ....................................................................................................... 37

vii
Acknowledgments
The Diabetes Prevention Impact Toolkit and this accompanying Technical Report were
developed by RTI International through Contract Number 200-2013-M-53964B, Purchase
Order 200-2-14-F-61255 from the Centers for Disease Control and Prevention. The contents
are solely the responsibility of the authors and do not necessarily represent the official
views of the Centers for Disease Control and Prevention, the Department of Health and
Human Services, or the U.S. government.
We would like to acknowledge the following members of the Expert Advisory Panel who
provided advice on the technical approach, development, and data sources to be used for
the development of the Impact Toolkit: Barbara Bartman, Jonathan Brown, William Herman,
Matt Petersen, and Kristi Pier.


1
1. INTRODUCTION
The Diabetes Prevention Impact Toolkit predicts the health and economic effects of the
National Diabetes Prevention Program (National DPP) or similar programs on a state,
employer, or insurer’s population at risk for diabetes. Specifically, the Impact Toolkit allows
users to estimate program costs, diabetes-related medical costs, and return on investment
(ROI) along with other cost and health outcome measures. This report describes the
methods, equations, and data used by the Impact Toolkit to project outcomes.
The Impact Toolkit has three modules: State, Employer, and Insurer. In general, these
modules are very similar. The key difference is that, in the Employer and Insurer modules,
the user can choose from a set of predefined populations or enter a customized set of
population characteristics. In contrast, the State module only offers state populations for
estimating the health and economic effects of a National DPP. The differences between the
modules are mainly reflected in the Population Characteristics section of the Input
Dashboard. Sections 2.1 through 2.3 describe the Population Characteristics inputs for each
module separately. All other sections of this technical report apply to all three modules,
except for Section 2.5.7 Productivity Costs, which only applies to the Employer module.
2. INPUT DASHBOARD
For each module (State, Employer, and Insurer), the Population Characteristics section has
different features and functions. Section 2.1 covers the technical details of population
characteristics for the State module, Section 2.2 covers the Employer module, and Section
2.3 covers the Insurer module. Sections 2.4 and 2.5 cover the technical details associated
with additional sections of the Input Dashboard that are the same in each module (e.g.,
screening assumptions, cost assumptions).
2.1 State Module Population Characteristics
When a state is selected from the dropdown list (or the U.S. map), the Impact Toolkit
references a table of state-level data that contains the predicted prevalence for each of the
risk groups eligible to participate in a National DPP or similar program. The default risk
group is set to “Persons with prediabetes” because the American Diabetes Association (ADA)
and other organizations recommend that persons with prediabetes be referred to an
intensive diet and physical activity behavioral counseling program (ADA, 2016). The
National DPP is an example of such a program. You can also select a larger group (“Persons
with prediabetes and other persons at risk for type 2 diabetes”), which has a slightly lower
annual probability of developing diabetes, or a smaller group (“Persons with high-risk
prediabetes”), which has a higher annual probability of developing diabetes. The larger
group (“Persons with prediabetes and other persons at risk for type 2 diabetes”) includes
everyone from the group “Persons with prediabetes” and additional persons with a high risk

Technical Report for the Diabetes Prevention Impact Toolkit
2
score on the CDC Prediabetes Screening Test (CDC, 2015a). The smaller group (“Persons
with high-risk prediabetes”) only includes a high-risk subset of the group “Persons with
prediabetes.” All three risk groups include only persons with a body mass index [BMI] ≥ 24
kg/m2, which is the eligibility criteria for the National DPP (CDC, 2015b). The user will select
one of these three risk groups as shown in Figure 1.
Figure 1. Three Risk Groups Eligible to Participate in National DPP
Note: The default risk group is set to “Persons with prediabetes.” The larger group (“Persons with prediabetes and other persons at risk for type 2 diabetes”) includes everyone from the group “Persons with prediabetes” and additional persons with a high risk score on the CDC Prediabetes Screening Test (CDC, 2015a). The smaller group (“Persons with high-risk prediabetes”) only includes a high-risk subset of the group “Persons with prediabetes.” Each group has a different
“Annual probability of diabetes.” See Section 2.4 for more information on how the default “Annual probability of diabetes” was calculated for each risk group.
State estimates of the number of people in each of these risk groups were derived using a
prediction equation based on age, sex, race/ethnicity, and BMI characteristics. These risk
groups were estimated in two steps. First, we estimated an ordered logistic regression
model using National Health and Nutrition Examination Survey (NHANES) (2011–2014) data
to predict the probability of having prediabetes (prediabetes was defined as fasting plasma
glucose [FPG] 100–125 mg/dl or A1C 5.7%–6.4%). The ordered logistic regression
approach allowed us to account for various diabetes-related groups, including normal
glucose, prediabetes, undiagnosed diabetes, and diagnosed diabetes. Second, we applied

Technical Report for the Diabetes Prevention Impact Toolkit
3
this prediction equation to the sample of state residents in the Behavioral Risk Factor
Surveillance System (BRFSS) (2014) for each state. In other words, based on the age, sex,
race/ethnicity, and BMI characteristics observed in each state, we predicted the number of
people who would have prediabetes and BMI ≥ 24 kg/m2. For Asian persons, we allowed a
lower BMI threshold (BMI ≥ 22 kg/m2) per CDC’s Diabetes Prevention Recognized Program
criteria (CDC, 2015b). Persons with diagnosed or undiagnosed diabetes were excluded from
all risk groups (persons with diabetes are not eligible for the National DPP).
For the larger risk group, “Persons with prediabetes and other persons at risk for type 2
diabetes,” we calculated the CDC Prediabetes Screening Test score for each person in
BRFSS (using age, BMI, and physical activity status) to ascertain how many were at risk for
diabetes in each state (CDC, 2015a). Persons with a score of 9 or higher are eligible to
participate in the National DPP. From this estimate of state residents with a score of 9 or
higher, we then subtracted the predicted prevalence of persons with diabetes and added the
predicted prevalence of persons from the prediabetes risk group that had a risk score of less
than 9. This is necessary because the group of “Persons with prediabetes and other persons
at risk for type 2 diabetes” should contain everyone in the prediabetes group even if they
had a score of less than 9. A step-by-step description of the algorithm for estimating the
state-level predicted prevalence of “Persons with prediabetes and other persons at risk for
type 2 diabetes” follows:
1. Generate indicator variable for having a high risk score for each person in the sample
(a score of 9 or higher on the CDC Prediabetes Screening Test qualifies as a high
score). Estimate the survey weighted mean of this indicator variable for each state’s
sample of participants. This mean represents an estimate of the proportion of people
in the sample with a high risk score.
a) We were able to calculate each person’s screening test result based on their age,
BMI, and physical activity status. We generated a variable for persons with “no
physical activity” based on each person’s yes or no response to a question about
participating in any leisure time physical activity. Additional questions from the
screening test regarding family history of diabetes and having had a baby that
weighs more than 9 pounds at birth are only worth 1 point each and cannot
change the outcome of the test (all other questions are worth at least 5 points,
and these additional questions cannot increase the score to 9 or higher).
2. Generate state predictions of “Persons with prediabetes” (BMI ≥ 24 kg/m2) who have
a low risk score (i.e., “Persons with prediabetes” who are not in the “Persons with
prediabetes and other persons at risk for type 2 diabetes” group except for the fact
that they have prediabetes). This was done by generating predictions of prediabetes
status (using the ordered logistic regression model) among persons with a low risk
score (less than 9) and a high BMI (BMI ≥ 24 kg/m2). We estimated the survey weighted mean prediction (of prediabetes) for each state’s sample of participants.

Technical Report for the Diabetes Prevention Impact Toolkit
4
3. Generate an indicator variable for persons with a high BMI (BMI ≥ 24 kg/m2) and low
risk score (less than 9). Estimate the survey weighted mean for the state’s sample of
participants.
4. Multiply (2) and (3) to get “Persons with prediabetes” (BMI ≥ 24 kg/m2) who would
not otherwise qualify for the “Persons with prediabetes and other persons at risk for type 2 diabetes” group.
5. Generate state predictions for total diabetes (undiagnosed and diagnosed diabetes)
in persons with a high risk score and BMI ≥ 24 kg/m2 (these persons are not eligible
for the National DPP). Estimate the survey weighted mean of these predictions for
each state’s sample of participants. This mean represents an estimate of the proportion of people in the sample with a high risk score and diabetes.
6. Calculate the full state-level risk group, “Persons with prediabetes and other persons at risk for type 2 diabetes” as follows:
a. “Persons with prediabetes and other persons at risk for type 2 diabetes” = {(1) −
[(5)*(1)]} + (4)
Finally, the smallest group, “Persons with high-risk prediabetes,” was calculated using the
predicted prevalence for the “Persons with prediabetes” risk group and the fraction of
persons with prediabetes that are considered high risk (34.3%). We used NHANES data
(2011–2014) to estimate this fraction, where we defined high-risk prediabetes as having an
A1C of 6.0%–6.4% or an FPG of 110–125 mg/dl. As shown in Section 2.4, persons with
these levels of A1C or FPG have a higher annual probability of developing diabetes.
National estimates offered in the State module (“UNITED STATES” selection in the dropdown
menu) do not use a prediction equation to predict the prevalence of “Persons with
prediabetes” because their prediabetes status is obtained directly from the results of the
NHANES laboratory data (i.e., A1C or FPG test results). Thus, we used the NHANES data
(2011–2014) alone for the U.S. population selection in the State module, whereas state-
level data were based on (1) the prediabetes prediction equation estimated in NHANES
(2011–2014) and (2) the state-level characteristics observed in BRFSS (2014).
Using the national data from NHANES, we demonstrate the method for parsing the Impact
Toolkit’s risk groups in Tables 1 through 3. Table 1 shows the division of persons between
normal glucose, prediabetes, undiagnosed diabetes, and diagnosed diabetes in NHANES
2011–2014.
Table 1. National Estimates of Prediabetes and Diabetes (NHANES 2011–2014)
Normal Glucose Prediabetes
Undiagnosed Diabetes
Diagnosed Diabetes
Estimate 52.5% 35.6% 3.1% 8.8%

Technical Report for the Diabetes Prevention Impact Toolkit
5
Not all persons with prediabetes are eligible for the National DPP. To be eligible, a person
with prediabetes must have BMI ≥ 24 kg/m2 (≥ 22 kg/m2 for Asians). As shown in Table 2,
29.2% of the population has prediabetes and BMI ≥ 24 kg/m2.
Table 2. National Estimates of “Persons with Prediabetes” and BMI≥24
(NHANES 2011–2014)
Normal Glucose
Prediabetes, BMI<24
Prediabetes, BMI≥24
Diagnosed and Undiagnosed Diabetes
52.5% 6.4% 29.2% 11.9%
The National DPP may also serve other persons at risk for diabetes who have BMI ≥ 24
kg/m2. Persons without A1C or FPG lab values in the prediabetes range are considered “at
risk for type 2 diabetes” if they have a CDC Prediabetes Screening Test score of 9 or higher
(CDC, 2015a, 2015b). This additional risk group is shown in Table 3, where the normal
glucose population is divided into persons at risk for type 2 diabetes with BMI ≥ 24 kg/m2
(12.1%) and those who are not at risk (40.4%). The risk group in the penultimate column
of Table 3, BMI ≥ 24 “Prediabetes and other persons at risk for type 2 diabetes,” includes
the 12.1% with “Normal glucose, at risk for type 2 diabetes, BMI ≥ 24,” and the 29.2% with
“Prediabetes, BMI ≥ 24.”
Table 3. National Estimates of “Persons with Prediabetes,” “Persons with
Prediabetes and Other Persons at Risk for Type 2 Diabetes,” and
Related Estimates (NHANES 2011–2014)
Normal
Glucose, Not at Risk for
Type 2 Diabetesa
Normal
Glucose, at Risk for Type 2 Diabetes, BMI≥24b
Prediabetes, BMI<24
Prediabetes, BMI≥24
Prediabetes and
Other Persons at Risk for Type
2 Diabetes, BMI≥24c
Diagnosed
and Undiagnosed
Diabetes
40.4% 12.1% 6.4% 29.2% 41.3% 11.9%
Note: Persons “at risk for type 2 diabetes” are persons with a score of 9 or higher on the CDC Prediabetes Screening Test (CDC, 2015a). The percentages in this table do not add up to 100%
because the “Persons with prediabetes, BMI≥24” are subsumed in the “Persons with prediabetes and other persons at risk, BMI≥24” estimate (i.e., the percentages add up to 100% if you ignore the “Prediabetes, BMI≥24” column and the “Normal Glucose, at Risk for Type 2 Diabetes, BMI≥24” column).
a “Normal glucose, not at risk for type 2 diabetes” excludes persons eligible for the National DPP
(“Prediabetes, BMI≥24” and “normal glucose, at risk for type 2 diabetes, BMI≥24”) and “diagnosed and undiagnosed type 2 diabetes.”
b Persons with “Normal glucose, at risk for type 2 diabetes, BMI≥24” do not have A1C or FPG lab values in the prediabetes range; however, they do have a score of 9 or higher on the CDC Prediabetes Screening Test (CDC, 2015a) based on their diabetes risk factors (e.g., age, BMI, physical activity status).
c The “prediabetes and other persons at risk for type 2 diabetes, BMI≥24” group includes persons with “Prediabetes, BMI≥24” and persons with “normal glucose, at risk for type 2 diabetes, BMI≥24” (i.e., persons with a score of 9 or higher on the CDC Prediabetes Screening Test (CDC, 2015a)).
Technical Report for the Diabetes Prevention Impact Toolkit
6
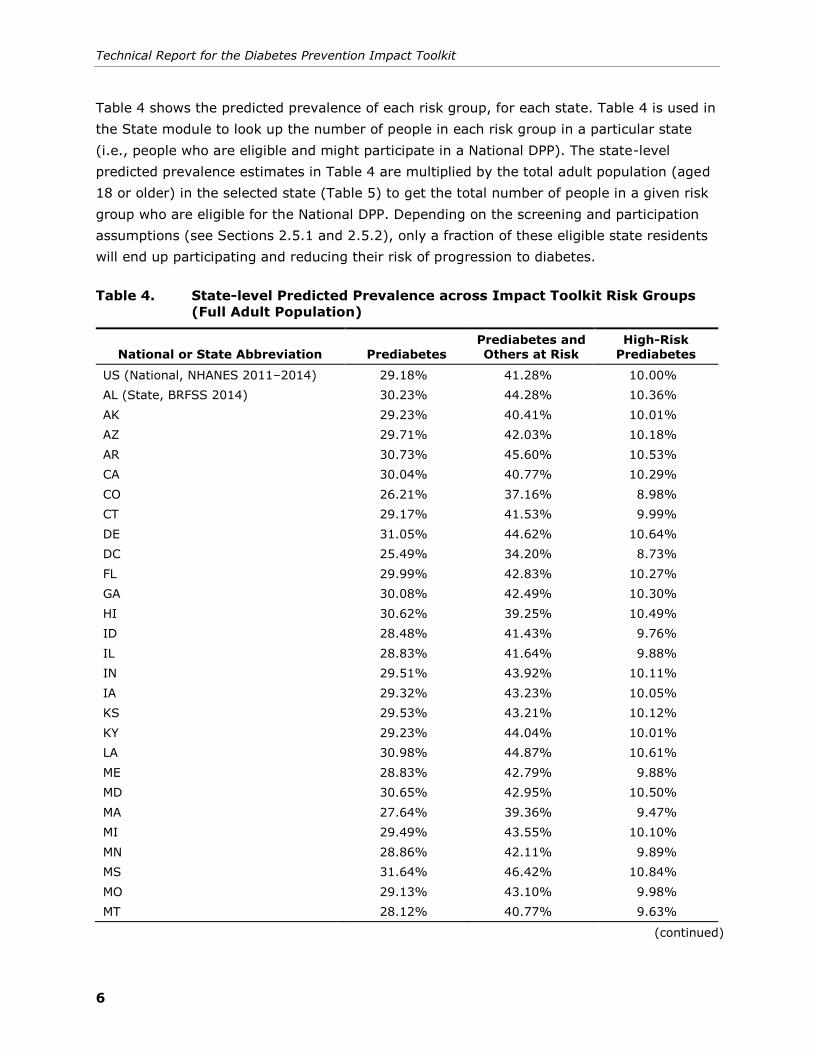
Table 4 shows the predicted prevalence of each risk group, for each state. Table 4 is used in
the State module to look up the number of people in each risk group in a particular state
(i.e., people who are eligible and might participate in a National DPP). The state-level
predicted prevalence estimates in Table 4 are multiplied by the total adult population (aged
18 or older) in the selected state (Table 5) to get the total number of people in a given risk
group who are eligible for the National DPP. Depending on the screening and participation
assumptions (see Sections 2.5.1 and 2.5.2), only a fraction of these eligible state residents
will end up participating and reducing their risk of progression to diabetes.
Table 4. State-level Predicted Prevalence across Impact Toolkit Risk Groups
(Full Adult Population)
National or State Abbreviation Prediabetes
Prediabetes and
Others at Risk
High-Risk
Prediabetes
US (National, NHANES 2011–2014) 29.18% 41.28% 10.00%
AL (State, BRFSS 2014) 30.23% 44.28% 10.36%
AK 29.23% 40.41% 10.01%
AZ 29.71% 42.03% 10.18%
AR 30.73% 45.60% 10.53%
CA 30.04% 40.77% 10.29%
CO 26.21% 37.16% 8.98%
CT 29.17% 41.53% 9.99%
DE 31.05% 44.62% 10.64%
DC 25.49% 34.20% 8.73%
FL 29.99% 42.83% 10.27%
GA 30.08% 42.49% 10.30%
HI 30.62% 39.25% 10.49%
ID 28.48% 41.43% 9.76%
IL 28.83% 41.64% 9.88%
IN 29.51% 43.92% 10.11%
IA 29.32% 43.23% 10.05%
KS 29.53% 43.21% 10.12%
KY 29.23% 44.04% 10.01%
LA 30.98% 44.87% 10.61%
ME 28.83% 42.79% 9.88%
MD 30.65% 42.95% 10.50%
MA 27.64% 39.36% 9.47%
MI 29.49% 43.55% 10.10%
MN 28.86% 42.11% 9.89%
MS 31.64% 46.42% 10.84%
MO 29.13% 43.10% 9.98%
MT 28.12% 40.77% 9.63%
(continued)

Technical Report for the Diabetes Prevention Impact Toolkit
7
Table 4. State-level Predicted Prevalence across Impact Toolkit Risk Groups
(Full Adult Population) (continued)
National or State Abbreviation Prediabetes Prediabetes and Others at Risk
High-Risk Prediabetes
NE 29.21% 42.78% 10.01%
NV 29.80% 42.26% 10.21%
NH 29.02% 42.53% 9.94%
NJ 30.58% 43.30% 10.48%
NM 30.55% 42.89% 10.46%
NY 29.48% 42.30% 10.10%
NC 30.22% 43.52% 10.35%
ND 29.66% 43.73% 10.16%
OH 29.91% 44.16% 10.25%
OK 30.42% 44.64% 10.42%
OR 28.40% 39.97% 9.73%
PA 29.71% 43.70% 10.18%
RI 28.91% 42.16% 9.90%
SC 30.40% 43.77% 10.41%
SD 28.99% 42.86% 9.93%
TN 30.02% 44.12% 10.28%
TX 31.25% 44.83% 10.71%
UT 25.81% 36.72% 8.84%
VT 27.29% 40.44% 9.35%
VA 29.41% 42.25% 10.08%
WA 29.37% 41.77% 10.06%
WV 30.50% 46.19% 10.45%
WI 29.91% 43.59% 10.25%
WY 28.48% 41.81% 9.76%
Table 5. National and State-Level Adult Population Estimates for Calculating
Risk Group Size (BRFSS 2014)
National or State Abbreviation National or State Population Estimatea
US 245,561,099
AL 3,739,646
AK 556,360
AZ 5,091,417
AR 2,266,396
CA 29,544,655
CO 4,115,447
(continued)

Technical Report for the Diabetes Prevention Impact Toolkit
8
Table 5. National and State-Level Adult Population Estimates for Calculating
Risk Group Size (BRFSS 2014) (continued)
National or State Abbreviation National or State Population Estimatea
CT 2,832,225
DE 730,755
DC 545,460
FL 15,832,660
GA 7,623,372
HI 1,112,388
ID 1,204,877
IL 9,888,842
IN 5,030,005
IA 2,386,030
KS 2,186,730
KY 3,402,842
LA 3,537,716
ME 1,068,811
MD 4,649,776
MA 5,365,728
MI 7,693,748
MN 4,191,574
MS 2,260,730
MO 4,673,556
MT 802,869
NE 1,417,407
NV 2,166,196
NH 1,061,487
NJ 6,949,942
NM 1,579,709
NY 15,519,718
NC 7,682,975
ND 583,766
OH 8,968,842
OK 2,944,523
OR 3,109,293
PA 10,099,122
RI 839,958
(continued)

Technical Report for the Diabetes Prevention Impact Toolkit
9
Table 5. National and State-Level Adult Population Estimates for Calculating
Risk Group Size (BRFSS 2014) (continued)
National or State Abbreviation National or State Population Estimatea
SC 3,749,025
SD 649,956
TN 5,067,014
TX 19,900,570
UT 2,068,310
VT 506,408
VA 6,499,147
WA 5,475,871
WV 1,474,021
WI 4,459,989
WY 453,235
a Weighted estimates from BRFSS 2014 (noninstitutionalized adult population aged 18 or older). National estimate is the sum of the state-level estimates.
In the State module, we used a table of the national and state-level adult population
(noninstitutionalized, as reported in BRFSS 2014) to estimate the number of people eligible
for a National DPP in each state. These population estimates are based on the survey-
weighted BRFSS 2014 population counts (see Table 5). The State module assumes that the
entire eligible state population is being offered the National DPP. Thus, population estimates
cannot be changed in the State module. However, in the Employer module (Section 2.2)
and Insurer module (Section 2.3), you can enter smaller or larger population sizes to
represent the approximate size of an employee population or insured adult population.
2.2 Employer Module Population Characteristics
Before selecting a radio button to designate your population’s characteristics, you will first
enter your population size (i.e., “Number of employees” in the Employer module). This
number should include all employees, not just those participating in the National DPP or
similar programs. The default number of employees is set to 1,000. Entering a number of
employees less than or equal to 11 (under the default settings) will lead to a result of 0
projected participants. Under the default settings, a minimum of 12 people are required to
get at least 1 participant. Having a low number of participants can lead to fractional results
such as 0.01 cases averted.
Once you have entered the total number of employees at a firm, you then will select a radio
button to determine the population characteristics of your employee population. There are
several predefined sets of population characteristics as well as an option to enter your own
employee population characteristics (age, race/ethnicity, sex, BMI). The proportion of the

Technical Report for the Diabetes Prevention Impact Toolkit
10
population that is eligible for the National DPP will be calculated using the set of population
characteristics defined here and a prediction equation estimated in NHANES (2011–2014).
When selecting one of the first four radio buttons for predefined sets of population
characteristics (“Assume national average for population characteristics” or “Assume state
average for population characteristics” or “Assume industry average for population
characteristics” or “Assume occupation average for population characteristics”) in the
Employer module, the Impact Toolkit references a lookup table of predicted prevalence
estimates for each of the risk groups eligible to participate in a National DPP. Sections 2.2.1
through 2.2.4 describe the data and methods underlying each set of predefined population
characteristics. The default risk group is set to “Persons with prediabetes” because the
American Diabetes Association (ADA) and other organizations recommend that persons with
prediabetes be referred to an intensive diet and physical activity behavioral counseling
program (ADA, 2016). The National DPP is an example of such a program. You can also
select a larger group (“Persons with prediabetes and other persons at risk for type 2
diabetes”), which has a slightly lower annual probability of developing diabetes, or a smaller
group (“Persons with high-risk prediabetes”), which has a higher probability of developing
diabetes. All three risk groups only include persons who are eligible for the National DPP
(BMI ≥ 24 kg/m2).
Unlike the first four radio button selections that use lookup tables, when you select the radio
button “Enter employee characteristics,” the predicted prevalence of each risk group is
calculated based on a prediction equation and other assumptions. See Section 2.2.5 for the
data and methods related to implementing the prediction equation when you enter your own
employee population characteristics.
2.2.1 Assume National Average for Population Characteristics
National average population characteristics in the Employer module are survey-weighted
estimates from the sample of U.S. employed persons in NHANES (2011–2014). National
estimates offered in the Employer module do not use a prediction equation to predict the
prevalence of “Persons with prediabetes” because their prediabetes status is obtained
directly from the results of the NHANES laboratory data (i.e., A1C or FPG test results). Thus,
we used the NHANES data (2011–2014) alone for the national selection in the employer
module, whereas state-level data are based on (1) the prediabetes prediction equation
estimated in NHANES (2011–2014) and (2) the state-level characteristics observed in
BRFSS (2014). See Section 2.1 and Tables 1 through 3 to see how the risk groups were
parsed from the national data.
2.2.2 Assume State Average for Population Characteristics
State estimates of the number of people in each risk group were estimated using the
methods described in Section 2.1. The only difference in the Employer module is that risk

Technical Report for the Diabetes Prevention Impact Toolkit
11
group estimates were generated for the sample of employed adults in BRFSS (2014).
Table 6 presents the predicted prevalence of each risk group, for each state’s population of
employed adults. This lookup table is used in the Employer module to estimate the number
of people in each risk group in a particular state’s employed population (i.e., people that are
eligible and might participate in a National DPP). The state predicted prevalence estimates
in Table 6 are multiplied by the “Number of Employees” (entered by the user) to get the
total number of people in a given risk group that are eligible for the National DPP.
Depending on your screening and participation assumptions (see Section 2.5.1 and 2.5.2),
only a fraction of these eligible employed adults will end up participating and reducing their
risk of progression to diabetes.
Table 6. State-level Predicted Prevalence across Impact Toolkit Risk Groups
(Adult Employed Population)
National or State Abbreviation Prediabetes
Prediabetes and Others at Risk
High Risk Prediabetes
US (National, NHANES) 26.95% 39.77% 9.23%
AL (State, BRFSS) 28.31% 40.95% 9.70%
AK 28.21% 38.50% 9.66%
AZ 27.76% 38.78% 9.51%
AR 29.35% 43.07% 10.06%
CA 29.26% 39.09% 10.02%
CO 25.11% 35.10% 8.60%
CT 28.40% 39.98% 9.73%
DE 29.61% 42.60% 10.14%
DC 22.27% 29.36% 7.63%
FL 28.06% 39.46% 9.61%
GA 28.94% 40.44% 9.92%
HI 30.55% 38.86% 10.47%
ID 27.19% 39.55% 9.32%
IL 27.59% 39.43% 9.45%
IN 27.92% 41.94% 9.56%
IA 27.63% 41.41% 9.47%
KS 28.35% 41.28% 9.71%
KY 26.61% 39.47% 9.12%
LA 29.63% 42.54% 10.15%
ME 26.99% 40.30% 9.25%
MD 29.90% 41.61% 10.24%
MA 26.45% 37.62% 9.06%
MI 27.30% 40.10% 9.35%
MN 27.32% 40.02% 9.36%
MS 30.40% 43.98% 10.42%
MO 27.40% 40.64% 9.39%

Technical Report for the Diabetes Prevention Impact Toolkit
12
National or State Abbreviation Prediabetes
Prediabetes and Others at Risk
High Risk Prediabetes
MT 26.42% 38.37% 9.05%
NE 27.91% 41.03% 9.56%
(continued)
Table 6. State-level Predicted Prevalence across Impact Toolkit Risk Groups
(Adult Employed Population) (continued)
National or State Abbreviation Prediabetes
Prediabetes and Others at Risk
High Risk Prediabetes
NV 28.68% 39.85% 9.83%
NH 27.43% 39.41% 9.40%
NJ 30.00% 42.33% 10.28%
NM 29.51% 41.09% 10.11%
NY 27.65% 39.36% 9.47%
NC 28.77% 40.72% 9.86%
ND 28.59% 42.61% 9.79%
OH 27.98% 41.00% 9.58%
OK 28.74% 41.61% 9.85%
OR 26.53% 36.41% 9.09%
PA 27.87% 41.18% 9.55%
RI 27.51% 39.72% 9.42%
SC 28.84% 41.00% 9.88%
SD 27.64% 40.93% 9.47%
TN 28.20% 39.83% 9.66%
TX 30.45% 43.36% 10.43%
UT 25.01% 35.40% 8.57%
VT 25.41% 37.58% 8.71%
VA 28.56% 40.58% 9.79%
WA 28.29% 39.80% 9.69%
WV 28.32% 42.59% 9.70%
WI 28.24% 41.51% 9.67%
WY 26.65% 39.02% 9.13%
2.2.3 Assume Industry Average for Population Characteristics
Industry characteristics are based on the sample of employed persons in NHANES (2011–
2014) and the relative rates of obesity across industries. Industries are defined in NHANES
using the U.S. Census Bureau’s 2002 Occupation and Industry coding system (U.S. Census,
2016). The U.S. Census Bureau defines industry as “the type of activity at a person’s place
of work.” To estimate the number of people in each risk group, we started by estimating a
baseline employed group using the mean values of each population characteristic (age, sex,
Technical Report for the Diabetes Prevention Impact Toolkit
13
race/ethnicity, and BMI) observed in NHANES (2011–2014) for employed adults. BMI was
modeled as a categorical variable with the following categories: normal weight, overweight,
and obese. Overweight was defined as a BMI 24.0–29.9 kg/m2 to match the National DPP
criteria. Obesity was defined as BMI ≥ 30 kg/m2.
An analysis of National Health Interview Survey (NHIS) data by Luckhaupt and colleagues
(2014) provided us with obesity prevalence ratios by industry. In other words, workers in
some industries have a higher risk of obesity than the average across all industries, and
Luckhaupt et al. quantified this in a prevalence ratio (controlling for sociodemographic
factors, such as age and race/ethnicity). If a particular industry has a prevalence ratio of
1.0, then people in that industry have the same risk of obesity as the average person across
all industries. Prevalence ratios greater than 1.0 signal a higher risk of obesity, whereas
prevalence ratios less than 1.0 signal a lower risk of obesity. We used these prevalence
ratios to inflate the percentage of people who are obese in a given industry according to the
prevalence ratio associated with that industry from Luckhaupt et al. (2014).
To implement this approach, we also had to assume that as the percentage of obesity
increased for a given industry population, the percentage overweight also increased, but to
a smaller degree. We made this assumption because more than three-quarters of the
employed population observed in NHANES (2011–2014) is overweight or obese, and some
prevalence ratios were large enough that allowing a one to one increase in the percentage
overweight (as the obesity percentage increases) led to a population with more than 100%
being overweight or obese. Thus, we used NHANES data to estimate the marginal effect of
the probability of obesity on the probability of overweight in the employed population (we
used an ordinary least squares approach for this estimate). We found that for every one
percentage point increase in the probability of being obese, there was a 0.63 percentage
point increase in the probability of being overweight.
Using the prediction equation for prediabetes, we estimated the probability of having
prediabetes for overweight employed people and for obese employed people. We used the
mean values for other characteristics included in the prediction equation (age, sex, and
race/ethnicity). The predicted probabilities of prediabetes for overweight people and obese
people were then combined according to their relative weights. For instance, in the baseline
employed group (prevalence ratio = 1.0), 33.9% of employed persons were obese and
41.6% were overweight (and the remaining 24.5% were normal weight or underweight). A
prediction of the probability of prediabetes was generated for the obese group and the
overweight group, and then these groups received weights of 33.9% and 41.6%,
respectively. We did not calculate a probability of prediabetes for the 24.5% of the
population that was assumed to be normal weight because they are not eligible for the
National DPP. They effectively have a probability of 0.

Technical Report for the Diabetes Prevention Impact Toolkit
14
The steps described above help us calculate the predicted prevalence of “Persons with
prediabetes” (and BMI ≥ 24 kg/m2), but do not help us calculate the larger risk group
“Persons with prediabetes and other persons at risk for type 2 diabetes” and the smaller risk
group “Persons with high-risk prediabetes.” To calculate the “Persons with prediabetes and
other persons at risk for type 2 diabetes” group, we assumed that this larger group was
about 1.5 times as large as the “Persons with prediabetes” group that was estimated for
each industry using the methods above. We assumed that this relationship was 1.48 based
on a comparison of the “Persons with prediabetes” group and the “Persons with prediabetes
and other persons at risk for type 2 diabetes” group in the NHANES data (2011–2014)
among employed people. Similarly, we assumed that the smaller risk group (“Persons with
high-risk prediabetes”) was 0.34 times the size of the “Persons with prediabetes” group
based on the relationship between these groups observed in the NHANES data (2011–2014)
among employed people. The resulting predicted prevalence of each risk group is shown in
Table 7.
Table 7. Industry Group Predicted Prevalence across Impact Toolkit Risk
Groups
Industry Group Prediabetes
Prediabetes
and Others at Risk
High Risk
Prediabetes
Agriculture, forestry, fishing, and hunting 29.06% 43.01% 9.96%
Mining 31.80% 47.07% 10.90%
Utilities 27.46% 40.64% 9.41%
Construction 29.06% 43.01% 9.96%
Manufacturing 29.75% 44.02% 10.19%
Wholesale trade 26.55% 39.29% 9.10%
Retail trade 27.69% 40.98% 9.49%
Transportation and warehousing 30.20% 44.70% 10.35%
Information 32.94% 48.76% 11.29%
Finance and insurance 27.92% 41.32% 9.56%
Real estate, rental and leasing 22.21% 32.87% 7.61%
Professional, scientific, and technical services 26.32% 38.95% 9.02%
Management of companies and enterprises 29.29% 43.35% 10.03%
Administrative, support, waste management,
and remediation services
29.06% 43.01% 9.96%
Education services 30.66% 45.38% 10.50%
Healthcare and social assistance 33.40% 49.43% 11.44%
Arts, entertainment, and recreation 24.04% 35.57% 8.23%
Accommodation and food services 26.09% 38.61% 8.94%
Other services (except public administration) 26.32% 38.95% 9.02%
Technical Report for the Diabetes Prevention Impact Toolkit
15
Industry Group Prediabetes
Prediabetes and Others
at Risk High Risk
Prediabetes
Public administration 35.46% 52.48% 12.15%
Note: Industry groups are defined by the U.S. Census Bureau’s 2002 Indexes of Industry and Occupation (U.S. Census, 2016).
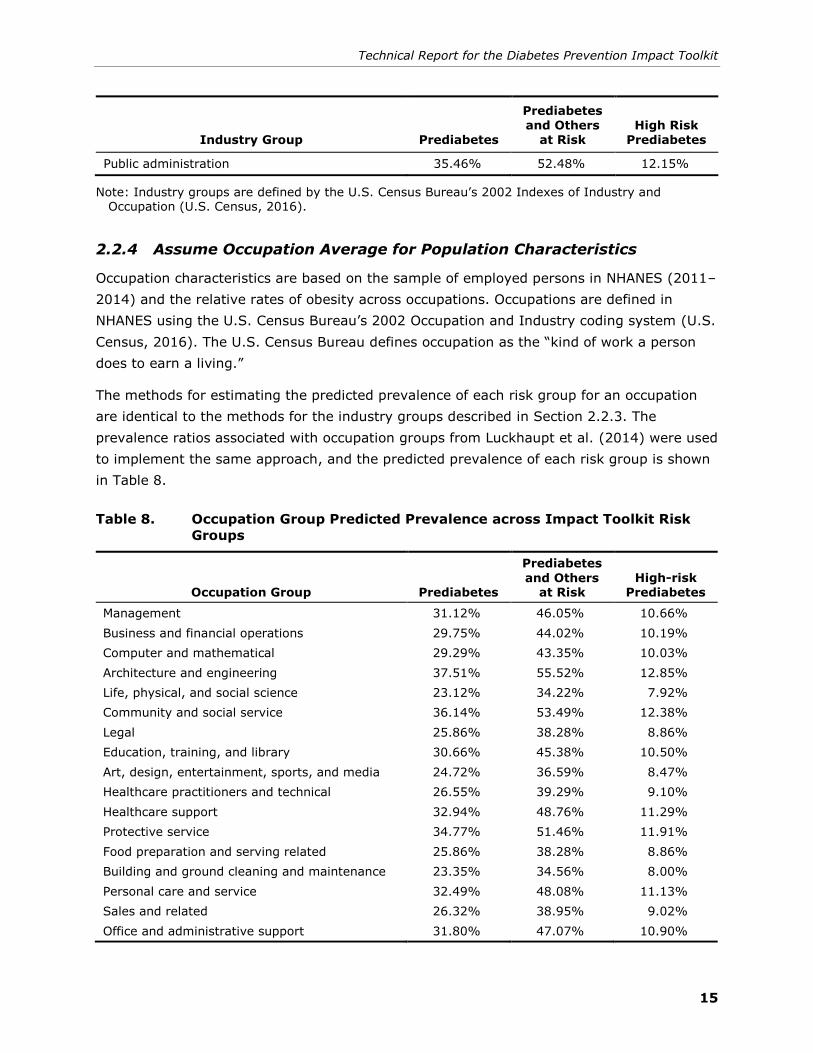
2.2.4 Assume Occupation Average for Population Characteristics
Occupation characteristics are based on the sample of employed persons in NHANES (2011–
2014) and the relative rates of obesity across occupations. Occupations are defined in
NHANES using the U.S. Census Bureau’s 2002 Occupation and Industry coding system (U.S.
Census, 2016). The U.S. Census Bureau defines occupation as the “kind of work a person
does to earn a living.”
The methods for estimating the predicted prevalence of each risk group for an occupation
are identical to the methods for the industry groups described in Section 2.2.3. The
prevalence ratios associated with occupation groups from Luckhaupt et al. (2014) were used
to implement the same approach, and the predicted prevalence of each risk group is shown
in Table 8.
Table 8. Occupation Group Predicted Prevalence across Impact Toolkit Risk
Groups
Occupation Group Prediabetes
Prediabetes
and Others at Risk
High-risk Prediabetes
Management 31.12% 46.05% 10.66%
Business and financial operations 29.75% 44.02% 10.19%
Computer and mathematical 29.29% 43.35% 10.03%
Architecture and engineering 37.51% 55.52% 12.85%
Life, physical, and social science 23.12% 34.22% 7.92%
Community and social service 36.14% 53.49% 12.38%
Legal 25.86% 38.28% 8.86%
Education, training, and library 30.66% 45.38% 10.50%
Art, design, entertainment, sports, and media 24.72% 36.59% 8.47%
Healthcare practitioners and technical 26.55% 39.29% 9.10%
Healthcare support 32.94% 48.76% 11.29%
Protective service 34.77% 51.46% 11.91%
Food preparation and serving related 25.86% 38.28% 8.86%
Building and ground cleaning and maintenance 23.35% 34.56% 8.00%
Personal care and service 32.49% 48.08% 11.13%
Sales and related 26.32% 38.95% 9.02%
Office and administrative support 31.80% 47.07% 10.90%

Technical Report for the Diabetes Prevention Impact Toolkit
16
Occupation Group Prediabetes
Prediabetes
and Others at Risk
High-risk Prediabetes
Farming, fishing, and forestry 29.52% 43.69% 10.11%
Construction and extraction 26.55% 39.29% 9.10%
Installation, maintenance, and repair 27.46% 40.64% 9.41%
Production 28.83% 42.67% 9.88%
Transportation and material moving 30.66% 45.38% 10.50%
Note: Occupation groups are defined by the U.S. Census Bureau’s 2002 Indexes of Industry and Occupation (U.S. Census, 2016).
2.2.5 Entering Employee Population Characteristics
For customized results based on your organization’s unique population characteristics, select
the “Enter employee characteristics” option. When this option is selected, you will see that
the fields for each characteristic have already been filled with default values. These default
values reflect national averages for the employed population in the United States. You can
change these to reflect your own employee population characteristics. If you want to return
to the default values at any point, click the “RESTORE DEFAULTS” link in the upper right-
hand corner. This button will clear all of the data that you have entered and restore the
default data.
The values entered in the employee characteristics fields are used to predict the percentage
of employees in each risk group (see Section 2.4 for more information on the risk groups).
The first step to predicting each of the risk groups is to predict the prevalence of the
primary risk group, “Persons with prediabetes.” The other two risk groups are predicted
indirectly, using multipliers to inflate or deflate the prediction for “Persons with prediabetes”
based on the relative size of the other two risk groups observed in NHANES data (2011–
2014). To predict the percentage of employees with prediabetes, we estimated an ordered
logistic regression model NHANES (2011–2014) to account for other diabetes-related
outcomes, including normal glucose, prediabetes, undiagnosed diabetes, and diagnosed
diabetes. The model included independent variables for age, sex, race/ethnicity, and BMI.
BMI was modeled as a categorical variable with the following categories: normal weight,
overweight, and obese. Overweight was defined as a BMI 24.0–29.9 kg/m2 to match the
National DPP criteria. Obesity was defined as BMI ≥ 30 kg/m2.
To limit the burden of data collection and data entry on the user, we developed an ad hoc
method to apply this prediction model using the set of population characteristic averages
entered by the user. Instead of asking the user to provide a person-level dataset of their
employee population, we generated a predicted prevalence of “Persons with prediabetes”
based on the characteristic averages with special emphasis on two key predictive variables:
overweight and obesity status. Using the prediction model for prediabetes, we estimated
two separate predicted prevalence estimates of “Persons with prediabetes”: one for

Technical Report for the Diabetes Prevention Impact Toolkit
17
overweight persons and another for obese persons. These two predicted prevalence
estimates are combined in a weighted average to estimate the predicted prevalence of
“Persons with prediabetes” in your employee population. We did not calculate a predicted
prevalence of “Persons with prediabetes” for the proportion of the population that is normal
weight because they are not eligible for the National DPP. They effectively have a probability
of 0.
The following example illustrates this method. Using the default employee population
characteristics in the Employer module (age, sex, and race/ethnicity), we predicted the
prevalence of “Persons with prediabetes” for overweight and obese persons separately. The
predicted prevalence of “Persons with prediabetes” for each BMI group was then combined
according to their relative proportions in the employee population. In the default employee
population characteristics, 33.9% of employed persons were obese, and 41.6% were
overweight (and 24.5% were normal weight, which effectively have a probability of 0). A
weighted average predicted prevalence of “Persons with prediabetes” was calculated based
on these weights and represents the proportion of your employee population that is
predicted to have prediabetes and BMI ≥ 24 kg/m2.
The steps described above give us the predicted prevalence of “Persons with prediabetes”
(and BMI ≥ 24 kg/m2). Refer to the last paragraph in Section 2.2.3 for more information on
how we calculated the larger risk group “Persons with prediabetes and other persons at risk
for type 2 diabetes” and the smaller risk group “Persons with high-risk prediabetes” using
the relative size of these risk groups in NHANES (2011–2014).
2.3 Insurer Module Population Characteristics
Before selecting a radio button to designate your population’s characteristics, you will first
enter your population size (i.e., “Number of Adults Insured” in the Insurer module). This
number should include all privately insured adults, not just those participating in the
prevention program. The default number of privately insured adults is set to 1,000.
Once you have entered the total number of privately insured adults in your population, you
will then select a radio button to determine the population characteristics of your
population. There are several predefined sets of population characteristics as well as an
option to enter your own privately insured adult population characteristics (age,
race/ethnicity, sex, BMI). The proportion of the population that is eligible for the National
DPP will be calculated using the set of population characteristics defined here and a
prediction equation estimated in NHANES (2011–2014).
When selecting one of the first four radio buttons (“Assume national average for population
characteristics” or “Assume state average for population characteristics” or “Assume
industry average for population characteristics” or “Assume occupation average for
population characteristics”) in the Insurer module, the Impact Toolkit references a lookup
Technical Report for the Diabetes Prevention Impact Toolkit
18
table of predicted prevalence estimates for each of the risk groups eligible to participate in a
National DPP. Sections 2.3.1 through 2.3.4 describe the data and methods underlying each
set of predefined population characteristics. The default risk group is set to “Persons with
Prediabetes.” because the American Diabetes Association (ADA) and other organizations
recommend that persons with prediabetes be referred to an intensive diet and physical
activity behavioral counseling program (ADA, 2016). The National DPP is an example of
such a program. You can also select a larger group (“Persons with prediabetes and other
persons at risk for type 2 diabetes”), which has a slightly lower annual probability of
developing diabetes, or a smaller group (“Persons with high-risk prediabetes”), which has a
higher annual probability of developing diabetes. All three risk groups only include persons
who are eligible for the National DPP (BMI ≥ 24 kg/m2).
Unlike the first four radio button selections that use lookup tables, when you select the radio
button “Enter insured adult population characteristics,” the predicted prevalence of each risk
group is calculated based on a prediction equation and other assumptions. See Section
2.3.5 for the data and methods related to implementing the prediction equation when you
enter your own privately insured adult population characteristics.
2.3.1 Assume National Average for Population Characteristics
National average population characteristics in the Insurer module are survey-weighted
estimates from the sample of U.S. privately insured persons in NHANES (2011–2014).
National estimates offered in the Insurer module do not use a prediction equation to predict
the prevalence of “Persons with prediabetes” because their prediabetes status is obtained
directly from the results of the NHANES laboratory data (i.e., A1C or FPG test results). Thus,
we used the observed NHANES data (2011–2014) alone for the national selection in the
Insurer module, whereas state-level data are based on (1) the prediabetes prediction
equation estimated in NHANES (2011–2014) and (2) the state-level characteristics among
privately insured persons in BRFSS (2014). See Section 2.1 and Tables 1 through 3 to see
how the risk groups were parsed from the national data.
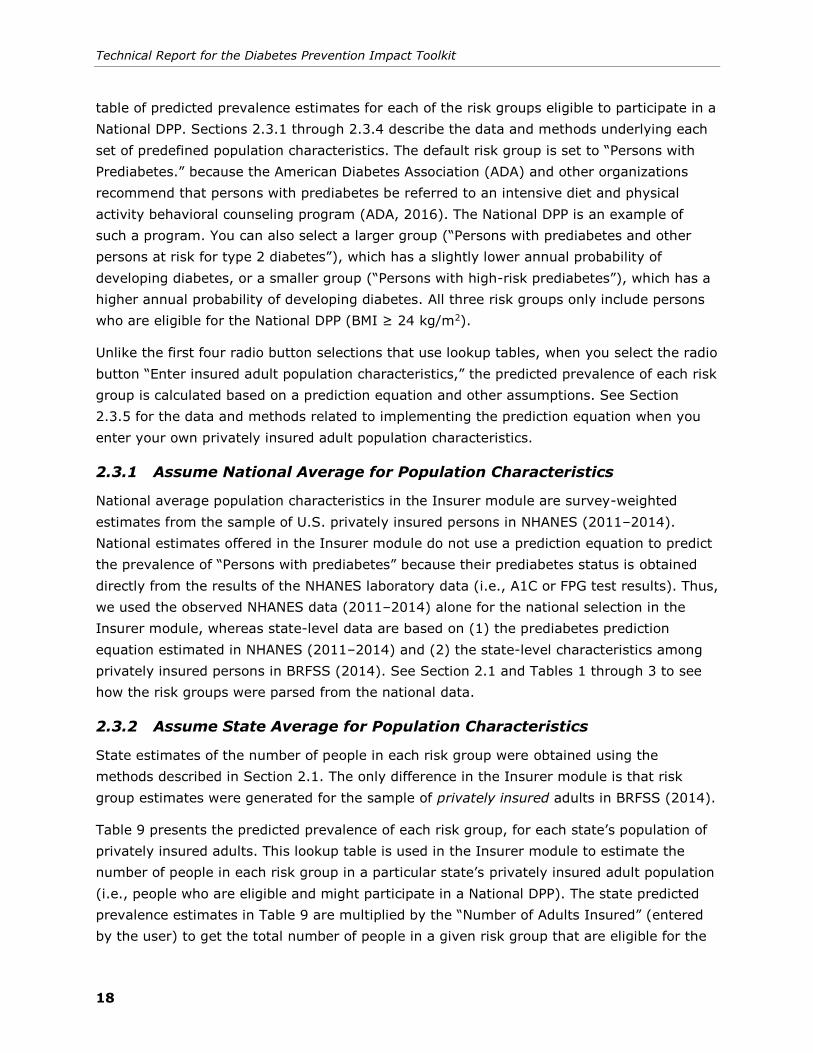
2.3.2 Assume State Average for Population Characteristics
State estimates of the number of people in each risk group were obtained using the
methods described in Section 2.1. The only difference in the Insurer module is that risk
group estimates were generated for the sample of privately insured adults in BRFSS (2014).
Table 9 presents the predicted prevalence of each risk group, for each state’s population of
privately insured adults. This lookup table is used in the Insurer module to estimate the
number of people in each risk group in a particular state’s privately insured adult population
(i.e., people who are eligible and might participate in a National DPP). The state predicted
prevalence estimates in Table 9 are multiplied by the “Number of Adults Insured” (entered
by the user) to get the total number of people in a given risk group that are eligible for the
Technical Report for the Diabetes Prevention Impact Toolkit
19
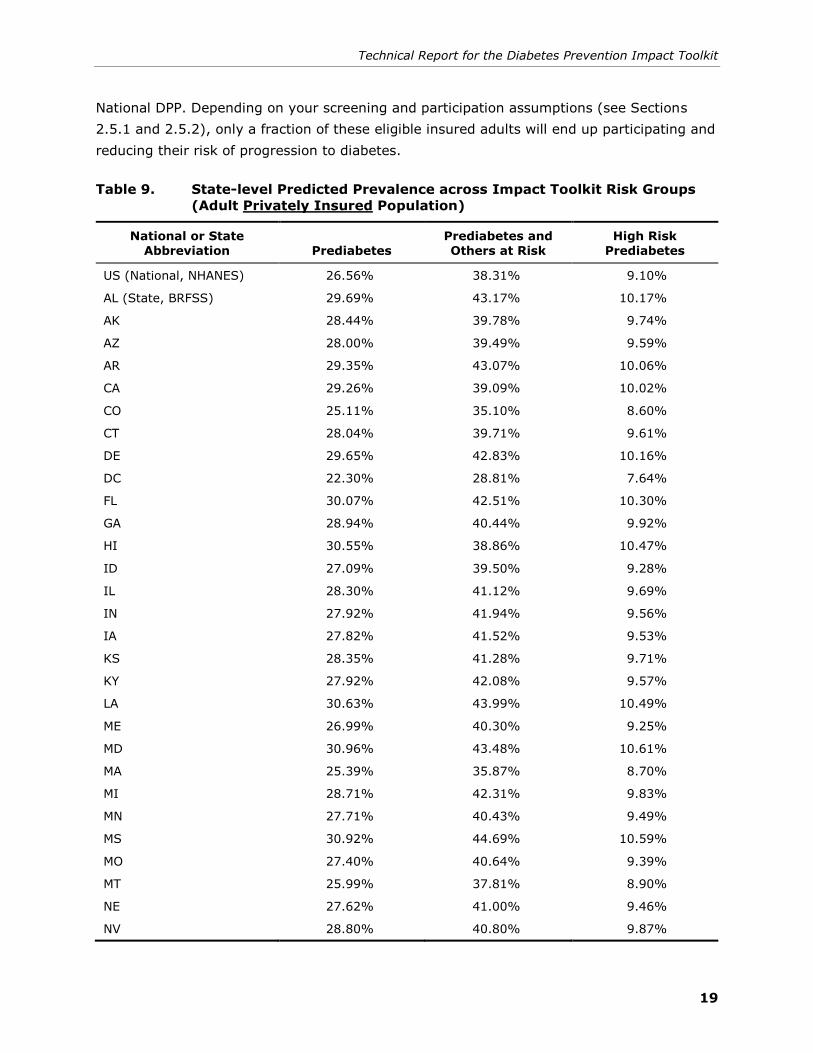
National DPP. Depending on your screening and participation assumptions (see Sections
2.5.1 and 2.5.2), only a fraction of these eligible insured adults will end up participating and
reducing their risk of progression to diabetes.
Table 9. State-level Predicted Prevalence across Impact Toolkit Risk Groups
(Adult Privately Insured Population)
National or State
Abbreviation Prediabetes
Prediabetes and
Others at Risk
High Risk
Prediabetes
US (National, NHANES) 26.56% 38.31% 9.10%
AL (State, BRFSS) 29.69% 43.17% 10.17%
AK 28.44% 39.78% 9.74%
AZ 28.00% 39.49% 9.59%
AR 29.35% 43.07% 10.06%
CA 29.26% 39.09% 10.02%
CO 25.11% 35.10% 8.60%
CT 28.04% 39.71% 9.61%
DE 29.65% 42.83% 10.16%
DC 22.30% 28.81% 7.64%
FL 30.07% 42.51% 10.30%
GA 28.94% 40.44% 9.92%
HI 30.55% 38.86% 10.47%
ID 27.09% 39.50% 9.28%
IL 28.30% 41.12% 9.69%
IN 27.92% 41.94% 9.56%
IA 27.82% 41.52% 9.53%
KS 28.35% 41.28% 9.71%
KY 27.92% 42.08% 9.57%
LA 30.63% 43.99% 10.49%
ME 26.99% 40.30% 9.25%
MD 30.96% 43.48% 10.61%
MA 25.39% 35.87% 8.70%
MI 28.71% 42.31% 9.83%
MN 27.71% 40.43% 9.49%
MS 30.92% 44.69% 10.59%
MO 27.40% 40.64% 9.39%
MT 25.99% 37.81% 8.90%
NE 27.62% 41.00% 9.46%
NV 28.80% 40.80% 9.87%

Technical Report for the Diabetes Prevention Impact Toolkit
20
National or State Abbreviation Prediabetes
Prediabetes and Others at Risk
High Risk Prediabetes
NH 27.79% 40.52% 9.52%
NJ 29.67% 42.05% 10.16%
NM 29.28% 41.19% 10.03%
(continued)
Table 9. State-level Predicted Prevalence across Impact Toolkit Risk Groups
(Adult Privately Insured Population) (continued)
National or State
Abbreviation Prediabetes
Prediabetes and
Others at Risk
High Risk
Prediabetes
NY 29.25% 42.06% 10.02%
NC 29.17% 41.87% 9.99%
ND 28.20% 42.21% 9.66%
OH 29.06% 42.96% 9.96%
OK 28.74% 41.61% 9.85%
OR 27.49% 38.58% 9.42%
PA 28.98% 42.91% 9.93%
RI 28.03% 41.01% 9.60%
SC 29.86% 42.81% 10.23%
SD 27.64% 40.93% 9.47%
TN 30.63% 44.24% 10.49%
TX 30.45% 43.36% 10.43%
UT 24.65% 34.99% 8.44%
VT 25.57% 37.79% 8.76%
VA 28.97% 41.11% 9.93%
WA 28.35% 40.43% 9.71%
WV 29.84% 45.41% 10.22%
WI 28.47% 41.83% 9.75%
WY 26.65% 39.02% 9.13%
2.3.3 Assume Industry Average for Population Characteristics
Industry characteristics in the Insurer module are based on the sample of employed persons
in NHANES (2011–2014) and the relative rates of obesity across industries. We used the
sample of employed persons for this selection in the Insurer module because insured adults
who work in a particular industry are employed by definition. Industries are defined in
NHANES using the U.S. Census Bureau’s 2002 Occupation and Industry coding system.

Technical Report for the Diabetes Prevention Impact Toolkit
21
The methods for estimating the predicted prevalence of each risk group for an industry are
identical to the methods described in Section 2.2.3. The predicted prevalence of each risk
group by industry is shown in Table 7.
2.3.4 Assume Occupation Average for Population Characteristics
Occupation characteristics in the Insurer module are based on the sample of employed
persons in NHANES (2011–2014) and the relative rates of obesity across occupations. We
used the sample of employed persons for this selection in the Insurer module because
insured adults who work in a particular occupation are employed by definition. Occupations
are defined in NHANES using the U.S. Census Bureau’s 2002 Occupation and Industry
coding system.
The methods for estimating the predicted prevalence of each risk group for an industry are
identical to the methods described in Section 2.2.4. The predicted prevalence of each risk
group by occupation is shown in Table 8.
2.3.5 Entering Insured Population Characteristics
For customized results based on your unique insured population’s characteristics, select the
“Enter insured adult population characteristics” option. When this option is selected, you will
see that the fields for each characteristic have already been filled with default values. These
default values reflect national averages for the privately insured adult population in the
United States. You can change these to reflect your own privately insured adult population
characteristics. If you want to return to the default values at any point, click the “RESTORE
DEFAULTS” link in the upper right-hand corner. This button will clear all of the data that you
have entered and restore the default data.
The values entered in the insured adult population characteristics fields are used to predict
the percentage of insured adults in each risk group. The methods for generating the
predicted prevalence of each risk group are identical to the methods described in Section
2.2.5 for the Employer module. The resulting predicted prevalence of the risk group you
select will be reported in the Output Dashboard.
2.4 Diabetes Incidence Rates for Each Risk Group
Defining the population characteristics allows prediction of the prevalence of each risk group
at the state, employee, and privately insured adult population level. Using the radio buttons
under the “Risk Group to Participate in Program” heading, you can select from the three risk
groups eligible for the National DPP (“Persons with prediabetes,” “Persons with prediabetes
and other persons at risk for type 2 diabetes,” and “Persons with high-risk prediabetes” [see
Sections 2.4.1, 2.4.2, and 2.4.3, respectively]). The annual probability of developing
diabetes is different for each risk group. The default annual probability for each risk group is
prepopulated in the input box. You can change this number if you would like to assume a

Technical Report for the Diabetes Prevention Impact Toolkit
22
higher or lower probability of diabetes. We recommend using the default annual
probabilities of diabetes unless you have generated inputs from your own data sources or
identified updated data available in the scientific literature.
We determined the diabetes incidence rates for each risk group using two key sources:
(1) Selvin et al.’s (2010) analysis of Atherosclerosis Risk in Communities study (ARIC) data
and (2) a systematic review of annual diabetes probabilities (in the prediabetes range) by
Zhang and colleagues (2010). We calculated a weighted average incidence across the A1C
categories presented by Selvin et al. and Zhang et al (Table 10, green cells). The Zhang et
al. review included studies with a combined sample size roughly 4 times larger than Selvin
et al.’s ARIC sample. Thus, the Zhang et al. review received a weight of about 80%, and the
Selvin et al. analysis received a weight of about 20%.
Table 10. Annual Incidence Probability of Diabetes by A1c Category
Source Total N <5.0% 5.0–5.5% 5.5–5.9% 6.0–6.4%
Selvin et al. (2010) 11,092 0.0046 0.0087 0.0166 0.0399
Zhang et al. (2010) 44,203 0.0030 0.0105 0.0340 0.0725
Weighted average 55,295 0.0033 0.0101 0.0305 0.0660
Rounded (%) 55,295 0.3% 1.0% 3.1% 6.6%
Unweighted average 55,295 0.0038 0.0096 0.0253 0.0562
Rounded (%) 55,295 0.4% 1.0% 2.5% 5.6%
Note: Weighted average was calculated based on the relative sample sizes of each study (see Total N
column). We calculated the midpoint of the annualized incidence probabilities presented in Zhang et al. (2010) (see Table 11).
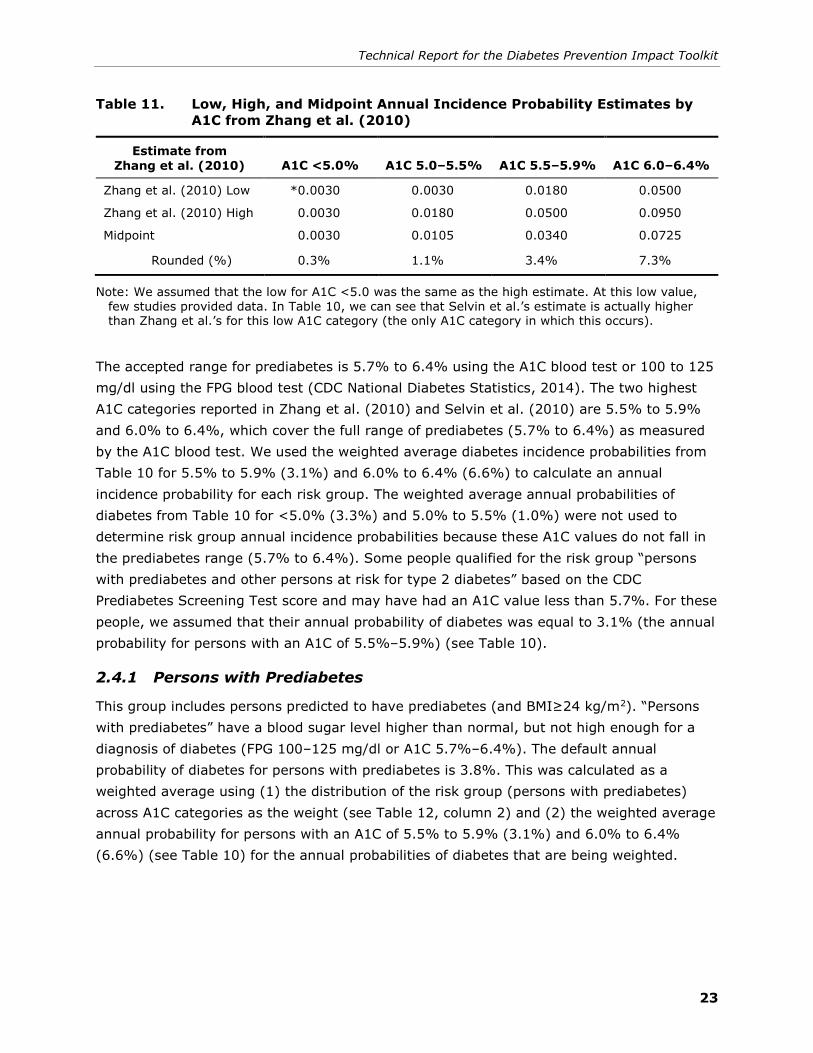
We used the midpoint of the low and high estimates (Table 11) reported for each A1C
category in the Zhang et al. (2010) review. The average age was slightly older in Selvin et
al. (2010) (56.7) than in Zhang et al. (2010) (53.4), and the race/ethnicity makeup differed
substantially. Several studies in Zhang et al. (2010) were from Asian and American Indian
populations, which were not well represented in Selvin et al.’s ARIC sample (U.S.
population, 78% white, 22% black). From the data in Selvin et al. (2010) and Zhang et al.
(2010), we determined that a plausible range for annual diabetes incidence was 1% to 7%
for these National DPP eligible risk groups. Just under the “Annual Probability of Diabetes”
entry field in the Impact Toolkit, we state this recommended range. Using values outside of
this range may lead to results with low credibility.
Technical Report for the Diabetes Prevention Impact Toolkit
23
Table 11. Low, High, and Midpoint Annual Incidence Probability Estimates by
A1C from Zhang et al. (2010)
Estimate from
Zhang et al. (2010) A1C <5.0% A1C 5.0–5.5% A1C 5.5–5.9% A1C 6.0–6.4%
Zhang et al. (2010) Low *0.0030 0.0030 0.0180 0.0500
Zhang et al. (2010) High 0.0030 0.0180 0.0500 0.0950
Midpoint 0.0030 0.0105 0.0340 0.0725
Rounded (%) 0.3% 1.1% 3.4% 7.3%
Note: We assumed that the low for A1C <5.0 was the same as the high estimate. At this low value, few studies provided data. In Table 10, we can see that Selvin et al.’s estimate is actually higher than Zhang et al.’s for this low A1C category (the only A1C category in which this occurs).
The accepted range for prediabetes is 5.7% to 6.4% using the A1C blood test or 100 to 125
mg/dl using the FPG blood test (CDC National Diabetes Statistics, 2014). The two highest
A1C categories reported in Zhang et al. (2010) and Selvin et al. (2010) are 5.5% to 5.9%
and 6.0% to 6.4%, which cover the full range of prediabetes (5.7% to 6.4%) as measured
by the A1C blood test. We used the weighted average diabetes incidence probabilities from
Table 10 for 5.5% to 5.9% (3.1%) and 6.0% to 6.4% (6.6%) to calculate an annual
incidence probability for each risk group. The weighted average annual probabilities of
diabetes from Table 10 for <5.0% (3.3%) and 5.0% to 5.5% (1.0%) were not used to
determine risk group annual incidence probabilities because these A1C values do not fall in
the prediabetes range (5.7% to 6.4%). Some people qualified for the risk group “persons
with prediabetes and other persons at risk for type 2 diabetes” based on the CDC
Prediabetes Screening Test score and may have had an A1C value less than 5.7%. For these
people, we assumed that their annual probability of diabetes was equal to 3.1% (the annual
probability for persons with an A1C of 5.5%–5.9%) (see Table 10).
2.4.1 Persons with Prediabetes
This group includes persons predicted to have prediabetes (and BMI≥24 kg/m2). “Persons
with prediabetes” have a blood sugar level higher than normal, but not high enough for a
diagnosis of diabetes (FPG 100–125 mg/dl or A1C 5.7%–6.4%). The default annual
probability of diabetes for persons with prediabetes is 3.8%. This was calculated as a
weighted average using (1) the distribution of the risk group (persons with prediabetes)
across A1C categories as the weight (see Table 12, column 2) and (2) the weighted average
annual probability for persons with an A1C of 5.5% to 5.9% (3.1%) and 6.0% to 6.4%
(6.6%) (see Table 10) for the annual probabilities of diabetes that are being weighted.

Technical Report for the Diabetes Prevention Impact Toolkit
24
Table 12. Persons with Prediabetes: Calculation of a Weighted Average Annual
Probability of Diabetes by A1C Category
A1C
Categories
Distribution of Risk
Group Across A1C Categories
Weighted
Average Annual Probability
Annual Probabilities Weighted
by A1C Category
<5.7%–5.9%a 79.8% 3.1% 2.4%
6.0%–6.4% 20.2% 6.6% 1.3%
Sum of Weighted Probabilities: 3.8%
Note: The distribution of the “Persons with prediabetes” risk group across A1C categories is based on
a survey-weighted estimate from NHANES (2011–2014) for national estimates. The “Sum of Weighted Probabilities” is 3.8% (and not 3.7%) due to rounding of the weighted probabilities for each A1C category.
a Some people qualified as having prediabetes based on their FPG test results, but had an A1C < 5.7%.
2.4.2 Persons with Prediabetes and Other Persons at Risk for Type 2 Diabetes
This is the largest group, as it includes all “Persons with prediabetes” and “other persons at
risk for type 2 diabetes.” This group is generally about 1.5 times larger than the risk group
“persons with prediabetes.” To enlarge the “persons with prediabetes” risk group, we
identified the additional people in the“…other persons at risk for type 2 diabetes” group
using criteria from the CDC Prediabetes Screening Test (CDC, 2015b). A score of 9 or higher
on the Prediabetes Screening Test determines whether a person is at risk for diabetes. See
Section 2.1 for a description of these risk groups and how they were calculated in the State
module (some slight differences in methods are noted in Sections 2.2 and 2.3 for the
Employer module and Insurer module, respectively). Because this group includes a broader
range of persons at risk for diabetes, the default annual probability of diabetes is slightly
lower at 3.6%. This probability was calculated as a weighted average using (1) the
distribution of the risk group (“persons with prediabetes and other persons at risk for type 2
diabetes”) across A1C categories as the weight (see Table 13, column 2) and (2) the
weighted average annual probability for persons with an A1C of 5.5%–5.9% (3.1%) and
6.0%–6.4% (6.6%) (see Table 10) for the annual probabilities of diabetes that are being
weighted.
Table 13. Persons with Prediabetes and Other Persons at Risk for Type 2
Diabetes: Calculation of a Weighted Average Annual Probability of
Diabetes by A1C Category
A1C Categories
Distribution of Risk Group Across A1C
Categories
Weighted Average Annual
Probability Annual Probabilities Weighted
by A1C Category
<5.5%–5.9%a 85.7% 3.1% 2.6%
6.0%–6.4% 14.3% 6.6% 0.9%

Technical Report for the Diabetes Prevention Impact Toolkit
25
A1C Categories
Distribution of Risk Group Across A1C
Categories
Weighted Average Annual
Probability Annual Probabilities Weighted
by A1C Category
Sum of Weighted Probabilities: 3.6%
Notes: The distribution of the “Persons with prediabetes and other persons at risk for type 2 diabetes” group across A1C categories is based on a survey-weighted estimate from NHANES (2011–2014).
The “Sum of Weighted Probabilities” is 3.6% (and not 3.5%) due to rounding of the weighted probabilities for each A1C category.
a Some people qualified for the risk group “persons with prediabetes and other persons at risk for type 2 diabetes” based on the CDC Prediabetes Screening Test score and may have had an A1C value less than 5.7%. For these people, we assumed that their annual probability of diabetes was equal to 3.1% (the annual probability for persons with an A1C of 5.5%–5.9%) (see Table 10).
2.4.3 Persons with High-Risk Prediabetes
This group is a subset of the group with prediabetes. This group is the smallest (about 34%
of the prediabetes group), but it represents those with the highest risk of progressing to
diabetes. “Persons with high-risk prediabetes” are defined as persons with an A1C between
6.0% and 6.4% or an FPG between 110 and 125 mg/dl and they have a default annual
probability of diabetes of 6.2%. This definition of “Persons with high-risk prediabetes” was
chosen because the annual risk of developing diabetes was higher for persons with an A1C
between 6.0% and 6.4% (Selvin et al., 2010) or an FPG between 110 and 125 mg/dl
(Nichols et al., 2010), compared to persons with lower A1C and FPG values that are still in
the prediabetes range.
This annual probability was determined by taking a weighted average of two annual
probabilities. In NHANES (2011–2014), we found that about 20% of persons with
prediabetes would qualify as having “high-risk prediabetes” under the A1C criteria alone
(6.0%–6.4%). We assumed that this group had an annual probability of diabetes equal to
6.6% (see Table 10). When we added in the FPG criteria (110–125 mg/dl), the predicted
prevalence of persons with high-risk prediabetes, among “Persons with prediabetes”
increased from 20% to 34%. We assumed that the incremental persons qualifying as high-
risk under the FPG criteria had a somewhat lower annual probability of diabetes based on
the annual probability reported in Nichols et al. (2010) (5.6%) for persons with an FPG
110–125 mg/dl. The persons qualifying under the A1C criteria (with an associated annual
probability of 6.6%) and the incremental persons qualifying under the FPG criteria (with an
associated probability of 5.6%) were combined in a weighted average of roughly 60% and
40%, respectively. These weights are based on the proportion diagnosed with A1C criteria
and the incremental proportion diagnosed with FPG criteria. The resulting annual probability
for persons with high-risk prediabetes was 6.2%.

Technical Report for the Diabetes Prevention Impact Toolkit
26
2.5 Additional Impact Toolkit Inputs
After selecting your population characteristics and risk group, you can customize additional
inputs by clicking on the “CUSTOMIZE FURTHER” button just above the “GET RESULTS”
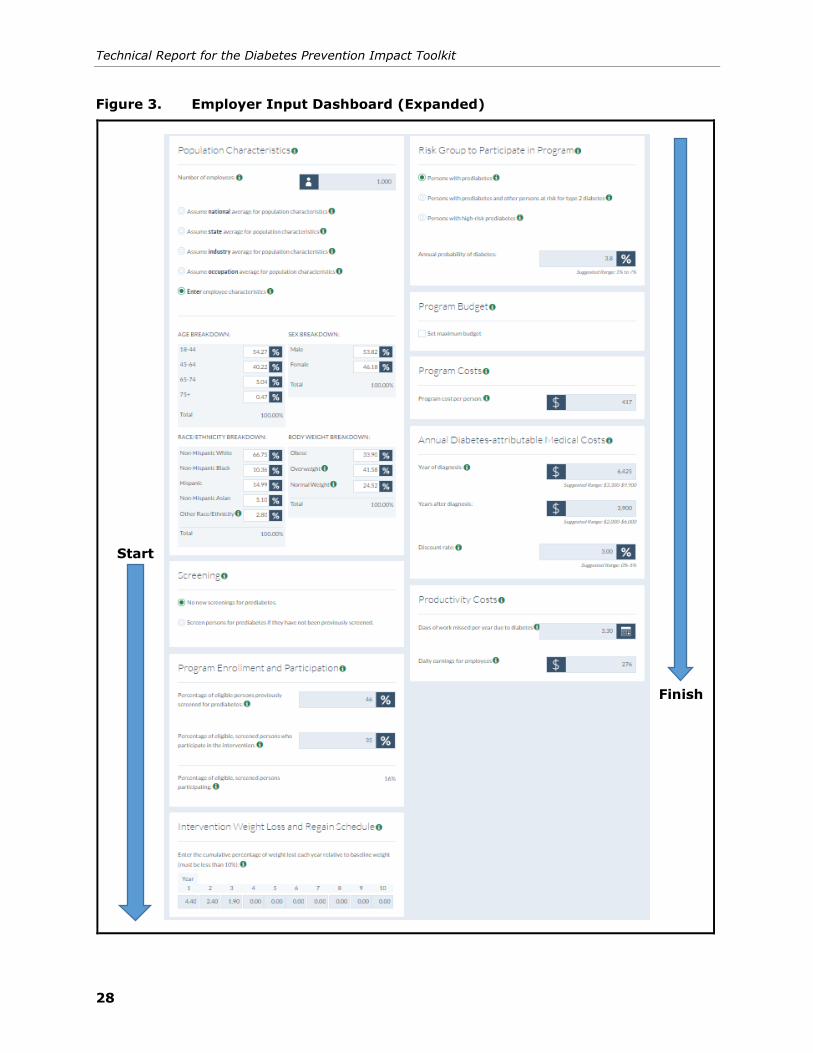
button (Figure 2). For these additional inputs, we recommend beginning with “Screening” in
the left column and ending with “Medical Costs” in the right column (your choice of
screening options will affect subsequent input choice) (Figure 3). In other words, read
through and customize the inputs as if you were reading a newspaper. First go down the left
column, and then go down the right column (note: depending on the window or device you
are using to view the Impact Toolkit, input fields may appear in a different number of
columns).
Figure 2. Employer Input Dashboard Collapsed

Technical Report for the Diabetes Prevention Impact Toolkit
27
Technical Report for the Diabetes Prevention Impact Toolkit
28
Figure 3. Employer Input Dashboard (Expanded)
Start
Finish

Technical Report for the Diabetes Prevention Impact Toolkit
29
Although everyone in your population can be recruited and screened for the National DPP,
only a small percentage of this target population will actually be eligible and willing to
participate in the program. If they do participate, they will receive the weight loss, diabetes
risk reduction, and medical cost reduction benefits associated with the program. In Sections
2.5.1 through 2.5.7, we describe all assumptions related to implementing the National DPP
in your population. In Section 3, we describe the benefits realized by conducting this
program, as reported in the Output Dashboard.
2.5.1 Screening
In the screening section, you can choose if you would like to screen potential participants
for prediabetes, if they have not already been screened. If you choose to conduct screening
for the unscreened persons in your population, then screening costs will be incurred and
these costs will be included in the toolkit’s calculation of program costs (see Section 2.5.5).
Screening costs are shown in the screening cost calculation box in the Program Costs
section (the box will appear in that section if you have chosen to conduct a screening
program). This box calculates the average screening cost per person as the product of the
assumed screening cost ($12.50 in the default setting) and the average number of people
screened per case detected (two in the default setting) (see Figure 4). This calculation
allows us to account for the costs of negative screenings in the overall program costs. For
further details on program cost calculations, see Section 2.5.5 on program costs. To assume
a different number of people screened for the average screening cost calculation, edit the
number in the box for “Average number of people screened for each case of prediabetes
detected.” An increase in this number would reflect an unscreened population with a low
prevalence of prediabetes, while a decrease would reflect an unscreened population with a
high prevalence of prediabetes. If you are not sure about the underlying prevalence in your
unscreened population, then we recommend using the default setting of two people
screened per case detected. This reflects a prevalence of prediabetes of about 50% among
unscreened people that agree to participate in a screening program. To our knowledge,
there are no extant data on the prevalence of prediabetes among people who participate in
a screening program. While the typical prevalence of prediabetes is lower than 50%, we
assumed that it would be higher among a self-selected group of screening participants (i.e.,
people are more likely to agree to screening if they have risk factors for prediabetes).

Technical Report for the Diabetes Prevention Impact Toolkit
30
Figure 4. Program Cost Inputs Showing Average Screening Cost Calculation
2.5.2 Program Enrollment and Participation
Here you can enter the percentage of eligible participants that have already been screened
for prediabetes. The default setting is 46%, which is based on the percentage of people at
risk for diabetes that have been screened in the past 3 years (Bullard et al., 2015; Kiefer et
al., 2015). Persons at risk for diabetes include adults aged 45 or older or those with physical
inactivity, family histories of diabetes, high blood pressure, and other risk factors per the
American Diabetes Association (ADA, 2016) and the U.S. Preventive Services Task Force
(Calange et al., 2008) criteria for screening for type 2 diabetes. Other analyses have shown
that only about 11% of persons with prediabetes in 2010 were screened and aware of their
disease status (CDC, 2013). Thus, other values such as 11% can be entered as an
alternative with justification.
If you have chosen to conduct additional screening for your program, then you can also
input the “percentage of eligible, previously unscreened persons receiving screening” (the
entry field for this input will only be shown if you have chosen to conduct screening in the
screening section). The default value is 100%, which assumes that all persons with a
BMI≥24 who have not been screened will receive screening. You can adjust this value
downward as appropriate for your population.

Technical Report for the Diabetes Prevention Impact Toolkit
31
Next, you enter your assumed participation rate (see Figure 5). The default setting for the
participation rate is 35%, which is based on the participation rate in a demonstration of the
National DPP with large employers (R. Li, R. Ackermann, personal communication, June 22,
2015). The participation rate might be higher or lower for your population based on the
incentives offered for participating or the perceived benefits of participation.
Figure 5. Program Enrollment and Participation Inputs
Note: An additional input field, “Percentage of eligible, previously unscreened persons receiving screening,” will appear if you choose to conduct screening for the unscreened persons in your population in the screening section.
In the final number shown in Figure 5, the program enrollment and participation inputs are
used to determine the total percentage of participation among eligible adults. For example,
if 46% of eligible adults have previously been screened, no additional screening occurs (the
default value), and the participation rate is 35%, then the total percentage of eligible adults
participating will be 16% (46%*35%=16%). This percentage is then applied to the
predicted prevalence of the selected risk group to get the percentage of projected
participants. For example, in the default setting, the predicted prevalence of “persons with
prediabetes” is 29% in the national sample. Thus, 29% * 16% = 4.7% of the total
population that will participate in the National DPP if no additional screenings are conducted.
However, in a scenario where a screening program is conducted to identify additional
eligible persons, the calculation is somewhat more complex (Equation 1). Generally, the

Technical Report for the Diabetes Prevention Impact Toolkit
32
more adults screened will result in a larger # of eligible persons and a larger # of
participants.
Equation 1. Percentage of Screened Population Who Participate in the Intervention
Percentage of screened
population who participate
in the intervention
= % of population previously screened for prediabetes * %
of screened persons participating in intervention +
[(100% − % of population previously screened for
prediabetes) * % of previously unscreened persons
receiving screening * % of screened persons
participating in intervention]
Similar to the example with no additional screenings, the percentage from Equation 1
(which is used when there are additional screenings) is applied to the predicted prevalence
of the selected risk group (e.g., 29% for “persons with prediabetes” in the national sample)
to get the percentage of projected participants. For example, if the “% of previously
unscreened persons receiving screening” is 100%, then we would calculate the percentage
of projected participants as 29% * (46%*35%) + [(100% − 46%)*100%*35%], which
equals 16% of the total population that will participate in the National DPP if additional
screenings are conducted on 100% of the previously unscreened population.
2.5.3 Intervention Weight Loss and Regain Schedule
The DPP trial demonstrated that participants in an intensive lifestyle intervention lost about
7.2% of their weight in the first year of the program (DPP, 2002; Hamman et al., 2002).
Real-world adaptations of the DPP trial, such as the National DPP, resulted in a smaller
weight loss effect, 4.4% on average at the end of the first year of follow-up (R. Li, personal
communication, June 24, 2015). This estimate is based on results from the National DPP
and represents the first year weight loss for program participants and is supported by other
studies.1 A participant was defined as someone attending at least 4 of the 16 program
sessions offered during the first 6 months. Attending at least 9 sessions during the first 6
months was associated with a slightly higher weight loss at the end of year one (5.1%) (R.
Li, personal communication, June 24, 2015).
The DPP trial and studies of real-world interventions with additional years of follow-up show
that the initial weight lost is regained in future years. Based on data from these studies, we
assume that about 50% of the weight lost is regained in Year 2, and another 20% is
regained in Year 3 (Barte et al., 2010). In Years 4 through 10, we assume that all the
weight lost has been regained (0% weight loss relative to baseline weight). These weight
loss and regain assumptions are based on group-based National DPPs or similar programs
1 In 2012, Ali et al. (2012) reported a 4.1% weight loss at 12 months’ follow-up for translational programs conducted in the United States and modeled on the Diabetes Prevention Program (DPP) trial’s lifestyle intervention.

Technical Report for the Diabetes Prevention Impact Toolkit
33
with a minimum of 16 sessions over the first 6 months. A minimum of 6 sessions must be
offered in the second 6 months of the program to achieve full recognition status per the
criteria set forth by the CDC (CDC, 2015b).
The intervention weight loss and regain schedule in the Impact Toolkit shows the average
percentage difference (relative to baseline body weight) for 10 years of follow-up. Data from
the DPP and Diabetes Prevention Program Outcomes Study (DPPOS) trial showed that
weight loss was the greatest after 1 year (7.2%; Hamman et al., 2002) and was associated
with a 58% diabetes risk reduction over the 3-year study period. Based on these DPP trial
data and the associated diabetes risk reductions observed in the trial we estimated the
average diabetes risk reduction from National DPP programs by discounting the DPP trial
risk reduction according to Equation 2.
Equation 2. Discount Factor for Translational DPP Program Effects for Program
Participants: Weight Loss
(NDPP weight loss)/(DPP weight loss) = (4.4%)/(7.2%) = 61.1%
Note: This discount factor is automatically recalculated in the Toolkit if the user adjusts the weight-loss effect as described above.
Thus, the National DPP program is assumed to have 61.1% of the effect on diabetes risk
that was observed in the DPP trial. In DPP trial, the 58% reduction in diabetes incidence is
associated with 7.2% weight reduction. Thus the 61.1% discount factor translates to a
35.4% risk reduction in the first year of participating in the National DPP. Table 14 shows
the default assumptions for weight loss and the calculated diabetes risk reduction (using
Equation 2) associated with each year’s weight loss estimate. The diabetes risk reduction
effects in each year are automatically updated per Equation 2 when the weight loss and
regain effects are changed by the user. Although these default settings are based on the
best available data for the average National DPP participant, your population and program
may differ from the average. You can edit these weight loss and regain assumptions
according to the expectations for your program.
For the Impact Toolkit, we limit customized input average loss values to 10% of baseline
weight. Larger weight losses are unlikely to occur, given the 7.2% weight loss in the original
DPP trial and the 4.4% weight loss observed in translational programs. In addition, weight
loss greater than 10% would lead to results with low credibility under the current model
calculation of the risk reduction in diabetes incidence associated with the National DPP. This
risk reduction cannot exceed 100% (i.e., you cannot reduce diabetes incidence below 0%).
Given Equation 2, the 10% ceiling on weight loss would lead to a discount factor of 1.39
and—multiplied by the 58% risk reduction in the original DPP—to an 81% risk reduction in
diabetes incidence.

Technical Report for the Diabetes Prevention Impact Toolkit
34
Table 14. Default Intervention Weight Loss and Weight Regain Schedule
Year Intervention Weight Loss (from baseline weight)
Assumed Diabetes Incidence Risk Reduction
1 4.4% 35.4%
2 2.4% 19.3%
3 1.9% 15.3%
4 0.0% 0.0%
5 0.0% 0.0%
6 0.0% 0.0%
7 0.0% 0.0%
8 0.0% 0.0%
9 0.0% 0.0%
10 0.0% 0.0%
Note: Year 1 is the year in which the intervention is delivered to participants. All weight loss percentages are based on participants’ baseline weight (before the intervention). In the default setting, weight is gradually regained with a full return to baseline weight in Year 4. This regain trend is based on evidence from a review of group-based lifestyle interventions. Weight loss and regain are associated with a reduced incidence of diabetes as described in Section 2.5.3.
2.5.4 Program Budget
In the default setting, the Impact Toolkit assumes that a state, employer, or insurer will
offer the program to all eligible persons who want to participate. However, if there is a
limited budget for implementing a National DPP or similar program, then you can check the
box in this section to set a maximum budget. Once you have checked this box, an additional
entry field will appear for you to enter your maximum budget. This budget you enter will
limit the number of program participants based on the size of your eligible population, your
program costs, and your screening costs (if you choose to screen previously unscreened
persons). Equation 3 demonstrates this calculation.
Equation 3. Determining the Proportion Participating in the Program when there is
a Limited Budget
Proportion participating in
intervention
= Minimum [Proportion completing screening *
Percentage of screened persons participating in
intervention,
( Total Program Budget
Average program cost per person with screening )]
2.5.5 Program Costs
Here you can enter the per person costs of your program. The default cost of $417 (2013
U.S. dollars) is the per-participant cost of a group-based National DPP or similar program
without screening costs included (Li et al., 2015). All costs in this section should be
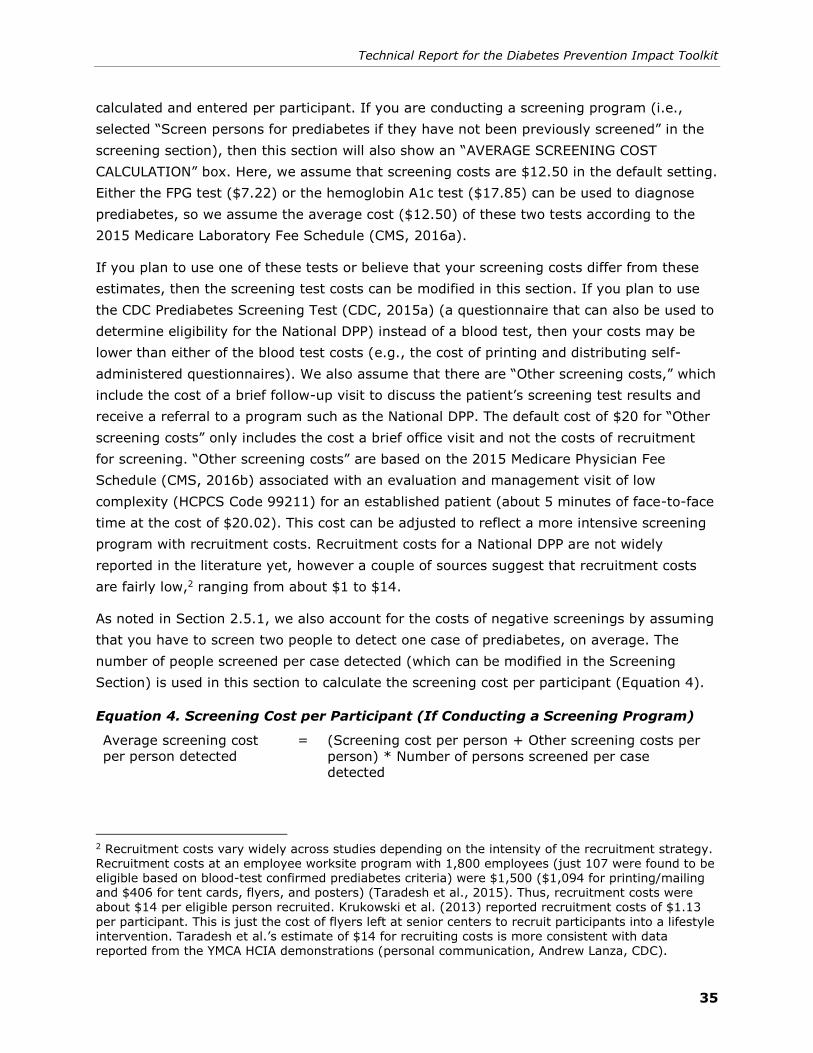
Technical Report for the Diabetes Prevention Impact Toolkit
35
calculated and entered per participant. If you are conducting a screening program (i.e.,
selected “Screen persons for prediabetes if they have not been previously screened” in the
screening section), then this section will also show an “AVERAGE SCREENING COST
CALCULATION” box. Here, we assume that screening costs are $12.50 in the default setting.
Either the FPG test ($7.22) or the hemoglobin A1c test ($17.85) can be used to diagnose
prediabetes, so we assume the average cost ($12.50) of these two tests according to the
2015 Medicare Laboratory Fee Schedule (CMS, 2016a).
If you plan to use one of these tests or believe that your screening costs differ from these
estimates, then the screening test costs can be modified in this section. If you plan to use
the CDC Prediabetes Screening Test (CDC, 2015a) (a questionnaire that can also be used to
determine eligibility for the National DPP) instead of a blood test, then your costs may be
lower than either of the blood test costs (e.g., the cost of printing and distributing self-
administered questionnaires). We also assume that there are “Other screening costs,” which
include the cost of a brief follow-up visit to discuss the patient’s screening test results and
receive a referral to a program such as the National DPP. The default cost of $20 for “Other
screening costs” only includes the cost a brief office visit and not the costs of recruitment
for screening. “Other screening costs” are based on the 2015 Medicare Physician Fee
Schedule (CMS, 2016b) associated with an evaluation and management visit of low
complexity (HCPCS Code 99211) for an established patient (about 5 minutes of face-to-face
time at the cost of $20.02). This cost can be adjusted to reflect a more intensive screening
program with recruitment costs. Recruitment costs for a National DPP are not widely
reported in the literature yet, however a couple of sources suggest that recruitment costs
are fairly low,2 ranging from about $1 to $14.
As noted in Section 2.5.1, we also account for the costs of negative screenings by assuming
that you have to screen two people to detect one case of prediabetes, on average. The
number of people screened per case detected (which can be modified in the Screening
Section) is used in this section to calculate the screening cost per participant (Equation 4).
Equation 4. Screening Cost per Participant (If Conducting a Screening Program)
Average screening cost per person detected
= (Screening cost per person + Other screening costs per
person) * Number of persons screened per case detected
2 Recruitment costs vary widely across studies depending on the intensity of the recruitment strategy. Recruitment costs at an employee worksite program with 1,800 employees (just 107 were found to be eligible based on blood-test confirmed prediabetes criteria) were $1,500 ($1,094 for printing/mailing and $406 for tent cards, flyers, and posters) (Taradesh et al., 2015). Thus, recruitment costs were about $14 per eligible person recruited. Krukowski et al. (2013) reported recruitment costs of $1.13
per participant. This is just the cost of flyers left at senior centers to recruit participants into a lifestyle intervention. Taradesh et al.’s estimate of $14 for recruiting costs is more consistent with data reported from the YMCA HCIA demonstrations (personal communication, Andrew Lanza, CDC).
Technical Report for the Diabetes Prevention Impact Toolkit
36
Next, the average screening cost per participant is added to the base program cost ($417 in
the default setting) to calculate the overall program cost per person. This calculation is
shown in Equation 5 and is used as the overall program cost in calculations of net costs
shown in the Output Dashboard.
Equation 5. Overall Program Cost (with a Screening Program)
Average program cost per participant with screening = Program cost per participant +
oninterventi in ingparticipat tsparticipan screened of %
screening receiving tsparticipan unscreened previously of %
*sprediabetefor screened previously pop of % - 100% * detected tparticipanper cost screening Average
Note: In Equation 5, the term “Average screening cost per person detected” is calculated from Equation 4.
2.5.6 Medical Costs
In the year that a person is diagnosed with diabetes, he or she will have substantial medical
costs associated with diagnosing and treating their diabetes. In each subsequent year, the
person will continue to have medical costs for the treatment of his or her disease, although
not as great as the initial year of diagnosis. These are usually called diabetes-attributable
medical costs, and they are defined as the excess medical costs for a person with diabetes
compared with a similar person without diabetes.
The default values that are provided in the Impact Toolkit reflect the average excess
medical costs for persons with diabetes based on a CDC analysis of longitudinal medical
claims data from MarketScan (2001–2013) (Shrestha et al., 2016). Based on these data
and a review of other cost analyses,3 we assumed default values of $6,424 for the first year
of diagnosis and $3,900 for the years after diagnosis (2013 U.S. dollars). First year costs
are approximately 1.65 times greater than subsequent year costs. If you believe that excess
medical costs associated with diabetes differ in your population, we suggest maintaining this
approximate relationship between the first year costs and the subsequent year costs. We
also suggest staying within the suggested range of $3,300 to $9,900 for first year costs and
$2,000 to $6,000 for subsequent year costs. Using excess medical cost estimates outside of
these ranges may lead to results with low credibility.
We used cost equations from Zhuo et al. (2014) to account for increasing age and duration
of diabetes (for persons that develop the disease) in future years. Table 15 shows how the
excess medical costs increase with increasing age and duration of diabetes (for persons
developing diabetes). On average, the excess medical cost associated with having diabetes
3 Studies that use cross-sectional cost data may underestimate costs in the year of diabetes onset. Previous analyses using the MEPS-NHIS linked data file have noted this limitation as well (Trogdon et
al., 2008). However, in studies that use longitudinal data to follow individuals before and after the onset of diabetes, authors find a spike in medical costs in the year of onset (Nichols et al., 2000; Shrestha et al., 2016).
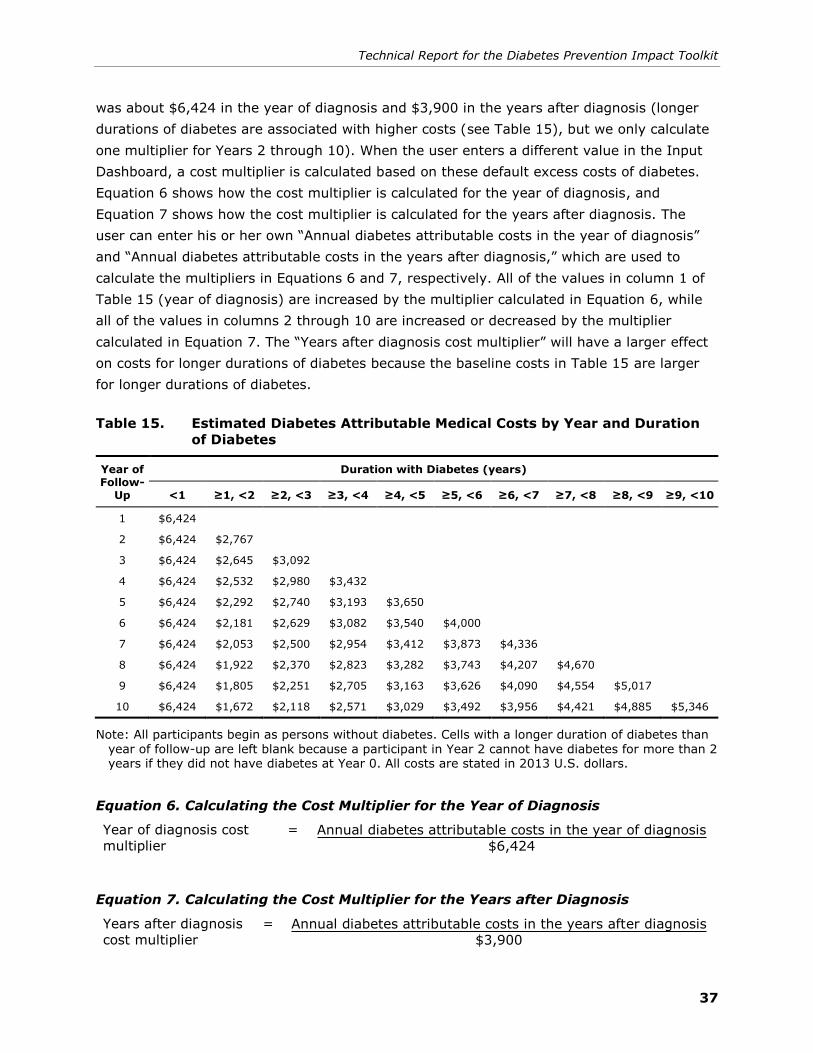
Technical Report for the Diabetes Prevention Impact Toolkit
37
was about $6,424 in the year of diagnosis and $3,900 in the years after diagnosis (longer
durations of diabetes are associated with higher costs (see Table 15), but we only calculate
one multiplier for Years 2 through 10). When the user enters a different value in the Input
Dashboard, a cost multiplier is calculated based on these default excess costs of diabetes.
Equation 6 shows how the cost multiplier is calculated for the year of diagnosis, and
Equation 7 shows how the cost multiplier is calculated for the years after diagnosis. The
user can enter his or her own “Annual diabetes attributable costs in the year of diagnosis”
and “Annual diabetes attributable costs in the years after diagnosis,” which are used to
calculate the multipliers in Equations 6 and 7, respectively. All of the values in column 1 of
Table 15 (year of diagnosis) are increased by the multiplier calculated in Equation 6, while
all of the values in columns 2 through 10 are increased or decreased by the multiplier
calculated in Equation 7. The “Years after diagnosis cost multiplier” will have a larger effect
on costs for longer durations of diabetes because the baseline costs in Table 15 are larger
for longer durations of diabetes.
Table 15. Estimated Diabetes Attributable Medical Costs by Year and Duration
of Diabetes
Year of Follow-
Up
Duration with Diabetes (years)
<1 ≥1, <2 ≥2, <3 ≥3, <4 ≥4, <5 ≥5, <6 ≥6, <7 ≥7, <8 ≥8, <9 ≥9, <10
1 $6,424
2 $6,424 $2,767
3 $6,424 $2,645 $3,092
4 $6,424 $2,532 $2,980 $3,432
5 $6,424 $2,292 $2,740 $3,193 $3,650
6 $6,424 $2,181 $2,629 $3,082 $3,540 $4,000
7 $6,424 $2,053 $2,500 $2,954 $3,412 $3,873 $4,336
8 $6,424 $1,922 $2,370 $2,823 $3,282 $3,743 $4,207 $4,670
9 $6,424 $1,805 $2,251 $2,705 $3,163 $3,626 $4,090 $4,554 $5,017
10 $6,424 $1,672 $2,118 $2,571 $3,029 $3,492 $3,956 $4,421 $4,885 $5,346
Note: All participants begin as persons without diabetes. Cells with a longer duration of diabetes than year of follow-up are left blank because a participant in Year 2 cannot have diabetes for more than 2 years if they did not have diabetes at Year 0. All costs are stated in 2013 U.S. dollars.
Equation 6. Calculating the Cost Multiplier for the Year of Diagnosis
Year of diagnosis cost
multiplier
= Annual diabetes attributable costs in the year of diagnosis
$6,424
Equation 7. Calculating the Cost Multiplier for the Years after Diagnosis
Years after diagnosis
cost multiplier
= Annual diabetes attributable costs in the years after diagnosis
$3,900

Technical Report for the Diabetes Prevention Impact Toolkit
38
In the Impact Toolkit, all costs incurred in the future are discounted back to the present
using a discount rate assumed in the Medical Cost section of the Input Dashboard. The
discount rate input box allows us to account for the fact that the money we have today has
more value than money received in the future. This accounts for future inflation, lost
investment opportunity, and risk. Applying this discount value allows us to more accurately
compare the money that will be spent in the future with the money that is spent today. An
annual discount rate of 1.0% to 5.0% is commonly used. Our default value is 3.0%.
2.5.7 Productivity Costs (Employer Module Only)
In the Employer module only, we include productivity costs associated with diabetes. We
limit productivity costs to the costs of days of work missed due to diabetes and the value of
these days. The value of the days of work missed (per person) is calculated by multiplying
the “Days of work missed per year due to diabetes” and the “Daily earnings for persons with
diabetes.” Days of work missed per year due to diabetes are the excess days of work
missed by someone with diabetes compared with a similar person without diabetes (e.g.,
similar age, sex, comorbidities).
We used NHIS to estimate the number of days of work missed attributable to diabetes.
Pooling data from the 2009 through 2013 NHIS, we estimated days of work missed at the
national level.4 Our final estimation used a two-part model with a logit model for the first
part and a generalized linear model for the second part. We controlled for the following
comorbidities: arthritis, asthma, cancer, depression, chronic bronchitis, back problems, and
pregnancy. We also included the following sociodemographic controls: age, age squared,
race/ethnicity, education, family income, health insurance, and occupation.
We found that, on average, a person with diabetes will miss 3.3 more days of work each
year as compared to a similar person without diabetes.5 The default daily earnings of $276
was calculated as a weighted average of daily earnings for males and females aged 45 to
4 In NHIS, persons with diabetes are identified by the question “Have you ever been told that you have diabetes?” The work-loss analysis was restricted to individuals employed at any point during the year. Number of workdays lost was defined using the following NHIS question: “During the past 12
months, about how many days did you miss work at a job or business because of illness or injury (do
not include maternity leave)?” To estimate workdays lost due to diabetes, we tested four different models for best fit: one-part negative binomial model, two-part truncated negative binomial model with a logit, two-part generalized linear model with a logit, and a zero-inflated negative binomial model. Based on a comparison of the model residuals, the Akaike information criterion (AIC), and the Bayesian information criterion (BIC), our final estimation used a two-part model with a logit model for the first part and a GLM for the second part. 5 This estimate of 3.3 work loss days is the weighted average of the estimated work loss associated
with diabetes for 45- to 64-year-old males (53.8% in the employed population, NHANES 2011–2014) and females (46.2% in the employed population, NHANES 2011–2014). We selected the 45–64 age group because the mean age of persons with prediabetes is about 52 years old.
Technical Report for the Diabetes Prevention Impact Toolkit
39
64.6 This value can be modified to reflect the average earnings for your employee
population.
After filling in all the fields discussed in Sections 2.1 through 2.5, click “GET RESULTS” to
view your customized results in the Output Dashboard. See Section 3 for information about
calculations made in the Output Dashboard and how to interpret results.
3. OUTPUT DASHBOARD
The results in the Output Dashboard are unique to your data inputs. They predict the health
and economic outcomes for your program participants as a result of implementing a
National DPP or similar program.
3.1 Projected Participants
Figure 6 demonstrates how the projected number of participants is calculated from the total
population. The total adult population being considered for the National DPP is shown in the
top bar in the figure. This is determined by the total adult population in your state (State
module), the number of employees at your company (employer module), or the number of
insured adults (Insurer module). In the second bar from the top, a subset of the total
population is projected to be eligible for the intervention based on (1) the assumed
population characteristics (Sections 2.1–2.3) and (2) the risk group selected in the Input
Dashboard (Section 2.4). Next, some or all (depending on your screening inputs, see
Section 2.5.1 and 2.5.2) of the eligible persons have been previously or newly screened,
confirming their eligibility for the intervention (shown in the third bar from the top). Among
the eligible, screened persons, some or all (depending on your participation inputs, see
Section 2.5.2) will participate in the intervention. The predicted number of participants is
shown in the bottom bar of this figure. This number is calculated by multiplying the number
of eligible people in second bar by the “Percentage of Screened Population who Participate
in the Intervention” calculated in Equation 1 in Section 2.5.2.
6 This estimate of $276 in daily earnings is a weighted average of the estimated daily earnings for 45- to 64-year-old males (53.8% in the employed population, NHANES 2011–2014) and females (46.2% in the employed population, NHANES 2011–2014). We selected the 45–64 age group because the mean age of persons with prediabetes is about 52 years old. To estimate the daily earnings, we used
the Current Population Survey’s (CPS’) 2014 annual wage estimates by 5-year age groups, aggregated these to the 45–64 age group using 2014 population counts from the Census, and deflated to wages to 2013 U.S. dollars. We calculated daily wage as the annual wage divided by 250 work days per year.

Technical Report for the Diabetes Prevention Impact Toolkit
40
Figure 6. Projected Participants
3.2 Cumulative Projected Cases of Diabetes
Figure 7 demonstrates the effect of the National DPP or similar programs on new cases of
diabetes. In the chart on the left in Figure 7, the cumulative number of diabetes cases with
and without the National DPP intervention is shown for your population of participants. The
gray line estimates the number of new diabetes cases without the National DPP. The green
line represents the number of new diabetes cases with the National DPP. The difference
between the two lines represents the cases of diabetes averted at a given point in time. In
the chart on the right in Figure 7, the cumulative years with diabetes averted is shown for
your population of participants. The cumulative years with diabetes averted (by the National
DPP or similar programs) is the cumulative calculation of the cases averted in each year.
The projected cases of diabetes were determined using a simplified Markov model and two
key inputs: (1) the annual probability of diabetes (see Sections 2.4.1 through 2.4.3); and
(2) the weight loss/regain assumptions, which reduce the probability of diabetes (see
Section 2.5.3). The simplified Markov model was initially a spreadsheet model that mimics a
Markov model with 1-year cycles and three states: No diabetes, Diabetes, and Dead. The
model begins with the full sample of program participants (final bar from “Projected
Participants” figure). During each annual cycle, a percentage of these participants
progresses from prediabetes to diabetes according to the annual probability of diabetes set
by the user (e.g., with an annual probability of diabetes of 3.8%, 38 out of 1,000
participants develop diabetes in the first cycle). Persons developing diabetes are removed
from the sample of persons without diabetes, and the number of cases in the next cycle is
calculated based on this new sample (e.g., the number of cases in the next cycle is

Technical Report for the Diabetes Prevention Impact Toolkit
41
Figure 7. Projected Cases of Diabetes and Years with Diabetes Averted by
Participating in the National DPP or Similar Programs
calculated based on a sample of 962 participants [1,000 − 38 = 962] without diabetes). The
calculations made by the spreadsheet-based Markov model were programmed as the
Impact Toolkit to calculate cases of diabetes over the 10-year period as well as the other
outcomes described in Sections 3.3 through 3.7.
To calculate the gray line (no intervention), the model assumes no weight loss and
therefore no reduction in the annual probability of diabetes. To calculate the green (National
DPP intervention) line, the model assumes some weight loss and some reduction in the
annual probability of diabetes—leading to a smaller number of cases. In each annual cycle,
the annual probability of diabetes is only reduced if there is a weight loss effect assumed for
the applicable annual cycle. In the default setting, there are weight loss effects in the first 3
years that translate to diabetes risk reduction effects (see Table 14) in each of the first 3
years. The simplified Markov model also incorporates mortality. See Section 3.7 for details
regarding the death rate and relative risk of death for persons with diabetes.
Clicking on the “SHOW DATA TABLE” button will open up a table with more information. The
table shows the number of “Cases Averted” in each year and the “Years with Diabetes
Averted.” The “Cases Averted” are calculated as the difference between the gray and green
line. The “Years with Diabetes Averted” represents the cumulative number of person-years
with diabetes that are averted with intervention. The maximum number of “Cases Averted”
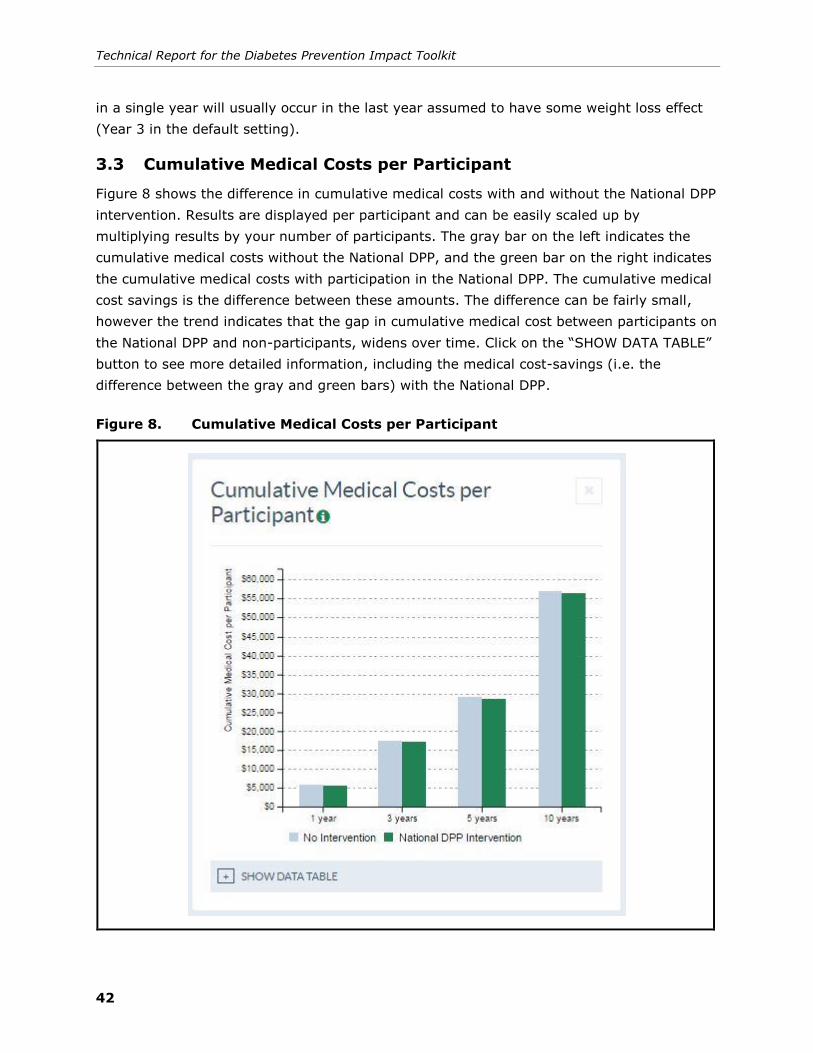
Technical Report for the Diabetes Prevention Impact Toolkit
42
in a single year will usually occur in the last year assumed to have some weight loss effect
(Year 3 in the default setting).
3.3 Cumulative Medical Costs per Participant
Figure 8 shows the difference in cumulative medical costs with and without the National DPP
intervention. Results are displayed per participant and can be easily scaled up by
multiplying results by your number of participants. The gray bar on the left indicates the
cumulative medical costs without the National DPP, and the green bar on the right indicates
the cumulative medical costs with participation in the National DPP. The cumulative medical
cost savings is the difference between these amounts. The difference can be fairly small,
however the trend indicates that the gap in cumulative medical cost between participants on
the National DPP and non-participants, widens over time. Click on the “SHOW DATA TABLE”
button to see more detailed information, including the medical cost-savings (i.e. the
difference between the gray and green bars) with the National DPP.
Figure 8. Cumulative Medical Costs per Participant
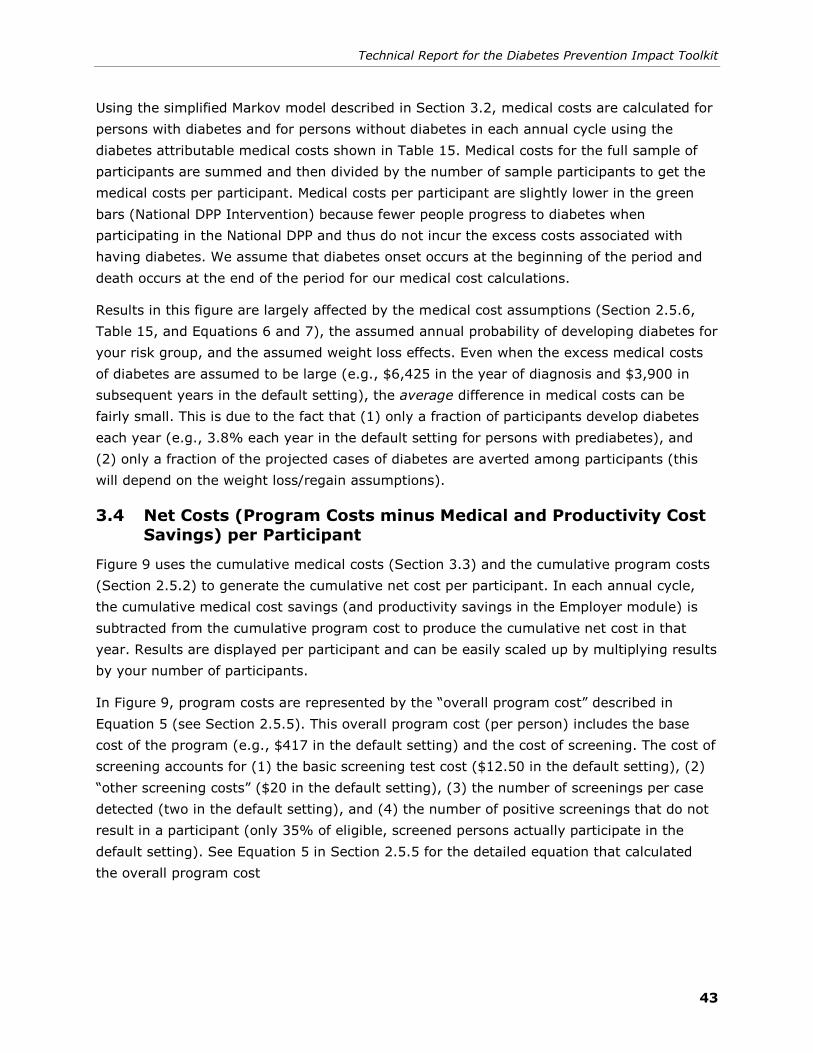
Technical Report for the Diabetes Prevention Impact Toolkit
43
Using the simplified Markov model described in Section 3.2, medical costs are calculated for
persons with diabetes and for persons without diabetes in each annual cycle using the
diabetes attributable medical costs shown in Table 15. Medical costs for the full sample of
participants are summed and then divided by the number of sample participants to get the
medical costs per participant. Medical costs per participant are slightly lower in the green
bars (National DPP Intervention) because fewer people progress to diabetes when
participating in the National DPP and thus do not incur the excess costs associated with
having diabetes. We assume that diabetes onset occurs at the beginning of the period and
death occurs at the end of the period for our medical cost calculations.
Results in this figure are largely affected by the medical cost assumptions (Section 2.5.6,
Table 15, and Equations 6 and 7), the assumed annual probability of developing diabetes for
your risk group, and the assumed weight loss effects. Even when the excess medical costs
of diabetes are assumed to be large (e.g., $6,425 in the year of diagnosis and $3,900 in
subsequent years in the default setting), the average difference in medical costs can be
fairly small. This is due to the fact that (1) only a fraction of participants develop diabetes
each year (e.g., 3.8% each year in the default setting for persons with prediabetes), and
(2) only a fraction of the projected cases of diabetes are averted among participants (this
will depend on the weight loss/regain assumptions).
3.4 Net Costs (Program Costs minus Medical and Productivity Cost
Savings) per Participant
Figure 9 uses the cumulative medical costs (Section 3.3) and the cumulative program costs
(Section 2.5.2) to generate the cumulative net cost per participant. In each annual cycle,
the cumulative medical cost savings (and productivity savings in the Employer module) is
subtracted from the cumulative program cost to produce the cumulative net cost in that
year. Results are displayed per participant and can be easily scaled up by multiplying results
by your number of participants.
In Figure 9, program costs are represented by the “overall program cost” described in
Equation 5 (see Section 2.5.5). This overall program cost (per person) includes the base
cost of the program (e.g., $417 in the default setting) and the cost of screening. The cost of
screening accounts for (1) the basic screening test cost ($12.50 in the default setting), (2)
“other screening costs” ($20 in the default setting), (3) the number of screenings per case
detected (two in the default setting), and (4) the number of positive screenings that do not
result in a participant (only 35% of eligible, screened persons actually participate in the
default setting). See Equation 5 in Section 2.5.5 for the detailed equation that calculated
the overall program cost

Technical Report for the Diabetes Prevention Impact Toolkit
44
Figure 9. Net Costs (Program Costs minus Medical and Productivity Cost
Savings) per Participant
Note: Productivity cost savings are only included in the Employer module.
In general, the cumulative net costs decrease over time, so that by Year 10 or sooner, there
may be negative cumulative net costs, indicating that the program is cost-saving (all
calculations account for the time value of money using the discount rate you specify—see
end of Section 2.5.6). Net costs fall because the program cost is only paid once, in Year 1,
whereas medical cost savings as a result of program participation occur each year. The net
cost calculation is most sensitive to your assumptions regarding the program cost, the
weight loss/regain, and the medical costs. Click on the “SHOW DATA TABLE” button to see
more information. It should be noted that net costs only include medical and program costs
and do not otherwise reflect the health benefits to participants.
3.4.1 Productivity Costs in the Employer Module
In the Employer module, productivity cost-savings are calculated in addition to medical
cost-savings. In the net costs figure (Figure 9), these productivity cost-savings are also
subtracted from the overall program costs in each period to get the net costs. For each new
case of diabetes, a number of days of work are missed each year due to diabetes (3.3 days
in the default setting—see Section 2.5.6). Each day is valued by the average wages
assumed for your employee population ($276 per day in the default setting). For example,
in the default setting, about $911 in productivity costs are incurred each year for everyone
who has developed diabetes in that cycle or a previous cycle.

Technical Report for the Diabetes Prevention Impact Toolkit
45
The productivity cost-savings from averting cases of diabetes in the intervention scenario
are averaged across all participants. Similar to the medical costs, the productivity costs with
the intervention are only slightly lower than the productivity costs without the intervention
due to the fact that (1) only a fraction of participants develop diabetes each year (e.g.,
3.8% each year in the default setting for persons with prediabetes), and (2) only a fraction
of the projected cases of diabetes are averted among participants (this will depend on the
weight loss/regain assumptions). The productivity costs with the intervention, without the
intervention, and the calculated cost-savings (all per person) are shown in the data table
associated with Figure 9. Click on the “SHOW DATA TABLE” button to see the detailed 10
year data in the Impact Toolkit.
3.5 Cumulative Quality Adjusted Life Years (QALYs) Gained
Figure 10 shows the cumulative quality-adjusted life years (QALYs) gained for your
population of participants. QALYs are a combined measure of health and time, allowing us to
weight years lived by the health-related quality of life in those years. One QALY is equal to 1
year of life with a perfect quality of life.
When a person develops diabetes, we assume that their quality of life is reduced by about
5%, on average. The estimate of a 5% reduction in quality of life is based on the quality of
life decrement associated with progressing from prediabetes to diabetes in the CDC/RTI
model of diabetes.7 This reduction in quality of life is averted or delayed with each case of
diabetes that is averted or delayed (due to the National DPP or similar programs). Similar to
the method for calculating medical costs, QALYs are calculated with and without effect of
the National DPP using a simplified Markov model. Using the Markov model approach the
cumulative QALYs gained (shown in Figure 10) account for averting the reduction in quality
of life associated with diabetes as well as the timing of when cases are averted. For
instance, if weight losses are maintained throughout the whole 10-year period, then cases
of diabetes will be delayed for a longer amount of time and QALY gains will be greater. If
weight losses are quickly regained, then these cases of diabetes are not delayed as long and
not as many QALYs will be gained.
7 A quality of life decrement of 0.04 relative to a baseline utility of 0.84 for persons without diabetes represents about a 5% decrease in quality of life.
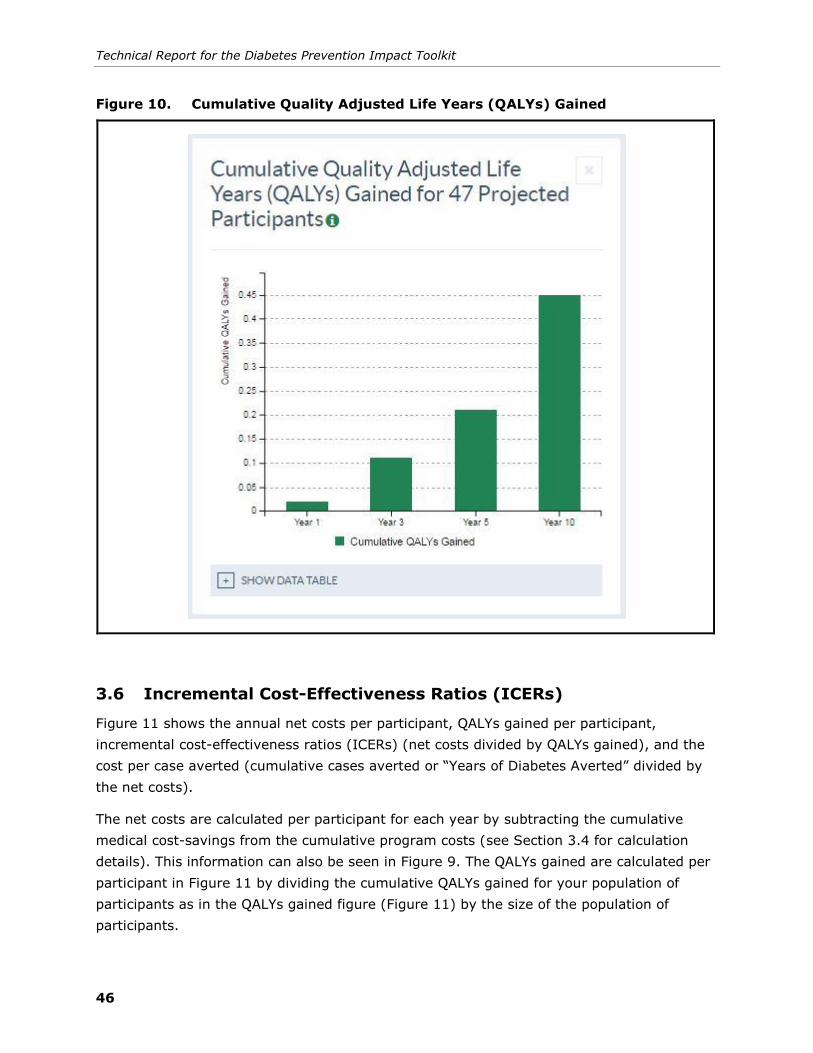
Technical Report for the Diabetes Prevention Impact Toolkit
46
Figure 10. Cumulative Quality Adjusted Life Years (QALYs) Gained
3.6 Incremental Cost-Effectiveness Ratios (ICERs)
Figure 11 shows the annual net costs per participant, QALYs gained per participant,
incremental cost-effectiveness ratios (ICERs) (net costs divided by QALYs gained), and the
cost per case averted (cumulative cases averted or “Years of Diabetes Averted” divided by
the net costs).
The net costs are calculated per participant for each year by subtracting the cumulative
medical cost-savings from the cumulative program costs (see Section 3.4 for calculation
details). This information can also be seen in Figure 9. The QALYs gained are calculated per
participant in Figure 11 by dividing the cumulative QALYs gained for your population of
participants as in the QALYs gained figure (Figure 11) by the size of the population of
participants.

Technical Report for the Diabetes Prevention Impact Toolkit
47
Figure 11. Incremental Cost-Effectiveness Ratios (ICERs)
The ICER is a measure of the cost-effectiveness or “return on investment” associated with
an intervention. It is calculated as the cumulative net costs divided by the cumulative QALYs
gained. A lower ICER is better as it indicates that QALYs are gained from the intervention at
a lower cost. A negative ICER indicates that the intervention is associated with QALY gains
and reduced costs (i.e., a cost-saving intervention). Negative ICERs are shown in Figure 11
as “cost-saving.” To see the amount of cost-savings per person, refer to the “Net Costs”
figure and accompanying table (see Section 3.4).
Technical Report for the Diabetes Prevention Impact Toolkit
48
The Cost per Case Averted is found by dividing the cumulative cases averted (as seen in
Figure 7, “Cumulative Projected Cases of Diabetes”) by the cumulative net cost. A negative
cost per case averted means that the program is cost saving by that point in time. Negative
costs per case averted are shown in Figure 11 as “cost-saving.”
3.7 Cumulative Years of Life Gained
Developing diabetes is associated with an increased risk of life-threatening events, such as
heart attack and stroke. We assumed that persons with diabetes have twice the risk of
dying in a given year (from all causes) compared with persons without diabetes, on
average. Based on an unpublished CDC analysis, we observed a range of 2.0 to 4.0 for the
relative risk of death for persons with diabetes (personal communication, Yiling Chen, April
11, 2015). These relative risk estimates varied by age and sex. We chose to use an
estimate of 2.0.
When cases of diabetes are averted or delayed (due to the intervention), a small decrease
in the number of diabetes-related deaths is achieved. These deaths averted are associated
with a gain in the years of life lived during the 10-year period. Similar to other calculations
discussed in Section 3, a simplified Markov model was used to calculate deaths in each
annual cycle. A small percentage of people die during each cycle and are removed from the
modeling sample based on an assumed mortality rate of 0.45% for persons without
diabetes and 0.90% for persons with diabetes. We chose the baseline mortality rate
(0.45%) from the 2010 National Vital Statistics Life Tables8 (Arias, 2014) based the average
age (age 52) of people with prediabetes in NHANES (2011–2014).
Figure 12 shows the cumulative years of life gained for your participant population as a
result of participation in the National DPP. These years of life gained do not account for the
quality of life with diabetes as in the QALYs gained figure. Click on the “SHOW DATA TABLE”
button to see more information. Results are calculated dynamically in the Output Dashboard
and are often rounded to accommodate the best display of the results given the space
restrictions. To view the unrounded results download your results in Microsoft Excel using
the green button in the upper right corner of the Output Dashboard.
8 See Table 1 “Life table for the total population: United States, 2010.”
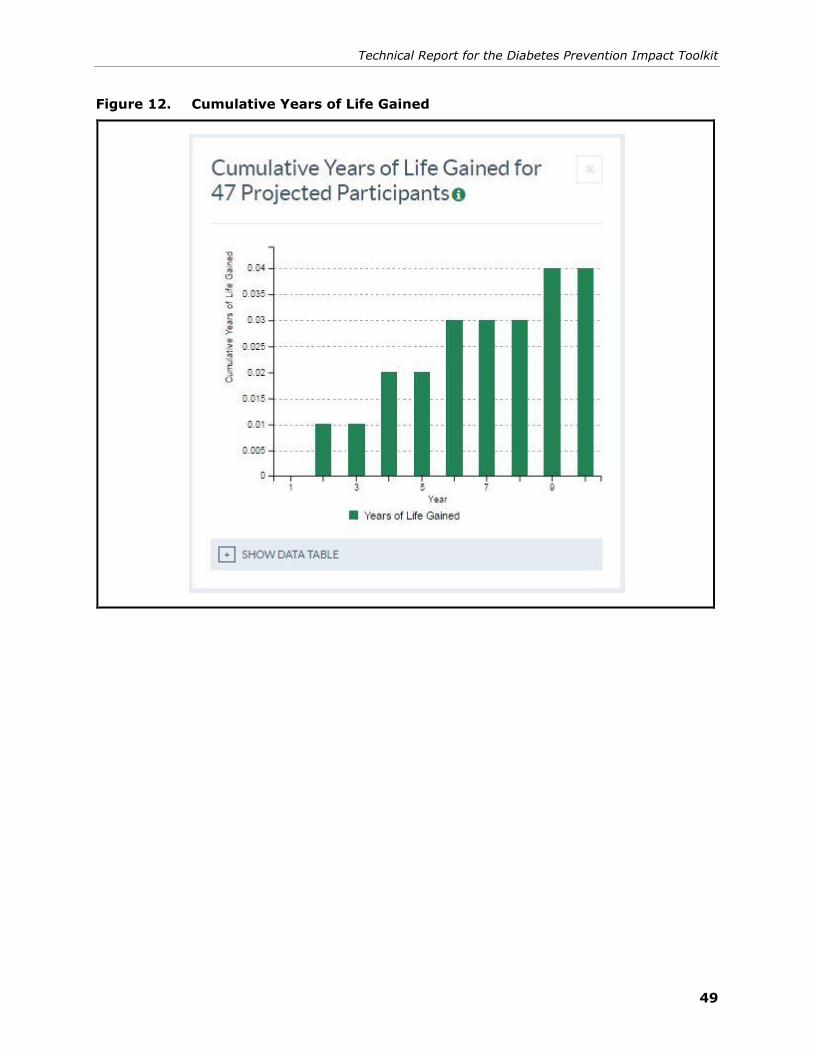
Technical Report for the Diabetes Prevention Impact Toolkit
49
Figure 12. Cumulative Years of Life Gained

R-1
References
Ackermann, R. T., Liss, D. T., Finch, E. A., Schmidt, K. K., Hays, L. M., Marrero, D. G., &
Saha, C. (2015). A randomized comparative effectiveness trial for preventing type 2
diabetes. American Journal of Public Health, 105(11), 2328–2334.
http://dx.doi.org/10.2105/AJPH.2015.302641
Ali, M. K., Echouffo-Tcheugui, J., & Williamson, D. F. (2012). How effective were lifestyle
interventions in real-world settings that were modeled on the Diabetes Prevention
Program? Health Affairs, 31(1), 67–75. http://dx.doi.org/10.1377/hlthaff.2011.1009
American Diabetes Association. (2016). Standards of medical care in diabetes—2016.
Diabetes Care, 39(Suppl 1), S4–S5. http://dx.doi.org/10.2337/dc16-S003
Arias, E. (2014). United States life tables, 2010. National Vital Statistics Reports, 63(7), 1–
62. Retrieved from http://www.cdc.gov/nchs/data/nvsr/nvsr63/nvsr63_07.pdf
Barte, J. C. M., ter Bogt, N. C. W., Bogers, R. P., Teixeira, P. J., Blissmer, B., Mori, T. A., &
Bemelmans, W. J. E. (2010). Maintenance of weight loss after lifestyle interventions
for overweight and obesity, a systematic review. Obesity Reviews, 11(12), 899–906.
http://dx.doi.org/10.1111/j.1467-789X.2010.00740.x
Bullard, K. M., Ali, M. K., Imperatore, G., Geiss, L. S., Saydah, S. H., Albu, J. B., . . . Gregg,
E. W. (2015). Receipt of glucose testing and performance of two US diabetes
screening guidelines, 2007-2012. PLoS One, 10(4), e0125249.
http://dx.doi.org/10.1371/journal.pone.0125249
Calonge, N., Petitti, D. B., DeWitt, T. G., Dietrich, A. J., Gordis, L., Gregory, K. D., . . ., &
the U.S. Preventive Services Task Force. (2008). Screening for type 2 diabetes
mellitus in adults: U.S. Preventive Services Task Force recommendation statement.
Annals of Internal Medicine, 148(11), 846–854. http://dx.doi.org/10.7326/0003-
4819-148-11-200806030-00007
Centers for Disease Control and Prevention (CDC). (2013). Awareness of prediabetes—
United States, 2005-2010. Morbidity and Mortality Weekly Report, 62(11), 209–212.
Centers for Disease Control and Prevention (CDC). (2014a). National diabetes statistics
report: Estimates of diabetes and its burden in the United States, 2014. Atlanta, GA:
U.S. Department of Health and Human Services.
Centers for Disease Control and Prevention (CDC). (2014b). Guide to Community Preventive
Services. Diabetes prevention and control: combined diet and physical activity
promotion programs to prevent type 2 diabetes among people at increased risk.
Retrieved from www.thecommunityguide.org/diabetes/combineddietandpa.html
Centers for Disease Control and Prevention (CDC). (2015a). CDC Prediabetes Screening
Test. Retrieved from
http://www.cdc.gov/diabetes/prevention/pdf/prediabetestest.pdf
Centers for Disease Control and Prevention (CDC). (2015b). Diabetes Prevention
Recognition Program Standards and Operating Procedures. Retrieved from
http://www.cdc.gov/diabetes/prevention/pdf/dprp-standards.pdf

Technical Report for the Diabetes Prevention Impact Toolkit
R-2
Centers for Medicare and Medicaid Services (CMS). (2016a). 2015 Medicare Laboratory Fee
Schedule. Retrieved February 23, 2016, from
https://www.cms.gov/apps/ama/license.asp?file=/Medicare/Medicare-Fee-for-
Service-Payment/ClinicalLabFeeSched/Downloads/15CLAB.zip
Centers for Medicare and Medicaid Services (CMS). (2016b). 2013 Medicare Physician Fee
Schedule. Retrieved February 23, 2016, from https://www.cms.gov/apps/physician-
fee-schedule/license-agreement.aspx
Hamman, R. F., Wing, R. R., Edelstein, S. L., Lachin, J. M., Bray, G. A., Delahanty, L., . . .
Wylie-Rosett, J. (2006). Effect of weight loss with lifestyle intervention on risk of
diabetes. Diabetes Care, 29(9), 2102–2107. http://dx.doi.org/10.2337/dc06-0560
Herman, W. H., Hoerger, T. J., Brandle, M., Hicks, K., Sorensen, S., Zhang, P., . . . Ratner,
R. E., & the Diabetes Prevention Program Research Group. (2005). The cost-
effectiveness of lifestyle modification or metformin in preventing type 2 diabetes in
adults with impaired glucose tolerance. Annals of Internal Medicine, 142(5), 323–
332. http://dx.doi.org/10.7326/0003-4819-142-5-200503010-00007
Hernan, W. H., Brandle, M., Zhang, P., Williamson, D. F., Matulik, M. J., Ratner, R. E., . . .
Engelgau, M. M., & the Diabetes Prevention Program Research Group. (2003). Costs
associated with the primary prevention of type 2 diabetes mellitus in the diabetes
prevention program. Diabetes Care, 26(1), 36–47.
http://dx.doi.org/10.2337/diacare.26.1.36
Jones, R., Jones, R. O., McCowan, C., Montgomery, A. A., & Fahey, T. (2009). The external
validity of published randomized controlled trials in primary care. BMC Family
Practice, 10(1), 5. http://dx.doi.org/10.1186/1471-2296-10-5
Kiefer, M. M., Silverman, J. B., Young, B. A., & Nelson, K. M. (2015). National patterns in
diabetes screening: Data from the National Health and Nutrition Examination Survey
(NHANES) 2005-2012. Journal of General Internal Medicine, 30(5), 612–618.
http://dx.doi.org/10.1007/s11606-014-3147-8
Knowler, W. C., Barrett-Connor, E., Fowler, S. E., Hamman, R. F., Lachin, J. M., Walker, E.
A., & Nathan, D. M., & the Diabetes Prevention Program Research Group. (2002).
Reduction in the incidence of type 2 diabetes with lifestyle intervention or metformin.
The New England Journal of Medicine, 346(6), 393–403.
http://dx.doi.org/10.1056/NEJMoa012512
Knowler, W. C., Fowler, S. E., Hamman, R. F., Christophi, C. A., Hoffman, H. J., Brenneman,
A. T., . . . Nathan, D. M., & the Diabetes Prevention Program Research Group.
(2009). 10-year follow-up of diabetes incidence and weight loss in the Diabetes
Prevention Program Outcomes Study. Lancet, 374(9702), 1677–1686.
http://dx.doi.org/10.1016/S0140-6736(09)61457-4
Krukowski, R. A., Pope, R. A., Love, S., Lensing, S., Felix, H. C., Prewitt, T. E., & West, D.
(2013). Examination of costs for a lay health educator-delivered translation of the
Diabetes Prevention Program in senior centers. Preventive Medicine, 57(4), 400–402.
http://dx.doi.org/10.1016/j.ypmed.2013.06.027

References
R-3
Laws, R. A., St George, A. B., Rychetnik, L., & Bauman, A. E. (2012). Diabetes prevention
research: A systematic review of external validity in lifestyle interventions. American
Journal of Preventive Medicine, 43(2), 205–214.
http://dx.doi.org/10.1016/j.amepre.2012.04.017
Li, R., Qu, S., Zhang, P., Chattopadhyay, S., Gregg, E. W., Albright, A., . . . Pronk, N. P.
(2015). Economic evaluation of combined diet and physical activity promotion
programs to prevent type 2 diabetes among persons at increased risk: A systematic
review for the Community Preventive Services Task Force. Annals of Internal
Medicine, 163(6), 452–460. http://dx.doi.org/10.7326/M15-0469
Li, R., Zhang, P., Chattopadhyay, S., & Hopkins, D. (2015). Economic evaluation of
translational programs to prevent type 2 diabetes among high risk adults.
Unpublished presentation by the Centers for Disease Control and Prevention Division
of Diabetes Translation.
Luckhaupt, S. E., Cohen, M. A., Li, J., & Calvert, G. M. (2014). Prevalence of obesity among
U.S. workers and associations with occupational factors. American Journal of
Preventive Medicine, 46(3), 237–248.
http://dx.doi.org/10.1016/j.amepre.2013.11.002
Nichols, G. A., Glauber, H. S., & Brown, J. B. (2000). Type 2 diabetes: Incremental medical
care costs during the 8 years preceding diagnosis. Diabetes Care, 23(11), 1654–
1659. http://dx.doi.org/10.2337/diacare.23.11.1654
Nichols, G. A., Hillier, T. A., & Brown, J. B. (2007). Progression from newly acquired
impaired fasting glucose to type 2 diabetes. Diabetes Care, 30(2), 228–233.
http://dx.doi.org/10.2337/dc06-1392
Selvin, E., Steffes, M. W., Zhu, H., Matsushita, K., Wagenknecht, L., Pankow, J., . . .
Brancati, F. L. (2010). Glycated hemoglobin, diabetes, and cardiovascular risk in
nondiabetic adults. The New England Journal of Medicine, 362(9), 800–811.
http://dx.doi.org/10.1056/NEJMoa0908359
Shrestha, S., Zhang, P., Hora, I., Gregg, E. (2016). Trajectory of excess medical
expenditures 9 years before and after the incidence of diabetes among adults, 2001–
2013. Unpublished Abstract.
Taradash, J., Kramer, M., Molenaar, D., Arena, V., Vanderwood, K., & Kriska, A. M. (2015).
Recruitment for a Diabetes Prevention Program translation effort in a worksite
setting. Contemporary Clinical Trials, 41, 204–210.
http://dx.doi.org/10.1016/j.cct.2015.01.010
U.S. Census Bureau. (2016). 2002 Indexes of Industry and Occupation. Retrieved from
http://www.census.gov/people/io/
Zhang, X., Gregg, E. W., Williamson, D. F., Barker, L. E., Thomas, W., Bullard, K. M., . . .
Albright, A. L. (2010). A1C level and future risk of diabetes: A systematic review.
Diabetes Care, 33(7), 1665–1673. http://dx.doi.org/10.2337/dc09-1939
Zhuo, X., Zhang, P., Barker, L., Albright, A., Thompson, T. J., & Gregg, E. (2014). The
lifetime cost of diabetes and its implications for diabetes prevention. Diabetes Care,
37(9), 2557–2564. http://dx.doi.org/10.2337/dc13-2484