
TECHNICAL REPORT - dtic.mil TECHNICAL REPORT Use of Target Shape and Size in Classification of UXO...
35
TECHNICAL REPORT Use of Target Shape and Size in Classification of UXO in Survey Data SERDP Project MR-1455 DECEMBER 2005 Jim R. McDonald AETC Incorporated David W. Opitz Stuart Blundell Visual Learning Systems, Inc.
Transcript of TECHNICAL REPORT - dtic.mil TECHNICAL REPORT Use of Target Shape and Size in Classification of UXO...

TECHNICAL REPORT Use of Target Shape and Size in
Classification of UXO in Survey Data
SERDP Project MR-1455
DECEMBER 2005 Jim R. McDonald AETC Incorporated David W. Opitz Stuart Blundell Visual Learning Systems, Inc.

Report Documentation Page Form ApprovedOMB No. 0704-0188
Public reporting burden for the collection of information is estimated to average 1 hour per response, including the time for reviewing instructions, searching existing data sources, gathering andmaintaining the data needed, and completing and reviewing the collection of information. Send comments regarding this burden estimate or any other aspect of this collection of information,including suggestions for reducing this burden, to Washington Headquarters Services, Directorate for Information Operations and Reports, 1215 Jefferson Davis Highway, Suite 1204, ArlingtonVA 22202-4302. Respondents should be aware that notwithstanding any other provision of law, no person shall be subject to a penalty for failing to comply with a collection of information if itdoes not display a currently valid OMB control number.
1. REPORT DATE FEB 2011
2. REPORT TYPE N/A
3. DATES COVERED -
4. TITLE AND SUBTITLE Use of Target Shape and Size in Classification of UXO in Survey Data
5a. CONTRACT NUMBER
5b. GRANT NUMBER
5c. PROGRAM ELEMENT NUMBER
6. AUTHOR(S) 5d. PROJECT NUMBER
5e. TASK NUMBER
5f. WORK UNIT NUMBER
7. PERFORMING ORGANIZATION NAME(S) AND ADDRESS(ES) Strategic Environmental Research & Development Program,901 StuartStreet, Suite 303,Arlington,VA,22203
8. PERFORMING ORGANIZATIONREPORT NUMBER
9. SPONSORING/MONITORING AGENCY NAME(S) AND ADDRESS(ES) 10. SPONSOR/MONITOR’S ACRONYM(S)
11. SPONSOR/MONITOR’S REPORT NUMBER(S)
12. DISTRIBUTION/AVAILABILITY STATEMENT Approved for public release, distribution unlimited
13. SUPPLEMENTARY NOTES The original document contains color images.
14. ABSTRACT
15. SUBJECT TERMS
16. SECURITY CLASSIFICATION OF: 17. LIMITATION OF ABSTRACT
SAR
18. NUMBEROF PAGES
34
19a. NAME OFRESPONSIBLE PERSON
a. REPORT unclassified
b. ABSTRACT unclassified
c. THIS PAGE unclassified
Standard Form 298 (Rev. 8-98) Prescribed by ANSI Std Z39-18

CONTENTS .................................................................................................................................... i FIGURES........................................................................................................................................ ii 1.0 INTRODUCTION .............................................................................................................1 1.1 Year 1 Project Goals ...............................................................................................2 1.2 Year 1 Results .........................................................................................................3 1.3 Year 2 Project Goals ...............................................................................................3 2.0 Summary of the Approach Developed for UXO Detection................................................4 2.1 Creating a Training Set ............................................................................................4 2.2 Run the Target Ranker .............................................................................................7 2.3 Application of the Approach to the Common Vehicular and Airborne Data ..........7 3 METHODS .........................................................................................................................8 3.1 Task 1: Develop a Probabilistic Evaluator...............................................................8 3.2 Task 2: Evolve Size and Shape Characterizations..................................................9 3.3 Task 3: Develop an Enhanced Target Picker and Target Ranker ............................9 3.4 Task 4: Evaluate the Target Picker and Target Ranker .........................................10 4.0 RESULTS .........................................................................................................................10 4.1 Methodology..........................................................................................................11 4.2 Datasets .................................................................................................................12 4.3 Learning Parameters ..............................................................................................15 4.4 Vehicular MTADS Survey of the 10-Acre Seeded Site: Dipole Processing .......16 4.5 Vehicular MTADS Survey of the 10-Acre Seeded Site: Analytic Signal Processing ..................................................................................................17 4.6 Airborne MTADS Survey of the 10-Acre Seeded Site: Dipole Processing .............................................................................................................18 4.7 Airborne MTADS Survey of the 10-Acre Seeded Site: Analytic Signal Processing ..................................................................................................19 4.8 South and West Survey Area Datasets...................................................................21 4.9 Vehicular Survey of the South Area: Dipole Signal Processing............................21 4.10 Airborne Survey of the South Area: Dipole Signal Processing.............................22 4.11 Airborne Survey of the South Area: Analytic Signal Processing ..........................22 4.12 Vehicular Survey of the West Area: Dipole Signal Processing.............................22 4.13 Airborne Survey of the West Area: Dipole Signal Processing ..............................23 4.14 Airborne Survey of the West Area: Analytic Signal Processing ...........................23 4.15 Airborne Survey of the Entire 1,685-Acre Site: Analytic Signal Processing .........23 5.0 CONCLUSIONS AND FUTURE WORK .......................................................................27 6.0 REFERENCES .................................................................................................................29
i

FIGURES 1. Progress during year one from the UX1455 Program Plan. .....................................................2 2. The two-pass workflow approach for automatic classification of UXO. The Target Picker provides a semi-automated method for generating ROIs and the Target Ranker classifies the ROI and assigns a confidence interval. .......................................5 3. The left image shows ten training set examples from the airborne survey of the seeded site. The right image is a close-up of a digitized polygon (example 1) showing how the analyst has drawn the outline around the center of the UXO target.............5 4. Screen clip showing the Feature Analyst user interface setup, which provides options for the user to define the parameters for the learning algorithm used as the Target Picker. .......................................................................................................................6 5. Sample ROI shapes for a UXO target on the left and a non-UXO target on the right ............10 6. For the vehicular dipole data, the four UXO locations, shown in the black outline boxes, caused inclusion of most of the false positives in during classification. The white circles are map symbols showing the location of the seeded UXO.......................10 7. Portion of a USGS 7.5 minute topo map of Bouquet Table. The border of the Impact Range is outlined in orange. The areas shaded in blue were surveyed in 2001 with the vehicular and Airborne MTADS. These data were used in this project .........13 8. Magnetic anomaly image map in dipole format for the Airborne MTADS survey of the Impact Range on Bouquet Table ..................................................................................14 9. Image clips (dipole presentation on the left, analytic signal on the right) of the two complementary 24-bit GeoTIFF images from the vehicular survey data ........................15 10. Spatial input pattern in Feature Analyst showing a sample Bull’s Eye pattern (#1, width 11), Square Pattern (width 9), and Manhattan pattern (width 9). The blue boxes represent pixels used by the learning algorithm and the red squared box in the center is the pixel at which the prediction is being made. The different arrangements provide alternative mechanisms for which to include spatial context in the learning process ............................................................................................................16 11. ROC Curve for the dipole analysis of the vehicular survey of the Seed Target Area. The Target Picker returned 74 ROIs including the 25 UXO seed targets....................17 12. Analytic Signal processing proved to reduce the amount of clutter overall with the exception of two important ground truth UXO outlier points (a) and (b) (at coordinates (722786, 4838120) and (722819, 4838143) respectively). Two typical analytic signal ground truth points are shown in (c) and (d) .........................................................18
ii

13. ROC curve for the dipole analysis of the airborne survey of the Seed Target Area. The Target Picker returned 73 ROIs including the 25 seed UXO targets..................19 14. ROC curve for the airborne survey of the Seed Target Area with Analytic Signal Analysis. The Target Picker returned 97 ROIs.........................................................20 15. ROC curve for the vehicular survey of the South Area with dipole analysis. The Target Picker returned 151 ROCs..................................................................................21 16. ROC curve for the dipole analysis of the airborne survey of the South Area. The Target Picker returned 155 ROIs....................................................................................22 17. ROC curve for the analytic signal analysis of the airborne survey of the South Area. The Target Picker returned 189 ROIs .........................................................................22 18. ROC curve for the vehicular survey of the West Area with dipole presentation analysis. The Target Picker returned 127 ROIs ...................................................................22 19. ROC curve for the airborne survey of the West Area with dipole image analysis...............23 20. ROC curve for the airborne survey of the West Area with analytic signal image analysis..................................................................................................................................23 21. Shown is a 100 X 200 m clip from the Airborne Analytic Signal image map generated from the target ranker. ROI shapes are superimposed on the image. Shape numbers 1, 2, and 3 closely resemble UXO; the target ranker assigned them probabilities 0.97, 0.84, and 0.95. Shape numbers 4, 5, and 6 do not resemble UXO, their evaluated probabilities were 0.03, 0.04, and 0.03......................................................................................24 22. ROC curve for the entire Airborne Survey. The Target Picker returned 5,985 ROIs. 1,293 anomalies were declared as UXO. The analyst correctly identified 18 of 19 UXO projectiles......................................................................................25 23. Screen clip from the MTADS DAS analysis of the 8 in projectile appearing as a false negative above in the airborne analysis. On the left, the anomaly as it appears in the dipole data is boxed by the analyst. The center image shows the data selected for fitting. The right image shows the individual sensor tracks over the anomaly ..................................................................................................................26 24. 60 X 60 m clip from the Analytic Signal presentation showing the false negative target at the center of the image ..............................................................................26
iii

1.0 INTRODUCTION
AETC, working with our subcontractor and partner, Visual Learning Systems, Inc. (VLS) has completed Year 1 of our development of a UXO ta rget picker and probabili stic classifier based primarily on shape metrics within an inductive learning softw are environment for detecting and discriminating UXO. This effort builds upon our prior research effort in the Seed Project, SERDP UX-1354. In the Seed Project, working with vehicular towed-array data from the 2001 Badlands Bombing Range (BBR) UXO survey, we showed that:
• Little or no further perform ance gain can likely be achieved using m achine-learning techniques that focus on ly on the ph ysics-based fitting parameters to make decisions about ordnance classification;
• There is substantial value in the use of shape and size information derived from target images created from high-density mapped sensor data to make ordnance classification decisions;
• Pattern recognition techniques that incorporate s ize and shape inform ation can dramatically reduce the nu mber of non-UXO targets while m aintaining most of the sensitivity of traditional physics-based approaches for finding true UXO.
As a result of the progress m ade in the Seed P roject, we proposed and were approved to undertake an additional two year e ffort. The prim ary focus of the new project is to develop an automated target selection and analysis approach for UXO that uses size and shape m etrics from two-dimensional magnetic anomaly signature im ages to in crease the accuracy of subsurface UXO detection while reducing the number of false positives UXO declarations. As we did in the Seed Project, we are us ing an existing commercial automated feature extraction (AFE) software utility, Feature Analyst ® as the base inductive learning system for UXO det ection and classification. This software utility was developed and is owned by VLS, Inc. It is designed and interfaced to operate as a fe ature extraction software extens ion for le ading commercial geographic information systems (GIS) and remo te sensing and photogramm etry applications including ESRI ArcGIS, Leica Geosystem s ERDAS IMAGINE, Intergraph GeoMedia and BAE Systems SOCET SET. To use Feature Analyst one must have one of these applications to access the various tools, algorithms and workflows used for feature extraction and target recognition. In this project Feature Analyst operates in conjunc tion with ArcGIS. Geosoft OASIS Montaj has also developed an extension for ESRI ArcGIS , which allows Analysts to acces s VLS and Geosoft tools within the sa me host GIS applica tion. The shape functions (Regions of Interest, ROIs) created by Feature Analyst o perating in an ArcGIS environment can be imported directly into Montaj.
In the 2004 Seed Project, we worked only w ith the Vehicular Multi-sensor Towed Array Detection Systems (MTADS) magnetometry survey data collected in 2001over 110 acres of the Badlands Bombing Range (BBR). Ten acres of th is area was set aside for training; it contained 25 known UXO and a bout 150 items of ordnance scrap. The latter item s were left over from prior use of the range.
During Year 1 of this project, we began developm ent of the enhanced target picker and probabilistic target classifier using the same dataset. Onc e the preliminary development work was completed, we extended the effort to evaluate MTADS Airborne survey data from this same
1

110 acre area. Following adaptations of the input pa rameters for the target picker and the target ranker for the airborne survey data analysis, the entire 1,685 acre airborne survey dataset was analyzed using the autom ated approaches de veloped for the 110 acre area. The 1,685 acre Airborne dataset was prepared by AETC and provided as m apped data files (without prior knowledge of the ground truth) to VLS for analysis . AETC prepared all vehicular and airborne survey datasets in both the st andard dipole presentation format and as Analy tic Signal presentations using Oasis Montaj routines to make the conversions. These are described in detail in later sections of this report. Figure 1 shows an adaptation of our Program Plan for this
project. Funding arrived in March 2005 and work began at a slow pace. The effort has been ramped up as we progressed with the prelim inary developments. The red crosses in F igure 1 signify efforts on tasks or subtasks that have been completed. We deferred beginning analysis of Isleta data until the second year of the project. All datasets have been developed f or this effort, which will begin in January 2006.
Activity 1st Qtr 2nd Qtr 3rd Qtr 4th Qtr 1st Qtr 2nd Qtr 3rd Qtr 4th QtrDevelop more sophisticated Target Picker
Test on Vehicular BBR DataPrepare training and test datasets from the BBR
Airborne SurveyEvaluate Target Picker with Airborne MTADS
Data (BBR Airborne Dataset)Evaluate alternative image presentation formats
for mag dataPrepare training and test datasets from
the Isleta Vehicular SurveyTest Target Picker against complex Range Data
(Isleta Vehicular Dataset)Evolve characterizaation of size and shape
parameters for Classification AlgorithmDevelop Probabilistic based ranking system
for the ClassifierTest Modified Classification Algorithm against
BBR vehicular and airborne datasetsPrepare training and test datasets from
the Isleta Airborne SurveyTrain and Test Pattern Recognition Picker and
Classifier (Isleta Airborne Dataset)Train and evaluate target picker and classifier
with EMI dataPrepare EMI training and test datasets
(From JPG Survey Data?)Evaluate alternative image presentation formats
for EM dataTest Pattern Recognition Picker and Classifier
(Using EM61 datasets)Evaluate Target Picker performance
against physical attributes pickerAnnual Report/Final Report
CY 2005 CY 2006
Figure 1. Progress during year one from the UX1455 Program Plan.
1.1 Year 1 Project Goals
During Year 1, we have: • Developed a probabilistic evaluator for the Ta rget Picker and Cla ssifier, which we now
call the Target Ranker. The resulting probabilistic based ranking system can be adjusted to either maximize UXO detections or minimize the size of the total dig list;
2

• Evolved the characterization of size and shape parameters and developed a more sophisticated Target Picker to im prove classification of UXO and m inimize false positives;
• Tested the new probabilis tic classifier approach on the origin al vehicular MTADS magnetometry data to v alidate the r esults of the probabilistic ranking system with the original results obtained in the Seed Program . All development work and testing has been carried out using both dipole and Analytic Signal image presentations;
• Adapted the target picker and target ranker for airborne MTADS da ta and evaluated its performance using alternative image presentation formats; and
• Classified the entire Airborne MTADS da taset using a UXO target model that was created from limited ground truth data collected over the seeded site. We used the UX O target model to automatically create ROIs and calculate probabilities using shape metrics.
1.2 Year 1 Results
During Year 1 research we have:
• Developed a prototype UXO classi fication tool and workflow approach that incorporates the machine learning ap proaches in Feature An alyst. The f irst learning pass uses the Target Picker to autom atically select all candidate ROIs th at are potentially UXO. The second pass, referred to as the Target Ranker, classifies each ROI primarily using shape parameters and then assigns each ROI a probability.
• During the Target Ranker phase, this shape clas sifier was trained to output a probability associated with each shape (ROI) – a num erical value (0.0-1.0) based upon how closely the shape in question matches the positiv e training exam ples. The analyst then determines the threshold probability at whic h to assum e all va lues greater are likely associated with UXO, and should be dug.
• Using the vehicular data this technique proved to reduce the number of false positives by over 50% (compared to the human analyst approach) while correctly classifying 100% of the known UXO. The result of this two-step approach, using the seeded site containing ground truth, is a Target Model for UXO that can be run in batch mode on additional data without the need for additional ground truth data.
• The value of the system is that it provides the human-in-the-loop with a simple software tool capable of (a) autom ated target selection and UXO classification (b) updating the UXO classification approach in the field th rough a sim ple interface that allows the Analyst to provide additional positive and negative examples of UXO targets and (c ) the ability to create Target Models that can be run in batch mode f or a site where the re is minimal information on UXO locations.
1.3 Year 2 Project Goals
In Year 2 of the project we will work on testi ng the UXO classification tool in a m ore complex geologic setting with more diverse UXO challe nges (using the Isle ta Pueblo vehicula r and airborne datasets). The project goals for Year 2 include:
3

• Refinement of the Target Pi cker and Target Ranker appr oaches for UXO detection and discrimination;
• Testing on the m ore complex Isleta dataset using both the vehicular and airborne MTADS survey data;
• Developing improvements to the V LS commercial Feature Analyst sof tware for us e in UXO mapping; and
• Working with EMI-array survey data.
2.0 SUMMARY OF THE APPROA CH DEVELOPED FOR UXO DETECTION
This section provides a summary of the approa ch we developed for detecting UXO using the two-pass process of Target Picker and Target Ranker (see Figure 2). Finding UXO in a survey image is analogous to the well-studied problem of automatically extracting features from remotely sensed imagery. VLS has developed a range of new machine-learning techniques and other technologies associated with feature identification in optical, multi-band, monoscopic and stereo imagery. These capabilities for Automated Feature Extraction (AFE) are all incorporated into the commercial software product Feature Analyst, which is owned by VLS. This approach addresses the AFE problem by creating a system built around machine learning, in particular, inductive learning. A human analyst employs six visual attributes to classify object s in images. These attributes are color, texture, pattern, spatial association (context), shape, and size. Feature Analys t uses m achine-learning techniques to incorporate ea ch of these characteristics during object-recognition and image classification. Using this approach provides a powerful classification capability for objects depicted in images. Several pub lished studies by the National Geospatial-Intelligence Agency,4 the US Forest Service,5 and others have evaluated the accuracy, speed, an d labor sav ings of the Feature Analyst app roach for object-recogn ition and feature extraction from imagery. In this project we are adapting and extending the cap abilities of Feature An alyst for th e identification and classification of UXO in ge ophysical magnetometry survey data. Feature Analyst provides the inductive learning framework for specific development of the Target Picker and Target Ranker algorithms. In Section 3 we pr ovide a more detailed discussion of the Target Picker parameters, as well as a discussion of the development of the Target Ranker algorithm.
2.1 Creating a Training Set
The development of the target picker relies on inductive learning, which in turn requires the use of a training set. For this problem domain, training examples are selected by a human analyst by digitizing a small (5 to 10) se t of sample UXO in the survey data image (e.g., from the MTADS magnetometry data). Ideally the training set examples should be spatially distributed and representative of the diversity of the UXO targets at the site (Figure 3).
4
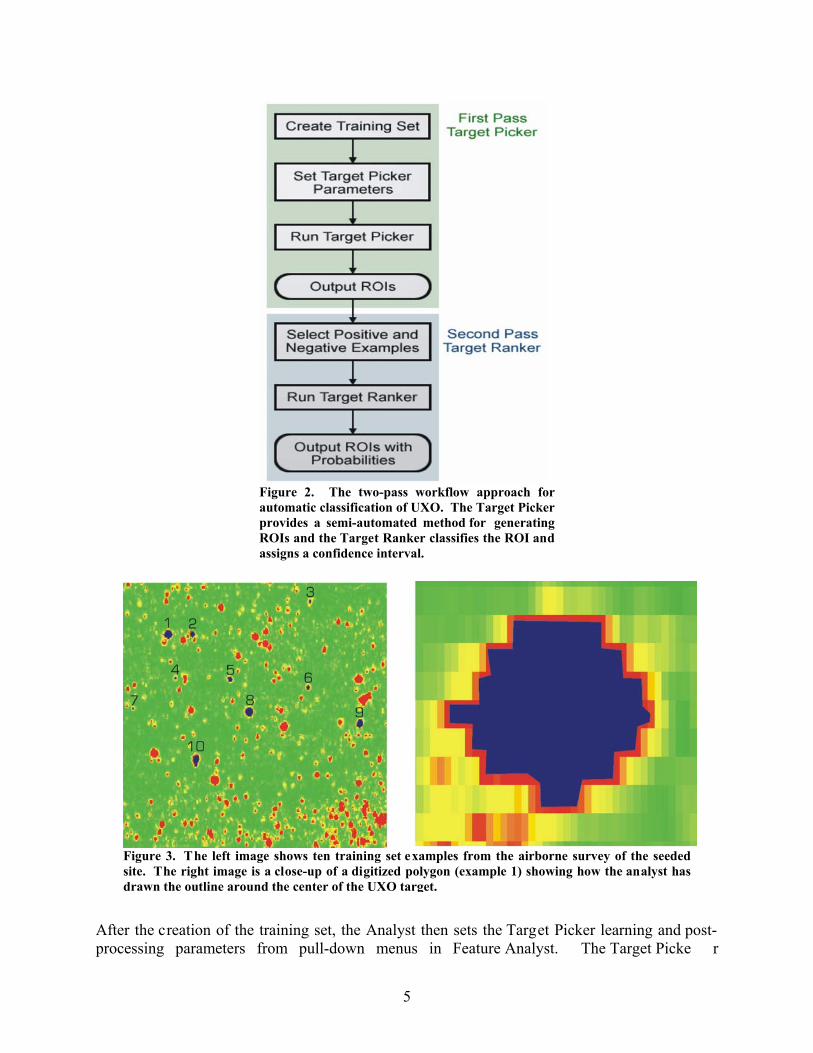
Figure 2. The two-pass workflow approach for automatic classification of UXO. The Target Picker provides a semi-automated method for generating ROIs and the Target Ranker classifies the ROI and assigns a confidence interval.
Figure 3. The left image shows ten training set examples from the airborne survey of the seeded site. The right image is a close-up of a digitized polygon (example 1) showing how the analyst has drawn the outline around the center of the UXO target.
After the creation of the training set, the Analyst then sets the Target Picker learning and post-processing parameters from pull-down menus in Feature Analyst. The Target Picke r
5

incorporates the tools in the inductive learning interface of the Featu re Analyst extension here operating within the master u tility ArcGIS. The setup s creen is sh own in Figure 4. The available parameters (including the modifications described in Section 3) include:
• Selection of Input Ba nds – For the types of color-m apped raster images used in this project, the analyst selects the default of all bands in the magnetometer image. Feature Analyst can accept multiple types of inputs in cluding thematic grids, airborne and satellite images and digital elevation models (DEMs). If all pertinent information exists in a few bands, the analyst has the ability to select only the relevant bands.
• Histogram Stretch – The analyst can apply a histogram equalization stretch to the raster image.
• Spatial Input Representation – The analyst can apply various pixel patterns to be used as spatial inputs to a learning algorithm. This is described in more detail and illustrated in Section 3.
• Aggregation – Aggregation is th e name of an algorithm that eliminates output polygons below a certain size an d fills in ho les in a polygon below a certain s ize. The size is selected by the analyst and usually corresponds with a minimum mapping unit threshold.
Figure 4. Scr een clip showing the Feature Anal yst user interface setup, which provides options for the user to define the parameters for the learning algorithm used as the Target Picker.
6

• Smoothing – The analyst has the option to use various algorithms for sm oothing the output polygon shapes to reduce the number of vertices in the output polygon.
• Rotation – Rotation is used in conjunction with th e pattern mask and learning algorithm. This parameter eliminates the n eed for the an alyst to prov ide training set ex amples of targets with similar signatures at different orientations.
2.2 Run the Target Ranker
The Target Ranker returns for each ROI an estimated probability (between 0 and 1) of the ROI being UXO. Setting up the Target Ranker requires the analyst to select a few ROI examples as UXO (positive) and non-UXO (negativ e). It then uses size and shape parameters of the ROIs to estimate a probab ility via an in ductive learning algorithm. In a ddition to assigning a probability to each ROI, the process generates a Target Model (file) that can be run in a fully-automated fashion on additional sites. W ith this approach, the T arget Model is ru n in ba tch mode; there is no requirem ent for the hum an-in-the-loop to provide a ny additional training examples or to set additional parameters.
2.3 Application of the Approach to the Common Vehicular and Airborne Data
The Feature Analyst two-pass approach for detecting and classifying UXO was applied to the 110 acre common survey area:
• Accuracy – Based on test resu lts from the seed target area and the 1 00 acre co mmon survey areas (measured against known ground tr uth) the Target Picker captured 100% of the UXO with minimal human intervention and fewer clutter (false alarms) than appeared in the human analyst physics-based dipole fitting analysis. These observations held using images derived either from the dipole data or from Analytic Signal presentations. See the details of these processes below.
• Adaptiveness – The Feature Analyst inductive lear ning approach to UXO detection and discrimination is adaptive. Once the train ing examples have been learned by both the target picker and the ranker, analys is of additional data can take place without further intervention by the human analyst. Alternatively, UXO and non-UXO discovered during field remediation can be provided back to the learning algorithm as new train ing set examples, which will allow f or update and improvement of the prediction process as remediation progress is underway.
• Efficiency – The Target Ranker outputs a probability value for each classified ROI. This allows the UXO site m anager to prioritize th e dig list. Most pr ojects do not provide either enough tim e or money to dig all su spected UXO; hence, the ability to set a confidence interval for UXO allows the team to be more efficient in recovery of the most potentially dangerous items.
• Automation – Feature Analyst provides a methodology for the Analyst to create a Target Model that can be run in a 100% autom ated batch m ode. The hum an-in-the-loop can create a model using a small portion of the site, such as we will show in detail below for the seeded s ite, and then use that model to classify the entire site. This approach was used to develop a UXO Target Model for the entire airborne BBR dataset.
7

• Software Tools – Feature Analyst is commercial software utility us ed for feature extraction throughout the geospatial comm unity. Incorporating the T arget Picker and Target Ranker workflow and alg orithms into Feature Analyst pro vides the UXO community with a promising new tool that wo rks within leading GIS and remote sensing software utilities. The purchasing or lice nsing of Feature Analyst d oes represent a significant investment. Most UX O service providers have one of the required GIS utilities resident in their ope rations. The costs of the Fe ature Analyst utility is not significantly different than ac quiring IDL (for use with the MTADS DAS) or acqu iring Geosoft utilities for UXO data processing.
3. METHODS
3.1 Task 1: Develop a Probabilistic Evaluator
The first task in this project was to develop a probabilistic evaluator for use with both the Target Picker and Targ et Ranker. In the Seed Project, the Feature An alyst predictions were developed as a two-class problem ; targets we re declared as UXO or not-UXO using only the dipole image data. The first step in developing a probabilistic evaluator required us to convert the “hard-class” predictions into “soft” probabi listic predictions. This was done by changing the activation function for the Artificial Neural Network (ANN) to m atch appropriate assumptions, which would allow it to give predictions between 0 and 1.
The next challenge was to generate an algor ithm to com bine the prob abilities from an ensemble (group) of predictions, weighted by th e perceived confidence of each ANN’s fidelity. Finally, individual predictions for each pixel we re required to be grouped and then the grouped pixels given one probability (for the Target Pi cker stage). Grouping two-dim ensional sets of probabilities to create R egions of Interest (ROI s) was done by thresholding the probabilities at 0.5 and keeping connected groups of 1’s whose groupings are greater than a minimum size.
The grouped pixels were then passed as input to the Target Ranking step where it used size and sh ape parameters to gen erate a n ew probability. W e explored several ways of generating probabilities and com bining the Target Picker predictions w ith the Ta rget Ranker predictions. To date, it works best to have the Target Ranker generate predictions independent of the Target Picker probability predictions. This is an area where additional research is required because smoothing some ROIs generated by the Target Picker can alter their shape parameters in a manner that negatively impacts the performance of the Target Ranker.
As described in the proposal, the refined Ta rget Picker and Target Rank er use the two-step process; incorporating shape metrics primarily in the classification (r anking) process. The resulting probabilistic ranking of a ll targets in the dig list can be adju sted to e ither maximize UXO detections (i.e., reduce the number of false ne gatives) or minimize the size of the total dig list at the risk of m isclassifying a few UXO. T his approach provides flexibility for the hum an-in-the-loop analyst, who we e nvision acting as a reviewer of this automated process. The probabilistic ranking pr ocess uses the probabili ties carried forward by the m ulti-step learning process (ROIs from the first pass and probabilit ies from the second pass). W e envision the
8

human analyst attention as being concentrated on the targets appearing below the dig threshold in the final ranking. The objective of this interven tion is to eliminate false negatives by providing additional insight from either visual analysis or physics-based eval uation of borderline targets. With this approach, the hum an-in-the-loop can account for site com plexities, such as geology, interferences from overlapping anomalies, glitches in the data, etc.
3.2 Task 2: Evolve Size and Shape Characterizations
Our approach for UXO detection involves the use of multiple spatial attributes including
size, shape, texture, pattern, and spatial association (contextual classification). In the first pass of learning (Target Picker) we investigated the use of shape attributes to enhance the detection of UXO targets and rem oval of clutter; however, we found that shape and size were m ore effectively used during the second stage of ra nking after candidate regi ons of interest were defined. T his is consistent with our previous experience developing su ccessful approaches to deal with sim ilar problems. In general, in th is field it is poor practic e to expect a learning algorithm to usefully incorporate all attributes in a single pass. Experim ents that we ran during the development for the seed project confirm ed that it is better to capture all candidate ROIs for UXO during an initial pass, without emphasizing discrimination between UXO and scrap, then to concentrate on recognizing non-UXO targets using probabilistic ranking during a second pass.
The shape classifier used in the previous UXO project created shape patterns based on the entire list of Feature Analyst options. These include the following attributes: number of vertices, number of holes, perimeter length, area of the shape, area of the bounding rectangle, compactness, second order moments, rotational invariant measure, and scale invariant measure. Each of these was use d with the probability classifier. W e tested various sub sets of these attributes to determine which were the m ost effective; however, in the e nd, using all attributes and allowing the learning algorithm to discri minate among them was found to be the m ost effective approach.
3.3 Task 3: Develop An Enhanced Target Picker and Target Ranker In Task 3 we developed a more sophisticated automated screening approach (pass one) to
increase the inclusion of all viable UXO candida tes, while continuing to the exten t possible to reject non-UXO. In the seed project, UX-1354, we focused on an inductive learning approach to maximize the accu racy of both classes (i.e., yield the m ost correctly classified UXO with the fewest false positives). With that approach, however, some UXO were missed.
In this project, our goal is to f orce all UXO through the target pick er step, even at the expense of significantly expanding the num ber of non-UXO ROIs. This was accom plished by creating an appropriate training se t, as described in m ore detail below. During the second pass, the intent was to predict the probability of ROIs being UXO versus non-UXO. Having the second pass of learning provide a probability ranking allows the An alyst to focus on selecting a probability threshold for specifying a dig li st with an acceptable am ount of UXO ( e.g., high confidence of 100%) with as few digs as possible. If during the digging process the lowest true UXO probabilities are too small, little scrap is removed from the dig list.
Incorporating an accurate and in clusive training set is of the utm ost importance for a learning algorithm to create accurate predictions. During our development work in this p roject,
9

we tested several alternative training sets in corporating various lear ning parameters. The training set examples were always digitized shap es of known UXO; however, we tried altering the number of exam ples used, the spatial dist ribution of exam ples, and the types of shape polygons (large, small, compact, etc). Parameters that were varied included histogram stretching of the image, rotation of the pattern mask, and spatial representa tion of the pattern m ask. Our intent was to determ ine the dependence of the quality of the output results on the training set choice and the parameters, as described in later sections.
A machine learning algorithm can be confused by a target feature that is not also easily discernable by visu al inspection (s ee Figure 5). In field data real UXO ano maly signatures have variability, which can cause difficulty in classification and discrimination of UXO fro m clutter. In the seed ed site for in stance, we found there were four (o f the 25) ROIs from the vehicular dipole dataset that tended to confuse the learner (see Figure 6). These ROIs, when class ified during the first pass, invariably returned a m ajority of the f alse positives. It is inte resting to note that three of these problem ROIs in the veh icular data d id not create the sam e difficulty in th e airborne dataset. This is likely because th e overlying small clutter above the UXO was not detectible in the airborne survey.
Figure 5. Sample ROI shapes for a UX O target on the left and a non-UXO target on the right.
3.4 Task 4: Evaluate The Target Picker and Target Ranker
We began our developm ent work in this project focusing on the Seeded Site from the 2001 BBR survey. This site contained 25 known UXO and 114 known scrap items. This dataset provides a satisfactory set of positive and negative exam ples to develop a UX O identification workflow using Feature Analyst. We conducted hundreds of experiments using this data, which are summarized in Section 4.
Figure 6. For the ve hicular dipole data, the four UXO locations, shown in the black outline boxes, caused inclusion of most of the false positives in during classification. T he white circles are m ap symbols showing the location of the seeded UXO.
4. RESULTS
This section provides the results on di scriminating UXO versus non-UXO for both the vehicular and airborne MTADS datasets collected over the BBR site. AETC provided VLS with both the dipole processed and analytic signal pr ocessed versions of the MTADS s urvey data. Results of our studies are presented primarily in the form of ROC curves for those datasets where ground-truth for UXO and non-UXO have been established. The statistics used to build the ROC
10

curves are the true positive ( UXO) and false positive (non-UXO) pr edictions. Previous reports on the BBR site describe the types of UXO and non-UXO that were planted on or dug2,3 from the BBR site.
VLS had the ground truth for the 110 acre vehicu lar survey area from our studies during the Seed Project. These sam e ground truth apply, of course, to the parts of the airborne dataset that fall within this 110 acre are a. The dipol e and Analytic Signal m apped data files for the entire 1,685 acres of the Airborne Survey were provided to VLS. The ground truth (derived from the 1,000 digs on the Airborne site) was w ithheld, however until after the analysis was complete and submitted to AETC. AETC graded the VLS declarations against the known target dig results and returned the re sults to VLS in the form of a ROC curve reported later in this report. Appendix A includes a set of tables th at provide the x-coordi nate, y-coordinate, and probability value for each prospective target from the various analyses.
4.1 Methodology
The UXO identification methodology for the results presented was as follows:
1. First pass – Target Picker: a. Hand digitize five known UXO; b. Set learning parameters as input for Feature Analyst; c. The Target Picker g ives training examples to learner and returns ROIs (shapefile
polygons).
2. Second pass – Target Ranker: a. The analyst locates and se lects positive and negative exam ples (known UXO and
known non-UXO from the ROIs selected by the Target Picker) as input to Feature Analyst Target Ranker.
b. Feature Analyst returns a UXO classif ication probability f or each shape (ROI returned by the Target P icker) based primarily on the shape characteristics of the ROI.
3. Evaluation of Experiments
a. Perform leave-one-out cross validation on the dataset to genera te the predic ted probability for each ROI. These probabilities are generated for an individual ROI when it was its turn to be left out of the training stage.
b. Develop receiver op erating characteristics (ROC) curves generated b y establishing the probabi lity threshold for predicting UXO versus non-U XO and plotting the cum ulative fraction of true positives versus the num ber of false positives.
4. Batch Processing
a. Run the trained and automated two-pass algorithms on new data. b. Set the threshold at a leve l that provides a high c onfidence that all UXO will be
retrieved, while at the sam e time, as a secondary goal, reducing the num ber of digs.
11

4.2 Datasets
The datasets used in this project during 2005 were from the 2001 survey of the Im pact Area of the Badlands Bom bing Range. The Im pact Area consists of about 2,000 acres on Bouquet Table (a high mesa) about 10 miles west of Interior South Dakota. This area was used for many years as a ground arti llery training range by the South Dakota National Guard. The projectiles fired from many directions from various firing points up to 10 miles from the center of the range. The primary aim ing point was a st ructure near the center of the range, which consisted of as many as 50 automobile bodies that were stacked in a pile. Therefore, the range, in addition to being cluttered with shrapn el from exploded projectiles , is cluttered with automobile parts (particularly near the area of the bull’s eye). Figure 7 shows a USGS topo map of the area. The I mpact Area border is shown in orange. The superim posed magnetic anomaly image is from a prior MTADS ve hicular survey conducted in 1999. Ordnance from the 1999 survey areas was cleared following the survey. Th e vehicular survey areas used in this project are shaded in blue in this figure. With the exception of the plot labeled as the Seed Target Area, none of the blue shaded areas were surveyed or cleaned du ring the 1999 survey. P rior to the 2001 survey, 25 inert seed targets were installed in the 10-acre Seed target area. They were buried, consistent with the live ordnance that was recovered follo wing the 1999 survey. All the areas shaded in blue were surveyed both with the MTADS vehicular towed array and the Airborne MTADS.
In addition, the Airborne MTADS surveyed 1,685 acres of the Im pact Area, which included virtually all the areas lying on top of Bouquet Table. Figure 8 shows a m agnetic anomaly image map of the 1,685 acre survey, presented in dipole image format.
12

13
Figure 7. Por tion of a USGS 7.5 minute topo map of Bouquet Table. The bord er of the Impac t Range is outlined in orange. The areas shaded in blue were surveyed in 2001 with the vehicular and Airborne MTADS. These data were used in this project.

14
Figure 8. Magnetic anomaly image map in dipole format for the Airborne MTADS survey of the Impact Range on Bouquet Table.
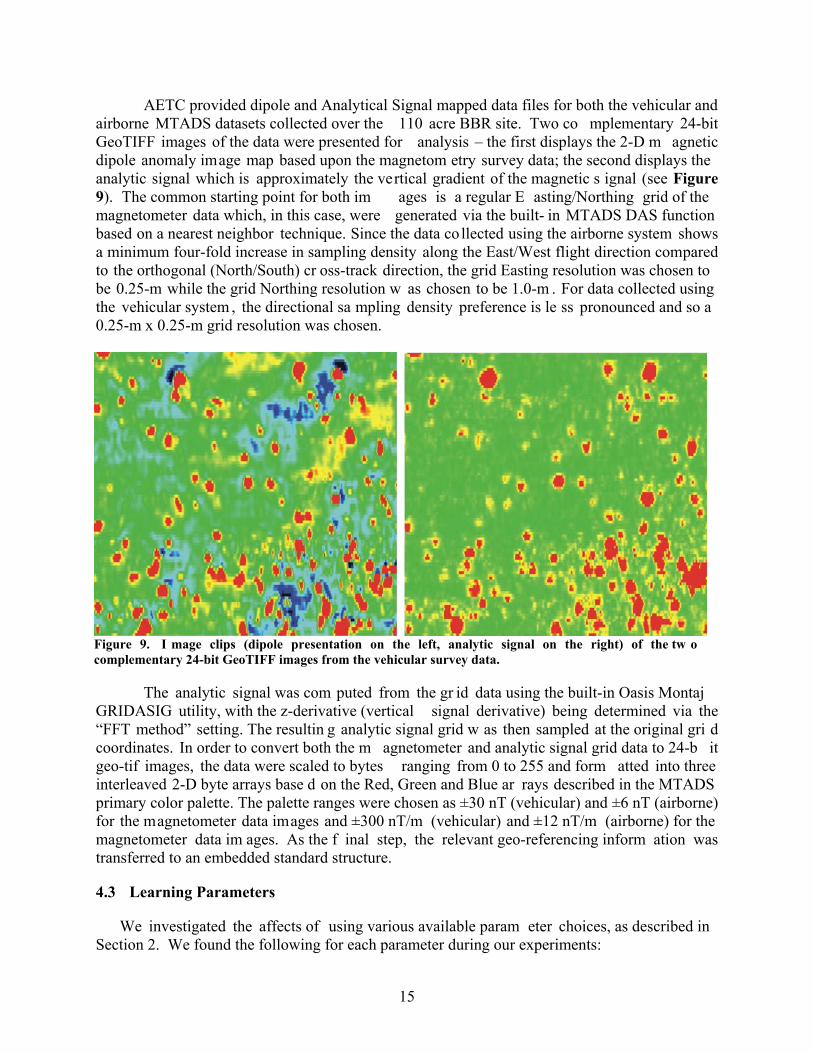
AETC provided dipole and Analytical Signal mapped data files for both the vehicular and airborne MTADS datasets collected over the 110 acre BBR site. Two co mplementary 24-bit GeoTIFF images of the data were presented for analysis – the first displays the 2-D m agnetic dipole anomaly image map based upon the magnetom etry survey data; the second displays the analytic signal which is approximately the vertical gradient of the magnetic s ignal (see Figure 9). The common starting point for both im ages is a regular E asting/Northing grid of the magnetometer data which, in this case, were generated via the built- in MTADS DAS function based on a nearest neighbor technique. Since the data co llected using the airborne system shows a minimum four-fold increase in sampling density along the East/West flight direction compared to the orthogonal (North/South) cr oss-track direction, the grid Easting resolution was chosen to be 0.25-m while the grid Northing resolution w as chosen to be 1.0-m . For data collected using the vehicular system , the directional sa mpling density preference is le ss pronounced and so a 0.25-m x 0.25-m grid resolution was chosen.
The analytic signal was com puted from the gr id data using the built-in Oasis Montaj GRIDASIG utility, with the z-derivative (vertical signal derivative) being determined via the “FFT method” setting. The resultin g analytic signal grid w as then sampled at the original gri d coordinates. In order to convert both the m agnetometer and analytic signal grid data to 24-b it geo-tif images, the data were scaled to bytes ranging from 0 to 255 and form atted into three interleaved 2-D byte arrays base d on the Red, Green and Blue ar rays described in the MTADS primary color palette. The palette ranges were chosen as ±30 nT (vehicular) and ±6 nT (airborne) for the magnetometer data images and ±300 nT/m (vehicular) and ±12 nT/m (airborne) for the magnetometer data im ages. As the f inal step, the relevant geo-referencing inform ation was transferred to an embedded standard structure.
Figure 9. I mage clips (dipole presentation on the left, analytic signal on the right) of the tw o complementary 24-bit GeoTIFF images from the vehicular survey data.
4.3 Learning Parameters
We investigated the affects of using various available param eter choices, as described in Section 2. We found the following for each parameter during our experiments:
15

• Selection of Input Bands – For the se images, it is im portant to include all bands in the GeoTIFF image.
• Histogram Stretch – The analyst can apply a histogram equalization stretch to the raster image. The experiments show that som etimes a histogram stretch can improve results; these cases are indicated below.
• Aggregation – Aggregation is an algorithm that eliminates output polygons below a certain size and fills in holes in a pol ygon below a certain size. The size of the appropriate value for each experiment is described below.
• Smoothing – Smoothing the polygons was found to improve accuracy and was done for each result presented below.
• Rotation – We found in all cases it was better to turn rotation off. • Spatial Input Representation – The analyst can apply various pixel patterns to be used
as spatial in puts to a le arning algorithm. Fo r the experiments, we tested what we felt were the most likely candidates for appropriate input representations. Various Bull’s eye patterns were tested (including #1 width 11; #2 width 11 and 13; #4 width 9 and 11), Manhattan patterns with widths 5 and 9; and Square patterns with widths 5 and 9. Figure 10 shows examples of each of these types of input patterns. We also tested various non-standard input representations that seemed to best fit observed UXO, as discussed below.
(a) Bull’s Eye (b) Manhattan 9x9 pattern (c) Square 9x9 pattern Figure 10. S patial input pattern in Feature Analyst showing a sample Bull’s Eye pattern (#1, width 11), Square Pattern (width 9), and Manhattan pattern (width 9). The blue boxes re present pixels used by the learning algorithm and the red squared box in the center is the pixel at which the prediction is being m ade. The different arrangements provide alternative mechanisms for which to include spatial context in the learning process. 4.4 Vehicular MTADS Survey of the 10-Acre Seeded Site: Dipole Processing
Figure 11 shows the ROC curve for the Veh icular MTADS dipole processed dataset for the 10 acre seeded site. 96% of the ordnance (24 of 25 seed targets) is included in the top half of the dig list. However, as shown, 100% UXO de tection (25 UXO) is not achieved until nearly 100% of the non-UXO are picked up as well. The human-in-the-loop physics-based analysis contained 134 selected candidate UXOs. The machine learning Target Picker selected only 74 ROIs, which is a reduc tion of 60 digs f or UXO candidates (with a total of 49 false positives). The training set for the first pass in the Seed Target dataset was created by first selecting a small set of examples, running the process, and then returning to the training set and adding additional
16

examples, as needed. The parameter settings used in Feature Analyst for the dipole dataset are listed below.
• Input representation o The most effective was a Square pattern of width 9.
• Aggregation o The smallest known UXO was just over 20 pixels in area; therefore, the
aggregation was set to below 20. If the resultant set returned results with the smallest known UXO polygon larger than 20 pixels, aggregation could be run at the new minimum as a post process to further reduce clutter.
• Histogram Stretch
o The results were better without the histogram stretch.
Figure 11. ROC Curve for the dipole analysis of the vehicular survey of the Seed Tar get Area. The Target Picker returned 74 ROIs including the 25 UXO seed targets.
4.5 Vehicular MTADS Survey of the 10-Acre Seeded Site: Analytic Signal Processing Two known UXO in this dataset did not contain the pixel characteristics typical of those
displayed by the rest of the ground truth set ( Figure 12). When these two exam ples were not given to the learner as part of the training set, the resulting shapefile contained between 69-119 ROIs – but did not include these two known UXO. When either one of these UXO were
17

included in the training set, th e resulting shapefile ballooned to between 393-871 ROIs. Since the dipole presentation first pass provided subs tantially fewer targets while retaining all known UXO, the Analytic Signal processed data were not further pursued.
(a) (b) (c) (d) Figure 12. Analytic Signal processi ng proved to reduce the amount of clutter overall with the exception of two important ground truth UXO out lier points (a) and (b) (at coordinates (722786, 4838120) and (722819, 4838143) respectively). Two typical analytic signal ground truth points are shown in (c) and (d).
The Feature Analyst parameter settings are listed below for the analytic signal vehicular data.
• Input representation o The optimal pattern was Bull’s Eye 1, width 11
• Aggregation o The aggregation was set to 8 since the ROIs were smaller with this data.
• Histogram Stretch o The histogram stretch improved results mildly.
As described in Section 4.2, the MTADS DAS presentations were used to scale the
pallets for the dipole images, Oasis Montaj was used to scale the pallets for the Analytic Signal images. Pallets with on ly a single vertical s cale were prov ided to VLS for each presentation . Selections were made which provided a reas onable representation for the known UXO (±30 nT for the vehicle dipole data and ±300 nT/m fo r the vehicle Analytic Signal data). The representation, as shown in the two examples on the left of Figure 10 was too course for th e Analytic Signal data. It is likely that a na rrower pallet presentation (120 nT/ m or 150 nT/ m) would have worked better for this particular analysis.
4.6 Airborne MTADS Survey of the 10-Acre Seeded Site: Dipole Processing
Figure 11 shows the ROC curve for the airborne MTADS dataset with dipole processing. A total of 73 ROIs were selected by the Target Picker. 100% of the UXO are classified correctly when the threshold is reduced to 0.05. At this threshold valu e, a total of 96% of the non-UXO were incorrectly classified as UXO, totaling 46 false positives. Th e input parameter settings are given below.
• Input representation o User defined rectangular pattern as follows. The width of each pixel
comprising the airborne dataset is 1/4 th the height of the pixel (as described
18
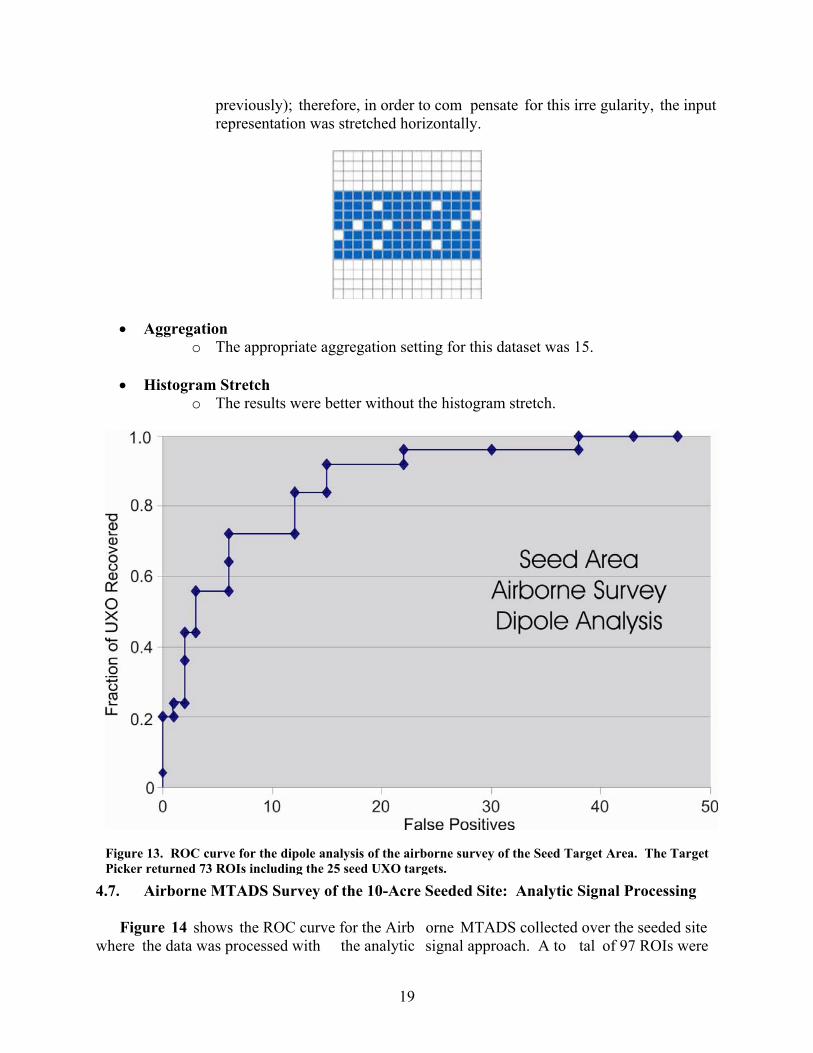
previously); therefore, in order to com pensate for this irre gularity, the input representation was stretched horizontally.
• Aggregation o The appropriate aggregation setting for this dataset was 15.
• Histogram Stretch o The results were better without the histogram stretch.
4.7. Airborne MTADS Survey of the 10-Acre Seeded Site: Analytic Signal Processing
Figure 13. ROC curve for the dipole analysis of the airborne survey of the Seed Target Area. The Target Picker returned 73 ROIs including the 25 seed UXO targets.
Figure 14 shows the ROC curve for the Airb orne MTADS collected over the seeded site
where the data was processed with the analytic signal approach. A to tal of 97 ROIs were
19

selected by the Target Picker. All of the UXO were classified correctly with 57% of the non-UXO returned by the T arget Ranker as false positives (41). The param eter settings for the Target Picker are listed below:
• Input representation o User defined rectangular pattern as follows . The airborne datasets pixel
dimensions are vertically oblong; therefor e, in order to co mpensate for this irregularity, the input representation was stretched horizontally.
• Aggregation
o The aggregation was set to 8 to match the size of the ROIs for this dataset.
• Histogram Stretch o Experiments were run with and without applying a histogram stretch, and it is
best to not have a histogram stretch.
Figure 14. ROC curve for the airborne survey of the Seed Target Area with Analytic Signal Analysis. The Target Picker returned 97 ROIs.
20

4.8 South and West Survey Area Datasets
The design of Feature Analyst allows the analyst to deve lop a target recognition or feature extraction model and then apply the m odel in an automated mode. This provides (a) an automated approach for treating multiple s imilar datasets; (b) a m ethodology for sharing workflows, and (c) a fram ework for develop ing a library of feature extraction m odels. As described above, we de veloped target recognition models using vehicular and airborne surve y data from the Seed Target Area for both dipole and analytic signal im age presentations. The results from the analytic signal and dipole a irborne datasets were similar. The pala te that was chosen for the vehicular analy tic signal image of the Seed Target Area was likely too course, leaving two of the known UXO as uncharacterized.
Because of their work with these d atasets during the Seed Project (U X-1322) VLS had the ground truth (based on the dig results) for the South and W est vehicular survey areas. Therefore, as a logical next step th e target recognition models developed from the Seed Target Area were tested on these lim ited survey areas. The target recognition m odels, generated from the Seed Site, were app lied to the South and West analytic si gnal and dipole airborne survey datasets, and the vehicular dipole datasets. Feature Analyst provides a menu option called Batch Processing for applying target models to new data. The South and West locations each contained 3 known UXO; thus the ratio betw een correctly classified UXO and incorre ctly classified non-UXO is very dissimilar to that of the seeded site. Results for these areas are presented below.
The probabilities returned by the Target Ranker for the known UXO i n the South and West survey areas were high co mpared to most of the non -UXO. The seeded site appears to contain more obscure and borderline UXO than the South and West locations; for this reason the threshold could potentially be incr eased for the South and West data sets. I t is likely that the signals of the inert UXO in the Seed Target Area were more varied and difficult to characterize because some of them were poorly degaussed and because they were physically located close to the bull’s eye and were therefore bu ried in the midst of relatively high levels of metallic clutter from exploded ordnance and from car body parts s cattered about from proj ectile explosions. Perhaps the target recognition models prepared from the seed target area are m ore robust for these reasons.
4.9 Vehicular Survey of the South Area: Dipole Signal Processing
The ROC curve for the vehicu lar survey of the South Area is shown in Figure 15. All the UXO were identified in the top 30% of the dig list. In the vehicular survey of the Seeded Area effectively 100% of the dig list had to be excavated to recover all UXO.
Figure 15. ROC curve for the vehicular survey of the South Area with dipole analysis. The Target Picker returned 151 ROCs.
21

4.10 Airborne Survey of the South Ar ea: Dipole Signal Processing
Figure 16 shows the ROC curve for the dipole analysis of the airborne survey of the South Area. The total num ber of ROIs returned by the targ et picker was sim ilar to the dipole analysis of the vehicular survey of the same area. Less than half of the dig list would have to be d ug to recover all the ordnance.
Figure 16. ROC curve for the dipole analysis of the airborne survey of the South Area. The Target Picker returned 155 ROIs.
4.11 Airborne Survey of the South Area: Analytic Signal Processing
Figure 17 shows the ROC curve for the same survey shown in Figure 16. In this case the analysis was based upon the analytic signal image. The target picker returned more ROIs than the dipole analysis, however the U XO were recovered at the very top of th e dig list. The South Area, at 20 acres is twice as large as the Seed Target Area.
Figure 17. ROC curve for the analytic signal analysis of the airborne survey of the South Area. The Target Picker returned 189 ROIs.
4.12 Vehicular Survey of the West Area: Dipole Signal Processing
The West Survey Area, at sligh tly over 40 acres, lies well south of the bull’ s eye. Figure 18 shows the ROC curve for the dipole processing of the vehicular survey. The target picker returned only 127 ROIs for the area, which is twice as large as the number returned for the vehicular survey of the South Area. Based upon digging in 2001, three UXO were recovered fro m the area.
Figure 18. ROC curve for the vehicular survey of the West Area with dipole presentation analysis. T he Target Picker returned 127 ROIs.
22
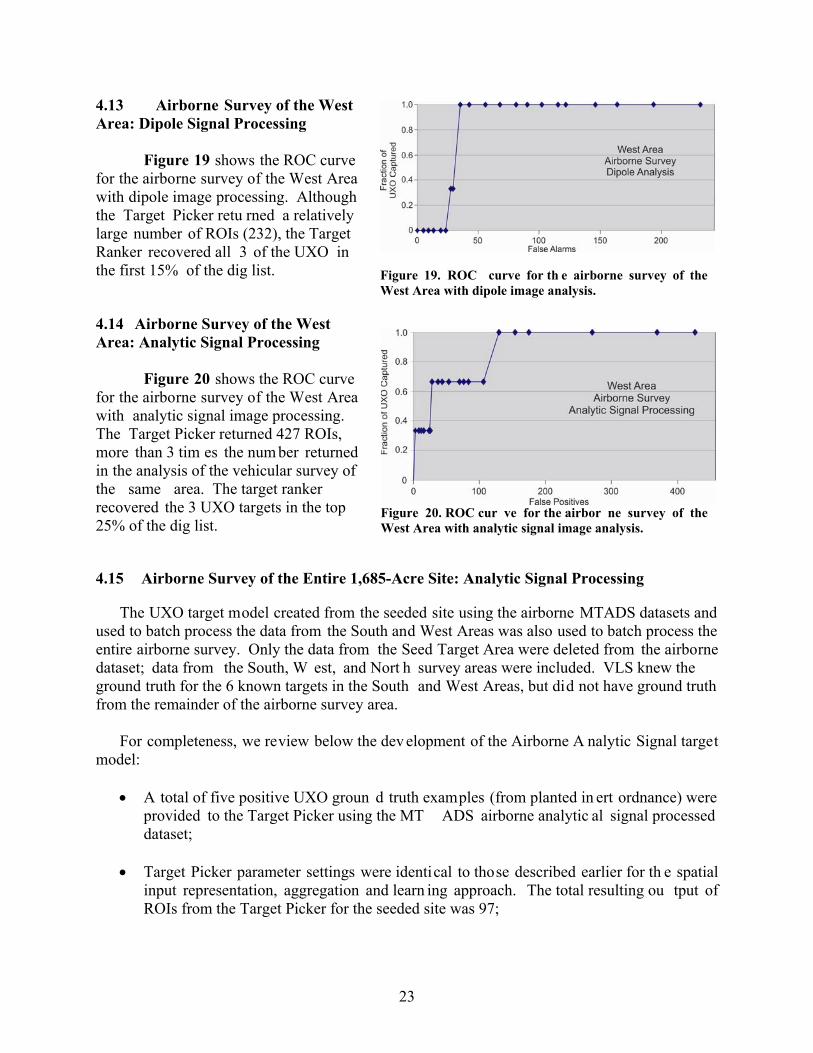
4.13 Airborne Survey of the West Area: Dipole Signal Processing
Figure 19. ROC curve for th e airborne survey of the West Area with dipole image analysis.
Figure 19 shows the ROC curve
for the airborne survey of the West Area with dipole image processing. Although the Target Picker retu rned a relatively large number of ROIs (232), the Target Ranker recovered all 3 of the UXO in the first 15% of the dig list. 4.14 Airborne Survey of the West Area: Analytic Signal Processing
Figure 20 shows the ROC curve for the airborne survey of the West Area with analytic signal image processing. The Target Picker returned 427 ROIs, more than 3 tim es the num ber returned in the analysis of the vehicular survey of the same area. The target ranker recovered the 3 UXO targets in the top 25% of the dig list.
Figure 20. ROC cur ve for the airbor ne survey of the West Area with analytic signal image analysis.
4.15 Airborne Survey of the Entire 1,685-Acre Site: Analytic Signal Processing
The UXO target model created from the seeded site using the airborne MTADS datasets and used to batch process the data from the South and West Areas was also used to batch process the entire airborne survey. Only the data from the Seed Target Area were deleted from the airborne dataset; data from the South, W est, and Nort h survey areas were included. VLS knew the ground truth for the 6 known targets in the South and West Areas, but did not have ground truth from the remainder of the airborne survey area.
For completeness, we review below the dev elopment of the Airborne A nalytic Signal target model:
• A total of five positive UXO groun d truth examples (from planted in ert ordnance) were provided to the Target Picker using the MT ADS airborne analytic al signal processed dataset;
• Target Picker parameter settings were identical to those described earlier for th e spatial
input representation, aggregation and learn ing approach. The total resulting ou tput of ROIs from the Target Picker for the seeded site was 97;
23
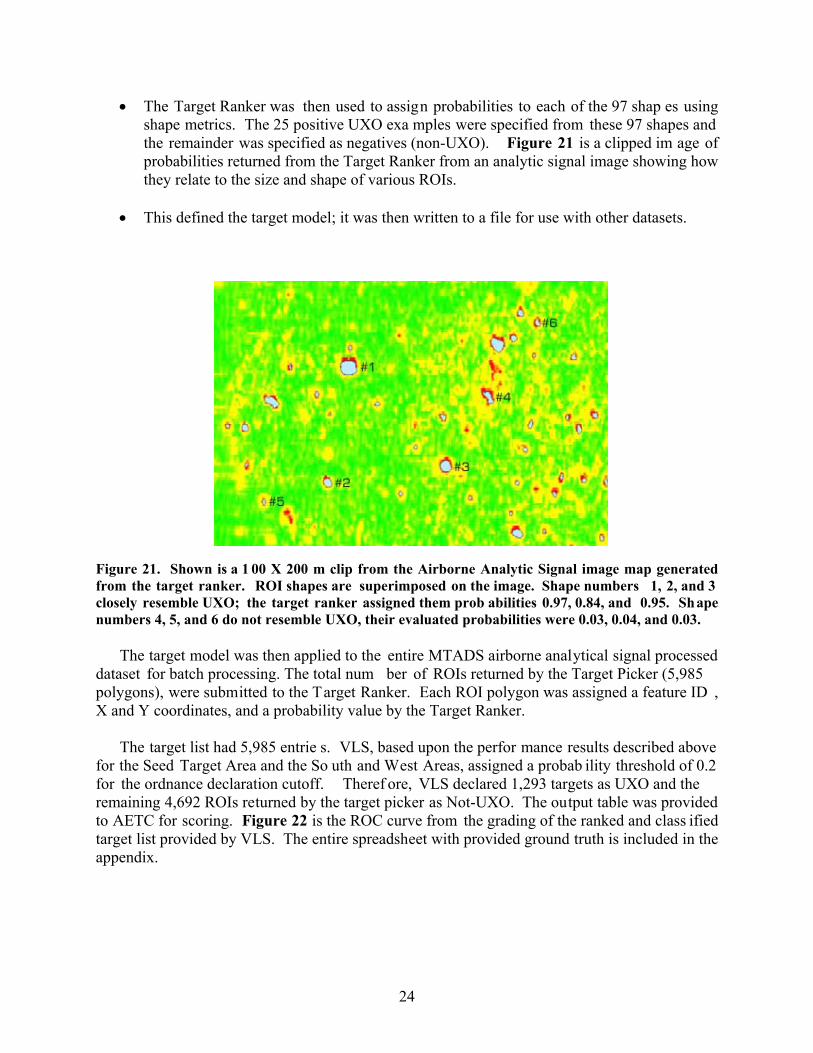
• The Target Ranker was then used to assign probabilities to each of the 97 shap es using shape metrics. The 25 positive UXO exa mples were specified from these 97 shapes and the remainder was specified as negatives (non-UXO). Figure 21 is a clipped im age of probabilities returned from the Target Ranker from an analytic signal image showing how they relate to the size and shape of various ROIs.
• This defined the target model; it was then written to a file for use with other datasets.
Figure 21. Shown is a 1 00 X 200 m clip from the Airborne Analytic Signal image map generated from the target ranker. ROI shapes are superimposed on the image. Shape numbers 1, 2, and 3 closely resemble UXO; the target ranker assigned them prob abilities 0.97, 0.84, and 0.95. Shape numbers 4, 5, and 6 do not resemble UXO, their evaluated probabilities were 0.03, 0.04, and 0.03.
The target model was then applied to the entire MTADS airborne analytical signal processed dataset for batch processing. The total num ber of ROIs returned by the Target Picker (5,985 polygons), were submitted to the Target Ranker. Each ROI polygon was assigned a feature ID , X and Y coordinates, and a probability value by the Target Ranker.
The target list had 5,985 entrie s. VLS, based upon the perfor mance results described above for the Seed Target Area and the So uth and West Areas, assigned a probab ility threshold of 0.2 for the ordnance declaration cutoff. Theref ore, VLS declared 1,293 targets as UXO and the remaining 4,692 ROIs returned by the target picker as Not-UXO. The output table was provided to AETC for scoring. Figure 22 is the ROC curve from the grading of the ranked and class ified target list provided by VLS. The entire spreadsheet with provided ground truth is included in the appendix.
24
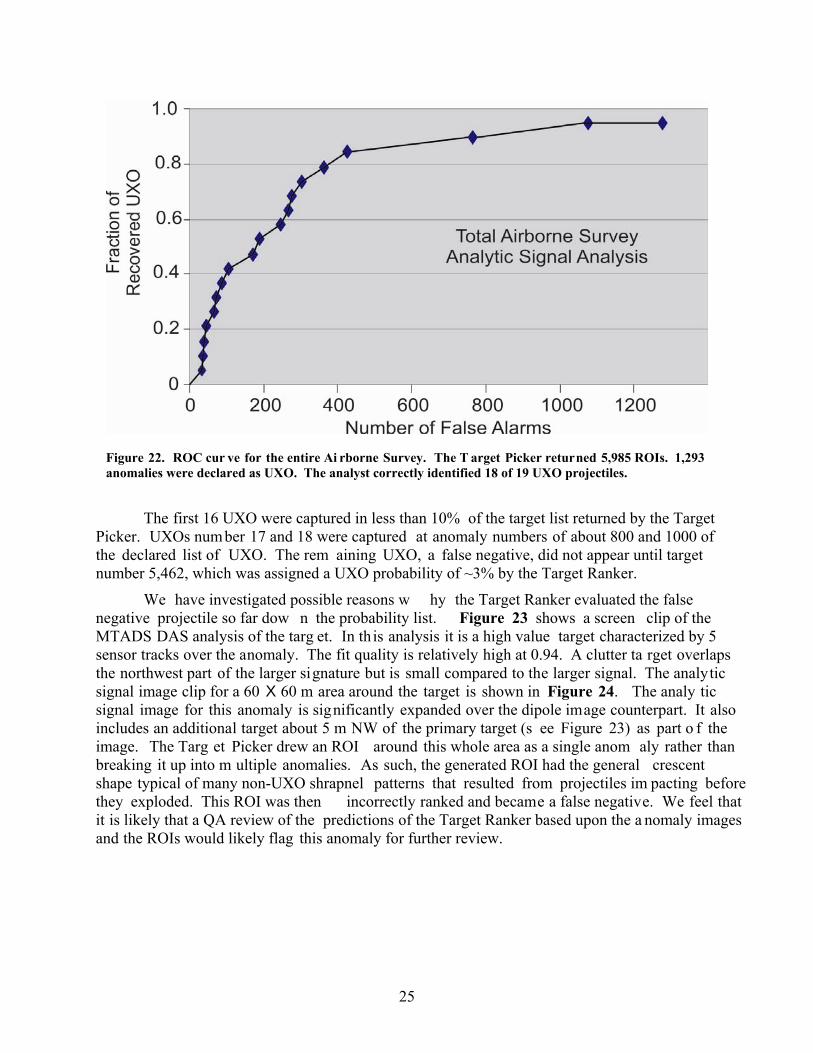
Figure 22. ROC cur ve for the entire Ai rborne Survey. The T arget Picker returned 5,985 ROIs. 1,293 anomalies were declared as UXO. The analyst correctly identified 18 of 19 UXO projectiles.
The first 16 UXO were captured in less than 10% of the target list returned by the Target Picker. UXOs number 17 and 18 were captured at anomaly numbers of about 800 and 1000 of the declared list of UXO. The rem aining UXO, a false negative, did not appear until target number 5,462, which was assigned a UXO probability of ~3% by the Target Ranker.
We have investigated possible reasons w hy the Target Ranker evaluated the false negative projectile so far dow n the probability list. Figure 23 shows a screen clip of the MTADS DAS analysis of the targ et. In th is analysis it is a high value target characterized by 5 sensor tracks over the anomaly. The fit quality is relatively high at 0.94. A clutter ta rget overlaps the northwest part of the larger signature but is small compared to the larger signal. The analytic signal image clip for a 60 X 60 m area around the target is shown in Figure 24. The analy tic signal image for this anomaly is significantly expanded over the dipole image counterpart. It also includes an additional target about 5 m NW of the primary target (s ee Figure 23) as part o f the image. The Targ et Picker drew an ROI around this whole area as a single anom aly rather than breaking it up into m ultiple anomalies. As such, the generated ROI had the general crescent shape typical of many non-UXO shrapnel patterns that resulted from projectiles im pacting before they exploded. This ROI was then incorrectly ranked and became a false negative. We feel that it is likely that a QA review of the predictions of the Target Ranker based upon the a nomaly imagesand the ROIs would likely flag this anomaly for further review.
25

Figure 23. Screen clip from the MTADS DAS analysis of the projectile appearing as a false negative above in the airborne analysis. On the l eft, the anomaly as it appears in the dipole data is boxed by the analyst. The center image shows the data selected for fitting. The right image shows the individual sensor tracks over the anomaly.
Figure 24. 60 X 60 m clip from the Analytic Signal presentation showing the fals e negative target at the center of the image.
26

5. CONCLUSIONS AND FUTURE WORK • During the first year of this project we deve loped a prototype classification tool using the
Feature Analyst framework to differentiate UXO from non-UXO. As part of this task, the shape classifier was adapted to output a certainty probability fo r each shape – a numerical value between 0.0 and 1.0. This pr obability evaluates how closely the shape matches the positive ex amples that were used to for m the target m odel. The analy st or site manager must then determine the probabi lity threshold at which to assume that all targets with higher values should be classi fied as UXO, an d should therefore beco me priority dig targets. W e note again that th e classifier can be updated at any tim e during the digging process by providing the dig results (positive a nd negative) to updating the target model.
• We have shown that it is pos sible to correctly identify w ith high confiden ce all of the
UXO among the ROIs selected by the target pi cker. The two-pass workflow in Feature Analyst with the Targ et Picker and Ta rget Ranker m odules operating separately successfully separates the ROIs into likel y UXO and targets unlikely to be UXO. The target ranker routinely batch processed the entire (massive) airborne dataset and ranked all ROIs. Using a conservative threshol d of 0.20 provided a UXO dig list with about 1,300 entries. This number of entries is si milar to the dig list generated by the MTADS DAS analyst using physics-based algorithm s and hands-on analysis of each individual target. The latter process required ~35 hour s of analyst tim e. Eighteen of nineteen known UXO were correctly identified by the automated target ranker.
As an aside, the ground truth for this exer cise is based upon the 1,000 targets dug behind the MTADS DAS analysis. There is no proof that the MTADS DAS analysis identified all the intact projectiles from the airborne survey dataset.
• The analytical signal processing of the magnetometer data was important, particularly for
the airborne datasets. Using the analytical signal data als o has the advantage th at it locates the coordinates correctly for the individual targets. When working with the dipole presentations, only the positive lo bes of the dipole signatures are used f or training because various orientations of the individual targets creates such a variable dipole image when the negative part of the signature is included that it is not practical to try to train on the full dipole signature.
• What results from this two-step approach, using the seeded site containing ground truth,
is a Target Model for UXO that can be run in batch mode. Further benefits include:
o The UXO dig list is automatically prioritized based on the probability values from the target ranker. The pr obabilities generated by the target ranker are based upon mathematically and statistically sound principles. The binning probabilities generated by the human analyst from the MTADS DAS, and by others using other physics-based fitting algorithms are basically intuitive (gut-feel) assignments that vary from analyst to analyst.
27

o Digging the high-probability UXO targets ba sed upon the target ranker optim izes both budget and schedule constraints. W e assume that the approach developed in this project is unlikely to ever be used without review by a hum an analyst. The most experienced available analyst shoul d focus on mid-range probability values, particularly those immediately below the UXO cutoff threshold. A human analyst can also likely make significant contributions by reviewing the targets on the dig list above the cutoff threshold. VLS was instructed that a fence line surrounded the range, that a group of trailers was parked in the north central part of the site, and that a destroyed homestead (with a reinforced concrete basement) was located northwest of the crossroads. These areas were censored fro m their data analysis , however many other areas such as ground water sam pling wells, geological benchmarks, trash collecting barrels, rem nants of pas t internal fences, and geological interferences we re not disclosed. Many of these features can be identified by visual ins pection of the da ta by an analyst and targets associated with them deleted from the dig list.
o The two-pass workflow and assignment of probabilities to UXO targets allows the analyst or the site m anager to export mid-range probability UXO targets to a traditional physics-based classifier. This workf low approach has the po tential to integrate the best too ls of both in ductive learning approaches and established geophysical techniques such as dipole fitting.
• In a wide area search of a new area such as that carried ou t using the MTADS airborne
dataset, Feature Analyst, used with the pr ototype UXO Toolkit developed in this project, can be used to quickly and autom atically classify all candidate ROIs returned by the Target Picker. Even without any prior existi ng ground truth, the parameters for the target picker can be opened up to pass target sizes consistent with the known site usage. Subsequently, the target ranke r can be programmed with a target m odel from other sites that contain ordnance known to be present at the current site. The target p icker and ranker can be run with these pa rameters in a batch m ode to generate a prelim inary dig list. As targets are dug, the target m odel can be updated ba sed upon the ground truth resulting from preliminary target digs. This process could be iteratively (and automatically) repeated at the end of each day of digging until it was felt that an optimum target model had been constructed.
• The inductive learning approaches in Feature Analyst with the UXO Toolkit are adaptive, robust, simple to use, and can be potentially deployed in many different geologic settings for UXO classification. However, the accuracy of the UXO cl assification will always be based on several key factors including:
o The quality of the magnetometer data . The vehicular and airborne MTADS system produced excellent data for UXO target detection and discrim ination. Careful planning and execution of the UXO su rvey is the necessa ry first step in producing a high-quality classification.
o Pre-processing the MTADS data to enhance signal-to-noise ratios and reduce clutter. We found the analytical signal processing approach to produce excellent
28

results for the BBR site. Obviously each UXO site is unique because of geology, historic use, cultural noise, etc. but careful prep rocessing of the survey data was important.
o Cultural features. Knowledge of the characteristics of the site, including the identity and location of manmade and cultural features can greatly aid the analyst in preprocessing the data and also during the analysis process.
o The experience and training of the analyst. These factors are also very important especially when selecting training set examples. In order to generalize, Feature Analyst requires diversity and spat ial distribution in the selection of both positive and negative UXO training set examples.
o Workflow is important . The analyst should consider the Feature Analyst and UXO Toolkit as a sem i-automated application for classifying and ranking UXO targets. Based on the probability threshold selected by the analyst, there will be a subset of ROIs that sho uld be passed to physics-based algorithms for additional classification as well as for quality control purposes.
Future Work During the second year of the project we will continue to develop and refine the target
picker and the ta rget ranker. This will be done by addressing other challenging sites and data sets. We will continue the project by working with the vehicular and airborne datasets from the wide area survey at the Isleta (Kirtland Precision Bombing) Range. This site contains a wider range of ordnance types, than BBR. Additionally, the terrain at Isleta is som ewhat more rugged than the BBR, and there is cons iderably more active geological interference than on the BBR. We have prepared the datasets for the vehicular and airborne surveys for analysis and ha ve tentatively prepared training sets of UXO and non-UXO targets based upon both seed targets and dug targets.
In addition, we plan to evalu ate the app roach using data from EM array surveys. Currently, we are considering data from the Jefferson Proving Ground. If we can identify better, newer, or more extensive EM datasets, we can switch to these.
29

6.0 REFERENCES
1. “Use of Shape Representation and Sim ilarity in Classification of UXO in M agnetometry Data, Final Report, SERDP Project UX-1354,” Jim R. McDonald and David Opitz, 2004 2. ESTCP Website for UXO projects, http://www.estcp.org/projects/uxo/ 3. “Airborne MTADS De monstration on the Imp act Area of the Badlands Bom bing Range, September 2001,” J.R. McDonald, David Wright, Nagi Khadr, and H.H. Nelson, NRL/PU/6110--02-453, May 2002 4. “Feature Extraction with the VLS Feature Analyst System,” M. O’Brien, Proceedings of the 2003 American Society of Photogrammetry and Remote Sensing Annual Conference (2003) 5. “High Resolution Image Classification: A Forest Service Test of Visual Learning System’s Feature Analyst,” D. Vanderzander and M. Morrison, ESRI User’s Conference, 2002
30