FHWA Road Safety Audit Guidelines - FHWA Safety Program - U.S

Technical Report Documentation Page 1. Report No.
FHWA/TX-07/0-1898-2 2. Government Accession No. 3. Recipient’s Catalog No.
4. Title and Subtitle
Composite Action during Construction of Steel Trapezoidal Box Girder Bridges
5. Report Date
August 2005
6. Performing Organization Code
7. Author(s) 8. Performing Organization Report No.
C. Topkaya, J. A. Yura, E. B. Williamson, and K. H. Frank 0-1898-2
9. Performing Organization Name and Address 10. Work Unit No. (TRAIS) Center for Transportation Research The University of Texas at Austin 3208 Red River, Suite 200 Austin, TX 78705-2650
11. Contract or Grant No.
0-1898
12. Sponsoring Agency Name and Address
Texas Department of Transportation Research and Technology Implementation Office P.O. Box 5080
13. Type of Report and Period Covered
Technical Report 9/1/2001–8/31/2002
Austin, TX 78763-5080 14. Sponsoring Agency Code
15. Supplementary Notes
Project performed in cooperation with the Texas Department of Transportation and the Federal Highway Administration.
16. Abstract
In steel trapezoidal box girder bridge systems, the U-shaped steel girder is designed to act compositely with the concrete deck to form a closed box for live loading. During the construction stage, however, the behavior is not well understood. The usual practice of assuming the system to be non-composite during construction requires substantial top flange bracing to form a quasi-closed box section. Field studies have Composite box girders with live loading, and girders during construction, have to be evaluated during the design of curved steel trapezoidal box girder bridges. Considering both cases, the design for construction loading is the least understood and is the most important. Stresses due to construction loading can reach up to 60-70 percent of the total design stress for a given cross section.
A three-phase study was undertaken to investigate the behavior of curved trapezoidal box girders during construction. In the first phase, laboratory tests were performed to investigate the shear transfer between the concrete deck and steel girder at early concrete ages (hours, not weeks). In the second phase, an easy-to-use finite element program, UTrAp, was developed for the analysis of these systems under construction loads and is documented in CTR Report 1898-3 (October 2002). The program has the capability of modeling the effects of semi-cured concrete. The third phase focused on the monitoring of two curved trapezoidal box bridges during construction. The measured forces and stresses in the field were compared with the analyses using the developed software. Findings from laboratory and field tests revealed that composite action develops at very early concrete ages. The developed software provides good correlation between measured field data and computed results.
17. Key Words composite action, steel bridges, shear studs, bracing forces, early-age concrete
18. Distribution Statement
No restrictions. This document is available to the public through the National Technical Information Service, Springfield, Virginia 22161. www.ntis.gov
19. Security Classif. (of report)
Unclassified
20. Security Classif. (of this page)
Unclassified
21. No. of pages
54
22. Price
Form DOT F 1700.7 (8-72) Reproduction of completed page authorized

i
Composite Action during Construction of Steel Trapezoidal Box Girder Bridges
by
C. Topkaya, J. A. Yura, E. B. Williamson, and K. H. Frank
Research Report 0-1898-2
Research Project 0-1898
SIMPLIFIED DETAILS FOR TRAPEZOIDAL STEEL BOX BEAMS
conducted for the
Texas Department of Transportation
in cooperation with the
U.S. Department of Transportation Federal Highway Administration
by the
CENTER FOR TRANSPORTATION RESEARCH BUREAU OF ENGINEERING RESEARCH THE UNIVERSITY OF TEXAS AT AUSTIN
August 2005

ii

iii
ACKNOWLEDGEMENTS We greatly appreciate the financial support from the Texas Department of Transportation that made this project possible. The support of the project director, John Holt (BRG), and program coordinator, Richard Wilkison (BRG), is also very much appreciated.
DISCLAIMER The contents of this report reflect the views of the authors, who are responsible for the facts and the accuracy of the data presented herein. The contents do not necessarily reflect the view of the Federal Highway Administration or the Texas Department of Transportation. This report does not constitute a standard, specification, or regulation.
NOT INTENDED FOR CONSTRUCTION,
PERMIT, OR BIDDING PURPOSES
J. A. Yura, P.E, Texas No. 29859
K. H. Frank, P.E, Texas No. 48953
E. B. Williamson
Research Supervisors

iv

v
TABLE OF CONTENTS
CHAPTER 1: INTRODUCTION ............................................................................................................ 1 1.1 SCOPE............................................................................................................................................... 1 1.2 MECHANICAL PROPERTIES OF MATURE CONCRETE........................................................................ 2 1.3 MECHANICAL PROPERTIES OF CONCRETE AT EARLY AGES............................................................ 3 1.4 BEHAVIOR OF STEEL-CONCRETE INTERFACE .................................................................................. 4
1.4.1 Behavior of Shear Studs .......................................................................................................................4 1.4.2 Mechanics of Shear Transfer ................................................................................................................6 1.4.3 Evaluation of the Push-out Test and the Definition of Stud Strength...................................................6
1.5 PROBLEM STATEMENT ..................................................................................................................... 7
CHAPTER 2: EXPERIMENTAL INVESTIGATION OF THE STEEL-CONCRETE INTERFACE BEHAVIOR AT EARLY AGES............................................................... 9
2.1 GENERAL.......................................................................................................................................... 9 2.2 PUSH-OUT TEST SETUP .................................................................................................................... 9 2.3 TEST PROGRAM.............................................................................................................................. 10 2.4 TEST PROCEDURE........................................................................................................................... 12 2.5 TEST RESULTS................................................................................................................................ 12
2.5.1 Push-out Tests ....................................................................................................................................12 2.5.2 Tests for Determining Concrete Properties ........................................................................................15 2.5.3 Development of Expressions for Maximum and Design Strength......................................................18 2.5.4 Effects of Changing Concrete Properties on the Performance of Shear Studs Pre-loaded at
Early Ages ..........................................................................................................................................18 2.5.5 Effect of Surface Bond .......................................................................................................................20
2.6 SUMMARY OF TEST RESULTS......................................................................................................... 20
CHAPTER 3: FIELD STUDIES........................................................................................................... 21 3.1 BRIDGES UNDER STUDY ................................................................................................................ 21 3.2 MONITORING OF CONNECT Z......................................................................................................... 21 3.3 CONCRETE DECK POUR ON DIRECT CONNECT Z........................................................................... 22 3.4 TOP LATERAL RESULTS FOR Z-CONNECT...................................................................................... 24
3.4.1 Pour 1 .................................................................................................................................................24 3.4.2 Pour 2 .................................................................................................................................................24 3.4.3 Pour 3 .................................................................................................................................................25
3.5 DISCUSSION OF ANALYSIS RESULTS.............................................................................................. 27

vi
3.5.1 Finite Element Model Used in ABAQUS...........................................................................................27 3.5.2 Shortcomings of the UTrAp Model ....................................................................................................27 3.5.3 Sensitivity Study.................................................................................................................................28
3.6 MONITORING OF CONNECT K ........................................................................................................ 29 3.7 CONCRETE DECK POUR ON DIRECT CONNECT K........................................................................... 30 3.8 TOP LATERAL AND GIRDER STRESS RESULTS FOR THE K-CONNECT............................................ 30
3.8.1 Pour 1 .................................................................................................................................................30 3.8.2 Pour 2 .................................................................................................................................................32 3.8.3 Pour 3 .................................................................................................................................................33
3.9 SUMMARY OF ANALYTICAL PREDICTIONS .................................................................................... 34
CHAPTER 4: SUMMARY AND CONCLUSIONS .............................................................................. 35
APPENDIX A: BRIDGE CROSS-SECTION PROPERTIES............................................................. 37
REFERENCES ......................................................................................................................................... 39

vii
LIST OF FIGURES Figure 1.1: A Typical Cross Section of a Trapezoidal Box Girder System................................................................1 Figure 1.2: Stress-Strain Response of Mature Concrete .............................................................................................2 Figure 1.3: Conventional Push-out Test Setup ...........................................................................................................4 Figure 1.4: Typical Load-Slip Response for a Shear Stud..........................................................................................5 Figure 1.5: Load-Slip Relationships for Shear Studs..................................................................................................6 Figure 1.6: Deformation Pattern of Steel Connector-Concrete Interface....................................................................6 Figure 1.7: Trapezoidal Box Girder Failure during Construction...............................................................................7 Figure 2.1: Schematic of the Push-out Test Setup....................................................................................................10 Figure 2.2: Side View of the Push-out Test Setup....................................................................................................10 Figure 2.3: View of All Push-out Test Specimens ...................................................................................................11 Figure 2.4: A Typical Push-out Test Result .............................................................................................................12 Figure 2.5: Load-Slip Relationship from Push-out Tests .........................................................................................13 Figure 2.6: Definition of Design and Maximum Strength ........................................................................................14 Figure 2.7: Load-Slip Relation for Shear Studs........................................................................................................15 Figure 2.8: Compressive Stress-Strain Response of Concrete at Early Ages ...........................................................16 Figure 2.9: Time Dependence of Properties .............................................................................................................17 Figure 2.10: Concrete Stiffness Test Results..............................................................................................................17 Figure 2.11: Stud Strength Results and Recommendations........................................................................................18 Figure 2.12: Residual Slip versus Maximum Strength for Retested Specimens.........................................................19 Figure 2.13: Load-slip Behavior of Retested Specimens............................................................................................19 Figure 2.14: Effect of Steel Surface Treatment on Stud Behavior .............................................................................20 Figure 3.1: Site Location ..........................................................................................................................................21 Figure 3.2: Plan View of the Direct Connect Z ........................................................................................................22 Figure 3.3: Dimensions of the Girder Cross Section ................................................................................................22 Figure 3.4: Deck Forms and Reinforcement Installation..........................................................................................23 Figure 3.5: Concrete Pour Sequence and Direction of Pour .....................................................................................23 Figure 3.6: Progress of Pours 1, 2, and 3..................................................................................................................23 Figure 3.7: Change in Axial Force Levels Due to Pour 1.........................................................................................24 Figure 3.8: Change in Axial Force Levels Due to Pour 2.........................................................................................25 Figure 3.9: Change in Axial Force Levels Due to Pour 3.........................................................................................26 Figure 3.10: Effect of Stud Stiffness on 13Z Top Lateral Forces (Pour 3).................................................................26 Figure 3.11: Sensitivity Study on Z-Connect .............................................................................................................28 Figure 3.12: Plan View of Direct Connect K..............................................................................................................29 Figure 3.13: Dimensions of Girder Cross Section ......................................................................................................29

viii
Figure 3.14: Concrete Pouring Sequence on Direct Connect K..................................................................................30 Figure 3.15: Change in Axial Force Levels Due to Pour 1..........................................................................................31 Figure 3.16: Change in Cross-Sectional Stresses Due to Pour 1 ................................................................................31 Figure 3.17: Change in Axial Force Levels Due to Pour 2.........................................................................................32 Figure 3.18: Change in Cross-Sectional Stresses Due to Pour 2 ................................................................................32 Figure 3.19: Change in Axial Force Levels Due to Pour 3..........................................................................................33 Figure 3.20: Change in Cross-Sectional Stresses Due to Pour 3 ................................................................................33

ix
LIST OF TABLES
Table 2.1: Weights per Cubic Yard of Concrete.........................................................................................................11 Table 2.2: Push-out Test Results ................................................................................................................................14 Table 2.3: Concrete Properties at Different Times .....................................................................................................16 Table 3.1: Start and End Times for the First Three Pours...........................................................................................30

x

xi
SUMMARY In steel trapezoidal box girder bridge systems, the U-shaped steel girder is designed to act compositely with the concrete deck to form a closed box for live loading. During the construction stage, however, the behavior is not well understood. The usual practice of assuming the system to be non-composite during construction requires substantial top flange bracing to form a quasi-closed box section. Field studies have Composite box girders with live loading, and girders during construction, have to be evaluated during the design of curved steel trapezoidal box girder bridges. Considering both cases, the design for construction loading is the least understood and is the most important. Stresses due to construction loading can reach up to 60-70 percent of the total design stress for a given cross section.
A three-phase study was undertaken to investigate the behavior of curved trapezoidal box girders during construction. In the first phase, laboratory tests were performed to investigate the shear transfer between the concrete deck and steel girder at early concrete ages (hours, not weeks). In the second phase, an easy-to-use finite element program, UTrAp, was developed for the analysis of these systems under construction loads and is documented in CTR Report 1898-3 (October 2002). The program has the capability of modeling the effects of semi-cured concrete. The third phase focused on the monitoring of two curved trapezoidal box bridges during construction. The measured forces and stresses in the field were compared with the analyses using the developed software. Findings from laboratory and field tests revealed that composite action develops at very early concrete ages. The developed software provides good correlation between measured field data and computed results.

xii
1
CHAPTER 1
INTRODUCTION
1.1 SCOPE Due to advances in fabrication technology, the use of steel trapezoidal box girders for curved interchange structures has become popular. The rapid erection, long span capability, economics, and aesthetics of these girders make them more favorable than other structural systems. A typical box girder system consists of one or more U-shaped steel girders that act compositely with a cast-in-place concrete deck. The composite action between the steel girder and concrete deck is achieved through the use of shear studs welded to the top flanges of the girders.
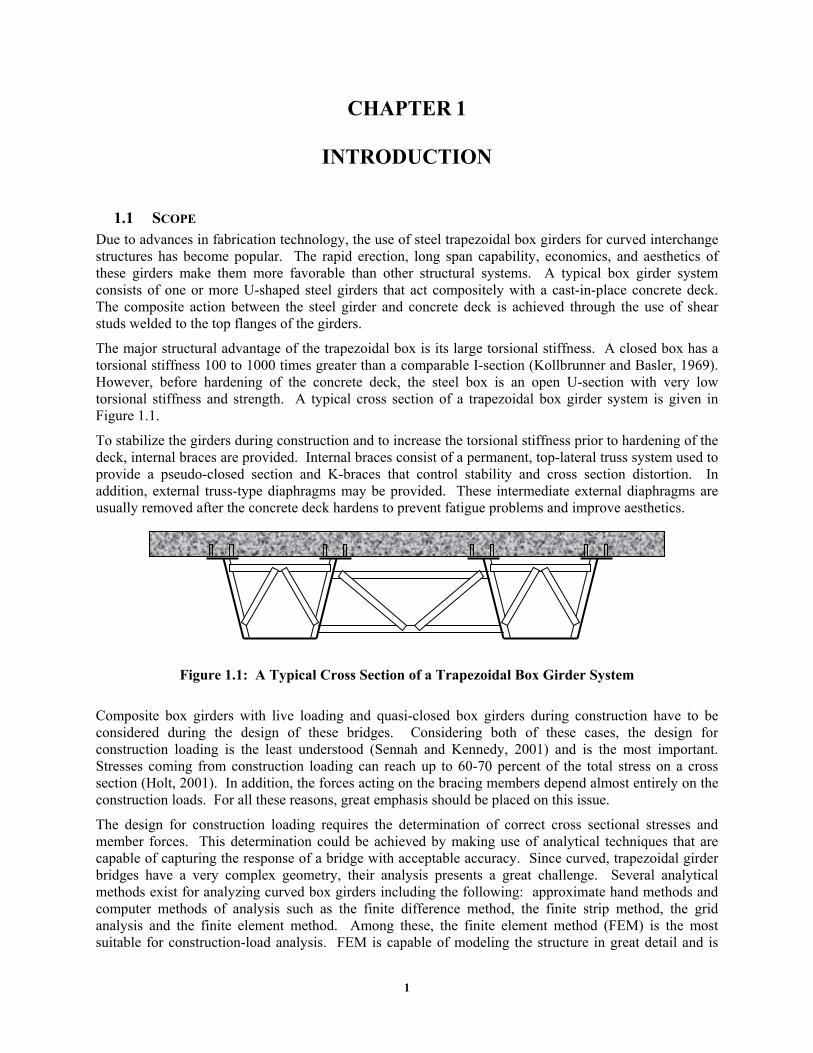
The major structural advantage of the trapezoidal box is its large torsional stiffness. A closed box has a torsional stiffness 100 to 1000 times greater than a comparable I-section (Kollbrunner and Basler, 1969). However, before hardening of the concrete deck, the steel box is an open U-section with very low torsional stiffness and strength. A typical cross section of a trapezoidal box girder system is given in Figure 1.1.
To stabilize the girders during construction and to increase the torsional stiffness prior to hardening of the deck, internal braces are provided. Internal braces consist of a permanent, top-lateral truss system used to provide a pseudo-closed section and K-braces that control stability and cross section distortion. In addition, external truss-type diaphragms may be provided. These intermediate external diaphragms are usually removed after the concrete deck hardens to prevent fatigue problems and improve aesthetics.
Figure 1.1: A Typical Cross Section of a Trapezoidal Box Girder System
Composite box girders with live loading and quasi-closed box girders during construction have to be considered during the design of these bridges. Considering both of these cases, the design for construction loading is the least understood (Sennah and Kennedy, 2001) and is the most important. Stresses coming from construction loading can reach up to 60-70 percent of the total stress on a cross section (Holt, 2001). In addition, the forces acting on the bracing members depend almost entirely on the construction loads. For all these reasons, great emphasis should be placed on this issue.
The design for construction loading requires the determination of correct cross sectional stresses and member forces. This determination could be achieved by making use of analytical techniques that are capable of capturing the response of a bridge with acceptable accuracy. Since curved, trapezoidal girder bridges have a very complex geometry, their analysis presents a great challenge. Several analytical methods exist for analyzing curved box girders including the following: approximate hand methods and computer methods of analysis such as the finite difference method, the finite strip method, the grid analysis and the finite element method. Among these, the finite element method (FEM) is the most suitable for construction-load analysis. FEM is capable of modeling the structure in great detail and is

2
more accurate than other methods of analysis. One limitation of this method, however, is that it requires knowledge of the finite element method on the designer’s part. There are general-purpose, commercial finite element programs widely available, but their use is very limited in the design of curved trapezoidal box girders due designer’s lack of knowledge on FEM. In addition, parameter studies can be difficult because changing structural layout requires generating a new mesh.
The finite element method, just like all other analysis methods, requires the correct mathematical representation of the physical problem being considered. To be able to do accurate modeling, knowledge of curved box girder behavior during construction is essential. The majority of the loading during construction comes from the weight of wet concrete. The entire deck is usually not cast in one stage because of the large volume of concrete and to control shrinkage. As a result, parts of the girders may become partially composite in sequential stages. Analysis for construction loading should take into account the partial composite action developing between the stages. In order to accurately model this phenomenon, a thorough understanding of the behavior of both the concrete deck and steel-concrete interface at early ages is essential.
1.2 MECHANICAL PROPERTIES OF MATURE CONCRETE Knowledge of mechanical properties of mature concrete is well established. Among the properties, compressive strength (f’c), stiffness (Ec), and stress-strain response are the ones that draw the most attention. The strength and stiffness varies according to the mix design used. In general, concrete exhibits a nonlinear compressive stress-strain response. (Fig 1.2) The stress-strain curve could be visualized as a rising portion followed by a descending branch. The rising portion resembles a parabola with its vertex at the maximum stress. The maximum stress is reached at a strain of between 0.0015 and 0.003.
0
500
1000
1500
2000
2500
3000
3500
4000
4500
5000
0 0.0005 0.001 0.0015 0.002 0.0025 0.003 0.0035 0.004
Strain (in/in)
Stre
ss (p
si)
Figure 1.2: Stress-Strain Response of Mature Concrete

3
Initial tangent modulus of elasticity increases with an increase in compressive strength. The modulus of elasticity, Ec, is a function of the modulus of elasticity of the cement paste and that of the aggregate. Empirical relations have been developed to express Ec as a function of f’c. For normal weight concrete with a density of 145 lb/ft3, ACI Sec 8.5.1 gives the modulus of elasticity as:
psifE cc '57000= (1.1)
This equation was derived from short duration tests on concrete and corresponds to the secant modulus of elasticity at approximately 0.45-0.5 f’c. Since this equation does not include the type of aggregate, there is wide scatter of the data. Measured values might range from 120 to 80 percent of the specified value. (ACI Commentary)
1.3 MECHANICAL PROPERTIES OF CONCRETE AT EARLY AGES Concrete gains stiffness and strength with time. The rate of strength gain is dependent on the type of cement and admixtures used as well as the moisture and temperature conditions during curing. For any type of concrete, the rate of increase in strength is greatly affected by temperature of cure. The combined effect of time and temperature is expressed by an index called maturity. Maturity is defined as the summation of the product of curing temperature and the time the concrete has cured at that temperature. It has units of degree-day (or hour). The definition can be written as:
∑ Δ−= tTM )10( (1.2)
where T is temperature of concrete at any time in degrees Fahrenheit, and Δt is the increment of time. Relationships between maturity and compressive strength of concrete can be found in the literature (MacGregor,1997).
Apart from the strength gain, other mechanical properties at early ages have been investigated by several researchers. Below is a summary of the key work in this field.
H. S. Lew, and T. W. Reichard (1978) : These researchers have investigated the possibility of using maturity of concrete as a parameter to correlate with the rate of gain of the splitting tensile strength, pullout bond strength, and elastic modulus. Standard cylinder compression tests, splitting tensile tests and pullout bond tests were performed on specimens cured at different temperatures. Tests were carried out at ages varying from 1 to 42 days. The study revealed that the maturity concept could be applied to the parameters mentioned above. It was determined that the rate of increase in the splitting tensile strength is approximately the same as that of compressive strength. In addition, the rate of increase in the pullout bond strength and modulus were found to be slightly greater than that of the compressive strength.
F. A. Oluokun, E. G. Burdette, and J. H. Deatherge (1991): Oluokun et al. investigated the applicability of existing relations between the properties of concrete at early ages. The cylinder compressive strength, elastic modulus and Poisson’s ratio were tested for four different concrete mixes at times ranging from 6 hours to 28 days. A significant finding of these researchers was that the ACI 318 relation for elastic modulus is valid at ages 12 hours and greater. Poisson’s ratio was found to be insensitive to the age and concrete mix and could be taken as approximately 0.2.
A. A. Khan, W. D. Cook, and D. Mitchell (1995): This work focused on the early age compressive stress-strain properties of low, medium, and high strength concretes. The specimens were subjected to three different curing conditions, namely, temperature-matched, sealed, and air-dry curing. Stress-strain behavior was monitored at times ranging from 8 hours to 91 days. Their study revealed that during the first few hours of hydration, the stress-strain response exhibited extremely low moduli, low compressive strength, and very high strains corresponding to peak compressive stress. After about 24 hours, the response for all of the concretes started to resemble the response at 28 days. During the first few hours, very high peak strains were observed. The elastic modulus was observed to grow very rapidly at early

4
ages. In addition, it was concluded that the ACI expression for elastic modulus overestimates the stiffness for very early age concretes.
1.4 BEHAVIOR OF STEEL-CONCRETE INTERFACE Composite action between a steel girder and concrete deck is achieved by the horizontal transfer of shear at the steel-concrete interface. This transfer can be attributed to several mechanisms, including, adhesion, friction, and bearing. Adhesion and friction should not be considered during design due to their lack of reliability. Therefore, steel elements welded to the girder and embedded in the concrete are assumed to provide a reliable shear connection. Among the many type of connectors available, welded headed shear stud is the most widely used in both bridge and building construction (Viest et al, 1997). Knowledge of shear stud behavior is necessary to be able to understand the mechanism of shear transfer between steel and concrete.
1.4.1 Behavior of Shear Studs An experimental investigation of shear stud behavior is carried out by performing push-out tests. Although there is not a standardized procedure for fabricating and testing push-out test specimens, other researchers have used similar, though slightly different, procedures (Viest et al, 1997) in the past. In a typical push-out test specimen, studs are welded to both flanges of a W-shape. Later, a slab is poured on each side of the W-shape so that the studs will be embedded in concrete. The specimens are tested by applying an axial force to the W-shape. A conventional push-out test specimen is shown in Figure 1.3. During the test, vertical slip between the slab and beam are measured. Specimens are generally loaded up to failure with or without unloading and reloading during the test. A load-slip response for a shear stud such as the one shown in Fig. 1.4 is obtained as a result of a push-out test. The load-slip behavior is nonlinear. In general, the unloading of specimens does not affect the envelope of the curves. The reloading is linear until the maximum load prior to unloading is reached.
Figure 1.3: Conventional Push-out Test Setup
The ultimate strength of a shear stud and the mathematical representation of the load-slip relationship are the two most important results of a push-out test. A large body of knowledge exists for shear stud tests. Among all previous investigations, the study by Ollgaard et al (1971) is the most frequently cited and forms the basis of the AISC and AASHTO specifications.
Top View

5
0
5
10
15
20
25
0 0.05 0.1 0.15 0.2
Slip (in)
Load
(kip
s)
Qu
Figure 1.4: Typical Load-Slip Response for a Shear Stud
Ollgaard, Slutter, and Fisher (1971) studied the strength of shear connectors in lightweight and normal-weight concrete. Forty-eight push-out specimens were tested during their investigation. The variables considered were concrete compressive strength, split tensile strength, modulus of elasticity, density of concrete, stud diameter, type of aggregate, and number of connectors per slab. Based on regression analysis of the results of this and earlier studies, they proposed the following equation for ultimate connector strength, Qu :
uscccscu FAEfAQ ≤= '5.0 (1.3)
where, Asc= cross-sectional area of shear stud (in2), Fu= minimum specified tensile strength of stud steel, and f’c and Ec in ksi.
In addition to the connector strength formula, two different load-slip relationships were proposed. For continuously loaded specimens, an empirical formula was determined as:
( ) 52181 Δ−−= eQQ u (1.4)
where, Δ= slip.
At zero load this function gives an initial tangent of infinity. This result is due to the initial bond between steel and concrete, and has been observed during the tests.
For the specimens that were loaded up to the working load level of connectors, then unloaded and reloaded to their ultimate load, a load-slip relationship for the reloading branch was proposed as:
Δ+
Δ=801
80uQQ (1.5)
Contrary to having a vertical tangent, this equation gives a slope of 80 Qu (kips/in) at zero load. Comparison of Equations 1.4 and 1.5 are given in Fig. 1.5.
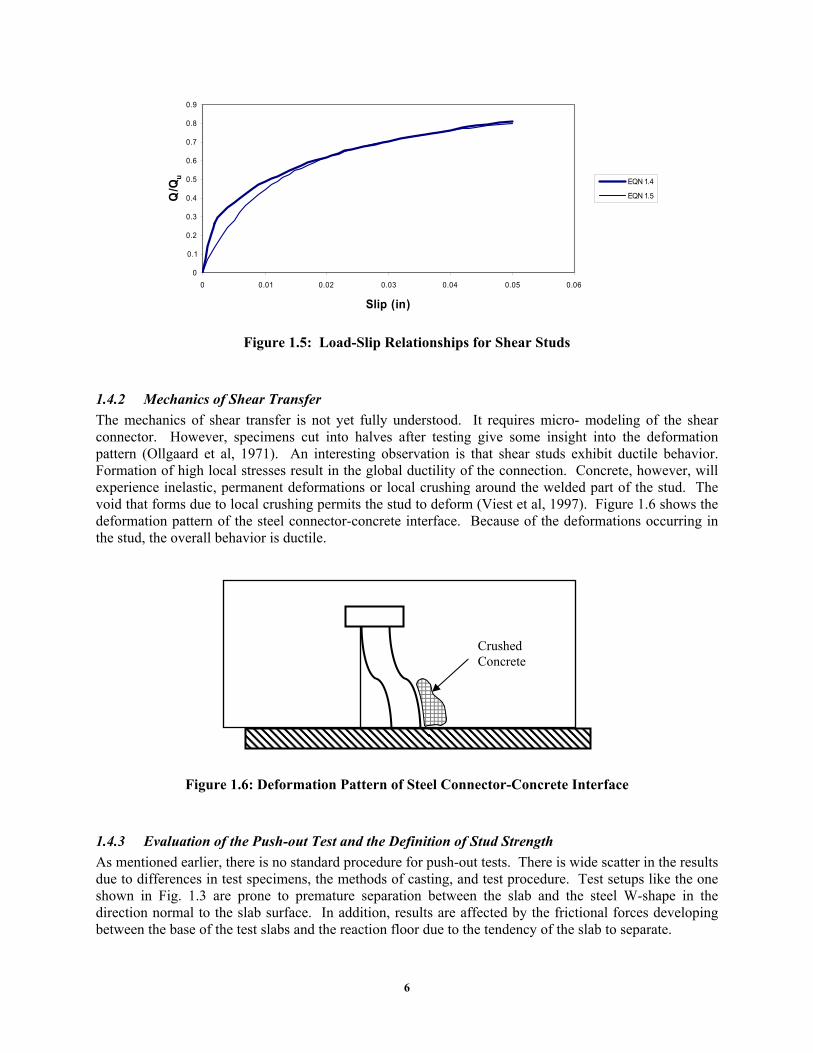
6
0
0.1
0.2
0.3
0.4
0.5
0.6
0.7
0.8
0.9
0 0.01 0.02 0.03 0.04 0.05 0.06
Slip (in)
Q/Q
u EQN 1.4
EQN 1.5
Figure 1.5: Load-Slip Relationships for Shear Studs
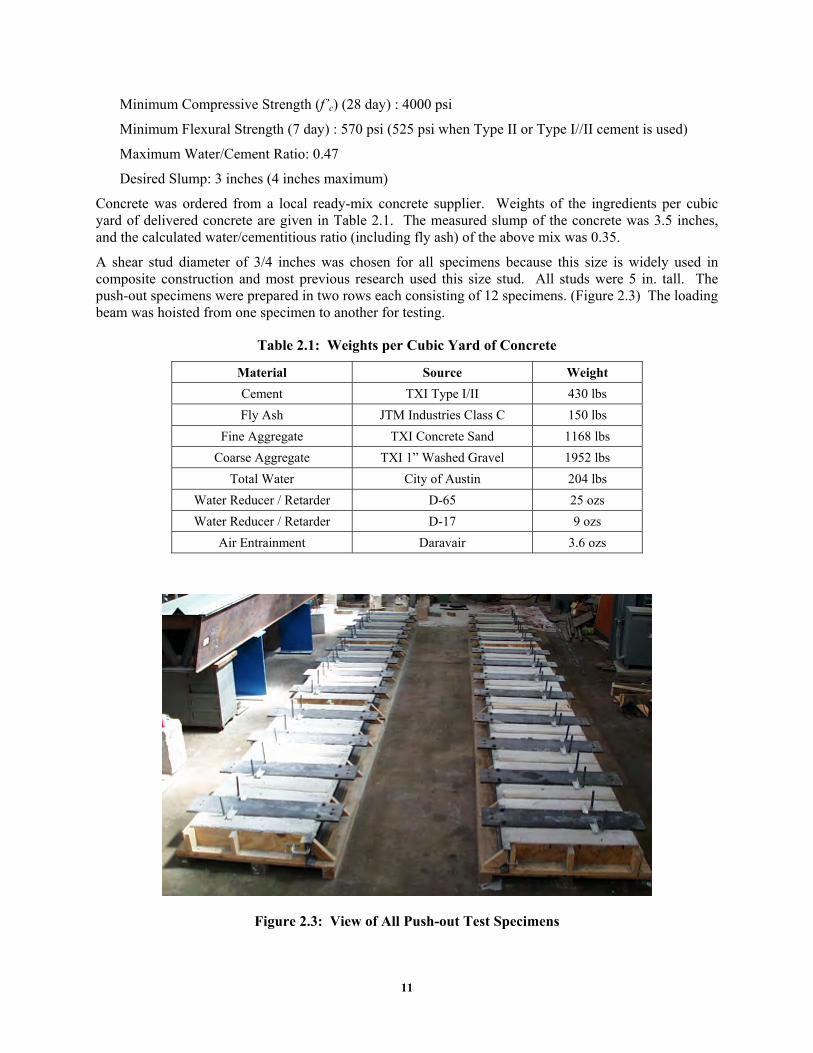
1.4.2 Mechanics of Shear Transfer The mechanics of shear transfer is not yet fully understood. It requires micro- modeling of the shear connector. However, specimens cut into halves after testing give some insight into the deformation pattern (Ollgaard et al, 1971). An interesting observation is that shear studs exhibit ductile behavior. Formation of high local stresses result in the global ductility of the connection. Concrete, however, will experience inelastic, permanent deformations or local crushing around the welded part of the stud. The void that forms due to local crushing permits the stud to deform (Viest et al, 1997). Figure 1.6 shows the deformation pattern of the steel connector-concrete interface. Because of the deformations occurring in the stud, the overall behavior is ductile.
Figure 1.6: Deformation Pattern of Steel Connector-Concrete Interface
1.4.3 Evaluation of the Push-out Test and the Definition of Stud Strength As mentioned earlier, there is no standard procedure for push-out tests. There is wide scatter in the results due to differences in test specimens, the methods of casting, and test procedure. Test setups like the one shown in Fig. 1.3 are prone to premature separation between the slab and the steel W-shape in the direction normal to the slab surface. In addition, results are affected by the frictional forces developing between the base of the test slabs and the reaction floor due to the tendency of the slab to separate.
Crushed Concrete

7
Another discrepancy arises during the interpretation of the test results. The ultimate strength of the shear connector is defined as the maximum load attained per stud during a test. However, this definition does not consider the interface displacement demand. In the study by Ollgaard et al., 1971, the maximum load was reached at slips varying from 0.23 to 0.42 in. In reality, these magnitudes of interface slip may not be easily tolerated by a structure. For design, values lower than the ultimate strength should be cosidered to limit the interface slip demands.
1.5 PROBLEM STATEMENT As explained earlier, construction loading should be handled with great care during the design of curved trapezoidal steel box girders. Such design requires a thorough understanding of curved girder behavior during construction and the use of accurate analytical tools. Lack of knowledge of curved girder behavior and/or use of inadequate tools has resulted in catastrophic failures in the past. Figure 1.7 shows a trapezoidal box girder failure during construction.
Currently, the behavior of the steel-concrete interface at early concrete ages is unknown. Recent field studies on curved trapezoidal box girders (Cheplak, 2001) revealed that the composite action develops at very early concrete ages. The development of early composite action has some beneficial effects. The use of early-age concrete deck to overcome construction loads might eliminate some of the bracing members and might also lead to the use of smaller plate members. In addition, the use of early composite action might reduce construction times. Reduction in member sizes and construction time could lead to significant cost savings.
Figure 1.7: Trapezoidal Box Girder Failure during Construction (T. Helwig, U. of Houston)
In order to use the idea of the early composite action, analysis tools capable of accurately modeling this phenomenon are essential. Current commercial computer programs available to designers do not permit the definition of a semi-cured concrete deck in the model. Only general-purpose finite element packages

8
are capable of solving this kind of a problem but they require knowledge the of finite element method. Therefore, the general purpose finite element programs are not widely used in the design of these bridges.
It is the focus of this research phase to investigate the steel-concrete interface behavior at early ages and provide for its implementation into an analysis package. An experimental program was designed to investigate the performance of shear connectors on curved bridges during early concrete ages. The study was limited to one typical concrete mix design used in these types of bridges. In addition to laboratory experiments, a user-friendly computer program, UTrAp was developed for the analysis of curved trapezoidal box girders under construction loads. UTrAp details are presented in CTR Report 1898-3 (Topkaya et al, 2002) and Topkaya and Williamson (2003). Two bridges were monitored in the field during construction and comparisons of the analytical predictions with the field observations will be presented.

9
CHAPTER 2
INVESTIGATION OF THE STEEL-CONCRETE INTERFACE BEHAVIOR AT EARLY AGES
2.1 GENERAL Current literature lacks experimental evidence of steel-concrete interface behavior at early concrete ages. This information is essential in understanding the shear transfer between concrete deck and top flange during construction of bridges. All push-out tests previously reported were performed on mature concrete. It is necessary to obtain load-slip curves for studs embedded in concrete and subjected to shear forces from 3 to 48 hours after concrete has been poured. Obtaining this information entails certain experimental challenges. Standard push-out tests were found not suitable for testing specimens at early ages. There are constraints on the test setup that need to be addressed in testing specimens with early-age concrete.
The testing should be completed in a very short time period. Otherwise, time elapsed during testing of replicate specimens would cause concrete to change properties that result in different load-displacement behavior. All replicate specimens should be tested within fifteen minutes.
Prior to testing, specimens should not be moved because unnecessary handling may damage the early-age concrete. Transportation of specimens may also expand the time interval between tests. This constraint limits the use of a test machine since specimens have to be cast and tested in place.
If possible, specimens should not be anchored to the floor or to another fixture. Application of loads to low strength concrete may cause damage to the specimen around anchorage regions, and local failures in these locations may result in an undesirable behavior.
2.2 PUSH-OUT TEST SETUP A self-contained push-out test setup was developed for testing shear studs embedded in early-age concrete that meets all the above-mentioned constraints. The test setup consisted of a loading fixture (A), a test specimen (B) and a spreader beam (C). (Figures 2.1 and 2.2)
For each specimen, a box-type formwork having dimensions of 36in. x 24in. x 8in. was prepared. Plywood was placed on three sides while a 24-in. long C8x11.5 channel section was placed on the remaining side. The channel section served as formwork as well as a spreader beam during the loading process. Two #6 reinforcing bars in both directions were placed at the bottom. Reinforcing bars are located 2 inches from the edges of the formwork. Two 3/4 in. diameter, 5 in. tall shear studs were welded to a 5/8 in. x10 in. x 48 in. flat bar using standard stud installation equipment. A plastic sheet was wrapped around the flat bar to prevent bonding between the steel plate and the concrete. The flat bar was placed on top of the formwork with the studs oriented downward. After completing all the forms for each test specimen, concrete was cast inside all the forms and vibrated according to standard specifications.
The specimens were tested by making use of a loading fixture. A loading fixture was constructed by welding a 12-in. and a 72-in. W8x18 wide flange steel section together. A 60-kip capacity hydraulic ram was bolted to a plate that was welded to the short section of the loading fixture. The loading fixture was lifted into position and was connected to the flat plate of the test specimen by four ¾-in. diameter A325 bolts. Two holes with a diameter 11/16 in. were drilled into the flange of the channel section, while, two holes with a diameter 17/16 in. were drilled into the flat plate at coinciding locations. Two 5/8 in. diameter A325 bolts were used to connect the two parts. These bolts were necessary to counteract the

10
tendency of the loading frame and the concrete slab to separate due to the eccentricity of the jack loading axis and the shear plane. A hydraulic ram was connected to a hand pump in order to apply the loading.
Figure 2.1: Schematic of the Push-out Test Setup
Figure 2.2: Side View of the Push-out Test Setup
During a typical test the load-displacement behavior was documented by collecting data at every second with a data acquisition system. The load was monitored by making use of a 50-kip load cell that was attached to the loading ram. Displacements were measured with two linear potentiometers that have an accuracy of 0.0001 inches.
One minor detail about the setup is also worth mentioning. Although the spreader beam was not connected to the floor, it did not uplift together with the loading beam when both were tied together. The tendency to uplift was prevented by the formation of frictional resistance between the channel section and concrete block as a result of the applied load. In order to increase the resistance against uplift, a layer of #6 reinforcing bars was welded to the web of the channel section to act as a shear key.
2.3 TEST PROGRAM A test program was designed to the obtain load-displacement behavior of shear studs embedded in early-age concrete. Eight testing times were chosen, 4 hours, 8 hours, 13 hours, 22 hours, 3 days, 7 days, 14 days, and 28 days after initial casting. At all of these times, concrete cylinders were also tested to obtain material properties. For each time period, three push-out tests, three cylinder compression tests, and three split cylinder tests were performed.
Class-S type concrete, which is used for bridge slabs in the state of Texas, was selected for use in the test specimens. According to the Texas Department of Transportation construction specifications (1993) Class-S type concrete should meet the following requirements:
W 8x18 (A)
(A) (B)
(C)
2-#6 rebar
Finger-tight bolt
Shear Key
11
Minimum Compressive Strength (f’c) (28 day) : 4000 psi
Minimum Flexural Strength (7 day) : 570 psi (525 psi when Type II or Type I//II cement is used)
Maximum Water/Cement Ratio: 0.47
Desired Slump: 3 inches (4 inches maximum)
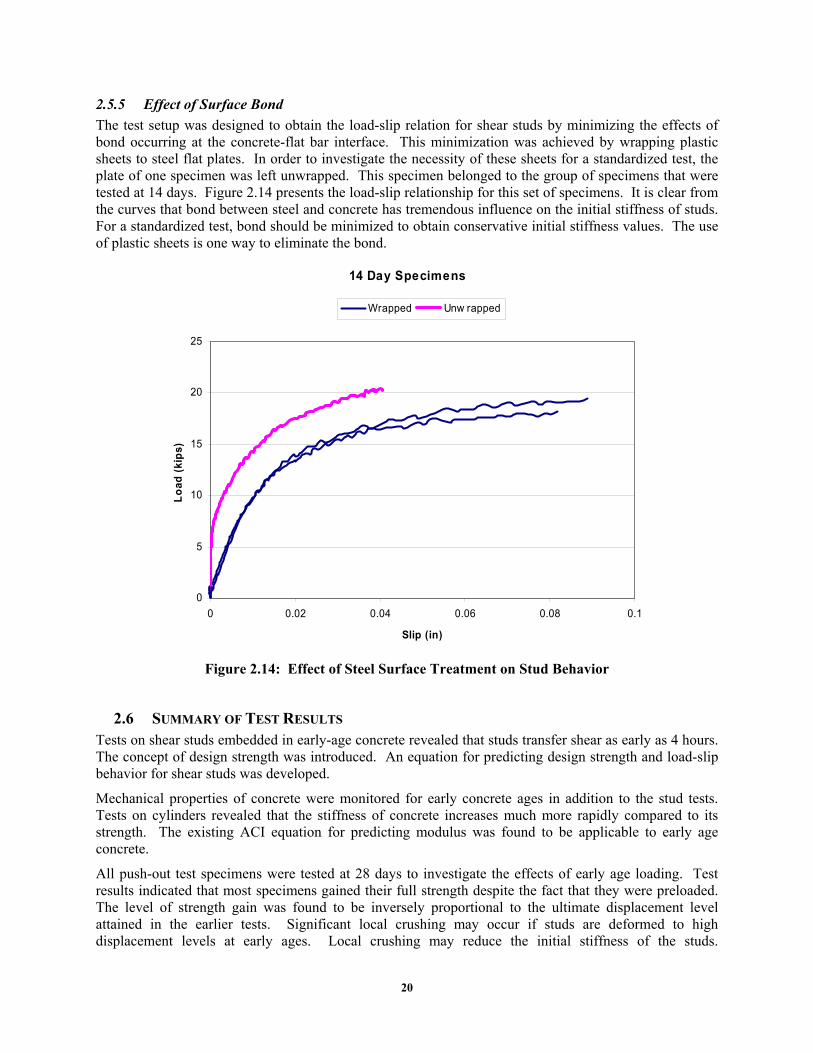
Concrete was ordered from a local ready-mix concrete supplier. Weights of the ingredients per cubic yard of delivered concrete are given in Table 2.1. The measured slump of the concrete was 3.5 inches, and the calculated water/cementitious ratio (including fly ash) of the above mix was 0.35.
A shear stud diameter of 3/4 inches was chosen for all specimens because this size is widely used in composite construction and most previous research used this size stud. All studs were 5 in. tall. The push-out specimens were prepared in two rows each consisting of 12 specimens. (Figure 2.3) The loading beam was hoisted from one specimen to another for testing.
Table 2.1: Weights per Cubic Yard of Concrete
Material Source Weight Cement TXI Type I/II 430 lbs Fly Ash JTM Industries Class C 150 lbs
Fine Aggregate TXI Concrete Sand 1168 lbs Coarse Aggregate TXI 1” Washed Gravel 1952 lbs
Total Water City of Austin 204 lbs Water Reducer / Retarder D-65 25 ozs Water Reducer / Retarder D-17 9 ozs
Air Entrainment Daravair 3.6 ozs
Figure 2.3: View of All Push-out Test Specimens

12
2.4 TEST PROCEDURE The same test procedure was followed for all push-out tests. The specimens were loaded until the load-displacement curve reached a horizontal asymptote. Then the specimens were unloaded to zero load and reloaded until the load-displacement curve indicated a maximum load had been reached or the shear displacement was excessive (approximately, one half of the stud diameter). Finally, the specimens were unloaded, and the loading beam was removed.
Concrete cylinders were tested under compression to determine the load-displacement curve. The loading procedure defined in ASTM C 469-94 was used. Specimens were tested using a 600-kip compression test machine. A compressometer with a linear potentiometer was placed around the concrete cylinders to monitor the displacement. Because the test machine was load-controlled, only the ascending branch of the load-displacement curve was obtained. In addition to compression tests, split cylinder tests were also performed in accordance with ASTM C 496-96 procedures.
The approximate elapsed times for testing of the three push-out specimens, three compression specimens, and three split cylinder specimens were 30, 30, and 20 minutes respectively. Therefore, each testing cycle took about 80 minutes to complete. The specimens were cast and air cured inside the laboratory where the ambient temperature was 85-95°F during the 28-day period.
2.5 TEST RESULTS
2.5.1 Push-out Tests As mentioned earlier, three push-out tests were performed for each of the eight time periods. A typical load displacement response obtained from a push-out test is given in Fig. 2.4. In addition, the first loading cycle of all tests is presented in Fig. 2.5. In general the load-slip relationships of replicate specimens were similar except for the set of specimens that were tested at 8 hours and 13 hours where large scatter was observed.
4hr Push-out Test Specimen #1
0
1
2
3
4
5
6
7
0 0.05 0.1 0.15 0.2 0.25 0.3 0.35
Slip (in)
Load
(kip
s)
Figure 2.4: A Typical Push-out Test Result

13
0
5
10
15
20
25
0 0.02 0.04 0.06 0.08 0.1 0.12 0.14 0.16 0.18Slip (in)
Load
(kip
s)
4hr 8hr 13hr 22hr 3dy 7dy 14dy 28dy
Figure 2.5: Load-Slip Relationship from Push-out Tests
It is evident from the results that even at very early ages, studs exhibit considerable stiffness and strength. In order to quantify the results, certain definitions are required. As explained in Chapter 1, the failure load obtained from a push-out test was considered as the ultimate capacity of the shear stud, (Qmax). Failure load is reached at high displacement levels. This definition does not consider the effect of stud deformation on the stiffness of the structure. Therefore, for composite design at the construction stage using early-age concrete, the concept of design strength (Qd), is proposed in this section.
The proposed design strength (Qd) is defined as the value of the load attained at a displacement value of 0.03 inches (Diameter/25). (Fig 2.6) This limit ensures that during the staged construction of the structure, the studs do not experience deformations in excess of 0.03 inches (D/25). Similar yet different procedures were proposed by other researchers for the design shear connector resistance and stiffness. For example, in a study by Wang (1998), the design resistance is taken as 80% of the ultimate resistance, and the stiffness is conservatively estimated as the secant stiffness at design strength with an equivalent slip of 0.03 inches. The reduced stud strength Qd should be used in design checks at the construction stage. The stud strength is reduced to limit the local early-age concrete damage at the stud locations as will be discussed in Section 2.5.4.
The sensitivity in the definition of design strength was investigated by considering a range of serviceability limits in the vicinity of 0.03 inches of slip. Test results showed that defining the design strength based on displacement values of 0.025 inches and 0.035 inches gives on average 6.7% lower and 5.7% higher design strength values, respectively, when compared to the proposed definition. It could be concluded that construction design strength is not very sensitive to the slip level in the vicinity of 0.03 inches.
Table 2.2 summarizes the design and maximum strength values obtained from the push-out tests. Maximum strength (Qmax) is defined as the maximum load attained during the test regardless of a displacement limit state. (Fig 2.6) Because the specimens were not loaded up to failure, the maximum strength is expected to be slightly lower than the ultimate value predicted by current design equations.

14
0
5
10
15
20
25
0 0.05 0.1 0.15 0.2 0.25 0.3
Slip (in)
Load
(kip
s)
Qd
Qmax
0.03
Figure 2.6: Definition of Design and Maximum Strength
Table 2.2: Push-out Test Results
Stud Design Strength, Qd (kips) Stud Maximum Strength, Qmax (kips) Specimen Number Specimen Number Time
1 2 3 Average
1 2 3 Average
4 hr 3.6 4.4 3.7 3.9 6.0 6.2 6.1 6.1 8 hr 8.1 6.3 6.9 7.1 10.2 8.85 10.0 9.6 13 hr 10.1 7.7 9.00 8.9 13.5 10.1 14.7 12.7 22 hr 11.9 13.0 11.5 12.1 17.5 17.6 17.5 17.5 3 day 13.8 14.5 13.0 13.7 17.5 19.4 19.1 18.7 7 day 14.9 15.0 14.9 14.9 18.4 20.2 19.8 19.4
14 day 15.3 16.0 xxx 15.6 19.2 20.1 21.2 20.2 28 day 18.3 16.4 17.0 17.2 21.0 21.0 21.0 21.0
A mathematical representation of the load-slip behavior for shear studs is required for proper modeling of their behavior in analysis packages. For this purpose, a simple load-slip response curve was developed. All load-displacement curves obtained from push-out tests were normalized with respect to design strength and 0.03 inches of displacement. All data were plotted together (Fig. 2.7). A fifth degree polynomial with an R2 value equal to 0.97 was fit to all the data shown in Fig. 2.7. Then a simplified equation was developed that represents the fifth degree curve. The proposed load slip relationship is given by Equation 2.1. This equation gives an initial tangent stiffness of 100 Qd and a secant stiffness at design load of 33.3 Qd.

15
0
0.2
0.4
0.6
0.8
1
1.2
0 0.2 0.4 0.6 0.8 1 1.2
Slip/0.03
Q/Q
d
Eq. 2.1 5th Degree Polynom ial
Figure 2.7: Load-Slip Relation for Shear Studs
⎟⎠⎞
⎜⎝⎛ Δ+
⎟⎠⎞
⎜⎝⎛ Δ
=
03.021
03.03
dQQ
(2.1)
2.5.2 Tests for Determining Concrete Properties Three compressive and three split cylinder tests were performed on concrete specimens for each time period. During the compressive tests, the displacement was monitored to obtain the stress-strain response. Table 2.3 summarizes the ultimate compressive strength, secant stiffness at 40% of ultimate strength and split cylinder test results for concrete specimens. In addition, the stress-strain curves for compression are presented in Fig. 2.8.
Test results revealed that the rate of stiffness gain is much higher compared to the rate of strength gain. Specimens reached almost 90 percent of the 28-day stiffness after 22-hour cure. At very early ages, the stress-strain response mimics elastoplastic behavior. Concrete specimens tested after 22 hours exhibit a stress-strain response that is similar to the 28-day response. Figure 2.9 presents the time dependence of concrete properties together with the push-out test results. For concrete the rate of stiffness gain is much higher in comparison to the rate of strength gain. The stud maximum and design strength increases faster than concrete strength and slower than concrete stiffness.

16
Table 2.3: Concrete Properties at Different Times
1.1.1.1.1 Time 4 hr 8 hr 13 hr 22 hr 3 dy 7 dy 14 dy 28 dy
1 286 715 1230 1970 3530 3740 4530 4370 2 304 832 1230 1830 3080 4420 4450 4370
Spec
imen
N
umbe
r 3 364 859 1250 1820 3060 4040 4380 4510
Com
pres
sive
Stre
ngth
(psi)
Average 318 802 1237 1873 3223 4067 4453 4417
1 1220 2578 2900 3433 4408 4067 4316 xxx 2 xxx 2802 3315 3868 4038 4552 4468 4148
Spec
imen
N
umbe
r
3 1280 3132 3204 3647 3923 4789 4341 4237
Com
pres
sive
Stiff
ness
(ksi)
Average 1250 2837 3140 3649 4123 4469 4375 4193
1 38 105 119 278 328 374 340 375 2 25 93 159 238 282 315 433 450
Spec
imen
N
umbe
r
3 32 98 141 250 293 318 450 442 Tens
ile
Stre
ngth
(psi)
Average 32 99 139 255 301 335 408 422
0
500
1000
1500
2000
2500
3000
3500
4000
4500
5000
0 0.0005 0.001 0.0015 0.002
Strain (in/in)
Stre
ss (p
si)
4hr 8hr 13hr 22hr 3dy 7dy 14dy 28dy
Figure 2.8: Compressive Stress-Strain Response of Concrete at Early Ages

17
0
0.2
0.4
0.6
0.8
1
1.2
1 10 100 1000
Time (hours)
Nor
mal
ized
Qua
ntiti
es
Concrete Strength Concrete Stiffness Split Cylinder
Stud Des ign Str/Stf Stud Maxim um Strength
Figure 2.9: Time Dependence of Properties
Based on the concrete cylinder tests, the applicability of the existing ACI relation (Equation 1.1) in predicting the stiffness of early age concrete was investigated. Figure 2.10 shows the comparison of the test results from four different researchers compared with the ACI relation. Careful examination of the data reveals that each set of data is consistent in itself. Data from this study shows stiffer response while data from Mo (1998) exhibits more flexible behavior in comparison to ACI’s relation. This result could be attributable to different curing conditions and mix designs used for concrete specimens. Also differences in the stiffness of the aggregates used by different researchers could cause scatter among test results. In general, the ACI relation is satisfactory and applicable in predicting the stiffness of concrete at early ages given its strength.
0
500
1000
1500
2000
2500
3000
3500
4000
4500
5000
0 1000 2000 3000 4000 5000
f'c (psi)
Ec (k
si)
Topkaya Lew Oluokun Mo ACI
Figure 2.10: Concrete Stiffness Test Results

18
2.5.3 Development of Expressions for Maximum and Design Strength Based on the experimental data gathered, expressions for estimating the design and maximum strength of shear studs were developed. These expressions are applicable to both mature and early-age concrete cases. Expressions were developed in such a way that they have a form similar to the one used in the current design specifications. Load on the stud is normalized by the cross-sectional area of the shear connector. Regression analyses were performed to find out the dependency of concrete parameters on the design and maximum connector strength. The coefficients obtained from regression analyses were rounded off to find out simpler equations for estimating quantities. Equations 2.2 and 2.3 (kip, in. units) were developed to estimate the design and maximum strength of shear connectors based on concrete properties. Figure 2.11 shows how the developed equations represent the experimental findings.
( ) 3.0'max 5.2 ccsc
EfA
Q= (2.2)
( ) 3.0'75.1 ccsc
d EfAQ
= (for construction only) (2.3)
0
10
20
30
40
50
60
0 5 10 15 20 25
(f'c Ec)0.3
Qm
ax/A
sc ,
Qd/ A
sc
Qmax
Qd
Figure 2.11: Stud Strength Results and Recommendations
2.5.4 Effects of Changing Concrete Properties on the Performance of Shear Studs Pre-loaded at Early Ages
The effect of loading studs in early-age concrete on the long-term performance is investigated. For this purpose, all specimens were retested after 28 days using the same testing procedure explained in Section 2.4. During the original tests, specimens were loaded up to different displacement limits. The residual slip level attained in earlier tests is an indication of damage to the early-age concrete. Figure 2.12 was prepared to investigate the effect of the level of damage on the long-term ultimate performance of the shear stud. For each test specimen, the residual slip value from initial tests was plotted versus the maximum load reached during re-testing at 28 days. According to the trend line fitted to the data, the maximum capacity of the stud decreases as the level of damage increases. In addition the plot reveals that studs loaded up to the recommended design displacement value of 0.03 inches at early concrete ages could be able to develop their full strength after 28 days.

19
0
5
10
15
20
25
30
0 0.1 0.2 0.3 0.4 0.5Residual Slip (in)
Stud
Max
imum
Stre
ngth
(kip
s)28 day Strength
0.03
Figure 2.12: Residual Slip versus Maximum Strength for Retested Specimens
Another observation on the load-slip behavior of re-tested studs is worth mentioning. Although pre-tested studs may develop their full capacity at 28 days, there might be a change in their initial stiffness. Figure 2.13 qualitatively represents this phenomenon. Load-displacement curves for two specimens are presented. The first specimen is tested at 13 hours while the second one is tested at 14 days. Both specimens were re-tested at 28 days and they developed their full capacity. However, for the 13-hour specimen, the retesting curve has a very low initial stiffness compared to the 14-day specimen. This observation shows that for specimens tested at very early ages, localized concrete damage around the stud weld location causes a weak zone that results in further stiffness reduction of the overall system.
13 hr Specimen
0
5
10
15
20
25
0 0.02 0.04 0.06 0.08 0.1 0.12
Slip (in)
Load
(kip
s)
Test Retest
14 Day Specim en
0
5
10
15
20
25
0 0.02 0.04 0.06 0.08 0.1
Slip (in)
Load
(kip
s)
Test Ret est
Figure 2.13: Load-slip Behavior of Retested Specimens
20
2.5.5 Effect of Surface Bond The test setup was designed to obtain the load-slip relation for shear studs by minimizing the effects of bond occurring at the concrete-flat bar interface. This minimization was achieved by wrapping plastic sheets to steel flat plates. In order to investigate the necessity of these sheets for a standardized test, the plate of one specimen was left unwrapped. This specimen belonged to the group of specimens that were tested at 14 days. Figure 2.14 presents the load-slip relationship for this set of specimens. It is clear from the curves that bond between steel and concrete has tremendous influence on the initial stiffness of studs. For a standardized test, bond should be minimized to obtain conservative initial stiffness values. The use of plastic sheets is one way to eliminate the bond.
14 Day Specimens
0
5
10
15
20
25
0 0.02 0.04 0.06 0.08 0.1
Slip (in)
Load
(kip
s)
Wrapped Unw rapped
Figure 2.14: Effect of Steel Surface Treatment on Stud Behavior
2.6 SUMMARY OF TEST RESULTS Tests on shear studs embedded in early-age concrete revealed that studs transfer shear as early as 4 hours. The concept of design strength was introduced. An equation for predicting design strength and load-slip behavior for shear studs was developed.
Mechanical properties of concrete were monitored for early concrete ages in addition to the stud tests. Tests on cylinders revealed that the stiffness of concrete increases much more rapidly compared to its strength. The existing ACI equation for predicting modulus was found to be applicable to early age concrete.
All push-out test specimens were tested at 28 days to investigate the effects of early age loading. Test results indicated that most specimens gained their full strength despite the fact that they were preloaded. The level of strength gain was found to be inversely proportional to the ultimate displacement level attained in the earlier tests. Significant local crushing may occur if studs are deformed to high displacement levels at early ages. Local crushing may reduce the initial stiffness of the studs.

21
CHAPTER 3
FIELD STUDIES
The study presented herein was a part of a larger research project that was sponsored by the Texas Department of Transportation. The aim of the project was to investigate the behavior of curved, steel, trapezoidal box girders during construction and under live loads. This chapter focuses on the field monitoring of two bridges that were investigated as a part of the research project.
3.1 BRIDGES UNDER STUDY Four trapezoidal steel box girder bridges were constructed at the intersection of IH35 and US290 in Austin, TX. The construction took place between September 1999 and July 2001. Brace members and cross sectional locations were instrumented for two bridges. The instrumented bridges were called Z and K connects. Figure 3.1 shows the site location for these bridges.
WESTBOUNDRM 2222
EASTBOUNDRM 2222
SOUTHBOUNDIH35
NORTHBOUNDIH35
WESTBOUNDUS290
EASTBOUNDUS290
Z - CONNECT
K - CONNECT
Figure 3.1: Site Location
3.2 MONITORING OF CONNECT Z Connect Z provides direct access from eastbound US290 to southbound IH35. The steel portion of the bridge consists of one three-span continuous unit adjacent to a two-span continuous unit. The three-span unit was monitored. The twin-girder symmetrical unit has two side spans of approximately 150 feet in length and a middle span of 190 feet. The centerline radius of the bridge is 450 feet. A plan view of the three-span continuous unit is given in Fig. 3.2.
The dimensions of the girder cross section are shown in Fig. 3.3. The top and bottom flanges and web vary in thickness along the length of the bridge (Appendix A).
North

22
Figure 3.2: Plan View of the Direct Connect Z
Figure 3.3: Dimensions of the Girder Cross Section
K-type internal diaphragms were spaced approximately every 20 feet to prevent distortion of the cross section. Details of internal and external braces are given in Appendix C. Solid plates were used at support locations to reduce torsional stresses. A top lateral truss system made of WT 7x21.5 sections was fastened near the top flanges to form a quasi-closed box section. Each girder centerline was offset by 98 inches from the bridge centerline. The concrete deck had a width of 360 inches. Studs having 7/8 inch diameter were spaced every 12 inches at both ends of the girders for a distance of ten feet from the pier. For the remainder of the girders, studs were spaced at every 24 inches. There were three rows of studs per flange over the entire length of the girders.
3.3 CONCRETE DECK POUR ON DIRECT CONNECT Z After the erection of the steel girders, permanent metal deck forms (PMDF) were installed between the top flanges of the girders. Longitudinal and transverse reinforcement were then placed on top of the PMDF. (Fig. 3.4) The 30-foot wide concrete deck was placed on the bridge by making use of a concrete screed. Class-S type concrete was used for the deck. A total of five pours were specified on the three-span bridge. The pour sequence and the length of pours are given in Fig. 3.5. The arrows indicate the direction of the screed movement during each pour segment.
Pours 1 through 3 took place in the early morning of September 1, 2000, while segments 4 and 5 were poured a week later on September 8, early in the morning. Four top lateral members, which were located near the ends of the girders, were instrumented during pours 1 through 3. (Fig. 3.2) The timing of the pour progress is given in Fig. 3.6. Timing is particularly important in analyzing the early composite action developing during concrete placement. The next section presents the changes in top lateral member forces due to pours 1 through 3 together with the predictions from the developed software.
PIER
PIER PIER
PIER 13Z
14Z 15Z
16Z
SPAN 13 SPAN 14
SPAN 15
DIRECT CONNECT Z
4′-8″
2′ 2′ 6′-11″
4′-6″
98″

23
Figure 3.4: Deck Forms and Reinforcement Installation
Figure 3.5: Concrete Pour Sequence and Direction of Pour
Figure 3.6: Progress of Pours 1, 2, and 3
65FT
135.5FT
92FT
135.5FT
65FT
POUR 1
POUR 4 POUR 3
POUR 5
POUR 2
SPAN 13
SPAN 14
SPAN 15
13z
14z 15z
16z
13z 16z
14z 15z11:40PM
1:00AM
12:30AM2:20AM
3:50AM
3:00AM4:40AM
5:30AM
6:40AM 9:10AM
7:10AM 10:40AM
POUR 3
POUR 2 POUR 1
1 2 21

24
3.4 TOP LATERAL RESULTS FOR Z-CONNECT Top lateral members of the first two panels at each end of the bridge were monitored for both the inner and outer girders. Each top lateral WT had two cross sections gauged for redundancy. The majority of the force measurements for the two sections of each member were nearly identical. The two axial forces for each member were averaged for each time increment. Details on the field monitoring are given in Cheplak (2001). The following sections present the changes in force levels in the instrumented top laterals for the first three pours along with the predictions from the developed software.
3.4.1 Pour 1 Pour 1 had a length of 65 feet and took about 2 hours and 40 minutes to be completed. In the analysis, no composite action was assumed; therefore the concrete and stud stiffness were considered to be zero. The specified deck thickness was 8 inches which is measured from the top surface of the PMDF to the top of the concrete deck. Usually, the amount of concrete poured is greater than the value calculated according to the specified deck thickness. This additional concrete is needed to fill haunches and the gaps of the corrugated metal deck. In the analysis, a modified constant deck thickness that takes into account the additional concrete should be used. For this purpose, the value of the total amount of concrete poured on the Z-connect was obtained from the contractor. From the total concrete amount, a constant deck thickness value was calculated to be 11 inches and this value was used in all the analyses related with the Z-connect. A distributed load value of 3.99 k/ft was applied to the first pour segment in order to simulate the forces resulting from the wet concrete. Changes in axial force levels for the instrumented top laterals, along with the analytical predictions, are given in Figure 3.7. The discussion of the results will be presented in Section 3.5.
-70
-60
-50
-40
-30
-20
-10
0
10
20
30
OuterGirder
Lateral 113Z
OuterGirder
Lateral 213Z
InnerGirder
Lateral 113Z
InnerGirder
Lateral 213Z
OuterGirder
Lateral 116Z
OuterGirder
Lateral 216Z
InnerGirder
Lateral 116Z
InnerGirder
Lateral 216Z
Axi
al F
orce
(kip
s)
Experimental UTrAp
Figure 3.7: Change in Axial Force Levels Due to Pour 1
3.4.2 Pour 2 Pour 2 had a length of 65 feet and was at the opposite end (Pier 16Z) of the bridge. Two hours and 30 minutes elapsed during the completion of this pour. Previously poured concrete on portion 1 had cured nearly 4 to 6 hours when this pour had ended. Although concrete in portion 1 had gained some strength, its value was expected to be very low. (f’c<300 psi) Therefore, in the analysis of pour 2, no composite

25
action was assumed for deck segments 1 and 2. A stiffness value of zero was assigned to the concrete and shear studs of both deck segments, and a distributed load of 3.99 k/ft was placed on the second pour segment. Changes in axial force levels for the instrumented top laterals, along with the analytical predictions, are given in Fig. 3.8.
-70
-60
-50
-40
-30
-20
-10
0
10
20
30
OuterGirder
Lateral 113Z
OuterGirder
Lateral 213Z
InnerGirder
Lateral 113Z
InnerGirder
Lateral 213Z
OuterGirder
Lateral 116Z
OuterGirder
Lateral 216Z
InnerGirder
Lateral 116Z
InnerGirder
Lateral 216Z
Axi
al F
orce
(kip
s)Experimental UTrAp
Figure 3.8: Change in Axial Force Levels Due to Pour 2
3.4.3 Pour 3 Pour 3 had a length of 90 feet and was placed at an equal distance from both ends. This pour was completed in 4 hours. By the time this pour was over, concrete on the first segment had cured 6 to 10 hours, and concrete on the second segment cured between 1 and 5 hours. In the analysis of this pour, concrete on segment one was assumed to cure for an average period of 8 hours. From the laboratory experiments explained in Chapter 2, the concrete stiffness for that time period was estimated to be 2800 ksi. The design connector strength at that time period was estimated to be 10.6 kips for f′c = 0.80 ksi. The load-slip relationship developed in Chapter 2 (Eq. 2.1) revealed that stud stiffness changes between 100 Qd and 33.3 Qd. For this case, studs have an initial tangent stiffness of 1060 k/in and final secant stiffness of 353 k/in. A value of 600 k/in was selected to represent the stud stiffness in segment 1. Moreover, because a short period of time had elapsed for curing of segment 2, this segment was assumed to act non-compositely. A distributed load of 3.99 k/ft was placed on the third pour segment. Changes in axial force levels for the instrumented top laterals along with the analytical predictions are given in Fig. 3.9. For comparison purposes, the analysis results for the case where the entire bridge is assumed to act non-compositely are presented in the same figure.
In order to investigate the validity of the assumptions made regarding the stud stiffness, several additional analyses were performed. In all these analyses, a concrete stiffness of 2800 ksi was used for the first segment, and the stud stiffness value varied between zero and 1000 k/in. Analysis results showed that varying the stud stiffness value had little effect on the axial force values of the top laterals located near pier 16Z because non-composite action was specified in the analysis. However, a change in stud stiffness had a significant effect on the axial force values of the top laterals located near pier 13Z. Figure 3.10 shows the axial force levels as a function of stud stiffness for the four top lateral members close to pier 13Z.

26
-60
-40
-20
0
20
40
60
OuterGirder
Lateral 113Z
OuterGirder
Lateral 213Z
InnerGirder
Lateral 113Z
InnerGirder
Lateral 213Z
OuterGirder
Lateral 116Z
OuterGirder
Lateral 216Z
InnerGirder
Lateral 116Z
InnerGirder
Lateral 216Z
Axi
al F
orce
(kip
s)
Experimental UTrAp UTrAp- non composite
Figure 3.9: Change in Axial Force Levels Due to Pour 3
-40
-30
-20
-10
0
10
20
30
40
50
60
0 200 400 600 800 1000 1200
Stud Stiffness (k /in)
Cha
nge
in A
xial
For
ce (k
ips)
Outer 1 Outer 2 Inner 1 Inner 2
Figure 3.10: Effect of Stud Stiffness on 13Z Top Lateral Forces (Pour 3)

27
It could be concluded that the assumption of a 600 k/in value for stud stiffness is reasonable by comparing the measured values and the analysis results presented in figures 3.9 and 3.10, respectively. Values of stud stiffness higher than 350 k/in produce similar results.
3.5 DISCUSSION OF ANALYSIS RESULTS For all three pours, the analytical predictions are in reasonable agreement with the experimental findings. In general, the computed forces were higher than the ones observed in the field. The discrepancies could be attributable to several shortcomings of the modeling used in the developed software such as superelevation or support movements. The effects of these shortcomings on the results were investigated further. The investigation was carried out by making use of a commercially available, general-purpose finite element program, ABAQUS. In the following sections, details of the modeling with ABAQUS and a discussion of various shortcomings of UTrAp are presented.
3.5.1 Finite Element Model Used in ABAQUS The same mesh density used in UTrAp was used for modeling the bridge in ABAQUS. Eight-node quadratic shell elements with reduced integration (S8R5) were used to model the top and bottom flanges, webs and pier diaphragms. Instead of shell elements, three-dimensional, 20-node quadratic bricks (C3D20) were used to model the concrete deck. One and twenty brick elements were used along the thickness and width of the deck, respectively. All bracing members were modeled with 2-node linear beam elements (B31). Spring elements were placed between the top flange and concrete deck to simulate the studs.
3.5.2 Shortcomings of the UTrAp Model
3.5.2.1 Superelevation
UTrAp forms the model of the bridge without accounting for the horizontal superelevation. However, in reality these bridges have moderate levels of horizontal superelevation. The Z-connect has a 6% superelevation. If there is no superelevation, then forces due to concrete weight are applied vertically to the bridge. In the case of superelevation, concrete weight has a horizontal component that acts on the bridge. This horizontal component produces a constant torque along the length which counteracts the forces due to the vertical component. In general, including superelevation into the model reduces the level of forces calculated for top lateral members.
3.5.2.2 Deck Thickness Profile
During the design of these bridges, a constant concrete deck thickness is specified. Due to construction limitations, it is very difficult to place concrete evenly on the permanent metal deck forms. Therefore, in some cases, the deck thickness profile becomes non-uniform. This kind of non-uniformity was not included in the finite element model because it could not be predicted at the design stage. For the bridges mentioned in this study, the thickness of the deck along the width and length of the bridge were measured by TxDOT engineers during construction. The measurements revealed that the poured deck had a tapered cross section for the Z-connect. Thickness of the deck reduced gradually from the inner portion of the bridge to the outer portion. (From 12.4 inches to 9.6 inches) Placing concrete unevenly has effects on the measured forces. In this case, placing more concrete on the inner girder compared to the outer girder causes a torque along the length of the bridge that counteracts the torsional forces due to the curved geometry of the bridge.
3.5.2.3 Support Movements
In the software developed, no vertical movement is allowed at the support locations. However, in reality some vertical support movement is expected. During the construction of these bridges, elastomeric bridge bearings were used at support locations. Because bearings do not possess infinite compressive and

28
rotational stiffness, some degree of movement should be expected at supports. The sensitivity of the measured forces to support movements will be discussed later.
3.5.2.4 Permanent Metal Deck Forms
As mentioned earlier, permanent metal deck forms (PMDF) were placed atop the girders to act as a formwork for the concrete deck. PMDF were attached to a thin angle section which was welded to the top flanges. Although this attachment detail is very weak, the PMDF stiffens the cross section to some small degree. Currently there is little information on quantifying the level of stiffness gain due to the attachment of PMDF to the top flanges of steel trapezoidal U-shaped girders (Chen, 2002). Therefore, the effects of PMDF are excluded in all finite element analyses.
3.5.2.5 Connection Details
In the Z and K connects, the top flange bracing members were bolted, not welded, to the top flanges. Bolted shear connections are more flexible compared to the rigid welded connection details. In these bridges, the bolts were specified to be fully torqued in the shop using the turn-of-the-nut tightening method (AISC, 1994). However, these bolts are frequently loosened in the field to provide some flexibility for erectors completing the girder field splices. In all the finite element analyses, welded connections were assumed. Bolted tension and shear connections were also used to connect the external diaphragms to the girders. (Cheplak, 2001) Due to the flexibility of these joints, the force distribution between the girders might be different than the calculated values.
3.5.3 Sensitivity Study In order to investigate the effects of superelevation and deck thickness profile, two additional analyses were performed using ABAQUS. In the first analysis, pour 1 was simulated by incorporating the superelevation into the model. In the second analysis, both superelevation and the tapered deck thickness profile were included. Figure 3.11 presents the results for both of these analyses together with the experimental and analytical findings explained before. It is evident that including the superelevation and tapered deck thickness profile produces estimates that are closer to the experimental findings. Axial forces on braces tend to decrease by 9% on average by including superelevation into the model. Forces reduced further by 17% on average by including the tapered thickness profile resulting in a total reduction of 26%.
-70
-60
-50
-40
-30
-20
-10
0
10
20
30
40
OuterGirder
Lateral 113Z
OuterGirder
Lateral 213Z
InnerGirder
Lateral 113Z
InnerGirder
Lateral 213Z
OuterGirder
Lateral 116Z
OuterGirder
Lateral 216Z
InnerGirder
Lateral 116Z
InnerGirder
Lateral 216Z
Axi
al F
orce
(kip
s)
Experimental ABAQUSABAQUS w / superelevation ABAQUS w /superelevation&deckUTrAp
Figure 3.11: Sensitivity Study on Z-Connect
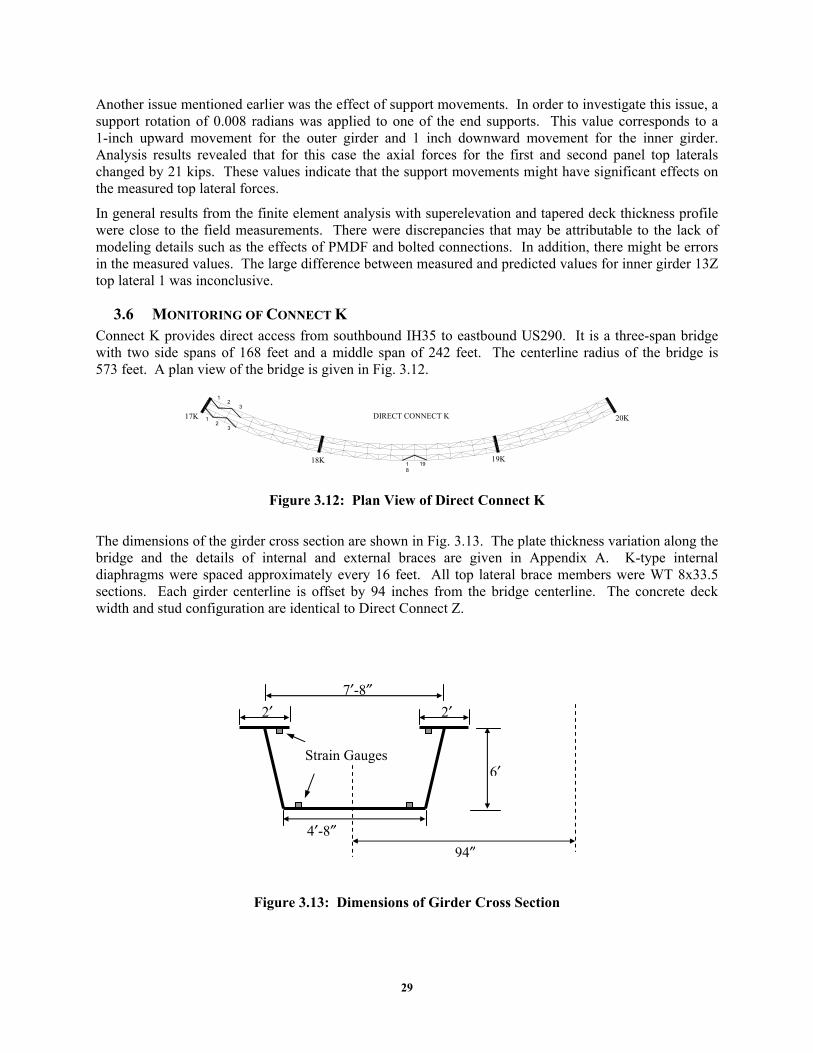
29
Another issue mentioned earlier was the effect of support movements. In order to investigate this issue, a support rotation of 0.008 radians was applied to one of the end supports. This value corresponds to a 1-inch upward movement for the outer girder and 1 inch downward movement for the inner girder. Analysis results revealed that for this case the axial forces for the first and second panel top laterals changed by 21 kips. These values indicate that the support movements might have significant effects on the measured top lateral forces.
In general results from the finite element analysis with superelevation and tapered deck thickness profile were close to the field measurements. There were discrepancies that may be attributable to the lack of modeling details such as the effects of PMDF and bolted connections. In addition, there might be errors in the measured values. The large difference between measured and predicted values for inner girder 13Z top lateral 1 was inconclusive.
3.6 MONITORING OF CONNECT K Connect K provides direct access from southbound IH35 to eastbound US290. It is a three-span bridge with two side spans of 168 feet and a middle span of 242 feet. The centerline radius of the bridge is 573 feet. A plan view of the bridge is given in Fig. 3.12.
Figure 3.12: Plan View of Direct Connect K
The dimensions of the girder cross section are shown in Fig. 3.13. The plate thickness variation along the bridge and the details of internal and external braces are given in Appendix A. K-type internal diaphragms were spaced approximately every 16 feet. All top lateral brace members were WT 8x33.5 sections. Each girder centerline is offset by 94 inches from the bridge centerline. The concrete deck width and stud configuration are identical to Direct Connect Z.
Figure 3.13: Dimensions of Girder Cross Section
1 2
3
18
19
32 1
17K
18K 19K
20KDIRECT CONNECT K
4′-8″
2′ 2′ 7′-8″
6′
94″
Strain Gauges

30
3.7 CONCRETE DECK POUR ON DIRECT CONNECT K After the placement of the PMDF and reinforcement, the concrete deck was poured in five segments. The pour sequence and the length of the pours are given in Fig. 3.14.
Figure 3.14: Concrete Pouring Sequence on Direct Connect K
The dates and the start and end times for the first three pours are given in Table 3.1. Eight top lateral members and four cross sections were instrumented for this bridge. Six of the instrumented top laterals were located in the first three panels at pier 17K. (Fig. 3.12) The remaining two instrumented laterals were located at panels 18 and 19 of the outer girder. (Fig. 3.12) Strain gauges were placed at the top and bottom flanges for four cross-sections. Two of the instrumented cross sections were located in the middle of panels 2 and 3. For these locations, both the inner and outer girder were monitored. The remaining two instrumented cross sections were located in the middle of panels 18 and 19. For these locations, only the outer girder was monitored. A total of four gauges were placed per girder cross section. Two of these gauges were placed at the top flanges while the others were placed at the bottom flange. (Fig. 3.13) Gauges were located at 5 inches from the edge of the plates.
Table 3.1: Start and End Times for the First Three Pours
START END DURATION POUR 1 3/13/01 8:39 AM 3/13/01 11:10 AM 2 hr 31 min POUR 2 3/16/01 12:27 AM 3/16/01 2:05 AM 1 hr 38 min POUR 3 3/17/01 12:00 AM 3/17/01 3:20 AM 3 hr 20 min
3.8 TOP LATERAL AND GIRDER STRESS RESULTS FOR THE K-CONNECT The field monitoring procedures used for the Z-Connect were also used for this bridge. Details of the field monitoring are given in Cheplak (2002). For the cross-sectional stresses, the two strain gage values on the flange were averaged for both the top flange and the bottom flange. The following section presents the changes in force and stress levels for the first three pours along with the predictions from the developed software.
3.8.1 Pour 1 Pour 1 had a length of 100 feet and took approximately 2 hours and 30 minutes to be completed. In the analysis, no composite action was assumed; therefore the concrete and stud stiffness were considered to be zero. The specified deck thickness for this bridge was 8 inches. From the measurements taken during the concrete pour, it was found out that the deck thickness profile was fairly uniform for this bridge. A constant deck thickness value was calculated to be 10 inches to account for the extra concrete that results when using PMDF. In all the analysis related with the K-connect, a constant deck thickness of 10 inches was used. A distributed load value of 3.625 k/ft was applied to the first pour segment in order to simulate the forces arising from the wet concrete. Changes in axial force levels and cross sectional stresses are given in Figs. 3.15 and 3.16 along with the analytical predictions.
17K
18K 19K
20KPOUR 3
POUR 4
POUR 1
POUR 5
POUR 2
100 FT 122 FT
134 FT122 FT
100 FT

31
In the figures related with stresses, the following nomenclature is used: Out- Outer Girder, In- Inner Girder, T- Top Flange, and B- Bottom Flange. Therefore, Out 3B means a change in stress at the bottom flange of the outer girder in the middle of panel 3.
-100
-80
-60
-40
-20
0
20
40
60
80
Panel 1OuterGirder
Panel 1InnerGirder
Panel 2OuterGirder
Panel 2InnerGirder
Panel 3OuterGirder
Panel 3InnerGirder
Panel 18OuterGirder
Panel 19OuterGirder
Axi
al F
orce
(kip
s)
Experim ental UTrAp
Figure 3.15: Change in Axial Force Levels Due to Pour 1
-15
-10
-5
0
5
10
15
Out 2T Out 2B In 2T In 2B Out 3T Out 3B In 3T In 3B Out18T
Out18B
Out19T
Out19B
Stre
ss (k
si)
Experimental UTrAp
Figure 3.16: Change in Cross-Sectional Stresses Due to Pour 1

32
3.8.2 Pour 2 Pour 2 had a length of 100 feet and was at the opposite end (Pier 20K) of the bridge. One hour and 38 minutes elapsed during the completion of this pour. Previously poured concrete on portion 1 had cured for 3 days when this pour started. From the laboratory experiments and the developed equations, the predicted concrete and average stud stiffness were 4100 ksi and 1200 k/in, respectively for pour 1. A distributed load of 3.625 k/ft was placed on the second pour segment. Changes in axial force levels and cross sectional stresses are given in Figs. 3.17 and 3.18 along with the analytical predictions. For comparison purposes, the analysis results for the case where the entire bridge is assumed to act non-compositely are presented in the same figures.
-15
-10
-5
0
5
10
15
20
Panel 1OuterGirder
Panel 1Inner
Girder
Panel 2OuterGirder
Panel 2Inner
Girder
Panel 3OuterGirder
Panel 3Inner
Girder
Panel 18OuterGirder
Panel 19OuterGirder
Axi
al F
orce
(kip
s)
Experimental UTrAp UTrAp- noncomposite
Figure 3.17: Change in Axial Force Levels Due to Pour 2
-3
-2
-1
0
1
2
3
Out 2T Out 2B In 2T In 2B Out 3T Out 3B In 3T In 3B Out18T
Out18B
Out19T
Out19B
Stre
ss (k
si)
Experimental UTrAp UTrAp- noncomposite
Figure 3.18: Change in Cross-Sectional Stresses Due to Pour 2

33
3.8.3 Pour 3 Pour 3 had a length of 134 feet and was placed at an equal distance from both ends. This pour was completed in 3 hours 20 minutes. By the time this pour was over, concrete on first segment has cured for 4 days, and the concrete on second segment has cured for one day. In the analysis, concrete and average stud stiffness were assumed to be 4100 ksi and 1200 k/in, respectively for the first segment. The corresponding values for the second segment were 3700 ksi and 1000 k/in, respectively. A distributed load of 3.625 k/ft was placed on the third pour segment. Changes in axial force levels and cross- sectional stresses are given in Figs. 3.19 and 3.20 along with the analytical predictions. For comparison purposes, the analysis results for the case where the entire bridge is assumed to act non-compositely are presented in the same figures.
-100
-80
-60
-40
-20
0
20
40
60
80
Panel 1OuterGirder
Panel 1Inner
Girder
Panel 2OuterGirder
Panel 2Inner
Girder
Panel 3OuterGirder
Panel 3Inner
Girder
Panel 18OuterGirder
Panel 19OuterGirder
Axi
al F
orce
(kip
s)
Experimental UTrAp UTrAp- non composite
Figure 3.19: Change in Axial Force Levels Due to Pour 3
-25
-20
-15
-10
-5
0
5
10
15
20
Out 2T Out 2B In 2T In 2B Out 3T Out 3B In 3T In 3B Out18T
Out18B
Out19T
Out19B
Stre
ss (k
si)
Experimental UTrAp UTrAp- non composite
Figure 3.20: Change in Cross-Sectional Stresses Due to Pour 3

34
3.9 SUMMARY OF ANALYTICAL PREDICTIONS For both of the bridges, the analytical predictions were in reasonable agreement with the experimental findings. In almost all cases, the analytical predictions were higher than the forces/stresses measured in the field. The reason for these discrepancies was the lack of knowledge on the effects of some details that were not included in the analytical model. These details were the modeling of PMDF and flexible connections as well as the support movements.
In general the program was capable of generating acceptable results for cases where there was no composite action. For the cases with early composite action, the differences in predicted and measured quantities were much higher. Based on K-connect results the predictions for girder stresses were much better than those for top lateral forces.
The experimental findings clearly reveal that composite action was occurring at very early concrete ages. For the Z-connect, the effects of composite action were observed as early as 8 hours.

35
CHAPTER 4
SUMMARY AND CONCLUSIONS
The weight of wet concrete comprises the majority of the loads acting on steel trapezoidal box girder bridges during construction. The entire deck is usually not cast in one stage because of the large volume of concrete and to control shrinkage. These systems were monitored in the past during the pouring sequence and were analyzed by making use of commercially available, sophisticated finite element programs. (Fan, 1999, and Cheplak, 2001) For later pours, significant differences were observed between the measured and predicted quantities. These differences gave an indication that the concrete poured at earlier times was acting compositely with the bridge.
An experimental program was developed to establish the behavior of the concrete deck – steel girder interface at early concrete ages. In order to investigate the behavior, load-slip curves for the connector elements (shear studs) embedded in early age concrete were obtained. A setup that enables the testing of studs at early concrete ages was developed. The study was limited to one type of concrete mix design used typically for Texas bridges. A total of 24 push-out tests were performed at eight different times varying between 4 hours and 28 days. At all time periods, cylinder tests were also conducted to determine the compressive and tensile strength and stiffness of concrete. Tests revealed that shear transfer between steel and concrete was achieved as early as 4 hours. In order to quantify the shear stud capacity at early concrete ages to be used during construction stages, a definition of design strength Qd was proposed based on a stud displacement limit of 0.03in. to control local concrete crushing at the studs. From the test results, equations for predicting the design and maximum stud strength were developed. The use of the current ACI equation for predicting concrete stiffness was found applicable to concrete at early ages. In order to estimate the shear stud stiffness, a load-slip relationship for studs was developed. As a last step, all specimens were retested after 28 days to find out the effects of loading early-age concrete. Test results showed that the maximum capacity decreases with the residual slip but studs deformed only up to the 0.03 in. limit at early ages were able to develop their full strength at 28 days. Excessive deformations at early ages might also cause a decrease in initial stiffness of the studs.
Using the design strength Qd in evaluating the strength of the composite girders during construction could reduce the top flange lateral truss bracing requirements during concrete staging. The loading that would exist during these stages would be the construction dead and live loads. The maximum strength, Qmax, would then be used to calculate the strength of the bridge in-service using normal design loads.
Two curved steel box girder bridges were monitored during construction to determine the effect of the pour sequence on girder stresses and brace member forces. Forces and stresses obtained from field tests showed reasonable agreement with the analytical results predicted by UTrAp. In general, the analytical predictions were higher than the field results. Several shortcomings related to analytical modeling were identified. Sensitivity studies were performed to investigate the effects of these shortcomings. Overall, the program produces acceptable results.
In conclusion, it was proven through laboratory experiments and field-tests that composite action develops at very early concrete ages. The research will have impacts on the fields of shear stud testing methods and bridge engineering. The new push-out test setup could be standardized and used for future shear stud investigations. Moreover, the concept of early composite action will lead to a better understanding of the bridge behavior. The use of this concept together with the developed software will yield more accurate and cost effective designs. Future research should extend the investigations by using different concrete mix designs and different stud geometries. Information contained herein could be used to investigate the potential benefits of early composite action in reducing the cost of these structural systems and the effects of different pouring sequences on stresses in the members.

36

37
APPENDIX A
BRIDGE PROPERTIES
Z-Connect Plate Properties
WEB BOTTOM FLANGE TOP FLANGE Length(ft.) Thickness(in.) Length(ft.) Thickness(in.) Length(ft.) Thickness(in.)
100.5 0.5 100.5 0.75 127 1.25 99 0.625 26.5 1.25 10 1.75 94 0.5 10 1.5 26 2.75 99 0.625 26 2.0 10 1.75
100.5 0.5 10 1.5 147 1.25 26.5 1.25 10 1.75 94 0.75 26 2.75 26.5 1.25 10 1.75 10 1.5 127 1.25 26 2.0 10 1.5 26.5 1.25 100.5 0.75
Σ = 493 ft Σ = 493 ft Σ = 493 ft
K-Connect Plate Properties
WEB BOTTOM FLANGE TOP FLANGE Length(ft.) Thickness(in.) Length(ft.) Thickness(in.) Length(ft.) Thickness(in.)
134 0.625 96 0.75 96 1.0 113 0.75 60 1.5 47 1.5 84 0.625 23 2.0 13 2.0
113 0.75 47 1.5 23 3.0 134 0.625 126 0.75 46 2.0
47 1.5 128 1.0 23 2.0 46 2.0 60 1.5 23 3.0 96 0.75 13 2.0 47 1.5 96 1.0
Σ = 578 ft Σ = 578 ft Σ = 578 ft
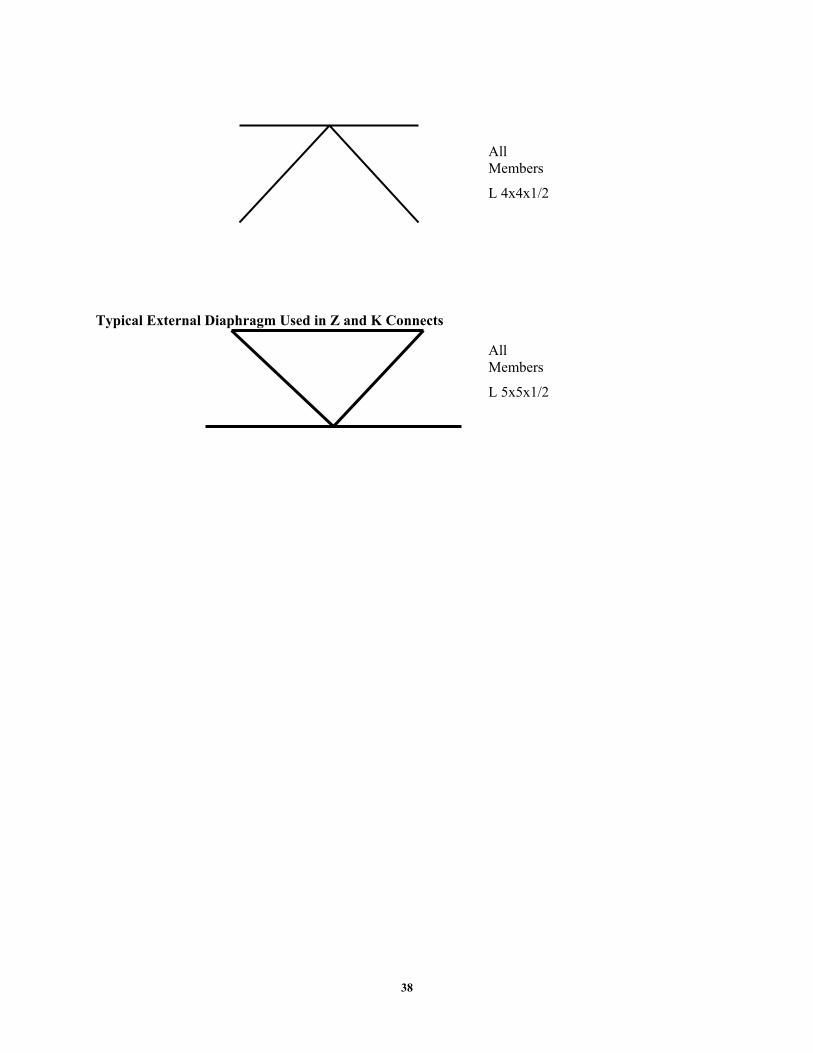
38
Typical External Diaphragm Used in Z and K Connects
All Members
L 4x4x1/2
All Members
L 5x5x1/2

39
REFERENCES
ABAQUS (1997). “Standard User’s Manual.” Hibbitt, Karlsson, and Sorensen, Inc., USA.
ACI (1999). “Building Code Requirements for Structural Concrete and Commentary.” ACI 318R-99, Farmington Hills, Michigan.
AISC (1994). “Manual of Steel Construction – Load and Resistance Factor Design.” 2nd Ed., Chicago.
ASTM C496-96 (1996). “Standard Test Method for Splitting Tensile Strength of Cylindrical Concrete Specimens.” West Conshohocken, PA.
ASTM C469-94 (1994). “Standard Test Method for Static Modulus of Elasticity and Poisson’s Ratio of Concrete in Compression.” West Conshohocken, PA.
Chen, B. S. (2002). “Top-Lateral Bracing Systems for Trapezoidal Steel Box-Girder Bridges” PhD Dissertation, University of Texas at Austin.
Cheplak, B. A. (2001). “Field Measurements of Intermediate External Diaphragms on a Trapezoidal Steel Box Girder Bridge.” MS Thesis, University of Texas at Austin.
Cheplak, B. A., Memberg, M., Frank, K. H., and Yura, J. A., (2002) “Field Measurements of Diaphragm and Top Lateral Members of Three Trapezoidal Composite Box Girder Bridges.” Research Report 1896-1 , Center for Transportation Research, University of Texas at Austin, Oct., 126p
Fan, Z. (1999). “Field and Computational Studies of Steel Trapezoidal Box Girder Bridges.” Dissertation, University of Houston.
Holt, J. (2001) TxDot Design Engineer, Personal Contacts.
Khan, A. A., Cook, W. D., and Mitchell D. (1995). “Early Age Compressive Stress-Strain Properties of Low-, Medium-, and High-Strength Concretes.” ACI Materials Journal, Vol. 92, No. 6, pp. 617-624.
Kollbrunner, C. F, Basler, K. (1969). “Torsion in Structures – An Engineering Approach.” Springer-Verlag, New York.
Lew, H. S., Reichard, T. W. (1978). “Mechanical Properties of Concrete at Early Ages.” ACI Journal, Vol. 75, No. 10, pp.533-542.
MacGregor, J. G. (1997). “Reinforced Concrete: Mechanics and Design.” 3rd Edition, Prentice Hall, Inc., Upper Saddle River, New Jersey.
Mo, Y. L., Chang, W. L., and Lee, Y. C. (1998). “Early Form Removal of Reinforced Concrete Slabs.” ASCE Practice Periodical on Structural Design and Construction, Vol. 3, No. 2, pp. 51-55.
Ollgaard, J. G., Slutter, R. G., and Fisher, J. W. (1971). “Shear Strength of Stud Connectors in Lightweight and Normal-Weight Concrete.” AISC Engineering Journal, 8(2), pp. 55-64.
Oluokun, F. A., Burdette, E. G., and Deatherage, J. H. (1991). “Elastic Modulus, Poisson’s Ratio, and Compressive Strength Relationship at Early Ages.” ACI Materials Journal, Vol. 88, No. 1, pp. 3-10.
Texas Department of Transportation (TxDot) (1993). “Standard Specification Book.” Austin, Texas.
Topkaya, C., Williamsom, E. B. and Yura, J. A.(2002), “UTrAp: Finite Element Based Software for the Analysis of Curved Trapezoidal Girders under Construction Loads”, Research Report 1898-3, Center for Transportation Research, U. of Texas at Austin, October, 32p
Topkaya, C.and Williamsom, E. B.(2003), “Development of Computational Software for analysis of Curved Girders under Construction loads”, Computers and Structures, Vol. 81, No. 21, pp 2087-2098

40
Sennah, K. M., Kennedy, J. B. (2001). “State-of-the-Art in Design of Curved Box Girder Bridges.” ASCE Journal of Bridge Engineering, Vol. 6, No. 3, pp. 159-167.
Viest, I. M., Colaco, J. P., Furlong, R. W., Griffis, L. G., Leon, R. T., and Wyllie, L. A. (1997). “Composite Construction Design for Buildings.” McGraw-Hill, New York.
Wang, Y. C. (1998). “Deflection of Steel-Concrete Composite Beams with Partial Shear Interaction.” ASCE Journal of Structural Engineering, Vol. 124, No. 10, pp. 1159-1165.