TECHNICAL REPORT AND PRE-FEASIBILITY STUDY · PDF file12.1.3 Core Assay Checks ... 18.7...
180
TECHNICAL REPORT AND PRE-FEASIBILITY STUDY ON THE TRUE NORTH GOLD MINE, BISSETT, MANITOBA, CANADA FOR KLONDEX CANADA LTD. LATITUDE 51 o 01’ 19.6” N LONGITUDE 95 o 40’ 44.9” W UTM WGS84 Zone 15U 312,110 m E 5,655,700 m N NI-43-101 & 43-101F1 TECHNICAL REPORT Eugene Puritch, P.Eng. Alexandru Veresezan, P.Eng. Fred Brown, P.Geo. William Stone, P.Geo. Alfred Hayden, P.Eng. David Orava, P.Eng. Kirk Rodgers, P.Eng. P&E Mining Consultants Inc., Report 315 Effective Date: June 30, 2016 Signing Date: October 27, 2016
Transcript of TECHNICAL REPORT AND PRE-FEASIBILITY STUDY · PDF file12.1.3 Core Assay Checks ... 18.7...

TECHNICAL REPORT AND PRE-FEASIBILITY STUDY
ON THE
TRUE NORTH GOLD MINE,
BISSETT, MANITOBA, CANADA
FOR
KLONDEX CANADA LTD.
LATITUDE 51o 01’ 19.6” N LONGITUDE 95
o 40’ 44.9” W
UTM WGS84 Zone 15U 312,110 m E 5,655,700 m N
NI-43-101 & 43-101F1
TECHNICAL REPORT
Eugene Puritch, P.Eng.
Alexandru Veresezan, P.Eng.
Fred Brown, P.Geo.
William Stone, P.Geo.
Alfred Hayden, P.Eng.
David Orava, P.Eng.
Kirk Rodgers, P.Eng.
P&E Mining Consultants Inc.,
Report 315
Effective Date: June 30, 2016
Signing Date: October 27, 2016

TABLE OF CONTENTS
1.0 SUMMARY ............................................................................................................................1 1.1 PROJECT HISTORY .................................................................................................1 1.2 GEOLOGIC SETTING AND MINERALIZATION .................................................1 1.3 PROJECT STATUS....................................................................................................2 1.4 MINERAL RESOURCE ESTIMATES .....................................................................2 1.5 MINERAL RESERVE ESTIMATES.........................................................................3 1.6 MINING ......................................................................................................................5 1.7 MINERAL PROCESS AND METALLURGICAL TESTING ..................................5 1.8 TAILINGS REPROCESSING....................................................................................6 1.9 ENVIRONMENTAL AND PERMITTING ...............................................................6 1.10 OPERATING AND CAPITAL COST ESTIMATES ..............................................6 1.11 PROJECT ECONOMICS .........................................................................................8 1.12 RECOMMENDATIONS AND CONCLUSIONS ...................................................8
2.0 INTRODUCTION AND TERMS OF REFERENCE ..........................................................10 2.1 TERMS OF REFERENCE .......................................................................................10 2.2 SOURCES OF INFORMATION .............................................................................10 2.3 UNITS AND CURRENCY ......................................................................................11
3.0 RELIANCE ON OTHER EXPERTS ...................................................................................14 4.0 PROPERTY DESCRIPTION AND LOCATION ................................................................15
4.1 PROPERTY LOCATION .........................................................................................15 4.2 PROPERTY DESCRIPTION ...................................................................................16 4.3 LIABILITIES AND PERMITS ................................................................................16
5.0 ACCESSIBILITY, CLIMATE, LOCAL RESOURCES, INFRASTRUCTURE AND
PHYSIOGRAPHY .............................................................................................................18 5.1 ACCESSIBILITY .....................................................................................................18 5.2 CLIMATE AND PHYSIOGRAPHY .......................................................................18 5.3 LOCAL RESOURCES AND INFRASTRUCTURE ...............................................18
6.0 HISTORY .............................................................................................................................22 6.1 PRE 1989 ERA .........................................................................................................22 6.2 POST 1989 ERA .......................................................................................................23 6.3 RICE LAKE GOLD MINE HISTORIC RESOURCE ESTIMATES ......................29
6.3.1 Historic Resource Estimates ......................................................................29 6.3.2 Most Recent Resource Estimate ................................................................29
6.4 RICE LAKE PROPERTIES FEASIBILITY STUDIES...........................................32 6.4.1 Historic Feasibility Studies ........................................................................32 6.4.2 Existing Feasibility Studies........................................................................32
6.5 PREVIOUS MINERAL PROCESSING & METALLURGICAL TESTING..........32 7.0 GEOLOGICAL SETTING AND MINERALIZATION ......................................................33
7.1 REGIONAL GEOLOGICAL SETTING ..................................................................33 7.2 LOCAL GEOLOGIC SETTING ..............................................................................35
7.2.1 Host Rock Units .........................................................................................35 7.2.2 Structures ...................................................................................................37 7.2.3 Veins ..........................................................................................................37 7.2.4 Wall Rock Alteration .................................................................................40
8.0 DEPOSIT TYPES .................................................................................................................43 9.0 EXPLORATION...................................................................................................................44 10.0 DRILLING ..........................................................................................................................45
10.1 DIAMOND CORE DRILLING ..............................................................................45 10.2 CHANNEL CHIP SAMPLING ..............................................................................46 10.3 HISTORIC TAILINGS POND DRILLING/SAMPLING .....................................47

11.0 SAMPLE PREPARATION, ANALYSES AND SECURITY ...........................................49 11.1 CORE SAMPLING METHODS ............................................................................49
11.1.1 Surface Core Sampling Methods ...............................................................49 11.1.2 Underground Core Sampling Methods ......................................................49
11.2 FACE SAMPLING METHODS.............................................................................51 11.3 TAILINGS SAMPLING METHODS ....................................................................51 11.4 SAMPLE QUALITY, REPRESENTATIVENESS AND SAMPLE BIAS ...........51 11.5 SAMPLE PREPARATION, ANALYSIS AND SECURITY ................................52
11.5.1 Core Sample Preparation and Analysis ......................................................52 11.5.2 Channel Chip Sample Preparation and Analysis .......................................52 11.5.3 Tailings Sample Preparation and Analysis ................................................53
11.6 CORE QUALITY ASSURANCE & QUALITY CONTROL ...............................53 11.6.1 Sample Standards .......................................................................................53 11.6.2 Core Sample Blanks and Duplicates ..........................................................55
11.7 CHIP QUALITY ASSURANCE & QUALITY CONTROL .................................57 11.7.1 Sample Standards .......................................................................................57 11.7.2 Chip Sample Duplicates .............................................................................57
11.8 TAILINGS QUALITY ASSURANCE-QUALITY CONTROL ............................58 11.8.1 Sample Standards .......................................................................................58 11.8.2 Tailings Sample Blanks and Duplicates ....................................................58
11.9 RECOMMENDATIONS AND CONCLUSIONS .................................................60 12.0 DATA VERIFICATION ....................................................................................................62
12.1 DRILL DATA REVIEW ........................................................................................62 12.1.1 Collar Location Checks..............................................................................62 12.1.2 Hole Survey Checks ...................................................................................62 12.1.3 Core Assay Checks ....................................................................................62 12.1.4 Geology Checks .........................................................................................62
12.2 CHANNEL CHIP DATA REVIEW .......................................................................63 12.2.1 Collar Location Checks..............................................................................63 12.2.2 Down Hole Survey Checks ........................................................................63 12.2.3 Assays Checks ...........................................................................................63
12.3 TAILINGS DATA REVIEW .................................................................................63 12.3.1 Assays Checks ...........................................................................................63
12.4 DUE DILIGENCE SAMPLING.............................................................................64 12.5 CONCLUSIONS TO DATA VERIFICATION .....................................................66
13.0 MINERAL PROCESSING AND METALLURGICAL TESTING ..................................67 14.0 MINERAL RESOURCE ESTIMATE ................................................................................73
14.1 INTRODUCTION ..................................................................................................73 14.2 PREVIOUS RESOURCE ESTIMATES ................................................................74 14.3 DATA SUPPLIED ..................................................................................................74 14.4 BULK DENSITY....................................................................................................75 14.5 VEIN MODELLING ..............................................................................................75 14.6 ASSAY DATA .......................................................................................................78 14.7 COMPOSITING .....................................................................................................81 14.8 TREATMENT OF EXTREME VALUES..............................................................82 14.9 AU GRADE ESTIMATION, CLASSIFICATION & MINIMUM WIDTH .........83 14.10 UNDERGROUND MINERAL RESOURCE ESTIMATE ...................................84 14.11 BLOCK MODEL VALIDATION .........................................................................86 14.12 TAILINGS MINERAL RESOURCE ESTIMATE ...............................................88 14.13 PREVIOUS RESOURCE ESTIMATES ...............................................................88 14.14 TAILINGS DATA SUPPLIED .............................................................................88 14.15 TAILINGS DRY BULK DENSITY ......................................................................89 14.16 DEPOSIT MODELLING ......................................................................................89

14.17 ASSAY DATA ......................................................................................................90 14.18 COMPOSITING ....................................................................................................90 14.19 SPATIAL ANALYSIS ..........................................................................................91 14.20 TREATMENT OF EXTREME VALUES.............................................................92 14.21 BLOCK MODEL EXTENTS ................................................................................92 14.22 GOLD TAILINGS GRADE ESTIMATION & CLASSIFICATION ...................93 14.23 TAILINGS MINERAL RESOURCE ESTIMATE ...............................................93 14.24 TAILINGS BLOCK MODEL VALIDATION .....................................................94
15.0 MINERAL RESERVE ESTIMATES.................................................................................97 15.1 UNDERGROUND MINERAL RESERVE ESTIMATES .....................................97 15.2 TAILINGS MINERAL RESERVE ESTIMATION .............................................101
16.0 MINING METHODS .......................................................................................................104 16.1 MINE DEVELOPMENT ......................................................................................104
16.1.1 Access Development ................................................................................104 16.1.4 Ventilation and Secondary Egress ...........................................................106
16.3 MINING METHODS ...........................................................................................108 16.3.1 Long-hole Stoping ...................................................................................108 16.3.2 Captive Sub Level Long-hole Stoping .....................................................111 16.3.3 Haulage ....................................................................................................112
16.5 EQUIPMENT FLEET UNDERGROUND...........................................................114 17.0 PROCESS PLANT AND PROCESS RECOVERY .........................................................116 18.0 PROJECT INFRASTRUCTURE .....................................................................................118
18.1 LOCATION AND ACCESS ................................................................................118 18.2 ACCOMMODATIONS AND CAMP FACILTIES .............................................118 18.3 ELECTRICAL POWER AND ON-SITE DISTRIBUTION ................................119 18.4 WATER SUPPLY AND RETICULATION ........................................................119 18.5 AIR COMPRESSORS ..........................................................................................119 18.6 DIESEL FUEL AND ON-SITE STORAGE FACILITY .....................................119 18.7 WAREHOUSING AND MATERIAL HANDLING ...........................................119 18.8 SITE SECURITY..................................................................................................119 18.9 COMMUNICATION ............................................................................................119 18.10 ON SITE TRANSPORT AND INFRASTRUCTURE ........................................120 18.11 SOLID WASTE DISPOSAL ...............................................................................120 18.12 PARTS AND MINE SUPPLY FREIGHT ..........................................................120 18.13 MOBILE AND FIX EQUIPMENT MAINTENACE FACILITY ......................120 18.14 FIRST AID AND AMBULANCE ......................................................................120 18.15 OFFICE AND ADMINISTRATION BULDINGS .............................................120
19.0 MARKET STUDIES AND CONTRACTS ......................................................................122 20.0 ENVIRONMENTAL STUDIES, PERMITTING, AND SOCIAL OR COMMUNITY
IMPACT ..........................................................................................................................123 20.1 SUMMARY ..........................................................................................................123 20.2 SCOPE OF THE PROJECT .................................................................................123 20.3 ONGOING EXPLORATION AND PROJECT DEVELOPMENT .....................124 20.4 INFORMATION REVIEW AND ASSESSMENT ..............................................124
20.4.1 Documentation reviewed .........................................................................124 20.4.2 Licenses, Permits and Approvals .............................................................125 20.4.3 Revised Environmental License and Minor Alterations ..........................126 20.4.4 Current Status / Mitigative Measures ......................................................129 20.4.5 Community Engagement .........................................................................131 20.4.6 Mine Closure ............................................................................................132
21.0 CAPITAL AND OPERATING COSTS ...........................................................................133 21.1 CAPITAL COSTS ................................................................................................133 21.2 OPERATING COSTS ..........................................................................................133

21.3 UNDERGROUND MINING COSTS ..................................................................134 21.4 PROCESSING COSTS .........................................................................................134 21.5 INDIRECT MINING COSTS ..............................................................................135 21.6 G&A COSTS ........................................................................................................135
22.0 ECONOMIC ANALYSIS ................................................................................................137 22.1 CASHFLOW MODEL INPUT PARAMETERS .................................................137
22.1.1 Production ................................................................................................137 22.1.2 Revenue....................................................................................................137 22.1.3 Royalties and Taxes .................................................................................137 22.1.4 Interest, Principal, and Other Payments ...................................................137
22.2 CAPITAL COSTS ................................................................................................137 22.3 OTHER PARAMETERS ......................................................................................137 22.4 ECONOMIC ANALYSIS RESULTS ..................................................................138
23.0 ADJACENT PROPERTIES .............................................................................................139 24.0 OTHER RELEVANT DATA AND INFORMATION ....................................................140 25.0 INTERPRETATIONS AND CONCLUSIONS ................................................................141 26.0 RECOMMENDATIONS ..................................................................................................142 27.0 REFERENCES .................................................................................................................143 28.0 CERTIFICATES ...............................................................................................................144
APPENDIX I. TRUE NORTH CLAIMS INFORMATION ................................................151 APPENDIX II. RESOURCE WIREFRAMES FOR V91, V710 AND V711 VEINS ...........158 APPENDIX III. CLASSIFICATION 3D MODELS AND CROSS SECTIONS FOR
V91, V710 AND V711 VEINS .....................................................................161 APPENDIX IV. AU GRADE MODELS AND CROSS SECTIONS FOR V91, V710
AND V711 VEINS .......................................................................................165 APPENDIX V. TAILINGS DRILL PLAN, CLASSIFICATION AND AU BLOCKS ...........169

LIST OF TABLES
Table 1.1 Underground Mineral Resource .............................................................................. 2 Table 1.2 Tailings Mineral Resource ...................................................................................... 3 Table 1.3 Underground Mineral Reserve ................................................................................ 4 Table 1.4 Tailings Mineral Reserve ........................................................................................ 5 Table 1.5 Sustaining Capital Costs .......................................................................................... 7 Table 1.6 Underground Ore Operating Cost Summary ........................................................... 7 Table 4.1 Summary of Mineral Property Holdings and Surface Areas ................................ 16 Table 6.1 Historic Production at Rice Lake Mine: 1927-1968 ............................................. 26 Table 6.2 Historic Production at Rice Lake Mine: 1980-2001 ............................................. 27 Table 6.3 Historic Production at Rice Lake Mine: 2007-2015 ............................................. 29 Table 6.4 Summary of Mineral Resource (Dec 31, 2012) .................................................... 30 Table 6.5 Summary of Mineral Resources (Dec 31, 2014) ................................................... 31 Table 10.1 Summary of Surface Exploration on the True North Gold Mine .......................... 46 Table 10.2 Summary of Tailings Drilling at True North Gold Mine ...................................... 48 Table 11.1 Certified Gold Assay Values for Commercial Standards ...................................... 53 Table 11.2 Certified Gold Assay Values for Commercial Standards ...................................... 57 Table 13.1 Harmony Gold – Rice Lake Deposit Metallurgical Results .................................. 67 Table 13.2 Hinge Zone Metallurgical Results ......................................................................... 67 Table 13.3 007 Zone Metallurgical Results ............................................................................ 68 Table 13.4 SGS Lakefield and Starkey Associates SAG Mill Testing Results ...................... 68 Table 13.5 JKTech Drop-weight Test Summary ..................................................................... 68 Table 13.6 MORE SGS Lakefield and Starkey & Associates SAG Mill Testing Results ...... 69 Table 13.7 Results Leaching Flotation Tails for 24 Hours at 2.5 gpl NaCN Concentration .. 70 Table 13.8 Results Leaching Flotation Tails for 24 Hours at 0.5 gpl NaCN Concentration .. 70 Table 13.9 Results from Leaching Samples from Tailings Storage Facility........................... 71 Table 14.1 True North Database Records ............................................................................... 74 Table 14.2 Bulk Density Statistics .......................................................................................... 75 Table 14.3 Modelled Veins ..................................................................................................... 77 Table 14.4 Summary Drillhole Assay Statistics ...................................................................... 79 Table 14.5 Summary Chip Assay Statistics ............................................................................ 80 Table 14.6 Summary Composite Statistics by Vein ................................................................ 81 Table 14.7 Composite Capping Levels ................................................................................... 83 Table 14.8 Total Underground Mineral Resources ................................................................. 84 Table 14.9 Underground Mineral Resource Estimate by Vein ............................................... 85 Table 14.10 Block Model Validation Grades ............................................................................ 86 Table 14.11 Volume Comparison ............................................................................................. 87 Table 14.12 Tailings Dry Bulk Density Results........................................................................ 89 Table 14.13 Summary Tailings Drillhole Assay Statistics........................................................ 90 Table 14.14 Summary Composite Statistics for Tailings Assays ............................................. 91 Table 14.15 Block Model Setup ................................................................................................ 92 Table 14.16 Tailings Mineral Resource .................................................................................... 93 Table 15.1 Total Project Mineral Reserve Estimate ................................................................ 97 Table 15.2 Operating and Revenue Parameters ...................................................................... 99 Table 15.3 Parameters Used to Assess Economic Viability of Underground Mineral
Reserve ................................................................................................................ 100 Table 15.4 Underground Mineral Reserve Estimate ............................................................. 100 Table 15.5 Underground Mineral Reserve BCOG Calculation Criteria ............................... 101 Table 15.6 2016 to 2018 Tailings Reserve BCOG Calculation Criteria ............................... 102 Table 15.7 2019 to 2023 Tailings Reserve BCOG Calculation Criteria ............................... 102 Table 15.8 Tailings Mineral Reserve Estimate
(1-6) ................................................................ 103
Table 16.1 Waste Rock Backfill and Stope Voids ................................................................ 112

Table 16.2 Underground Mining Schedule Summary ........................................................... 113 Table 16.3 Required Mining Equipment ............................................................................... 114 Table 16.4 Tailings Reprocessing Schedule.......................................................................... 115 Table 17.1 Process Plant Production Schedule ..................................................................... 117 Table 20.1 Obtained Licenses and Key Permits and Approvals ........................................... 125 Table 20.2 Potential Significant Environmental Impacts and Current Status /
Mitigative Measures ............................................................................................ 129 Table 21.1 Sustaining Capital Costs ...................................................................................... 133 Table 21.2 Underground Operating Cost Summary .............................................................. 134 Table 21.3 Mine Operating Cost ........................................................................................... 134 Table 21.4 Process Plant Operating Cost .............................................................................. 135 Table 21.5 Indirect Underground Mine Operating Cost ....................................................... 135 Table 21.6 G&A Cost (During UG Mining) ......................................................................... 135 Table 22.1 Financial Evaluation ............................................................................................ 138

LIST OF FIGURES
Figure 4.1 Location of the True North Gold Mine, Bissett, Manitoba ................................... 15 Figure 4.2 Regional Klondex Mining Claim and Lease Holdings ......................................... 17 Figure 5.1 Photograph of the True North Gold Mine Looking South .................................... 19 Figure 5.2 Plan View of Surface Infrastructure at the True North Gold Mine ....................... 20 Figure 5.3 Tailings Pond Facility at the True North Gold Mine ............................................ 21 Figure 7.1 Regional Geologic Map showing the Location of True North Gold Mine in
the Archean Uchi Subprovince, Manitoba ............................................................ 34 Figure 7.2 Geologic Map showing the Location of Gold Deposits and Lithotectonic
Assemblages in True North Gold Mine Area........................................................ 34 Figure 7.3 Local Geology of True North Gold Mine Area ..................................................... 36 Figure 7.4 The Structural Geological Setting of Gold Mineralization at True North Gold
Mine ...................................................................................................................... 37 Figure 7.5 Shear Zones and Quartz Veins .............................................................................. 38 Figure 7.6 Example of 16-Type Shear and 38-Type Breccia Gold Mineralized Quartz
Veins in the SAM Unit at True North ................................................................... 39 Figure 7.7 Controls on Gold Mineralization in the 007 Zone ................................................ 41 Figure 7.8 Interpreted Cross-Sections of 007 and L10 Zones Looking West ........................ 41 Figure 7.9 Level Plan of the 710 Zone showing the Location of the 710 and 711 Veins. ..... 42 Figure 8.1 Schematic Cross-Section Representation of the Geometry and Structural
Setting of Shear Zone Hosted Gold-Bearing Quartz Vein Networks in
Greenstone Belt Terrains like True North Gold Mine .......................................... 43 Figure 11.1 Flow Chart for Surface and Underground Core Sampling Methods ..................... 50 Figure 11.2 Assay Results of Standard CDN-GS-1P5C ........................................................... 54 Figure 11.3 Assay Results for Standard CDN-GS-6B.............................................................. 54 Figure 11.4 Assay Results for Standard CDN-GS-13A ........................................................... 55 Figure 11.5 Assay Results for Standard CDN-GS-22 .............................................................. 55 Figure 11.6 Assay Results for Blanks ....................................................................................... 56 Figure 11.7 Assay Results for Duplicates ................................................................................. 56 Figure 11.8 Assay Results for Chip Sample Duplicates ........................................................... 58 Figure 11.9 Tailings Assay Results for Standard GS-1P5C ..................................................... 59 Figure 11.10 Tailings Assay Results for Standard GS-1L ......................................................... 59 Figure 11.11 Tailings Assay Results for Blanks ........................................................................ 60 Figure 11.12 Tailings Assay Results for Duplicates .................................................................. 60 Figure 12.1 Due Diligence Sample Pulp Results for Gold ....................................................... 65 Figure 12.2 Due Diligence Sample Core Results for Gold ...................................................... 65 Figure 12.3 Due Diligence Tailings Sample Results for Gold ................................................. 66 Figure 14.1 Plan View of Modelled Veins ............................................................................... 75 Figure 14.2 3D View of Modelled Veins and Drilling ............................................................. 76 Figure 14.3 Nearest Pair Plot of Pit Samples ........................................................................... 89 Figure 14.4 Experimental Semi-Variogram ............................................................................. 91 Figure 14.5 Histogram and Probability Plots for Uncapped Tailings Composites ................... 92 Figure 14.6 Model and Composite Comparisons ..................................................................... 94 Figure 14.7 Comparison of Estimation Results ........................................................................ 95 Figure 14.8 Tailings Swath Plot ............................................................................................... 96 Figure 15.1 Reserve Block X-Section for Economic Viability Analysis (710/710A Veins) ... 97 Figure 15.2 Created Stope Shapes for Economic Viability Analysis ....................................... 98 Figure 16.1 Longitudinal Section ........................................................................................... 105 Figure 16.2 True North Gold Mine 710 Complex Ventilation System .................................. 107 Figure 16.3 Long-hole Open Stope Sill Development ........................................................... 108 Figure 16.4 Long-hole Open Stope Raise and Drilling .......................................................... 109 Figure 16.5 Long-hole Open Stope Blasting .......................................................................... 109

Figure 16.6 Long-hole Open Stope Backfilling ..................................................................... 110 Figure 16.7 Over-cut and Under-cut Plan View ..................................................................... 110 Figure 16.8 True North Gold Mine Typical Long-hole Drill Section .................................... 111 Figure 16.9 True North Gold Mine Sub-Level Captive Long-hole Stope .............................. 112 Figure 16.10 Tailings Recovery Flow Diagram ....................................................................... 115 Figure 16.11 Aerial View of Tailings Recovery Site ............................................................... 115 Figure 17.1 True North Gold Mine Process Plant Flow Sheet ............................................... 117 Figure 18.1 Surface Infrastructure Plan View ........................................................................ 118 Figure 20.1 True North Gold Mine Site Plan ......................................................................... 127 Figure 20.2 TMA Site Plan ..................................................................................................... 127 Figure 20.3 Aerial View of the Mine, Plant Site and TMA ................................................... 128 Figure 23.1 Adjacent Properties to the True North Gold Mine .............................................. 139

P&E Mining Consultants Inc., Report No. 315 Page 1 of 171
Klondex Canada Ltd. True North Gold Mine
1.0 SUMMARY
Klondex Canada Ltd. (“Klondex” or “the Company”), is a subsidiary of Klondex Mines Ltd.,
which is a Canadian and U.S. listed mining company. Klondex Mines Ltd. also owns and
operates additional high grade underground gold mines in north central Nevada. In January 2016,
Klondex acquired the Rice Lake Mine through its purchase from 7097914 Manitoba Ltd.
(formerly Shoreline Gold Inc.). Rice Lake Mine was previously owned by San Gold Corporation
(San Gold). In May 2016, Klondex renamed the Rice Lake Gold Mine to True North Gold Mine.
The mine and processing plant are located approximately 190 miles (250 km) northeast of the
city of Winnipeg on the edge of the Bissett township in Manitoba, Canada.
Klondex has engaged the services of Canadian based geology and mining engineering
consultants P&E Mining Consultants Inc. (P&E) to complete a National Instrument (NI) 43-101
Technical Report and Pre-Feasibility Study (Technical Report) for the True North Gold Mine
(“True North” or “Project”). The purpose of this Technical Report is to provide an independent
Mineral Resource and Mineral Reserve estimate of the gold mineralization in conformance with
the standards required by NI 43-101 and Form 43-101F1.
1.1 PROJECT HISTORY
Gold was originally discovered on the Project in 1911, however, it was not until the 1920s that
the construction of a shaft to a depth of 725 feet (221 metres) and approximately 2,000 feet (600
metres) of underground lateral development confirmed the presence of an economically viable
mineral resource.
Small scale production from underground mining commenced in 1932 and production increased
to about 500 tons per day (450 tonnes per day) in 1948. A fire destroyed some of the surface
facilities in 1968, and as a result production was suspended. Beginning in the late 1990s,
production was intermittent under various ownerships, until 2016 when Klondex acquired a
100% interest in True North.
1.2 GEOLOGIC SETTING AND MINERALIZATION
All the major gold occurrences in the True North area occur as quartz veins or quartz vein
systems formed during structural deformation of the host rocks. At the Project, gold
mineralization is controlled by quartz-carbonate veins and vein systems in brittle-ductile
structures with related hydrothermal alteration halos within or at the margin of particular host
rock units.
All of the gold mineralized zones at the Project are hosted in rocks of the Bidou Lake
Assemblage which forms a north-facing stratigraphic sequence of tholeiitic basalt to intermediate
volcanic flows, dacite crystal tuffs and breccias overlain by well stratified felsic epiclastic rock
interpreted to be of pyroclastic and sedimentary origin. The stratigraphic sequence is intruded by
tholeiitic gabbro sills and dykes and felsic porphyry dykes.
The best-known gabbro sill is the San Antonio Unit, host rock of the gold mineralization at the
True North deposit. The Bidou Lake Assemblage is unconformably overlain by feldspathic
sandstone of the San Antonio Assemblage.

P&E Mining Consultants Inc., Report No. 315 Page 2 of 171
Klondex Canada Ltd. True North Gold Mine
The gold mineralized veins show a high degree of structural control and are best developed in
competent mafic host rock ranging from intermediate to gabbroic in composition.
1.3 PROJECT STATUS
True North is accessible from Winnipeg via all-weather Provincial highways and is located
adjacent to the town of Bissett, a long established mining community with a fluctuating
population which is currently approximately 340 people.
Refurbishing existing underground openings as well as test stope mining is underway, as of the
effective date of this Technical Report. Process plant testing programs are progressing and a
historic tailings re-processing assessment project commenced in August 2016.
1.4 MINERAL RESOURCE ESTIMATES
P&E has produced an NI 43-101 compliant Mineral Resource estimate for True North based
primarily on information from exploration and definition drilling, underground chip sampling,
and supplemented in part by geophysical data, historical underground and surface mapping
which assisted with interpretations.
P&E developed block models constrained within 3D wireframe models of the principal
geological domains. Values for bulk density and gold (Au) ounces per ton (opt) were
interpolated into the grade model blocks using Inverse Distance Squared (ID2) weighting.
The underground Mineral Resource estimate is based on a gold cut-off grade of 0.09 opt (3.09
grams per tonne), which has been calculated from the following parameters:
Gold Price: US$ 1,400 per oz
Exchange Rate: C$ to US$: 0.80
Mining Cost: C$49.09 per ton
Process Cost: C$27.77 per ton
• Indirect Mine Cost: C$49.04 per ton
G&A Cost: C$15.62 per ton
Process Recovery: 94%
The underground Mineral Resource estimate for the Project is tabulated in Table 1.1.
TABLE 1.1
UNDERGROUND MINERAL RESOURCE(1-7)
Class Grade
Au opt
Grade
Au g/t
Tons
(k)
Au
(k) oz
Measured 0.232 7.95 455 106
Indicated 0.202 6.92 931 188
Measured & Indicated 0.212 7.26 1,386 294
Inferred 0.165 5.65 2,793 460 (1) Mineral Resource is inclusive of Mineral Reserve.
(2) Mineral resources which are not mineral reserves do not have demonstrated economic viability. The estimate
of mineral resources may be materially affected by environmental, permitting, legal, marketing, or other
relevant issues.
(3) Mineral Resource was estimated using the Canadian Institute of Mining, Metallurgy and Petroleum (CIM),
CIM Standards on Mineral Resources and Reserves, Definitions and Guidelines prepared by the CIM
Standing Committee on Reserve Definitions and adopted by CIM Council.

P&E Mining Consultants Inc., Report No. 315 Page 3 of 171
Klondex Canada Ltd. True North Gold Mine
(4) The quantity and grade of reported Inferred resources in this estimation are uncertain in nature and there
has been insufficient exploration to define these Inferred resources as an Indicated or Measured mineral
resource and it is uncertain if further exploration will result in upgrading them to an Indicated or Measured
mineral resource category.
(5) Contained metal may differ due to rounding.
(6) Cut-off grade = 0.09 opt Au (3.09 g/t).
(7) A bulk density of 0.086 tons per cubic foot was utilized in Resource tonnage calculations.
The tailings Mineral Resource estimate for the Project is based on information from auger
drilling. A block model constrained within a 3D wireframe model of the geological domain was
developed. Values for bulk density and Au/opt were interpolated into the grade model blocks
using Inverse Distance Squared weighting.
The tailings Mineral Resource estimate is based on a gold cut-off grade of 0.015 opt Au (0.51
grams per tonne), which has been calculated from the following parameters:
Gold Price: US$ 1,400 per oz
Exchange Rate: C$ to US$: 0.80
Process Cost: C$18.01 per ton
• G&A Cost: C$6.40 per ton
Process Recovery: 90%
The tailings Mineral Resource estimate for the project is tabulated in Table 1.2.
TABLE 1.2
TAILINGS MINERAL RESOURCE(1-7)
Class Grade
Au opt
Grade
Au g/t
Tons
(k)
Au
(k) oz
Indicated 0.024 0.82 2,138 51.0
Inferred 0.022 0.75 47 1.1 (1) Tailings Mineral Resource is inclusive of tailings Mineral Reserve.
(2) Mineral Resources which are not mineral reserves do not have demonstrated economic viability. The
estimate of mineral resources may be materially affected by environmental, permitting, legal, marketing, or
other relevant issues.
(3) Mineral Resource was estimated using the Canadian Institute of Mining, Metallurgy and Petroleum (CIM),
CIM Standards on Mineral Resources and Reserves, Definitions and Guidelines prepared by the CIM
Standing Committee on Reserve Definitions and adopted by CIM Council.
(4) The quantity and grade of reported Inferred Mineral Resources in this estimation are uncertain in nature and
there has been insufficient exploration to define these Inferred Mineral Resources as an Indicated or
Measured Mineral Resource and it is uncertain if further exploration will result in upgrading them to an
Indicated or Measured Mineral Resource category.
(5) Contained metal may differ due to rounding.
(6) Cut-off grade = 0.015 opt Au (0.51 g/t Au).
(7) A dry bulk density of 0.044 tons per cubic foot (pcf) was utilized in the tailings Mineral Resource estimate
tonnage calculation.
1.5 MINERAL RESERVE ESTIMATES
P&E have produced a NI-43-101 compliant Mineral Reserve estimate for True North based on
the resource block model, achievable mining shapes, mining recovery, mining dilution and stope
pre-production development cost considerations.
The underground Mineral Reserve estimate is based on a gold cut-off grade of 0.13 opt (4.46
grams per tonne) which has been calculated from the following parameters:

P&E Mining Consultants Inc., Report No. 315 Page 4 of 171
Klondex Canada Ltd. True North Gold Mine
Gold Price: US$ 1,200 per oz
Exchange Rate: C$ to US$: 0.80
Mining Cost C$49.09 per ton
Process Cost: C$27.77 per ton
• Indirect Mine Cost: C$49.04 per ton
G&A Cost: C$15.62 per ton
Sustaining Development Cost: C$42.49 per ton
Recovery: 94%
The underground Mineral Reserve estimate for the Project is tabulated in Table 1.3.
TABLE 1.3
UNDERGROUND MINERAL RESERVE(1-6)
Class Grade
Au opt
Grade
Au g/t
Tons
(k)
Au
(k) oz
Proven 0.241 8.26 153 36.8
Probable 0.245 8.40 199 48.7
Proven & Probable 0.243 8.33 352 85.5 (1) Mineral Resource is inclusive of Mineral Reserve shapes, mining recovery, mining dilution and stope pre-
production development costs. Mineral Reserve estimate includes dilution and is constrained to a minimum
mining width of 5 feet.
(2) Mineral Reserve was estimated using the Canadian Institute of Mining, Metallurgy and Petroleum (CIM),
CIM Standards on Mineral Resources and Reserves, Definitions and Guidelines prepared by the CIM
Standing Committee on Reserve Definitions and adopted by CIM Council.
(3) Mining losses of 2% have been applied to the designed mine excavations and no additional unplanned
dilution has been included.
(4) Contained metal may differ due to rounding.
(5) Cut-off grade = 0.13 opt Au (4.46 g/t Au).
(6) A bulk density of 0.086 tons pcf was utilized in Mineral Reserve tonnage calculations.
The tailings Mineral Reserve estimate for the Project is based on the resource block model,
achievable recovery shape, mining recovery, reprocessing cost considerations and availability of
process plant capacity in conjunction with underground ore mining.
The tailings Mineral Reserve estimate is based on a gold cut-off grades of 0.026 opt Au (0.89 g/t
Au) for 2016 to 2018 and 0.020 opt Au (0.69 g/t Au) for 2019 to 2023 which has been
calculated from the following parameters:
2016-2018 At 600tpd
Gold Price: US$ 1,200 per oz
Exchange Rate: C$ to US$: 0.80
Process Cost: C$25.06 per ton
Sustaining Capital Cost C$6.39 per ton
G&A Cost: C$3.15 per ton
Recovery: 90%
Cut-off 0.026 opt Au (0.89 g/t Au)
P&E Mining Consultants Inc., Report No. 315 Page 5 of 171
Klondex Canada Ltd. True North Gold Mine
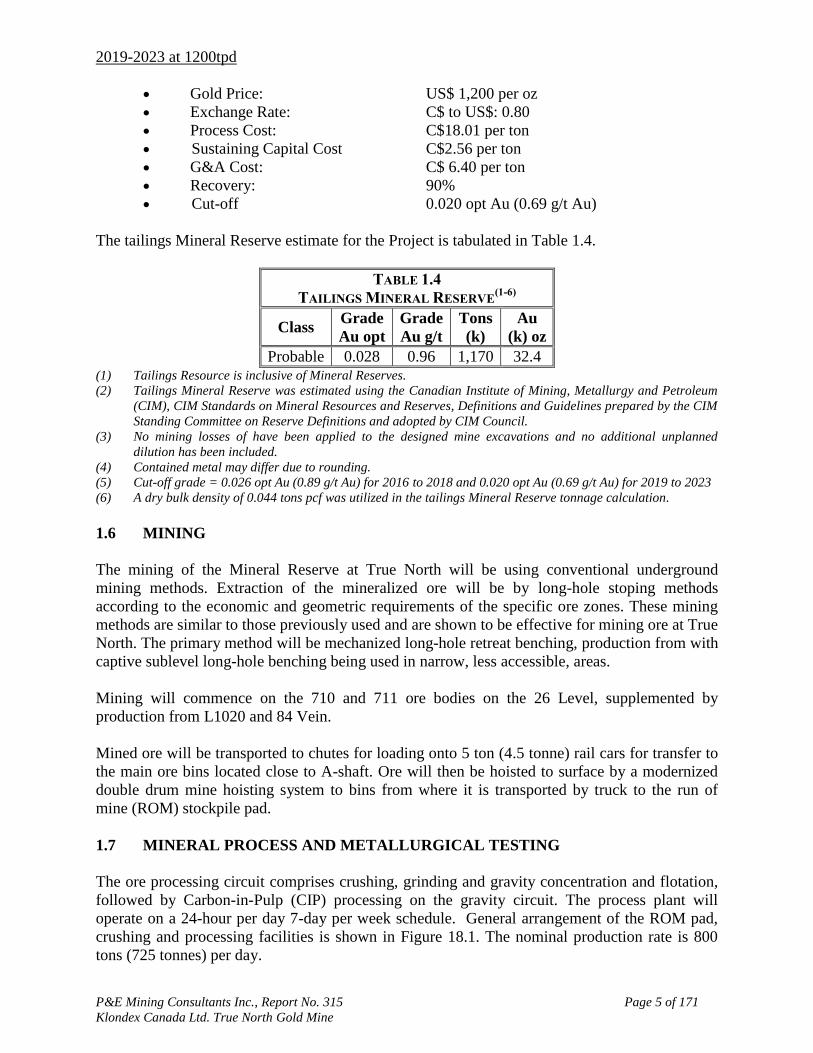
2019-2023 at 1200tpd
Gold Price: US$ 1,200 per oz
Exchange Rate: C$ to US$: 0.80
Process Cost: C$18.01 per ton
Sustaining Capital Cost C$2.56 per ton
G&A Cost: C$ 6.40 per ton
Recovery: 90%
Cut-off 0.020 opt Au (0.69 g/t Au)
The tailings Mineral Reserve estimate for the Project is tabulated in Table 1.4.
TABLE 1.4
TAILINGS MINERAL RESERVE(1-6)
Class Grade
Au opt
Grade
Au g/t
Tons
(k)
Au
(k) oz
Probable 0.028 0.96 1,170 32.4 (1) Tailings Resource is inclusive of Mineral Reserves.
(2) Tailings Mineral Reserve was estimated using the Canadian Institute of Mining, Metallurgy and Petroleum
(CIM), CIM Standards on Mineral Resources and Reserves, Definitions and Guidelines prepared by the CIM
Standing Committee on Reserve Definitions and adopted by CIM Council.
(3) No mining losses of have been applied to the designed mine excavations and no additional unplanned
dilution has been included.
(4) Contained metal may differ due to rounding.
(5) Cut-off grade = 0.026 opt Au (0.89 g/t Au) for 2016 to 2018 and 0.020 opt Au (0.69 g/t Au) for 2019 to 2023
(6) A dry bulk density of 0.044 tons pcf was utilized in the tailings Mineral Reserve tonnage calculation.
1.6 MINING
The mining of the Mineral Reserve at True North will be using conventional underground
mining methods. Extraction of the mineralized ore will be by long-hole stoping methods
according to the economic and geometric requirements of the specific ore zones. These mining
methods are similar to those previously used and are shown to be effective for mining ore at True
North. The primary method will be mechanized long-hole retreat benching, production from with
captive sublevel long-hole benching being used in narrow, less accessible, areas.
Mining will commence on the 710 and 711 ore bodies on the 26 Level, supplemented by
production from L1020 and 84 Vein.
Mined ore will be transported to chutes for loading onto 5 ton (4.5 tonne) rail cars for transfer to
the main ore bins located close to A-shaft. Ore will then be hoisted to surface by a modernized
double drum mine hoisting system to bins from where it is transported by truck to the run of
mine (ROM) stockpile pad.
1.7 MINERAL PROCESS AND METALLURGICAL TESTING
The ore processing circuit comprises crushing, grinding and gravity concentration and flotation,
followed by Carbon-in-Pulp (CIP) processing on the gravity circuit. The process plant will
operate on a 24-hour per day 7-day per week schedule. General arrangement of the ROM pad,
crushing and processing facilities is shown in Figure 18.1. The nominal production rate is 800
tons (725 tonnes) per day.

P&E Mining Consultants Inc., Report No. 315 Page 6 of 171
Klondex Canada Ltd. True North Gold Mine
Under the previous San Gold operations the process plant recovery was 93.5% on an ore feed
grade of 0.21 opt Au. Process recovery is grade dependent, and test work on the anticipated
higher ore feed grades, recoveries will be as high as 96.5%. The economic evaluation presented
in this Technical Report is based on a more conservative gold process recovery rate of 94%.
Past and current processing analyses have shown no evidence of any deleterious elements such
as arsenic, mercury, or antimony that would otherwise affect gold recovery in the leach circuit,
however, copper in the leach circuit solution may occasionally be high.
1.8 TAILINGS REPROCESSING
Under the previous ownership a percentage of the coarse grained free gold was lost to tailings.
Trial processing of the reslurried tailings has demonstrated that reprocessing of the existing
historic tailings can recover approximately 89% of the contained gold.
P&E have produced a Mineral Resource estimate on the tailings and the Company plans to
supplement the mine feed with historic tailings. The tailings reprocessing operation will be
carried out concurrently with the underground mining operation until 2018 and will continue for
an additional 5 years until 2013 on a stand-alone basis.
1.9 ENVIRONMENTAL AND PERMITTING
Klondex has revised the existing Environmental Act Licence 2628RR (Licence) for True North
which includes approvals for minor alternations needed for operation. The San Gold Mine
Closure Plan (2012) (Closure Plan) and the pledged fixed-asset financial security for mine
closure were transferred to Klondex in January.
Klondex collects all required environmental monitoring data including: water quality sampling,
environmental effects monitoring, final effluent release reporting, and is developing procedures
for its environmental management system. Klondex is also in the process of re-initiating First
Nations and Aboriginal community engagement.
Based on the available information, P&E is of the opinion that there does not appear to be any
significant environmental and/or social barriers to the True North operation.
1.10 OPERATING AND CAPITAL COST ESTIMATES
The capital cost estimate for True North was developed by Klondex, and includes all future
sustaining capital expenditures to be incurred over the remainder of True North mine life. There
are no significant pre-production capital requirements, since the Project will be utilizing existing
infrastructure. Sustaining capital costs are scheduled over the life-of-mine (LOM).
The total capital cost for the life-of-mine is summarized in Table 1.5 and totals approximately
$32.1 million over the next several years.

P&E Mining Consultants Inc., Report No. 315 Page 7 of 171
Klondex Canada Ltd. True North Gold Mine
TABLE 1.5
SUSTAINING CAPITAL COSTS
Description (000's of dollars)
Q4 - 2016 2017 2018 2019-2023 Total
Ramp Development 2,493 6,798 4,079 13,370
Capital Development 553 3,952 2,253 6,758
Capital Drilling 231 1,649 940 2,820
Mobile Fleet 90 641 365 1,096
Site Infrastructure & Processing Plant 297 2,119 1,208 3,624
Underground Services 53 382 217 652
Tailings Reprocessing 0 511 735 2,500 3,746
Total 3,717 16,052 9,797 2,500 32,066
Sustaining capital for the five years following mine closure when tailings reprocessing will be
continuing in isolation will be approximately $400,000 per year. In addition, an allowance for
winterization of the processing plant and reopening in the spring has been included at $100,000
per year.
In addition, the cost of mine closure and remediation is estimated to be $4.4 million (per the
existing accepted Closure Plan).
These estimates have an accuracy of ±15% with a base date as of the effective date of this
Technical Report.
The operating costs of True North encompass all labour, supervision, and operating consumables
required for production, support, and equipment maintenance activities.
The average operating cost estimate for the True North operation over the LOM is summarized
in Table 1.6 which is calculated based on the cost per ton of ore mined and processed at the
Project.
TABLE 1.6
UNDERGROUND ORE OPERATING COST SUMMARY
Description $/ton
Mining 49.09
Processing 27.77
Indirect Mine 49.04
G&A 15.62
Total 141.52
The average total operating cost for the Tailings Reserve tonnage during underground mining is
$25.06 per ton, which includes the extraction and delivery of the tailings to the processing
facility. Sustaining capital costs are included in the capital cost summary.
In 2019, the mining operation will be finished, however, the processing plant will continue to
process historic tailings at a rate of 195,000 per annum, as a seasonal operation from May to
October. During this period following the closure of the underground mining operation, historic

P&E Mining Consultants Inc., Report No. 315 Page 8 of 171
Klondex Canada Ltd. True North Gold Mine
tailings processing costs will average $18.01 per ton. G&A costs will average approximately
$6.40 per ton due to the reduced site requirements and the higher historic tailings processing rate
of 1,200 tons (1,089 tonnes) per day.
1.11 PROJECT ECONOMICS
The results of the Project’s economic analysis based on mining the identified underground and
tailings Mineral Reserve, indicate a positive net present value (NPV) of $26.3 million (after tax)
at a discount rate of 7%, as shown in Table 22.1. Since True North does not include any pre-
production cost, the Internal Rate of Return (IRR) and payback period are not pertinent to this
analysis.
Taxes are included in the operating cash flow analysis. The analysis conclusively shows that for
the purpose of the NI-43-101 assessment, True North will be profitable.
This economic analysis carried out was based on the following parameters:
Mine production schedule commencing the fourth quarter of 2016 and continuing
through to 2018;
Reprocessing of historic tailings during mine operation and continuing for 5 years
(2019-2023) following mine closure;
An underground Mineral Reserve tonnage of 352,000 tons containing 85,500 oz
Au (0.243 opt);
Waste dilution of 15.6% was included in the underground Mineral Reserve
tonnage;
A tailings Mineral Reserve of 1.17 million tons containing 32,400 oz Au (0.028
opt Au) (0.96 g/t Au);
Process plant gold recovery of 94% for underground ore and 90% for tailings; and
A fixed gold price of $US 1,200/oz.
1.12 RECOMMENDATIONS AND CONCLUSIONS
This Technical Report, as prepared by P&E, describes a viable mining and processing operation
at the True North Gold Mine.
As of the effective date of this Technical Report, True North hosts an underground Mineral
Reserve of 352,000 tons (319,000 tonnes) at average grade of 0.243 opt Au (8.33 g/t) at a 0.13
opt Au (4.46 g/t Au) cut-off grade. In addition, the historic tailings re-processing project contains
1.17 million tons (1.06 million tonnes) of recoverable tailings Mineral Reserves at an average
grade of 0.028 opt Au (0.96 g/t Au) at a cut-off grade of 0.026 opt Au (0.89 g/t Au) for 2016 to
2018 and 0.018 opt Au (0.62 g/t Au) for 2019 to 2023.
Economically, True North appears to be robust, and the risks are low given the Project is an
operating mine with significant production history. Capital expenditures for construction will
not be required and True North components will require only limited refurbishment.
Based on a cash flow model using estimated cost of production and revenues, True North will
generate an undiscounted pre-tax net cash flow of $48.8 million over the LOM. At a discount
rate of 7%, this corresponds to an NPV of $26.3 million on an after tax basis.
Technically, True North presents no fatal flaws.

P&E Mining Consultants Inc., Report No. 315 Page 9 of 171
Klondex Canada Ltd. True North Gold Mine
P&E recommends that True North continue its current production plan with long-hole mining of
the underground Mineral Reserve and the reprocessing of the historic tailings. Klondex has
advised that they will be spending additional capital on near mine exploration and further
resource/reserve definition in order to expand the current LOM. A summary of the
interpretations, conclusions, and recommendations to advance True North are provided in
Sections 25 and 26 of this Technical Report.

P&E Mining Consultants Inc., Report No. 315 Page 10 of 171
Klondex Canada Ltd. True North Gold Mine
2.0 INTRODUCTION AND TERMS OF REFERENCE
2.1 TERMS OF REFERENCE
At the request of Mr. Brian W. Morris, CPG, Vice President Exploration of Klondex Mines Ltd.
P&E has prepared this National Instrument 43-101 (NI 43-101) technical report for the True
North Gold Mine and processing facility.
Klondex Canada Ltd. is the Canadian-based subsidiary of TSX listed Klondex Mines Ltd, a gold
mining company that owns and operates three gold and silver mines in north central Nevada.
True North is an existing underground gold mining operation, acquired by Klondex in January
2016, located approximately 250 kilometres northeast of Winnipeg on the edge of the town of
Bissett, Manitoba, Canada.
The purpose of this Technical Report is to deliver Mineral Resource and Mineral Reserve
estimates for the underground gold mining and tailings reprocessing operations at True North.
The corporate address of Klondex Mines Ltd. is:
1055 West Hastings Street, Suite 2200
Vancouver, BC
V6E 2E9
The effective date for this Mineral Reserve and Mineral Resource estimate Technical Report is
June 30, 2016.
Eugene Puritch, P.Eng., William Stone, P.Geo., Alfred Hayden, P.Eng. and Alexandru
Veresezan, P.Eng., all of P&E and Qualified Persons (QP) under the terms specified under of NI
43-101. Each of the aforesaid has conducted site visits to the Project during May, June, July, and
September, 2016.
In addition to visits to the Project, P&E carried out a study of relevant parts of the available
literature on documented results concerning the Project, and held discussions with technical
personnel from the Company regarding other pertinent aspects of True North. For additional
information, the reader can refer to these data sources which are outlined in Section 27.0,
“References” of this Technical Report, for further details on True North.
The purpose of the Technical Report is to provide independent Mineral Resource and Mineral
Reserve estimates of the gold mineralization present at the Project, in conformance with the
standards required by NI 43-101 and Form 43-101F1.
The authors of this Technical Report (“the Authors”) are listed in Section 28.
2.2 SOURCES OF INFORMATION
This report is based in part on internal Company technical reports and maps, published
government technical reports, published scientific papers, company letters and memoranda, and
public information listed in Section 27.0 “References” at the conclusion of this Technical Report.

P&E Mining Consultants Inc., Report No. 315 Page 11 of 171
Klondex Canada Ltd. True North Gold Mine
Sections from reports authored by other consultants have been directly quoted or summarized in
this Technical Report and are indicated as such within the appropriate sections. P&E held
discussions with technical personnel from the Company regarding pertinent aspects of the
Project. P&E has not conducted detailed land status evaluations, and has relied on previous
qualified reports, public documents and statements by Klondex management and legal counsel,
regarding the status and legal title to True North.
This Technical Report is prepared in accordance with the requirements of NI 43-101 and in
compliance with Form NI 43-101 F1 the Canadian Securities Administrators (CSA).
The estimates of Mineral Resource and Mineral Reserve contained in the Technical Report are
prepared in conformity to the CIM Mineral Resource and Mineral Reserve definitions referenced
in the National Instrument 43-101 Standards of Disclosure for Mineral Projects that are in force
as of the effective date of this Technical Report.
2.3 UNITS AND CURRENCY
Unless otherwise stated all units used in this report are imperial. Gold assay values are reported
in ounces per short ton (opt Au) unless grams per tonne (g/t Au) are specifically stated. The
Canadian dollars ($ or C$) is used throughout this report unless the United States Dollars (US$)
is specifically stated. The US$:C$ currency exchange rate utilized in this report is 0.8:1.
The following list shows the meaning of the abbreviations for technical terms used throughout
the text of this Technical Report.
Abbreviation Meaning
ID3 Inverse distance cubed method
3D Three dimensional
AA Atomic absorption
Ag Silver
ANFO Ammonium nitrate/fuel oil
AOI Area of interest
ARD Acid rock drainage
ASL Above sea level
Au Gold
Au g/t Grams of gold per tonne
C$ Canadian dollars
CEAA Canadian Environmental Assessment Agency
CIM Canadian Institute of Mining, Metallurgy And Petroleum
cm Centimetre(s)
CSA Canadian Securities Administrators
Cum Cumulative
DCF Discounted cash flow
DDH Diamond drillhole
DMT Dry metric tonne
E East
EIA Environmental Impact Assessment

P&E Mining Consultants Inc., Report No. 315 Page 12 of 171
Klondex Canada Ltd. True North Gold Mine
FAR Fresh Air Raises
g or gm Gram
G&A General and Administration
g/t or gm/t Grams per metric tonne
ha Hectare(s)
IP Induced polarization
IRR Internal rate of return
ISO International Organization for Standardization
k Thousands
kg Kilogram
kg/t Kilograms per metric tonne
Klondex Klondex Mines Ltd.
km Kilometre(s)
km/h Kilometres per hour
kt Thousands of tonnes
LiDAR Light Detection and Ranging
LOM Life-of-mine
M Million
m Metre(s)
M$ Millions of dollars
m3 Cubic metres
Ma Millions of Years
masl Metres above sea level
meas. Measured Resources
mm Millimetres
Mt Millions of tonnes
N North
N/A Not applicable
NAG Non-potentially acid generating rock
NE North-East
NI 43-101 National Instrument 43-101
NN Nearest neighbour method
NPV Net Present Value
NSR Net Smelter Return
opt Troy ounces of gold per short ton
No significant values
OSC Ontario Securities Commission
oz Troy ounce
oz/T Au Troy ounces of gold per short ton
P&E P&E Mining Consultants Inc.
PAG Potentially acid generating rock
Q4 Fourth Quarter
QA/QC Quality Assurance/Quality Control
QP Qualified Person as defined by NI 43-101

P&E Mining Consultants Inc., Report No. 315 Page 13 of 171
Klondex Canada Ltd. True North Gold Mine
RAR Return air raises
ROM Run-Of-Mine: Material produced during mining
S South
SEDAR
Website Developed by the CRA, that provides access to public securities
documents and information filed by public Companies and investment
funds in Canada
t Metric tonne(s)
t/m3 Metric tonnes per cubic metre
tpd Tonnes per Day
tph Tonnes per Hour
TSF Tailings Storage Facility
US$ United States dollars
WMT Wet metric tonne
P&E Mining Consultants Inc., Report No. 315 Page 14 of 171
Klondex Canada Ltd. True North Gold Mine
3.0 RELIANCE ON OTHER EXPERTS
Statements in this Technical Report and Pre-Feasibility Study with regard to the status and legal
title of the Project, are reliant on information provided by Klondex legal counsel.
The status of the Klondex environmental program and the permitting process was provided by
the Environmental Superintendent for the Project. The corporate Manager of Metallurgy,
provided information regarding metallurgical testing and process operating statistics. These
contributions have been reviewed, edited and accepted by the Authors of this report and are
accurate portrayals of True North, as of the effective date of this Technical Report.
Operating and capital cost projections related to the production and sale of doré gold have been
provided by Klondex. This information has been reviewed and accepted by the Authors as being
reasonable, as of the effective date of this Technical Report.
Estimates of the taxation rates that will be payable on production from the Project, were provided
by D. Scott Farmer, Mining Tax Plan LLC
P&E has assumed, and relied on information and technical documents listed in the References
section of this Technical Report as being accurate and complete in all material aspects. While
P&E carefully reviewed the available information provided, P&E cannot guarantee its accuracy
and completeness.
P&E reserves the right, but will not be obligated, to revise this Technical Report and the
conclusions if additional information becomes known to P&E subsequent to the date of this
Technical Report.
A draft copy of this Technical Report has been reviewed for factual errors by Klondex, and the
Authors have relied on Klondex’s historical and current knowledge of True North in this regard.
Any statements and opinions expressed in this document are given in good faith and in the belief
that such statements and opinions are not false and misleading as of the effective date of this
Technical Report.

P&E Mining Consultants Inc., Report No. 315 Page 15 of 171
Klondex Canada Ltd. True North Gold Mine
4.0 PROPERTY DESCRIPTION AND LOCATION
4.1 PROPERTY LOCATION
The Project is located adjacent to the township of Bissett on the north shore of Rice Lake in
southeastern Manitoba, 190 miles (235 km) northeast of the city of Winnipeg (Figure 4.1). The
Project includes the mine, mill, and tailings management area. Klondex’s property holdings in
Manitoba, Canada include a larger regional exploration boundary as outlined in Figure 4.2 of this
Technical Report.
Bissett can be accessed from Winnipeg via all-weather provincial highways. A small emergency
gravel airstrip is located 12 miles (19 km) east of Bissett. Rice Lake serves as a base for float-
equipped aircraft during the ice free months.
Geographical co-ordinates are:
latitude 51o 01’ 19.6” N longitude 95
o 40’ 44.9” W
UTM WGS84 Zone 15U 312,110 m E 5,655,700 m N
Figure 4.1 Location of the True North Gold Mine, Bissett, Manitoba

P&E Mining Consultants Inc., Report No. 315 Page 16 of 171
Klondex Canada Ltd. True North Gold Mine
The locations of all mineralized zones, mineral resources, mineral reserves, mine workings,
tailings management area (TMA), and waste deposits are shown on various figures in other
sections of this Technical Report.
The boundaries of the mining lease (ML-063) and of the patented mining claims have been
surveyed, whereas the boundaries of other, un-surveyed mining claims, are sourced from
government claim maps.
4.2 PROPERTY DESCRIPTION
The Project consists of claims, patents and a mineral lease owned 100% by the Company (Figure
4.2). The total area covered by the Project is 40,257 ha (Table 4.1).
TABLE 4.1
SUMMARY OF MINERAL PROPERTY HOLDINGS AND SURFACE AREAS
Item Claims/Patents/Leases Hectares
Unpatented Mining Claims 300 39,195
Patented Mining Claims 18 296
Mineral Lease 1 766
Total 319 40,257
Klondex retains a 100% recorded interest in mineral lease ML-063 (“ML-063”). This lease
covers 766 hectares (ha) and, subject to annual payments, expires April 1, 2034.
In addition to ML-063, Klondex also holds 18 Patented Mining Claims covering an area of 296
ha and 300 Mining Claims covering an area of 39,195 ha. The Company owns 100% of 273 of
the Mining Claims.
Klondex owns 50% of the remaining 27 Mining Claims through a Joint Venture Agreement with
Greenbelt Gold Mines Inc. (see Appendix I for full listing of claims information).
4.3 LIABILITIES AND PERMITS
All environmental liabilities are disclosed in Section 20, which covers the mine closure plan. All
permits required to perform work are also disclosed in Section 20.

P&E Mining Consultants Inc., Report No. 315 Page 17 of 171
Klondex Canada Ltd. True North Gold Mine
Figure 4.2 Regional Klondex Mining Claim and Lease Holdings

P&E Mining Consultants Inc., Report No. 315 Page 18 of 171
Klondex Canada Ltd. True North Gold Mine
5.0 ACCESSIBILITY, CLIMATE, LOCAL RESOURCES, INFRASTRUCTURE AND
PHYSIOGRAPHY
5.1 ACCESSIBILITY
Bissett can be accessed from Winnipeg via all-weather provincial highways. A small emergency
gravel airstrip is located 12 miles (19 km) east of Bissett. Rice Lake itself serves as a base for
float-equipped aircraft during the ice free months.
5.2 CLIMATE AND PHYSIOGRAPHY
Average relief in the Project area is approximately 130 feet to 200 feet (40m to 60m), with
elongated outcrop ridges separated by low lying ground with swamps, rivers and lakes.
This area of eastern Manitoba has average annual precipitation of approximately 17 inches (430
mm) of rain. Winter snow accumulations of up to 57 inches (145 cm) occur between October and
March. Average winter temperature is 3oF (-16°C) with extended periods of -4
oF to -13
oF (-20°C
to -25oC). Average summer temperature is 61
oF (16°C).
The vegetation consists of typical Canadian Shield boreal forest. Poplar, balsam, spruce, and
pine are the main tree species. Rock outcrop exposure is abundant in most areas, although there
is a thin cover of organics and lichen growth that can restrict detailed observation.
5.3 LOCAL RESOURCES AND INFRASTRUCTURE
Bissett is an established mining community, located adjacent to the mine, with a fluctuating
population of approximately 340 people. The township was established to service the emerging
mines that developed after 1911, but has remained home to permanent residents during periods
of mine closure and now provides a healthy recreational sport base as well as servicing the
Project.
Mining supplies, equipment, and services and a skilled mining and mineral exploration
workforce are readily available in southern Manitoba and across the border to the established
mining communities in northeast Ontario. The Project has a long history of mining, which helps
to attract employees and contractors from throughout the area.
Manitoba Hydro provides electrical power to site via twin transmission lines. Fuel is trucked in
from Winnipeg and the area is well serviced by access roads.
Klondex owns 100% of the mine shaft, declines, mobile and crushing equipment, mineral
processing mill, TMA, and storage areas (Figures 5.1, 5.2 and 5.3).
The process plant is licensed to operate at up to 2,500 tons (2,268 tonnes) per day. The Company
has sufficient accommodation on-site for all personnel and provides cafeteria services for
employees housed in the Project’s bunkhouse accommodation.
A small school provides education up to grade six. A bar, hotel, restaurant, and convenience
store provide services for residents and visitors to the town. The township has recreational
infrastructure such as a curling rink, outdoor ice skating rink and a baseball diamond.

P&E Mining Consultants Inc., Report No. 315 Page 19 of 171
Klondex Canada Ltd. True North Gold Mine
Figure 5.1 Photograph of the True North Gold Mine Looking South

P&E Mining Consultants Inc., Report No. 315 Page 20 of 171
Klondex Canada Ltd. True North Gold Mine
Figure 5.2 Plan View of Surface Infrastructure at the True North Gold Mine

P&E Mining Consultants Inc., Report No. 315 Page 21 of 171
Klondex Canada Ltd. True North Gold Mine
Figure 5.3 Tailings Pond Facility at the True North Gold Mine

P&E Mining Consultants Inc., Report No. 315 Page 22 of 171
Klondex Canada Ltd. True North Gold Mine
6.0 HISTORY
For the historic estimates in this section of the Technical Report, Qualified Persons from
either P&E or Klondex have not done sufficient work to classify the historical estimates as
a current Mineral Resource or Mineral Reserve, and P&E and Klondex are not treating
these historical estimates as current Mineral Resources or Mineral Reserves. The
historical estimates cannot be fully verified. These values cannot and should not be relied
upon and are only referred to herein as an indication of previously defined gold
mineralization. The relevance of the historical estimates is not known. Key assumptions,
parameters and methods used to estimate these Mineral Resources and Mineral Reserves
are not known. The historical Mineral Resource and Mineral Reserve estimates described
in this Technical Report section have been superseded by the Mineral Resource and
Mineral Reserve estimates described herein (see Section 14 and 15 of this Technical
report).
6.1 PRE 1989 ERA
Gold was originally discovered at the shore of Rice Lake in 1911. The first attempt at
underground development was undertaken by a syndicate in 1927, when No.1 exploration shaft
was sunk to 164 feet (50 m) and No.2 Shaft was sunk to 300 feet. (91 m). Approximately 2,000
feet (610 m) of lateral development was completed in 1927, but results failed to meet
expectations. Nevertheless, during 1928 the syndicate proceeded to deepen the No.2 Shaft to 600
feet (183 m) and the No. 1 Vein was discovered on that level. However, it was not until 1929,
with discovery of the No. 9 Vein on the 725-foot (221 m) level, that the deposits became
economically viable.
Sufficiently encouraging underground results were obtained by 1931, and the newly formed San
Antonio Gold Mines Ltd. (“San Antonio”) commenced construction of a process plant and power
line. Production began in May 1932 at a rate of 150 tons (136 tonnes) per day, increasing to 350
tons (318 tonnes) per day in 1935, and subsequently increased to 550 tons (500 tonnes) per day
by 1948. Access to the mine was primarily through the No.1 Shaft (now called the A-Shaft) and
three internal winzes; 3A, 3B, and 3C (now called B-Shaft, C-Shaft, and D-Shaft).
Underground development was carried out by driving footwall drifts on each level. Flat
exploration drill-holes on 50-foot (15 m) centres were used to establish the location of veins on
the level prior to establishing drifts along the full length of ore zones. Shrinkage mining was
used utilized with a minimum mining width of 4 feet (1.2 m).
The 550-ton (500-tonne) per day process plant consisted of a crushing plant adjacent to the collar
of No.1 Shaft with a conveyor to the process plant building. After grinding, concentrating, and
blanket tables, an amalgam table recovered approximately 12% of the total gold. Then the
material from the gravity circuit passed through a Merrill Crowe cyanide plant to recover the
balance of the gold.
The No.1 Shaft surface hoist was destroyed by fire in July 1968 and production ceased. San
Antonio declared bankruptcy and the assets were acquired by New Forty Four Mines (“New
Forty Four”). In 1980, the process plant was destroyed by fire.
In 1980, Brinco Mining Limited (“Brinco”) entered into a Joint Venture with New Forty Four.
Brinco undertook a program of underground exploration drilling during the period 1980 through
1983 and approximately 100,000 ore tons (91,000 tonnes) were mined and trucked to Hudson

P&E Mining Consultants Inc., Report No. 315 Page 23 of 171
Klondex Canada Ltd. True North Gold Mine
Bay Mining & Smelting Co Ltd. in Flin Flon, Manitoba, for processing. Brinco earned a 100%
interest in the project, however, after 1983 did no significant work.
In 1987, a subsidiary of Inco Ltd. (“Inco”) entered into an agreement with Brinco and completed
over 20,000 feet. (6,096m) of drilling. Inco opted out of the venture in 1988.
6.2 POST 1989 ERA
In 1989, Rea Gold Corp. (“Rea Gold”) acquired the Property from Brinco. Wright Engineers and
Dolmage Campbell completed a due diligence study for Rea Gold prior to their acquisition of the
Project in 1989. At that time, the historic (non NI 43-101 compliant) Mineral Reserve was
estimated to be 1,226,000 tons (1,114,000 tonnes) grading 0.22 opt Au (7.5 g/t Au). A Pre-
Feasibility study by Kilborn Engineering Ltd. (Kilborn) in 1993 recommended that the resource
base be increased prior to a production decision.
In 1994, Rea Gold undertook a $3.1 million underground rehabilitation and exploration program
to gain access to the lower levels of the mine and delineate additional Mineral Resources. This
program resulted in an increase in the historic (non NI 43-101 compliant) Mineral Reserves to
1,977,000 tons (1,797,000 tonnes) grading 0.21 opt Au (7.2 g/t Au).
A Feasibility Study was completed by Rea Gold and Simmons Engineering Inc. in 1995, and
construction and development of a 1,000 ton (907 tonne) per day mining operation was initiated.
Rea Gold established a new mine access system that significantly streamlined the mining
operation. Previously, the mine was accessed by A-Shaft and three internal winzes (B-Shaft, C-
Shaft, and D-Shaft). Ore from the D-Shaft area had to be trammed and hoisted via four shafts in
order to transport it to surface. Rea Gold deepened the principal A-Shaft to link the surface
directly with the upper level of the D-Shaft area, thereby eliminating two cycles of tramming and
hoisting.
By 1997, Rea Gold had established a modern 1,000 ton (907 tonne) per day gold mining and
processing facility at a total cost of approximately $90 million. Prior to the start of production,
Rea Gold was placed into receivership and the receiver put the assets up for sale. Harmony Gold
(Canada) Inc. (“Harmony”) was the successful bidder and took over the project in 1998.
After acquiring the assets from the receiver, Harmony invested approximately $30 million to
build a ramp system in the lower part of the D-Shaft area, in order to establish a long-hole
mining operation. Harmony operated the mine for three years, and subsequently put the project
on care and maintenance in August, 2001. Compared to the previously employed shrinkage
mining operation, the Harmony operation produced fewer ounces of gold from more tons
processed per day and failed to achieve the corporate objectives set by Harmony’s parent
company, Harmony Gold Mines Limited of South Africa.
In January, 2002, Harmony entered into an option agreement with Wildcat Exploration Ltd. of
Winnipeg, Manitoba (“Wildcat”). Wildcat’s objective was to re-establish the mine as a smaller
scale shrinkage stope operation delivering ore to a surface stock pile to feed the 1,250 ton (1,136
tonne) process plant which operated on a two week-on two week-off cycle.
In April 2002, A. C. A. Howe International (“Howe”) (Titaro et al 2002) completed a report on
the Harmony assets on behalf of Wildcat. The report included an audit of the mineral resources
and mineral reserves, a review of the operating and capital costs, and preparation of a financial
evaluation of the economic feasibility of reopening the mine. Howe concluded that a viable

P&E Mining Consultants Inc., Report No. 315 Page 24 of 171
Klondex Canada Ltd. True North Gold Mine
shrinkage mining operation could be operated at a mining rate of 550 tons (500 tonnes) per day
was feasible. Ore was delivered to a surface stockpile to feed the 1,250 ton (1,136 tonne) per day
process plant operating on a two week on, two week off cycle. Gold at that time was US$300/oz.
Howe further concluded that based on well-founded historical estimation practices at the Rice
Lake Mine (as it was then called), that as of April 2001, the mine, had a historical (not NI 43-101
compliant) Measured and Indicated Mineral Resource of 1,267,000 tons (1,149,000 tonnes)
grading 0.26 opt Au (8.9 g/t Au) plus Inferred Mineral Resource of 735,000 tons (668,000
tonnes) grading 0.31 opt Au (10.6 g/t Au). All of the above mentioned Mineral Resources were
situated above the 4,630 Level (5,370 feet or 1,637 m below the collar of A-Shaft) in the C and
D-Shaft areas of the Rice Lake Mine.
Within the Measured and Indicated Mineral Resources, Howe concluded that the Rice Lake
Mine had Proven and Probable Mineral Reserves of 901,800 tons (820,000 tonnes) with an
average grade of 0.27 opt Au (9.3 g/t Au). In determining this reserve, Howe used dilution,
cutting, and cut-off practices which were based on over 38 years of mining experience at the
Rice Lake Mine (now True North Gold Mine). All of these mineral reserves had existing
development drifts and were accessible on levels within the C-Shaft and D-Shaft areas.
Despite this work by Howe, Wildcat was unable to complete the acquisition of the Rice Lake
Mine.
On March 5, 2004, San Gold Resources Corporation (“Old San Gold”) and Gold City Industries
Ltd. (“Gold City”), entered into a joint venture agreement to acquire 100% of the issued and
outstanding shares of Harmony through a newly formed corporation, Rice Lake Joint Venture
Inc. (“RLJV”). RLJV was owned and controlled jointly by Gold City (50%) and Old San Gold
(50%). Effective March 17, 2004, RLJV acquired the shares of Rice Lake Gold Corporation
(formerly Harmony Gold Corporation (Canada) Inc.) from Harmony Gold Mining Company
Limited of South Africa. The purchase price was $7,757,961, including $3,632,961 in cash and
$4,125,000 in shares and warrants of Gold City and Old San Gold. On June 30, 2005 Old San
Gold and Gold City amalgamated to form a new corporation called San Gold Corporation.
The exploration drilling completed between the period from 2005 to 2013, (is summarized below
and more fully described in Section 10 of this Technical Report). As part of San Gold’s
exploration program, a Light Detection and Ranging (LiDAR) survey was flown over the Rice
Lake greenstone belt in 2009. From this a second mining trend called the Shoreline Basalt unit,
which hosts the Hinge and 007 Zones, was recognized
A ramp to explore and develop the new, separate SG1 deposit commenced in the winter of 2005.
Production from that deposit continued until mid-2008 when workings had reached a depth of
640 feet (195m) below surface. Work was suspended in 2008 due to diminishing economics and
the mobile equipment was needed elsewhere to develop the recently discovered Hinge Zone.
A new surface ramp to explore and develop the Hinge Zone commenced in 2008 and reached the
deposit in March 2009. Production started almost immediately as definition drilling continued.
In early 2010, a new internal ramp was started from a vertical depth of 800 feet (244m) in the
Hinge Zone workings to access the 007 deposit. The ramp reached the 007 deposit in July 2010,
and production started while definition drilling continued.
A second surface ramp was started near the old Wingold shaft in the second half of 2010. This
ramp was to provide top access to the 007 deposit and provide access to develop the Cohiba

P&E Mining Consultants Inc., Report No. 315 Page 25 of 171
Klondex Canada Ltd. True North Gold Mine
deposit. The ramp reached the Cohiba mineralization at a vertical depth of 108 feet (33m) below
surface.
Under the San Gold operations, ore was mined along three active underground mining trends.
The Rice Lake Mine (as the Project was previously named), formed the core of mining
operations and provided extensive workings that extended deep below the surface to access these
deposits situated within the mineralised host system. The A-Shaft head frame and extends 4,060
feet (1,249 m) below surface.
The second mining trend, the Shoreline Basalt mining unit, focused on the 007 deposit, began
commercial production in 2010. The 007 mine portal is located 2,000 feet (600 m) from the
process plant and provided the main access to San Gold’s operations along the Shoreline Basalt
mining unit and the Hinge Zone. The Hinge zone is hosted in intermediate rocks, is the third
mining trend host and its portal provides access to the 007 deposit.
After investing approximately C$375 million in capital since 2007, including the extensive
underground development and modernising the process plant, San Gold ceased mining in May
2015, and placed operation on care and maintenance. San Gold declared bankruptcy and
announced sale of all of its assets to secured creditors in June 2015.
In early 2016, Klondex Mines Ltd. announced acquisition of 100% of the Rice Lake Mine,
process plant complex and a 400 km2 exploration land package from the creditors. In the first
half of 2016, Klondex commenced refurbishment of the underground infrastructure and
commenced trial mining on readily accessible ore.
Following sampling of the historic tailings storage facility, Klondex commenced a tailings
reprocessing project. Reprocessing of the tailings will be carried out concurrently with
processing of underground ore and when weather permits. Processing of stockpiled ROM ore is
expected to commence in fourth quarter 2016.
A name change to True North Gold Mine was announced in May, 2016. In September 2016,
Klondex announced the formal decision to resume production at True North.

P&E Mining Consultants Inc., Report No. 315 Page 26 of 171
Klondex Canada Ltd. True North Gold Mine
TABLE 6.1
HISTORIC PRODUCTION AT RICE LAKE MINE: 1927-1968
Mill Throughput Ore Reserves
YEAR Gold
% Recovery
of
Process
Plant Average Head
Gold Reserve Grade Notes
Head Stope Feed Grade
ozs Grade Grade tons tons/day opt ozs tons opt
1927 27,008 181% 169% 30,419 83 0.49 34,992 74,450 0.47 Process Plant starts May 1932
1933 22,720 95% 94% 55,677 153 0.43 63,140 154,000 0.41
1934 21,638 93% 90% 64,294 176 0.36 87,750 225,000 0.39 Gold fixed at $35/oz from $20/oz
1935 32,250 92% 96% 102,712 281 0.34 77,070 226,675 0.34
1936 29,040 96% 86% 112,416 308 0.27 59,351 197,836 0.30
1937 30,035 93% 93% 115,765 317 0.28 71,824 256,516 0.28 Discovered 38 vein
1938 31,257 95% 96% 117,376 322 0.28 96,184 343,515 0.28
1939 34,242 94% 94% 117,787 323 0.31 152,361 491,486 0.31 Start of World War 2
1940 36,745 94% 93% 122,365 335 0.32 242,150 756,718 0.30
1941 43,121 95% 94% 138,097 378 0.33 312,501 945,609 0.30
1942 58,869 95% 95% 199,203 546 0.31 285,481 920,908 0.31
1943 48,568 95% 97% 164,307 450 0.31 256,612 916,471 0.28
1944 40,669 97% 96% 140,085 384 0.30 256,735 855,784 0.30
1945 38,326 98% 97% 135,000 370 0.29 213,562 736,419 0.29 End of World War 2
1946 43,819 97% 98% 149,875 411 0.30 214,738 715,794 0.30
1947 42,326 99% 100% 137,867 378 0.31 215,173 694,105 0.31
1948 52,764 114% 113% 154,953 425 0.30 214,826 716,087 0.30 Emergency Gold Mining Assistance
started
1949 53,201 105% 104% 188,000 515 0.27 193,860 718,000 0.27
1950 51,822 101% 102% 182,397 500 0.28 198,562 709,151 0.28
1951 50,735 96% 96% 195,000 534 0.27 174,150 645,000 0.27
1952 53,120 95% 95% 200,000 548 0.28 168,112 600,400 0.28
1953 40,993 98% 99% 174,904 479 0.24 102,816 428,400 0.24 Gold free market ends
1954 43,868 97% 98% 180,599 495 0.25 86,900 347,600 0.25
1955 41,211 98% 99% 174,631 478 0.24 70,800 295,000 0.24 First operating loss
1956 33,462 98% 99% 155,595 426 0.22 54,868 249,400 0.22
1957 33,339 98% 98% 136,616 374 0.25 48,648 202,700 0.24
1958 34,300 98% 98% 124,597 341 0.28 56,650 226,600 0.25
1959 28,570 98% 98% 116,666 320 0.25 47,444 197,683 0.24
1960 31,136 96% 95% 135,642 372 0.24 47,928 199,700 0.24
1961 31,009 98% 99% 149,942 411 0.21 36,869 160,300 0.23
1962 30,339 99% 98% 133,000 364 0.23 23,218 110,560 0.21

P&E Mining Consultants Inc., Report No. 315 Page 27 of 171
Klondex Canada Ltd. True North Gold Mine
TABLE 6.1
HISTORIC PRODUCTION AT RICE LAKE MINE: 1927-1968
Mill Throughput Ore Reserves
YEAR Gold
% Recovery
of
Process
Plant Average Head
Gold Reserve Grade Notes
Head Stope Feed Grade
ozs Grade Grade tons tons/day opt ozs tons opt
1963 24,017 94% 94% 127,575 350 0.20 46,886 203,853 0.23
1964 28,773 98% 98% 133,764 366 0.22 44,989 187,454 0.24
1965 24,969 98% 97% 111,295 305 0.23 34,966 145,693 0.24
1966 21,630 98% 97% 85,258 234 0.26 40,241 174,961 0.23
1967 13,394 98% 98% 71,673 196 0.19 43,240 188,000 0.23
1968 6,066 87% 93% 30,218 166 0.23 38,769 161,537 0.24 Fire destroys surface hoist; production
ends July, 1968.
TABLE 6.2
HISTORIC PRODUCTION AT RICE LAKE MINE: 1980-2001
YEAR
Mill Throughput Ore Reserves
Gold % Recovery of Process Plant
Average Head
Gold Reserve Grade Notes Head Stope Feed Grade
ozs Grade Grade tons tons/day opt ozs tons opt
1980-83 13,954 100% 104,135 0.13 146,085 664,024 0.22 New Forty Four/Brinco Joint Venture formed.
Mill destroyed by fire in 1980. Production ends May 227, 1983, drilling continues at depth
1984 111,616 534,504 0.21 Lathwell/Brinco JV conducts limited program
1985 Brinco changes name to Cassiar Mining Corporation
1986 350,196 1,522,591 0.23 Inco subsidiary drills 20,008 ft to test depth
1987 Inco opts out. Cassiar ownership 100%
1988 308,700 1,470,000 0.21 Kilborn reviews reactivation program for Mandor
Gold
1989 169,641 1,225,642 0.22 Rea Gold Corp. acquires project from Cassiar.
1990 Wright Engineers and Dolmage Campbell complete due diligence on behalf of Rea Gold
1991
1992
1993 Pre-Feasibility of Kilborn and Tonto recommends mineable reserves be increased
1994 415,149 1,976,901 0.21 Rehab, exploration and development in lower
levels of mine
1995 540,715 2,216,046 0.24
Feasibility studies by Rea Gold and Simmons
completed. Drilling and development
underground.
1996 558,213 2,335,621 0.24 Construction and development towards 1,000

P&E Mining Consultants Inc., Report No. 315 Page 28 of 171
Klondex Canada Ltd. True North Gold Mine
TABLE 6.2
HISTORIC PRODUCTION AT RICE LAKE MINE: 1980-2001
YEAR
Mill Throughput Ore Reserves
Gold % Recovery of Process Plant
Average Head
Gold Reserve Grade Notes Head Stope Feed Grade
ozs Grade Grade tons tons/day opt ozs tons opt
tons per day operation
1997 9,000 60,000 0.15 674,951 2,812,297 0.24
1998 2,875 40,035 0.07
Rea Gold Corp. bankrupt. Receiver puts assets up
for sale. Harmony Gold (Canada) Inc. acquires
mining assets of Harmony.
1999 33,238 231,898 0.14
2000 39,476 257,605 0.15
2001 29,341 85% 79% 203,868 0.17 327,884 1,932,404 0.17 Project placed on care and maintenance August,
2001

P&E Mining Consultants Inc., Report No. 315 Page 29 of 171
Klondex Canada Ltd. True North Gold Mine
TABLE 6.3
HISTORIC PRODUCTION AT RICE LAKE MINE: 2007-2015
Year Tons Processed Head Grade Gold
opt g/t oz
2007 96,653 0.13 4.35 9,193
2008 116,835 0.09 3.20 13,845
2009 164,424 0.23 8.00 35,154
2010 275,860 0.17 5.85 47,082
2011 461,150 0.17 5.93 79,802
2012 629,279 0.15 5.07 93,233
2013 641,711 0.13 4.32 80,828
2014 390,564 0.12 4.03 41,890
2015 (Q1) 81,427 0.11 3.91 9,261
6.3 RICE LAKE GOLD MINE HISTORIC RESOURCE ESTIMATES
6.3.1 Historic Resource Estimates
1989: Rea Gold estimated the historic (not NI 43-101 compliant) Mineral Reserve to be
1,226,000 tons (1,114,000 tonnes) grading 0.22 opt Au (7.5 g/t Au).
1994: Rea Gold increased the historic (not NI 43-101 compliant) mineral reserve to 1,977,000
tons (1,797,000 tonnes) grading 0.21 opt Au (7.2 g/t Au) based on the results of a C$3.1 million
underground rehabilitation and exploration program to delineate additional mineral resources.
2002: Howe (Titaro et al 2002) concluded that as of April 2001 the mine had a historic (not NI
43-101 compliant) Measured and Indicated Mineral Resource of 1,267,000 tons (1,152,000
tonnes) grading 0.26 opt Au (8.9 g/t Au) plus an Inferred Mineral Resource of 735,000 tons
(668,000 tonnes) grading 0.31 opt Au (10.6 g/t Au).
6.3.2 Most Recent Resource Estimate
2012: A summary of the 2013 Resource Estimate for the Rice Lake Mining Complex is given
below in Table 6.4. Information from Table 6.4 was taken from a report completed under NI 43-
101 standards and amended and filed on the System for Electronic Document Analysis and
Retrieval, “SEDAR”, (www.sedar.com), on February 25, 2013. The authors of the Rice Lake
Technical Report, produced for SanGold, were Qualified Persons Dale Ginn, P.Geo. and Michael
Michaud, P.Geo. San Gold.

P&E Mining Consultants Inc., Report No. 315 Page 30 of 171
Klondex Canada Ltd. True North Gold Mine
TABLE 6.4
SUMMARY OF MINERAL RESOURCE (DEC 31, 2012)
Description Mineral Resource Gold Grade Total Gold
(tons) (opt) (g/t) (ounces)
Rice Lake Mine
Measured Resource 226,000 0.24 8.2 54,000
Indicated Resource 770,000 0.24 8.1 181,000
Measured and Indicated 996,000 0.24 8.1 235,000
Inferred Resource 1,710,000 0.29 9.8 489,000
Hinge Zone District
Measured Resource 96,000 0.16 5.7 16,000
Indicated Resource 481,000 0.13 4.5 63,000
Measured and Indicated 577,000 0.14 4.7 79,000
Inferred Resource 1,564,000 0.13 4.5 205,000
007 Zone
Measured Resource 225,000 0.24 8.2 54,000
Indicated Resource 869,000 0.15 5.1 130,000
Measured and Indicated 1,094,000 0.17 5.7 183,000
Inferred Resource 8,513,000 0.14 4.9 1,215,000
Hanging Wall Zones (Cohiba, Cartwright L13)
Measured Resource 39,000 0.16 5.6 6,000
Indicated Resource 336,000 0.19 6.6 64,000
Measured and Indicated 375,000 0.19 6.5 71,000
Inferred Resource 3,509,000 0.19 6.6 680,000
Normandy Shear (SG1, SG2, SG3)
Measured Resource 0
Indicated Resource 387,000 0.22 7.7 87,000
Measured and Indicated 387,000 0.22 7.7 87,000
Inferred Resource 1,221,000 0.22 7.4 265,000
Total Project
Measured and Indicated 3,430,000 0.19 6.5 655,000
Inferred Resource 16,517,000 0.17 5.9 2,853,000 (1) Mineral Resource estimate is based on cut-off grades of 0.09 oz/ton to 0.12 opt and gold price of US$1300-
US$1500 /oz
(2) Some values have been rounded. The totals are accurate summations of the columns and rows of data.
At that time, the total project Proven and Probable Mineral Reserve was estimated at 1,699,000
tons (1,541,000 tonnes) grading 0.15 opt (5.14 g/t) Au.
2014: In a press release dated March 31, 2015, San Gold announced an updated Mineral Reserve
and Mineral Resource estimate for the Rice Lake Mining Complex effective December 31, 2014

P&E Mining Consultants Inc., Report No. 315 Page 31 of 171
Klondex Canada Ltd. True North Gold Mine
(Table 6.5). The update was based on mine depletion or previous resources and definition
drilling of new resources.
TABLE 6.5
SUMMARY OF MINERAL RESOURCES (DEC 31, 2014)
Description Mineral Resource Gold Grade Total Gold
(tons) (opt) (g/t) (ounces)
Rice Lake Mine
Measured Resource 212,000 0.24 8.1 50,000
Indicated Resource 1,111,000 0.23 8.0 260,000
Measured and Indicated 1,323,000 0.23 8.0 310,000
Inferred Resource 2,015,000 0.25 8.4 495,000
Hinge Zone District
Measured Resource 12,000 0.13 4.3 1,000
Indicated Resource 871,000 0.19 6.5 164,000
Measured and Indicated 883,000 0.19 6.4 165,000
Inferred Resource 1,174,000 0.17 5.9 202,000
007 Deposit
Measured Resource 0
0
Indicated Resource 305,000 0.14 5.0 44,000
Measured and Indicated 305,000 0.14 5.0 44,000
Inferred Resource 1,000,000 0.15 5.1 150,000
Other Deposits
Measured Resource 0
0
Indicated Resource 662,000 0.17 5.9 114,000
Measured and Indicated 662,000 0.17 5.9 114,000
Inferred Resource 1,640,000 0.16 5.3 254,000
Total Project
Measured and Indicated 3,173,000 0.20 6.8 633,000
Inferred 5,829,000 0.19 6.5 1,101,000 (1) Mineral Resource estimate is based on cut-off grades of 0.08 opt (2.74 g/t) and 0.10 opt (3.43 g/t) and a gold
price of US$1350/oz
(2) Some values have been rounded. The totals are accurate summations of the columns and rows of data.
At that time, total Project Proven and Probable Reserves were estimated at 2,629,000 tons
(2,385,000 tonnes) grading 0.173 opt Au (5.93 g/t Au).
Note: the Resource Estimate above is not current and has since been superseded by the
2016 P&E NI 43-101 compliant Resource Estimate, as described in Section 14 of this
Technical Report.

P&E Mining Consultants Inc., Report No. 315 Page 32 of 171
Klondex Canada Ltd. True North Gold Mine
6.4 RICE LAKE PROPERTIES FEASIBILITY STUDIES
Information in this Section is taken from the February 4, 2013 San Gold report titled “Technical
Report on the Rice Lake Mining Complex, Bissett, Manitoba”.
6.4.1 Historic Feasibility Studies
1993: Based on a historic (non NI 43-101 compliant) Mineral Reserve estimated to be 1,226,000
tons (1,114,000 tonnes) grading 0.22 opt Au (7.5 g/t Au), a Pre-Feasibility study by Kilborn
Engineering in 1993 for Rea Gold recommended that the Mineral Resource base be increased
prior to a production decision.
1995: A Feasibility Study was completed by Rea Gold and Simmons Engineering in 1995 and
construction and development of a 1,000 ton (907 tonne) per day operation was initiated.
2002: Howe (Titaro et al 2002) completed a report on the Harmony assets, which included an
audit of the mineral resources and mineral reserves, review of the operating and capital costs,
and preparation of a financial evaluation of the economic feasibility for reopening the Rice Lake
Mine. Howe concluded that a viable shrinkage mining operation could be run at a mining rate of
550 tons (500 tonnes) per day, which delivered ore to a surface stockpile to feed the 1,250 ton
(1,136-tonne) per day process plant. The process plant would operate on a two-week on, two-
week off cycle. Gold was US$300 per ounce at this time. .
Howe further concluded that based on established estimation practices at the Rice Lake Mine,
the mine had a historic (not NI 43-101 compliant) Measured and Indicated Mineral Resource of
1,267,000 tons (1,149,000 tonnes) grading 0.26 opt Au (8.9 g/t Au) plus Inferred Mineral
Resources of 735,000 tons (668,000 tonnes) grading 0.31 opt Au (10.6 g/t Au) as of April 2001.
All resources were located above the 4,630 Level 5,370 feet (1,637 m) below the collar of A-
Shaft) in the C-Shaft and D-Shaft areas of the mine.
Within the Measured and Indicated Mineral Resources, Howe concluded that the Rice Lake
Mine had Proven and Probable Mineral Reserves of 901,800 tons (820,000 tonnes) grading 0.27
opt Au (9.3 g/t Au). In determining this Mineral Reserve, Howe used dilution, cutting, and cut-
off practices based on more than 38 years of mining at the Rice Lake Mine. All reserves had
existing development drifts and were accessible on levels within the C-Shaft and D-Shaft areas.
6.4.2 Existing Feasibility Studies
Technical Reports on NI 43-101 compliant Feasibility Studies have not been completed for True
North.
6.5 PREVIOUS MINERAL PROCESSING & METALLURGICAL TESTING
A mineral processing plant has been operated intermittently in conjunction with mining since the
1930s. The details of mineral processing and metallurgical testing are disclosed in Section 13 of
this Technical Report.

P&E Mining Consultants Inc., Report No. 315 Page 33 of 171
Klondex Canada Ltd. True North Gold Mine
7.0 GEOLOGICAL SETTING AND MINERALIZATION
7.1 REGIONAL GEOLOGICAL SETTING
True North is underlain by the Archean Rice Lake greenstone belt located at the west end of the
Uchi Volcanic-Plutonic Subprovince of the Superior Province (Figures 7.1 and 7.2). The Rice
Lake greenstone belt is bound to the north and south by the Wanipigow Shear Zone and the
Manigotagan Shear Zone, respectively.
The Manigotagan Shear Zone is marked by a regionally continuous zone of faults (Manigotagan-
Lake St. Joseph Fault) which separates the volcanic-plutonic terrain of the Uchi Subprovince
from the English River (Ontario) - Manigotagan (Manitoba) gneissic belts. The Manigotagan
gneissic belt, which occurs immediately south of the Rice Lake greenstone belt, consists of a
lithologic gradation from low-grade metavolcanic and metasedimentary rocks, through
paragneiss and migmatite, to quartz diorite and granodiorite gneiss.
The Wanipigow Shear Zone is marked at True North by regional-scale fault structures and
elsewhere by increasing metamorphic grade into the metamorphic-plutonic terrain of the
Wanipigow (Manitoba) Subprovinces and Berens River (Ontario). The Wanipigow River
Plutonic Complex, which forms the northern boundary of the Rice Lake greenstone belt, is
composed mainly of hornblende and biotite-bearing quartz diorite, granodiorite and locally
quartz monzonite intrusions and gneisses. Several large gabbro intrusions are also present.
The rocks in the True North area were affected by at least three and possibly four major periods
of deformation (Anderson, 2008). The resulting fold pattern is complex with overturned, doubly-
plunging folds in the Rice Lake Group rocks. The late Archean San Antonio Formation
sedimentary rocks may have been affected by only the last major period of deformation.
Many major regional fault structures are present in the True North area. The most prominent are
the major structures that trend generally east-west. Movement along these structures formed
conjugate shear zones which splay off to the north and south. Thrust faulting likely occurred in
the early stages of the deformation, but these structures are difficult to identify.
All the major gold occurrences in the Project area occur as quartz veins or quartz vein systems
formed during structural deformation of the host rocks. Significant gold production has occurred
from the Uchi Subprovince in the Rice Lake area to the west in Manitoba and in the Red Lake,
Birch-Uchi Lake and Pickle-Dona Lake areas to the east in Ontario (Figure 7.1).

P&E Mining Consultants Inc., Report No. 315 Page 34 of 171
Klondex Canada Ltd. True North Gold Mine
Figure 7.1 Regional Geologic Map showing the Location of True North Gold Mine in
the Archean Uchi Subprovince, Manitoba
*(Anderson, 2008). Abbreviations: MSZ, Manigotagan Shear Zone; SL–LSJF, Sydney Lake–Lake St. Joseph Fault;
WSZ, Wanipigow Shear Zone
Figure 7.2 Geologic Map showing the Location of Gold Deposits and Lithotectonic
Assemblages in True North Gold Mine Area

P&E Mining Consultants Inc., Report No. 315 Page 35 of 171
Klondex Canada Ltd. True North Gold Mine
7.2 LOCAL GEOLOGIC SETTING
All of the gold mineralized zones at True North are hosted in rocks of the Bidou Lake
Assemblage (Figure 7.3). The Bidou Lake Assemblage forms a north-facing stratigraphic
sequence of tholeiitic basalt to intermediate volcanic flows, dacite crystal tuffs and breccias
overlain by well stratified felsic epiclastic rock interpreted to be of pyroclastic and sedimentary
origin. The stratigraphic sequence is intruded by tholeiitic gabbro sills and dykes and felsic
porphyry dykes.
The best known gabbro sill is the San Antonio Unit, host rock of the gold mineralization at the
True North deposit. The Bidou Lake Assemblage is unconformably overlain by feldspathic
sandstone of the San Antonio Assemblage.
In the Project area, gold mineralization is controlled by quartz-carbonate veins and vein systems
in brittle- ductile structures with related hydrothermal alteration halos within or at the margin of
particular host rock units (Figure 7.4).
7.2.1 Host Rock Units
The gold mineralized veins show a high degree of structural control and are best developed in
competent host rock units. Since 2009, three main host units have produced the most gold ore at
True North (Figures 7.3, 7.4):
1) The SAM, a gabbro sill from which gold has been mined for more than 80 years
from the True North deposit;
2) The Shoreline Basalt unit, which hosts the 007, L10 and SG zones; and
3) The Intermediate Volcanic unit, which hosts the Hinge, L13, L08 and Cohiba
Zones.
The SAM unit is a layered tholeiitic gabbro sill which intrudes the Bidou Lake Assemblage and
dips moderately to the north. The SAM has been interpreted to be a subvolcanic feeder for the
overlying mafic volcanic rocks. SAM hosted all the gold mineralization mined prior to 2004 in
the True North Mine and the Cartwright zone, for a total of 1.5 million oz.
The Shoreline Basalt is a steeply dipping mafic volcanic rock unit that is geologically similar and
subparallel to the SAM unit, and hosts the 007, L10 and possibly the SG gold zones (Figure 7.4).
The Intermediate Volcanic Unit occurs to the north of the Shoreline Basalt and hosts the Hinge
and Cohiba Zones.
In addition to these three rock unit, an unnamed intermediate to mafic volcanic unit situated in
the footwall to the Shoreline Basalt unit hosts the 710 Zone which was discovered in 2013.
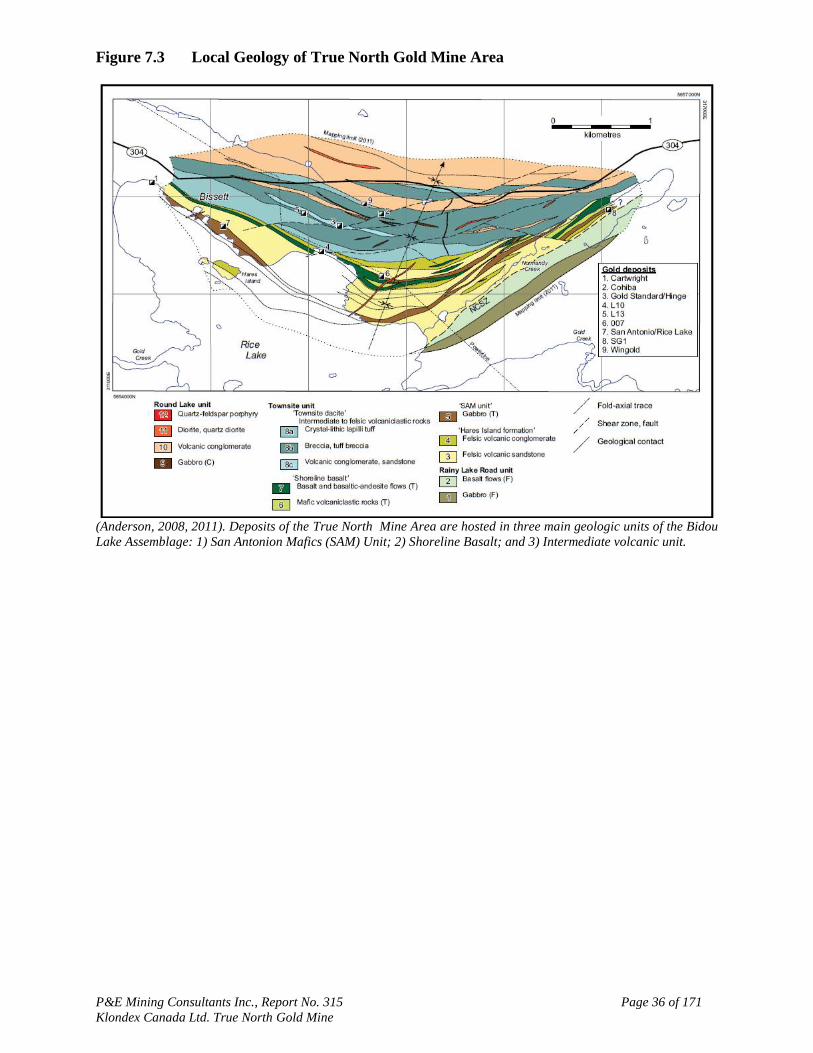
P&E Mining Consultants Inc., Report No. 315 Page 36 of 171
Klondex Canada Ltd. True North Gold Mine
Figure 7.3 Local Geology of True North Gold Mine Area
(Anderson, 2008, 2011). Deposits of the True North Mine Area are hosted in three main geologic units of the Bidou
Lake Assemblage: 1) San Antonion Mafics (SAM) Unit; 2) Shoreline Basalt; and 3) Intermediate volcanic unit.

P&E Mining Consultants Inc., Report No. 315 Page 37 of 171
Klondex Canada Ltd. True North Gold Mine
Figure 7.4 The Structural Geological Setting of Gold Mineralization at True North Gold
Mine
The mine area is bound by the Wanipigow Fault Zone to the north; the Normandy Creek Sheer Zone to the east and
the Gold Creek Shear Zone to the south. The general north-northeast shortening of the True North Mine area rocks
produced a conjugate set of northeast-trending and northwest-trending shear and tensional brittle-ductile
structures.
7.2.2 Structures
The structures that control the gold mineralization are brittle-ductile shear zones which strike
from parallel to transverse to the host rock units and dip steeply northwest or northeast. The
shear zones are marked by intensely foliated and lineated interlayered sericite and chlorite
schists, which range from <100m to 6 km long and from 1m to >10m thick (Figure 7.5A).
Structures trending east-northeast have kinematic features indicative of sinistral-reverse
movement, whereas those trending northwest have kinematic features indicative of dextral-
normal movement.
The sinistral and dextral structures are interpreted to have been generated during a single
protracted areal deformation event – D3 (Anderson, 2011; SRK, 2013). Stretching lineation and
fold plunges tend to be orthogonal to movement on the host shear zone (SRK, 2013). The
structures contain a main, banded (laminated) quartz vein and subsidiary veins in the schist on
either side (Figure 7.5B). The main vein can be situated anywhere in the structure.
7.2.3 Veins
According to Anderson (2008), shear-hosted veins include massive, laminated and brecciated
varieties, commonly within the same vein, and typically pinch and swell along strike and down-
dip. Thicker veins are associated with inflection points in the host shear zones, which suggests
hydrothermal infill of dilational jogs.

P&E Mining Consultants Inc., Report No. 315 Page 38 of 171
Klondex Canada Ltd. True North Gold Mine
Most of the shear zones are associated with fringing arrays of kinematically linked extension and
oblique-extension quartz veins, which locally intensify into complex peripheral stockwork-
breccia systems. Considered with the geometry of the vein arrays, the vein textures indicate
synkinematic emplacement under brittle-ductile conditions. Most deposits are arrays of sub-
horizontal extension veins, which suggests emplacement accompanied by transiently
supralithostatic fluid pressures.
In the True North deposit, the gold-bearing quartz veins occur mainly as either “16-type” shear
zone veins or “38-type” tensional fracture stockwork veins (Figures 7.6, 7.7 and 7.8) or, where
they intersect, as a combination of the two vein types. The 16-type appear to be fault fill veins
with generally higher grades and more continuity, which are laminated with pressure solution
seams (stylolites) and trend north-northeast.
The stylolites consist of intergrown pyrite-chlorite-tourmaline-muscovite. Compared to the 16-
type, the 38-type are stockwork breccia veins that are wider and arranged in an en-echelon
pattern along the strike and down the dip of the host gabbro unit, but gold mineralization is more
irregular and grades difficult to predict. In some deposits, for example SG-1 and SG-3, the gold
mineralized veins were intensely transposed during ductile deformation (Anderson, 2008),
presumably later in D3.
Figure 7.5 Shear Zones and Quartz Veins
(SRK, 2013), A) East-NE trending shear zone foliation at the 98 vein (16-type) in the True North Mine. B) The main
laminated (16-type) 84 vein and subsidiary veins in the True North Mine.

P&E Mining Consultants Inc., Report No. 315 Page 39 of 171
Klondex Canada Ltd. True North Gold Mine
Figure 7.6 Example of 16-Type Shear and 38-Type Breccia Gold Mineralized Quartz
Veins in the SAM Unit at True North
(San Gold Corporation, 2015)

P&E Mining Consultants Inc., Report No. 315 Page 40 of 171
Klondex Canada Ltd. True North Gold Mine
In addition to quartz, the veins contain subordinate carbonate, minor albite, chlorite and sericite,
and rare tourmaline and fuchsite (a.k.a. mariposite). The carbonate is dolomite-ankerite in
composition (Ross & Rhys, 2010). Sulphide minerals consist of pyrite with minor chalcopyrite
and rare sphalerite, galena and gold-silver telluride minerals. Pyrite generally comprises <5% of
individual veins and occurs as scattered grains and irregular blebs within and along vein margins,
and is concentrated along planar slip surfaces or stylolites.
Gold typically occurs are free grains associated with or as inclusions in pyrite. Gold grades tend
to be highly erratic within individual quartz veins. The gold ores have high Au/Ag ratios of >5:1
and low concentrations of Copper, Lead, Zinc, Arsenic, Bismuth, Boron, Antimony and
Tungsten, as is typical for Archean lode-gold deposits.
7.2.4 Wall Rock Alteration
Wall rock alteration spatially associated with the quartz veins varies from minor to intense and is
generally zoned outward from proximal albite + ankerite + sericite + quartz +pyrite through
medial chlorite + ankerite ± sericite to distal chlorite + calcite (Anderson, 2008). These alteration
mineral assemblages overprint the regional greenschist facies metamorphic mineral assemblage
(Ames et al., 1991). Many veins show evidence of wall rock sulphidization in the form of coarse
euhedral pyrite grains.
In the True North deposit, thick zones of altered and sulphidized wall rock with minor vein
quartz contain ore grade gold. Complex and antipathetic distribution patterns of phengitic white
mica and muscovite-paragonite are reported by SRK (2013), and appear to be controlled by
second order faults and near-mine shear zones.
The True North and SG-1 deposits show close spatial relationship with laterally continuous
zones of ankerite-sericite phyllite and phyllonite, which represent reliable guides to ore.
Deformation structures in the phyllonite preserve evidence of a complex deformation history,
increments of which pre-date and post-date vein formation.
Despite vertical extents of up to >2 km, the True North deposit shows only minor variation in
vein mineralogy, texture and structure.

P&E Mining Consultants Inc., Report No. 315 Page 41 of 171
Klondex Canada Ltd. True North Gold Mine
Figure 7.7 Controls on Gold Mineralization in the 007 Zone
(SRK, 2013; San Gold Corp., 2015). A) and B). Level plan geologic maps showing the distribution of veins and
alteration, relationship to 16-type shear zones and 38-type breccia zones, and formation of high-grade dilational
jogs. C) Photograph of a dilational jog at the L10 zone. D) Three-dimensional image showing the steep north-
northwest plunge of the dilational jog.
Figure 7.8 Interpreted Cross-Sections of 007 and L10 Zones Looking West
A) cross-section of 007 zone. Note that the 007 veins crosscut stratigraphy. B) Cross-section of the L10 zone. The
veins here appear to be largely confined to the Shoreline Basalt
A. B.

P&E Mining Consultants Inc., Report No. 315 Page 42 of 171
Klondex Canada Ltd. True North Gold Mine
Figure 7.9 Level Plan of the 710 Zone showing the Location of the 710 and 711 Veins.
Note the near-orthogonal orientation of the two veins and the host intermediate-mafic volcanic unit between the
SAM unit to the south and the Shoreline Basalt unit to the north

P&E Mining Consultants Inc., Report No. 315 Page 43 of 171
Klondex Canada Ltd. True North Gold Mine
8.0 DEPOSIT TYPES
The association of gold at True North with quartz-carbonate veins in brittle-ductile shear zones
and laterally extensive hydrothermal alteration zones indicates that the deposits represent
epigenetic mesothermal lode gold-type (Poulsen et al., 2000) or orogenic-type gold
mineralization (Groves et al., 1998).
Such gold deposits form from metal-bearing fluids generated during accretionary processes and
prograde regional metamorphism at depth in greenstone belt terrains. In this model (Figure 8.1),
the resulting fluids migrate and are channelled upward along transcrustal fault systems to
subsidiary shear and fracture structures developed in the middle to upper crust. Gold is deposited
in quartz carbonate veins as a result of pressure-temperature, pH and other physiochemical
changes, phase separation and fluid-rock reactions. The reactions commonly involve
sulphidization of precursor oxide, carbonate and silicate minerals and mineral assemblages.
Figure 8.1 Schematic Cross-Section Representation of the Geometry and Structural
Setting of Shear Zone Hosted Gold-Bearing Quartz Vein Networks in Greenstone
Belt Terrains like True North Gold Mine
(Poulsen et al., 2000)

P&E Mining Consultants Inc., Report No. 315 Page 44 of 171
Klondex Canada Ltd. True North Gold Mine
9.0 EXPLORATION
Klondex has yet to commence near mine and regional exploration work at True North. Limited
underground diamond drilling exploration, has been completed for ore definition. Most of the
exploration work at the Project was completed previously during the San Gold ownership.
Based on the orogenic gold model (Figure 8.1), exploration targets at True North are areas or
zones selected based on the criteria listed below:
Presence of gold
Favourable structure (shear zones and breccia zones)
Significant quartz vein material
Hydrothermal alteration minerals and assemblages
Proximity to unconformities and disconformities; and
Proximity to oxidation/reduction boundaries of regional scale
On surface, favourable structures are identified utilizing the 2009 LiDAR survey and the 2011
airborne magnetometer survey. The LiDAR survey products include a high-resolution digital
elevation model which has been used to map geological contacts, bedding planes, faults, shears,
lineations and joints. Follow-up ground geological mapping is employed to identify fabrics,
offsets and abrupt changes in rock types that indicate structure.
Mineral prospecting is used to identify indicative mineral alteration, particularly sericite and
carbonate minerals and mineral assemblages. Many surface targets meeting some or all of the
relevant criteria remain to be tested by drilling.
Underground exploration has been and continues to be guided by drilling mineralized structures
along strike and updip and down-dip from mine workings and development, particularly within
the SAM unit, Shoreline Basalt unit, Intermediate Volcanic Unit, and the 710 host mafic unit. At
least seven underground targets have been identified by Klondex for exploration drilling.
P&E Mining Consultants Inc., Report No. 315 Page 45 of 171
Klondex Canada Ltd. True North Gold Mine
10.0 DRILLING
Drilling at True North has been completed both on surface and underground. The majority of the
drilling was done previously by San Gold. Klondex commenced drilling underground and
sampling the historic tailings in the spring of 2016.
10.1 DIAMOND CORE DRILLING
Underground drillholes are planned by the Geology Department using three- dimensional A-
mine software applying length, dip, and anticipated deviation. The front and back sights are
setup by the survey department and on completion of the hole, the collar location is surveyed.
Downhole survey measurements are taken at 70 feet (20m) from the collar, and then every 100
feet (30m) for underground drillholes and 200 feet (60m) for surface drillholes. For infill drilling,
the typical hole spacing is 50 feet (15m).
Underground air diamond drills produce AQ size core and underground electric diamond drills
produce BQ and NQ size core. Surface diamond drills produce NQ size core, except for the first
500 feet (150m) of some of the deeper holes, for which HQ size core is produced to minimize
drillhole deviation.
Underground exploration and definition drilling completed, by previous owners, along the SAM
unit was for near and mid-term production planning purposes. Definition drilling also continued
at the 007 and L10 zones within the Shoreline Basalt unit and at the L13 and Hinge Zones in
order to advance Mineral Resources from Inferred to Measured and Indicated categories and to
increase the Mineral Reserve.
In 2011, the L08 zone was discovered to the northwest of the Hinge Zone. The L08 zone was
traced vertically in drilling from 1,000 feet to 2,300 feet below surface and is in close proximity
to the Hinge Zone and True North workings at the 16 Level. In 2013, the 710 Zone was
discovered as part of underground drilling of an unnamed intermediate mafic volcanic unit
between the SAM unit to the south and the Shoreline Basalt unit to the north. Underground
drilling of the 710 Zone and other zones continued in 2014 through the spring of 2015.
Klondex commenced underground diamond drilling which, in early 2016, was focused on the
710 Zone. By the spring of 2016, approximately 5,700 underground exploration holes were
drilled collectively by San Gold and Klondex with an approximate total of 2,482,000 feet
(756,500 m).
It is important to note that the apparent drop in the Mineral Reserves and Resources from early
publicly released numbers (not NI -43-101 compliant) is not the result from drilling, but due to a
more conservative approach to resource modelling and categorizing.
Surface diamond drilling has occurred at the Project since 1912, which includes more than 2,190
holes and 2,605,000 feet (794,000 m) (Table 10-1). San Gold’s largest surface drilling
exploration program was in 2011-2012 and included drilling approximately 1,024,000 feet
(336,000 m) in 602 surface holes. The exploration drill program focused on the SAM unit,
Shoreline Basalt unit, and Intermediate Volcanic Rock unit.

P&E Mining Consultants Inc., Report No. 315 Page 46 of 171
Klondex Canada Ltd. True North Gold Mine
TABLE 10.1
SUMMARY OF SURFACE EXPLORATION ON THE TRUE NORTH GOLD MINE
10.2 CHANNEL CHIP SAMPLING
The face sampling procedure described below is used for grade control at the Project is derived
from a 2016 document provided by Klondex. The sampling procedure consists of the following
steps:
Ensure that the face to be sampled is secure and safe prior to chipping;
Wash the face thoroughly to remove loose material and expose rock type
boundaries;

P&E Mining Consultants Inc., Report No. 315 Page 47 of 171
Klondex Canada Ltd. True North Gold Mine
Delineate sample intervals using a measuring stick and paint. The sample line
should be perpendicular to the orebody dip and run from left to right;
Sample widths should not exceed 3 feet in waste and 2 feet in ore, with a
minimum sample width of 0.5foot (0.15m);
Sample intervals should not cross lithologic boundaries; and
Cumulative sample intervals should encompass the entire width of the face.
Samples are collected by chipping rock from the interval utilizing a sharp rock hammer pick.
Rock chips are placed in a clean plastic 12 inch x 12 inch sample bag. The bag is filled to an
approximate ¼ capacity. Sample information is recorded on a sample tag and the numbered end
placed in the corresponding sample bag.
On a chip sample face sheet, a scaled picture is drawn of the face and the sampled intervals. In
addition, the date, sampler, heading, dimension, orientation, position relative to the nearest
survey station, samples, sampled intervals, and materials (host rock or vein) are all recorded.
The channel chip sample information is entered into the database and stored as pseudo drillholes
with collar, survey and assay values.
10.3 HISTORIC TAILINGS POND DRILLING/SAMPLING
Prior to committing to a trial of the re-processing of the historic tailings an extensive sampling
program was undertaken to determine the distribution of recoverable gold within the tailings
mass. In the spring and summer of 2016, Klondex drilled 138 holes and hand dug 214 holes on
the historic tailings for which is a total of 352 holes with a total footage of 3,714 feet (1,132 m)
(Table 10.2). The holes ranges in depth from <5 feet at the margins up to 35 feet in the centre.
On the historic tailings, two phases of drilling have been completed using a 200-foot by 100-foot
grid. Phase 1 drilling was completed using a stem auger. The hollow stem auger sampling
method employed by SanGold is not well documented. Brief descriptions indicate that the holes
were drilled and sampled in 5-ft (1.5m) increments through a hollow stem auger.
Phase 2 drilling was performed with a percussion probe (Geo Probe). Holes were planned,
located, and staked with a differential global positioning system (GPS), and drilled with a dual
tube system. An outer tube is pushed down inside the drill rod by percussion, and then an inner
tube with a sampling polyvinyl chloride (PVC) cylinder is pushed down inside of the tube. A
continuous 5¬foot sample is collected within the PVC cylinder. The inner PVC cylinder and the
sample are retrieved through the outer tube, which remains in place. When drilling resumes, the
drill pushes down an additional 5-foot section of outer tube, and the processes is repeated in
continuous 5- foot intervals until the total depth of the hole is reached.
In addition to the drilling, samples were also collected from hand dug holes. Holes were planned
on a grid spacing of 50-foot by 50-foot and staked and located with a differential GPS. The holes
were dug to the diameter of the shovel blade and to a depth at which the hole is stable. The
geologist logs lithologic units that are >0.5 foot in thickness, based on grain size (sand, clay, or
mixed). Hand dug hole collars are imported into the database as pseudo drillholes with an
azimuth of 0 degrees and dip of -90 degrees.

P&E Mining Consultants Inc., Report No. 315 Page 48 of 171
Klondex Canada Ltd. True North Gold Mine
TABLE 10.2
SUMMARY OF TAILINGS DRILLING AT TRUE NORTH GOLD MINE
Hole Type Grid Spacing No. Holes Footage Assay Lab
Stem Auger 200 ft x 100 ft 39 818.8 AcmeLabs
Geo Probe 200 ft x 100 ft 99 2351.5 TSL Lab
Hand Dug 50 ft x 50 ft 214 543.5 Site Lab

P&E Mining Consultants Inc., Report No. 315 Page 49 of 171
Klondex Canada Ltd. True North Gold Mine
11.0 SAMPLE PREPARATION, ANALYSES AND SECURITY
This section of the report summarizes the sampling methods, sample preparation, assay analysis,
and security procedures for surface and underground drill core, underground face sampling, and
historic tailings sampling.
For core and face sampling, the procedures were developed and documented by the previous
operator San Gold have largely been adopted by Klondex. Any changes made by Klondex are
noted within this Technical report. The procedures for tailings sampling were developed entirely
by Klondex.
11.1 CORE SAMPLING METHODS
Surface and underground drilling at the Project is completed by contractors. Diamond drill core
is placed in labelled wooden trays and depth marker blocks are inserted by drilling contractor
personnel prior to the removal of the core from the drill site by the project geologist. Upon
arrival at the secure core logging facility, the core boxes are sequentially placed in a core rack
and the spatial information on each box of core is checked for accuracy and consistency. If
necessary, remedial action is undertaken to correct deficiencies and errors in the spatial
information prior to entry into the database. The drill core is digitally photographed prior to
logging and marked for sampling.
11.1.1 Surface Core Sampling Methods
Exploration geologists log the core and record observations in a digital drill log database prior to
sample selection for assay analyses (Figure 11.1). Core intervals are selected for sampling based
on the following presence of mineralization, favourable structure and quartz veining. They are
then marked and measured for sampling and identified with one part of a three-part assay tag
placed at the end of the sample interval.
Samples are taken by sawing the core perpendicular to the core axis, with one-half of the core
returned to the core box and the other half placed in a clean plastic bag along with part two of the
three-part assay tag. Information on the third part of the assay tag is entered into the database and
the drill log, at which time accuracy and consistency are checked again and corrected for
discrepancies.
San Gold submitted core samples for assay analysis to TSL Laboratories Inc. in Saskatoon,
Saskatchewan. Check assays were performed at Accurassay Laboratories Ltd. in Thunder Bay,
Ontario. As of the publication date of this Technical Report, Klondex has not completed any
surface drilling. Both labs are independent of Klondex.
11.1.2 Underground Core Sampling Methods
Drill programs planned by the Projects’s Department are typically underground definition
drilling of known zones rather than exploration. The core sampling method differs from that for
the surface exploration holes.
The interval to be sampled is determined and marked by the geologist logging the core (Figure
11.1). Most samples, particularly those from known zones, range between 0.5 foot (0.15m) and
4.0 foot (1.2m) in length. Every sample is bracketed by a minimum of 1.0 ft. (300 mm) for small
veins and structures and 6 feet (1.8m) in each of the footwall and hanging wall of known zones.

P&E Mining Consultants Inc., Report No. 315 Page 50 of 171
Klondex Canada Ltd. True North Gold Mine
The entire core sample is placed in a bag by the geologist and identified with an assay tag,
which has a copy that remains in the sample book, and the sample number is recorded in the
database. If core is to be cut, the sampling procedure is the same as the surface exploration
procedure. Approximately 10 feet (3.05m) of core above and below the sampled portion is kept
to ensure that sufficient material remains if a re-bracket is required. The remainder of the core is
stored at the Project.
Underground core samples are submitted to TSL Laboratories Inc. (TSL) in Saskatoon,
Saskatchewan. The check assay laboratory was ALS Global (ALS) in Vancouver, British
Columbia. San Gold also submitted core samples to the Project’s Assay Lab. In which case,
check assays were performed by TSL. Klondex submits underground core samples to TSL. Their
check assay lab is ALS. Both labs are independent of Klondex.
Figure 11.1 Flow Chart for Surface and Underground Core Sampling Methods
In general, all sections with quartz veining and/or alteration are sampled. Sample lengths in
mineralized core, characterized by silicification, carbonate alteration, sulphide minerals, quartz
veins and visible gold, are variable and based on geological considerations.
SurfaceCore
UndergroundCore
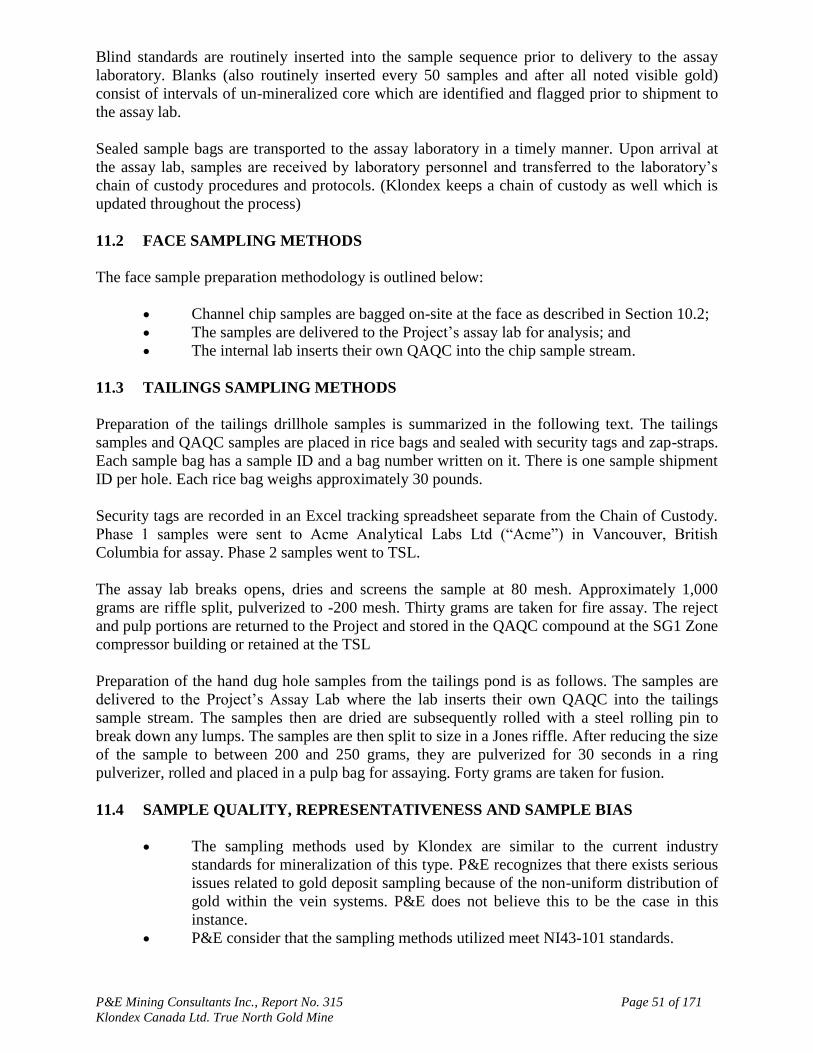
P&E Mining Consultants Inc., Report No. 315 Page 51 of 171
Klondex Canada Ltd. True North Gold Mine
Blind standards are routinely inserted into the sample sequence prior to delivery to the assay
laboratory. Blanks (also routinely inserted every 50 samples and after all noted visible gold)
consist of intervals of un-mineralized core which are identified and flagged prior to shipment to
the assay lab.
Sealed sample bags are transported to the assay laboratory in a timely manner. Upon arrival at
the assay lab, samples are received by laboratory personnel and transferred to the laboratory’s
chain of custody procedures and protocols. (Klondex keeps a chain of custody as well which is
updated throughout the process)
11.2 FACE SAMPLING METHODS
The face sample preparation methodology is outlined below:
Channel chip samples are bagged on-site at the face as described in Section 10.2;
The samples are delivered to the Project’s assay lab for analysis; and
The internal lab inserts their own QAQC into the chip sample stream.
11.3 TAILINGS SAMPLING METHODS
Preparation of the tailings drillhole samples is summarized in the following text. The tailings
samples and QAQC samples are placed in rice bags and sealed with security tags and zap-straps.
Each sample bag has a sample ID and a bag number written on it. There is one sample shipment
ID per hole. Each rice bag weighs approximately 30 pounds.
Security tags are recorded in an Excel tracking spreadsheet separate from the Chain of Custody.
Phase 1 samples were sent to Acme Analytical Labs Ltd (“Acme”) in Vancouver, British
Columbia for assay. Phase 2 samples went to TSL.
The assay lab breaks opens, dries and screens the sample at 80 mesh. Approximately 1,000
grams are riffle split, pulverized to -200 mesh. Thirty grams are taken for fire assay. The reject
and pulp portions are returned to the Project and stored in the QAQC compound at the SG1 Zone
compressor building or retained at the TSL
Preparation of the hand dug hole samples from the tailings pond is as follows. The samples are
delivered to the Project’s Assay Lab where the lab inserts their own QAQC into the tailings
sample stream. The samples then are dried are subsequently rolled with a steel rolling pin to
break down any lumps. The samples are then split to size in a Jones riffle. After reducing the size
of the sample to between 200 and 250 grams, they are pulverized for 30 seconds in a ring
pulverizer, rolled and placed in a pulp bag for assaying. Forty grams are taken for fusion.
11.4 SAMPLE QUALITY, REPRESENTATIVENESS AND SAMPLE BIAS
The sampling methods used by Klondex are similar to the current industry
standards for mineralization of this type. P&E recognizes that there exists serious
issues related to gold deposit sampling because of the non-uniform distribution of
gold within the vein systems. P&E does not believe this to be the case in this
instance.
P&E consider that the sampling methods utilized meet NI43-101 standards.

P&E Mining Consultants Inc., Report No. 315 Page 52 of 171
Klondex Canada Ltd. True North Gold Mine
11.5 SAMPLE PREPARATION, ANALYSIS AND SECURITY
11.5.1 Core Sample Preparation and Analysis
The primary independent assay laboratory used by San Gold and Klondex is TSL. When pulps
and rejects are returned by TSL, selected samples are sent by the Company to ALS to cross
check the TSL assay results. TSL and ALS are each ISO/IEC 17025 certified laboratories and
have long histories within the Canadian mining industry. Each laboratory uses similar sample
preparation, analytical methods, and QAQC procedures.
On receipt by TSL, samples are sorted and verified according to the sample submittal form
shipped with the samples by the Company. Security ties on the sample bags are checked with
records sent electronically to TSL and the shipment is assigned a TSL reference number and
worksheet. Sample labels are produced with the client sample number and the TSL reference
number. Sample preparation procedures involve oscillating jaw crushing to 75% -10 mesh. A
1,000-gram sub-sample is riffle split from the -10 mesh sample and pulverized to >95% -150
mesh in a ring mill pulverizer. Between each sample, the crushers, rifflers, and pans are cleaned
with compressed air. Pulverizing pots and rings are brushed, hand cleaned and air blown.
Samples without visible gold are subject to normal fire assay analytical procedures. The gold
concentration is determined for a homogenized 30-gram sample using a fire assay collector and
atomic absorption finish. Samples are assayed in batches of 24, comprised of 20 client samples,
two duplicate client samples, one TSL standard and one TSL blank.
Each sample with visible gold is subject to total metallic and fire assay procedures. The whole
sample is crushed and pulverized to 95% passing 150 mesh. The +150 mesh fraction (including
the sieve cloth) is assayed for the coarse gold content and two 30-gram samples of the -150 mesh
are assayed. The weighted average of the three assays determines the reported assay grade for the
sample.
11.5.2 Channel Chip Sample Preparation and Analysis
Channel chip samples are analyzed by the Project’s Assay Lab at True North. When chip
samples are received in the laboratory, they are sorted and placed into numerical order and the
sample tag number written on the outside of the plastic bag. Wet samples are dried. All
information on the samples received is entered into the logbook.
All dry samples are put through a Rhino Crusher. The crusher reduces the size of the sample to
50% -10 mesh. Crushed samples are reduced in size to approximately 200 grams by splitting,
utilizing the sample riffle until one side contains the 200 gram sample to be pulverized. The
remaining sample (reject) is returned to the original sample bag and stored for 6 months.
All crushed samples are pulverized for 90 seconds in a ring pulverizer to 90% -150 mesh. The
sample pulps are rolled to ensure that they are homogenous and then placed in pulp bags for
assay.
Pulp samples are subject to normal lead fire assay analytical procedures. A 20 gram sample is
placed with 60 millilitres flux in a 30 gram crucible for fusion and fire assay of gold. Klondex
does not insert standards or blanks with the chip samples.

P&E Mining Consultants Inc., Report No. 315 Page 53 of 171
Klondex Canada Ltd. True North Gold Mine
The past production of greater than 1.5 million oz of gold from the True North Gold Mine
supports the validity of the channel sampling and assay procedures. P&E consider the assays to
be accurate. The Project’s Assay Lab inserts a standard with every set of samples and the results
are checked and tracked internally. The Project’s Assay Lab also runs check assays with each
batch of chip samples.
11.5.3 Tailings Sample Preparation and Analysis
The sample cylinders are split by the driller for the geologist. The geologist wearing latex gloves
photographs the sample, and then scoops it from the cylinder into a doubled sample bag using a
spoon. The sample is tagged, the inner bag is rolled down and the outer bag is sealed. After each
hole is completed, the geologist changes gloves and washes the spoon with distilled water.
11.6 CORE QUALITY ASSURANCE & QUALITY CONTROL
A QA/QC program was implemented by San Gold and adopted by Klondex to monitor the
contamination, precision and accuracy at the various stages of core sample analysis. Klondex
systematically inserts sample standards, blanks and duplicates into its sampling stream.
After every 25th
sample, the company inserts a QA/QC control sample alternating between a
standard, a field duplicate and a blank. (Standards are every 25th
sample, Blanks are every 50th
sample or after any noted visual gold, Duplicates are inserted every 20 samples.) When assays
are received, the data are plotted to ensure that all the results are within acceptable limits and any
remediation, if required, is carried out.
11.6.1 Sample Standards
Under Klondex procedures all exploration core is subject to data verification procedures through
the insertion of four blind sample standards at regular intervals in every one hundred samples.
Standards consist of Standard Reference Material (SRM) purchased from CDN Resource
Laboratory Ltd. located in British Columbia, Canada. Four different standards are employed with
contents of gold ranging from low grade to high grade (Table 11.1).
Assay results for the standards are illustrated in Figures 11.2 to 11.5. Results are routinely
reviewed. If the results plot outside the acceptable limits for standards or blanks, the sample
batch is rerun.
TABLE 11.1
CERTIFIED GOLD ASSAY VALUES FOR COMMERCIAL STANDARDS
P&E considers that all potential gold mineralized zones in drill core have been sampled. Security
of the samples at the core logging facility and at the analytical lab appear to be adequate to
ensure the integrity of the samples and assays.
CRM Standard Laboratory Recommended Value (g/t) 2 x StdDev
CDN-GS-1P5C CDN Resource Laboratory Ltd. 1.56 0.13
CDN-GS-6B CDN Resource Laboratory Ltd. 6.45 0.33
CDN-GS-13A CDN Resource Laboratory Ltd. 13.20 0.72
CDN-GS-22 CDN Resource Laboratory Ltd. 22.94 1.12

P&E Mining Consultants Inc., Report No. 315 Page 54 of 171
Klondex Canada Ltd. True North Gold Mine
Figure 11.2 Assay Results of Standard CDN-GS-1P5C
Figure 11.3 Assay Results for Standard CDN-GS-6B

P&E Mining Consultants Inc., Report No. 315 Page 55 of 171
Klondex Canada Ltd. True North Gold Mine
Figure 11.4 Assay Results for Standard CDN-GS-13A
Figure 11.5 Assay Results for Standard CDN-GS-22
11.6.2 Core Sample Blanks and Duplicates
Sample blanks consist of un-mineralized, unaltered and un-deformed drill core from True North.
Two blanks are inserted at regular intervals for every 100 samples. Additional blanks are inserted
after each sample with visible gold. The blanks are employed to monitor contamination during
the sample preparation step in the assay lab.
Review of assay results for 4,178 blanks indicates that only 28 (<0.7%) exceed the upper
threshold assay value set by San Gold of 0.05 opt Au (Figure 11.6). An upper threshold assay
value of 0.02 opt Au is utilized by Klondex. Otherwise, the core sample blank analysis protocols
remain unchanged from those used previously by San Gold.
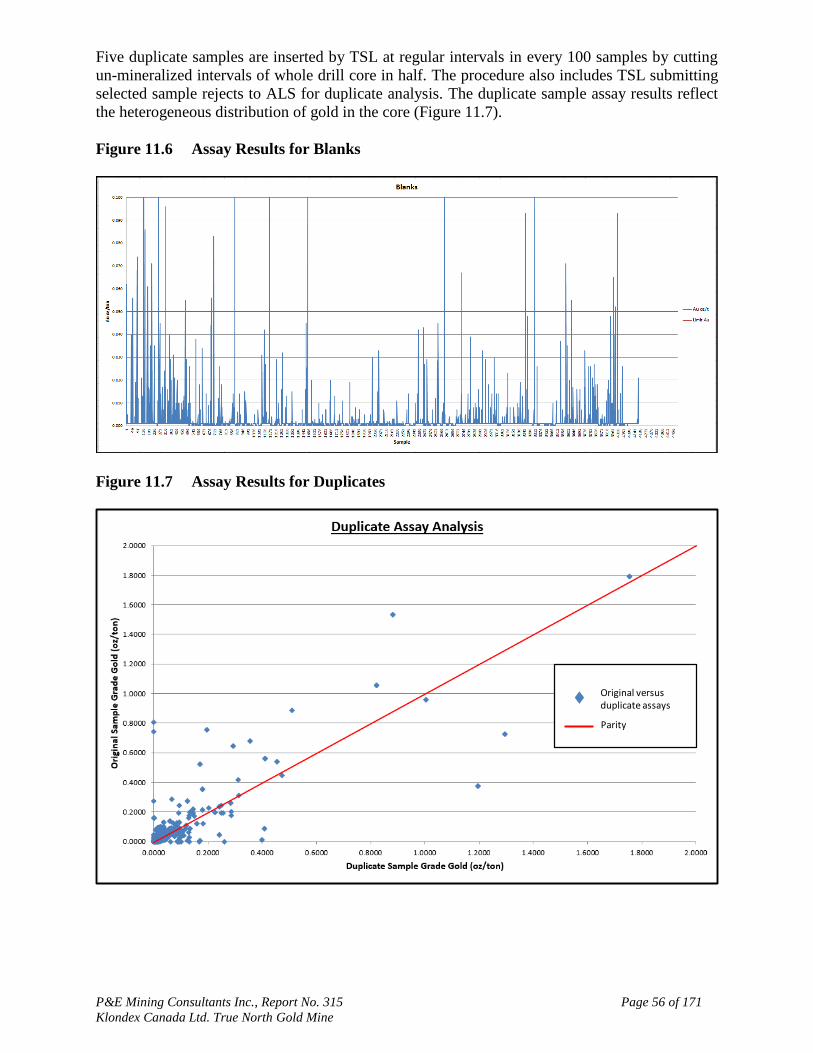
P&E Mining Consultants Inc., Report No. 315 Page 56 of 171
Klondex Canada Ltd. True North Gold Mine
Five duplicate samples are inserted by TSL at regular intervals in every 100 samples by cutting
un-mineralized intervals of whole drill core in half. The procedure also includes TSL submitting
selected sample rejects to ALS for duplicate analysis. The duplicate sample assay results reflect
the heterogeneous distribution of gold in the core (Figure 11.7).
Figure 11.6 Assay Results for Blanks
Figure 11.7 Assay Results for Duplicates
Original versus duplicate assays
Parity

P&E Mining Consultants Inc., Report No. 315 Page 57 of 171
Klondex Canada Ltd. True North Gold Mine
11.7 CHIP QUALITY ASSURANCE & QUALITY CONTROL
11.7.1 Sample Standards
The standards inserted by the Project’s Assay Lab consist of Certified Reference Materials
(SRM) produced by Rocklabs of Auchland, New Zealand and sold in Canada previously by
Anachemia Science and currently by VMR’s mining division (Table 11.2). The standards are
ordered with a sulphur matrix and a gold value of approximately 1 part per million (ppm) to 10
ppm.
Results are routinely reviewed by the Project’s Assay Lab.
TABLE 11.2
CERTIFIED GOLD ASSAY VALUES FOR COMMERCIAL STANDARDS
11.7.2 Chip Sample Duplicates
Duplicate assays are run with every set of chip samples. Assay results for the original samples
versus duplicates are illustrated in Figure 11.8. Results are routinely reviewed by the Projects’s
Assay Lab.
CRM Standard Laboratory Recommended Value (ppm) 95% CI
SG31 Rocklabs 0.996 0.011
SG40 Rocklabs 0.976 0.009
SG66 Rocklabs 1.086 0.009
SK52 Rocklabs 4.107 0.029
SK62 Rocklabs 4.075 0.045
SL61 Rocklabs 5.931 0.057
SN38 Rocklabs 8.576 0.061
SN50 Rocklabs 8.685 0.062
SN60 Rocklabs 8.595 0.073
SN74 Rocklabs 8.981 0.065
SN75 Rocklabs 8.671 0.054

P&E Mining Consultants Inc., Report No. 315 Page 58 of 171
Klondex Canada Ltd. True North Gold Mine
Figure 11.8 Assay Results for Chip Sample Duplicates
11.8 TAILINGS QUALITY ASSURANCE-QUALITY CONTROL
11.8.1 Sample Standards
For QAQC of the historic tailings samples, blind standards are inserted every 25th
sample. The
standards utilized are Canadian Research Lab standards GS-1L, GS-1P5C, and GS-P6 on an
alternating basis. At this stage, the majority of the data are available for GS-1P5C and GS-1L.
Assay results for the standards are illustrated in Figures 11.9 to 11.10. Results are routinely
reviewed. If the results plot outside the acceptable limits for standards and for blanks, the sample
batch is rerun.
11.8.2 Tailings Sample Blanks and Duplicates
Sand blanks are inserted at the sample numbers ending in 40 and 90. The blanks are composed of
beach sand, which has been prepared and assay tested at the Project’s Assay Lab. Assay results
for the blank are illustrated in Figure 11.11. Assay results for duplicates are illustrated in Figure
11.12. Blank and duplicate results are routinely reviewed.
0.000
0.500
1.000
1.500
2.000
2.500
3.000
3.500
4.000
4.500
5.000
0.000 0.500 1.000 1.500 2.000 2.500 3.000 3.500 4.000 4.500 5.000
Ori
gin
al C
hip
Sam
ple
Gra
de
Go
ld (
oz/
ton
)
Duplicate Chip Sample Grade Gold (oz/ton)
Duplicate Chip Assay Analysis

P&E Mining Consultants Inc., Report No. 315 Page 59 of 171
Klondex Canada Ltd. True North Gold Mine
Figure 11.9 Tailings Assay Results for Standard GS-1P5C
Figure 11.10 Tailings Assay Results for Standard GS-1L

P&E Mining Consultants Inc., Report No. 315 Page 60 of 171
Klondex Canada Ltd. True North Gold Mine
Figure 11.11 Tailings Assay Results for Blanks
Figure 11.12 Tailings Assay Results for Duplicates
11.9 RECOMMENDATIONS AND CONCLUSIONS
P&E is of the opinion that the core, channel chip and tailings sample assay data have been
adequately verified for the purposes of a mineral resource estimate. All data included in the
resource estimate appear to be of adequate quality.

P&E Mining Consultants Inc., Report No. 315 Page 61 of 171
Klondex Canada Ltd. True North Gold Mine
Recommendations are as follows:
4) Technical Database: All Project data collected needs to be stored and archived in
a permanent and reliably retrieval manner. A full-time database administrator is
recommended.
5) Quality Assurance/Quality Control: Timely follow-up for any and all QA/QC
assay deviations and re-assay requests should be performed in a timely manner.
The process should be automated when the database is up and running.
6) Sample Storage and Retrieval: Half-core remaining from sample assays should be
retained for reference and check assay purposes. All assay sample rejects and
pulps should be stored in a safe, secure and sheltered manner and properly
catalogued to ease retrieval.
7) Project Assay Lab: Standard operating procedures should be updated, particularly
in regards to assay data generation, storage and retrieval.

P&E Mining Consultants Inc., Report No. 315 Page 62 of 171
Klondex Canada Ltd. True North Gold Mine
12.0 DATA VERIFICATION
This section of the report summarizes the results of P&E’s due diligence for the data verification
for the True North Gold Mine.
12.1 DRILL DATA REVIEW
True North Gold Mine was visited by Dr. Bill Stone, P.Geo., a Qualified Person as defined in
National Instrument NI 43-101 Standards of Disclosure for Mineral Projects. Dr. Stone visited
the Project of three occasions on May 21-25, June 20-23 and September 20-22, 2016. The
categories of data reviewed for the three datasets include collar location surveys, down-hole
surveys, assay results and geology.
12.1.1 Collar Location Checks
Comparison of 130 underground collar survey reports to easting, northing, elevation and hole
length values in the database revealed no errors. Collar locations of the underground holes are
considered to be reliable.
Comparison of 55 surface collar survey reports to easting, northing, elevation and hole length
values in the database revealed no errors. Collar locations for the surface holes are considered to
be reliable.
12.1.2 Hole Survey Checks
Comparison of 51 underground hole borehole survey reports to azimuth and dip values in the
database found no errors. Borehole surveys of the underground holes are considered to be
reliable.
Comparison of 13 surface hole borehole survey reports to azimuth and dip values in the database
found no errors.
12.1.3 Core Assay Checks
P&E conducted verification of the drillhole assay database by comparison of the database entries
with the assay certificates. The assay certificates were obtained in digital format directly from
the assay laboratories and compiled.
Assay data ranging from 2009 through 2016 were verified for the True North Gold Mine.
Approximately 40% (6,220 out of 15,494) of the constrained drilling assay data were checked for
Au against the original laboratory certificates from TSL, ALS, and the Project’s Assay Lab. A
very few minor data errors were observed and corrected, with the overall impact to the database
considered negligible.
12.1.4 Geology Checks
The digital core logging system developed by San Gold has been adapted by Klondex for True
North. In the lithology database, 14,292 intervals logged as 75% or greater quartz were checked
for vein codes. As a result, only <1% of the quartz rich intervals were coded as rock types other
than quartz veins.

P&E Mining Consultants Inc., Report No. 315 Page 63 of 171
Klondex Canada Ltd. True North Gold Mine
Many of these intervals are coded as chert or cherty sediments, or structures such as faults and
shear zones that are commonly associated with quartz veins. In addition, 6,728 intervals logged
as shears or shear zones in the structure database were also checked and only a single error was
found.
12.2 CHANNEL CHIP DATA REVIEW
12.2.1 Collar Location Checks
The location of the channels on the original face map sheets and the Klondex database show
positive correlation.
12.2.2 Down Hole Survey Checks
The location of the channel chip samples on the face map sheets and the database show positive
correlation.
12.2.3 Assays Checks
P&E conducted verification of the channel chip database by comparison of the database entries
with the assay certificates. The assay certificates were obtained in digital format directly from
the assay laboratories and compiled.
Assay data ranging from 2009 through 2016 were verified for the True North Gold Mine.
Approximately 66% (3,739 out of 5,697) of the constrained chip channel assay data were
checked for Au against the original laboratory certificates from the Project’s Assay Lab. A very
few minor data errors were observed and corrected, with the overall impact to the database
considered negligible.
12.3 TAILINGS DATA REVIEW
Tailings sample procedures are described in Section 10.3 of this report. All the holes are located
by differential GPS and are vertical. Sand and clay lithological units >0.5 feet thick are logged.
12.3.1 Assays Checks
P&E conducted verification of the tailings assay databases by comparison of the database entries
with the assay certificates. The assay certificates were obtained in digital format directly from
the assay laboratories and compiled. Approximately 87% (882 out of 1,012) of the tailings assay
data were checked for Au against the original laboratory certificates from TSL, ACME and the
Projects’s Assay Lab. A very few minor data errors were observed and corrected, with the
overall impact to the database considered negligible.

P&E Mining Consultants Inc., Report No. 315 Page 64 of 171
Klondex Canada Ltd. True North Gold Mine
12.4 DUE DILIGENCE SAMPLING
Data verification assays were carried out for three separate batches of samples:
Pulp samples of diamond core from 14 drillholes of three mineralized zones;
Half-core samples of diamond core from 6 drillholes of three mineralized zones;
and
Rejects of 20 samples from the tailings pond.
As part of the due diligence, sampled intervals of a variety of low grade, average grade, and high
grade mineralized material. Selected core intervals were sampled by taking the entire pulp
sample or the entire half core, whichever was available.
For due diligence of the historic tailings, samples were selected from stored sample bags. The
bagged materials were sampled by taking half or the entire sample, whichever was available.
Prior to sampling, employees or other associates of Klondex were not informed of the location or
identification of any of the samples to be collected. The objective of these check samples was to
verify the presence and approximate grades of gold encountered during drilling, rather than to
provide exhaustive independent verification of the original assay results.
The samples were collected by Dr. Stone or under his direct supervision. They were placed by
Dr. Stone in appropriately numbered sample bags with pre-packaged standards, sealed in rice
bags with lock ties and packing tape, and taken by him to Burlington for courier transport to the
P&E office in Brampton, Ontario. From there, the samples were sent by courier to AGAT
Laboratories Ltd. (AGAT) in Mississauga, Ontario for analysis. Gold was analyzed by fire assay
on a 30 gram aliquot with an AAS finish. Samples yielding values >10 g/t Au were re-assayed
and quantitatively determined by the gravimetric method.
AGAT employs a quality assurance system to ensure the precision, accuracy and reliability of all
results. The best practices have been documented and are consistent with:
The International Organization for Standardization’s ISO/IEC 17025, “General
Requirements for the Competence of Testing and Calibration Laboratories' and
the ISO 9000 series of Quality Management standards”;
All principles of Total Quality Management (TQM);
All applicable safety, environmental and legal regulations and guidelines;
Methodologies published by the American Society for Testing and Materials
(ASTM), National Institute for Occupations Safety and Health (NIOSH), United
States Environmental Protection Agency (EPA) and other reputable organizations;
and
The best practices of other industry leaders.

P&E Mining Consultants Inc., Report No. 315 Page 65 of 171
Klondex Canada Ltd. True North Gold Mine
Figure 12.1 Due Diligence Sample Pulp Results for Gold
P&E’s independent comparisons of the core sample verification results to the original assay
results are illustrated in Figures 12.1 and 12.2. The P&E results for the pulps are satisfactory, but
those for cores exhibit a low bias consistent with what could be anticipated for different sample
volumes of a relatively heterogeneous sample from a high-grade, narrow vein gold deposit like
True North.
Figure 12.2 Due Diligence Sample Core Results for Gold
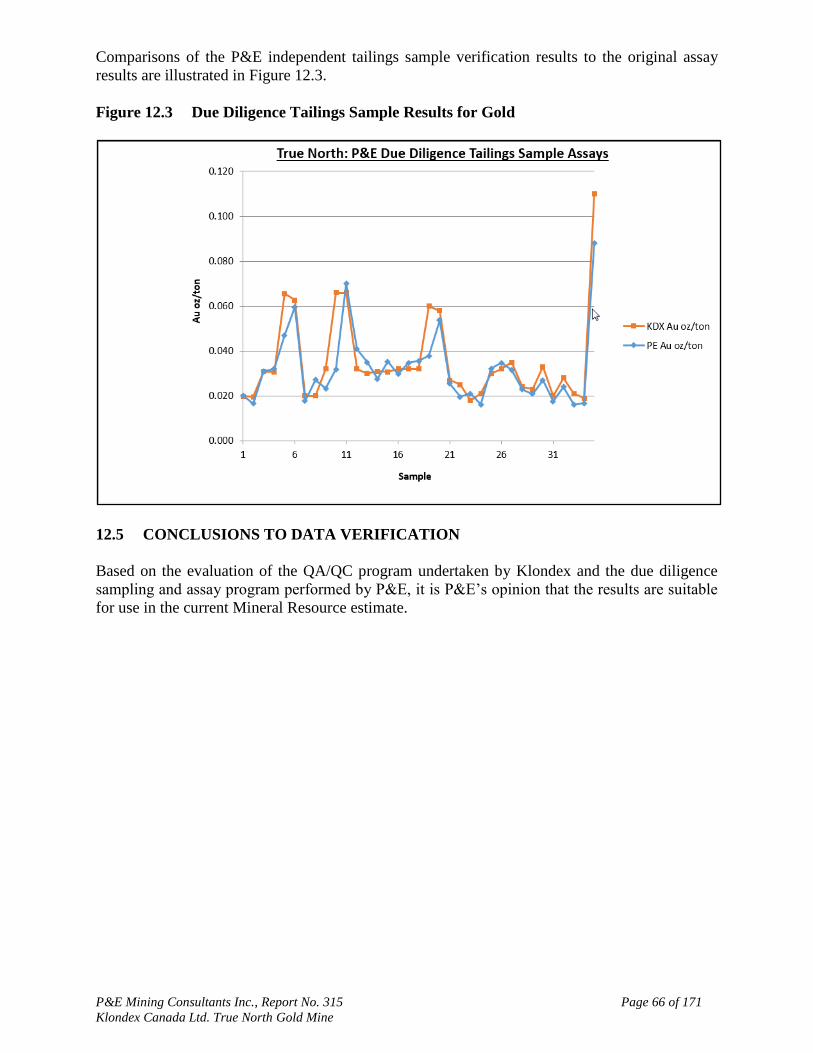
P&E Mining Consultants Inc., Report No. 315 Page 66 of 171
Klondex Canada Ltd. True North Gold Mine
Comparisons of the P&E independent tailings sample verification results to the original assay
results are illustrated in Figure 12.3.
Figure 12.3 Due Diligence Tailings Sample Results for Gold
12.5 CONCLUSIONS TO DATA VERIFICATION
Based on the evaluation of the QA/QC program undertaken by Klondex and the due diligence
sampling and assay program performed by P&E, it is P&E’s opinion that the results are suitable
for use in the current Mineral Resource estimate.

P&E Mining Consultants Inc., Report No. 315 Page 67 of 171
Klondex Canada Ltd. True North Gold Mine
13.0 MINERAL PROCESSING AND METALLURGICAL TESTING
Mining and ore processing has been carried out at True North intermittently since the early
1930’s. The original process used a gravity concentration step and whole-ore cyanidation using
Merrill Crowe gold precipitation. Recoveries with this original plant and process were generally
96%.
In 1980, the original process plant was destroyed by fire except for the crushing plant and fine
ore bin feed conveyor. A new process plant was constructed with the same throughput as the
original; however, the process was changed to incorporate gravity concentration and a bulk
sulphide flotation process.
It was found that by floating the sulphides, a “throwaway: tail” could be achieved. The
concentrate was reground and upgraded through a cleaner circuit and filtered. The high grade
concentrate was then shipped to a local smelter. Recovery using this process was generally 93%.
In the mid-1990’s, the mine was restarted and the process plant was expanded by adding a larger
12.5 foot x 14 foot (3.8m x 4.3m) grinding mill and a cyanide leach circuit for concentrate
leaching. The operation was short lived.
In 1998, the operation was restarted again and this time ran for three years at a rate of 1,000
tonnes (907 tonnes) per day. The process used two-stage crushing followed by grinding,
concentration using a centrifugal concentrator, and a bulk sulphide flotation process. This
flotation concentrate was reground and sent to a leach/CIP gold recovery plant. The carbon was
eluted using a conventional pressure strip followed by electrowinning and subsequent refining.
Recovery for the period was calculated as generally 92%.
TABLE 13.1
HARMONY GOLD – RICE LAKE DEPOSIT METALLURGICAL RESULTS
Tons Milled
1990’s
Gravity
(oz. Au)
EW
(oz. Au)
Gold Prod’n
(oz. Au)
Overall Loss
(oz. Au)
Calc. Grade
(opt Au)
Gravity
Recovery
Overall
Recovery
994,830 58,198 91,297 149,496 13,304 0.164 35.75% 91.83%
When the Hinge Zone was developed, a 3,700 ton (3,357 tonne) bulk sample was treated through
the process circuit with no changes having been made to that process. Recovery from this bulk
sample was generally 92%. Subsequent samples were processed in May and June of 2009 with
recoveries at 96.6% and 97.2% respectively, not shown.
TABLE 13.2
HINGE ZONE METALLURGICAL RESULTS
Tons Milled Gravity
(oz. Au)
EW
(oz. Au)
Gold Prod’n
(oz. Au)
Overall Loss
(oz. Au)
Calc. Grade
(opt Au)
Gravity
Recovery
Overall
Recovery
154,229 6,712 16,608 23,320 1,826 .163 27.30% 92.74%
27,543 742 3,385 4,127 348 .162 16.59% 92.23%
258,469 10,462 21,418 31,880 2,605 .133 27.61% 92.45%
In August 2010, the first bulk sample from the 007 Zone ore was processed. This represented
6,245 tons (5,667 tonnes) grading 0.139 opt Au (4.77 g/t Au) gold with a general recovery of
92%. Additional samples in the months of September and October of 2010 yielded recoveries
between 95% and 92%, not shown. Current process plant recovery from all ore is 93.3%, not
shown.

P&E Mining Consultants Inc., Report No. 315 Page 68 of 171
Klondex Canada Ltd. True North Gold Mine
TABLE 13.3
007 ZONE METALLURGICAL RESULTS
Tons
Processed
Gravity
(oz. Au)
EW
(oz. Au)
Gold Prod’n
(oz. Au)
Overall Loss
(oz. Au)
Calc. Grade
(opt Au)
Gravity
Recovery
Overall
Recovery
24,734 1,015 1,944 2,959 270 0.131 65.78% 91.65%
248,475 17,782 27,716 45,498 3,026 0.195 36.65% 93.76%
Although current operations employ a conventional ball mill as a primary grinding unit, the
potential of Semi-Autogenous Grinding (SAG) milling was investigated. Samples of both True
North and Hinge Zone mineralized material were sent to both SGS Mineral Services’ Lakefield
Laboratory (SGS Lakefield) and Starkey & Associates Inc. (Starkey Associates) for testing.
Results are listed below.
TABLE 13.4
SGS LAKEFIELD AND STARKEY ASSOCIATES SAG MILL TESTING RESULTS
Sample
Name
Relative
Density
JK
Parameters
MacPherson
Test
Work Indices
(kWh/t)
A x b ta (kg/h) (kWh/t) AWI RWI BWI
Rice Lake
Ore 2.77 74.5 0.34 9.7 8.2 13.9 15.7 14.9
Hinge Ore 2.71 64.4 .038 10.9 7.5 14.5 13.2 16.7
TABLE 13.5
JKTECH DROP-WEIGHT TEST SUMMARY
Sample
Name A b A x b
Hardness
Percentile ta
Hardness
Percentile
Relative
Density
Rice Lake
Ore 61.7 0.77 47.5 50 0.34 73 2.77
Hinge Ore 91.9 1.04 64.4 30 0.38 65 2.71
Table 13.6 shows additional SGS Lakefield and Starkey & Associates SAG Mill Testing Results.
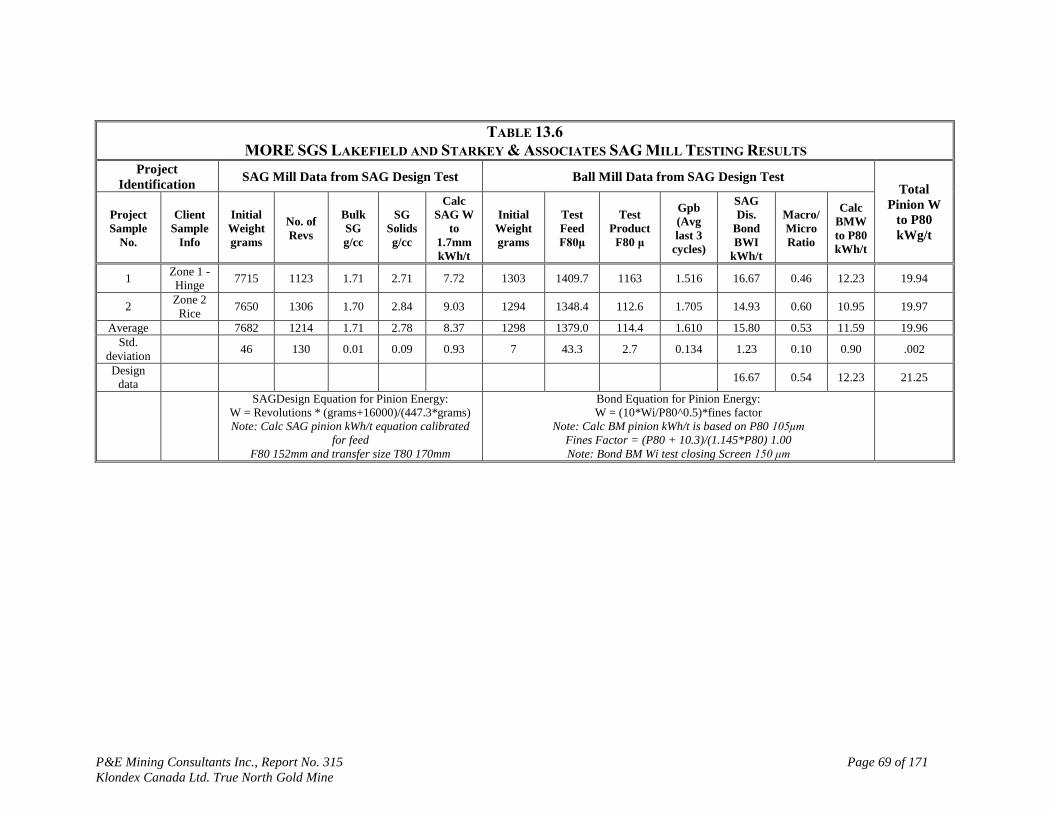
P&E Mining Consultants Inc., Report No. 315 Page 69 of 171
Klondex Canada Ltd. True North Gold Mine
TABLE 13.6
MORE SGS LAKEFIELD AND STARKEY & ASSOCIATES SAG MILL TESTING RESULTS
Project
Identification SAG Mill Data from SAG Design Test Ball Mill Data from SAG Design Test
Total
Pinion W
to P80
kWg/t
Project
Sample
No.
Client
Sample
Info
Initial
Weight
grams
No. of
Revs
Bulk
SG
g/cc
SG
Solids
g/cc
Calc
SAG W
to
1.7mm
kWh/t
Initial
Weight
grams
Test
Feed
F80μ
Test
Product
F80 μ
Gpb
(Avg
last 3
cycles)
SAG
Dis.
Bond
BWI
kWh/t
Macro/
Micro
Ratio
Calc
BMW
to P80
kWh/t
1 Zone 1 -
Hinge 7715 1123 1.71 2.71 7.72 1303 1409.7 1163 1.516 16.67 0.46 12.23 19.94
2 Zone 2
Rice 7650 1306 1.70 2.84 9.03 1294 1348.4 112.6 1.705 14.93 0.60 10.95 19.97
Average 7682 1214 1.71 2.78 8.37 1298 1379.0 114.4 1.610 15.80 0.53 11.59 19.96
Std.
deviation 46 130 0.01 0.09 0.93 7 43.3 2.7 0.134 1.23 0.10 0.90 .002
Design
data 16.67 0.54 12.23 21.25
SAGDesign Equation for Pinion Energy:
W = Revolutions * (grams+16000)/(447.3*grams)
Note: Calc SAG pinion kWh/t equation calibrated
for feed
F80 152mm and transfer size T80 170mm
Bond Equation for Pinion Energy:
W = (10*Wi/P80^0.5)*fines factor
Note: Calc BM pinion kWh/t is based on P80 105μm
Fines Factor = (P80 + 10.3)/(1.145*P80) 1.00
Note: Bond BM Wi test closing Screen 150 μm

P&E Mining Consultants Inc., Report No. 315 Page 70 of 171
Klondex Canada Ltd. True North Gold Mine
In 2012 several flotation tails samples were leached in cyanide to understand the potential need
for building a flotation tails leach circuit at the Project. The samples were tested during two test
programs with both programs employing a 24-hour leach on as-received samples at a pH above
10.0. The first program used a cyanide concentration of 2.5 grams per litre cyanide (gpl NaCN)
and the second program a concentration of 0.5 gpl NaCN. The results of these two programs are
summarized in the tables below:
TABLE 13.7
RESULTS LEACHING FLOTATION TAILS FOR 24 HOURS AT 2.5 GPL NACN CONCENTRATION
Date Sampled Calc. Head, opt Au % Recovery opt Recoverable Gold
10/09/12 0.0100 90.04% 0.0090
10/10/12 0.0062 84.00% 0.0052
10/11/12 0.0074 86.52% 0.0064
10/12/12 0.0071 85.96% 0.0061
10/13/12 0.0100 90.04% 0.0090
10/14/12 0.0086 88.35% 0.0076
10/15/12 0.0119 66.31% 0.0079
10/16/12 0.0157 55.55% 0.0087
10/17/12 0.0071 85.96% 0.0061
10/18/12 0.0081 75.38% 0.0061
10/19/12 0.0083 87.94% 0.0073
10/20/12 0.0092 89.09% 0.0082
10/21/12 0.0095 89.43% 0.0085
10/22/12 0.0077 87.03% 0.0067
10/23/12 0.0077 87.03% 0.0067
10/24/12 0.0083 87.94% 0.0073
10/25/12 0.0105 85.77% 0.0090
10/26/12 0.0271 87.10% 0.0236
10/27/12 0.0103 90.32% 0.0093
10/28/12 0.0095 94.76% 0.0090
10/30/12 0.0071 85.96% 0.0061
10/31/12 0.0088 82.94% 0.0073
11/01/12 0.0065 76.77% 0.0050
11/02/12 0.0097 89.74% 0.0087
Avg. 0.0097 84.58% 0.0081
TABLE 13.8
RESULTS LEACHING FLOTATION TAILS FOR 24 HOURS AT 0.5 GPL NACN CONCENTRATION
Date Sampled Calc. Head, opt Au % Recovery opt Recoverable Gold
11/08/12 0.0060 83.22% 0.0050
11/09/12 0.0045 77.78% 0.0035
11/12/12 0.0054 81.39% 0.0044
11/14/12 0.0060 83.22% 0.0050
11/15/12 0.0067 70.00% 0.0047
11/16/12 0.0070 71.25% 0.0050
11/17/12 0.0093 78.47% 0.0073
11/18/12 0.0065 84.71% 0.0055
11/19/12 0.0080 87.50% 0.0070

P&E Mining Consultants Inc., Report No. 315 Page 71 of 171 Klondex Canada Ltd. True North Gold Mine
TABLE 13.8 RESULTS LEACHING FLOTATION TAILS FOR 24 HOURS AT 0.5 GPL NACN
CONCENTRATION Date Sampled Calc. Head, opt Au % Recovery opt Recoverable Gold
11/16/12 0.0070 71.25% 0.0050 11/17/12 0.0093 78.47% 0.0073 11/18/12 0.0065 84.71% 0.0055 11/19/12 0.0080 87.50% 0.0070 11/20/12 0.0092 89.09% 0.0082 11/21/12 0.0068 85.36% 0.0058 11/22/12 0.0086 88.35% 0.0076 11/23/12 0.0080 87.50% 0.0070 11/24/12 0.0080 87.50% 0.0070 11/25/12 0.0092 89.09% 0.0082 11/26/12 0.0092 89.09% 0.0082 11/29/12 0.0118 91.52% 0.0108 11/29/12 0.0210 57.05% 0.0120 11/29/12 0.0117 74.47% 0.0087 11/30/12 0.0176 94.33% 0.0166 12/01/12 0.0060 83.22% 0.0050 12/02/12 0.0085 58.62% 0.0050 12/03/12 0.0068 85.36% 0.0058 12/04/12 0.0089 88.73% 0.0079 12/13/12 0.0071 85.96% 0.0061 12/14/12 0.0071 85.96% 0.0061 12/15/12 0.0054 81.39% 0.0044 12/16/12 0.0097 89.74% 0.0087 12/17/12 0.0100 90.04% 0.0090 12/18/12 0.0089 88.73% 0.0079 12/19/12 0.0092 89.09% 0.0082 12/20/12 0.0083 87.94% 0.0073 12/21/12 0.0080 87.50% 0.0070 12/22/12 0.0086 71.01% 0.0061 12/23/12 0.0146 89.74% 0.0131 12/24/12 0.0124 91.92% 0.0114 12/27/12 0.0074 86.52% 0.0064 12/28/12 0.0065 84.71% 0.0055 12/29/12 0.0074 86.52% 0.0064 12/30/12 0.0098 59.32% 0.0058 12/31/12 0.0067 85.05% 0.0057
Avg. 0.0087 82.91% 0.0072 Solid samples have been collected from the tailings storage facility and leached to document potential recoverable gold present. Three as-received samples were leached for 72 hours with 1.0 gpl NaCN concentration at a pH of above 10.0. Results from these three tests are given in the table below:

P&E Mining Consultants Inc., Report No. 315 Page 72 of 171 Klondex Canada Ltd. True North Gold Mine
TABLE 13.9 RESULTS FROM LEACHING SAMPLES FROM TAILINGS STORAGE FACILITY Sample Calc. Head, opt Au % Recovery, 24 hr test % Recovery, 72 hr
1 0.0408 80.1% 85.4% 2 0.0204 67.7% 72.4% 3 0.0408 78.1% 85.8%

P&E Mining Consultants Inc., Report No. 315 Page 73 of 171
Klondex Canada Ltd. True North Gold Mine
14.0 MINERAL RESOURCE ESTIMATE
14.1 INTRODUCTION
The Mineral Resource estimate presented herein has been prepared following the guidelines of
the Canadian Securities Administrators’ National Instrument 43-101 and Form 43-101F1 and in
conformity with generally accepted “CIM Estimation of Mineral Resource and Mineral Reserves
Best Practices” guidelines. Mineral Resources have been classified in accordance with the “CIM
Standards on Mineral Resources and Reserves: Definition and Guidelines”:
Measured Mineral Resource: “A ‘Measured Mineral Resource’ is that part of a mineral resource
for which quantity, grade or quality, densities, shape, and physical characteristics are so well
established that they can be estimated with confidence sufficient to allow the appropriate
application of technical and economic parameters, to support production planning and evaluation
of the economic viability of the deposit. The estimate is based on detailed and reliable
exploration, sampling and testing information gathered through appropriate techniques from
locations such as outcrops, trenches, pits, workings and drillholes that are spaced closely enough
to confirm both geological and grade continuity.”
Indicated Mineral Resource: “An ‘Indicated Mineral Resource’ is that part of a mineral resource
for which quantity, grade or quality, densities, shape and physical characteristics, can be
estimated with a level of confidence sufficient to allow the appropriate application of technical
and economic parameters, to support mine planning and evaluation of the economic viability of
the deposit. The estimate is based on detailed and reliable exploration and testing information
gathered through appropriate techniques from locations such as outcrops, trenches, pits,
workings and drillholes that are spaced closely enough for geological and grade continuity to be
reasonably assumed.”
Inferred Mineral Resource: “An ‘Inferred Mineral Resource’ is that part of a mineral resource for
which quantity and grade or quality can be estimated on the basis of geological evidence and
limited sampling and reasonably assumed, but not verified, geological and grade continuity. The
estimate is based on limited information and sampling gathered through appropriate techniques
from locations such as outcrops, trenches, pits, workings and drillholes.”
Mineral Resources are not Mineral Reserves and do not have demonstrated economic viability.
There is no guarantee that all or any part of the Mineral Resource will be converted into Mineral
Reserve. Confidence in the estimate of Inferred Mineral Resources is insufficient to allow the
meaningful application of technical and economic parameters or to enable an evaluation of
economic viability worthy of public disclosure.
All Mineral Resource estimation work reported herein was carried out or reviewed by Fred
Brown, P.Geo., an independent Qualified Person as defined by NI 43-101 by reason of
education, affiliation with a professional association and past relevant work experience. This
Mineral Resource estimate is based on information and data supplied by Klondex.
Mineral Resource modelling and estimation were carried out using Maptek Vulcan (version
9.1.8) and Snowden Supervisor (version 7.10.11) software programs.
The effective date of this mineral resource estimate is June 30, 2016.

P&E Mining Consultants Inc., Report No. 315 Page 74 of 171
Klondex Canada Ltd. True North Gold Mine
14.2 PREVIOUS RESOURCE ESTIMATES
Previous public Mineral Resource estimates for portions of the True North deposits have been
reported in 2010 and 2013.1 Historically, in excess of 70 mineralized Au bearing veins have been
identified, of which only 36 are included in the mineral resource estimates that are the subject of
this report. Klondex has identified an additional five veins not included in this report for possible
conversion to mineral resources in the near future.
P&E notes that all previous mineral resource estimates for the True North deposits are
superseded by this report.
14.3 DATA SUPPLIED
Sample data were provided electronically by Klondex. Distance units are reported in feet, and
assay grade units are reported as ounce per short ton. The supplied drilling database contains
7,746 unique collar records and 335,973 assay records (Table 14.1). A total of 6,526 drillhole
assay records are reported at zero grade. The chip sample database contains 28,763 unique collar
records and 106,322 assay records. A total of 1,817 chip assay records are reported at zero grade.
TABLE 14.1
TRUE NORTH DATABASE RECORDS
Data Type Record Count Total Footage Total Metres
Drillhole Samples 335,973 699,496.2 213,206.4
Chips 28,763 243,940.6 74,353.1
Total 364,736 943,436.8 287,559.5
Industry standard validation checks were completed on the supplied databases, and minor
corrections made where necessary. P&E typically validates a mineral resource database by
checking for inconsistencies in naming conventions or analytical units, duplicate entries, interval,
length or distance values less than or equal to zero, blank or zero-value assay results, out-of-
sequence intervals, intervals or distances greater than the reported drillhole length, inappropriate
collar locations, and missing interval and coordinate fields. A small number of trivial errors were
noted and corrected, including three drillhole assay overlapping sample intervals and nine
duplicate chip sample intervals.
No significant discrepancies with the supplied data were noted, and P&E considers that the
databases are suitable for mineral resource estimation.
1 George PT (2010). Technical report mineral reserves, mineral resources and economic assessment, Rice Lake
Project, Rice Lake Greenstone Belt, Bissett, Manitoba. Technical report for SanGold Corporation released on
SEDAR with an effective date of June 30, 2010.
Ginn D and Michaud M (2013). Technical report on the Rice Lake Mining Complex, Bissett, Manitoba. Technical
report for SanGold Corporation released on SEDAR with an amended effective date of February 25, 2013.

P&E Mining Consultants Inc., Report No. 315 Page 75 of 171
Klondex Canada Ltd. True North Gold Mine
14.4 BULK DENSITY
Klondex supplied a total of 6,193 bulk density measurements, with an average value of 0.086
tons per cubic foot (2.76 tonnes per cubic metre [t/m3]) (Table 14-2). Bulk density was
determined by immersion of dried core samples in distilled water.
No correlation between assay grade and bulk density was noted by P&E. The average reported
bulk density of 0.086 short tons per cubic foot; 11.7 cubic feet per short ton (2.76 t/m3) was used
for Mineral Resource estimation.
TABLE 14.2
BULK DENSITY STATISTICS
Tonnes per cubic metre tons per cubic foot
Minimum 2.30 0.072
Maximum 4.14 0.129
Average 2.76 0.086
Median 2.75 0.086
Mode 2.74 0.086
Standard Deviation 0.08 0.002
Number of Samples 6,193
14.5 VEIN MODELLING
The updated P&E Mineral Resource estimate is based on 36 modelled veins, with a total volume
on the order of 271 million cubic feet. See Figures 14.1 and 14.2.
Figure 14.1 Plan View of Modelled Veins
Note: Not all veins are shown
0 2,500 5,000 7,500 10,0001,250Feet
v200
v210

P&E Mining Consultants Inc., Report No. 315 Page 76 of 171
Klondex Canada Ltd. True North Gold Mine
Figure 14.2 3D View of Modelled Veins and Drilling
Vein models were developed by Klondex based on a scripted grid modelling workflow using
Maptek Vulcan software. Grid modelling is applicable to modelling narrow, continuous
geological features such as precious metal veins and coal seams and creates a surface by
interpolating a regular grid of points over a modelling area. These grid points are combined with
the input intercepts to create output triangulated surfaces that represent the vein hanging wall and
footwall contacts. The contacts are combined to create a valid solid triangulation for use in
building the resource block model. See vein modelling cross sections for V91, V710 and V711 in
Appendix III.
The modelling methodology as implemented by Klondex can be summarized as follows:2
Set the vein to be modelled, its overall dip and dip direction, and the drillhole and
channel databases to be used.
Extract the hanging wall (HW) and footwall (FW) vein intercepts from the
drillhole and channel databases.
Combine interpreted or surveyed HW and FW points to control the vein model
interpretation where required.
Use the dip and dip direction settings to rotate the intercepts to a local flat plane.
2 Anthony Bottrill, Klondex Corporate Resources Manager, personal communication August 16, 2016 .

P&E Mining Consultants Inc., Report No. 315 Page 77 of 171
Klondex Canada Ltd. True North Gold Mine
Use inverse distance to contour HW and FW grid surfaces from the input data and
perform grid mathematics to ensure HW grid points are always above FW grid.
Create a triangulation of the HW contact that combines the grid model points with
the input intercepts to ensure the final surface is snapped to the input data. Repeat
this process for the FW contact. Model specific settings are attached as attributes
to the triangulations and also written to a text file for future auditing. Where chip
samples are present, chip sampling may override drillhole sampling in generating
the vein model as drillhole intercepts may be found to be locally inaccurate.
Drillholes to be ignored are flagged to allow chip samples will take precedence
over drilling.
Produce boundary polygons of the vein contact surfaces to create a boundary
triangulation that can be appended to the vein contacts to create a valid solid
triangulation.
Un-rotate the triangulations and intercepts back to their true spatial location.
Clip the solid vein triangulation to the topography and other vein surfaces as
required.
Build the vein block model. The block model specifications are read directly from
the vein extents and overall dip and dip direction used in the vein model creation
process. Block sizes along strike and down dip are set to 5.0 foot by 5.0 foot
(1.5m by 1.5m) to represent local variations in orientation of the vein. Block sizes
across the thickness of the vein are designated as a single block across the true
width of the vein to a minimum thickness resolution of 0.2 foot (0.06m) This
ensures the local vein orientations and volumes are representative and also
rationalizes the size of the final block model.
The modelling technique as implemented by Klondex produces a series of valid
triangulated wireframes oriented to the plane of the vein, as well as a
corresponding rotated and plunging block model for each vein. The block model
corresponding to the vein has constant strike and dip dimensions of 5.0 foot
(1.5m), and a variable vein thickness perpendicular to strike.
P&E has reviewed the 36 resulting wireframes and considers them to be suitable for mineral
resource estimation. The vein wireframes were used for sample coding, statistical analysis and
compositing limits (Table 14.3). See resource wireframes for V91, V710 and V711 veins in
Appendix II.
P&E recommends that alternative estimation techniques, such as utilizing accumulation with a
fixed-height block model, be considered as a check on the seam-based model output.
TABLE 14.3
MODELLED VEINS
Vein Wireframe Volume
(cubic feet) Wireframe tons
v072 4,388,991 377,453
v1010 14,507,150 1,247,615
v1011 1,547,129 133,053
v1012 1,170,844 100,693
v1020 5,974,179 513,779
v1030 12,788,126 1,099,779
v1040 239,926 20,634

P&E Mining Consultants Inc., Report No. 315 Page 78 of 171
Klondex Canada Ltd. True North Gold Mine
TABLE 14.3
MODELLED VEINS
Vein Wireframe Volume
(cubic feet) Wireframe tons
v1300 4,291,264 369,049
v1305 1,115,306 95,916
v1310 2,079,014 178,795
v1320 1,542,305 132,638
v1330 774,116 66,574
v1331 567,757 48,827
v200 25,549,080 2,197,221
v210 11,320,757 973,585
v400 8,079,136 694,806
v62 696,313 59,883
v63 3,425,009 294,551
v700 12,088,160 1,039,582
v710 12,693,819 1,091,668
v711 8,080,407 694,915
v713 2,114,464 181,844
v714 2,082,142 179,064
v730 12,526,653 1,077,292
v731 2,482,616 213,505
v732 1,115,264 95,913
v800 5,977,193 514,039
v810 7,359,619 632,927
v820 2,105,643 181,085
v84 5,863,299 504,244
v86 3,988,093 342,976
v91 3,501,065 301,092
vCW2 6,389,382 549,487
vCW3 7,081,996 609,052
vCW4 11,431,644 983,121
vSG1 64,501,083 5,547,093
TOTAL 271,438,943 23,343,749
14.6 ASSAY DATA
Summary assay statistics were calculated separately by vein for drill-hole assay samples (Table
14.4) and chip assay samples (Table 14.5). Chip sample strings have been converted to pseudo-
drill-holes.
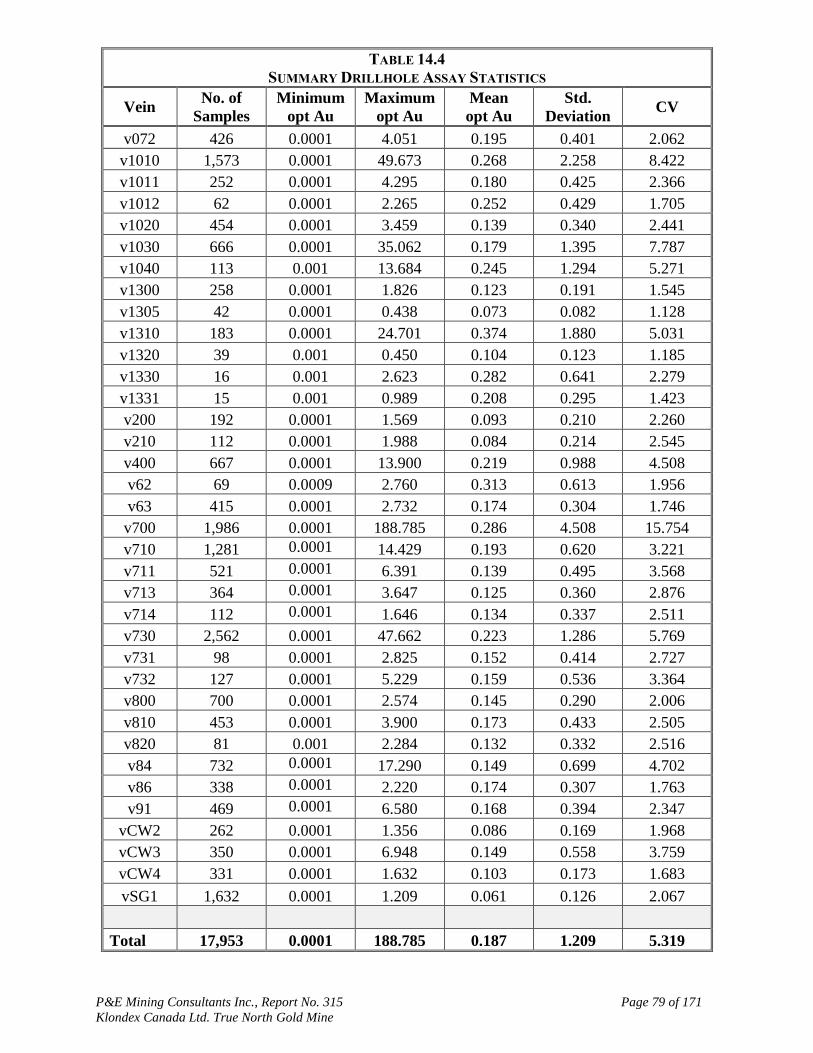
P&E Mining Consultants Inc., Report No. 315 Page 79 of 171
Klondex Canada Ltd. True North Gold Mine
TABLE 14.4
SUMMARY DRILLHOLE ASSAY STATISTICS
Vein No. of
Samples
Minimum
opt Au
Maximum
opt Au
Mean
opt Au
Std.
Deviation CV
v072 426 0.0001 4.051 0.195 0.401 2.062
v1010 1,573 0.0001 49.673 0.268 2.258 8.422
v1011 252 0.0001 4.295 0.180 0.425 2.366
v1012 62 0.0001 2.265 0.252 0.429 1.705
v1020 454 0.0001 3.459 0.139 0.340 2.441
v1030 666 0.0001 35.062 0.179 1.395 7.787
v1040 113 0.001 13.684 0.245 1.294 5.271
v1300 258 0.0001 1.826 0.123 0.191 1.545
v1305 42 0.0001 0.438 0.073 0.082 1.128
v1310 183 0.0001 24.701 0.374 1.880 5.031
v1320 39 0.001 0.450 0.104 0.123 1.185
v1330 16 0.001 2.623 0.282 0.641 2.279
v1331 15 0.001 0.989 0.208 0.295 1.423
v200 192 0.0001 1.569 0.093 0.210 2.260
v210 112 0.0001 1.988 0.084 0.214 2.545
v400 667 0.0001 13.900 0.219 0.988 4.508
v62 69 0.0009 2.760 0.313 0.613 1.956
v63 415 0.0001 2.732 0.174 0.304 1.746
v700 1,986 0.0001 188.785 0.286 4.508 15.754
v710 1,281 0.0001 14.429 0.193 0.620 3.221
v711 521 0.0001 6.391 0.139 0.495 3.568
v713 364 0.0001 3.647 0.125 0.360 2.876
v714 112 0.0001 1.646 0.134 0.337 2.511
v730 2,562 0.0001 47.662 0.223 1.286 5.769
v731 98 0.0001 2.825 0.152 0.414 2.727
v732 127 0.0001 5.229 0.159 0.536 3.364
v800 700 0.0001 2.574 0.145 0.290 2.006
v810 453 0.0001 3.900 0.173 0.433 2.505
v820 81 0.001 2.284 0.132 0.332 2.516
v84 732 0.0001 17.290 0.149 0.699 4.702
v86 338 0.0001 2.220 0.174 0.307 1.763
v91 469 0.0001 6.580 0.168 0.394 2.347
vCW2 262 0.0001 1.356 0.086 0.169 1.968
vCW3 350 0.0001 6.948 0.149 0.558 3.759
vCW4 331 0.0001 1.632 0.103 0.173 1.683
vSG1 1,632 0.0001 1.209 0.061 0.126 2.067
Total 17,953 0.0001 188.785 0.187 1.209 5.319

P&E Mining Consultants Inc., Report No. 315 Page 80 of 171
Klondex Canada Ltd. True North Gold Mine
TABLE 14.5
SUMMARY CHIP ASSAY STATISTICS
Vein No. of
Samples
Minimum
opt Au
Maximum
opt Au
Mean
opt Au
Std.
Deviation CV
v064 7 0.260 1.000 0.569 0.293 0.515
v065 10 0.030 0.720 0.250 0.241 0.964
v072 833 0.000 23.020 0.485 1.368 2.822
v1010 1,370 0.000 45.835 0.258 1.427 5.541
v1011 211 0.001 3.477 0.218 0.488 2.242
v1013 17 0.003 0.634 0.103 0.152 1.476
v1020 337 0.001 7.753 0.211 0.538 2.544
v1030 830 0.000 5.188 0.184 0.406 2.208
v1040 12 0.001 0.052 0.008 0.016 2.002
v11020 1 0.067 0.067 0.067 0.000 0.000
v1300 17 0.020 0.510 0.158 0.138 0.870
v1310 468 0.001 48.038 0.754 3.403 4.511
v1331 4 0.011 0.119 0.040 0.053 1.330
v400 1,037 0.000 28.044 0.279 1.311 4.693
v62 5 0.001 0.170 0.046 0.070 1.509
v63 83 0.000 3.780 0.320 0.632 1.971
v700 293 0.001 9.436 0.215 0.774 3.599
v710 566 0.000 15.707 0.261 0.827 3.164
v711 219 0.001 4.107 0.305 0.670 2.199
v713 51 0.001 0.742 0.073 0.142 1.945
v730 201 0.000 25.830 0.254 1.846 7.267
v731 1 0.005 0.005 0.005 0.000 0.000
v732 3 0.017 0.046 0.029 0.015 0.534
v7400 1 0.055 0.055 0.055 0.000 0.000
v800 341 0.001 19.269 0.334 1.243 3.726
v810 257 0.001 7.527 0.286 0.710 2.477
v84 556 0.001 60.500 0.748 4.216 5.632
v86 293 0.001 16.810 0.401 1.056 2.634
v91 255 0.000 2.019 0.144 0.215 1.496
v99 73 0.006 1.358 0.295 0.322 1.093
vSG1 3202 0.000 3.890 0.120 0.207 1.732
Total 11,557 0.000 60.500 0.277 1.458 5.261
Of the 14,140 constrained drill-hole assay samples available, only 28 assay samples have a grade
higher than 10.0 opt Au (343 g/t Au), and these drillhole assay samples were capped at 10.0 opt
Au prior to compositing (Table 14.6).
Of 11,557 constrained chip samples available, only 24 assay samples have a grade higher than
10.0 opt Au (343 g/t Au). Chips samples are only utilized during the first estimation pass and

P&E Mining Consultants Inc., Report No. 315 Page 81 of 171
Klondex Canada Ltd. True North Gold Mine
their influence is restricted to 50 feet (15m) Chip samples were therefore not capped prior to
compositing.
14.7 COMPOSITING
Drillhole assay sample lengths within the defined veins range from 0.10 foot (0.03m) to 15.03
feet (4.58m), with an average sample length of 1.55 feet (0.47m) Chip assay sample lengths
within the defined veins range from 0.10 foot (0.03m) to 12.18 feet (3.71m), with an average
sample length of 1.95 feet (0.59m) A maximum length of 10.0 feet (3.05m) was selected for
compositing in order to generate single intercept composites across the width of the vein.
Klondex geologists identified where drill-holes oriented sub-parallel to the strike of specific
veins were not representative of local mineralization, and these were excluded from the
compositing process. Klondex geologists also identified a small number of assay intervals that
were not captured by the vein modelling process, and these were manually flagged for inclusion
in the compositing process.
Length-weighted composites were calculated within the defined vein. Missing sample intervals
or zero-grade assay intervals were assigned a value of 0.001 opt Au (0.001 g/t Au) The
compositing process started at the first point of intersection between the drillhole and the vein
intersected, and halted on exit from the vein wireframe. All residual composites were retained.
The wireframes that represent the interpreted veins were also used to back-tag a rock code field
into the assay and composite workspaces. The resulting composite data were visually validated
against vein wireframes. Summary statistics were calculated separately by vein for the composite
samples (Table 14.6).
P&E notes that the compositing methodology results in composite samples with a variable
support length corresponding to the thickness of the vein, producing variable-length single
intercept composite samples where the modelled vein thickness is 10.0 feet (3.05m) or less and
additional composite samples where the vein thickness is greater than 10.0 feet (3.05m).
TABLE 14.6
SUMMARY COMPOSITE STATISTICS BY VEIN
Statistic Samples Minimum
opt Au
Maximum
opt Au
Mean
opt Au
Std.
Deviation CV
v072 447 0.0003 6.451 0.417 0.640 1.534
v1010 1,067 0.001 22.996 0.199 0.854 4.284
v1011 204 0.0001 2.503 0.144 0.294 2.043
v1012 21 0.00021 0.857 0.189 0.265 1.404
v1020 382 0.0001 2.894 0.119 0.266 2.232
v1030 658 0.001 3.407 0.115 0.271 2.344
v1040 38 0.001 1.600 0.150 0.284 1.894
v1300 163 0.001 0.709 0.078 0.113 1.444
v1305 35 0.00011 0.168 0.040 0.050 1.257
v1310 457 0.0001 48.038 0.633 2.865 4.524
v1320 14 0.001 0.237 0.086 0.072 0.844
v1330 6 0.001 1.348 0.291 0.526 1.807
v1331 10 0.001 0.532 0.152 0.178 1.173

P&E Mining Consultants Inc., Report No. 315 Page 82 of 171
Klondex Canada Ltd. True North Gold Mine
TABLE 14.6
SUMMARY COMPOSITE STATISTICS BY VEIN
Statistic Samples Minimum
opt Au
Maximum
opt Au
Mean
opt Au
Std.
Deviation CV
v200 99 0.0004 0.896 0.053 0.108 2.051
v210 31 0.0001 1.988 0.139 0.357 2.571
v400 551 0.001 17.738 0.246 0.947 3.845
v62 35 0.001 2.760 0.265 0.589 2.225
v63 171 0.001 2.000 0.178 0.239 1.348
v700 646 0.0001 4.719 0.135 0.374 2.767
v710 328 0.0006 4.8058 0.238 0.437 1.839
v711 218 0.001 2.570 0.175 0.312 1.779
v713 118 0.00034 2.516 0.103 0.286 2.788
v714 70 0.001 1.019 0.077 0.200 2.591
v730 634 0.001 25.830 0.218 1.107 5.071
v731 40 0.0001 0.670 0.080 0.145 1.808
v732 30 0.0001 0.721 0.105 0.173 1.651
v800 410 0.00085 19.269 0.236 1.037 4.401
v810 240 0.0001 3.900 0.163 0.390 2.386
v820 56 0.001 0.793 0.054 0.130 2.394
v84 390 .001 10.000 0.357 0.993 2.783
v86 433 0.001 16.810 0.239 0.915 3.824
v91 262 0.001 6.580 0.163 0.431 2.642
vCW2 114 0.0001 0.675 0.070 0.104 1.484
vCW3 162 0.0001 6.948 0.139 0.562 4.059
vCW4 161 0.0001 0.868 0.073 0.118 1.610
vSG1 1,656 0.001 1.639 0.101 0.131 1.302
14.8 TREATMENT OF EXTREME VALUES
Grade capping analysis was conducted on the vein-coded and composited grade data in order to
evaluate the potential influence of extreme values during Au grade estimation. The presence of
high-grade outliers was identified by examination of histograms and log-probability plots.
Composites were capped to the selected value prior to estimation.
In addition, due to the highly channelized nature of the mineralization, a 50.0 feet (15m) range
restriction on samples greater than the 97.5th
percentile of the local vein composite data set was
used during the second and third Au grade estimation passes (Table 14.7).

P&E Mining Consultants Inc., Report No. 315 Page 83 of 171
Klondex Canada Ltd. True North Gold Mine
TABLE 14.7
COMPOSITE CAPPING LEVELS
Vein Cap (opt) 97.5th
Percentile (opt) Vein Cap (opt) 97.5th Percentile
(opt)
v62 NA 0.500 v732 NA 0.650
v63 NA 0.500 v800 3.0 0.991
v072 5.0 1.670 v810 2.0 0.976
v84 7.0 0.889 v820 NA 0.361
v86 5.0 1.350 v1010 5.0 1.184
v91 3.0 0.715 v1011 1.4 0.994
v200 NA 0.304 v1012 NA 0.500
v210 NA 0.600 v1020 2.0 0.600
v400 6.0 1.360 v1030 2.0 0.812
v700 2.4 0.930 v1040 NA 0.600
v710 2.6 1.150 v1300 NA 0.382
v711 1.8 0.928 v1305 NA NA
v713 1.4 0.747 v1310 9.0 3.476
v714 1.0 0.858 v1320 NA NA
v730 4.0 1.254 v1330 NA 0.100
v731 NA 0.667 v1331 NA 0.100
14.9 AU GRADE ESTIMATION, CLASSIFICATION & MINIMUM WIDTH
The mineral resource estimate reported herein was constrained by vein wireframes that form
hard boundaries between their respective composite sample extents. All Au block grades were
estimated using a triple pass Inverse Distance cubed (“ID3”) weighting of between four and
twelve capped composite grades from two or more drillholes. In addition, due to the varying
sample support lengths generated by the compositing process, a variable weighting factor
defined by the length of the composite samples was also implemented during Au grade
estimation. A discretization level of 3 by 3 by 1 was used.
During the first pass, drillhole and chip samples were selected using an isotropic search with a
radius of 50.0 feet (15m). All blocks estimated during the first pass were algorithmically
assigned a classification of Measured.
During the second pass, drill-hole samples were selected using an isotropic search with a radius
of 100.0 feet (30m) For the second pass, estimation was implemented using a 25.0 feet by 25.0
feet by 25.0 ft.(7.6m by 7.6m by 7.6m) parent block size. All blocks estimated during the second
pass were algorithmically assigned a classification of Indicated.
During the third pass, drillhole samples were selected using an isotropic search with a radius of
500.0 feet (150m) For the third pass, estimation was implemented using a 50.0 feet by 50.0 feet
by 50.0 feet (15m by 15m by 15m) parent block size. All blocks estimated during the third pass
were algorithmically assigned a classification of Inferred.
See 3D classification models and cross sections for V91, V710 and V711 veins in Appendix III
Blocks that did not meet the minimum sample requirements were not estimated.

P&E Mining Consultants Inc., Report No. 315 Page 84 of 171
Klondex Canada Ltd. True North Gold Mine
Klondex has defined a minimum mining width of 4.0 feet (1.2m) For blocks with a width less
than 4.0 feet the estimated grade was diluted at zero grade to a 4.0 feet (1.2m) width with an
associated increase in tonnage, and the adjusted grade and tonnage used for mineral resource
reporting.
See Au grade models and cross sections for V91, V710, and V711 veins in Appendix IV.
A Nearest Neighbour model was also generated simultaneously using the same parameters as the
third estimation pass.
14.10 UNDERGROUND MINERAL RESOURCE ESTIMATE
Mineral resources are based on a cut-off grade of 0.09 opt (3.09 g/t) (Table 14-8). The cut-off
grade has been calculated from the following parameters:
Gold Price: US$ 1,400 per oz
Exchange Rate: C$ to US$: 0.80
Mine & Process Cost: C$141.53 per ton
Recovery: 94%
Cut-off: 0.09 opt Au (3.09 grams per tonne)
TABLE 14.8
TOTAL UNDERGROUND MINERAL RESOURCES(1-7)
Class Grade
Au opt
Grade
Au g/t tons Au oz
Measured 0.232 7.95 455,000 105,600
Indicated 0.202 6.92 931,000 187,800
Measured & Indicated 0.212 7.26 1,386,000 293,400
Inferred 0.165 5.65 2,793,000 459,900 (1) Mineral Resource is inclusive of Mineral Reserve.
(2) Mineral resources which are not mineral reserves do not have demonstrated economic viability. The estimate
of mineral resources may be materially affected by environmental, permitting, legal, marketing, or other
relevant issues.
(3) Mineral Resource was estimated using the Canadian Institute of Mining, Metallurgy and Petroleum (CIM),
CIM Standards on Mineral Resources and Reserves, Definitions and Guidelines prepared by the CIM
Standing Committee on Reserve Definitions and adopted by CIM Council.
(4) The quantity and grade of reported Inferred resources in this estimation are uncertain in nature and there
has been insufficient exploration to define these Inferred resources as an Indicated or Measured mineral
resource and it is uncertain if further exploration will result in upgrading them to an Indicated or Measured
mineral resource category.
(5) Contained metal may differ due to rounding.
(6) Cut-off grade = 0.09 opt Au (3.09 g/t Au).
(7) A bulk density of 0.086 tons per cubic foot was utilized in Resource tonnage calculations.
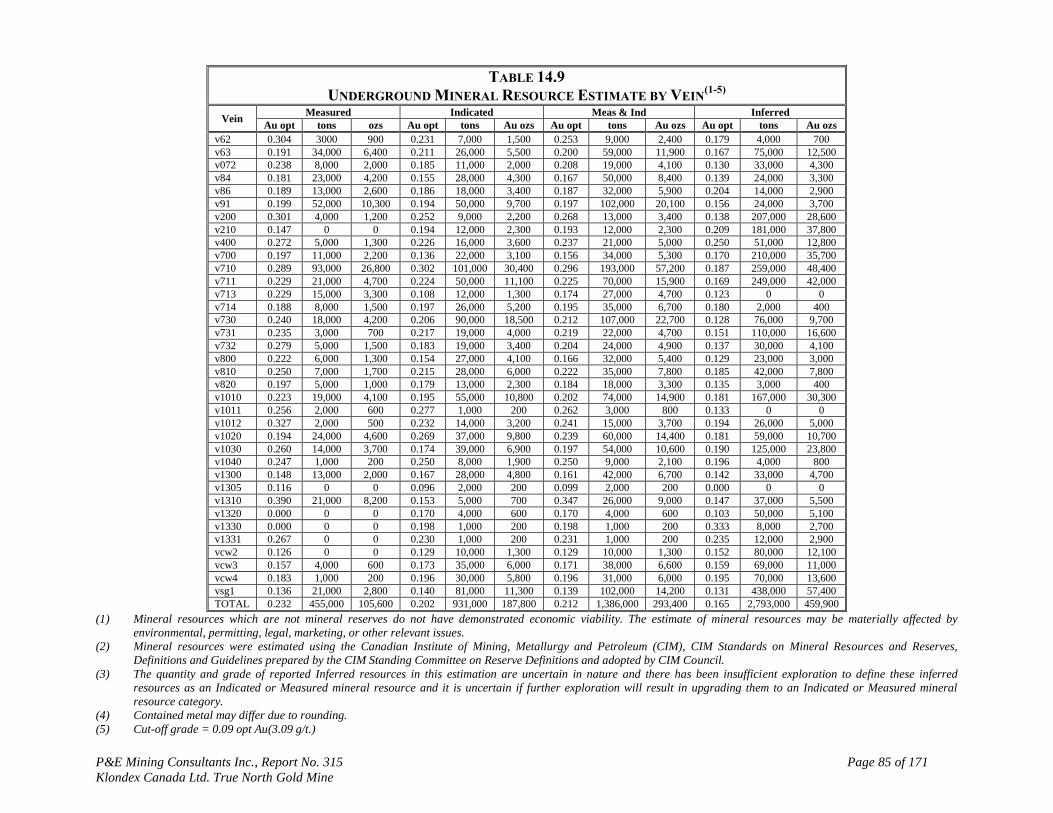
P&E Mining Consultants Inc., Report No. 315 Page 85 of 171
Klondex Canada Ltd. True North Gold Mine
TABLE 14.9
UNDERGROUND MINERAL RESOURCE ESTIMATE BY VEIN(1-5)
Vein Measured Indicated Meas & Ind Inferred
Au opt tons ozs Au opt tons Au ozs Au opt tons Au ozs Au opt tons Au ozs
v62 0.304 3000 900 0.231 7,000 1,500 0.253 9,000 2,400 0.179 4,000 700
v63 0.191 34,000 6,400 0.211 26,000 5,500 0.200 59,000 11,900 0.167 75,000 12,500
v072 0.238 8,000 2,000 0.185 11,000 2,000 0.208 19,000 4,100 0.130 33,000 4,300
v84 0.181 23,000 4,200 0.155 28,000 4,300 0.167 50,000 8,400 0.139 24,000 3,300
v86 0.189 13,000 2,600 0.186 18,000 3,400 0.187 32,000 5,900 0.204 14,000 2,900
v91 0.199 52,000 10,300 0.194 50,000 9,700 0.197 102,000 20,100 0.156 24,000 3,700
v200 0.301 4,000 1,200 0.252 9,000 2,200 0.268 13,000 3,400 0.138 207,000 28,600
v210 0.147 0 0 0.194 12,000 2,300 0.193 12,000 2,300 0.209 181,000 37,800
v400 0.272 5,000 1,300 0.226 16,000 3,600 0.237 21,000 5,000 0.250 51,000 12,800
v700 0.197 11,000 2,200 0.136 22,000 3,100 0.156 34,000 5,300 0.170 210,000 35,700
v710 0.289 93,000 26,800 0.302 101,000 30,400 0.296 193,000 57,200 0.187 259,000 48,400
v711 0.229 21,000 4,700 0.224 50,000 11,100 0.225 70,000 15,900 0.169 249,000 42,000
v713 0.229 15,000 3,300 0.108 12,000 1,300 0.174 27,000 4,700 0.123 0 0
v714 0.188 8,000 1,500 0.197 26,000 5,200 0.195 35,000 6,700 0.180 2,000 400
v730 0.240 18,000 4,200 0.206 90,000 18,500 0.212 107,000 22,700 0.128 76,000 9,700
v731 0.235 3,000 700 0.217 19,000 4,000 0.219 22,000 4,700 0.151 110,000 16,600
v732 0.279 5,000 1,500 0.183 19,000 3,400 0.204 24,000 4,900 0.137 30,000 4,100
v800 0.222 6,000 1,300 0.154 27,000 4,100 0.166 32,000 5,400 0.129 23,000 3,000
v810 0.250 7,000 1,700 0.215 28,000 6,000 0.222 35,000 7,800 0.185 42,000 7,800
v820 0.197 5,000 1,000 0.179 13,000 2,300 0.184 18,000 3,300 0.135 3,000 400
v1010 0.223 19,000 4,100 0.195 55,000 10,800 0.202 74,000 14,900 0.181 167,000 30,300
v1011 0.256 2,000 600 0.277 1,000 200 0.262 3,000 800 0.133 0 0
v1012 0.327 2,000 500 0.232 14,000 3,200 0.241 15,000 3,700 0.194 26,000 5,000
v1020 0.194 24,000 4,600 0.269 37,000 9,800 0.239 60,000 14,400 0.181 59,000 10,700
v1030 0.260 14,000 3,700 0.174 39,000 6,900 0.197 54,000 10,600 0.190 125,000 23,800
v1040 0.247 1,000 200 0.250 8,000 1,900 0.250 9,000 2,100 0.196 4,000 800
v1300 0.148 13,000 2,000 0.167 28,000 4,800 0.161 42,000 6,700 0.142 33,000 4,700
v1305 0.116 0 0 0.096 2,000 200 0.099 2,000 200 0.000 0 0
v1310 0.390 21,000 8,200 0.153 5,000 700 0.347 26,000 9,000 0.147 37,000 5,500
v1320 0.000 0 0 0.170 4,000 600 0.170 4,000 600 0.103 50,000 5,100
v1330 0.000 0 0 0.198 1,000 200 0.198 1,000 200 0.333 8,000 2,700
v1331 0.267 0 0 0.230 1,000 200 0.231 1,000 200 0.235 12,000 2,900
vcw2 0.126 0 0 0.129 10,000 1,300 0.129 10,000 1,300 0.152 80,000 12,100
vcw3 0.157 4,000 600 0.173 35,000 6,000 0.171 38,000 6,600 0.159 69,000 11,000
vcw4 0.183 1,000 200 0.196 30,000 5,800 0.196 31,000 6,000 0.195 70,000 13,600
vsg1 0.136 21,000 2,800 0.140 81,000 11,300 0.139 102,000 14,200 0.131 438,000 57,400
TOTAL 0.232 455,000 105,600 0.202 931,000 187,800 0.212 1,386,000 293,400 0.165 2,793,000 459,900
(1) Mineral resources which are not mineral reserves do not have demonstrated economic viability. The estimate of mineral resources may be materially affected by
environmental, permitting, legal, marketing, or other relevant issues.
(2) Mineral resources were estimated using the Canadian Institute of Mining, Metallurgy and Petroleum (CIM), CIM Standards on Mineral Resources and Reserves,
Definitions and Guidelines prepared by the CIM Standing Committee on Reserve Definitions and adopted by CIM Council.
(3) The quantity and grade of reported Inferred resources in this estimation are uncertain in nature and there has been insufficient exploration to define these inferred
resources as an Indicated or Measured mineral resource and it is uncertain if further exploration will result in upgrading them to an Indicated or Measured mineral
resource category.
(4) Contained metal may differ due to rounding.
(5) Cut-off grade = 0.09 opt Au(3.09 g/t.)

P&E Mining Consultants Inc., Report No. 315 Page 86 of 171
Klondex Canada Ltd. True North Gold Mine
14.11 BLOCK MODEL VALIDATION
The block models were validated visually by the inspection of successive section lines in order to
confirm that the block models correctly reflect the distribution of high-grade and low-grade
values. An additional validation check was completed by comparing the average grade of the
composites to the model block grade estimates at zero cut-off. Unadjusted block grades were
also compared to the de-clustered composite mean as well as to an unadjusted Nearest Neighbour
(NN) model generated using the same search criteria as that used for the mineral resource
estimate (Table 14.10).
TABLE 14.10
BLOCK MODEL VALIDATION GRADES
Vein ID
3 Mean
Au opt
NN Mean
Au opt
Declustered Mean
Au opt
v072 0.152 0.163 0.209
v1010 0.089 0.090 0.148
v1011 0.069 0.067 0.112
v1012 0.125 0.167 0.189
v1020 0.085 0.095 0.082
v1030 0.081 0.079 0.091
v1040 0.222 0.205 0.150
v1300 0.054 0.058 0.067
v1305 0.041 0.040 0.038
v1310 0.176 0.151 0.383
v1320 0.087 0.072 0.086
v1330 0.077 0.234 0.281
v1331 0.224 0.208 0.152
v200 0.048 0.053 0.049
v210 0.083 0.127 0.111
v400 0.103 0.082 0.193
v62 0.090 0.188 0.225
v63 0.129 0.104 0.157
v700 0.074 0.071 0.121
v710 0.163 0.205 0.176
v711 0.115 0.093 0.126
v713 0.046 0.033 0.082
v714 0.053 0.045 0.077
v730 0.066 0.067 0.176
v731 0.122 0.104 0.065
v732 0.112 0.109 0.090
v800 0.089 0.089 0.139
v810 0.071 0.069 0.122
v820 0.042 0.030 0.050
v84 0.072 0.135 0.225

P&E Mining Consultants Inc., Report No. 315 Page 87 of 171
Klondex Canada Ltd. True North Gold Mine
TABLE 14.10
BLOCK MODEL VALIDATION GRADES
Vein ID
3 Mean
Au opt
NN Mean
Au opt
Declustered Mean
Au opt
v86 0.075 0.090 0.157
v91 0.114 0.110 0.150
vCW2 0.071 0.061 0.068
vCW3 0.081 0.086 0.109
vCW4 0.061 0.056 0.074
vSG1 0.052 0.049 0.074
Swath plots were generated to check the block model estimates global bias by comparing the
(NN) block estimate to the ID3 estimate for Measured and Indicated Resources (see Appendix).
As a further check of the Mineral Resource model the total volume reported at zero Au cut-off
was compared by vein with the calculated volume of the defining mineralization wireframe
(Table 14.11). All reported volumes fall within acceptable tolerances.
TABLE 14.11
VOLUME COMPARISON
Vein Resource Volume
(cubic ft)
Wireframe Volume
(cubic ft)
v072 4,388,856 4,388,991
v1010 14,318,142 14,507,150
v1011 1,547,795 1,547,129
v1012 1,170,010 1,170,844
v1020 5,975,060 5,974,179
v1030 11,931,908 12,788,126
v1040 240,220 239,926
v1300 4,288,995 4,291,264
v1305 1,115,260 1,115,306
v1310 2,079,285 2,079,014
v1320 1,539,625 1,542,305
v1330 772,756 774,116
v1331 193,962 567,757
v200 23,078,214 25,549,080
v210 9,920,635 11,320,757
v400 7,896,820 8,079,136
v62 695,815 696,313
v63 3,330,105 3,425,009
v700 12,000,717 12,088,160
v710 9,644,615 12,693,819
v711 8,030,502 8,080,407
v713 2,114,117 2,114,464
v714 2,082,206 2,082,142
v730 12,317,510 12,526,653
v731 2,482,877 2,482,616
v732 1,115,265 1,115,264
v800 5,977,515 5,977,193
v810 7,311,945 7,359,619
v820 2,103,755 2,105,643

P&E Mining Consultants Inc., Report No. 315 Page 88 of 171
Klondex Canada Ltd. True North Gold Mine
TABLE 14.11
VOLUME COMPARISON
Vein Resource Volume
(cubic ft)
Wireframe Volume
(cubic ft)
v84 6,724,538 5,863,299
v86 3,981,750 3,988,093
v91 3,501,150 3,501,065
vCW2 5,575,025 6,389,382
vCW3 6,303,789 7,081,996
vCW4 9,005,981 11,431,644
vSG1 54,522,427 64,501,083
TOTAL 249,279,147 271,438,943
14.12 TAILINGS MINERAL RESOURCE ESTIMATE
All mineral resource estimation work reported in this section was carried out or reviewed by
Fred Brown, P.Geo., an independent Qualified Person as defined by NI 43-101 by reason of
education, affiliation with a professional association and past relevant work experience. This
Mineral Resource estimate is based on information and data supplied by Klondex.
Mineral Resource modelling and estimation reported in this section were carried out using
Gemcom GEMS (version 5.4.1) and Snowden Supervisor (version 7.10.11) software programs.
14.13 PREVIOUS RESOURCE ESTIMATES
P&E is not aware of a previous public mineral resource estimate for the True North tailings.
14.14 TAILINGS DATA SUPPLIED
Sample data were provided electronically by Klondex. Distance units are reported in feet, and Au
assay grade units are reported opt. The supplied drilling database contains records for 138
drillholes, of which 39 are stem auger drillholes and 99 are percussion probe drillholes. The
drilling grid as completed is on the order of 200 feet by 100 feet (60m x 30m) (See Appendix V).
The supplied database also included results for 210 pit samples recovered from hand-dug
excavations. Pit samples were examined visually during modelling, but were not used for
estimation due to differences in support size, sample quality and assay results compared with
adjacent drillhole samples (Figure 14.3).

P&E Mining Consultants Inc., Report No. 315 Page 89 of 171
Klondex Canada Ltd. True North Gold Mine
Figure 14.3 Nearest Pair Plot of Pit Samples
Industry standard validation checks were completed on the supplied tailings database, and minor
corrections made where necessary. P&E typically validates a mineral resource database by
checking for inconsistencies in naming conventions or analytical units, duplicate entries, interval,
length or distance values less than or equal to zero, blank or zero-value assay results, out-of-
sequence intervals, intervals or distances greater than the reported drillhole length, inappropriate
collar locations, and missing interval and coordinate fields. No significant discrepancies with the
supplied data were noted, and P&E considers that the database is suitable for mineral resource
estimation.
14.15 TAILINGS DRY BULK DENSITY
Klondex submitted two samples to ALS Environmental Laboratories for dry bulk density
measurements, with an average value of 0.044 tons per cubic foot (1.395 tonnes per cubic metre)
(Table 14.12). The average dry bulk density value of 0.044 tons per cubic foot was used for
Mineral Resource estimation.
TABLE 14.12
TAILINGS DRY BULK DENSITY RESULTS
Test Units Sample 1 Sample 2 Average
% Moisture % 42.0 40.5 41.3
Dry Weight g 427.6 262.1 344.9
Total Sample Weight g 738 440 589.0
Dry Bulk Density t/m3 1.260 1.530 1.395
14.16 DEPOSIT MODELLING
Klondex supplied a three-dimensional AutoCAD format drawing file of the tailings volume
which was reviewed by P&E. The upper surface of the tailings volume was constructed from
collar elevations and the lower surface was defined by drillhole intersection of the underlying
clay/peat horizon. The modeled tailings volume is on the order of 30 feet (9m) thick.

P&E Mining Consultants Inc., Report No. 315 Page 90 of 171
Klondex Canada Ltd. True North Gold Mine
14.17 ASSAY DATA
Summary assay statistics were calculated from the drilling assay grades (Table 14.13). The
difference in mean grade between the auger and percussion sample populations is due to the
smaller area associated with the auger drilling.
TABLE 14.13
SUMMARY TAILINGS DRILLHOLE ASSAY
STATISTICS
STEM AUGER Length (ft) Au (opt)
Mean 4.20 0.029
Median 4.00 0.021
Mode 4.00 0.015
Standard Deviation 0.68 0.032
CV 0.16 1.104
Minimum 2.00 0.0001
Maximum 5.00 0.379
Count 194 194
PERCUSSION Length (ft) Au (opt)
Mean 4.94 0.019
Median 5.00 0.016
Mode 5.00 0.013
Standard Deviation 0.41 0.015
CV 0.08 0.782
Minimum 0.50 0.0000
Maximum 5.00 0.211
Count 476 476
TOTAL Length (ft) Au (opt)
Mean 4.73 0.022
Median 5.00 0.017
Mode 5.00 0.013
Standard Deviation 0.60 0.022
CV 0.13 0.997
Minimum 0.50 0.0001
Maximum 5.00 0.379
Count 670 670
14.18 COMPOSITING
Drillhole assay sample lengths within the defined tailings volume range from 0.5 feet to 5.0 feet,
(0.15m to 1.52m) with an average sample length of 4.73 feet (1.44m). A compositing length of
10.0 feet (3.05m) was selected for compositing, equivalent to the model block height. Residual
sample lengths less than 5.0 feet (1.52m) were merged with the preceding composite interval.
The resulting composite lengths range from 5.0 feet to 14.0 feet (1.52m to 4.27m) with an
average length of 9.4 feet (2.87m).

P&E Mining Consultants Inc., Report No. 315 Page 91 of 171
Klondex Canada Ltd. True North Gold Mine
The resulting composite data were visually validated and summary statistics were calculated for
the resulting composite samples (Table 14.14).
TABLE 14.14
SUMMARY COMPOSITE STATISTICS FOR
TAILINGS ASSAYS
Length (ft) Au (opt)
Mean 9.37 0.021
Median 10.0 0.018
Mode 10.0 0.018
Standard Deviation 2.02 0.016
CV 0.22 0.747
Minimum 5.00 0.0001
Maximum 14.00 0.206
Count 338 338
14.19 SPATIAL ANALYSIS
A horizontal experimental semi-variogram was modeled from uncapped composite samples.
Standardized spherical models were used to model the experimental semi-variogram in normal-
score transformed space (Figure 14.3), and the modeled variance contributions were then back-
transformed to:
0.17 + 0.30 Spherical50 + 0.60 Spherical750
The resulting semi-variogram suggests a maximum range on the order of 750 feet (230m)
(Figure 14.4).
Figure 14.4 Experimental Semi-Variogram

P&E Mining Consultants Inc., Report No. 315 Page 92 of 171
Klondex Canada Ltd. True North Gold Mine
14.20 TREATMENT OF EXTREME VALUES
Grade capping analysis was conducted on the composited grade data in order to evaluate the
potential influence of extreme values during grade estimation. The presence of high-grade
outliers was identified by examination of histograms and log-probability plots (Figure 14.5).
Composites were capped to the selected threshold value prior to estimation:
Capping Threshold: 0.060 opt (2.06 g/t)
Average Uncapped Au Grade: 0.021 opt (0.72 g/t)
Maximum Au Grade: 0.206 opt (7.06 g/t)
Number Capped: 5
Average Au Capped Grade: 0.020 opt (0.69 g/t)
Percent Change: 4.8%
Figure 14.5 Histogram and Probability Plots for Uncapped Tailings Composites
14.21 BLOCK MODEL EXTENTS
A rotated block model was established across the Project with the block model limits selected so
as to cover the extent of the defined volume and reflect the generally general dimensions of the
drilling grid (Table 14.15). The block model consists of separate models for estimated grades,
rock code, percent, density and classification attributes. A percent block model was used to
accurately represent the volume and tonnage contained within the constraining tailings volume.
TABLE 14.15
BLOCK MODEL SETUP
Dimension Origin Count Size (ft)
X 6,800 90 50
Y 9,000 60 50
Z 10,000 6 10
Rotation -20° counter-clockwise from the origin.

P&E Mining Consultants Inc., Report No. 315 Page 93 of 171
Klondex Canada Ltd. True North Gold Mine
14.22 GOLD TAILINGS GRADE ESTIMATION & CLASSIFICATION
The tailings mineral resource estimate was constrained within the extents of the modeled tailings
volume. Au block grades were estimated using a single pass Inverse Distance Cubed (“ID3”)
weighting of between three and twelve capped composite grades from two or more drillholes. A
NN model was also generated simultaneously using the same search parameters.
Blocks within 250 feet (76m) of a drillhole sample were classified as Inferred, and blocks within
250 feet (76m) of at least three drillhole samples were classified as Indicated. This ensures that
blocks classified as Indicated were largely interpolated between drillholes, while Inferred blocks
were not extrapolated beyond a reasonable limit (See Appendix V), and that all block estimates
are within the spatial range defined by the experimental semi-variogram. Approximately 25% of
the blocks contained by the tailings volume are outside these limits and remain un-estimated.
14.23 TAILINGS MINERAL RESOURCE ESTIMATE
The tailings Mineral Resource estimate is based on a gold cut-off grade of 0.015 opt Au (0.51
grams per tonne), which has been calculated from the following parameters:
Gold Price: US$ 1,400 per oz
Exchange Rate: C$ to US$: 0.80
Process Cost: C$18.01 per ton
• G&A Cost: C$6.40 per ton
Process Recovery: 90%
The tailings Mineral Resource estimate for the project is tabulated in Table 14.16.
TABLE 14.16
TAILINGS MINERAL RESOURCE(1-7)
Class Grade
Au opt
Grade
Au g/t
Tons
(k)
Au
(k) oz
Indicated 0.024 0.82 2,138 51.0
Inferred 0.022 0.75 47 1.1 (1) Tailings Mineral Resource is inclusive of Tailings Mineral Reserve.
(2) Mineral Resources which are not mineral reserves do not have demonstrated economic viability. The
estimate of mineral resources may be materially affected by environmental, permitting, legal, marketing, or
other relevant issues.
(3) Mineral Resource was estimated using the Canadian Institute of Mining, Metallurgy and Petroleum (CIM),
CIM Standards on Mineral Resources and Reserves, Definitions and Guidelines prepared by the CIM
Standing Committee on Reserve Definitions and adopted by CIM Council.
(4) The quantity and grade of reported Inferred Mineral Resources in this estimation are uncertain in nature and
there has been insufficient exploration to define these Inferred Mineral Resources as an Indicated or
Measured Mineral Resource and it is uncertain if further exploration will result in upgrading them to an
Indicated or Measured Mineral Resource category.
(5) Contained metal may differ due to rounding.
(6) Cut-off grade = 0.015 opt Au (0.51 g/t Au).
(7) A dry bulk density of 0.044 pcf was utilized in the tailings Mineral Resource estimate tonnage calculation.
See tailings Au block model in Appendix V.

P&E Mining Consultants Inc., Report No. 315 Page 94 of 171
Klondex Canada Ltd. True North Gold Mine
14.24 TAILINGS BLOCK MODEL VALIDATION
The block models were validated visually by the inspection of successive cross sections in order
to confirm that the block model correctly reflects the distribution of high-grade and low-grade
values (See Appendix IV) and Figure 14.6. An additional validation check was completed by
comparing the average grade of the informing composites to the model block grade estimates at
zero cut-off. Block grades were also compared to the NN model generated using the same search
criteria as that used for the ID3 Mineral Resource estimate:
Avg. Capped Au Composite Grade: 0.02 opt Au (0.69 g/t Au);
Avg. Au ID3 Block Grade: 0.02 opt Au (0.69 g/t Au); and
Avg. Au NN Block Grade: 0.02 opt Au (0.69 g/t Au)
Figure 14.6 Model and Composite Comparisons
As a check on the selected methodology, the results were also generated by Ordinary Kriging
(OK) and Inverse Distance Squared (ID2) estimation. In both cases, it was noted that the ID
3
estimates compared better with regards to the average block composite grade (Figure 14.7).

P&E Mining Consultants Inc., Report No. 315 Page 95 of 171
Klondex Canada Ltd. True North Gold Mine
Figure 14.7 Comparison of Estimation Results
Swath plots were generated to check the block model estimate for global bias by comparing the
NN block estimate to the ID3 estimate (Figure 14.8).

P&E Mining Consultants Inc., Report No. 315 Page 96 of 171
Klondex Canada Ltd. True North Gold Mine
Figure 14.8 Tailings Swath Plot

P&E Mining Consultants Inc., Report No. 315 Page 97 of 171
Klondex Canada Ltd. True North Gold Mine
15.0 MINERAL RESERVE ESTIMATES
Table 15.1 summarizes the True North Mineral Reserve estimate which includes a combination
of underground ore and high grade tailings for re-reprocessing. Also in its respective subsections,
there is additional explanation about the mineral reserve determination and parameters utilized.
TABLE 15.1
TOTAL PROJECT MINERAL RESERVE ESTIMATE
Reserve Area Proven Reserve Probable Reserve Proven & Probable Reserve
District tons Au
(opt)
Au
(Ozs) tons
Au
(opt)
Au
(Ozs) tons
Au
(opt) Au (Ozs)
26L -710 89,000 0.269 23,900 101,000 0.294 29,600 190,000 0.282 53,500
16L 810 2,000 0.221 500 13,000 0.213 2,800 15,000 0.214 3,300
16L - L10 18,000 0.194 3,500 32,000 0.193 6,100 50,000 0.193 9,600
26L - SAM 44,000 0.203 8,900 53,000 0.191 10,200 97,000 0.196 19,100
Subtotal True
North
Underground
153,000 0.241 36,800 199,000 0.245 48,700 352,000 0.243 85,500
Tailings
Reprocessed 0 0.000 0 1,170,000 0.028 32,400 1,170,000 0.028 32,400
Total True
North including
Tailings
153,000 0.241 36,800 1,369,000 0.059 81,100 1,522,000 0.077 117,900
15.1 UNDERGROUND MINERAL RESERVE ESTIMATES
Mineralization wireframes are cut along level boundaries, and subsequently cut along typical
stope dimensions were applicable. This leaves a series of shapes (created with Vulcan Stope
Optimizer software) with various dimensions of 60 feet (18m) high access level intervals (access
level spacing), various lengths along strike stopes, and then full width of the orebody which
varies from 4 feet (1.2m) to 30 feet (9.1m) This is illustrated below in Figure 15.1. The minimum
mining width considered when creating stopes shapes is 5 feet (1.5m). This minimum mining
width was introduced due to existing mobile equipment limitations or requirements and previous
experience with the proposed mining methods to extract these stopes i.e. long-hole, captive long-
hole and retreat uppers without backfill.
Figure 15.1 Reserve Block X-Section for Economic Viability Analysis (710/710A Veins)

P&E Mining Consultants Inc., Report No. 315 Page 98 of 171
Klondex Canada Ltd. True North Gold Mine
These blocks were reported from the grade model with grade and resource category as outputs.
Blocks where the ore was classified as Measured or Indicated were moved to the next phase of
assessment. Blocks with Stope dilution and mining recoveries were subsequently applied to each
of these shapes. Only blocks that are above BCOG were considered economic.
Subsequently, these blocks were considered only when creating the stopes shapes for further
evaluations taking in account the following parameters, level accesses and vertical development
or level spacing every 60 feet (18m), stope length varies and is mainly dictated by the
positioning of above break-even cut-off grade blocks. Where applicable, captive stopes have
been considered with multiple level extraction that can be mined and extracted from one
development horizon (access) which makes these stopes dependent on one another.
Figure 15.2 Created Stope Shapes for Economic Viability Analysis
Stopes were subsequently assessed individually or in groups to determine if they were
economically mineable. The stopes that passed this test were added to the reserve totals, as
shown in the evaluation sample below. The parameters used to assess the economic viability of
the reserve shapes are listed below in Table 15.2. These values and parameters were provided by
Klondex, reviewed/accepted by P&E, and are understood to be derived from actual operations.

P&E Mining Consultants Inc., Report No. 315 Page 99 of 171
Klondex Canada Ltd. True North Gold Mine
TABLE 15.2
OPERATING AND REVENUE PARAMETERS

P&E Mining Consultants Inc., Report No. 315 Page 100 of 171
Klondex Canada Ltd. True North Gold Mine
The main areas at True North where stope shapes were deemed economic after valuation and
included in the current reserve statement are distributed across a few mining areas (districts) and
lenses in the three main accessible mining districts; the 16L-08/L10, 26L- SAM and the 26L-
710/711. Out of the total reserve at True North, 43% Proven and 57% Probable distribution
occurs with 62.5% of ounces located in the 710/711 area.
The total dilution shown was modelled into the mining shape as external dilution of 0.5feet
(0.15m) over-break on the long-hole stopes which have minimum of 4 feet (1.2m) width and
internal dilution in areas where waste or marginal grade blocks along strike must be taken as part
of the mining shape.
Additionally, the Mining Recovery was considered at 98% and was also applied to the model
with the understanding the stope shapes already include a mining loss which is significant. The
mining recovery was considered somewhat high due to the narrow vein nature of the True North
Deposit and after review it is considered acceptable for all stopes. See underground mineral
reserve estimation parameters in Table 15.3.
TABLE 15.3
PARAMETERS USED TO ASSESS ECONOMIC VIABILITY OF
UNDERGROUND MINERAL RESERVE
Reserve Parameters UM Value
Break Even Cut-Off Grade (BCOG) opt 0.131
Resource Cut-Off Grade (RCOG) opt 0.090
Au Price US$/Oz 1,200
Au Price C$/Oz 1,500
Exchange Rate USD:CAD US$:C$ 0.80
Total Operating Cost C$/t 184.01
Stope Dilution % 21%
Stope Mining Recovery % 98%
Blocks that are below the BCOG, but above the RCOG are reported as Mineral Resources (see
Section 14.10). The underground Mineral Reserve developed for the Project is summarized in
Table 1543.
TABLE 15.4
UNDERGROUND MINERAL RESERVE ESTIMATE
Reserve
Area Proven Reserve Probable Reserve Proven & Probable Reserve
District tons Au
(opt)
Au
(Ozs) tons
Au
(opt)
Au
(Ozs) tons
Au
(opt) Au (Ozs)
26L -710 89,000 0.269 23,900 101,000 0.294 29,600 190,000 0.282 53,500
16L 810 2,000 0.221 500 13,000 0.213 2,800 15,000 0.214 3,300
16L - L10 18,000 0.194 3,500 32,000 0.193 6,100 50,000 0.193 9,600
26L - SAM 44,000 0.203 8,900 53,000 0.191 10,200 97,000 0.196 19,100
Total 153,000 0.241 36,800 199,000 0.245 48,700 352,000 0.243 85,500
(1) Mineral Resource is inclusive of Mineral Reserve shapes, mining recovery, mining dilution and stope pre-
production development costs. Mineral Reserve estimate includes dilution and is constrained to a minimum
mining width of 5 feet.
(2) Mineral Reserve was estimated using the Canadian Institute of Mining, Metallurgy and Petroleum (CIM),
CIM Standards on Mineral Resources and Reserves, Definitions and Guidelines prepared by the CIM
Standing Committee on Reserve Definitions and adopted by CIM Council.
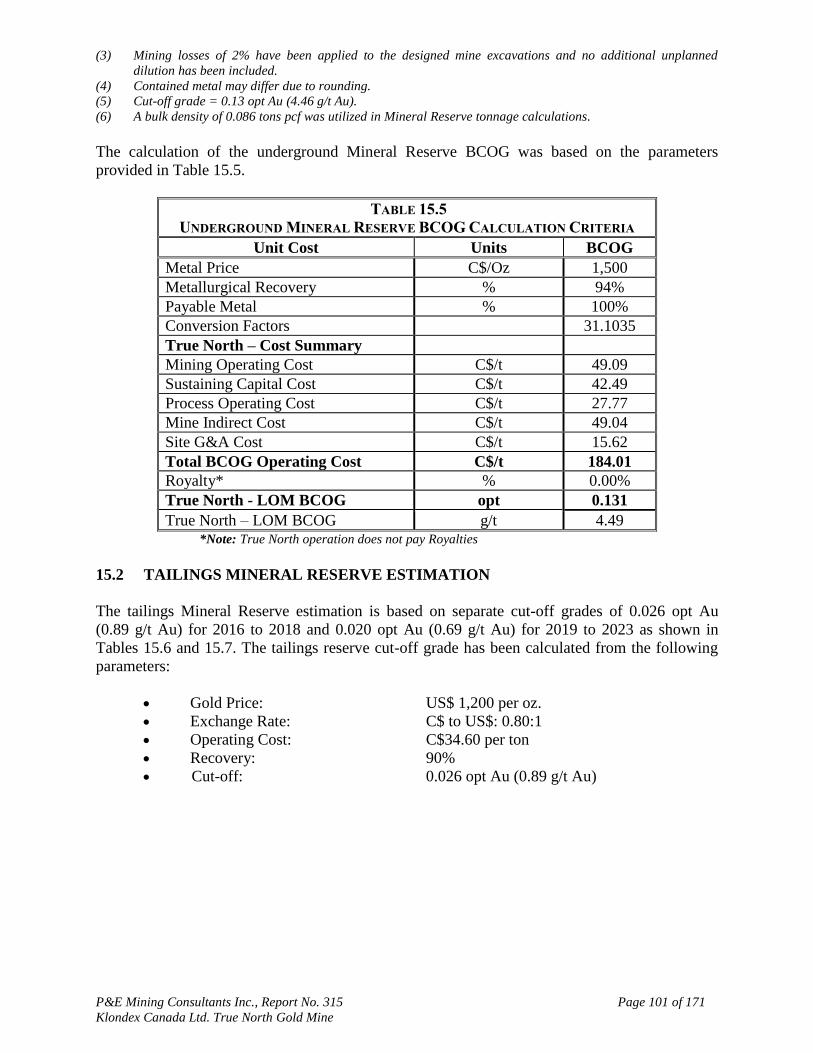
P&E Mining Consultants Inc., Report No. 315 Page 101 of 171
Klondex Canada Ltd. True North Gold Mine
(3) Mining losses of 2% have been applied to the designed mine excavations and no additional unplanned
dilution has been included.
(4) Contained metal may differ due to rounding.
(5) Cut-off grade = 0.13 opt Au (4.46 g/t Au).
(6) A bulk density of 0.086 tons pcf was utilized in Mineral Reserve tonnage calculations.
The calculation of the underground Mineral Reserve BCOG was based on the parameters
provided in Table 15.5.
TABLE 15.5
UNDERGROUND MINERAL RESERVE BCOG CALCULATION CRITERIA
Unit Cost Units BCOG
Metal Price C$/Oz 1,500
Metallurgical Recovery % 94%
Payable Metal % 100%
Conversion Factors 31.1035
True North – Cost Summary
Mining Operating Cost C$/t 49.09
Sustaining Capital Cost C$/t 42.49
Process Operating Cost C$/t 27.77
Mine Indirect Cost C$/t 49.04
Site G&A Cost C$/t 15.62
Total BCOG Operating Cost C$/t 184.01
Royalty* % 0.00%
True North - LOM BCOG opt 0.131
True North – LOM BCOG g/t 4.49 *Note: True North operation does not pay Royalties
15.2 TAILINGS MINERAL RESERVE ESTIMATION
The tailings Mineral Reserve estimation is based on separate cut-off grades of 0.026 opt Au
(0.89 g/t Au) for 2016 to 2018 and 0.020 opt Au (0.69 g/t Au) for 2019 to 2023 as shown in
Tables 15.6 and 15.7. The tailings reserve cut-off grade has been calculated from the following
parameters:
Gold Price: US$ 1,200 per oz.
Exchange Rate: C$ to US$: 0.80:1
Operating Cost: C$34.60 per ton
Recovery: 90%
Cut-off: 0.026 opt Au (0.89 g/t Au)

P&E Mining Consultants Inc., Report No. 315 Page 102 of 171
Klondex Canada Ltd. True North Gold Mine
TABLE 15.6
2016 TO 2018 TAILINGS RESERVE BCOG CALCULATION CRITERIA
Unit Cost Units BCOG
Metal Price C$/Oz 1,500
Metallurgical Recovery % 90%
Payable Metal % 100%
Conversion Factors 31.1035
True North – Cost Summary
Process Operating Cost C$/t $ 25.06
Sustaining Capital Cost C$/t $ 6.39
Site G&A Cost C$/t $ 3.15
Total BCOG Operating Cost C$/t $ 34.60
Royalty* % 0.00%
True North – Tailings BCOG opt 0.026
True North – Tailings BCOG g/t 0.89 *Note: True North operation does not pay royalties
Gold Price: US$ 1,200 per oz.
Exchange Rate: C$ to US$: 0.80:1
Operating Cost: C$26.97 per ton
Recovery: 90%
Cut-off: 0.020 opt Au (0.69 g/t Au)
TABLE 15.7
2019 TO 2023 TAILINGS RESERVE BCOG CALCULATION CRITERIA
Unit Cost Units BCOG
Metal Price C$/Oz 1,500
Metallurgical Recovery % 90%
Payable Metal % 100%
Conversion Factors 31.1035
True North – Cost Summary
Process Operating Cost C$/t 18.01
Sustaining Capital Cost C$/t 2.56
Site G&A Cost C$/t 6.40
Total BCOG Operating Cost C$/t 26.97
Royalty* % 0.00%
True North –Tailings BCOG opt 0.020
True North –Tailings BCOG g/t 0.69 *Note: True North operation does not pay royalties
In addition to the underground Mineral Reserve estimate, there are 1,278,000 tons (1,159,000
tonnes) of tailings Mineral Resource containing 36,000 Indicated oz of Au that were converted to
Mineral Reserves and considered for processing as indicated below in Table 15.8 and described
in section 16. The tailings re-processing project will be continued during May to October when
outside conditions permits to recovered the material and will be transferred for processing in
order to increase True North process plant utilization and generate additional revenue. The
tailings Mineral Reserve represents an economic upside to the project.
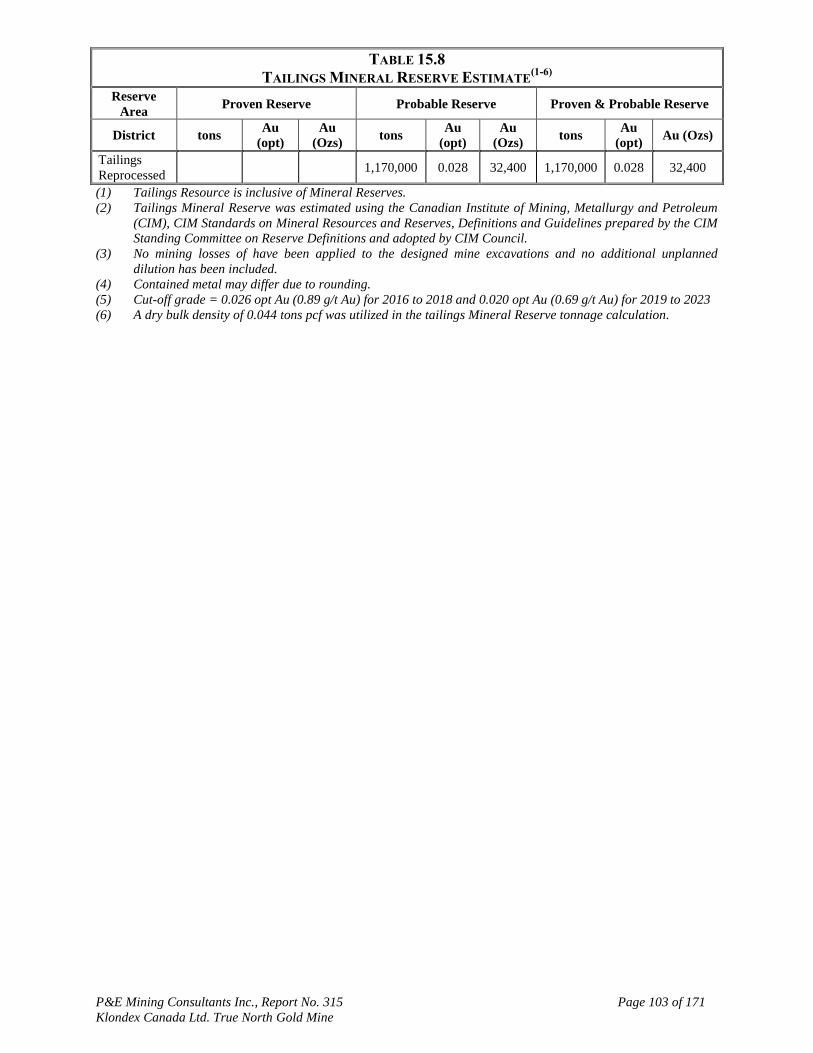
P&E Mining Consultants Inc., Report No. 315 Page 103 of 171
Klondex Canada Ltd. True North Gold Mine
TABLE 15.8
TAILINGS MINERAL RESERVE ESTIMATE(1-6)
Reserve
Area Proven Reserve Probable Reserve Proven & Probable Reserve
District tons Au
(opt)
Au
(Ozs) tons
Au
(opt)
Au
(Ozs) tons
Au
(opt) Au (Ozs)
Tailings
Reprocessed 1,170,000 0.028 32,400 1,170,000 0.028 32,400
(1) Tailings Resource is inclusive of Mineral Reserves.
(2) Tailings Mineral Reserve was estimated using the Canadian Institute of Mining, Metallurgy and Petroleum
(CIM), CIM Standards on Mineral Resources and Reserves, Definitions and Guidelines prepared by the CIM
Standing Committee on Reserve Definitions and adopted by CIM Council.
(3) No mining losses of have been applied to the designed mine excavations and no additional unplanned
dilution has been included.
(4) Contained metal may differ due to rounding.
(5) Cut-off grade = 0.026 opt Au (0.89 g/t Au) for 2016 to 2018 and 0.020 opt Au (0.69 g/t Au) for 2019 to 2023
(6) A dry bulk density of 0.044 tons pcf was utilized in the tailings Mineral Reserve tonnage calculation.

P&E Mining Consultants Inc., Report No. 315 Page 104 of 171
Klondex Canada Ltd. True North Gold Mine
16.0 MINING METHODS
16.1 MINE DEVELOPMENT
16.1.1 Access Development
True North is an underground mining operation that has been in almost continuous operation
since the early 20th
century. Over the years, the mine has employed many mining methods
including shrinkage, sublevel stoping, cut and fill and panel stoping.
Currently, the Project has two main production levels, namely 16L and 26L, which are accessed
via a 4,400 foot (1,341m) two compartment shaft (A-Shaft). The 710 Zone mining complex is
the main mining area and is located approximately 6,600 feet (2,000m) from the main shaft
along the 26L access level.
The main haulage track drift on 26L is used to access the 710 Vein. In order to access above and
below the 26L, the 710 Vein has a 12 foot by 12 foot (3.7m x 3.7m) incline and decline driven at
a maximum gradient of +/-15% with access cross-cuts into the ore body every 60 feet (18m)
vertically. Additional infrastructure along the incline includes a vertical ventilation and escape
raise and an ore and waste pass system.
A longitudinal section through the mine is provided in Figure 16.1.
16.1.2 Geotechnical
Rock characteristics at True North are typical northern Canadian shield conditions with very
little water and very competent with RMR ranging from 65% to 85%. In large areas and stopes
all necessary joint sets are mapped and a ground support standards are reviewed using Unwedge.
The Uniaxial Compressive Strength (UCS) of the ground is 200 million pascal (MPa), due to the
depth of the 710 vertical stress will range from 30MPa to 40MPa with maximum horizontal
stress being 1.3*vertical stress.
16.1.3 Ground Support
The ground conditions at True North are typical of those found elsewhere in the northern shield,
with typically dry and very competent conditions. The main ground support system is resin
encapsulated 6 ft (1.8m) #6 rebar bolted in a 4 foot by 4 foot (1.2m by 1.2m) pattern, supporting
4 inch (0.1m) welded wire mesh. In areas wider than 18 feet (5.5m), 8 feet (2.4m) #6 rebar bolts
replace the 6 foot (1.8m) rebar bolts.
Where more adverse conditions are encountered in long-hole stopes, 20 feet (6m) and 30 feet
(9m) long grout encapsulated cable bolts are installed as well as in intersections with span
between 20 feet and 30 feet (6m to 9m). The cable bolt pattern is determined from the specific
conditions and are drilled with a long-hole drill and then fully grouted.

P&E Mining Consultants Inc., Report No. 315 Page 105 of 171
Klondex Canada Ltd. True North Gold Mine
Figure 16.1 Longitudinal Section

P&E Mining Consultants Inc., Report No. 315 Page 106 of 171
Klondex Canada Ltd. True North Gold Mine
16.1.4 Ventilation and Secondary Egress
Underground mining relies on diesel equipment in the process to extract the ore and waste rock
and to transport backfill to the stopes. The Project is ventilated through an intake connection to
surface. This air route includes travel through historic mining areas and from there, it is directed
to the 24L and distributed to the main 710 Zone mining horizon via horizontal and vertical
openings. All of the air eventually exhausts out through A- shaft. Fans located in development
headings ventilate working faces. The surface intake fan is powered by two 150 horsepower (hp)
(110 kilo Watt [kW]) fans and the 24L main ventilation fans deliver 75,000 cubic feet per minute
(cfm) (5.7 m3/sec) to the 710 Zone. A ventilation schematic is provided in Figure 16.2.
Two means of secondary egress are available at the project including a man-way with ladders
and landings in A-shaft. A second man-way connection to surface is via a timbered raise from
26L to 16L, which continues on to a man-way up B shaft to 8L and then on to a series of other
raises from 8L to surface.
16.2 POWER DISTRIBUTION AND DEWATERING
Electrical power to the mine is provided by a 4,160-volt feeder connection which is stepped
down to 480 volts for distribution. Step down transformers and circuit protection are provided by
22 load centers located throughout the mine. Excess mine water is dewatered from 26L to 16L to
10L and then to the process plant where is it sent to tailings. The mine purges water on a weekly
basis at approximately 300 gallon (1.36m3)/week, however, most water is recycled and inflow
from the surrounding rock is minimal.

P&E Mining Consultants Inc., Report No. 315 Page 107 of 171
Klondex Canada Ltd. True North Gold Mine
Figure 16.2 True North Gold Mine 710 Complex Ventilation System
500 Feet

P&E Mining Consultants Inc., Report No. 315 Page 108 of 171
Klondex Canada Ltd. True North Gold Mine
16.3 MINING METHODS
The primary mining method at the Project is long-hole stoping which is a cost effective method
to mine the complex geology at the Project, and benefits from a quick stope cycle time. In areas
where mineralization does not warrant the development of a ramp access system, Klondex
employs captive sublevel stoping methods.
16.3.1 Long-hole Stoping
Long-hole stoping is the lowest cost method used at the Project and generally also provides the
lowest total cost per ounce of gold produced.
Level accesses are driven perpendicular towards the ore body every 60 feet (18m) vertical. From
these access drifts, 8 foot x 9 foot (2.4m x 2.7m) sills are developed along the strike of the
mineralized zone (Figure 16.3).
Figure 16.3 Long-hole Open Stope Sill Development
Once the levels are developed, a slot raise is driven between the levels which provides the free
face necessary for long-hole blasting. Subsequently, long-hole drilling is carried out with 2.5
inch (64mm) holes on a 3foot (0.9m) ring burden. The actual drill pattern is determined by the
stope shape. (Figure 16.4).

P&E Mining Consultants Inc., Report No. 315 Page 109 of 171
Klondex Canada Ltd. True North Gold Mine
Figure 16.4 Long-hole Open Stope Raise and Drilling
Once all long-hole drilling is completed, the stope is loaded with explosives and blasted. A diesel
powered load-haul-dump machine (LHD) is used to move the blasted material from the under-
cut. The LHD is equipped with line-of-sight remote control mechanism to allow the removal of
all blasted rock without exposing operating personnel to the open stope and the potential risk of
ground falls (Figure 16.5).
Figure 16.5 Long-hole Open Stope Blasting
After all blasted material has been extracted, the remaining void is backfilled with waste rock
(Figure 16.6).

P&E Mining Consultants Inc., Report No. 315 Page 110 of 171
Klondex Canada Ltd. True North Gold Mine
Figure 16.6 Long-hole Open Stope Backfilling
Figure 16.7 shows a fairly typical over-cut and undercut access and sill in plan view, and Figure
16.8 shows a typical drill ring section.
Figure 16.7 Over-cut and Under-cut Plan View

P&E Mining Consultants Inc., Report No. 315 Page 111 of 171
Klondex Canada Ltd. True North Gold Mine
Figure 16.8 True North Gold Mine Typical Long-hole Drill Section
16.3.2 Captive Sub Level Long-hole Stoping
Captive sub level long-hole stoping is used in situations where an up-ramp access cannot be
economically justified. This mining method uses three 6 foot by 6 foot (1.8m by 1.8m) raises up
to 60 feet (18m) in length. One raise acts as a slot raise for the long-hole blasts to slash into; the
second raise acts as a mill-hole for muck from the sublevel where broken ore is slushed into; and
the last is a access man-way. At the top of the raises an 8 foot by 9 foot (2.4m by 2.7m) sublevel
is driven along the strike of the ore body. An air slusher is used to move the development muck
from the sublevel over to and down the mill hole. If the mineralization warrants, another series of
raises and a sublevel are developed.
After all of the raises and sublevels are developed, long-hole drilling is carried out with an air
drill capable of drilling 2.5 inch (64mm) holes on a 3 foot (0.9m) ring burden. These rings are
blasted into the slot raises. The material drops to the bottom level and a remote controlled LHD
removes the blasted ore without exposing the operator to the open stope and the potential risk of
ground falls.
Figure 16.9 shows an arrangement of two sub-levels of a sub level captive long-hole stope.

P&E Mining Consultants Inc., Report No. 315 Page 112 of 171
Klondex Canada Ltd. True North Gold Mine
Figure 16.9 True North Gold Mine Sub-Level Captive Long-hole Stope
16.3.3 Haulage
Ore and waste rock generated from the incline of the 710 Zone mining complex is hauled with
LHDs to the vertical ore and waste chute system which connects to the 26L haulage drift. The
material is then loaded into rail cars and hauled from the rock passes along the haulage drift with
a diesel locomotive and 5 ton (4.5 tonne) rail cars. The cars are dumped at a grizzly equipped
with a rock breaker and the material is sent to the loading pocket below 26L, from where it is
hoisted in the shaft to surface in a 5 ton (4.5 tonne) capacity skip.
In the 710 Zone mining complex decline, ore and waste are hauled to the 26L haulage drift via
two 13 ton (12 tonne) rubber tired underground mining haul trucks. These haul trucks deliver the
ore and waste rock to the 710 ore and waste bins. From these ore bins, the follows the same route
as described in the above paragraph.
16.3.4 Backfilling
Waste rock is moved from development to stoping whenever possible and major fill zones are
created in the mining through the down hole long-hole method on the 710 incline. The decline
will not create fill void and will require sill pillars at certain level intervals. With the mining in
the incline being filled, a percentage of waste rock will need to be removed from the mine but
there will be sufficient material to fill the created void as per Table 16.1.
TABLE 16.1
WASTE ROCK BACKFILL AND STOPE VOIDS
Period Q4 - 2016 2017 2018 Total
Waste Rock Backfill Created - tons 34,000 119,000 70,000 223,000
Stope Voids Created - tons 14,000 98,000 56,000 168,000
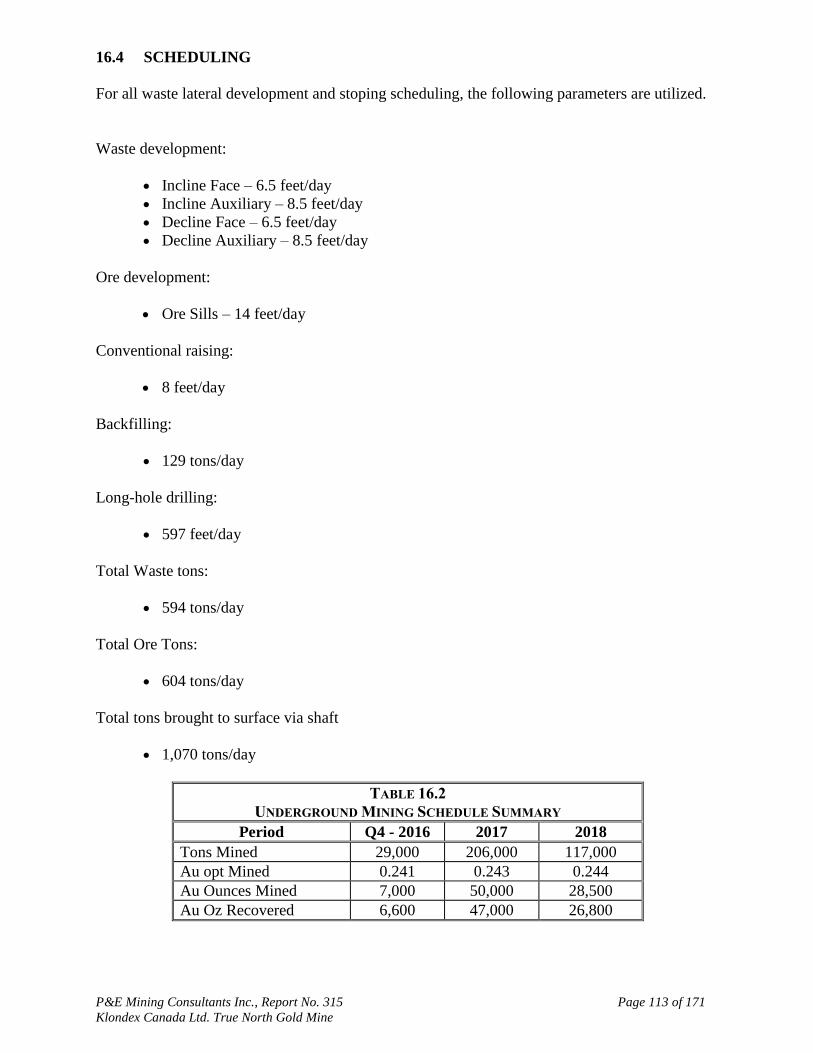
P&E Mining Consultants Inc., Report No. 315 Page 113 of 171
Klondex Canada Ltd. True North Gold Mine
16.4 SCHEDULING
For all waste lateral development and stoping scheduling, the following parameters are utilized.
Waste development:
Incline Face – 6.5 feet/day
Incline Auxiliary – 8.5 feet/day
Decline Face – 6.5 feet/day
Decline Auxiliary – 8.5 feet/day
Ore development:
Ore Sills – 14 feet/day
Conventional raising:
8 feet/day
Backfilling:
129 tons/day
Long-hole drilling:
597 feet/day
Total Waste tons:
594 tons/day
Total Ore Tons:
604 tons/day
Total tons brought to surface via shaft
1,070 tons/day
TABLE 16.2
UNDERGROUND MINING SCHEDULE SUMMARY
Period Q4 - 2016 2017 2018
Tons Mined 29,000 206,000 117,000
Au opt Mined 0.241 0.243 0.244
Au Ounces Mined 7,000 50,000 28,500
Au Oz Recovered 6,600 47,000 26,800

P&E Mining Consultants Inc., Report No. 315 Page 114 of 171
Klondex Canada Ltd. True North Gold Mine
16.5 EQUIPMENT FLEET UNDERGROUND
A summary of all underground mining equipment requirements are listed in Table 16.3.
TABLE 16.3
REQUIRED MINING EQUIPMENT
Description Quantity
Development
3.5yd3 (2.7m
3) scoop 4
2.5yd3 (1.9 m
3)scoop 1
1 boom jumbo 3
scissor decks 2
13 ton (12 tonne) haul trucks 2
Production
Air powered long-hole drill 2
2.5yd3 (1.9m
3) remote controlled
scoop 4
Tramming Locomotive 4
5 ton (4.5 tonne) rail cars 20
Ancillary
Scissor lift 1
Boom truck 1
grease truck 1
Telehandler 1
Kubota RTV or Toyota Land Cruiser 3
16.6 TAILINGS REPROCESSING
Tailings reprocessing will be carried out from 2016 to 2023, initially during the underground
mining operations (2016 to 2018) and subsequently following cessation mining operations (2019
to 2023), as a stand-alone operation. This seasonal reprocessing operation will be conducted at a
process plant throughput of 1,200 tpd (1,189 tonnes per day).
Dry tailings material is extracted throughout the historic tailings and moved to the pump station
using a dozer. The pump station consists of a 50 HP (37 kW) pump, a reclamation water supply
and a water reservoir. During operation, dry material can be moved at a rate of 39 tons (35
tonnes) per hour from the tailings pump. The material is fed into a reservoir and is diluted into
slurry with high pressure water jets. The slurry is pumped from the historic tailings pond and into
a holding tank located at the tailings substation, on the bank of the historic tailings pond. The
tailings substation consists of a holding tank with a 75 HP (56kW) pump inside, valves to direct
process water, electrical controls for the pumps and auxiliary equipment and a diesel powered
generator.
From the holding tank, the slurry is pumped through a 10 inch (250mm) line to the grinding bay
at the process plant. A flow rate is maintained using the pump located in the tank and a 50 HP
(37 kW) booster pump located approximately 3,000 feet (1 km) along the reprocessing line.
Process water is added to the holding tank as required in order to maintain a consistent
suspended solids level, heading to the process plant. Tailings slurry is pumped to the process
plant with a flow rate above 600 gallons (2.7m3) per minute maintained and a typical suspended
solids rating of 20%. Tailings material is sent to a de-watering cyclone located in the process

P&E Mining Consultants Inc., Report No. 315 Page 115 of 171
Klondex Canada Ltd. True North Gold Mine
plant grinding bay where the overflow from the cyclone is returned to the new tailings pond and
the underflow is sent into the grinding circuit.
A schedule for tailings reprocessing is shown in table 16.4.
TABLE 16.4
TAILINGS REPROCESSING SCHEDULE
Period 2017 2018 2019-2023*
Tons Reprocessed 80,000 115,000 195,000
Au opt Reprocessed 0.036 0.036 0.026
Au Oz Reprocessed 2,900 4,100 5,100
Au Oz Recovered 2,600 3,700 4,600
* Annual figures for 2019 to 2023
Figures 16.10 and 16.11 respectively depict the tailings recovery flow diagram and an aerial
view of the tailings recovery site.
Figure 16.10 Tailings Recovery Flow Diagram
Figure 16.11 Aerial View of Tailings Recovery Site

P&E Mining Consultants Inc., Report No. 315 Page 116 of 171
Klondex Canada Ltd. True North Gold Mine
17.0 PROCESS PLANT AND PROCESS RECOVERY
In 2011, the process crushing plant was expanded by adding a new primary 30 inch by 42 inch
(760mm by 1067mm) jaw crusher, a GP300 gyratory crusher as a secondary breaker and a
Barmac B8000 VSI (vertical shaft impact) crusher as a tertiary unit. There units are all in line
with a 7 foot by 20 foot(2.1m by 6.1m) triple deck vibrating screen. See Figure 17.1
The process plant feed is ground in an AC 12 ½ foot by 14 foot (3.8m by 4.3m), 1,250 HP (933
kW) ball mill to 67% passing Tyler 200 mesh (74 microns). A portion of the process plant
circulating load is passed through one of two 20” (500mm) gravity concentrators. Concentrate
from these units s upgraded on an 8 foot (2.4m) shaking table. The table concentrate is direct
smelted. Tails from the concentrators and the shaking table are returned to the head end of the
grinding mill. The fines from the grinding circuit are fed to one of two rows of 10m3 OUTOTEC
tank cells producing both a rougher concentrate grading between 5 and 10 opt (171 and 343 g/t
Au) and a scavenger concentrate that is very low grade. The scavenger concentrate is circulated
to the main grinding circuit. Rougher concentrate is collected and reground through an 8 foot by
6 foot (2.4m by 1.8m) ball mill to 98% passing Tyler 400 mesh (37 microns), thickened and
leached in a three stage leach circuit of 12 foot by 24 foot (3.6m by 7.2 m) tanks. Dissolved gold
is recovered using a six stage carbon-in-pulp circuit using 12ft. x 14ft (3.6m x 4.3m) vessels. The
carbon is then eluted in a stainless steel pressure strip vessel. The elution liquor is passed through
an electrowinning cell fitted with stainless steel anodes and cathodes. Gold sludge from this cell
is then smelted in an electric induction furnace.
Current process plant recovery is name plated at 93.5% based on a feed grade of 0.16 opt (5.5
g/t). This recovery is grade dependent and has been as high as 96.5% with higher feed grades.
Past and current processing analyses have shown that the process plant feed is clean displaying
no evidence of any deleterious constituents such as arsenic, mercury or antimony that would
otherwise affect gold recovery in the leach circuit. Copper in solution is sometimes high.
The process plant operates on a 14 day on, 14 day off, 12 hour per day schedule utilizing four
crews. See process plant production schedule in Table 17.1.
An economic assessment is underway looking into leaching the flotation tails and solids from the
tailing storage facility. According to the potential future flow sheet the existing flotation
concentrate leach circuit would remain intact with flotation tails reporting to a new pre-leach
thickener. Slurry would be pumped from the existing tailings storage facility over a new trash
screen. The flotation tails and trash screen undersize would be combined and thickened using the
new thickener. The thickener underflow would be pumped to a series of six CIL tanks for
cyanide leaching. The CIP tails from the flotation concentrate leach circuit will be pumped to the
new CIL circuit. Carbon would be transferred counter current from the slurry with the carbon
from the first CIL tank being pumped either to the acid wash vessel or to the flotation
concentrate CIP circuit depending upon operational conditions. Material from the tailings storage
facility would be pumped back to the process plant for processing as weather allows. It is
estimated that the tailing pumping would operate approximately six months of the year. During
the winter months only the flotation underflow alone would report to the new thickener and then
pumped to the new CIL circuit. The CIP tails from the flotation concentrate leach would
continue to be pumped to the new CIL circuit.

P&E Mining Consultants Inc., Report No. 315 Page 117 of 171
Klondex Canada Ltd. True North Gold Mine
Figure 17.1 True North Gold Mine Process Plant Flow Sheet
TABLE 17.1
PROCESS PLANT PRODUCTION SCHEDULE
Period Q4 - 2016 2017 2018 2019 – 2023*
Tons Processed 29,000 286,000 232,000 195,000
Au opt Processed 0.241 0.185 0.141 0.026
Au Oz Processed 7,000 52,900 32,600 5,100
Au Oz Recovered 6,600 49,600 30,500 4,600
* Annual figures for 2019 to 2023
In 2019, the underground mining operation will cease. However, the processing plant will
continue to take historic tailings for reprocessing for another 5 years until 2023. This material
will not require grinding therefore the processing plant will be able to operate at a rate of 1,200
tpd (1,189 tonnes per day) for this period, however, it will only be a seasonal operation, running
from May to Oct each year.

P&E Mining Consultants Inc., Report No. 315 Page 118 of 171
Klondex Canada Ltd. True North Gold Mine
18.0 PROJECT INFRASTRUCTURE
True North has been an active mine for almost 90 years except for some periods of inactivity.
During this timeframe the onsite infrastructure has been updated, upgraded and improved
continuously by its respective historic owners. Figure 18.1 illustrates the current layout of the
surface infrastructure.
Figure 18.1 Surface Infrastructure Plan View
18.1 LOCATION AND ACCESS
The Project is located adjacent to the town of Bissett Manitoba, which is 235km northeast from
Winnipeg Manitoba. Bissett and the Project are accessible via provincially maintained public
roads connecting to Winnipeg. Bissett provides employee housing and support services to the
Project.
18.2 ACCOMMODATIONS AND CAMP FACILTIES
The Project has a 300 room camp facility located near the main administration offices which
includes a kitchen and dining facility, and recreation and fitness facilities. The majority of
employees and contractors working on site are currently accommodated at this facility during
shift rotations. In addition, the town of Bissett offers options for employee room and board.

P&E Mining Consultants Inc., Report No. 315 Page 119 of 171
Klondex Canada Ltd. True North Gold Mine
18.3 ELECTRICAL POWER AND ON-SITE DISTRIBUTION
The Project is supplied power by Manitoba Hydro grid through two power lines which provides
20MW to the Project transformer station. The twin power line provides a redundancy such that in
the event of a single line power outage, the mine, process plant and surface facilities can still
function in a limited capacity on 10MW.
18.4 WATER SUPPLY AND RETICULATION
Potable water is supplied from the town of Bissett’s water supply.
Process water for the mine is reclaimed from the tailings pond and water recovered from the
underground workings.
18.5 AIR COMPRESSORS
Compressed air for the underground workings is provided by five 300hp (224kW) and two
150hp (122kW) compressors located in a central compressor house. The compressed air is
distributed throughout the Project through a network of 10 inch and underground and plant
smaller airlines.
18.6 DIESEL FUEL AND ON-SITE STORAGE FACILITY
Diesel fuel is supplied to the onsite storage tanks by commercial road tanker from a major fuel
supplier’s central depot in Winnipeg. The diesel fuel for the underground machinery is
transported from the onsite storage tanks to the underground SasStat fuel storage facility via fuel
cars on the mine cage.
18.7 WAREHOUSING AND MATERIAL HANDLING
The Project is serviced from a two-story, heated, 445m2 (4,800 ft
2) warehouse building, a 223 m
2
(2,400 ft2) cold storage area, as well as three cold storage tents and a 9,290 m
2 (100,000 ft
2)
secured yard storage. There is also a gravel surfaced storage area that is unsecured.
18.8 SITE SECURITY
The Company employs an external security contractor, who monitors the Project from a central
security outpost at the main gate. There are also roaming security personnel. Currently, the
Project is surrounded by chain link fencing.
18.9 COMMUNICATION
Voice and data communications are routed through the Bissett Manitoba Telephone System
microwave tower. This tower also provides cell phone coverage for the Project and town site.
On-site and underground communications is via a radio over leaky feeder network which is
maintained and extended as need it by the Project personnel.

P&E Mining Consultants Inc., Report No. 315 Page 120 of 171
Klondex Canada Ltd. True North Gold Mine
18.10 ON SITE TRANSPORT AND INFRASTRUCTURE
The Company provides bus transportation from Winnipeg to site on scheduled shift rotations.
Light vehicles and pickups are provided on-site to transport mine workers from accommodations
to their respective work areas.
18.11 SOLID WASTE DISPOSAL
Waste is managed in dumpsters and other appropriate waste containers. Waste and materials for
recycling are disposed of off-site by an external contractor located in Pine Falls. Additionally the
external contractor removes waste hydrocarbons for disposal or recycling.
18.12 PARTS AND MINE SUPPLY FREIGHT
All supplies and other consumables required to operate the mine, process plant and surface
facilities are brought in via all season access road from approximately 235 Km NW of Winnipeg,
Manitoba by various freight-forwarding contractors.
18.13 MOBILE AND FIX EQUIPMENT MAINTENACE FACILITY
There are 5 maintenance bays, welding and tire facilities at the Project which have been
upgraded by the previous owner to accommodate and provide an enclosed facility for all
maintenance activities. This is especially useful during winter season when temperature can
plunge as low as -31oF (-35
oC).
18.14 FIRST AID AND AMBULANCE
The Project has a first-aid clinic, ambulance and trained personnel on stand-by for any medical
attention or emergency that may arise. An air ambulance service is readily available from the
nearby Winnipeg Emergency Rescue Service.
18.15 OFFICE AND ADMINISTRATION BULDINGS
The Project hosts a recently constructed (by the previous operator) modern office and
administration facility that is capable of accommodating the necessary engineering, geological,
accounting, safety, environmental, and administrative personnel.
18.16 TAILINGS STORAGE
The Tailings Management Area (TMA) is located approximately 1 mile (1.6 km) north of the
process plant in an area naturally defined by bedrock ridges around the perimeter of a previously
flat boggy area. The original ground surface of the bog was near elevation 889 feet above sea
level (asl) (271 m asl) (geodetic) with bedrock ridges on the south and west sides up to 920 feet
asl (280 m asl) and bounded to the north by bedrock up to elevation 985 feet asl (300 m asl).
Since the development of the TMA, tailings have been pumped from the process plant to the
TMA via an approximate 1 mile (1.6 km) pipeline. It is understood that during mine operation,
the tailings are transported as slurry, with 34% (approx.) solids by weight. The TMA currently
consists of 8 dykes with a number of the embankments separated by bedrock outcroppings such
that they follow an A/B nomenclature. The embankments have been designed and constructed in
various stages and phases from 1997 onwards to the most recent raises and improvements

P&E Mining Consultants Inc., Report No. 315 Page 121 of 171
Klondex Canada Ltd. True North Gold Mine
completed from 2012 to 2014. The current configuration of the TMA consists of a tailings pond
and polishing pond, separated by dyke 7. The west half (approx.) of the tailings pond has reached
its capacity, with tailings placed up to the crest of dykes 1, 2, 8 and a portion of dyke 3, while the
east half of the tailings pond contains tailings submerged beneath water ranging in depth from
less than 3 feet (1m) to several feet (metres). No spillway or low level outlet structures are
present in the TMA. It is understood that the TMA has been designed to safely retain water from
the mill discharge, runoff, and storm events.
In order to increase the capacity to retain tailings beyond the current capacity of the TMA, a new
area, termed the East Tailings Management Area (ETMA) was currently undergoing
development until the most recent mining operations ceased in 2015. The ETMA is located
directly east of the TMA and currently consists of dyke 9 along its south perimeter, with dyke 6
of the TMA forming the containment along the west side. The natural contours to the north and
east provide containment of the remainder of the ETMA.
Dyke 9 has an overall length of nearly 5,000 feet (1,500m) and at its current constructed
elevation, has a height of 10 feet to 13 feet (3m to 4 m). No spillway or low level outlet
structures are present in the ETMA. It is understood that the TMA has been designed to safely
retain water from the process plant discharge, runoff, and storm events.
A dam safety review was conducted by Stantec Consulting Ltd. geotechnical engineers in 2015.
18.17 STOCKPILES
The True North site has an existing waste rock stockpile which currently contains approximately
200,000 tons (180,000 tonnes) on an area of 4.6 acres (1.9 ha). This waste material is utilized to
construct the tailings containment berms
The site is permitted to stockpile up to 10,000 tons (9,000 tonnes) of ore permanently and 50,000
tons (45,000 tonnes) of ore on surface as outlined in the 2016 temporary permit.

P&E Mining Consultants Inc., Report No. 315 Page 122 of 171
Klondex Canada Ltd. True North Gold Mine
19.0 MARKET STUDIES AND CONTRACTS
Gold and silver doré bars are the principal commodities produced at the Project. The Project also
produces a small amount of certain gold and silver bearing by-products, such as loaded carbon.
All gold and silver doré bars and by-products are sent to third parties for refining to produce
bullion that meets the required London Bullion Market Association standards of 99.95% pure
gold and 99.90% pure silver. Doré bars are transported to a refinery via secure transportation
(“armored car”). Under the terms of Klondex’s refining agreements, their share of the refined
gold and the separately-recovered silver are credited to their account or delivered to buyers based
on instructions provided to the refiner from the Company.
For the purpose of this study, trailing average prices for gold were investigated as possible gold
price indicators for future production. Whereas the Mineral Resource estimates were based on a
gold selling price of C$1,750 per oz (US$1,400 per oz), the Mineral Reserve Estimates were
based on a selling price of C$1,500 per oz (US$1,200 per oz).
Gold and silver has two main categories of use: fabrication and investment. Gold and silver
prices are quoted in active world spot markets in US dollars per troy ounce. The prices of gold
and silver are variable and sometimes volatile in nature. Prices are affected by many factors
beyond Klondex’s control, such as the sale or purchase of gold by central or reserve banks or
other monetary authorities and financial institutions such as commercial banks; inflation or
deflation and monetary policies; fluctuation in the value of the US dollar and other foreign
currencies; global and regional demand; and the political and economic conditions of countries
throughout the world.
A description of the Company’s material contracts is as follows:
Asahi Refining Canada Ltd. – Refines gold and silver doré bars.
Brinks Canada Limited – Securely transports gold and silver doré bars to the
refinery.
Auramet International LLC Trading – Purchases gold and silver.
Investec Bank plc – Purchases gold and silver.

P&E Mining Consultants Inc., Report No. 315 Page 123 of 171
Klondex Canada Ltd. True North Gold Mine
20.0 ENVIRONMENTAL STUDIES, PERMITTING, AND SOCIAL OR
COMMUNITY IMPACT
20.1 SUMMARY
The previous mine operator San Gold held an Environmental Act License covering mining,
processing and tailings management area operations for the Project. San Gold also held an
accepted Mine Closure Plan and had pledged certain fixed assets to provide financial security for
closure. Klondex has since obtained a revised Environmental Act Licence for the Project and
approvals of minor alternations required for its Project. The San Gold Mine Closure Plan (2012)
and the pledged fixed-asset financial security for the mine closure plan were transferred to
Klondex in January 2016.
Klondex has been conducting required environmental monitoring including water quality
sampling and environmental effects monitoring work; developing procedures for its
environmental management system; and is in the process of re-initiating First Nations and
Aboriginal community engagement including final effluent release reporting.
In consideration of the historic activities and planned activities at this Project, the Author has
reviewed historic and current information on the Project including: current legislation affecting
mine permitting, operations and closure in Manitoba; the revised Environment Act License for
mining, processing and tailings management recently issued to Klondex; relevant reports
prepared as part of a harmonized federal-provincial environmental assessment for a tailings
management expansion project approved in 2013 including public comments and First Nations
and Aboriginal community consultation conducted at that time; and other information. The
Author also contacted the Author of the metallurgical components of this report in regard to the
process plant complex and Klondex’s Environmental Superintendent about the current
environmental–social status of the Project.
Based on the available information, P&E is of the opinion that there do not appear to be any
insurmountable environmental and/or social barriers to the Project.
20.2 SCOPE OF THE PROJECT
The scope of True North Gold Mine includes:
Underground mine development and production. True North includes six underground mines
(i.e. Cohiba Zone, SG-1, 710/711 Zone, 007 Zone, Hinge Zone, Rice Lake), a vertical shaft, two
decline ramps, a mill, an ore feed pad, mill feed crushing and conveying, a waste rock
management area, and a tailings management area (“TMA”).
Klondex commenced ramp-up activities in early 2016 including test stope mining and
stockpiling in advance of a production decision. This underground work has included
underground mining using conventional narrow vein long-hole stoping methods at the 710/711
and Cohiba Zones. It is projected that underground mining would produce about 800 tpd using
conventional drill and blast methods, rail load and haul technologies, and a vertical shaft and two
decline ramps.
The re-processing of historic process plant tailings for gold and silver recovery commenced
earlier this year with approval from the Province of Manitoba - historic tailings are being

P&E Mining Consultants Inc., Report No. 315 Page 124 of 171
Klondex Canada Ltd. True North Gold Mine
dredged, pumped to the process plant for treatment. The re-processed tailings are re-deposited in
another section of the TMA.
20.3 ONGOING EXPLORATION AND PROJECT DEVELOPMENT
Klondex acquired Mineral Lease ML-63 (formerly known as the Rice Lake Gold Mine) at
Bissett, Manitoba in 2015 when the Project was inactive under a temporary suspension of
operations. Mineral exploration and mining activities have been undertaken at the Project since
about 1932 with ownership having changed numerous times over time.
In the present process plant flowsheet, the comminution stage includes crushing and a closed
grinding circuit with hydrocyclones. The hydrocyclone overflow is directed to gravity
concentrators and the resulting gravity concentrate is further processed using a shaking table
with the table concentrate sent to the smelting furnace. The crushing circuit feeds the flotation
circuit. The rougher concentrate is re-ground, dewatered and pumped to the carbon-in-leach
(“CIL”) circuit. The rougher cell tailings are pumped to scavenger cells, and the scavenger
concentrate is fed back to the grinding circuit. Rougher flotation concentrate is leached in a three
tank leach circuit followed by a six stage CIL circuit. Loaded carbon is eluted in a conventional
strip circuit and gold is electrowon from the eluate. An Inco SO2-air cyanide destruction process
is used to treat CIL circuit wastewater. Natural degradation is used to destroy residual cyanide in
the tailings pond water. The six-stage CIL circuit is currently being used as part of Klondex’s
tailings re-processing project.
The present TMA includes a designed tailings storage containment area and a water polishing
pond. Water quality is monitored through sampling and excess pond water is pumped and
released to No Name Creek over a specified effluent release time line. TMA water pond levels,
water quality, available water storage capacity and available freeboard are monitored by
Klondex’s environmental staff.
20.4 INFORMATION REVIEW AND ASSESSMENT
20.4.1 Documentation reviewed
The documentation reviewed by the Author included:
The regulatory regime affecting mine permitting, operations and mine closure in Manitoba.
Revised Environment Act License 2628 RRR issued to Klondex Canada Ltd. for the “True North
Gold Mine” on September 16, 2016, and Klondex’s April 2016 request for a minor alteration to
allow early discharge from the East Tailings Pond and tailings re-processing – the latter
document provides East Tailings Pond water quality data for a February 18, 2016 water sampling
event. The QP also reviewed historical Environment Act License 2628 R which applied to Rice
Lake Gold Corporation’s “Bissett Gold Mine” operations in 2004.
Relevant parts of the Environmental Assessment Proposal (EAP) filed in 2012 for a Class 2
development comprised of the expansion and operation of the TMA. That development included
the construction of an additional main tailings pond, a polishing pond and three access roads.
Treated water from the new polishing pond would be pumped to the existing polishing pond for
discharge to No Name Creek from June 15 to November 30. The Author also reviewed
comments on the EAP received from:

P&E Mining Consultants Inc., Report No. 315 Page 125 of 171
Klondex Canada Ltd. True North Gold Mine
Environment Canada, the Canadian Environmental Assessment Agency and
Health Canada;
Manitoba departments and branches including Manitoba Conservation & Water
Stewardship, Climate change and Environmental Protection Division, Mines
Branch, Community Planning Services, Sustainable Resource and Policy
management Branch, Aboriginal Relations, Workplace Safety and Health
Division;
The Kookum’s of Hollow Water First Nation and a trapper from the Hollow
Water First Nation; and
The Wanipigow Lake East End Cottager’s Association.
Environmental Act License 2628 RR issued in 2012 allowed for the construction and operation
of the East TMA. Stage 1 of the East TMA was completed in November 2014 and provided a
year of tailings storage capacity based on a process plant throughput of 2,500 tons per day (2,268
tonnes per day).
A 2010 Notice of Alteration for San Gold’s Cartwright Mine and Hinge Zone Bulk Sample
Collection submitted to Manitoba Conservation. It included an assessment of environmental
impacts and proposed mitigation measures in regard to air, noise, runoff and wastewater.
Other information describing the existing infrastructure, environment, and the Project.
20.4.2 Licenses, Permits and Approvals
The licenses, permits and approvals obtained to operate the Project are shown in Table 20.1.
TABLE 20.1
OBTAINED LICENSES AND KEY PERMITS AND APPROVALS
License/Permit/Approval Act/Regulation Description Issued to
License 2628 RRR.
Minor alteration.
Manitoba
Sustainable
Development
Environmental
Approvals
Environment
Act.
Environmental
Act License –
main license.
Klondex
(September
2016)
Minor alteration.
Manitoba
Sustainable
Development
Environmental
Approvals
Environment
Act.
Early
discharge of
the East
Tailings Pond
and tailings
reprocessing.
Klondex
(May 2016)
Minor alteration.
Manitoba
Sustainable
Development
Environmental
Approvals
Environment
Act.
Ore stockpile
increase to
50,000 tons.
Klondex
(May 2016)
Minor alteration.
Manitoba
Sustainable
Development
Environmental
Approvals
Environment
Act.
Tailings
reprocessing –
trucking
tailings.
Klondex
(August
2016)
Water Rights License Manitoba Water Rights License to use Klondex

P&E Mining Consultants Inc., Report No. 315 Page 126 of 171
Klondex Canada Ltd. True North Gold Mine
TABLE 20.1
OBTAINED LICENSES AND KEY PERMITS AND APPROVALS
License/Permit/Approval Act/Regulation Description Issued to
2016 – 003. Sustainable
Development
Water
Licensing
Act, Water
Rights
Regulation.
water from
lake.
Hazardous Waste
registration.
Manitoba
Sustainable
Development
Environmental
Services
Hazardous
Waste
Regulation,
Dangerous
Goods Handling
&
Transportation
Regulation.
Hazardous
waste
registration.
Klondex.
Petroleum Storage Facility
Permit.
Manitoba
Sustainable
Development
Manitoba
Conservation
Environmental
Services
Storage and
Handling of
Petroleum
Products and
Allied Products
Regulation,
Technical
Bulletins.
Above ground
storage tanks
with a capacity
of 5,000 L or
more.
Penner Oil
Crown Lands Permit
GP0003073.
Crown Lands
and Property
Agency
Crown Lands
Act.
Ventilation
raise building
situated within
the Town of
Bissett
Rice Lake
Gold
Corporation*
Crown Lands Permit
GP0005737.
Crown Lands
and Property
Agency
Crown Lands
Act. TMA
Rice Lake
Gold
Corporation* *Klondex has requested the permit holder name be changed to Klondex Canada Ltd.
Source: Klondex Canada Ltd.
20.4.3 Revised Environmental License and Minor Alterations
Revised Environmental Act License 2628 RRR
The Environmental Stewardship Division, Environmental Approvals Branch of Manitoba
Sustainable Development issued revised Environmental Act License No. 2628 RRR to Klondex
Canada Ltd. on September 16, 2016 for the operation of the “Development” being a 2,273 tonnes
per day (2,500 tons per day) gold and silver mining, processing and refining operation known as
the True North Gold Mine and including the existing and expanded TMA. Plans of mine, process
plant, and the TMA are shown in Figures 20.1 and 20.2. Figure 20.3 provides an aerial view of
the mine, process plant and TMA.

P&E Mining Consultants Inc., Report No. 315 Page 127 of 171
Klondex Canada Ltd. True North Gold Mine
Figure 20.1 True North Gold Mine Site Plan
Source: Revised Environmental Act License No. 2628 RRR for the True North Gold Mine, Appendix B.
Figure 20.2 TMA Site Plan
Revised Environmental Act License No. 2628 RRR for the True North Gold Mine, Appendix A.

P&E Mining Consultants Inc., Report No. 315 Page 128 of 171
Klondex Canada Ltd. True North Gold Mine
Figure 20.3 Aerial View of the Mine, Plant Site and TMA
Source: Google Maps
Minor Alterations
Section 14 of The Environment Act requires notification and approval for alterations to a
licensed Development. A notice of alteration submitted by a License holder is assessed by the
Director as either minor, having insignificant environmental effects, or major, having significant
environmental effects. Minor alterations may be approved through a revised Environment Act
License or by a letter from the Director for Class 1 and 2 projects. Recent examples of requested
alterations and approvals are provided below.
In March 2016, the Director of Manitoba Mineral Resources approved Klondex’s notice to
recommence mining and processing operations. Since receiving approval Klondex has
undertaken a range of preparatory works such as shaft guide replacement, underground track
repair, narrow vein long-hole layout testing, development of a new underground shop and
mining gear storage cut-outs, and metallurgical testwork on historical tailings based on using the
existing flow sheet.
In April 2016 Klondex issued a notice of alteration to the Development as licensed for early
discharge of effluent (to commence on May 9, 2016) from the East TMA and the implementation
of a tailings re-processing project. The ETP contained about 780,000 m3 of water which met
effluent discharge criterion. The proposed tailings re-processing alteration included the
construction and operation of a tailings dredging system, a pumping station, booster pumps and a
pipe line to be used to pump the tailings slurry to the existing process plant for re-processing. It
was projected that 80,000 m3 to 150,000 m
3 of tailings would be dredged in 2016 commencing
on June 1st. The regulator determined that the potential effect of the proposed alteration would be
a minor in accordance with the Environment Act and approved the proposed alteration.
In May 2016 Klondex issued a notice of alteration for a one-year temporary increase in the ore
stockpile limit from 10,000 tons to 50,000 tons (9,000 tonnes to 45,000 tonnes). The regulator
determined that the potential effect request was a minor alteration in accordance with the
Environment Act and approved the alteration.

P&E Mining Consultants Inc., Report No. 315 Page 129 of 171
Klondex Canada Ltd. True North Gold Mine
20.4.4 Current Status / Mitigative Measures
The current status of the Project as well as associated environmental aspects and mitigative
measures are summarized in Table 20.2 based on the information obtained and P&E’s experience
at other mine properties internationally.
TABLE 20.2
POTENTIAL SIGNIFICANT ENVIRONMENTAL IMPACTS AND CURRENT STATUS / MITIGATIVE
MEASURES
Area Current Status / Mitigative Measures
Environmental
Management
System
The revised Environmental Act License requires Klondex to establish and
implement an Environmental Management System (“EMS”). An EMS is a
comprehensive system that would be expected to require without being
limited to the development and communication of an environmental policy,
the identification of significant environmental aspects, the identification of
legal and other requirements, procedures, training, records, change
management, consultation and complaint response, monitoring, EMS and
compliance reviews, a corrective and preventative measures procedure to
deal with a non-conformance, and emergency preparedness and response
planning.
As part of other conditions of the environmental license it is expected that
the EMS would also include solid waste reduction and recycling efforts;
contingency plans for spills, ruptures and unexpected TMA seepage losses;
and require spill recovery equipment. In addition, solid waste and hazardous
wastes are to be disposed of in accordance with regulatory requirements;
petroleum products are to be stored in accordance with regulatory
requirements; and the sewage management system is subject to the Onsite
Wastewater Management Systems Regulation.
Acid Rock
Drainage
Test results included in the documentation reviewed by the Author indicate
that waste rock and tailings are not acid generating. The revised
environmental license requires ongoing scheduled acid:base account testing.
Final effluent Klondex is to reclaim as much water as possible from the TMA to supply the
process water demands of the mill.
Mine water is directed to the TMA. Treated effluent can only be released
from the TMA polishing pond to No Name Creek and subsequently to the
Wanipigow River between June 15 and November 30 each year at a rate not
to exceed 0.20 m3/sec. Treated effluent cannot be released if the quality or
toxicity of the effluent results in, or is likely to directly or cumulatively
results in, a downstream water quality degradation beyond a maximum 10%
mixing zone (by volume) within No Name Creek and/or the Wanipigow
River relative to the Manitoba Water Quality Standards, Objectives and
Guidelines Regulation under the Water Protection Act.
Elevated levels of ammonia in mine water / polishing pond water occurred
in years past possibly in part as a result of the dissolution of mine explosives
and blasting agents. Best practices including improved blasting practices and
reducing / avoiding ANFO use are now used to help avoid this potential
issue.
Air emissions Klondex would maintain its diesel-powered equipment and mine air heater.
As required by the environmental license: distinct plume forming fugitive
emissions are not to exceed 5% opacity whilst non-plume forming fugitive
emissions are to be not visible. Downwind off Project, point of impingement

P&E Mining Consultants Inc., Report No. 315 Page 130 of 171
Klondex Canada Ltd. True North Gold Mine
TABLE 20.2
POTENTIAL SIGNIFICANT ENVIRONMENTAL IMPACTS AND CURRENT STATUS / MITIGATIVE
MEASURES
Area Current Status / Mitigative Measures
suspended particle matter ground level concentrations are not to exceed a 24
hour average of 120 µg/m3 or an annual geometric mean of 70 µg/m
3.
Cyanide
transportation
and storage
Cyanide transfer, storage and mixing activities would be conducted in
conformance with regulatory requirements and Klondex’s procedures and
EMS requirements.
Tailings
management
Tailings from the original San Antonio Gold Mine were discharged into Rice
Lake from about 1932 to 1968. Tailings produced when the mine was
reopened in 1981 to 1983 were placed in a containment constructed over the
previously disposed tailings. The TMA is located north north-east of the
mine and plant site and includes a tailings pond and a polishing pond. The
final treated effluent is pumped and annually released to No Name Creek
which flows to the Wanipigow River. The historic tailings that are being re-
processed as part of the Project are located in the TMA. The revised
Environmental Act License 2628 RRR requires Klondex to engage the
services of licensed professional geotechnical engineers for engineering and
quality control during dyke construction and submit a construction
performance and quality control report to the Director for approval.
Klondex’s Environmental Superintendent would monitor dykes and assess
conditions / geotechnical monitoring data with input from competent
geotechnical engineers.
Waste rock
storage
New waste rock is to be stockpiled in the designated “waste rock stockpile
area”. Ore is to be stored in the designated “ore rock stockpile area”. The
License also requires the company to conduct acid:base accounting testing
as indicated above.
Environmental
monitoring
Klondex uses the existing TMA and the water polishing ponds to manage
surface water storage / release. An Inco SO2-air process and natural
degradation continue to be used for cyanide destruction. TMA water
management controls include polishing pond levels, water quality
monitoring and a surface water management program.
Surface water samples (i.e. mine water samples to be collected from the
tailings ponds, polishing pond, treated effluent, downstream receiving water
quality sampling stations) are to be sampled at frequencies and for
parameters specified in the License while groundwater quality is to be
monitored at specified groundwater wells and at additional wells as may be
requested by the Director. Treated effluent toxicity testing is also required.
Sediment core samples are to be collected at two downstream water quality
sampling station locations and analyzed for total metals, total organic
carbon, moisture content and pH.
Klondex will continue to conduct scheduled downstream water quality
sampling, sediment sampling, and environmental effects monitoring.
Klondex has undertaken two environmental effects monitoring studies and
has scheduled a third.
Solid waste Solid non-hazardous waste that is not re-used / recycled would be disposed
in an off-site licensed solid waste landfill.
Hazardous Hazardous waste would be disposed of in accordance with regulatory

P&E Mining Consultants Inc., Report No. 315 Page 131 of 171
Klondex Canada Ltd. True North Gold Mine
TABLE 20.2
POTENTIAL SIGNIFICANT ENVIRONMENTAL IMPACTS AND CURRENT STATUS / MITIGATIVE
MEASURES
Area Current Status / Mitigative Measures
waste requirements.
Klondex is currently working to confirm that there are no electrical
transformers that contain PCB in use or stored on the Project and that
asbestos had been removed several years ago from all surface buildings with
the exception of one secured unused old building.
Terrestrial and
avian wildlife
Klondex is aware of its responsibilities to protect wildlife. It is expected that
this would be reflected in the EMS procedures.
Social
consultation
Klondex has as a priority re-initiated community engagement activities with
local First Nations, the Town of Bissett, other interested communities and
persons, and regulatory authorities.
20.4.5 Community Engagement
As part of 2012 TMA expansion project EAP, the Manitoba Mines Branch requested that First
Nations and Aboriginal communities whose traditional activities could be impacted be identified
and engaged and that community issues be incorporated into the environmental assessment for
the TMA. Winsor (2013) reported on the outcome of that consultation process and reported that:
Most of the concerns from constituents were a result of misinformation.
The Manitoba Mines Branch had determined that there are three Anishinaabe (Ojibwa) First
Nations situated within an 80 mile (130 km) radius of the mine: the Hollow Water First Nation,
the Little Black River First Nation, and the Sagkeeng First Nation. The Hollow Water First
Nation is situated downstream of the confluence of No Name Creek and the Wanipigow River
which flows to Lake Winnipeg.
It was recommended that an Environment Act Licence be issued to San Gold in 2013 for the
proposed TMA expansion subject to it accommodating community concerns and issues. As such,
the draft License included a clause requiring the operator to submit an environmental monitoring
report to the Hollow Water First Nation after each effluent discharge campaign summarizing
monitoring data and impacts on the receiving waterways.
The Hollow Water Chief and Council encouraged direct negotiations between San Gold and two
trappers. San Gold negotiated a confidential compensation settlement with one of the trappers
(Trap Line #11) for loss of opportunity to trap in the proposed TMA expansion area, and at the
time of reporting was negotiating a settlement with the second trapper (Trap Line #12).
San Gold had met with Hollow Water First Nation residents in June 2012 and discussed the
potential impacts of the proposed TMA expansion. San Gold participated in the Hollow Water
First Nation’s Traditional Area Advisory Committee (TAAC). The Kookom’s who opposed the
TMA expansion did not have official standing in the community. San Gold had attempted to
arrange an information meeting with the Little Black River First Nation situated in
the O'Hanley and Black Rivers area on the eastern shore of Lake Winnipeg.
Klondex is in the process of re-initiating community engagement activities and aims to maintain
contact and communication with local First Nations and Aboriginal communities, and continue
to sponsor community events and undertakings and recruit and train local First Nations and

P&E Mining Consultants Inc., Report No. 315 Page 132 of 171
Klondex Canada Ltd. True North Gold Mine
Aboriginal workers. The Town of Bissett is also kept informed of environmental matters that
could potentially impact residents or community services. Klondex participates in Town of
Bissett council meetings and has held community information sessions.
20.4.6 Mine Closure
Mine closure planning and financial security provisions that apply to advanced exploration and
mining projects are described in the Mine Closure Regulation (MR 67/99) under The Mines and
Minerals Act (C.C.S.M. c.M162).
Responsibility for the accepted San Gold Corporation Mine Closure Plan (2012) for Mineral
Lease ML-63 which includes pledged fixed assets financial security was transferred to Klondex
Canada Ltd. on January 13, 2016 by the Mines Branch Director (Manitoba, 2016). The Author
reviewed sections of the Mine Closure Plan (2012) and estimated mine reclamation and
rehabilitation costs presented in Gibson (2015). The estimated reclamation and rehabilitation
costs amounted to $4.4M. There is a possibility that the Mines Branch may require an alternate
form of financial security at some point in the future when the closure plan is updated.
As indicated in Section 10 “Expected Site Conditions” of the closure plan, the Project would be
rehabilitated to a predevelopment state as a wilderness area with primarily conservation and
recreational value. An additional crown pillar assessment would be completed at close-out to
assure surface stability. The surface of the tailings in the TMA would be revegetated at closure.
Pond water quality would continue to be monitored and excess water would be pumped /
released to No Name Creek until the pond water quality is shown to improve to a level whereby
a weir system could be used to direct excess run-off to No Name Creek. Environmental
monitoring would continue to be conducted through each stage of closure to ensure that the mine
remains compliant with environmental and safety requirements.

P&E Mining Consultants Inc., Report No. 315 Page 133 of 171
Klondex Canada Ltd. True North Gold Mine
21.0 CAPITAL AND OPERATING COSTS
True North has been in operation continuously from 2007 to 2015 by a previous owner and was
restarted in mid-2016 by Klondex. The mine operated intermittently for many years before 2007.
The forecasted costs presented in this section are based on both actual cost information from the
Project and Klondex’s operating experience at their other operating mines.
All currency units are in Canadian dollars unless otherwise noted.
Where historical operating costs have been provided by Klondex, P&E have not audited the
financial records or cost details but consider the costs are acceptable for this type of mining
operation.
21.1 CAPITAL COSTS
The capital costs summarized for the project represent the future capital expenditures required to
be incurred over the remainder of the project life. Previous development costs are considered to
be sunk costs and do not directly impact on the future cash flows.
The ongoing capital costs for the life-of-mine are summarized in Table 21.1 and total $32.1
million until 2023.
TABLE 21.1
SUSTAINING CAPITAL COSTS
Description (000's of dollars)
Q4 - 2016 2017 2018 2019-2023 Total
Ramp Development 2,493 6,798 4,079 13,370
Capital Development 553 3,952 2,253 6,758
Capital Drilling 231 1,649 940 2,820
Mobile Fleet 90 641 365 1,096
Site Infrastructure & Processing Plant 297 2,119 1,208 3,624
Underground Services 53 382 217 652
Tailings Reprocessing 0 511 735 2,500 3,746
Total 3,717 16,052 9,797 2,500 32,066
Sustaining capital for the five years following mine closure when historic tailings reprocessing
will be continuing on a stand-alone basis will be approximately $400,000 per year. In addition,
an allowance for winterization of the processing plant and reopening in the spring has been
included at $100,000 per year. These total annual $500,000 costs are included in Table 21.1.
Mine closure & reclamation costs are not included in Table 21.2 and estimated to be $4.4 million
commencing in 2019.
21.2 OPERATING COSTS
The Project operating costs estimates are based on both actual costs and cost projections for the
future. Since the project is continuing to ramp up to nameplate production rates, historical
operating costs may not be truly representative of future costs. Therefore some costs projections

P&E Mining Consultants Inc., Report No. 315 Page 134 of 171
Klondex Canada Ltd. True North Gold Mine
have been used to estimate future unit costs assuming that production rates are achieved at
design rates.
The average total operating cost per underground ore ton during the mining years (2016-2018) is
approximately $141.52/ton.
Table 21.2 summarizes the total operating cost per Underground Mineral Reserve ton.
TABLE 21.2
UNDERGROUND OPERATING COST SUMMARY
Description $/ton
Mining 49.09
Processing 27.77
Indirect Mine 49.04
G&A 15.62
Total 141.52
The average total operating cost during underground mining for the historic Tailings Mineral
Reserve tonnage is $25.06 per ton reprocessed. G&A costs during this period are $3.15 per ton in
addition to the G&A carried by the underground mining operation. Capital costs are included in
the capital cost summary (Section 21.1).
Following the cessation of the mining operation in 2018, the historic tailings reprocessing
program will continue for another five years until 2023. Process plant operating costs during this
period will be $18.01 per ton and G&A costs will be $6.40 per ton. Sustaining capital costs are
included in the capital cost summary (Section 21.1).
21.3 UNDERGROUND MINING COSTS
Mining operations are performed by Klondex and its contractors. The mine operating cost shown
Table 21.3 is a cost per ton processed and includes the cost for all associate waste rock
production. The mine operating cost is $49.09 per ton. This cost is broken down into component
costs in Table 21.3.
TABLE 21.3
MINE OPERATING COST
Description $/ton
U/G Ore Advance 17.92
U/G Long-hole Stoping 28.56
Material Movement 2.61
Total 49.09
21.4 PROCESSING COSTS
The processing cost during underground mining at the Project is $27.77 per ton. This is
composed of the costs listed in Table 21.4.

P&E Mining Consultants Inc., Report No. 315 Page 135 of 171
Klondex Canada Ltd. True North Gold Mine
TABLE 21.4
PROCESS PLANT OPERATING COST
Description $/ton
Operation Administration 14.64
Maintenance Admin 7.23
Consumables 3.16
Circuit Maintenance 2.74
Total 27.77
In 2019, the underground mining operation will cease, however, the processing plant will
continue to treat tailings at a rate of 195,000 tons (177,000 tonnes) per annum, as a seasonal
operation from May to October. The total processing cost during this period will be $18.01/ton.
21.5 INDIRECT MINING COSTS
The indirect mining costs at the Project totals $49.04 per ton processed and includes mine
maintenance, support services and hoisting, plus engineering, geology, administration and
supervision. This total dollar cost is treated as a fixed cost. A breakdown of the indirect mining
costs is provided in Table 21.5.
TABLE 21.5
INDIRECT UNDERGROUND MINE OPERATING COST
Description $/ton
Hoisting 4.14
Underground Support Services 4.59
Mobile Maintenance 7.48
Electrical Maintenance 3.79
Mine Admin and Supervision 12.30
Geology 14.35
Engineering/Survey 2.39
Total 49.04
21.6 G&A COSTS
The G&A costs (including salaries, labour costs) during the underground mining as a fixed cost.
A breakdown of the G&A costs is provided in Table 21.6.
TABLE 21.6
G&A COST (DURING UG MINING)
Description $/ton
Site Administration 10.07
IT 0.70
Surface Support Services 2.10
Health and Safety 2.50
Environmental 0.25
Total 15.62

P&E Mining Consultants Inc., Report No. 315 Page 136 of 171
Klondex Canada Ltd. True North Gold Mine
In 2019, the mining operation will cease, however, the processing plant will continue to treat
historic tailings at a rate of 195,000 tons (177,000 tonnes) per annum, as a seasonal operation
from May to October until 2023. During 2016 to 2018 there will be a G&A cost of $3.15 per ton
incurred. During 2019 to 2023 G&A costs will be $6.40 per ton due to the reduced site
requirements and the higher processing rate of 1,200 tpd (1,089 tonnes per day).

P&E Mining Consultants Inc., Report No. 315 Page 137 of 171
Klondex Canada Ltd. True North Gold Mine
22.0 ECONOMIC ANALYSIS
The True North Gold Mine is currently in production and the objective of this Technical Report
is to provide a confirmation of the mineral resource and mineral reserve estimate. A mineral
reserve can be declared if the project is deemed economic based on projected future cash flows.
Since this Project has been built and the economics are forward looking, the sunk costs to
initially develop the project are not included in this economic analysis.
22.1 CASHFLOW MODEL INPUT PARAMETERS
A simplified cash flow model has been developed to assess the economics of the Project as of the
effective date of this Technical Report. The basis for the cash flow analysis is listed below.
22.1.1 Production
Underground mine production schedule commencing the fourth quarter of 2016
and continuing through to 2018;
An combined underground mine and tailings Proven and Probable Mineral
Reserve of 1.522 million tons (1.381 million tonnes) containing 117,900 ounces
of gold at 0.077 opt Au (2.64 g/t Au);
Included dilution in underground Mineral Reserve of 21%; and
Gold process recovery 94% for underground ore and 90% for tailings.
22.1.2 Revenue
A fixed gold price of C$1,500/oz.;
22.1.3 Royalties and Taxes
The Project pays no royalties; and
Taxes are included in the operating cash flow analysis.
22.1.4 Interest, Principal, and Other Payments
Financing charges, land lease payments, interest or price escalation considerations have not been
included the operating cash flow analysis.
22.2 CAPITAL COSTS
No pre-production capital costs or Project acquisition costs have been included;
Sustaining capital costs of $32.1 million over the life of Project have been
included. Included is $500,000 per year that has been included for sustaining
capital during the tailings reprocessing that will occur after cessation of the
underground mining operation in 2018;
Reclamation and closure cost of $4.4 million after mine closure have been
included in 2023.
22.3 OTHER PARAMETERS
Discount rates of 0% and 7% are applied to assess the cash flow results.

P&E Mining Consultants Inc., Report No. 315 Page 138 of 171
Klondex Canada Ltd. True North Gold Mine
22.4 ECONOMIC ANALYSIS RESULTS
The results of the economic analysis indicate a 7% discounted positive NPV of $26.3 million
(after-tax) for the Project, as shown in Table 22.1. Since this economic analysis does not include
any pre-production costs, the IRR and payback period are not pertinent to this analysis.
TABLE 22.1
FINANCIAL EVALUATION

P&E Mining Consultants Inc., Report No. 315 Page 139 of 171
Klondex Canada Ltd. True North Gold Mine
23.0 ADJACENT PROPERTIES
There are a number of mineral exploration properties adjacent to Klondex’s True North (Figure
23.1), but most appear to be inactive.
Gold Pocket Resources Ltd. owns the Bissett Project exploration property south adjacent to True
North. Maps on their website show numerous gold mineralized zones, drillhole collar locations,
and historic shafts. In 1998, Golden Pocket drilled 131 diamond holes for a total of (68,652 feet)
20,925 metres. The drilling returned high grade gold intersects, particularly from the Nevada
Zone. Currently, Golden Pocket has sufficient assessment credits to keep the Bissett Property in
good standing.
Bison Gold Exploration Inc. owns the Cryderman Central property about 15 miles (25 km) to the
southeast of True North, but adjacent to Klondex owned ground in that area. An NI 43-101
technical report dated November 15, 2013 for the Ogama-Rockland Mine deposit lists Inferred
Mineral resources of 1.28 million tons (1.16 million tonnes) grading 0.24 opt Au (8.17 g/t Au).
The style of gold mineralization is dominated by gold-bearing quartz-carbonate veins associated
with shear zones in granite host rocks.
Figure 23.1 Adjacent Properties to the True North Gold Mine

P&E Mining Consultants Inc., Report No. 315 Page 140 of 171
Klondex Canada Ltd. True North Gold Mine
24.0 OTHER RELEVANT DATA AND INFORMATION
P&E is not aware of any other relevant data or information as of the effective date of this
Technical Report.

P&E Mining Consultants Inc., Report No. 315 Page 141 of 171
Klondex Canada Ltd. True North Gold Mine
25.0 INTERPRETATIONS AND CONCLUSIONS
This Technical Report and Pre-Feasibility Study confirms the positive economics of continuing
operations at True North. On this basis, the Mineral Reserve estimate is confirmed.
The Project hosts a Proven and Probable underground Mineral Reserve of 352,000 tons (319,000
tonnes) at average grades of 0.243 opt (8.33 g/t), at a 0.13 opt (4.46 g/t) Au cut-off grade. In
addition, the tailings reprocessing project contains a Mineral Reserve of 1.17 million tons (1.06
million tonnes) at an average grade of 0.028 opt Au (0.96 g/t Au), with a 0.026 opt Au (0.89 g/t
Au) for 2016 to 2018 and 0.018 opt Au (0.62 g/t Au) for 2019 to 2023.
P&E is of the opinion that the core, channel chip and tailings sample assay data have been
adequately verified for the purposes of a mineral resource estimate. All data included in the
resource estimate appear to be of adequate quality.
The operation of the Project appears to be financially sound. Capital expenditures for
construction will not be required and the Project components will require only limited
rehabilitation and refurbishment. Based on cash flows using estimated costs of production and
revenue factors, the Project will generate a pre-tax net cash flow of $48.8 million over the LOM.
At a discount rate of 7%, this corresponds to an NPV of $26.3 million (after tax).
P&E also offers the following interpretation and conclusions:
The Project is situated adjacent to a well-established mining community and has an existing
infrastructure of underground openings, operating and maintenance equipment and operations
personnel that can be used for future operations.
In future operations, Klondex intends to apply technologies or methods that have already been
accepted and previously implemented at the Project.
Klondex intends to continue to investigate extensions to the currently defined resource base.
The pre-existing mine closure plan that estimated closure costs at $4.4 million was transferred to
Klondex in January 2016 along with an assignment of fixed-assets as financial security. It may
be beneficial for Klondex to review the technical basis of the TMA closure approach presented
in the 2012 mine closure plan and update the associated closure costs.
Klondex is aware of the importance of an effective community engagement process to the
Project. Klondex is currently in the process of re-initiating community engagement activities
with local Aboriginal communities, the Town of Bissett, other interested stakeholders, and
regulatory authorities, on a priority basis

P&E Mining Consultants Inc., Report No. 315 Page 142 of 171
Klondex Canada Ltd. True North Gold Mine
26.0 RECOMMENDATIONS
This Technical Report and Pre-Feasibility Study describes a viable mining and processing
operation at the True North Gold Mine.
Technically, the Project presents no fatal flaws.
It is recommended that the Project continue with its current production plan with a combination
of long-hole mining methods as detailed in Section 16 and the on-site processing of ore. It is also
recommended that Klondex continue with its plans to reprocess of the existing tailings on site.
Specifically, it is recommended that Klondex take the following actions to develop and operate
the Project:
Geology
1) Technical Database: All True North project data collected need to be stored and
archived in a permanent and reliably retrieval manner. A full-time database
administrator is recommended.
2) Quality Assurance/Quality Control: Timely follow-up for any and all QA/QC
assay deviations and re-assay requests should be performed in a timely manner.
The process should be automated when the database is up and running.
3) Sample Storage and Retrieval: Half-core remaining from sample assays should be
retained for reference and check assay purposes. All assay sample rejects and
pulps should be stored in a safe, secure and sheltered manner and properly
catalogued to ease retrieval.
4) Project Assay Lab: Standard operating procedures should be updated, particularly
in regards to assay data generation, storage and retrieval.
Environmental and Mine Closure
It is recommended that Klondex review the technical basis of the TMA closure approach
presented in the 2012 mine closure plan and update the associated closure costs. A provisional
amount for a $250k study that would be carried out over four years commencing in 2016 is
recommended. This amount has not been included in the cash flow model presented in this
Technical Report. This exercise will review and confirm the technical basis of the proposed
TMA closure plan and estimated costs and possibly identify opportunities to improve upon the
currently proposed approach.
Other
P&E also recommends that other exploration targets in the area continue to be identified and
investigated to provide supplemental process plant feed in the future.
P&E Mining Consultants Inc., Report No. 315 Page 143 of 171
Klondex Canada Ltd. True North Gold Mine
27.0 REFERENCES
Ames, D. E., Franklin, J.M and Froese, E. 1991. Zonation of hydrothermal alteration at the San
Antonio Gold Mine, Bissett, Manitoba, Canada. Economic Geology 86, 600-619.
Anderson, S.D. 2008. Geology of the Rice Lake area, Rice Lake greenstone belt, south-eastern
Manitoba (Parts of NTS 52L13, 52M4), Manitoba Science, Technology, Energy and Mines,
Manitoba Geological Survey, Geoscientific Report GR2008-1, 97p.
Anderson, S.D. 2011. Geology and structure of the Rice Lake Mine trend, Rice; greenstone belt,
south-eastern Manitoba (part of NTS 52M4) Manitoba Innovation, Energy and Mines.
Preliminary Map PMAP2011-3, 2011.
CMG Airborne 2011. Report on a Helicopter-Borne Magnetic Gradiometer and Radiometric
Survey Bissett Mine; Project 2011-004; for San Gold Corporation; Dec. 21, 2011.
Ginn, D. and Michaud, M. 2013. Technical Report on the Rice Lake Mining complex, Bissett,
Manitoba.
Gibson, 2015. Exhibit “J” referred to in an affidavit of Greg Gibson dated January 16, 2015.
Available under San Gold Corporation at the MNP Ltd. website – www.mnpdebt.ca. January 16,
2015.
Groves, D.I., Goldfarb, R.J., Gebre-Mariam, M., Hagemann, S.G. and Robert, F. 1998. Orogenic
gold deposits: a proposed classification in the context of their crustal distribution and
relationship to other gold deposit types. Ore Geology Reviews 13, p. 7–27.
Manitoba Mines Branch, 2016. Consent to Closure Plan, Mineral Lease ML-63. January 13,
2016.
Manitoba Sustainable Development, 2016. Revised Environment Act Licence No. 2628 RRR,
revised September 16, 2016. Issued to Klondex Canada Ltd. Available at www. gov.mb.ca.
September 16, 2016.
Poulsen, K.H., Robert, F. and Dube, B. 2000. Geological classification of Canadian gold
deposits. Geological Survey of Canada Bulletin 540. 106p.
Ravenelle, J.-F. and Fonseca, A. 2013. Structural controls on gold mineralization at the and
surrounding area. Unpublished report for San Gold Corporation by SRK Consulting (Canada)
Inc., 77p.
Ross, K. and Rhys, D. 2010. Petrographic and SEM study of vein samples from the and Hinge
Zone, Bissett, Manitoba. Unpublished report for San Gold Corporation by Panterra Geoservices
Inc., 50p.
San Gold Corporation 2015. DRAFT – Rice Lake Mining complex – Summary of Mineral
Resource Estimation. April 2015.
Winsor, Jennifer, 2013. Summary of Comments/Recommendations for the San Gold Tailings
Management Area Expansion. File No. 2435.40. Available at www.gov.mb.ca. July 9, 2013.

P&E Mining Consultants Inc., Report No. 315 Page 144 of 171
Klondex Canada Ltd. True North Gold Mine
28.0 CERTIFICATES
CERTIFICATE OF QUALIFIED PERSON
EUGENE J. PURITCH, P. ENG.
I, Eugene J. Puritch, P. Eng., residing at 44 Turtlecreek Blvd., Brampton, Ontario, L6W 3X7, do hereby certify that:
1. I am an independent mining consultant and President of P&E Mining Consultants Inc.
2. This certificate applies to the technical report titled “Technical Report and Pre-Feasibility Study on the True
North Gold Mine, Bissett, Manitoba, Canada” (the “Technical Report”), with an effective date of June 30, 2016.
3. I am a graduate of The Haileybury School of Mines, with a Technologist Diploma in Mining, as well as
obtaining an additional year of undergraduate education in Mine Engineering at Queen’s University. In addition
I have also met the Professional Engineers of Ontario Academic Requirement Committee’s Examination
requirement for Bachelor’s Degree in Engineering Equivalency. I am a mining consultant currently licensed by
Association of Professional Engineers and Geoscientists New Brunswick (License No. 4778), Association of
Professional Engineers and Geoscientists Newfoundland & Labrador (License No. 5998), Association of
Professional Engineers and Geoscientists Saskatchewan (License No. 16216) the Professional Engineers of
Ontario (License No. 100014010) and Association of Professional Engineers and Geoscientists British
Columbia (Licence No. 192893). I am also a member of the National and Toronto Canadian Institute of Mining
and Metallurgy.
4. I have read the definition of “qualified person” set out in National Instrument 43-101 (“NI 43-101”) and certify
that, by reason of my education, affiliation with a professional association (as defined in NI 43-101) and past
relevant work experience, I fulfill the requirements to be a “qualified person” for the purposes of NI 43-101.
I have practiced my profession continuously since 1978. My summarized career experience is as follows:
Mining Technologist - H.B.M.& S. and Inco Ltd., ..................................................................... 1978-1980
Open Pit Mine Engineer – Cassiar Asbestos/Brinco Ltd., .......................................................... 1981-1983
Pit Engineer/Drill & Blast Supervisor – Detour Lake Mine, ...................................................... 1984-1986
Self-Employed Mining Consultant – Timmins Area, ................................................................. 1987-1988
Mine Designer/Resource Estimator – Dynatec/CMD/Bharti, .................................................... 1989-1995
Self-Employed Mining Consultant/Resource-Reserve Estimator,.............................................. 1995-2004
President – P&E Mining Consultants Inc, .............................................................................. 2004-Present
5. I visited the Property that is the subject of this report on June 23 and July 18, 2016.
6. I am responsible for co-authoring Section 15, 16, 18, 21 and 22 of the Technical Report along with those parts
of the Executive Summary, and Sections 25 and 26 pertaining thereto.
7. I am independent of Klondex Mines Ltd. applying the test in Section 1.5 of NI 43-101.
8. I have had no prior involvement with the project that is the subject of this Technical Report.
9. I have read NI 43-101 and Form 43-101F1. This Technical Report has been prepared in compliance therewith.
10. As at the effective date of the Technical Report, to the best of my knowledge, information and belief, the
Technical Report contains all scientific and technical information that is required to be disclosed to make the
Technical Report not misleading.
Effective Date: June 30, 2016
Signed Date: October 27, 2016
{SIGNED AND SEALED} [Eugene J. Puritch]
____________________________
Eugene J. Puritch, P.Eng.

P&E Mining Consultants Inc., Report No. 315 Page 145 of 171
Klondex Canada Ltd. True North Gold Mine
CERTIFICATE OF QUALIFIED PERSON
ALEXANDRU VERESEZAN, P. ENG.
I, Alexandru Veresezan of 25 Stookes Crescent, Richmond Hill, Ontario, L4E 0J4, and Senior Associate Mining
Engineering with P&E Mining Consultants Inc. of Brampton, Ontario., do hereby certify that:
1. This certificate applies to the technical report titled “Technical Report and Pre-Feasibility Study on the
True North Gold Mine, Bissett, Manitoba, Canada” (the “Technical Report”), with an effective date of June
30, 2016.
2. I am a graduate of Mining Engineering with a Master of Engineering, Honors Underground Mining degree
from the University of Petrosani in 1993. I have practiced my profession as a Professional Engineer since
graduation. I am a Registered Professional Engineer in good standing with the Professional Engineers
Ontario (License No. 100078587).
3. I have read the definition of “qualified person” set out in NI 43-101 and certify that, by reason of my
education, affiliation with a professional association (as defined in NI 43-101) and past relevant work
experience, I fulfill the requirements to be a “qualified person” for the purpose of NI 43- 101.
My summarized career experience is as follows:
P&E Mining Consultants Inc.: (Sr. Associate Mining Engineer) 2016-Present
Barrick Gold Corp, Copper Division: (Mine Manager/ Alternate GM) 2012-2015
Barrick Gold Corp. (Manager, Underground Mining, Corporate Office) 2008-2012
Wardrop Engineering Inc.: (Sr. Mining Engineer) 2006-2008
Cementation SKANSKA Canada Inc.: (Mining Eng/Estimator/ Pro Cost Control) 2002-2006
Dynatec Corp: (Estimator / EIT) 2001-2002
S.C. Grandemar S.A.: (Open Pit Manager) 1999-2000
Cluj, Romania Various: (Junior-Senior Project Engineer) 1993-1999
4. I am responsible for co-authoring Sections 15, 16 and 18 of the Technical Report along with those parts of
the Executive Summary, and Sections 25 and 26 pertaining thereto.
5. I am not aware of any material fact or material change with respect to the subject matter of this technical
report which is not reflected in the technical report.
6. I am independent of Klondex Mines Ltd. applying the test in Section 1.5 of NI 43-101.
7. I visited the Property that is the subject of this report from July 18 to 21, 2016.
8. I have had no prior involvement with the project that is the subject of this Technical Report.
9. I have read National Instrument 43-101 and the Technical Report has been prepared in compliance with
National Instrument 43-101 and Form 43- 101F1.
10. As at the effective date of the Technical Report, to the best of my knowledge, information and belief, the
Technical Report contains all scientific and technical information that is required to be disclosed to make
the Technical Report not misleading.
Effective Date: June 30, 2016
Signed Date: October 27, 2016
{SIGNED AND SEALED} [Alexandru Veresezan]
____________________________ Alexandru Veresezan, P.Eng.

P&E Mining Consultants Inc., Report No. 315 Page 146 of 171
Klondex Canada Ltd. True North Gold Mine
CERTIFICATE OF QUALIFIED PERSON
FRED H. BROWN, P.GEO.
I, Fred H. Brown, residing at Suite B-10, 1610 Grover St., Lynden WA, 98264 USA, do hereby certify that:
1. I am an independent geological consultant and have worked as a geologist continuously since my graduation
from university in 1987.
2. This certificate applies to the technical report titled “Technical Report and Pre-Feasibility Study on the True
North Gold Mine, Bissett, Manitoba, Canada” (the “Technical Report”), with an effective date of June 30, 2016.
3. I graduated with a Bachelor of Science degree in Geology from New Mexico State University in 1987. I
obtained a Graduate Diploma in Engineering (Mining) in 1997 from the University of the Witwatersrand and a
Master of Science in Engineering (Civil) from the University of the Witwatersrand in 2005. I am registered
with the South African Council for Natural Scientific Professions as a Professional Geological Scientist
(registration number 400008/04), the American Institute of Professional Geologists as a Certified Professional
Geologist (certificate number 11015) and the Society for Mining, Metallurgy and Exploration as a Registered
Member (#4152172).
4. I have read the definition of “qualified person” set out in National Instrument 43-101 (“NI 43-101”) and certify
that by reason of my education, affiliation with a professional association (as defined in NI 43-101) and past
relevant work experience, I fulfill the requirements to be a “qualified person” for the purposes of NI 43-101
This report is based on my personal review of information provided by Shore Gold Inc. and on discussions with
its representatives. My relevant experience for the purpose of the Technical Report is:
Underground Mine Geologist, Freegold Mine, AAC ................................................................. 1987-1995
Mineral Resource Manager, Vaal Reefs Mine, Anglogold......................................................... 1995-1997
Resident Geologist, Venetia Mine, De Beers ............................................................................ 1997-2000
Chief Geologist, De Beers Consolidated Mines ......................................................................... 2000-2004
Consulting Geologist .............................................................................................................. 2004-Present
5. I have not visited the Property that is the subject of this Technical Report.
6. I am responsible for authoring Section 14 of this Technical Report along with those parts of the Executive
Summary, and Sections 25 and 26 pertaining thereto.
7. I am independent of Klondex Mines Ltd. applying the test in Section 1.5 of NI 43-101.
8. I have had no prior involvement with the project that is the subject of this Technical Report.
9. I have read NI 43-101 and Form 43-101F1 and the Technical Report has been prepared in compliance
therewith.
10. As at the effective date of the Technical Report, to the best of my knowledge, information and belief, the
Technical Report contains all scientific and technical information that is required to be disclosed to make the
Technical Report not misleading.
Effective Date: June 30, 2016
Signed Date: October 27, 2016
{SIGNED AND SEALED}
[Fred H. Brown]
_______________________________
Fred H. Brown, P.Geo

P&E Mining Consultants Inc., Report No. 315 Page 147 of 171
Klondex Canada Ltd. True North Gold Mine
CERTIFICATE OF QUALIFIED PERSON
WILLIAM STONE, Ph.D., P.Geo.
I, William Stone, Ph.D., P.Geo, residing at 4361 Latimer Crescent, Burlington, Ontario, do hereby certify that:
1. I am an independent geological consultant
2. This certificate applies to the technical report titled “Technical Report and Pre-Feasibility Study on the
True North Gold Mine, Bissett, Manitoba, Canada” (the “Technical Report”), with an effective date of June
30, 2016.
3. I am a graduate of Dalhousie University with a Bachelor of Science (Honours) degree in Geology (1983).
In addition, I have a Master of Science in Geology (1985) and a Ph.D. in Geology (1988) from the
University of Western Ontario. I have worked as a geologist for a total of 31 years since obtaining my
M.Sc. degree. I am a geological consultant currently licensed by the Association of professional
Geoscientists of Ontario (License No 1569).
4. I have read the definition of “qualified person” set out in National Instrument 43-101 (“NI 43-101”) and
certify, by reason of my education, affiliation with a professional organization (as defined in NI 43-101)
and past relevant work experience, I fulfill the requirements to be a “qualified person” for the purposes of
NI 43-101. My relevant experience for the purpose of the Technical Report is:
Contract Senior Geologist, LAC Minerals Exploration Ltd ....................................................... 1985-1988
Post-Doctoral Fellow, McMaster University .............................................................................. 1988-1992
Contract Senior Geologist, Outokumpu Mines and Metals Ltd .................................................. 1993-1996
Senior Research Geologist, WMC Resources Ltd ...................................................................... 1996-2001
Senior Lecturer, University of Western Australia ...................................................................... 2001-2003
Principal Geologist, Geoinformatics Exploration Ltd ................................................................ 2003-2004
Vice President Exploration, Nevada Star Resources Inc ............................................................ 2005-2006
Vice President Exploration, Goldbrook Ventures Inc................................................................. 2006-2008
Vice President Exploration, North American Palladium Ltd ...................................................... 2008-2009
Vice President Exploration, Magma Metals Ltd. ........................................................................ 2010-2011
President & COO, Pacific North West Capital Corp .................................................................. 2011-2014
Consulting Geologist ............................................................................................................. .2013-Present
5. I visited the Property that is the subject of this report from May 21-25, June 20-23 and September 20-22,
2016.
6. I am responsible for authoring Sections 4-12 and 23 of this Technical Report along with those parts of the
Executive Summary, and Sections 25 and 26 pertaining thereto.
7. I am independent of Klondex Mines Ltd. applying the test in Section 1.5 of NI 43-101.
8. I have had no prior involvement with the project that is the subject of this Technical Report.
9. I have read NI 43-101 and Form 43-101F1 and this Technical Report has been prepared in compliance
therewith
10. As at the effective date of the Technical Report, to the best of my knowledge, information and belief, the
Technical Report contains all scientific and technical information that is required to be disclosed to make
the Technical Report not misleading.
Effective Date: June 30, 2016
Signed Date: October 27, 2016
(SIGNED AND SEALED)
[William Stone]
_______________________
Dr. William E. Stone, P.Geo.
P&E Mining Consultants Inc., Report No. 315 Page 148 of 171
Klondex Canada Ltd. True North Gold Mine
CERTIFICATE OF QUALIFIED PERSON
ALFRED S. HAYDEN, P. ENG
I, Alfred S. Hayden, P. Eng., residing at 284 Rushbrook Drive, Ontario, L3X 2C9, do hereby certify that:
1. I am currently President of:
EHA Engineering Ltd.,
Consulting Metallurgical Engineers
Box 2711, Postal Stn. B.
Richmond Hill, Ontario, L4E 1A7
2. This certificate applies to the technical report titled “Technical Report and Pre-Feasibility Study on the True
North Gold Mine, Bissett, Manitoba, Canada” (the “Technical Report”), with an effective date of June 30, 2016.
3. I graduated from the University of British Columbia, Vancouver, B.C. in 1967 with a Bachelor of Applied
Science in Metallurgical Engineering. I am a member of the Canadian Institute of Mining, Metallurgy and
Petroleum and a Professional Engineer and Designated Consulting Engineer registered with Professional
Engineers Ontario. I have worked as a metallurgical engineer for over 40 years since my graduation from
university.
4. I have read the definition of “qualified person” set out in National Instrument 43-101 (“NI 43-101”) and certify
that by reason of my education, affiliation with a professional association (as defined in NI 43-101) and past
relevant work experience, I fulfill the requirements to be a “qualified person” for the purposes of NI 43-101.
My summarized career experience is as follows:
EHA Engineering Ltd: (President) ............................................................................................ 1990-Present
EH Associates: (Partner) ...............................................................................................................1985-1990
A.H. Ross & Associates Ltd. (Senior Associate) ...........................................................................1976-1985
Eldorado Nuclear Limited (Chief Metallurgist/Mill Engineer) .....................................................1966-1976
5. I visited the Property that is the subject of this report on September 20 and 21, 2016.
6. I am responsible for authoring Sections 13 and 17 of this Technical Report along with those parts of the
Executive Summary, and Sections 25 and 26 pertaining thereto.
7. I am independent of Klondex Mines Ltd. applying the test in Section 1.5 of NI 43-101.
8. I have had no prior involvement with the Property that is the subject of this Technical Report.
9. I have read NI 43-101 and Form 43-101F1 and the Technical Report has been prepared in compliance
therewith.
10. As at the effective date of the Technical Report, to the best of my knowledge, information and belief, the
Technical Report contains all scientific and technical information that is required to be disclosed to make the
Technical Report not misleading.
Effective Date: June 30, 2016
Signed Date: October 27, 2016
{SIGNED AND SEALED}
[Alfred Hayden]
__________________________
Alfred S. Hayden, P.Eng.

P&E Mining Consultants Inc., Report No. 315 Page 149 of 171
Klondex Canada Ltd. True North Gold Mine
CERTIFICATE OF QUALIFIED PERSON
DAVID A. ORAVA, P. ENG.
I, David A. Orava, M. Eng., P. Eng., residing at 19 Boulding Drive, Aurora, Ontario, L4G 2V9, do hereby certify
that:
1. I am an Associate Mining Engineer at P&E Mining Consultants Inc. and President of Orava Mine Projects Ltd.
2. This certificate applies to the technical report titled “Technical Report and Pre-Feasibility Study on the True
North Gold Mine, Bissett, Manitoba, Canada” (the “Technical Report”), with an effective date of June 30, 2016.
3. I am a graduate of McGill University located in Montreal, Quebec, Canada at which I earned my Bachelor
Degree in Mining Engineering (B.Eng. 1979) and Masters in Engineering (Mining - Mineral Economics Option
B) in 1981. I have practiced my profession continuously since graduation. I am licensed by the Professional
Engineers of Ontario (License No. 34834119).
4. I have read the definition of “qualified person” set out in National Instrument 43-101 (“NI 43-101”) and certify
that by reason of my education, affiliation with a professional association (as defined in NI 43-101) and past
relevant work experience, I fulfill the requirements to be a “qualified person” for the purposes of NI 43-101.
My summarized career experience is as follows:
Mining Engineer – Iron Ore Company of Canada. ..................................................................... 1979-1980
Mining Engineer – J.S Redpath Limited / J.S. Redpath Engineering. ........................................ 1981-1986
Mining Engineer & Manager Contract Development – Dynatec Mining Ltd. ........................... 1986-1990
Vice President – Eagle Mine Contractors............................................................................................ 1990
Senior Mining Engineer – UMA Engineering Ltd. ............................................................................. 1991
General Manager - Dennis Netherton Engineering ................................................................... 1992-1993
Senior Mining Engineer – SENES Consultants Ltd. .................................................................. 1993-2003
President – Orava Mine Projects Ltd. .................................................................................. 2003 to present
Associate Mining Engineer – P&E Mining Consultants Inc. .............................................. 2006 to present
5. I have not visited the Property that is the subject of this report.
6. I am responsible for authoring Section 20 of the Technical Report along with those parts of the Executive
Summary, and Sections 25 and 26 pertaining thereto.
7. I am independent of Klondex Mines Ltd. applying all of the tests in Section 1.5 of NI 43-101.
8. I have had no prior involvement with the project that is the subject of this Technical Report.
9. I have read NI 43-101 and Form 43-101F1 and the Technical Report has been prepared in compliance
therewith.
10. As at the effective date of the Technical Report, to the best of my knowledge, information and belief, the
Technical Report contains all scientific and technical information that is required to be disclosed to make the
Technical Report not misleading.
Effective Date: June 30, 2016
Signed Date: October 27, 2016
{SIGNED AND SEALED}
[David Orava]
____________________________________
David Orava, M. Eng., P. Eng.

P&E Mining Consultants Inc., Report No. 315 Page 150 of 171
Klondex Canada Ltd. True North Gold Mine
KIRK RODGERS, P.ENG.
CERTIFICATE OF AUTHOR
I, Kirk H. Rodgers, P. Eng., residing at 146 Royal Beech Drive, Wasaga Beach, Ontario, do hereby certify that:
1. I am an independent mining consultant, contracted as Vice President, Engineering by P&E Mining Consultants
Inc.
2. This certificate applies to the Technical Report titled “Technical Report and Pre-Feasibility Study on the True
North Gold Mine, Bissett, Manitoba, Canada” (the “Technical Report”), with an effective date of June 30,
2016.
3. I am a graduate of The Haileybury School of Mines, with a Technologist Diploma in Mining. I subsequently
attended the mining engineering programs at Laurentian University and Queen’s University for a total of two
years. I have met the Professional Engineers of Ontario Academic Requirement Committee’s Examination
requirement for Bachelor’s Degree in Engineering Equivalency. I have been licensed by the Professional
Engineers of Ontario (License No. 39427505), from 1986 to the present. I am also a member of the National
and Toronto Canadian Institute of Mining and Metallurgy.
4. I have read the definition of “Qualified Person” set out in National Instrument 43-101 (“NI 43-101”) and certify
that, by reason of my education, affiliation with a professional association (as defined in NI 43-101) and past
relevant work experience, I fulfill the requirements to be a “Qualified Person” for the purposes of NI 43-101.
My relevant experience for the purpose of the Technical Report is:
Underground Hard Rock Miner, Denison Mines, Elliot Lake Ontario ....................................... 1977-1979
Mine Planner, Cost Estimator, J.S Redpath Ltd., North Bay Ontario ........................................ 1981-1987
Chief Engineer, Placer Dome Dona Lake Mine, Pickle Lake Ontario ....................................... 1987-1988
Project Coordinator, Mine Captain, Falconbridge Kidd Creek Mine, Timmins, Ontario .......... 1988-1990
Manager of Contract Development, Dynatec Mining, Richmond Hill, Ontario ......................... 1990-1992
General Manager, Moran Mining and Tunnelling, Sudbury, Ontario ........................................ 1992-1993
Independent Mining Engineer ........................................................................................................... 1993
Project Manager - Mining, Micon International, Toronto, Ontario ........................................ 1994 - 2004
Principal, Senior Consultant, Golder Associates, Toronto, Ontario ................................... 2004 – 2010
Independent Consultant, VP Engineering to P&E Mining Consultants Inc, Brampton ON 2011 – present
5. I am responsible for authoring Sections 1, 2, 3, 19 and co-authoring sections 21 and 22 of the Technical Report
along with those parts of the Executive Summary, and Sections 25 and 26 pertaining thereto.
6. I have not visited the Property that is the subject of this report.
7. I am independent of Klondex Mines Ltd. applying the test in Section 1.5 of NI 43-101.
8. I have had no prior involvement with the Property that is the subject of this Technical Report.
9. I have read NI 43-101 and Form 43-101F1 and this Technical Report has been prepared in compliance
therewith.
10. As As at the effective date of the Technical Report, to the best of my knowledge, information and belief, the
Technical Report contains all scientific and technical information that is required to be disclosed to make the
Technical Report not misleading.
Effective Date: June 30, 2016
Signed Date: October 27, 2016
{SIGNED AND SEALED} {Kirk Rodgers}
Kirk Rodgers, P.Eng

P&E Mining Consultants Inc., Report No. 315 Page 151 of 171
Klondex Canada Ltd. True North Gold Mine
APPENDIX I. TRUE NORTH CLAIMS INFORMATION

P&E Mining Consultants Inc., Report No. 315 Page 152 of 171
Klondex Canada Ltd. True North Gold Mine

P&E Mining Consultants Inc., Report No. 315 Page 153 of 171
Klondex Canada Ltd. True North Gold Mine

P&E Mining Consultants Inc., Report No. 315 Page 154 of 171
Klondex Canada Ltd. True North Gold Mine

P&E Mining Consultants Inc., Report No. 315 Page 155 of 171
Klondex Canada Ltd. True North Gold Mine

P&E Mining Consultants Inc., Report No. 315 Page 156 of 171
Klondex Canada Ltd. True North Gold Mine

P&E Mining Consultants Inc., Report No. 315 Page 157 of 171
Klondex Canada Ltd. True North Gold Mine

P&E Mining Consultants Inc., Report No. 315 Page 158 of 171
Klondex Canada Ltd. True North Gold Mine
APPENDIX II. RESOURCE WIREFRAMES FOR V91, V710 AND V711 VEINS

P&E Mining Consultants Inc., Report No. 315 Page 159 of 171
Klondex Canada Ltd. True North Gold Mine

P&E Mining Consultants Inc., Report No. 315 Page 160 of 171
Klondex Canada Ltd. True North Gold Mine

P&E Mining Consultants Inc., Report No. 315 Page 161 of 171
Klondex Canada Ltd. True North Gold Mine
APPENDIX III. CLASSIFICATION 3D MODELS AND CROSS SECTIONS
FOR V91, V710 AND V711 VEINS

P&E Mining Consultants Inc., Report No. 315 Page 162 of 171
Klondex Canada Ltd. True North Gold Mine

P&E Mining Consultants Inc., Report No. 315 Page 163 of 171
Klondex Canada Ltd. True North Gold Mine

P&E Mining Consultants Inc., Report No. 315 Page 164 of 171
Klondex Canada Ltd. True North Gold Mine

P&E Mining Consultants Inc., Report No. 315 Page 165 of 171
Klondex Canada Ltd. True North Gold Mine
APPENDIX IV. AU GRADE MODELS AND CROSS SECTIONS FOR V91, V710
AND V711 VEINS

P&E Mining Consultants Inc., Report No. 315 Page 166 of 171
Klondex Canada Ltd. True North Gold Mine

P&E Mining Consultants Inc., Report No. 315 Page 167 of 171
Klondex Canada Ltd. True North Gold Mine

P&E Mining Consultants Inc., Report No. 315 Page 168 of 171
Klondex Canada Ltd. True North Gold Mine

P&E Mining Consultants Inc., Report No. 315 Page 169 of 171
Klondex Canada Ltd. True North Gold Mine
APPENDIX V. TAILINGS DRILL PLAN, CLASSIFICATION AND AU
BLOCKS

P&E Mining Consultants Inc., Report No. 315 Page 170 of 171
Klondex Canada Ltd. True North Gold Mine

P&E Mining Consultants Inc., Report No. 315 Page 171 of 171
Klondex Canada Ltd. True North Gold Mine