TECHNICAL REPORT 86-19 - Nagra · NAGRA NTB 86-19 - ii - RESUME On a procédé à l'analyse...
155
Nagra Nationale Genossenschaft fUr die Lagerung radioaktiver Abfalie Cedra Societe cooperative nationale pour I'entreposage de dechets radioactifs Cisra Societacooperativa nazionale per I'immagazzinamento di scorie radioattive TECHNICAL REPORT 86-19 CHEMISTRY OF WATERS IN THE BOTTSTEIN, WEIACH, RINIKEN, SCHAFISHEIM, KAISTEN AND LEUGGERN BOREHOLES: A HYDROCHEMICALLY CONSISTENT DATA SET F. J. Pearson, Jr.1) J. L. Lolcama 2 ) A. Scholtis 3 ) 1) Consulting Ground-water Geochemist 10700 Richmond Ave. Suite 263 Houston, TX 77042 2) Intera Technologies Inc. 6850 Austin Center Blvd. Suite 300 Austin, TX 78731 and 3) NAGRA JUNE, 1989 Parkstrasse 23 5401 Baden/Schweiz Telephon 056/205511
Transcript of TECHNICAL REPORT 86-19 - Nagra · NAGRA NTB 86-19 - ii - RESUME On a procédé à l'analyse...

Nagra Nationale Genossenschaft fUr die Lagerung radioaktiver Abfalie
Cedra Societe cooperative nationale pour I'entreposage de dechets radioactifs
Cisra Societacooperativa nazionale per I'immagazzinamento di scorie radioattive
TECHNICAL REPORT 86-19
CHEMISTRY OF WATERS IN THE BOTTSTEIN, WEIACH, RINIKEN, SCHAFISHEIM, KAISTEN AND LEUGGERN BOREHOLES:
A HYDROCHEMICALLY CONSISTENT DATA SET
F. J. Pearson, Jr.1) J. L. Lolcama 2)
A. Scholtis 3)
1) Consulting Ground-water Geochemist 10700 Richmond Ave. Suite 263 Houston, TX 77042
2) Intera Technologies Inc. 6850 Austin Center Blvd. Suite 300 Austin, TX 78731
and 3) NAGRA
JUNE, 1989
Parkstrasse 23 5401 Baden/Schweiz Telephon 056/205511

Der vorliegende Bericht wurde im Auftrag der Nagra erstellt. Der Autor hat seine eigenen Ansichten und Schlussfolgerungen dargestellt. Diese müssen nicht unbedingt mit denjenigen der Nagra übereinstimmen.
Le présent rapport a été préparé sur demande de la Cédra. Les opinions et conclusions présentées sont celles de llauteur et ne correspondent pas nécessairement à celles de la Cédra.
This report was prepared as an account of work sponsored by Nagra. The viewpoints presented and conclusions reached are those of the author(s) and do not necessarily represent those of Nagra.

NAGRA NTB 86-19 - i -
ABSTRACT
Chemical analyses were made on water samples taken from many intervals of the first six Nagra deep boreholes. WITTWER (1986, NTB 85-49) gives complete results of these analyses, evaluates their purity, and where possible, corrects them for contamination. This report evaluates the geochemical consistency of these analyses with formations from which the samples were extracted.
Most samples appear to have lost CO 2 during collection, leading to calculated oversaturation with respect to calcite. Such samples were adjusted to calcite saturation, and the pH values, concentrations of carbonate species, and other saturation indices are given at that state.
Saturation indices were also calculated for the minerals dolomite, anhydrite, celestite, barite, fluorite, and the silica, minerals quartz and chalcedony, all of which are present in one or more of the rock type samples. With a few exceptions there is consitency between the calculated saturation indices and the presence of the respective minerals. This indicates that both the analytical data on the components of the minerals and the mineral properties included in the thermochemical data base are reliable.
Oxidation potentials were calculated from the platinum electrode potential and from analyzed concentrations of members of several redox couples. pE values based on the arsenic couple and the assumption of uraninite saturation tend to similar. The platinum electrode potential measured in some samples is also similar.
A thermochemical data base for aqueous species and minerals was developed to support the geochemical modeling performed for this report. This data base and the sources of the data chosen in an appendix.

NAGRA NTB 86-19 - ii -
RESUME
On a procédé à l'analyse chimique d'échantillons d'eau prélevé s à différentes profondeurs des six premiers forages profonds de la Cédra. WITTWER (1986, NTB 85-49) fournit tous les résultats de ces analyses et évalue leur pureté; partout où cela fut possible, les analyses furent corrigées pour tenir compte de la contamination. Ce rapport a pour objet d'évaluer la parenté géochimique de ces échantillons avec les formations dont ils sont issus.
La plupart des échantillons semblent avoir perdu du CO 2 lors de leur prélèvement, entraînant une surestimation de la saturation en calcite. Les analyses sont recalculées en fonction de la saturation en calcite, en conséquence les valeurs de pH, de concentration en carbonates, ainsi que les autres indices de saturation sont présentés dans l'état corrigé.
Les indices de saturation des minéraux dolomite, anhydrite, célestite, barite, fluorite, ainsi que les silicates quartz et calcédoine sont également calculés; ces minéraux se trouvent tous dans un ou plusieurs échantillons des différents types de roches. A quelques exceptions près, les indices de saturation calculés concordent avec la présence des minéraux correspondants. Cela démontre le fiabili té de la banque de données thermo-chimique constituée des données analytiques des éléments constitutifs des minéraux et de leurs propriétés minérales.
Les potentiels d'oxyda tion furent calculés à partir du potentiel de l'électrode de platine et des concentrations analysées de plusieurs couples rédox. Les valeurs de pE, basées sur le couple arsenic et sur l'hypothèse de la saturation en uraninite, montrent une certaine similitude; il en va de même pour le potentiel de l'électrode de platine mesuré sur quelques échantillons.
Une banque de données comprenant· substances aqueuses et minéraux fut développée dans le but de soutenir la modélisation géochimique exposée dans ce rapport. Le contenu de cette banque de données ainsi que les références des données choisies sont fournis en annexe.

NAGRA NTB 86-19 - iii -
ZUSAMMENFASSUNG
Wasserproben aus verschiedenen Tiefenintervallen der ersten sechs NagraTiefbohrungen wurden chemisch analysiert. In WITTWER (1986, NTB 85-49) wurden alle Resultate dieser Analysen präsentiert, ihre Reinheit evaluiert und, wo möglich, eine Korrektur fUr Verunreinigung durchgefUhrt. Ziel dieses Berichts ist es, die Uebereinstimmung dieser Analysen mit den Forma tionen, aus denen die Proben entnonnnen wurden, aus geochemischer Sicht zu bewerten.
Die meisten Proben haben anscheinend während der Entnahme CO 2 verloren, was zu einer Calcit-Uebersättigung fUhrt. Solche Proben wurden auf Calcit-Sättigung korrigiert, und die pH-Werte, die Konzentrationen der Carbonatspezies und andere Sättigungsindizes werden fUr diesen korrigierten Zustand angegeben.
Sättigungsindizes wurden auch fUr die Mineralien Dolomit, Anhydrit, Celestit, Baryt, Fluorit und die Silicat-Mineralien Quarz und Chalzedon berechnet; diese Mineralien sind alle in einer oder mehreren Proben der verschiedenen Gesteinstypen vorhanden. Mit einigen Ausnahmen, stimmen die berechneten Sättigungsindizes gut mit dem Auftreten der entsprechenden Mineralien Uberein. Diese Tatsache zeigt auf, dass sowohl die analytisch bestimmten Mineralbestandteile als auch die in der thermodynamischen Datenbasis gespeicherten Mineraleigenschaften zuverlässig sind.
Oxida tionspotentiale wurden aus dem Plat±nelektroden-Potential und analysierten Konzentrationen einiger Redoxpaareberechnet. pE-Werte, die sich auf das Arsen-Paar und auf die Annahme einer Uraninit-Sättigung stUtzen, zeigen gewisse Aehnlichkeiten, dies gilt ebenso fUr einige Wasserproben, die mit einer Platinelektrode gemessen wurden.
Eine thermochemische fUr die in diesem entwickelt. Diese Datenquellen, wird in
Datenbasis fUr wässrige Spezies und Mineralien wurde Bericht durchgefUhrte geochemische ModelIierung Datenbasis, zusammen mit den entsprechenden einem Anhang dokumentiert.
NAGRA NTB 86-19 - iv -
TABLE OF CONTENTS
ABSTRACT ZUSA.M:t-1ENFAS SUNG RESUME .... TABLE OF CONTENTS LIST OF TABLES 1.0 INTRODUCTION 1.1 1.1.1 1.1.2 1.1.3 1.2 1.2.1 1.2.2 1.2.2.1 1.2.2.2 1.2.2.3
1.2.3 1.2.4 1.2.5 1.2.5.1 1.2.5.2
1.2.6 1.2.7 1.3 2.0 2.1 2.2 2.2.1 2.2.2 2.3 2.3.1 2.3.2 2.3.3 2.3.4 2.3.5 3.0 3.1 3.2 3.3 3.3.1 3.3.2 3.3.3 3.4 3.4.1 3.4.2 4.0 4.1
4.2 4.3 4.3.1
Sources of Analytical Data Analyzed Constituents Excluded from this Data Set Selection of Results from Multiple Analyses Selection of Results from Multiple Laboratories Conversion of Units and Other Calculations Calculation of Molalities Total Dissolved Solids
Calculation from Analytical Data Residues on Evaporation . . Comparison of Calculated and Measured Total Dissolved Solids . . . . . . . . . . .
Calculation of Charge Balance . . . . . Geochemical Modelling and Thermochemical Data Carbonate Modelling . . . . . . . .
Dissolved Carbonate Species . . . . Calcite Equilibrium and Correction for CO2 Outgas-sing ..... .
Oxidation Potentials Sources of Uncertainty in Calculated Parameters Description of Contents of Data Tables B6TTSTEIN . . . . . . . . . . . . . . . Upper Muschelkalk 162.9 m (123.2 - 202.5 m) Buntsandstein/Weathered Crystalline 316.6 m (305.6 - 327.6 m) 312.5 m (305.2 - 319.8 m) Crystalline . . . . . . . Crystalline 399.5 m (393.9 - 405.1 m) Crystalline 621.3 m (618.5 - 624.1 m) Crystalline 618.4 m (608.0 - 628.8 m) Crystalline 792.4 m (782.0 - 802.8 m) Crystalline 1326.2 m (1321.0 - 1331.4 m) WEIACH ............... . Massenkalk 255.0 m (242.9 - 267.0 m) Upper Musche1kalk 859.1 m (822.0 - 869.1 m) Buntsandstein/Perm ..... Buntsandstein 985.3 m (981.0 - 989.6 m) Perm 1116.5 m (1109.2 - 1123.8 m) Perm 1408.4 m (1401.1 - 1415.7 m) Crystalline . . . . Crystalline 2218.1 m (2211.6 - 2224.6 m) Crystalline 2267.0 m (2260.5 - 2273.5 m) RINIKEN .... , .... . .... Schilfsandstein through Gansinger Dolomite 515.7 m (501.0 - 530.5 m) ...... . Upper Musche1kalk 656.7 m (617.3 - 696.0 m) Buntsandstein/Perm .... Buntsandstein 806.6 m (793.0 - 820.2 m)
i ii
iii iv vi
1 2 2 4 5 6 6 7 7
10
10 11 12 14 14
15 16 17 19 26 27 28 28 29 30 30 31 32 33 35 39 39 41 42 42 43 44 45 45 46 50
50 51 52 52

NAGRA NTB 86-19 - v -
4.3.2 4.3.3 4.3.4 5.0 5.1 5.2 5.2.1 5.2.2 5.3
5.4 5.4.1 5.4.2 6.0 6.1 6.1.1 6.1.2 6.2 6.2.1 6.2.2 6.2.3 6.2.4 6.2.5 6.2.6 7.0 7.1 7.2 7.3 7.3.1 7.3.2 7.3.3 7.3.4 7.3.5 7.3.6 7.3.7 7.3.8 7.3.9 7.3.10 7.3.11 8.0 9.0 APPENDIX:
Perm 965.5 m (958.4 - 972.5 m) Perm 993.5 m (977.0 - 1010.0 m) Perm 1361.5 m (1354.0 - 1369.0 m) SCHAFISHEIM Lower Susswassermo1asse 558.0 m (553.0 - 563.0 m) Upper Muschelkalk Upper Muschelkalk 1260.4 m (1227.8 - 1293.0 m) Upper Musche1kalk 1251.1 m (1240.7 - 1261.6 m) BuntsandsteinfWeathered Crystalline 1488.2 m (1476.0 -1500.4 m) Crystalline Crystalline 1571.1 m (1564.5 - 1577.7 m) Crystalline 1887.9 m (1883.5 - 1892.3 m) KAISTEN Buntsandstein/Perm Buntsandstein 113.5 m (97.0 - 129.9 m) Perm 284.3 m (276.0 - 292.5 m) Crystalline Crystalline 310.4 m (299.3 - 321.5 m) Crystalline 482.6 m (475.5 - 489.8 m) Crystalline 819.4 m (816.0 - 822.9 m) Crystalline 1031.0 m (1021.0 - 1040.9 m) Crystalline 1153.3 m (1140.8 - 1165.8 m) Crystalline 1271.9 m (1238.0 - 1305.8 m) LEUGGERN Upper Muschelkalk 74.9 m (53.5 - 96.4 m) Buntsandstein 217.8 m (208.2 - 227.5 m) Crystalline Crystalline 251.2 m (235.1 - 267.5 m) Crystalline 444.2 m (440.4 - 448.1 m) Crystalline 538.0 m (507.4 - 568.6 m) Crystalline 705.7 m (702.0 - 709.5 m) Crystalline 847.0 m (834.5 - 859.5 m) Crystalline 923.0 m (916.2 - 929.7 m) Crystalline 1192.5 m (1176.2 - 1208.8 m) Crystalline 1203.2 m (1179.3 - 1227.2 m) Crystalline 1433.4 m (1427.4 - 1439.4 m) Crystalline 1643.4 m (1637.4 - 1649.3 m) Crystalline 1665.5 m (1642.2 - 1688.9 m) SUMMARY AND CONCLUSIONS LITERATURE CITED
Thermodynamic Data Used for Geochemical Modelling
53 54 55 60 60 61 62 63
64 65 65 66 70 70 70 71 72 72 73 74 75 76 77 82 82 83 84 86 86 87 88 88 89 90 91 92 93 93 99
101 A.1

NAGRA NTB 86-19 - vi -
Table 1.1:
Table 1.2:
Table 1.3:
Table 1.4:
Table 2.1:
Table 2.2:
Table 2.3:
Table 3.1:
Table 3.2:
Table 4.1:
Table 4.2:
Table 4.3:
Table 5.1:
Table 5.2:
Table 6.1:
Table 6.2:
Table 7.1:
Table 7.2:
LIST OF TABLES
Metals analyzed only in early samples and not included in consistent data set . . .
Analytical techniques used by Institut Fresenius and PSI for analysis of dissolved gases . . . . .
Atomic and molecular weights used in this report (WAGMAN AND OTHERS, 1982) ....... .
Factors by which reported concentrations of certain dissolved species were multiplied before calculating the sum of dissolved solids . .
Chemistry of water from B6ttstein borehole
Uranium concentrations and pE values at uraninite saturation for waters from the B6ttstein borehole
Chemistry of water from 1326 m zone of B6ttstein borehole . . . . . . . . . . . . . . ...
Chemistry of water from Weiach borehole
Uranium concentrations and pE values at uraninite saturation for waters from the Weiach borehole
Chemistry of water from Riniken borehole
Uranium concentrations and pE values at uraninite saturation for waters from the Riniken borehole
Chemistry of samples and corrected chemistry of water from 1362 m interval of the Riniken bore-hole ................. .
Chemistry of water from Schafisheim borehole
Uranium concentrations and pE values at uraninite saturation for waters from the Schafisheim bore-hole . . . . .. . ....... .
Chemistry of water from Kaisten borehole
Uranium concentrations and pE values at uraninite saturation for waters from the Kaisten borehole
Chemistry of water from Leuggern borehole . . .
Uranium concentrations and pE values at uraninite saturation for waters from the Leuggern borehole
3
6
8
9
37
27
36
48
40
58
51
56
68
61
78
70
95
83

NAGRA NTB 86-19 - 1 -
1.0 INTRODUCTION
During the Nagra deep borehole programme, a number of water samples were collected from water-bearing zones in both the sedimentary and crystalline rocks encountered. Field and laboratory analyses of these samples were to be used to characterize the geochemical environments in the sub - surface. Before beginning the process of extracting geochemical information from the analytical data, it is important to evaluate carefully how well the sample data represent groundwater conditions.
There are three primary reasons why analytical data on water samples may not represent the chemistry of water in the formation from which the sample was taken.
First, there may be errors in one or more of the chemical analyses or measurements of the physical properties of the sample. Several tests have been applied to these analyses to try to delete such errors. First, the consistency of the analyses of major dissolved species is checked using ion charge balance and by comparing the total dissolved solids content determined as the residue on evaporation with the value calculated as the sum of the analyzed constituents. These consistency checks are discussed in Sections 1.2.2 and 1.2.3 below. Second, duplicate samples were collected from many intervals and analyzed separately. Errors in major and most minor dissolved constituents would have been detected from the comparison of these replicate analyses as discussed in Sections 1.1.2 and 1.1.3. Third, as mentioned in Section 1.2.4, values of such calculated geochemical parameters as mineral saturation indices can be used in many cases to discover analytical errors.
The second reason why analytical data may not be representative of the natural groundwater is that a sample may be contaminated. Such contamination could occur either by mixing with non-formation fluids or by reaction with non-formation solids. The samples discussed here were taken during, and shortly after, completion of drilling, so the most likely contaminating substances are drilling fluid, solid debris from drilling, and the drilling and sampling equipment itself.
The influence of drilling fluid on sample chemistry has been carefully evaluated by WITTWER (1986) using drilling records, drilling fluid tracer data, the results of sequential sampling and tritium data. Based on these considerations, WITTWER presents a list of analytical data of samples which are minimally contaminated by non-formation fluids or which have been corrected for such contamination. This report relies heavily on WITTWER's conclusions about sample quality and adopts the concentrations given in her report for species such as chloride, which are likely to have been effected only by fluid contamination.
It is more difficult to evaluate the possibility of sample contamination by reaction with solids than contamination by foreign fluids. This report considers reactions with solids as possible

NAGRA NTB 86-19 - 2 -
explanations for inconsistencies noted in some of the geochemical parameters of the samples.
The third major type of differences between sample data and the chemistry of in situ groundwater are brought about by reactions accompanying changes in pressure and temperature which occur during sampling. Such changes may effect the saturation state of the solution with respect to dissolved minerals and gases. Because the processes of mineral dissolution and, particularly, precipitation do not occur rapidly, they are not likely to affect the chemistry of a sample unless the sampling is done very slowly and the formation temperature is high. Gas dissolution or evolution does occur rapidly, however, and is a process which seems to have effected the observed carbonate chemistry of most of the samples discussed.
This report examines analytical data corrected for fluid contamination for their consistency with the physical and mineralogical environment of the formations from which they were taken. The analytical data are adjusted to eliminate or minimize any inconsistencies found, and the results are given as representing the chemistry of the water as it exists in the source formation.
The remainder of this section discusses the conventions followed and the procedures used to examine and adjust the analytical data, and describes the contents of the data tables.
1.1 Sources of Analytical Data
1.1.1
Samples for consideration from the borehole testing programme have been assigned a classification of Block 1, 2 or 3 based on the extent to which they are contaminated by residual drilling fluid. Sample classification and. the corrections required for those samples containing some drilling fluid are described by WITTWER (1986). This report considers Block 1 and 2 samples from the B6ttstein, Weiach, Riniken, Schafisheim, Kaisten, and Leuggern boreholes. Although the B6ttstein samples were discussed by PEARSON (1985), for completeness they are included in this report as well. The original equilibrium and pE calculations for the B6ttstein waters have been revised to reflect changes in the thermodynamic data base used since the preparation of the earlier report.
Many zones were sampled more than once, and WITTWER (1986) gives several analyses for them. Further, some dissolved constituents, including the gases and uranium, were analyzed by several laboratories. This section describes the selection of the single values given in the consistent data set from the several sets of analytical data.
Analyzed Constituents Excluded from this Data Set
The tables of analytical results given by WITTWER (1986, Beilage 3.18 to 3.23) include all the constituents called for in the test

NAGRA NTB 86-19 - 3 -
plans for the boreholes (NAGRA, 1982, Table 3, for example). Analyses for all scheduled constituents were made on the first 11 to 15 samples from the Bottstein, Weiach, and Riniken boreholes. A number of metals were either not detected or were found in so few of the early samples that no analyses were made for them in the later samples. These metals, which are not included in the data of this report, are described in Table 1.1. The detection limits for the constituents reported are given in Beilage 3.18a of WITTWER (1986). Detection limits as well as the precision of the several analyses are also given in Table 4 of KUSSMAUL AND ANTONSEN (1985).
Table 1.1: Metals analyzed only in early samples and not included in consistent data set.
Constituents
SyniJol Detection limit (~/l)
No. of No. Remarks GrOl4l Analyses Detected
-------------------------------------------------------------BeryL L fum Be+2 0.0001 11 2 At detection l imi t
-0.001 Titanium Ti 0.005 11 2 At detection Limit
From DST sampLe Zirconium Zr+4 0.01 12 0 CobaLt Si l ver cadmium
Mercury
Tin Chromium
Vanadium
Co+2 0.005 13 3 At detection limit Ag+ 0.002 14 1 From DST sample Cd 0.0002 15 3 At detection limit
2 From DST sample and Pengo Bailer
Hg 0.0001 13 2 At detection limit 5 Measurable
Sn+2 12 Measurable Cr or 0.002 15 2 At detection limit Cr+3 4 From DST sample,
Pengo Bailer, and GTC sampler
2 Measurable V 0.005 12 0
Attributes of Groups:
A Analyses at or below detection limits given by WITTWER (1986, Beilage 3.18a).
B Above detection only in metallic, possibly contaminating sampling vessels.
C In measurable concentrations in a few samples.
A
B
A A B B
C
C C
A
The concentrations ~f four constituents, beryllium, zirconium, cobalt, and vanadium, were below or just at the analytical detection limit in all samples analyzed. The concentrations of three constituents, titanium, silver, and cadmium, were below or just at their detection limit in all but one or two samples. These exceptional samples were collected using raw metal sampling apparatus such as drill stem test tools and may well have anomalous metals

NAGRA NTB 86-19 - 4 -
1.1.2
concentrations from contact with these tools. Analyses for these constituents and for mercury were not made on samples taken after the first sample from Riniken. None of them have been included in the tables of this report.
There are also three anionic constituents for which most samples were analyzed, but which are not included in this report. These constituents, selenium, nitrite and nitrate, were detected in only a few of the samples.
Selection of Results from Multiple Analyses
A number of water-bearing zones were sampled more than once. If the zone flowed to the surface or could be pumped, the surface discharge was sampled. Such zones were generally also sampled at depth using a GTG or Preussag pressure sampler. Zones yielding little water were commonly sampled only at depth using a bailer or the Preussag pressure sampler. Details of the sampling procedures and equipment are given by HAUG (1985).
Larger samples could be collected at the surface than with the pressure samplers, so the volumes available from some down-hole samples were not large enough to permit analyses of all trace constituents or residues on evaporation. In addition, the charge balance of several pressure samples, including Bottstein 301/13 and Kaisten 305/5 and 17, is worse than four per cent, perhaps because an insufficient volume of sample was available to permit re-analysis of maj or constituents to refine the balance. The charge balance of at least one of the larger surface samples, Leuggern 306/5, is also worse than four per cent, however.
Except for those analyses which are obviously suspect by virtue of unusually poor charge balances, there is little reason to choose the results of either the surface-collected or down-hole samples as being superior. Thus, the concentrations of dissolved solids given in this report are generally the mean of the replicate samples from the interval. If a different choice of concentration was made, the reasons for that choice are given in the text.
While the concentrations of most dissolved constituents agree well among replicate samples, large differences are evident for the concentrations of others. Zinc generally has higher concentrations in the samples collected at the surface than in those collected down-hole. This is attributed to the greater opportunity for contact between formation water and the tubing and other borehole sampling apparatus for samples travelling to the surface than for those collected at depth. There are frequent differences between the concentrations of nickel, copper, and lead as well. There is less consistency about which type of sample has the higher concentration of these constituents than there is for zinc, but the differences are also probably related to such artifacts as copper sampling tubes and stainless steel in the down-hole sampling string.

NAGRA NTB 86-19 - 5 -
1.1.3
Although the precise reason for differences in the concentrations of nickel, copper, lead, and zinc cannot be ascertained for every sample pair, it is probable that all four are dissolving into formation water to some extent from the sampling apparatus. Thus, it is not possible to be certain what concentration should be assigned to each of these constituents in the formation water. Certainly it should be as low as or lower than the lowest analyzed value. Thus, the concentrations of these four metals are given in this report as less than «) the lowest analyzed value.
The nature of the drilling and sampling operations makes it likely that the concentrations of several other dissolved constituents are also higher in the samples than in the formation water. The iron and aluminum concentrations of all samples are considerably higher than would be expected from geochemical considerations. Iron could easily have been added to formation water by reaction with the drilling and sampling apparatus, as mentioned in Section 1.2.7, while aluminum could come from the rock flour produced during drilling. The expected concentrations of dissolved organic carbon (DOC) in groundwaters are not well known, but it is also likely that DOC could have been added to the formation water from drilling and sampling apparatus. Thus, the concentrations of iron, aluminum, and DOC are also given in this report as less than the lowest value analyzed.
Finally, most samples have dissolved hydrogen, H2 (aq)' contents corresponding to conditions much more reducing than suggested by any other redox couple. As discussed in Section 1.2.7 below, it is likely that at least some of the hydrogen analyzed is, like some of the dissolved iron, a product of the corrosion of metallic iron tools, tubing, etc. in the borehole. Thus, in this report dissolved hydrogen concentrations are also given as less than the value measured.
It was necessary to make other selections of the data included in this report. These selections and the basis for them are given in Section 1.3 and in the discussions of the sampled intervals.
Selection of Results from Multiple Laboratories
Dissolved gases were analyzed by several analytical groups using a number of measurement techniques. The results given by WITTWER (1986) are from Institut Fresenius and the Paul Scherrer Institut (PSI), formerly the Eidgenossisches Institut fur Reaktorforschung (0. Antonsen). The methods used for these analyses are described in KUSSMAUL AND ANTONSEN (1985) and are summarized in Table 1.2. The selection of results used in this report is described in Section 1.3 and in the discussions of the sampled intervals.
Uranium analyses were made by Institut Fresenius, PSI, and at the Atomic Energy Research Establishment (AERE), Harwell, U.K. (M. Ivanovitch). There is reasonable agreement among the results from all three laboratories, particularly at higher concentrations. For consistency with the report on the isotope geochemistry of groundwater in northern Switzerland (NTB 88-01, in preparation),

NAGRA NTB 86-19 - 6 -
1.2
1.2.1
Table 1.2: Analytical techniques used by Institut Fresenius and PSI for analysis of dissolved gases.
Gas
°2 N2
CO2
H2
He
Ar
H2S
Institut Fresenius
Oxygen electrode or Winkler titration.
Extracted into vacuum; Analyzed by gas chromatography.
Titrated base capacity.
As for N2•
As for N2•
As for N2•
Laboratory measurement of total sulphide fixed with zinc acetate; value is for total sulphide.
As for N2•
PSI
Extracted into vacuum; Analyzed by mass spectroscopy.
As for 02.
As for 02: CO2(aq) is less than value reported because of disproportionation of HC03- during extraction into vacuum.
As for 02.
As for 02.
As for 02.
As for 02; H2S(aq) may be less than value reported because of disproportionation of HS- during extraction into vacuum.
As for 02.
the AERE analysis were generally used in this report. The uranium results are discussed further in Section 1.3 and in the discussions of the individual samples.
Conversion of Units and Other Calculations
Calculation of Molalities·
Molal concentrations, moles of solute per kilogram H20, abbreviated m, are commonly used for geochemical calculations because they do not change with external conditions. Values of concentrations given per volume of solution (mg/l, for example), and per mass of solution (mg/kg soln, for example, or ppm) are not constant with changes in temperature, pressure or concentrations of other dissolved constituents.
Concentrations in Nagra analyses and in WITTWER (1986) are given as milligrams per litre solution (mg/l) or milligrams per kilogram solution (mg/kg or ppm) and must be converted to molalities for geochemical modelling. This conversion requires knowledge of the total dissolved solids content (TDS, mg/l) , calculated as described in Section 1.2.2, and the solution density (kg/I). The density of each sample is reported in the tables of analyses in WITTWER (1986) in units of g/cm3
, which is equivalent within the precision of this report to kg/I. The calculation is as follows:

NAGRA NTB 86-19 - 7 -
1.2.2
1.2.2.1
1
FW
m (_mOle )= kg H20
1 ( m \. (litre sOln) 1000 mmole} kg H20
In this expression, C is the reported concentration of the substance, FW its formula weight, and the factor (litre soln/kg H20) is the reciprocal of:
( kg H20 ~_ .
1· 1 - Denslty ltre so n (
kg soln \ _ TDS ( mg ) • 10-6(~ \ litre soln } litre soln mg }
The formula weights used in developing the data set are those recommended by the U.S. National Bureau of Standards (WAGMAN AND OTHERS, 1982) and are given in Table 1.3.
Total Dissolved Solids
The total dissolved solids content of a water sample can be calculated as the sum of the analyzed concentrations of individual dissolved constituents. It can also be determined directly by measuring the mass of the residue left after evaporating a given volume of sample to dryness. It is useful to compare both measures of total dissolved solids as a check that no major dissolved constituent remains unanalyzed and that there is no significant error in the analysis of any major dissolved constituent.
Calculation from Analytical Data
The character of most constituents in solution is the same as in the residue on evaporation. That is, the masses of such species as Na+, Ca+2 , Al+3 , Cl-' or S04-2 in the residue are the same as their reported masses in solution. The concentrations of other constituents in solution are reported in terms of species which are different from those which are present in the residue on evaporation. The reported dissolved concentration of the latter type of constituent must be corrected before being included in the calculated sum of total dissolved solids.
Two dissolved species are present in most groundwaters in large enough concentrations that failure to correct their reported concentrations can lead to significant errors in calculated values of total dissolved solids. They are bicarbonate, which is reported as mg HC03-/l, and silica, reported as mg H2Si03/1.
During evaporation, HC03 - in solution reacts as follows:

NAGRA NTB 86-19 - 8 -
Table 1.3: Atomic and molecular weights used in this report (WAGMAN AND OTHERS, 1982).
Name Synbol Charge
Elements and Cations
Oxygen ° Hydrogen H Sulphur S Nitrogen N Phosphorus P Arsenic As Carbon C Si l icon Si Boron B Uranium U
Lithium Li 1 Sodium Na 1 Potassium K 1 Rubidium Rb 1 Cesium Cs 1 Ammonium NH4 1 Magnesium Mg 2 Calcium Ca 2 Strontium Sr 2 Barium Ba 2 Radium Ra 2 Manganese Mn 2 Iron Fe 2 Nickel Ni 2 Copper Cu 2 Zinc Zn 2 Lead Pb 2 Aluminum Al 3 Uranyl
(U VI) UOz 2
FOMIIJla "eight (g/moL)
15.9994 1.0080 32.064 14.0067 30.9738 74.9216 12.0112 28.086 10.811 238.029
6.941 22.9898 39.102 85.4678 132.9054 18.0387 24.312 40.08 87.62 137.34 226.025 54.9380 55.847 58.71 63.54 65.37 207.19 26.9815
270.0278
Name Syubol FOnl'llLa
Charge "eight (g/mol)
Anions and Neutral Species
Fluoride F -1 18.9984 Chloride Cl -1 35.453 Bromide Br -1 79.909 Iodide I -1 126.9044 Sulphate S04 -2 96.0616 Nitrite NOz -1 46.0055 Nitrate N03 -1 62.0049 Phosphate P04 -3 94.9714 Arsenite
(As I II) As03 -3 122.9198 Arsenate
(As V) As04 -3 138.9192 Bicarbonate HC03 -1 61.0174 Carbonate C03 -2 60.0094 Bisulphide HS -1 33.072 Sulphide S -2 32.064 Hydroxide OH -1 17.0074
Silicic Acid HzSi03 0 78.1002
Silica Si02 0 60.0848 Boric
Acid B(OH)3 0 61.8332 Water H2O 0 18.0154
Dissolved Gases:
°2 0 31.9988 Nz 0 28.0134 CO2 0 44.0100 H2 0 2.0160 He 0 4.0026 Ar 0 39.948 H2S 0 34.080 CH 4 0 16.0432
so that only one mole of C03 -2 is present in the residue for each
two moles of HC03- reported in solution. The correction factor for HC03 - is 0.4917 mg C0 3 -z jmg HC03 -, which equals:
60.0094 mg C03 -z •
mrnole C03 -2
o . 5 mrnole C03 -2
mmole HC03
1 61.0174
mmole HC03-
mg HC03-
The formula weights used to calculate this and the following correction factors are those given in Table 1.3. The factors themselves are summarized in Table 1.4.

NAGRA NTB 86-19
Table 1.4:
Species Reported
- 9 -
Factors by which reported concentrations of certain dissolved species were multiplied before calculating the sum of dissolved solids.
THIS REPORT SCHMASSMANN AND OTHERS (1984) and WITTWER (1986)
Species Correction Species Correction in Factor in Factor
Resic1Je Resic1Je
----------------------------------Alkalinity
as HC03- CO -z 3 0.4917
HCO -Z 3 CO -z 3 0.4917
CO -z 3 CO -z 3 1.0000
HzSi03 SiOZ 0.7693 SiOz 0.7693
p PO -3 4 3.0662 HPO -z 4 3.0907
As AsO -3 4 1.8542 HAS04- Z 1.8676
As (III) As04 -3 1.8542 HAS04- 2 1.8676
As (V) AsO -3 4 1.8542 HAS04- Z 1.8676
Al Al+3 1.0000 Al(OH)4 3.5213
U UO +z 2 1.1344 U 1.0000
Silica is present in solution primarily as H4Si04 and its dissociation products, but it will appear in the residues from evaporation as SiOz ' The correction factor for HzSi03 is 0.7693 mg Si02/mg HzSi03 , which equals:
1 78.1002
nunole Si mg HzSi03
60.0848 mg Si02
nunole Si
Several other constituents are also reported in the Nagra analyses in terms of species which are not those in which they occur in the residue on evaporation. The concentrations of these other constituents are so small that their contribution to the calculated total dissolved solids is within the margin of error expected for this parameter. Thus, to correct them does not improve the precision of the calculation. For completeness, however, these constituents are mentioned here and correction factors for them are given in Table 1.4. The choice of species is based on stability diagrams for the elements as given by BAES AND MESMER (1976), and by POURBAIX (1974). The minor constituents are:
Phosphorus, which is reported as mg P/l, but which is actually present in the residue on evaporation as P04- 3 ;
Arsenic, which is reported as As+3 and As+5. Residues on evaporation are prepared by heating in air, which is an oxidizing process. Thus, the oxidized form of an element is likely to be

NAGRA NTB 86-19 - 10 -
1.2.2.2
1.2.2.3
present in the residue. For arsenic, this form is the arsenate • A 0 -3 anlon, s 4 ;
Uranium, which is reported as U, but which will also be present in residues on evaporation in its oxidized state as uranyl, U02+2 •
Calculated total dissolved solids contents are also given in Beilage 3.24 through 3.29 of WITTWER (1986). In developing the sums in these Beilagen, corrections were made to some of the reported concentrations. These corrections were similar to those discussed in this section, and were described in SCHMASSMANN AND OTHERS (1984, Section 4.3.2 and Table 6). The same factors are used for correcting the major constituents both in SCHMASSMANN AND OTHERS (1984) and in this report (Table 1.4). The factors adopted for correction of the minor species in SCHMASSMANN AND OTHERS (1984) and WITTWER (1986) assume more hydrated forms of the substances than those used here. The more hydrated forms may well be correct for the species when in solution, but in the residue after heating, anhydrous forms are probably more appropriate. In any case, the differences in the factors are small, as are the concentrations of the species they multiply, so virtually no differences in the calculated total dissolved solids result from the different factors used for the minor constituents.
Residues on Evaporation
The Nagra analyses include determinations of the residues on evaporation at 110°C and 180°C. The results of both are given by WITTWER (1986, Beilage 3.18 to 3.23). Inspection of these tables shows that for samples of relatively low salinity, such as those taken from the crystalline, both measurements tend to agree, generally within a few mg/l .. This agreement is concordant with the ± 5 mg/l precision of the determination given in KUSSMAUL AND ANTONSEN (1985, Table 4). For samples of higher salinity such as were collected from the Muschelkalk and from Permian sediments, the 180°C results are significantly lower than those determined at 110°C.
Comparison of Calculated and Measured Total Dissolved Solids
Calculated sums of analyzed constituents and residues on evaporation at 110° and 180°C are given in the data tables of this report.
From inspection of these tables it can be seen that for the less saline waters, such as those from the crystalline, there is generally good agreement between the sums and the residues on evaporation, with a tendency for the residues to be smaller than the sums. It is also evident from these tables that the residues on evaporation from more saline samples tend to be considerably higher than the sums of analyzed constituents.

NAGRA NTB 86-19 - 11 -
1.2.3
According to Dr. Kussmaul of Institut Fresenius (in SCHMASSMANN, 1986, p. 5), for bicarbonate waters, residues on evaporation at 180°C tend to agree well with the sums of analyzed constituents. For sulphate waters, however, the 180°C values tend to be larger than the sums. This is attributed to the fact that at 180°C, some residual water of hydration may be associated with CaS04 in the residue which is not included in the sum. This water of hydration can be expelled from the residue by heating at 260°C. In support of this contention, SCHMASSMANN (1986, p. 5) noted that differences between the sums and the residues at 110°C correlate with the sulphate contents of the samples.
Comparison between the two measures of total dissolved solids is intended to serve as a check on the completeness and accuracy of an analysis. As indicated by the results given, both by WITTWER (1986) and in this report, however, differences of up to several per cent of the total solids content are to be expected even in analyses as carefully made as those for the Nagra programme. An uncertainty of several per cent of the total dissolved solids of the more saline waters equals several hundreds of mg/l. This is such a large uncertainty that the total dissolved solids comparison can be used to check only for gross errors in the major dissolved constituents in these waters.
Calculation of Charge Balance
Solutions are electrically neutral so the total positive charge of the dissolved cations must exactly balance the total negative charge of the dissolved anions. If accurate analyses of all ions dissolved in a water are available, the sum of the charges of the analyzed cations should balance the sum of the charges of the anions. An imbalance would indicate that not all ions had been analyzed and (or) that the-analysis of one or more of the ions was in error. Charge balances are given in Beilage 3.24 to 3.29 of WITTWER (1986) and in the data tables of this report.
Ion charges are expressed in milliequivalents (meq or mval). In WITTWER (1986) they are given in meq/l and were calculated:
C ( mg ). ,litre
Charge ( meq ). mmole
I FW
where C and FW represent concentration and formula weight, as before.
In this report, charge is expressed as meq/kg H20 and was calculated using:

NAGRA NTB 86-19 - 12 -
1.2.4
• 3 (mmole ) ( meq ') Mola11ty • 10 kg H20 • Charge mmole)
Charge balances are expressed in per cent and calculated using:
~ Cations - ~ Anions 100 L Cations + ~ Anions 2
The value of the charge balance will be the same whether the charge is expressed in units of meq/l or meq/kg H20.
Charge balances are useful indicators of the completeness and accuracy of the analyses of major ions in most Nagra samples. However, according to Dr. Pogoda (Institut Fresenius, oral communication, November, 1988), in waters of more than about 1500 to 2000 mg/l sodium, the precision of direct analyses for this constituent is so poor that it was determined indirectly by setting it to the value which gave a charge balance of zero. Under these conditions, of course, the charge balance can no longer be used as an independent check on an analysis.
Some of the analyses of relatively saline waters have charge balances of 0.0 per cent, but others have slight charge imbalances. If sodium has been adjusted for charge balance, it is not apparent why all the ~ore saline samples do not have zero charge balances.
Geochemical Modelling and Thermochemical Data
The geochemical consistency of a sample or samples from a particular interval was tested by examining parameters of the carbonate system, comparing the state of saturation of the formation fluids with minerals known or likely to be present in the rock of the sample zone, and examining the consistency between indicators of oxidation potential. All three consistency checks require the use of a geochemical model and a consistent thermodynamic data base. These are discussed in this section.
The geochemical model was applied to water analyses from each interval sampled, and saturation indices for a number of minerals were calculated. The saturation index is defined:
where:
SI = log lAP - log KT
log KT is the value for the equilibrium constant for the dissolution of the mineral at the formation temperature of the water, and:
log lAP is the product of the thermodynamic activities of the aqueous species into which the mineral dissociated.
A saturation index of zero indicates the solution is just saturated with respect to the mineral. A positive saturation index indicates oversaturation and a negative index undersaturation. A

NAGRA NTB 86-19 - 13 -
saturation index of -1, for example, means that a solution is 1/10 saturated.
The geochemical computer model used to examine the analyses given in this report is a version of the U.S. Geological Survey Program PHREEQE (PARKHURST AND OTHERS, 1980). The PHREEQE code uses the ion-pair model of solution behaviour to calculate the distribution of species actually present in a solution from its chemical analysis. With the distribution of species known, the code is then able to calculate the saturation state of the solution with respect to a number of minerals. Finally, PHREEQE is able to simulate the changes in solution composition which would occur were reactions added to the solution and the solution brought to equilibrium with specified minerals.
To use a geochemical code such as PHREEQE requires not only analytical data on the solution of interest, but thermodynamic data on the species likely to be present in solution and on minerals of interest. While most geochemical computer models are supplied by their authors with thermodynamic data bases, these data bases may not have been so carefully constructed and evaluated as to be useful for every problem. Thus, it is important that each user of a geochemical model assure himself that the thermodynamic data he uses are internally consistent and appropriate for his problem. For example, the documentation to the original PHREEQE computer model states: "Although the PHREEQE data base ... has been extensively tested against results from WATEQ2 and WATEQF, it is not documented in detail and is intended only as a preliminary data base which may be used for testing purposes. The responsibility for final selection of thermodynamic data used by PHREEQE rests with the user" (PARKHURST AND OTHERS, 1980, p. 42).
A thermodynamic data base .has therefore been assembled specifically for use in evaluating the Nagra borehole samples. The data are given in Appendix A, together with notes describing the data sources and reasons for their selection. The data set does not include iron or manganese minerals. In the discussion of samples from the Bottstein borehole given by PEARSON (1985) it was pointed out that one of the probable effects of sampling on groundwater composition was an increase in dissolved iron and hydrogen due to corrosion by the groundwater of iron present in the sampling apparatus in the borehole. The absence of iron and manganese minerals from the data base precluded any attempt to reconcile the iron and manganese chemistry of the samples described in this report. In addition, iron and manganese chemistry could not be used to estimate oxidation potentials.
Although the data base includes dissolved aluminum and silica species, no alumino-silicate minerals are included in it. Thus, no adjustments have been made to silica and aluminum concentrations. In the discussion of chemistry of the Bottstein borehole (PEARSON, 1985), silica was adjusted to chalcedony saturation, and it was pointed out that the analyzed aluminum concentrations were consistent with solution saturation with respect to the mineral kaolinite. Review of the thermodynamic data base used in preparing that report shows that the kaolinite data included were seri-

NAGRA NTB 86-19 - 14 -
1.2.5
1.2.5.1
ously in error and that the aluminum contents of the Bottstein waters indicated oversaturation by approximately two orders of magnitude with respect to kaolinite. In the analyses in this report, the silica and aluminum values reported are those analyzed.
Equilibrium constants for mineral dissolution and the formation of aqueous species vary with temperature and pressure. The PHREEQE model and the thermodynamic data base used include equations and data to adjust these constants to formation temperatures. Neither the model nor the data base will make corrections for changes in pressure, however. Thus, the results of the calculations given in this report refer to pressures of one bar.
Carbonate Modelling
Dissolved Carbonate Species
The Nagra analyses report concentrations for bicarbonate (HC03-) and carbonate (C03-2). The values given are not directly measured values for these constituents, but are calculated from m- and p-values determined by an alkalinity titration.
In conventional water analysis practice, it is assumed that only hydroxide (OH-) , carbonate, and bicarbonate species contribute to the alkalinity, and so alkalinity results are often given in terms of these species. This practice was followed in presenting the results of the Nagra analyses in WITTWER (1986).
In reality, there are many dissolved species in addition to bicarbonate, carbonate and hydroxide which neutralize acid at pH values above 4.3 and contribute to the total alkalinity measured in most natural waters. Species of this type which occur in Nagra waters include:
The hydrolysis products of several metals including Mn+2, Fe+2, Fe+3, and Al+3. Examples include Fe(OH)3-' Fe(OH)2o, FeOH+, and analogous Mn+2 forms, and Fe(OH)4-' Fe(OH)30, Fe(OH)2+' and analogous Al+3 species. All of these species react with H+ ions to form free metal ions during an alkalinity titration;
Certain acids including P04 -3 and HP04 -2, and As04 -3 and HAs04 -2, which react with H+ ions to form H2P04 and H2As04 -, respectively;
The bisulphide (HS-) and sulphide (S-2) ions which react to form H2S, during an alkalinity titration;
The hydrolysis products of the alkaline earth elements, such as BaOH+, as well as NH3 0, H3Si04 -, and H2B03 - . These species are significant only in waters of pH values greater than nine or ten, but also react with H+ during an alkalinity titration.
These and similar species are usually present in concentrations which are low relative to carbonate species concentrations, so the

NAGRA NTB 86-19 - 15 -
1.2.5.2
conventional attribution of all the measured alkalinity to carbonate species introduces errors of only a few mgll or less. Errors of this size are commensurate with the experimental uncertainty in the alkalinity determination itself. The reported precision of the analyses for HC03- and C03 -2 are one to five and five mgll, respectively (KUSSMAUL AND ANTONSEN, 1985, Table 4).
Geochemical models of solution behaviour such as PHREEQE include routines to correct total alkalinity values for non-carbonate species and so calculate the correct concentrations of carbonate species. The total alkalinity values required as input to PHREEQE were reconstructed from the data of WITTWER (1986). From the bicarbonate and carbonate concentrations reported as mg HC03 - II and mg C03 -2/1,
Alkalinity ( meg )= mg HC03- 1 ( meg ) litre litre EW mg HC03 -
+ mg C0
3- 2
iw ( meg ) litre mg C03 Z
where EW, the equivalent weights, are the formula weights from Table 1.3 divided by the number of equivalents per mole. For HC03- which has one equivalent per mole, the equivalent weight is the same as the formula weight, 61.0174 mg/meq; for C03-
2, which
has two equivalents per mole, the equivalent weight is 30.0047 mg/meq.
Several samples from the Nagra test boreholes have high enough sulphide contents that the bisulphide ion is a significant contributor to the total alkalinity. The most extreme such samples are numbers 304/3 and 14 from the Muschelkalk of the Schafisheim borehole. The effects of bisuiphide on the interpretation of the carbonate chemistry from this formation is discussed in Section 5.1.2 below.
Calcite Equilibrium and Correction for CO2 Outgassing
Positive saturation indices for calcite were calculated using the raw analyzed data for many samples, suggesting that the waters were oversaturated with respect to calcite. Actual calcite oversaturation in groundwaters is quite uncommon because reactions between carbonate minerals and water occur rapidly relative to the residence time of groundwaters. Apparent oversaturation is more often caused by difficulties during sample collection, particularly the loss of CO2 gas (PEARSON AND OTHERS, 1978).
Because the data in this report are intended to represent the chemistry of the waters in situ, the analytical data have been modeled to correct for CO2 loss. CO2 loss before or during pH measurement would result in apparent calcite oversaturation and in calculated concentrations of dissolved CO2 lower than those analyzed. An initial calculation of mineral saturation indices was

NAGRA NTB 86-19 - 16 -
1.2.6
made with the lowest pH reported for the interval. If calcite oversaturation was calculated, the pH was adjusted by mathematically adding CO2 to bring the water to calcite saturation. The dissolved CO2 content of the sample was compared with the analyzed concentration of CO2 , Verification of the calculated CO2 against analyzed values supported the pH chosen. In addition, if an analyzed total dissolved carbonate concentration was reported, the calculated total CO2 was compared with this value for additional verification. Where the pH and alkalinity for a sample led to a significantly higher dissolved CO2 concentration than analyzed, the total carbonate content of the sample was fixed and the pH was adjusted for saturation with calcite. This approach usually resulted in a lower-than-measured alkalinity and an improvement in the consistency between calculated and measured dissolved CO2 ,
The pH of sample waters from the crystalline of Bottstein and Leuggern were generally high (> 8). Such high values are associated with very low dissolved CO2 concentrations and led to difficulties in reconciling the carbonate system of many of these waters. With these low concentrations, the reported value was close to or at the analytical detection limit, and often showed poor consistency with the modeled concentration.
Oxidation Potentials
Several oxidation potentials are reported for each of the intervals. They are given both as pE and Eh values which are related by the equation
where:
pE Cu Eh/T
Cu = Units conversion = 5040.07 KjV Eh= Oxidation potential in Volts (V)
T = Absolute temperature in Kelvin (K).
The values in this report are derived from measured platinum electrode potentials given by WITTWER (1986) and from calculations using analyzed concentrations of members of redox couples.
The platinum electrode potential of solutions has been related to a number of redox couples. SATO (1960) observed that the potential of oxygen-bearing solutions that might be found in weathering environments was related to their dissolved oxygen, 02(aq)' content. The measured potentials were far below those calculated using the theoretical 02(aq) -H20 couple, but seemed related to the 02-HzOz couple. Both couples are included in the calculations of this report as the 02(aq)/HZO and the 0Z(SATO)/HzO couples, respectively.
In many studies, beginning with that of BARNES AND BACK (1964), the platinum electrode potentials of groundwaters have been related to the Fe+z (aq) -Fe+3
(solid) couple. Waters in which this relationship is strongest are free of dissolved oxygen and of dissolved sulphides. Platinum electrode potentials have also been

NAGRA NTB 86-19 - 17 -
1.2.7
related to the sulphide couple HS- (aq) - SO (aq) in both the pore waters of sediments (BERNER, 1963) and in groundwaters (NORDSTROM AND PUIGDOMENECH, 1986). Because neither iron-bearing minerals nor SO (aq) species are included in the thermochemical data base used, no calculations for these two couples were made.
As discussed by STUMM AND MORGAN (1981, p. 492), the platinum electrode often yields a mixed potential resulting from competition between several redox couples. LINDBERG AND RUNNELS (1984) have amply demonstrated that such mixed potentials cannot be interpreted in terms of commonly postulated redox reactions.
If analyzed concentrations of both members of an oxidation-reduction couple are available, the pE value corresponding to that couple can be calculated. The reaction for the oxidation of species R to species 0 can be written:
R = 0 + nH+ + me ,
with equilibrium constant:
By definition, pE = -log 0e-' so the log KT expression can be rewritten:
pE = -log KT/m + (log 00 + n log 0H+ - log 0R)/m
pE values were calculated for this report for the As (V)/As (III), NZ(aq)/NH/, S04-z/HzS(aq)' COZ(aq)/CH4(aq) and H+/HZ(aq) couples as well as for the two 0Z(aq) couples.
A pE value is also given for uraninite (UOz) saturation. It is calculated as the pE at which the dissolved uranium concentration is in equilibrium with uraninite.
Sources of Uncertainty in Calculated Parameters
There are several sources of uncertainty in the calculated pH values, carbonate concentrations, saturation indices and pE values given in the tables below. One source of error is uncertainty in the raw analytical data. An uncertainty of five per cent in the analysis for a given element will contribute an uncertainty of 0.02 (= log 1.05) to the saturation indices of each mineral in which the element occurs. Thus, for such minerals as gypsum, anhydrite, and celestite, which are formed from elements which can be analyzed with some precision, the uncertainties in saturation indices due to analytical uncertainties should be less than 0.05.
As discussed by SCHMASSMANN AND OTHERS (1984, Section 4.3 and Table 9b), there is considerably more error associated with barium analyses than with the analyses for calcium or strontium. Thus, the uncertainty in the saturation indices for barite will be considerably larger than for the other alkaline-earth sulphate minerals. Inspection of the barite saturation indices given in this
NAGRA NTB 86-19 - 18 -
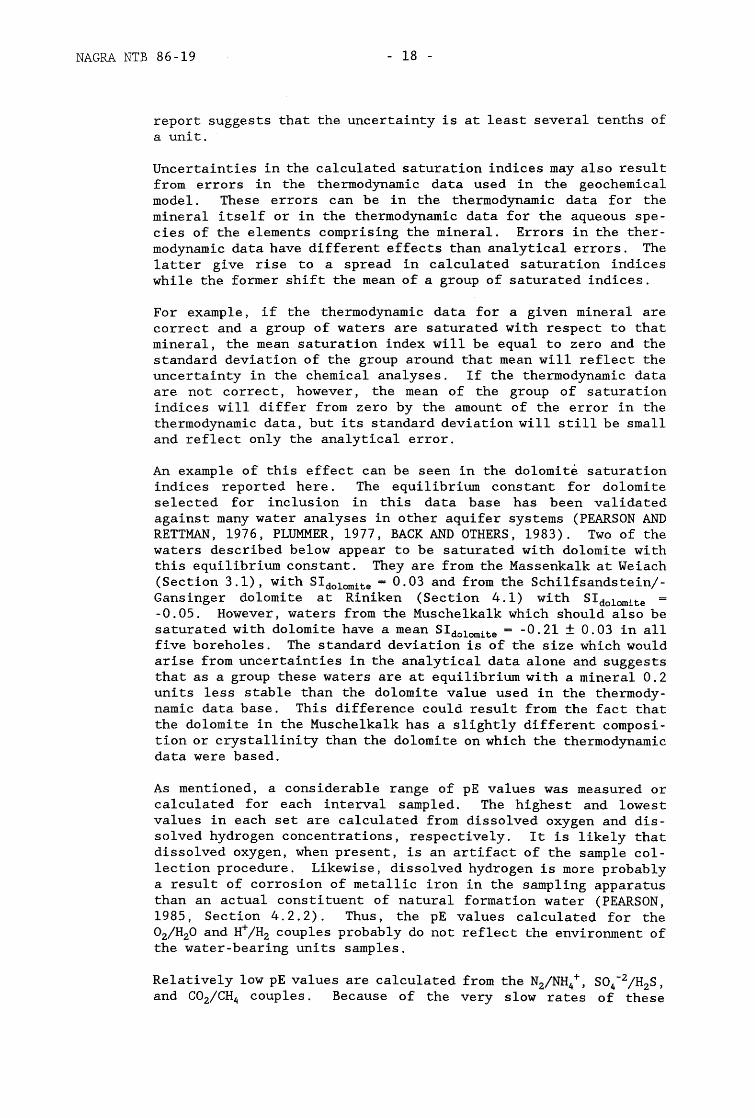
report suggests that the uncertainty is at least several tenths of a unit.
Uncertainties in the calculated saturation indices may also result from errors in the thermodynamic data used in the geochemical model. These errors can be in the thermodynamic data for the mineral itself or in the thermodynamic data for the aqueous species of the elements comprising the mineral. Errors in the thermodynamic data have different effects than analytical errors. The latter give rise to a spread in calculated saturation indices while the former shift the mean of a group of saturated indices.
For example, if the thermodynamic data for a given mineral are correct and a group of waters are saturated with respect to that mineral, the mean saturation index will be equal to zero and the standard deviation of the group around that mean will reflect the uncertainty in the chemical analyses. If the thermodynamic data are not correct, however, the mean of the group of saturation indices will differ from zero by the amount of the error in the thermodynamic data, but its standard deviation will still be small and reflect only the analytical error.
An example of this effect can be seen in the dolomite saturation indices reported here. The equilibrium constant for dolomite selected for inclusion in this data base has been validated against many water analyses in other aquifer systems (PEARSON AND RETTMAN, 1976, PLUMMER, 1977, BACK AND OTHERS, 1983). Two of the waters described below appear to be saturated with dolomite with this equilibrium constant. They are from the Massenkalk at Weiach (Section 3.1), with SIdolomite = 0.03 and from the Schilfsandstein/Gansinger dolomite at Riniken (Section 4.1) with SIdolomite = -0.05. However, waters from the Muschelkalk which should also be saturated with dolomite have a mean SIdolomite = -0.21 ± 0.03 in all five boreholes. The standard deviation is of the size which would arise from uncertainties in the analytical data alone and suggests that as a group these waters are at equilibrium with a mineral 0.2 units less stable than the dolomite value used in the thermodynamic data base. This difference could result from the fact that the dolomite in the Muschelkalk has a slightly different composition or crystallinity than the dolomite on which the thermodynamic data were based.
As mentioned, a considerable range of pE values was measured or calculated for each interval sampled. The highest and lowest values in each set are calculated from dissolved oxygen and dissolved hydrogen concentrations, respectively. It is likely that dissolved oxygen, when present, is an artifact of the sample collection procedure. Likewise, dissolved hydrogen is more probably a result of corrosion of metallic iron in the sampling apparatus than an actual constituent of natural formation water (PEARSON, 1985, Section 4.2.2). Thus, the pE values calculated for the 02/H20 and H+ /H2 couples probably do not reflect the environment of the water-bearing units samples.
Relatively low pE values are calculated from the N2/NH4+, S04-2/H2S, and CO2/CH4 couples. Because of the very slow rates of these

NAGRA NTB 86-19 - 19 -
redox reactions at the temperatures of the intervals sampled, the values calculated may also not be relevant to defining redox conditions in the interval.
More oxidizing pE values are calculated from the assumption that the measured uranium content is in equilibrium with the mineral uraninite. For some samples the uranium concentration reported is too low to represent uraninite saturation at any pE, and for these samples the process has been reversed. That is, a pE value consistent with the results of calculations on other species has been assumed. With this pE, the uranium concentration at equilibrium with uraninite has been calculated.
For many samples, particularly those from the later boreholes, analyses for both As (III) and As (V) were made, and pE values could be calculated from them. In some samples, As (V) was below detection ("n.n" in the data tables), and for these a concentration of less than the analytical detection limit was assumed « 0.005 mg/l, WITTWER, 1986, Beil. 3.l8a). As the data tables show, there is frequently good agreement (within a few tenths of a pE unit) between the pE values calculated for the arsenic couple and from uranium concentrations. The pE calculated from the platinum electrode potential is similar for many waters as well. When the arsenic and uranium pE values are consistent, their range can probably be taken to indicate the behaviour of other redox active species in the water as well.
1.3 Description of Contents of Data Tables
The data are given in Tables 2.1 through 7.1 arranged by borehole. Each sample is given in two columns to permit presentation of some data in alternate units. This section describes the contents of each line in these tables-of data.
The raw chemical data used are from WITTWER (1986, Beilage 3.18 (B6ttstein), 3.19 (Weiach), 3.20 (Riniken), 3.21 (Schafisheim), 3.22 (Kaisten) , and 3.23 (Leuggern». For brevity, these will referred to collectively as the WITTWER chemical tables.
The notation and other conventions followed in the tables are as follows:
the number of significant figures used in reporting the raw data are commensurate with the analytical precision or the number of figures given in the WITTWER chemical tables;
averaged values are rounded to the nearest significant digit. Fives are rounded to the nearest even number;
"n. n." in the mg/l column means that the constituent was sought but not found; and
a blank in the mg/l column means that no analysis was performed for that constituent.

NAGRA NTB 86-19 - 20 -
The contents of each line in the tables are as follows:
Lines 1-4: Sample identification data
These include the mean depth of the borehole interval from which the sample was taken, the designation of the formation yielding the sample, the Nagra identification number of the analysis or analyses from which the data were taken, and the date of collection of the sample(s). This information is from WITTWER (1986, Table 5.1 (Bottstein), 5.3 (Weiach), 5.7 (Riniken), 5.12 (Schafisheim), 5.14 (Kaisten) and 5.15 (Leuggern)), and from the WITTWER chemical tables.
Line 5: Measured pH
This contains the field or laboratory measured pH value as given in line 6 of the WITTWER chemical tables. If several samples are grouped, the lowest pH value was chosen for the reasons given in the discussion of dissolved carbonate species in Section 1.2.5.1.
Line 6: Platinum electrode potential, in volts
Measurements of the platinum electrode potential were made on a number of samples. Platinum electrode measurements on relatively small samples such as those collected in pressure vessels or bailers are not likely to be as useful as those made with flow-through cells on samples being taken by pumping or artesian flow. Thus, in this report only platinum electrode measurements made on flowing or pumped samples are considered. The measured values reported in line 8a of the WITTWER chemical data tables include the potentials of the AgCl reference electrode. These have been converted to the scale of the standard hydrogen electrode (SHE) using
mV (SHE) = mV (AgCl) + 224.6 - 0.72 • temperature
where the temperature is that at which the sample was collected as given in line 7. The potential relative to the standard hydrogen electrode is commonly referred to as the Eh, and is the value given in volts (V) in line 6 of the tables of this report and in millivolts (mV) in line 8b of the WITTWER chemical tables.
Line 7: Sample temperature in Celsius
Temperature of the sample as collected, from line 3 of the WITTWER chemical tables.
Line 8: Formation temperature in Celsius
Temperature of the water-bearing zone from which the sample was taken, as given by WITTWER (1986, Tables 6.1 (Bottstein) , 6.2 (Weiach), 6.3 (Riniken), 6.4 (Schafisheim), 6.5 (Kaisten) and 6.6 (Leuggern)). The temperatures are based on the sam-

NAGRA NTB 86-19 - 21 -
pIe depth and the measured or estimated geothermal gradient in the borehole.
Line 9: Density in grams per cubic centimetres
Sample density at 20°C as given in line 4 of the WITTWER data tables.
Line 10: Concentration units
The units for the concentration data in lines 11-48 are milligrams per litre (mg/l) and molality (mole per kilogram H20). The mg/l values represent the raw data and are from the WITTWER chemical tables. The molality values have been calculated as described in Section 1.2.1.
Lines 11-22: Concentrations of lithium through manganese
These concentrations are taken from the WITTWER chemical tables, lines 14-19, 21-24b, and 27. When more than one analysis is available, as indicated by the presence of several analysis numbers in line 3, average concentrations are given as described in Section 1.1 above. Details for each interval are given in the text describing the interval.
Lines 23-28: Concentration of iron through aluminum
These concentrations are taken from lines 28, 30, 31, 33, 35 and 48 of the WITTWER chemical tables. The values are given as less than «) the lowest concentration reported for the reasons given in Section 1.1.
Line 29: Uranium concentration
The WITTWER chemical tables give uranium concentrations analyzed by Fresenius (line 52) and by PSI (line 89). Uranium analyses made by AERE are used in discussing the isotope geochemistry of groundwaters from northern Switzerland (NTB 88-01, in preparation). The AERE and PSI values for the samples from each borehole are given in separate tables, 2.2 through 7.2, in this report. The text discusses the selection of the values included in the main data tables, 2. 1 through 7.1.
Lines 31-39: Concentration of fluoride through arsenite
These concentrations are taken from the WITTWER chemical tables, lines 36-40 and 44-45c. When more than one analysis is available, as indicated by the presence of more than one analysis number in line 3, average concentrations are given. The type of data available for the arsenic species varies from borehole to borehole, and is discussed in the text describing the individual samples.

NAGRA NTB 86-19 - 22 -
Line 40: Alkalinity as mg HC03-/l and millieguivalents per kg H2Q (meg/kg)
This value is calculated from the bicarbonate and carbonate concentrations given in lines 41 and 42, and is used in the geochemical calculations described in Section 1.2.5.1.
Lines 41 and 42: Concentrations of bicarbonate and carbonate
These concentrations are taken from the WITTWER chemical tables, lines 46 and 47. When more than one analysis is available, as indicated by the presence of more than one analysis number in line 3, average concentrations are given. Details of each interval listed are given in the text describing that interval.
Line 44: Total dissolved sulphide
The concentration given is that of the Fresenius analyses in line 51 of the WITTWER chemical tables. It is an analysis for total dissolved sulphide made on samples stabilized in the field. It is used in preference to the PSI result given in line 85 of the WITTWER chemical tables, which is a laboratory analysis of exsolved H2S gas.
Line 45: Silica as H2Si03
The WITTWER chemical tables report silica analyses on both 'unfiltered (line 50a) and filtered (line 50b) samples. The lowest values have been chosen except when they lead to calculated quartz undersaturation, which is probably not realistic. The silica concentrations of many samples are described in the text.
Line 46: Borate as B(OH31
These concentrations are from the WITTWER chemical tables, line 51, where the species is identified as H3B03 •
Lines 47 and 48: Total iron and dissolved organic carbon
These concentrations are from the WITTWER chemical tables, li.nes 12 and. 13. As discussed in Secti.on 1.1, iron and dissolved organic carbon may well be produced during the process of drilling and sampling. Thus, the results are reported as less than «) the analyzed quantity.
Line 50: Dissolved oxygen
This concentration is that of the Fresenlus analyses, line 52, of the WITTWER chemical data tables. It is a field analyses, and so is used in preference to the PSI result given in line 79, which is a laboratory measurement of exsolved 02 gas.

NAGRA NTB 86-19 - 23 -
Lines 51-54: Nitrogen through argon
These concentrations are those given in lines 80, 86, 82, and 84 of the WITTWER chemical tables and are results of PSI analyses for total dissolved gases. They are used in preference to Fresenius results given in lines 54, 60, 56, and 58. Fresenius distinguished between free and dissolved gases in some earlier samples and made no analyses at all for these gases in many later samples. Values for samples taken at the surface were used in preference to those taken with down-hole pressure samplers. H2 concentrations are given as less than «) the analyzed values because H2 is likely to have been produced during the sample collection procedure itself. The gas concentrations of some samples are discussed in the text describing the individual intervals. The concentrations of these gases are given in the WITTWER chemical tables in units of milligrams per kilogram solution (mg/kg).
Line 55: Dissolved carbon dioxide
This concentration is that of the Fresenius analyses given in line 55 of the WITTWER chemical tables. It is a field analyses and so is used in preference to the PSI result, which is a laboratory analyses of exsolved CO2 gas. Dissolved CO2 is discussed in Section 1.2.5.1, which describes the carbonate chemistry of the waters and in the text describing the samples from individual intervals.
Lines 58-61: Total dissolved solids
Line 59 gives the sum of the analyzed dissolved constituents calculated as described in Section 1.2.2. Lines 60 and 61 give the analyzed residues on evaporation at 110aC and l80 aC as shown in lines 11 and lIb of the WITTWER chemical tables. The percentages by which the analyzed values differ from the calculated sum are given the second column of lines 60 and 61.
Line 63: Charge balances
The balances of the charges of the dissolved ionic species analyzed are given in this line. They are calculated as discussed in Section 1.2.3.
Lines 65-71: Comparison of total dissolved carbonate concentrations from various sources
Two measured values are available. Line 67 gives the sum of the Fresenius analysis of HC03- (line 41), C03- 2 (line 42), and CO2(aq) (line 55). The other, which is given in line 68, is a direct measurement made by PSI and is given in the WITTWER chemical tables line 88. Total dissolved carbonate values are also calculated using the geochemical model as described in Section 1.2.5. The value in line 70 is calculated with the alkalinity from line 40 and the measured pH from line 5. The value given in line 71 is the modeled value
NAGRA NTB 86-19 - 24 -
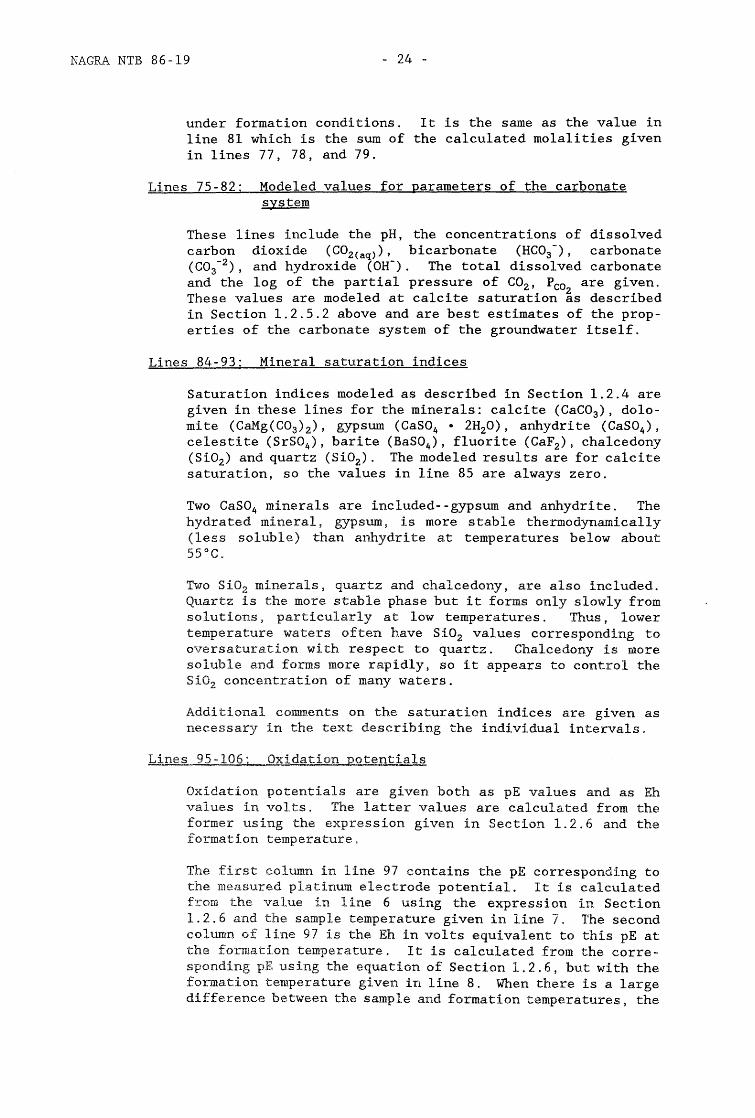
under formation conditions. It is the same as the value in line 81 which is the sum of the calculated molalities given in lines 77, 78, and 79.
Lines 75-82: Modeled values for parameters of the carbonate system
These lines include the pH, the concentrations of dissolved carbon dioxide (C02 (aq»), bicarbonate (HC03 -) , carbonate (C03- 2 ), and hydroxide (OH-). The total dissolved carbonate and the log of the partial pressure of CO2 , Pea are given. These values are modeled at calcite saturation ~s described in Section 1.2.5.2 above and are best estimates of the properties of the carbonate system of the groundwater itself.
Lines 84-93: Mineral saturation indices
Saturation indices modeled as described in Section 1.2.4 are given in these lines for the minerals: calcite (CaC03), dolomite (CaMg(C03 )2), gypsum (CaS04 • 2H20) , anhydrite (CaS04 ),
celestite (SrS04), barite (BaS04 ), fluorite (CaF2), chalcedony (Si02 ) and quartz (Si02). The modeled results are for calcite saturation, so the values in line 85 are always zero.
Two CaS04 minerals are included--gypsum and anhydrite. The hydrated mineral, gypsum, is more sta,ble thermodynamically (less soluble) than anhydrite at temperatures below about 55°C.
Two Si02 minerals, quartz and chalcedony, are also included. Quartz is the more stable phase but it forms only slowly from solutions 1 particularly at low' temperatures. Thus, lower temperature waters often have Si02 values corresponding to oversaturation with respect to quartz. Chalcedony is more soluble and forms more rapidly, so it appears to control the Si02 concen'tration of many waters.
Additional comnents on the saturation indices are given as necessary in the text describing the individual intervals.
Lines 95-106: Oxidation potentials
Oxidation potentials are given both as pE values and as Eh valu.es in volts. The latter values are calculated from the former using the expression given in Section 1.2.6 and the formation temperature.
The first column in line 97 contains the pE correspon.ding to the m~,:Hlsured pla.ti.num electrode potenti.al. It is calculated from the value in line 6 using the expression in Section 1.2.6 and the sample temperature given in line 7. The second c.olumn of line 97 is the Eh in volts equivalent to this pE at the formati.on temperature. It is calculated from the corresponding pE using the equat,ion of Section 1.2.6, but with the formation temperature given in line 8. When there is a large difference between the sample and formation temperatures, the

NAGRA NTB 86-19 - 25 -
Eh value of line 97, which refers to formation conditions, may differ from the value given in line 6, which refers to sample conditions.
The values in line 99 are calculated assuming that the measured uranium content of the sample represents equilibrium with respect to the mineral uraninite (U02 ). In some samples the uranium concentration reported was too low for uraninite saturation at any oxidation potential. These samples are discussed in the text.
The oxidation potentials in line 100 through 106 are calculated from the measured concentrations of their oxidized and reduced forms as described above and in the Appendix.

NAGRA NTB 86-19 - 26 -
2.0 BOTTSTEIN
A complete report on the investigations of the Bottstein borehole has been given by NAGRA (1985), and the results of the hydrochemical studies have been described in more detail by PEARSON (1985). In order that the present report includes discussions of the chemistry of groundwaters from all the boreholes completed through 1985, the B5ttstein water chemistry is discussed in this chapter in the same format used to describe waters from the other boreholes.
There are slight differences between the values of certain parameters given in the earlier report and in this chapter. Most differences are due to changes in the thermodynamic data bases which were used for the calculations reported. The thermodynamic data which were used in preparing this report are discussed in the Appendix.
Differences in the following parameters may be particularly noticeable:
Carbonate system data: Slight changes in the thermodynamic data for the carbonate system have been made to 'include the most recent experimental work. This has led to calculated values for pH, alkalinity, total dissolved carbonate and similar parameters in this report which may differ from those given by PEARSON (1985).
Iron concentrations: Samples from the crystalline rock described in the earlier report were assigned an iron concentration of 0.02 mg/l for reasons which were discussed in Sections 4.2.2.2 of that report. In this chapter analyzed iron concentrations are given, as discussed in the Introduction.
Silica concentrations: The silica concentrations given in the earlier report for waters from the crystalline were calculated at equilibrium with chalcedony. The silica concentrations in this report are analyzed values.
Temperatures: The formation temperatures given by PEARSON (1985) were estimated as described in Section 4.2.3 of that report. The formation temperatures used here are from WITTWER (1986, Section 6), which were based on a more complete set of borehole temperature data.
Buntsandstein samples: The samples from the intervals centred on 316.6 and 312.5 m were not interpreted in the earlier report.

NAGRA NTB 86-19 - 27 -
2.1 Upper Musche1kalk 162.9 m (123.2 - 202.5 m) l-Nov-82 Sample 301/2 Block 1 Reference: WITTWER (1986) Sect. 5.1.1: PEARSON (1985) Sect. 5.1
This zone was drilled with fresh-water mud with no tracer. The sample was taken at the end of a three-day pumping test during which about 1300 m3 of fluid was removed from the interval. Because the zone had been so heavily pumped before sampling, and the tritium content of the sample itself was less than one TV, this sample is assigned to Block 1.
The chemistry of the water in the B6ttstein Muschelkalk is given in Table 2.1. The concentrations of dissolved solid constituents, 0Z(aq)' COZ(aq) and total HzS are those measured by Fresenius. The other gas concentrations were measured by PSI. As Table 2.2 shows, the uranium values reported by PSI and AERE are virtually identical.
Table 2.2:
S~le Depth
162.9 m
316.6 m
312.5 m
399.5 m
621.3 m
618.4 m
792.4 m
Uranium concentrations and pE values at uraninite saturation for waters from the Bottstein borehole.
S~le Nlililer
301/2
301/5 301/6
301/25b
301/8c
301/12b
301/16
301/18
Uranium Concentration in micrograms per litre pE Calcu
lated at PSI AERE At CaLcu- Uraninite
Analysis Analysis lated pE Saturation
0.55 0.57 ± 0.01 0.57 -0.08
0.90 1.54 ± 0.04 1.5 -0.99 1.00 1.48 ± 0.04
0.20 0.16 ± 0.008 0.16 -1.84
1.00 1.10 ± 0.02 1.1 -1.72 1.10
0.40 0.42 ± 0.01 0.42 -1.90 0.50
0.21 0.14 ± 0.008 0.14 -2.24 0.25
0.19 0.05 ± 0.005 0.19 -2.42 0.096 * -3.50 0.096 * -5.00
* Calculated assuming uraninite saturation at pE shown.
The modeled values for the carbonate system are based on the measured alkalinity and a pH adjusted for calcite saturation. SIdol~ite for this water is -0.23. As discussed in Section 1.2.7, this probably does not indicate undersaturation of this water with dolomite, but rather that the equilibrium constant for dolomite in the thermochemical data base used for these calculations is about

NAGRA NTB 86-19 - 28 -
2.2
2.2.1
0.2 units more stable than the specific dolomite present in the Muschelkalk.
The water also appears to be saturated with respect to gypsum, the GaS04 solid stable at the temperature of this water, as well as with celestite and fluorite. The water seems to be oversaturated with respect to barite, chalcedony and quartz. Quartz oversaturation in water as cool as this is common. The oversaturation with barite and chalcedony, however, is probably a result of erroneously high analyzed values for barium and silica, respectively. The silica analysis on this sample was not made on a filtered sample.
pE values calculated from several redox couples, the platinum electrode potential, and uraninite saturation are available. The nitrogen and carbon couples agree within one unit, but because they react so sluggishly, they are unlikely to influence the redox state of any other dissolved species. Hydrogen is probably produced in the borehole itself by corrosion of iron. Thus, the hydrogen couple gives a strongly negative pE value. Arsenate (As V) was not detected in this sample, but an upper limiting pE can be calculated for the arsenic couple by assuming an arsenate concentration equal to the analytical detection limit, 0.005 mg/l. This value is within a .15 units of that calculated assuming uraninite saturation at the measured uranium concentration. The value calculated from the measured platinum electrode potential is several units more positive.
BuntsandsteinlWeathered Crystalline
316.6 m (305.6 - 327.6 m) 14-16-Nov-82 Samples 301/5.6 Block 2 Reference: WITTWER (1986) Sect. 5.1.5
This zone was drilled during 9- and 10-Nov-82 using mud with a salt (NaGl) content of about 200 grams per litre. Hydraulic tests were carried out on 11- and l2-Nov and about 900 litres were bailed from the interval on l3-Nov in an attempt to clean it. On l4-Nov, DST apparatus with a sample chamber was installed. The interval flowed until 16 -Nov yielding 40 to 50 m3 of mixed drilling fluid and groundwater. Sample 301/5 was collected from this flow on l6-Nov-82. Sample 301/6 was taken from the sample chamber of the DST tool when it was removed from the borehole.
The tritium content of sample 301/5 is less than one TU, and shows that the samples contain less than one per cent drilling fluid. Thus, they should yield reliable isotope analyses. However, because the drilling fluid contained about 200 g NaGl/l, one per cent contamination would add about 790 mg Na+/l and about 1210 mg Gl-/l. These are larger than the actual measured Na+ and Gl- contents of samples 301/5 and 6 (see Table 2.1), so that the actual contamination must have been considerably less than one per cent. However, the chemistry of these samples must be interpreted with caution.
NAGRA NTB 86-19 - 29 -
2.2.2
The chemistry of water in this zone is shown in Table 2.1. The concentrations of dissolved solid constituents, 0Z(aq)' COZ(aq) and total HzS are from the Fresenius analyses of samples 301/5 and 301/6. The other dissolved gas concentrations are from the PSI analyses of the flowing sample, 301/5. The uranium concentrations are shown in Table 2.2. The value used in Table 2.1 is the rounded mean of the AERE results.
The modeled values for the carbonate system are based on the measured alkalinity and a pH corresponding to calcite saturation. The water appears undersaturated with respect to dolomite and all sulphate minerals except barite. The apparent oversaturation of both barite and fluorite in this water may indicate analytical errors. The barium concentrations reported for the two samples from this interval differ by a factor of nearly two, for example. The lower of the reported silica concentrations was chosen for inclusion in Table 2.1. It corresponds to saturation with respect to chalcedony.
The pE values calculated from the nitrogen, sulphur, and carbon couples agree within one pE unit, but because these couples react so slowly, they probably have little influence on other redox reactions. The hydrogen couple leads to an even more negative pE, probably due to the presence of excess hydrogen from iron corrosion. The pE values calculated for uraninite saturation and the measured platinum electrode potential also agree within one pE unit, but are about three units more positive than those of the nitrogen, sulphur, and carbon couples. Other pE-sensitive metals in this water probably respond to pE values in the range of those measured and calculated from uraninite saturation.
This borehole was cased to a depth of about 340 m, isolating the BuntsandsteinfWeathered Crystalline contact before drilling the remainder of the borehole.
312.5 m (305.2 - 319.8 m) 20-Jan-84 Sample 301/25b Block 2 Reference: WITTWER (1986) Sect. 5.1.14
In an attempt to collect a sample of water more representative of the BuntsandsteinfWeathered Crystalline than the one discussed in the preceding section, the cased borehole was perforated from 307 to 313 m and from 315 to 319 m on l3-Jan-84. The perforated zone was isolated with double packers and cleaned by swabbing and pumping from 14- to 20-Jan. When sample 30l/25b was taken, about 30 m3 of fluid had been extracted, and the conductivity had been steady within three per cent for two days. The tritium content of the sample was 0.2 ± 0.2 TU, suggesting minimal contamination with drilling fluid. As pointed out by WITTWER (1986), a low tritium content does not preclude some contamination with water from underlying water-bearing zones in the crystalline either during drilling or within the perforated section during cleaning prior to sampling. The chemistry of the water does differentiate it from crystalline water, however.

NAGRA NTB 86-19 - 30 -
2.3
2.3.1
The composition of the sample is given in Table 2.1. The dissolved solid constituents are from the Fresenius analysis, as are the 02(aq)' CO2 (aq) and total H2S concentrations. The concentrations of the other gases are from the PSI analyses. As Table 2.2 shows, the PSI and AERE uranium concentrations are closely similar.
This sample is meant to be from the same interval as the previous sample. As Table 2.1 shows, however, the 312.5 m sample is of lower overall salinity than that from 316.6 m, and the concentration of some constituents including potassium, calcium, barium and uranium differ by factors of two or more between the two sets of analysis.
The modeled values for the carbonate system are based on the measured alkalinity and a pH calculated at calcite saturation. The mineral saturation states of this sample are closely similar to those of the previous sample in spite of the differences in their compositions. The lower calcium content of this sample makes it appear to be less oversaturated with respect to fluorite, while the lower barium content leads to a calculation of barite saturation.
The pE values calculated from the platinum electrode potential, uraninite saturation, and the arsenic couple agree within 0.5 units. They are lower than either the uranium or platinum electrode values for the 316.6 m sample, however. The uranium concentrations in the two samples differ by a factor of about ten, which leads to the approximately one unit difference in the pE values calculated from them. As is their usual pattern, the pE values calculated from the gas couples are considerably more negative and are unlikely to represent formation conditions.
Crystalline
Crystalline 399.5 m (393.9 - 405.1 m) 14. 15-Dec-82 Samn1es 301/8c.9 Block 1 Reference: WITTWER (1986) Sect. 5.1.5; PEARSON (1985) Sect. 6.1
This interval flowed at 1.3 l/min. Water sample 301/8c was collected from this flow at the surface. The tracer concentration of the sample water corresponded to a drill fluid content of less than one per cent, consistent with a tritium concentration below 1.0 TU. Sample 301/9 was collected after sample 301/8 from a depth of about 90 m using the GTC pressure sampling apparatus.
The chemistry of water from this interval is given in Table 2.1. The concentrations of dissolved solids CO2 (aq)' 02(aq)' and total H2S are based on Fresenius analyses of samples 30l/8c and 9. The 02(aq)
chosen was the lowest value reported. The concentrations of the other gases are PSI results on the surface sample. The uranium concentrations reported by PSI and AERE agree, as shown in Table 2.2. The AERE value was used in Table 2.1.
The modeled values for the carbonate system are based on the measured alkalinity and a pH adjusted for calcite saturation. The

NAGRA NTB 86-19 - 31 -
2.3.2
water is strongly undersaturated with respect to dolomite and all sulphate minerals except barite. The barite oversaturation is probably due to an erroneously high barium concentration. This water is also at equilibrium with fluorite and chalcedony.
pE values were calculated for all gas couples, the arsenic couple, and the platinum electrode as shown in Table 2.1. As with other samples, values from the nitrogen, sulphur, and carbon couples agree within better than one unit, but probably do not influence the behaviour of other redox couples in the water. The value for the hydrogen couple is even more negative, probably due to excess hydrogen produced by corrosion of iron.
There is wide scatter among the other pE values. Even though the lowest reported 0Z(aq) concentration was used, the pE values calculated from it are more positive than any other for this sample. The platinum electrode value is the next highest, perhaps an effect of the dissolved oxygen present. The arsenite concentration in this sample is below detection, so only a limiting value for the arsenic couple could be calculated. It is strongly negative. The value corresponding to uraninite saturation is consistent with values generated from several couples in virtually chemically identical water from deeper intervals in this borehole.
Crystalline 621.3 m (618.5 - 624.1 m) 22-Jan-83 Samples 301/12b.13 Block 1 Reference: WITTWER (1986) Sect. 5.1.7: PEARSON (1985) Sect. 6.2
This interval flowed at more than five l/min from a thick zone of pegmatite and aplite with open fractures near 624 m. Sample 30l/l2b was collected at the surface from this discharge on 22-Jan-83. Sample 301/13 was then collected using the GTe pressure sampling tool from a depth of 610 m.
Even though the interval had been swabbed and allowed to flow freely until nearly 18 m3 of fluid had discharged, the tracer concentrations of both the surface and pressure samples indicated that they still contained as much as three per cent drilling fluid (NAGRA, 1985, Beilage 8.10). However, the tritium concentration of the isotope sample taken during the same sampling period was only 1.0 ± 0.7 TU. The tritium content of the de-ionized water used for drilling fluid was about 110 TU (PEARSON, 1985, Table 7.5), so the samples are not likely to have contained more than 1 to 1.5 per cent de- ionized water. The interval at 399 m was probably contributing to the fluid in the borehole while drilling proceeded. The difference between the amount of contamination indicated by the tracer and the tritium concentrations could be due to the presence of 1.5 to 2 per cent of water from the 399 m zone in the sample.
The accuracy to be expected in water analyses is probably not less than one or two per cent. This is the same level of error that could have been introduced by the presence of drilling fluid in the sample. Thus, attempting to correct the reported analyses for their drilling fluid content is not justified.

NAGRA NTB 86-19 - 32 -
2.3.3
The chemistry of the waters collected from the 621 m interval of the crystalline at B6ttstein is given in Table 2.1. The concentrations of dissolved solids are based on the analyses of the surface (30l/l2b) and pressure vessel (301/13) samples. The 02(aq)'
CO2 (aq) and total H2S concentrations are field measured values by Fresenius. Concentrations of the other dissolved gases are PSI analyses of the surface sample. As Table 2.2 shows, the uranium concentrations reported by PSI and AERE are in good agreement. The AERE value was used in Table 2.1.
The modeled values for the carbonate system are based on the measured alkalinity and a pH adjusted for calcite saturation. The pattern of saturation with respect to other minerals in this water is virtually identical with that of the 399.5 m water discussed in the previous section.
pE values calculated from three gas couples, uraninite saturation, the platinum electrode potential, and a limiting value for the arsenic couple, are available. As with the other samples, the nitrogen and sulphur couples agree well but are strongly negative while the hydrogen couple is even more negative. The upper limiting value from the arsenic couple is within 0.4 units of that calculated for uraninite saturation. As Table 2.1 shows, the range of these pE values is similar to that in other crystalline waters from this borehole. The pE value from the platinum electrode measurement is more positive.
Crystalline 618.4 m (608.0 - 628.8 m) 9-Aug-83 Samples 301/16.17 Block 1 Reference: WITTWER (1986) Sect. 5.1.9: PEARSON (1985) Sect. 6.3
This interval was sampled on 9-Aug-83 during the test phase of the borehole programme, some 200 days after the interval was first drilled. Straddle packers were set to isolate the same waterbearing zone that was sampled on 22-Jan-83 and described in Section 2.3.2.
Sample 301/16 was collected at the surface from the discharge of a submersible pump. Following pumping, sample 301/17 was taken at a depth of about 600 m using the GTC pressure sampling apparatus.
After the packers were installed, about 40 m3 of water was allowed to flow from the interval before setting the pump. At the time of pump installation, the tracer concentration indicated that the discharge water contained less than 0.2 per cent borehole fluid. Some fluctuation in tracer concentration was observed during pumping, but the final values indicated a borehole fluid content of about 0.3 per cent in the sample. Tritium levels for the discharge were reported at 1.0 ± 0.7 TU.
This behaviour is interpreted as the result of fluid in the annular space bypassing the upper packer through the surrounding rock and entering the test interval. Because of the discharge into the annular space from the open 399 m zone, this sample

NAGRA NTB 86-19 - 33 -
2.3.4
probably is more representative of water from the 399 m zone than of water from the 621 m horizon. The 14C content of this and the other samples from the Bottstein crystalline section support this hypothesis, as described by PEARSON, (1985, Section 6.6).
The chemistry of the waters from this interval is given in Table 2.1. Dissolved solid concentrations are based on values reported by Fresenius for the pumped and the pressure samples. The concentrations of CO2 (aq) and total H2S was taken from the field analysis of Fresenius, while the 02(aq) represents the lowest value reported by PSI. The remaining gas concentrations are PSI data from the surface sample. The uranium results are given in Table 2.2. The AERE value is lower than the PSI results, but was chosen.
Modeled values for the carbonate system were based on the measured alkalinity and a pH adjusted for calcite saturation. Like all the other samples from the crystalline in this borehole, this water is undersaturated with respect to dolomite and all sulphate minerals except barite. It appears to saturated with respect to barite and chalcedony, and saturated, or slightly undersaturated, with respect to fluorite.
pE values could be calculated for all gas couples except sulphur, and for the arsenic couple, uraninite saturation and the platinum electrode potential. The nitrogen and carbon couples agree well, but as with all other samples, they are strongly negative. The hydrogen couple is even more negative. Values calculated from the platinum electrode potential, uraninite saturation, and the arsenic couple agree within 0.8 units and are within the range established by uraninite saturation and the arsenic couple for the other samples from the crystalline.
Crystalline 792.4 m (782.0 - 802.8 m) 16-Aug-83 Sample 301/18 Block 1 Reference: WITTWER (1986) Sect. 5.1.10: PEARSON (1985) Sect. 6.4
This interval was sampled from 14- through 16-Aug-83 during the test phase of the borehole programme, more than 200 days after the interval was drilled.
Sample 301/18 was collected at the surface while the interval was being pumped at 20 l/min with a submersible pump. Prior to the start of pumping, artesian discharge from the borehole annulus was measured at approximately 16.6 l/min. During pumping, with the water level in the observation standpipe at 180 m, this discharge was observed to decrease to 11.2 l/min. Therefore, it was concluded that leakage was occurring into the packered interval from the open borehole as a result of pumping; no attempt was made to sample the packered interval using the GTC pressure sampling apparatus.
The tracer concentration in this sample water corresponded to a drilling fluid contamination level of about one per cent, which agreed with the tritium content of 0.9 ± 0.9 TU.

NAGRA NTB 86-19 - 34 -
An explanation can be given for this tracer and tritium behaviour and for the fact that the observed water chemistry so closely resembles that from zones higher in the borehole. The long period of artesian discharge from the 619 m zone prior to pumping could have resulted in groundwater entering the 792 m interval from the upper zone. The observed tracer concentrations would result from borehole annulus fluid mixing with water from the test interval during pumping. This hypothesis is examined in detail in Sections 6.4.1 and 6.6 of PEARSON (1985).
Table 2.1 summarizes the chemistry of the waters from this interval. The concentrations of the dissolved solids, CO2 (aq) and total H2S were taken from the Fresenius analyses of the pumped water sample (301/18) . The 02(aq) concentration is from PSI and represents the lowest of the reported values. The remaining dissolved gas concentrations are also taken from the PSI analyses.
Modeled values for the carbonate system are based on the measured alkalinity and a pH corresponding to calcite saturation. This water, like that from the other crystalline intervals in this borehole, is undersaturated with respect to dolomite and all sulphate minerals except barite. This water appears to be saturated with respect to barite and chalcedony, but undersaturated with respect to fluorite. '
pE values calculated for this interval are similar to those from other crystalline waters. Values for the nitrogen and sulphur couples are somewhat negative, and because they react only sluggishly, are unlikely to influence other redox reactions in the system. The even more negative value calculated for the hydrogen couple probably results from excess hydrogen produced by iron corrosion. The analyzed trace of dissolved oxygen leads to positive pE values. This oxygen is likely to have been an artifact of sample collection or analysis, so the pE values corresponding to it are not likely to reflect those of the formation.
The results of uranium analysis are shown in Table 2.2. The AERE value is considerably below that reported by PSI and below values measured for any water in this borehole. It is also below that corresponding to uraninite saturation at any pE. As Table 2.2 shows, the minimum uranium content at uraninite saturation in this water would be less than 0.1 ~g/l. Therefore, the PSI value has been taken to represent the uranium content of water from this interval. The pE corresponding to uraninite saturation at this uranium concentration is virtually identical to that calculated from the platinum electrode potential. These values are similar to the low end of the range of values calculated from uraninite saturation and the arsenic couple in other waters from the crystalline in this borehole.

NAGRA NTB 86-19 - 35 -
2.3.5 Crystalline 1326.2 m (1321.0 - 1331.4 m) 30-Sep to 10-0ct-83 Samples 301/19.20.21.22 Block 2 Reference: WITTWER (1986) Sect. 5.1.11i PEARSON (1985) Sect. 7.
The Bottstein borehole below about 800 metres yields little water and therefore can only be sampled with difficulty. To provide at least an estimate of the chemistry of the water in the deep crystalline environment, straddle packers were used to isolate the zone from 1321 to 1331 m depth. Even though this is the zone with the highest hydraulic conductivity below 800 m (see NAGRA, 1985, Figure 1.1), it yields only a few millilitres of water per minute. This low flow rate was not sufficient to flush or completely displace the fluid in the borehole between the packers and in the tubing during the time available for sampling.
The interval was packed off on 3l-Aug-83 and samples were taken from within the tubing beginning on 19-5ept-83. Samples through 28-Sept were collected from several depths using a bailer and were analyzed for tracer, conductivity, pH and alkalinity. On 3~-Sept and on 7 and on 10-Oct, samples were collected for complete chemical analysis by Fresenius, for analyses by PSI and for isotope analysis. These samples were taken using the Preussag sampler at depths between 1,300 and 1,313 m in the tubing.
The chemistry of the waters from this interval, corrected for borehole fluid contamination, is given in Table 2.3. These values are taken from Table 7.4 of PEARSON (1985). The details of the method of correction of the original analyses for large drilling fluid contents are discussed in Section 7 of that report. The COZ(aq) and total COz content of the water were calculated using a pH adjusted for calcite saturation, and the laboratory alkalinity value. These data differ slightly from those originally reported by PEARSON (1985).

NAGRA NTB 86-19
Table 2.3:
- 36 -
Chemistry of water from 1326 m zone of Bottstein borehole.
Sample Depth Formation Analysis No. Date Measured pH Saq:>le Ter!l>. (C) Formation Ter!l>. (C) Density (g/ml)
Sodium (Na+) Potassium (K+) Anmonium (NH4+) Magnesium (Mg+2) Calcium (Ca+2) Strontium (Sr+2) Manganese (Mn+2) Uranium
Fluoride (F-) Chloride (Cl-) Sulphate (S04-2) Phosphate (P) Alkalinity as HC03-
Dissolved Solids: Sum
Charge Balance:
MODELED VALUES: Carbonate System
pH C02(aq)
1326 m KRI
301/19-22 Corrected 30-Sep. 10-0ct-83
7.00 20 60
1.00B mg/l 4037
45 0.2 2.6 870
21 3.1
6.0E-05
molality 1. 765E-01 1.157E-03 1.115E-05 1.075E-04 2.182E-02 2.409E-04 5.672E-05 2.534E-10
3.6 1.905E-04 6621 1.B77E-01
1560 1.632E-02 0.06 1.947E-06 95.0 1.565E-03
mg/kg difference 13210
-0.00%
6.67
Bicarbonate (HC03-) Carbonate (C03-2) Hydroxide (OH-)
17.1 3.912E-04 93.2 1.536E-03
O.B 1.370E-05 0.0 8.351E-07
1.941E-03 -1.60
Total Dissolved C02 log P(C02)
Saturation Indices: Calcite 0.00 Dolomite -2.12 Gypsum -0.25 Anhydrite -0.21 Celestite -0.16 Fluorite -0.01
Oxidation State Calculated from: U02 Satn. -1.06 -0.07

1 Sample Depth 162.9 m 316.6 m 312.5 m 399.5 621.3 m 618.4 m 792.4 m ~ 2 Formation mo s-KRI s-KRI KRI KRI KRI KRI
3 Analysis No. 301/2 301/5,6 301/25b 301/8c,9 301/12b,13 301/16,17 301/18 G) 4 Date 1-Nov-82 16-Nov-82 20-Jan-84 14,15-Dec-82 22-Jan-83 9-Aug-83 16-Aug-83 f:; 5 Measured pH 6.88 8.26 8.65 8.14 8.00 7.94 8.25 6 Pt Elect. Pot. (v) 0.16 -0.01 -0.13 0.00 -0.01 -0.09 -0.15 Z 7 Sample Temp. (DC) 19.7 12.5 19.4 11 .1 15.4 31 31.3 H 8 Formation Temp. (DC) 21 27 27 29.5 38 38 43 to 9 Density (g/ml) 1.0037 1.0001 0.9997 0.9992 0.9992 0.9993 0.9993 00
10 mg/l molality mg/l molality mg/l molal ity mg/l molal ity mg/l molality mg/l molality mg/l molality 0'\ I 11 lithiun (li+) 2.9 4.188E-04 1.5 2.165E-04 1.6 2.310E-04 2.02 2.916E-04 2.5 3.609E-04 1.4S 2.093E-04 1.3S 1.949E-04 I--' 12 SodillTl (Na+) 1100 4.797E-02 746.4 3.2S3E-02 662 2.886E-02 3S6.2 1.SS2E-02 364.0 1.S86E-02 377.6 1.64SE-02 39S.4 1.723E-02 \0
13 Potassiun (K+) 83.4 2. 138E-03 9.6 2.460E-04 16.9 4.331E-04 8.S 2.178E-04 10.8 2.767E-04 9.8 2.S11E-04 8.3 2.127E-04 14 Rubidiun (Rb+) 1.2 1.408E-05 0.06 7.034E-07 0.14 1.642E-06 0.07 8.20SE-07 0.09S 1.114E-06 0.04 4.689E-07 0.03 3.S17E-07 15 Cesium (Cs+) 0.96 7.241E-06 0.05 3.770E-07 0.07 S.278E-07 0.06 4.S23E-07 0.07 S.2nE-07 0.02 1.S08E-07 0.02 1.S08E-07 16 Ammoniun (NH4+) 1.2 6.669E-OS 0.1S 8.332E-06 0.2S 1.389E-OS 0.37 2.0SSE-OS 0.17 9.442E-06 0.23 1.277E-OS 0.19 1.0SSE-OS 17 Magnesium (Mg+2) 198.8 8.197E-03 4.1 1.690E-04 2.3 9.481E-OS 0.3 1.236E-OS 0.3 1.236E-OS 0.2 8.241E-06 0.2 8.241E-06 18 Calciun (Ca+2) 611.7 1.S30E-02 38.0 9.S00E-04 20.1 5.026E-04 9.6 2.400E-04 11.8 2.9S0E-04 11.8 2.949E-04 8.5 2.125E-04 19 Strontium (Sr+2) 11 1.259E-04 0.90 1.029E-05 0.97 1.109E-05 0.40 4.S74E-06 0.57 6.S18E-06 0.34 3.887E-06 0.09 1.029E-06 20 Bariun (Ba+2) 0.015 1.095E-07 0.048 3.502E-07 0.025 1.824E-07 0.04 2.918E-07 0.04S 3.283E-07 0.025 1.824E-07 0.03 2.188E-07 21 Radiun (Ra+2) 6.0E-09 2.661E-14 9.0E-10 3.990E-15 7.0E-10 3.104E-15 3.0E-10 1.330E-15 7.0E-1O 3.103E-15 4.0E-10 1.773E-15 3.0E-10 1.330E-15 22 Manganese (Mn+2) 0.034 6.204E-07 0.20 3.648E-06 0.10 1.824E-06 0.12 2.188E-06 0.10 1.824E-06 0.14 2.553E-06 0.14 2.553E-06 23 Iron (Fe+2) < 1.3 2.334E-OS < 2.3 4.127E-05 < 0.31 5.563E-06 < 1.2 2.153E-05 < 1.16 2.081E-05 < 1.00 1.794E-05 < 0.81 1.4S3E-OS 24 Nickel (Ni+2) < 0.003 5.123E-08 n.n. n.n. < 0.008 1.365E-07 n.n. n.n. n.n. 25 Copper (Cu+2) n.n. n.n. n.n. < 0.002 3.153E-08 n.n. n.n. n.n. 26 Zinc (Zn+2) < 0.005 7.668E-08 < 0.110 1. 686E-06 n.n. < 0.095 3.065E-08 < 0.021 3.219E-07 < 0.15 2.299E-06 < 1.1 1.686E-05 27 Lead (Pb+2) n.n. n.n. < 0.002 9.674E-09 < 0.008 3.868E-08 n.n. < 0.001 4.835E-09 < 0.003 1.451E-08 28 Aluninun (Al+3) < 0.017 6.316E-07 < 0.16 5.942E-06 < 0.008 2.971E-07 < 0.006 2.228E-07 n.n. < 0.009 3.342E-07 n.n. 29 Uraniun 5.7E-04 2.401E-09 1.5E-03 6.356E-09 1.6E-04 6.736E-10 1.1E-03 4.630E-09 4.2E-04 1. 768E-09 1.4E-04 5.892E-10 1.9E-04 7.997E-10 30 31 Fluoride (F-) 2.6 1.372E-04 12.4 6.540E-04 12.1 6.383E-04 12.4 6.539E-04 12.4 6.539E-04 12.0 6.328E-04 12.9 6.802E-04 32 Chloride (Cl-) 1302 3.682E-02 692.8 1.958E-02 637.6 1.802E-02 120.7 3.411E-03 130.8 3.696E-03 123.8 3.498E-03 141.8 4.007E-03 w
-.....J 33 Bromide (Br-) 0.92 1.154E-05 0.69 8.652E-06 0.78 9.782E-06 0.83 1.041E-05 0.88 1.103E-05 1.00 1.254E-OS 1.2 1.S04E-OS 34 I ad i de (I - ) 0.04 3.160E-07 0.06 4.737E-07 n.n. 0.022 1. 737E-07 0.024 1.895E-07 0.03 2.368E-07 0.05 3.947E-07 35 Sulfate (S04-2) 2624 2.738E-02 359 3.745E-03 287 2.994E-03 308 3.212E-03 333 3.473E-03 340 3.546E-03 339 3.535E-03 36 Phosphate (as P) 0.06 1.942E-06 0.021 6.793E-07 0.025 8.089E-07 0.006 1. 941E-07 0.012 3.882E-07 0.06 1.941E-06 0.04 1. 294E-06 37 Tot. Arsenic (As+5) 0.12 1.605E-06 0.13 1. 738E-06 38 Arsenate (As+5) < O.OOS 6.690E-08 0.006 8.026E-08 < 0.005 6.686E-08 < 0.005 6.686E-08 0.14 1.872E-06 39 Arsenite (As+3) 0.11 1.472E-06 0.165 2.207E-06 0.26 3.477E-06 0.019 2.541E-07 0.03 4.011E-07 40 Alkalinity as HC03- 387.5 6.366E-03 390.5 6.413E-03 367.3 6.033E-03 372.5 6.116E-03 387.4 6.361E-03 372.2 6.110E-03 384.4 6.311E-03 41 Bicarbonate (HC03-) 387.5 6.366E-03 343.0 S.632E-03 318.5 S.231E-03 342.0 S.615E-03 387.4 6.361E-03 372.2 6.110E-03 372.2 6.111E-03 42 Carbonate (C03-2) n.n. 23.4 3.907E-04 24.0 4.008E-04 15.0 2.504E-04 n.n. n.n. 6.0 1.002E-04 43 44 Tot. Sulfide (H2S) n.n. 0.01 2.940E-07 0.042 1. 235E-06 0.009 2.646E-07 n.n. n.n. n.n. 45 Silica (H2Si03) 26.4 3.389E-04 24.3 3.118E-04 23.9 3.067E-04 24.7 3.168E-04 38.5 4.939E-04 36.8 4.720E-04 29.2 3.746E-04 46 Borate (B(OH)3) 18.2 2.951E-04 4.4 7.130E-OS 3.67 5.948E-05 4.2 6.805E-OS 5.75 9.317E-05 6.20 1.00SE-04 S.36 8.684E-05 47 Total I ron < 1.4 2.513E-05 < 3.8 6.818E-05 < 0.65 1.166E-05 < 2 3.S88E-OS < 1.3 2.332E-05 < 0.63 1.130E-05 < 1.7 3.050E-05 48 Diss. Organic C < 3.5 2.921E-04 < 11.1 9.260E-04 < 2.9 2.420E-04 < 0.9 7.507E-05 < 0.82 6.840E-05 < 0.1S 1.251E-05 < 0.53 4.421E-05 49 mg/kg molality mg/kg molality mg/kg molality mg/kg molal ity mg/kg molality mg/kg molality mg/kg molal ity 50 Oxygen (02) n.n. n.n. n.n. < 0.007 2.190E-07 n.n. < 0.0005 1.564E-08 < 0.0005 1.S64E-08 51 Nitrogen (N2) 31.2 1.121E-03 30.0 1.073E-03 33.1 1.184E-03 34.3 1.226E-03 34.8 1.244E-03 33.6 1.201E-03 35.2 1.258E-03 52 Methane (CH4) 0.01 6.272E-07 0.02 1.249E-06 0.04 2.498E-06 0.01 6.240E-07 0.02 1. 248E-06 0.03 1.872E-06 0.03 1.872E-06 53 Hydrogen (H2) < 0.001 4.991E-07 < 0.12 5.96SE-05 < 0.003 1.491E-06 < 0.005 2.483E-06 < 0.004 1.986E-06 < 0.01 4.966E-06 < 0.05 2.483E-OS 54 Argon (Ar) o.n 1.939E-05 0.84 2.107E-05 0.87 2.182E-OS 0.89 2.230E-OS 0.9 2.2S5E-05 0.9 2.255E-05 0.92 2.306E-OS 55 Carbon Dioxide (CO2) 89 2.035E-03 n.n. n.n. 2 4.549E-05 3 6.824E-05 13 2.957E-04 n.n.
Table 2.1: Chemistry of water from the Bottstein borehole. (Page 1 of 2)

1 Sample Depth 162.9 m 316.6 m 312.5 m 399.5 621.3 m 618.4 m 792.4 m 2 Formation mo s-KRI s-KRI KRI KRI KRI KRI S; 3 Analysis No. 301/2 301/5,6 301/25b 301/8c,9 301/12b,13 301/16,17 301/18 4 Date 1-Nov-82 16-Nov-82 20-Jan-84 14,15-Dec-82 22-Jan-83 9-Aug-83 16-Aug-83 G")
57 ~ 58 Dissolved Solids: mg/kg difference mg/kg difference mg/kg difference mg/kg difference mg/kg difference mg/kg difference mg/kg difference Z 59 SLIIl 6175 2095 1848 1028 1095 1098 1129 ~ 60 Residue (110°C) 6480 4.9% 2044 -2.4% 1846 -0.1% 1045 1.6% 1017 -7.2% 1088 -0.9% 1119 -0.9% tJj
61 Residue (180°C) 6336 2.6% 2035 -2.9% 1844 -0.2% 1034 0.6% 1017 -7.2% 1085 -1.2% 1114 -1.3% 00 62 0'1 63 Charge Balance: -0.21% 3.53% 0.25% -0.00% -2.78% 1.33% 0.40% I
64 ....... 65 Total Dissolved CO2 mg/L molality mg/l molaLity mg/l molality mg/l molality mg/l molality mg/l molal ity mg/l molal ity \.0
66 Analysed 67 Fresenius 8.401E-03 6.023E-03 5.632E-03 5.911E-03 6.429E-03 6.406E-03 6.211E-03 68 EIR 7.550E-03 5.570E-03 6.050E-03 7. 150E-03 69 Calculated 70 With Meas. pH 7.729E-03 6.281E-03 5.n1E-03 6.093E-03 6.362E-03 6. 134E-03 6.167E-03 71 At Calcite Satn 8.706E-03 6. 736E+00 6.162E-03 6.139E-03 6.452E-03 6. 182E-03 6.338E-03 72 73 MODELED VALUES: 74 75 Carbonate System 76 pH 6.65 7.50 7.78 8.03 7.82 7.84 7.92 77 Carbon Dioxide(C02) 103.2 2.352E-03 16.0 3.634E-04 7.9 1.806E-04 4.5 1.035E-04 7.1 1.619E-04 6.5 1.484E-04 5.5 1.245E-04 78 Bicarbonate (HC03-) 386.1 6.344E-03 386.4 6.345E-03 361.6 5.938E-03 363.7 5.972E-03 379.8 6.236E-03 364.2 5.979E-03 373.9 6.139E-03 79 Carbonate (C03-2) 0.6 1.009E-05 1.6 2.753E-05 2.6 4.279E-05 3.8 6.422E-05 3.2 5.410E-05 3.3 5.462E-05 4.5 7.499E-05 80 Hydroxide (OH-) 0.0 4.064E-07 0.3 2.049E-05 0.0 2.096E-06 0.1 3.569E-06 0.0 2.683E-06 0.1 3.972E-06 0.1 4.234E-06 81 Total Dissolved CO2 8.706E-03 6. 736E-03 6.162E-03 6.139E-03 6.452E-03 6.182E-03 6.338E-03 82 log P(C02) -1.20 -1.94 -2.25 -2.46 -2.18 -2.22 -2.25 83 84 Saturation Indices: w 85 Calcite 0.00 0.00 0.00 0.00 0.00 0.00 0.00 00 86 Dolomite -0.22 -0.67 -0.65 -1.19 -1.23 -1.41 -1.25 87 GYPSLlll -0.03 -1.62 -1.94 -2.14 -2.03 -2.03 -2.18 88 Anhydrite -0.42 -1.93 -2.26 -2.43 -2.23 -2.22 -2.32 89 Celestite -0.08 -1.54 -1.56 -1.81 -1.64 -1.85 -2.44 90 Barite 0.27 0.31 -0.02 0.28 0.22 -0.03 -0.02 91 Fluorite -0.07 0.45 0.19 -0.08 -0.09 -0.12 -0.26 92 Chalcedony 0.14 0.02 0.01 -0.01 0.09 0.07 -0.08 93 Quartz 0.58 0.45 0.44 0.41 0.48 0.46 0.29 94 95 Oxidation State at 96 Formation T~. pE Eh(volts) pE Eh(volts) pE Eh(volts) pE Eh(volts) pE Eh(volts) pE Eh(volts) pE Eh(volts) 97 Pt Electrode 2.75 0.16 -0.18 -0.01 -2.24 -0.13 0.00 0.00 -0.17 -0.01 -1.49 -0.09 -2.48 -0.16 98 Calculated from: 99 U02 Satn. -0.08 -0.00 -0.99 -0.06 -1.84 -0.11 -1.72 -0.10 -1.90 -0.12 -2.24 -0.14 -2.42 -0.15 100 02(aq)/H20 < 11.43 0.69 < 10.67 0.66 < 10.22 0.64 101 02(aq)/H20(Sato) < 1.33 0.08 < 0.57 0.04 < 0.12 0.01 102 As(V)/As(III) < 0.05 0.00 -2.28 -0.14 < -2.96 -0.18 < -2.28 -0.14 -1.70 -0.10 103 N2(AQ)/NH4+ -2.69 -0.16 -3.69 -0.22 -4.13 -0.25 -4.58 -0.27 -4.39 -0.27 -4.46 -0.28 -4.64 -0.29 104 S04-2/H2S -3.77 -0.22 -4.17 -0.25 -4.39 -0.26
105 C02/CH4 -3.45 -0.20 -4.54 -0.27 -4.90 -0.29 -5.15 -0.31 -5.10 -0.31 -5.15 -0.32 -5.32 -0.33 106 H+/H2(AQ) > -5.04 -0.29 > -6.93 -0.41 > -6.41 -0.38 > -6.77 -0.41 > -6.53 -0.40 > -6.75 -0.42 > -7.18 -0.45
Table 2.1: Chemistry of water from the Bottstein borehole. (Page 2 of 2)

NAGRA NTB 86-19 - 39 -
3.0 WEIACH
3.1 Massenkalk 255.0 m (242.9 - 267.0 m) 5. 6-Mar-83 Samples 302/5.6.7.8.9 Block 2 Reference: WITTWER (1986) Sect. 5.2.1
Hydraulic tests were made on six zones in the sediments above the Muschelkalk in the Weiach borehole. Of these, only the interval from 242.9 to 267.0 m in the Kimmeridgian Massenkalk yielded sufficient water that it could be successfully sampled.
The test'of this zone began on 28-Feb-83 with a period of artesian flow followed by swabbing and pumping. After the collection of isotope samples from the pump discharge on 4- and 5-Mar (305/9), a GTC pressure sample was taken for chemical and gas analyses (302/5). On 6-Mar a bailer sample was taken (305/8) and two additional samples were collected from the upper and lower sample chambers of the drill stem test apparatus after it was removed from the borehole (302/6 and 302/7, respectively). Complete chemical analyses by Fresenius are available on samples 302/5, 6, and 8, gas analyses by PSI on samples 302/5, 6, and 7, and tritium analyses on samples 302/6 and 9.
The interval was drilled with fresh-water mud with no tracer. Because of the volume of water removed from the zone before sampling and the relatively low tritium concentrations of the samples « 5.7 TU in 302/6 and < 3.6 TU in 302/9), the sample chemistry should be representative of the groundwater in the zone.
The chemistry of the water in this zone is given in Table 3.1. The concentrations of the dissolved solids are the means of the three samples 302/5, 6 and 8, except as noted in the following paragraph. The concentrations of the major dissolved ions Na+ and Cl- in the three analyses -differ from their mean by no more than four per cent, and there is no pattern in the concentrations of these and other dissolved species which would lead one to select one sample as most representative of the groundwater.
The HzSi03 content of sample 302/6 was chosen over that of 302/8 because the lower concentration of the latter is equivalent to undersaturation with respect to quartz, which is unreasonable. The concentrations of 0Z(aq) and COZ(aq) are means of the Fresenius analyses of 302/5 and 6, and the total HzS value is the Fresenius field analysis of sample 302/6. The concentrations of the remaining gases are as given by PSI for samples 302/6 and 7. The gas results from sample 302/5 are not included in the average because the concentrations of all gases in it are lower than in the other samples. The uranium concentrations are given in Table 3.2.
The modeled values for the carbonate system under formation conditions are based on the measured alkalinity and a pH corresponding to calcite saturation. As Table 3.1 shows, this leads to a calculated concentration of COZ(aq) lower than that measured by Fresenius. The saturation index of this sample with respect to dolomite is 0.03. As discussed in Section 1.2.7, this suggests that not only is the water in this formation saturated with respect to

NAGRA NTB 86-19
Table 3.2:
~le Depth
255.0 m
859.1 m
985.3 m
1116.5 m
1408.3 m
2218.1 m
2267.0 m
*
- 40 -
Uranium concentrations and pE values at uraninite saturation for waters from the Weiach borehole.
Uraniu. Concentration in .icrogrlas per litre pEC8lcu
lated at ~le PSI AERE NlIIber Ana l ys i s Ana L ys is
302/5 0.12 302/6 0.06 0.08 :t 0.01
302/10a 0.13 ± 0.01 302/10b 0.17 0.24 ± 0.01
302/12 0.13 0.02 ± 0.01 302113 0.24
302/19 0.20 0.01 ± 0.003 302/20 0.20
302/17 0.20 0.02 ± 0.006
302/16 <0.05 0.01 :t 0.002
302/14 0.05 0.01 :t 0.004 302/15 0.20
At Calcu- Uraninite lated pE Saturation
0.08 -1.07
0.24 -0.60
0.02 -1.n 0.18 -1.17
0.01 -1.66
0.02 -0.90
0.105 * -5.00 0.106 * ·3.00 0.086 * -5.00 0.087 * -3.00 0.20 -1.60
Calculated assuming uraninite saturation at pE shown.
dolomite, but that the dolomite in the formation has thermodynamic properties like the dolomite included in the data base.
pE values for this sample were calculated from the nitrogen, sulphur, carbon, and hydrogen couples and from the uranium concentration at uraninite saturation. Values for the four redox couples are strongly negative, and those for the nitrogen, sulphur, and carbon couples are in agreement nearly within one pE unit. Because these couples react so sluggishly that they tend not to reflect equilibrium, the agreement between the three of them is probably fortuitous and does not reflect redox conditions of the formation. The H2 dissolved in the sample is most likely a product of corrosion of the iron tools in the borehole, so the hydrogen couple also does not reflect formation conditions.
The uraninite saturation calculation leads to a pE value of about -1.0. In other samples the uraninite saturation value is often corroborated by values calculated from the arsenic redox couple and, sometimes, by the measured platinum electrode potential as well. Only a total arsenic concentration is available for this sample and no flow-through cell platinum electrode measurement was made.

NAGRA NTB 86-19 - 41 -
3.2 Upper Muschelkalk 859.1 m (822.0 - 869.1 m) 4-Apr-83 Sample 302/10b Block 1 References: WITTWER. (1986) Sect. 5.2.2
Before drilling the Upper Muschelkalk, 13 3/8 in. casing was set at about 814 m. The interval to 896.1 m was then drilled with untraced, fresh-water mud. To minimize drilling fluid loss into the formation, it was necessary to use a high-viscosity additive. Before testing and sampling the Muschelkalk, a temporary casing was set at 822 m.
On 28- and 29-Mar, drill stem tests were carried out, and on 30-and 3l-Mar, the borehole was flushed and swabbed to clean it in preparation for a long-term pump test. The interval was pumped from 1- to 4-Apr, during which time the conductivity of the pumped water stabilized. The chemical samples were taken on 4-Apr after more than 800 m3 of water had been pumped. The tritium content of the water sampled was 3.2 ± 0.7 TU. In spite of the drilling fluid loss into the interval, the lack of drilling fluid tracer and the presence of measurable tritium, this sample is thought to well represent the groundwater from this interval and is assigned to Block 1 (WITTWER, 1986, Table 5.2).
The chemistry of the Muschelkalk at Weiach is given in Table 3.1. The concentrations of dissolved solids, CO2 (aq) and total H2S are those of Fresenius. The concentrations of the other gases are as determined by PSI. The uranium analyses are shown in Table 3.2.
Modeled values of the carbonate chemistry of formation water are based on the measured alkalinity and a pH corresponding to calcite saturation. The modeled CO2 (aq) concentration is considerably larger than that measured. As discussed in Section 1.2.7, the dolomite in the Muschelkalk appears to be about 0.2 units more soluble than that included in the thermochemical data base. Thus, the SIdolomite value for the this water, -0.18 suggests saturation with respect to that mineral. The water is also saturated with respect to gypsum, the stable CaS04 solid at the formation temperature. The silica concentration corresponds to oversaturation with respect to both chalcedony and quartz. This is unlikely and suggests that the silica concentration, which was measured on an unfiltered sample, may be too high.
pE values are available for all the gas couples, a platinum electrode measurement, uraninite solubility and a limiting value from the arsenic couple. All gas couples but oxygen lead to strongly negative pE values which are unlikely to represent formation conditions. Both the theoretical and the Sato oxygen couples lead to positive pE values. The dissolved oxygen reported may be a result of contamination rather than representing the groundwater itself. Thus, the oxygen pE values may not be representative of the formation itself.
The pE values calculated from the platinum electrode measurement and from uranium saturation are in disagreement by more than 1.5 uni ts . The significance of this disagreement, if any, is not

NAGRA NTB 86-19 - 42 -
3.3
3.3.1
clear and it is not possible to suggest which value might better represent formation conditions.
Buntsandstein/Perm
Buntsandstein 985.3 m (981.0 - 989.6 m) 18. 19-Jul-83 Samples 302/12,13 Block 1 Reference: WITTWER (1986) Sect. 5.2.4
This interval was invaded by from 6 to 11 m3 of mixed de-ionized and salt-water-mud drilling fluid. It was pumped for about three days before sampling, removing about 90 m3 of fluid. The conductivity, pH and m-TFMBA values were steady after about two days of pumping and the tritium content of the sample was low « 0.8 TU). These samples are therefore designated Block 1.
Samples were taken by pumping (302/12) and with a GTC pressure vessel (302/13). Although the pressure sample contained considerably higher tracer concentrations, its salinity was within two per cent of that of the pumped sample.
The chemistry of water from this zone is shown in Table 3.1. The concentrations of dissolved solid constituents, 02(aq), CO2 (aq) and total H2S are based on Fresenius analyses of both the pumped and pressure-vessel samples. The other dissolved gases are from the PSI analyses of the pumped sample.
The carbonate chemistry modeled for this water is based on the measured alkalinity and a pH calculated for calcite saturation. The modeled water contains more CO2 (aq) than measured by Fresenius and more total dissolved carbonate than analyzed by either Fresen ius or PSI. The water appears to be undersaturated with respect to dolomite and fluorite but is saturated with respect to gypsum and celestite. As is common, it is undersaturated with respect to chalcedony and oversaturated with respect to quartz. The positive barite saturation index may result from an erroneously high barium analysis.
pE values are available from the nitrogen, sulphur, carbon and hydrogen couples, and from the platinum electrode potential. The nitrogen, sulphur, and carbon values agree within about one unit and are strongly negative. Because these couples react so slowly, the values are probably not representative of the pE of the formation. The hydrogen couple leads to a highly negative pE. The dissolved hydrogen is probably, in part, a result of iron oxidation, so this pE is also not representative of the formation.
An unusual feature of this sample is that its platinum electrode potential leads to a pE more negative than those calculated for the nitrogen, sulphur and carbon couples. It is not possible to evaluate the significance of this measured value without considering the specific reactions which might be taking place on the surface of the platinum electrode in these waters.

NAGRA NTB 86-19 - 43 -
3.3.2
As shown in Table 3.2, the various reported uranium concentrations differ by a factor of as much as 12. The table also shows that choosing the AERE uranium concentration or the mean of the PSI analysis leads to calculated pE values differing by less than 0.6 units.
Perm 1116.5 m (1109.2 - 1123.8 m) 28. 29-Jun-84 Samples 302/19.20 Block 2 Reference: WITTWER (1986) Sect. 5.2.8
This interval was drilled on l3-May-83 with 90 per cent core loss. It remained open to the fresh-water-mud drilling fluid until it was cased on l8-Sept-83. The zone was perforated on l8-Jun-84, but until a good packer seat was established on 24-Jun, it was open to the de-ionized water filling the casing. After swabbing, the interval was pumped from 24- to 28-Jun and yielded about 0.3 l/min. at a drawdown of 175 to 180 m. Sample 302/19 was collected on 28-Jun-84 at the well-head from the pump discharge, and sample 302/20 was taken on 19 -Jun- 83 using a GTC pressure sampler.
The borehole history before sampling is so complicated that the tracer concentrations cannot be used to test the reliability of these samples. The facts that approximately 200 m3 of fluid were pumped from the interval before the samples were taken, and that the tritium content of the pumped sample was so low, suggest that not more than a few per cent of non-formation water was present in the samples. Thus, they are given Block 2 status.
The chemistry of water in this zone is given in Table 3.1. The concentrations of dissolved solids, CO2 (aq)' oxygen and total H2S are based on the Fresenius analyses of the pumped (302/19) and GTC pressure vessel (303/20) samples. The concentrations of the other gases are from the PSI analyses of the pressure sample.
Preliminary modelling using the measured alkalinity and with pH adjusted for calcite saturation led to a calculated total dissolved carbonate concentration of nearly 20 mmol which seems high. The total carbonate concentration was therefore assumed to be 13.0 mmol, approximately the amount analyzed by Fresenius and close to the total dissolved carbonate content of the water from the 985.3 m zone. The pH was then adjusted to give calcite saturation at this total dissolved carbonate concentration. The resulting bicarbonate concentration is lower than that measured by Fresenius while the dissolved CO2 (aq) modeled is higher than that analyzed.
As Table 3.1 shows, the water appears to be undersaturated with respect to dolomite and approximately saturated with respect to anhydrite, celestite and quartz. Anhydrite is the stable CaS04 solid phase at the temperatures of this zone and at higher temperatures.
Calculated pE values are available from the nitrogen, sulphur, carbon and hydrogen couples. The values from the nitrogen and sulphur couples agree within one pE unit, as do those from the
NAGRA NTB 86-19 - 44 -
3.3.3
carbon and hydrogen couples. All four values are strongly negative, however, and because none of these reactions take place rapidly, it is unlikely that they represent conditions in the formation itself.
As shown in Table 3.2, the uranium analyses for these samples differ by a factor of 20. Using the lower value leads to a pE at uraninite saturation within 0.3 units of that calculated from the platinum electrode potential. The pE calculated from the arsenic couple for this sample is only a limiting value because the As (V) concentration was below detection.
Perm 1408.4 m (1401.1 - 1415.7 m) 5. 15-Jun-84 Samples 302/17.18 Block 2 Reference: WITTWER (1986) Sect. 5.2.7
This zone was open to fresh-water-mud drilling fluid from the time it was first penetrated on 3-Jun-83 until it was cased on l8-Sept-83. The casing was perforated on 2-May-84 and developed by taking a 600-800 m swab every few days. Under these conditions, the zone yielded 0.1-0.2 l/min. The water in the tubing was tested by bailing every two days from 9-May until l6-Jun when it was sampled with the Preussag pressure sampler. There are inconsistencies in the tracer records which prevent them from being used to evaluate the quality of the sample. However, the conductivity of the fluids had been relatively constant for the 15 days prior to sampling and the tritium was not excessive (ca. six TU), so these analyses are given Block 2 status.
The dissolved solid values in Table 3.1, as well as the 0Z(aq), COZ(aq) and total HzS concentrations are based on the Fresenius analyses of the two samples. The concentrations of the dissolved gases are from the PSI analysis of sample 302/18.
The modeled values of the carbonate system are based on the mean of the alkalinity values measured by Fresenius and a pH calculated for calcite saturation. The resulting calculated COZ(aq) concentration is slightly lower than the mean of the Fresenius analyses as is the total dissolved carbonate content. The water appears to be undersaturated with respect to dolomite and all sulphate minerals except barite. Calcite saturation is assumed while the positive barite saturation index may be result of an erroneous barium analyses. The water is also undersaturated with respect to both chalcedony and quartz. This is unlikely and may result from an erroneously low silica concentration. The lower of the two reported silica values is used in Table 3.1. Even if the higher value (5.7 mg/l) were used, the water would still be undersaturated with respect to both minerals.
Calculated pE values are available from the gas couples and uraninite saturation. The values for the nitrogen, sulphur and carbon couples are strongly negative and probably do not represent formation conditions. The value from the hydrogen couple is even more negative, probably as a result of hydrogen produced by corrosion of iron tools in the borehole.

NAGRA NTB 86-19 - 45 -
Uranium analyses made by AERE and PSI differ by a factor of ten as shown in Table 3.2. The lower value was chosen and leads to a pE for uraninite saturation which is more positive than those calculated from the gas couples.
3.4 Crystalline
3.4.1
During the drilling of the crystalline, no fracture zones were identified through loss of drilling fluid to the formation. The sample intervals at 2218.1 and 2267.0 m were located by fluid logging and by using the Nagra bailer to test the chemistry of fluid in the borehole. Tracer concentrations in the drill fluid were determined only after the fluid had been exchanged in the borehole. Although some small artesian pressures were noted at several points in the borehole, the drilling fluid pressure was sufficient to counteract groundwater flow from these zones.
Crystalline 2218.1 m (2211.6 - 2224.6 m) 27-Apr-84 Sample 302/16 Block 2 Reference: WITTWER (1986) Sect. 5.2.6
This interval recovered very slowly from hydraulic testing. During the cleaning phase using the Nagra bailer, the tracer concentrations indicated a decrease in drilling fluid contamination from between 10 and 15 per cent to close to five per cent. However, because of the small volumes of fluid removed from the borehole, the tracer concentrations varied during the later stages of the cleaning phase. The electrical conductivity of the fluid being recovered decreased during the cleaning phase, but then increased during the sampling with the Preussag bailer. Sample 302/16 was taken with the Preussag pressure vessel within the tubing at a depth of 2190 m. It contained two to five per cent drilling fluid contamination and had a tritium concentration of 2.7 ± 0.7 TU. Because of the drilling fluid present in the sample and the variation in tracer concentration history during cleaning, the sample was assigned to Block 2.
The chemistry of water from the crystalline at 2218 m depth is given in Table 3.1. The concentrations of the dissolved solids, 0Z(aq)' total HzS, and COz(aq) are Fresenius analyses. The concentration of the other dissolved gases are PSI results.
The formation temperature of this water is 112°C. This temperature is at or, for some species, above the limit of validity of the thermochemical data used. For this reason, modelling results including the calculated saturation indices and pE values must be used with caution.
The modeled values for the carbonate system are based on the measured alkalinity and a pH corresponding to saturation with respect to calcite. The modeled total dissolved carbonate is virtually the same as that measured by Fresenius.

NAGRA NTB 86-19 - 46 -
3.4.2
The modeled water is undersaturated with respect to dolomite, all sulphate minerals except barite, fluorite, and both silica minerals. The apparent barite oversaturation may be an artifact of an erroneous barium analysis. Undersaturation with respect to quartz is unusual for a water of this temperature, and may indicate that some silica precipitated from this sample because of cooling during sampling.
pE values calculated for the gas couples and a limiting value for the arsenic couple are given in Table 3.2. The nitrogen, sulphur, and carbon couples agree within less than one unit, although all are strongly negative. The hydrogen couple leads to an even more negative pE value, due probably to excess hydrogen produced by corrosion of iron tools in the boreholes.
The measured uranium concentrations are shown in Table 3.2. Both concentrations are below uraninite saturation at any pE. Thus, the table includes values of the uranium concentrations calculated at equilibrium with respect to uraninite at assumed pE values of -3 and -5. This concentration, 0.1 mg/l, is well above the measured values. Therefore, no good estimate is possible for the redox conditions in this interval, except that it is probably more negative than -2 or -3 pE units.
Crystalline 2267.0 m (2260.5 - 2273.5 m) 26, 27-Mar-84 Samples 302/14,15 Block 2 Reference: WITTWER (1986) Sect. 5.2.5
The cleaning of this interval prior to sampling was less successful than for the 2218 m zone. The drilling fluid used was traced de-ionized water, but it was difficult to remove because of the low hydraulic conductivity of this interval. During the cleaning phase, contamination from.drilling fluid was reduced from nearly 100 per cent to between 8 and 18 per cent. The electrical conductivity of the sample reached a maximum prior to the final sampling. The final sample (302/14) was taken with the Preussag sampler at 2245 m depth. From its tracer content it required a correction of nine per cent to compensate for residual de-ionized water contamination. The tritium content of 11.0 ± 1.1 TU verified the tracer results. A duplicate sample (302/15) was attempted using the Schlumberger bailer at 2245 m depth, but because of technical difficulties, only waters for PSI analyses could be retrieved.
The chemistry of the water from the crystalline at 2267 m is given in Table 3.1. The concentrations of the dissolved constituents were taken from WITTWER (1986, Table 5.6) and represent Fresenius analyses for sample 302/14 corrected for nine per cent dilution. The possible contribution of the residual drilling fluid to the gas concentrations of the sample is unknown, so the only gas concentrations given in Table 3.1 are for 02(aq)' H2S, and CO2 (aq)'
The modeled values for the carbonate system were calculated assuming a total dissolved carbonate content of 1.601 mmol equivalent to that of the sample from 2218.1 m, and a pH corresponding

NAGRA NTB 86-19 - 47 -
to saturation with respect to calcite. The calculated total alkalinity (1.19 meq/kg, not shown in Table 3.1) is equivalent to that measured by Fresenius (1.20 meq/kg, Table 3.1, line 40). This water is also similar to that from the 2218.1 m interval in its mineral saturation states and calculated pE values. Because of its high temperature, the results of the model calculations on this water, like those on the previous sample, should be used cautiously.
As Table 3.2 shows, there is a wide spread in the uranium concentrations reported by the two laboratories from the samples of this interval. The highest value corresponds to uraninite saturation at a pE of -1.6, but the two lower values are below uraninite saturation at any pE. As the table shows, uraninite saturation, even at very low pE values, leads to a dissolved uranium concentration of about 0.09 ~g/l.

1 Sampl e Depth 255.0 m 859.1 m 985.3 m 1116.5 m 1408.3 m 2218.1 m 2267.0 m 2 Formation joki mo s r r KRI KRI 3 AnaLysis No. 302/5,6,7,8 302/10b 302/12,13 302/19,20 302/17,18 302/16 302/14 CORRECTED ~ 4 Date 5,6·Mar-83 4-Apr-83 18,19-Jul-83 28,29·Jun-84 5,15-Jun-84 27-Apr-84 26,27-Mar-85 G)
5 Measured pH 7.20 6.81 7.30 7.20 7.21 7.66 8.16 ~ 6 Pt ELect. Pot. (v) -0.13 -0.30 -0.11 7 Sample Temp. (IC) 14.0 43.1 32.3 17.4 28.1 17.8 20.0 Z 8 Formation Temp. (IC) 19 50 53 59 70 112 112 H 9 Density (g/mL) 1.0034 1.0013 1.0106 1.0253 1.0713 1.0031 1.0038 b:I
10 mg/l moLaL ity mg/l molality mg/l molaL ity mg/L moLaLity mg/L moLaLity mg/l mola·L ity mg/L molaLity 00 11 Lithium (Li+) 0.98 1.417E-04 0.19 2.742E-05 5.4 7.810E-04 10.6 1.544E·03 13.1 1.939E-03 6.25 9.03SE-04 8.5 1.230E-03 0\
12 Sodium (Na+) 2275 9.928E-02 139.3 6.071E-03 4318 1.885E-Ol 12165 5.351E-Ol 26112 1. 167E+00 2205 9.623E-02 272S 1.190E-Ol I
I-' 13 Potassium (K+) 29.2 7.492E-04 25.1 6.431E-04 81.2 2.085E-03 192.6 4.981E-03 762 2.002E-02 70.4 1.806E-03 93.0 2.389E-03 1.0 14 Rubidium (Rb+) n.n. 0.014 1.641E-07 O.OS 5.873E-07 1.2 1.420E-05 2.4 2.88SE-OS 1.1 1.291E-05 0.97 1.140E-OS lS Cesium (Cs+) n.n. n.n. 0.02 1.511E-07 0.26 1.978E-06 0.28 2.165E-06 0.73 5.511E-06 0.8 6.045E-06 16 Ammonium (NH4+) 2.85 1.58SE-04 0.40 2.222E-05 6_5 3.617E-04 15.5 8.689E-04 70 3.987E-03 1.7 9.4S6E-OS 1.8 1.002E-04 17 Magnesium (Mg+2) 90.6 3.739E-03 149.2 6.148E-03 6S.3 2.696E-03 189.2 7.870E-03 1006 4.252E-02 0.1 4.127E-06 0.4 1.652E-OS 18 CaLcium (Ca+2) 148.1 3.707E-03 578.7 1.447E-02 456.6 1.144E-02 1046 2.639E-02 8890 2.279E-Ol 151.8 3.800E-03 221.0 5.537E-03 19 Strontium (Sr+2) 6.9 7.901E-05 7.90 9.033E-05 11.1 1.272E-04 32.60 3.762E-04 390 4.573E-03 4.65 5.325E-05 6.9 7.908E-05 20 Barium (Ba+2) 1.9 1.388E-05 0.04 2.918E-07 0.03 2.193E-07 0.094 6.921E-07 16.2 1.212E-04 0.25 1.826E-06 0.5 3.6S6E-06 21 Radium (Ra+2) 4.7E-09 2.086E-14 1.5E-09 6.649E-15 9.0E-09 3.997E-14 1.4E-09 6.264E-15 3.0E-08 1.364E -13 3.8E-09 1.687E -14 1.6E-08 7.109E-14 22 Manganese (Mn+2) 0.57 1.041E-05 0.18 3.283E·06 0.92 1.681E-05 1.78 3.276E-05 7.88 1.474E-04 0.S5 1.004E·05 0.43 7.860E-06 23 Iron (Fe+2) < 2.3 4.126E-OS < 35 6.291E-04 < 70.7 1.280E-03 < 23.4 4.305E-04 < 0.60 1.078E-05 < 1 1.798E-05 24 Nickel (Ni+2) < 0.02 3.418E-07 < 0.002 3.413E-08 n.n. < 0.01 1. 722E-07 < 0.28 4.900E-06 < 0.18 3.076E-06 < 0.005 8.553E-08 25 Copper (Cu+2) < 0.006 9.474E-08 < 0.003 4.730E-08 < 0.003 4.740E-08 n.n. < 0.01 1.617E-07 n.n. < 0.008 1.264E-07 26 Zinc (Zn+2) < 0.095 1.458E-06 < 0.044 6.744E-07 < 0.1 1.536E·06 < 0.24 < 1.55 2.436E-05 < 0.24 3.684E-06 < 0.36 5.531E-06 27 Lead (Pb+2) < 0.015 7.264E-08 < 0.006 2.901E·08 n.n. n.n. < 0.011 5.455E-08 < 0.011 5.327E-08 n.n. 28 ALuminum (AL+3) < 0.026 9.668E-07 n.n. < 0.013 4.837E-07 < 0.017 6.372E-07 < 0.015 5.7l2E-07 n.n. < 0.016 5.955E-07 29 Uranium 8.0E-05 3.372E-l0 2.4E-04 1.010E-09 1.8E-04 7.591E-10 loOE-05 4.248E-l1 2.0E-05 8.633E-l1 1.0E-05 4.215E-l1 2.0E-04 8.438E-l0 30 31 FLuoride (F-) 2.73 1.442E-04 2.85 1.503E-04 0.87 4.S97E-05 0.58 3.087E-05 0.68 3.678E-OS 5.8 3.084E-04 8.5 4.493E-04 32 ChLoride (CL-) 3795 1.074E-Ol 53 1.498E-03 2921 8.271E -02 18088 5.159E-Ol 59750 1.732E+00 3382 9.571E-02 4312 1. 221 E -01 33 Bromide (Br-) 11.5 1.444E-04 n.n. 6.9 8.668E-05 71 8.985E-04 630 8.101E-03 32.7 4.106E-04 44.0 5.530E-04 +:--
00 34 I od i de (I - ) 8.9 7.036E-05 n.n. 0.42 3.322E-06 1.0 7.969E-06 5.2 4.210E-05 0.21 1.660E-06 0.42 3.324E-06 35 SuLfate (S04-2) 33 3.447E-04 1990 2.075E-02 6198 6.477E-02 4165 4.385E-02 264 2.824E-03 431 4.502E-03 468 4.893E-03 36 Phosphate (as P) 0.13 4.211E-06 0.031 1.003E-06 0.011 3.565E-07 0.194 6.334E-06 0.11 3.649E-06 0.013 4.211E-07 0.07 2.270E-06 37 Tot. Arsenic (As+5) 0.016 2.143E·07 0.033 0.0007 9.600E-09 38 Arsenate (As+5) < 0.005 6.686E-08 < 0.005 6.749E-08 < 0.005 6.696E-08 < 0.005 6.702E-08 39 Arsenite (As+3) 0.007 9.361E-08 0.004 5.399E-08 0.0053 7.098E·08 0.013 1.743E-07 40 Alkalinity as HC03- 466.0 7.662E-03 283.7 4.6S8E-03 544.4 8.956E-03 609.0 1.009E-02 146.5 2.467E-03 76.3 1.255E-03 73.0 1.201E-03 41 Bicarbonate (HC03-) 466.0 7.662E-03 283.7 4.658E-03 544.4 8.956E-03 609.0 1.009E-02 146.5 2.467E-03 76.3 1.255E-03 73.0 1.201E-03 42 Carbonate (C03-2) n.n. n.n. n.n. n.n. n.n. n.n. n.n. 43 44 Tot. Sulfide (H2S) 0.13 3.827E-06 4.0 1. 176E-04 0.04 1.178E-06 0.04 1.187E·06 0.015 4.522E-07 0.014 4.122E-07 0.017 5.009E-07 45 Silica (H2Si03) 14 1. 798E-04 58.9 7.556E-04 25 3.213E-04 17.2 2.227E-04 3.4 4.473E-05 58.1 7.464E-04 55.6 7.149E·04 46 Borate (B(OH)3) 20.5 3.326E-04 3.4 5.509E-05 39.5 6.413E-04 67.82 1.109E-03 27.15 4.512E-04 46.95 7.618E-04 58.1 9.436E-04 47 TotaL I ron < 12.9 2.317E-04 < 2.39 4.288E-05 < 36 6.471E-04 < 74.8 1.354E·03 < 47.5 8.739E-04 < 0.3 5.390E-06 < 12.8 2.302E-04 48 Diss. Organic C < 6.5 5.429E-04 < 34 2.836E-03 < 3.9 3.259E-04 < 0.25 2.105E-05 < 21.5 1.839E-03 < 7.8 6.516E-04 < 6.5 5.435E-04 49 (mg/kg) molality (mg/kg) molaLity (mg/kg) molaLity (mg/kg) moLaLity (mg/kg) molaLity (mg/kg) moLaLity (mg/kg) moLal ity 50 Oxygen (02) n.n. 0.02 6.270E-07 n.n. n.n. n.n. n.n. 51 Nitrogen (N2) 44.8 1.610E -03 15.8 5.658E-04 48.5 1.756E-03 107 3.960E-03 137.5 5.403E-03 6S.0 2.335E-03 52 Methane (CH4) 68.4 4.292E-03 0.02 1.251E-06 0.19 1.201E-05 7_49 4.B41E-04 202.5 1.389E-02 27.7 1.738e-03 53 Hydrogen (H2) < 0_01 4.994E-06 < 0.003 1.493E-06 < 0.21 1.057E-04 < O.OOOS 2.572E-07 < 0.3 1.638E-04 < 0.99 4.942E-04 54 Argon CAr) 0.73 1.B40E-05 0.65 1.632E-05 0.83 2.108E-05 0.63 1.635E-05 0.64 1. 764E-05 0.92 2.318E-05 55 Carbon Dioxide (CO2) 78 1.784E-03 54 1.231E-03 51 1.176E-03 102 2.403E-03 66 1.651E-03 18 4.116E-04 3.6 8.246E-OS
TabLe 3.1: Chemistry of water from Yeiach borehoLe. (Page 1 of 2)

1 Sample Depth 255.0 m 859.1 m 985.3 m 1116.5 m 1408.3 m 2218.1 m 2267.0 m 2 Formation joki mo s r r KRI KRI 3 Analysis No. 302/5,6,7,8 302/10b 302/12,13 302/19,20 302/17,18 302/16 302/14 CORRECTED ~ 4 Date 5,6-Mar-83 4-Apr-83 18,19-Jul-83 28,29-Jun-84 5,15-Jun-84 27-Apr-84 26,27-Mar-85 GJ 57 f;;: 58 Dissolved Solids: mg/kg difference mg/kg difference mg/kg difference mg/kg di fference mg/kg difference mg/kg difference mg/kg di fference
59 Sum 6675 3172 14438 36432 98069 6432 8037 Z 60 Residue (11OIC) 6944 4.0% 3409 7.5% 14648 1.5% 37288 2.3% 117315 19.6% 6392 -0.6% 8405 4.6% 1-3 61 Residue (180 C) 6842 2.5% 3375 6.4% 14411 -0.2% 37000 1.6% 105418 7.5% 6359 -1.1% t1:l 62 0:> 63 Charge Balance: -0.46% 0.93% 0.15% 0.10% 0.26% 0.51% 0.39% 0"\ 64 I
~ 65 Total Dissolved CO2 mg/t molality rng/l molality mg/l molality rng/l molality mg/l molality mg/l molal ity mg/l molal ity 1..0 66 Analysed 67 Fresenius 9.446E-03 5.889E-03 1.013E-02 1.250E-02 4.118E-03 1.666E-03 1.284E-03 68 EIR 8.730E-03 9.590E·03 69 Calculated 70 With Meas. pH 8.459E-03 5.501E-03 9.255E-03 1.013E-02 2.065E-03 9.060E-04 71 At Calcite Satn 8.793E-03 7.218E-03 1. 299E-02 1.300E-02 3.884E-03 1.601E-03 1.601E-03 72 73 MODELED VALUES: 74 75 Carbonate System 76 pH 7.06 6.38 6.43 6.11 5.84 6.78 6.68 77 Carbon Dioxide(C02) 50.8 1.159E-03 117.6 2.676E-03 178.1 4.063E-03 238.9 5.490E-03 61.6 1.439E-03 18.4 4.191E-04 21.4 4.889E-04 78 Bicarbonate (HC03-) 463.1 7.615E-03 276.0 4.532E-03 540.9 8.899E-03 451.5 7.484E-03 144.4 2.432E-03 70.4 1.158E-03 66.2 1.090E-03 79 Carbonate (C03-2) 1.2 1.935E-05 0.6 9.820E-06 1.5 2.477E-05 1.6 2.676E-05 0.7 1.213E-05 1.5 2.460E-05 1.3 2.253E-05 80 Hydroxide (OH-) 0.0 2.923E-06 0.0 4.198E-07 0.1 3.069E-06 0.1 4.050E-06 0.1 4.208E-06 0.3 1.539E-05 0.3 1.606E-05 81 Total Dissolved CO2 8.793E-03 7.218E-03 1.299E-02 1.300E-02 3.884E-03 1.601E-03 1.601E-03 82 log P(C02) -1.53 -0.86 -0.63 -0.41 -0.77 -1.35 -1.28 83 84 Saturation Indices: 85 Calcite 0.00 0.00 0.00 0.00 0.00 0.00 0.00 +=' 86 Dolomite 0.03 -0.18 -0.42 -0.30 -0.51 -3.46 -3.04 1..0
87 Gypsum -2.36 -0.05 -0.08 -0.12 -0.81 -1.07 -0.96 88 Anhydrite -2.77 -0.11 -0.11 -0.08 -0.62 -0.53 -0.41 89 Celestite -1.99 -0.16 0.06 0.06 -0.49 -0.70 -0.58 90 Barite 0.68 0.31 0.21 0.21 0.72 0.20 0.45 91 Fluorite -0.42 -0.27 -1.65 -1.93 -1.92 -0.53 -0.12 92 Chalcedony -0.11 0.17 -0.21 -0.38 -1.03 -0.36 -0.37 93 Quartz 0.34 0.52 0.14 -0.04 -0.70 -0.13 -0.15 94 95 Oxidation State at 96 Formation Temp. pE Eh(volts) pE Eh(volts) pE Eh(volts) pE Eh(volts) pE Eh(volts) pE Eh(volts) pE Eh(volts) 97 Pt Electrode -2.07 -0.13 -4.95 -0.32 -1.91 -0.13 98 Calculated from: 99 U02 Satn. -1.07 -0.06 -0.60 -0.04 -1.17 -0.08 -1.66 -0.11 -0.90 -0.06 -1.60 -0.12
100 02(aq)/H20 11.66 0.75 101 02(aq)/H20(Sato) 1.56 0.10 102 As(V)/As(III) < 0.21 0.01 < 0.38 0.03 < -2.09 -0.16 < -2.13 -0.16 103 N2(AQ)/NH4+ -3.28 -0.19 -2.91 -0.19 -3.33 -0.22 -3.06 -0.20 -3.06 -0.21 -4.62 -0.35 104 S04-2/H2S -3.43 -0.20 -3.03 -0.19 -2.82 -0.18 -2.57 -0.17 -2.50 -0.17 -3.82 -0.29 -3.71 -0.28 105 C02/CH4 -4.34 -0.25 -3.71 -0.24 -3.90 -0.25 -3.86 -0.25 -4.01 -0.27 -5.51 -0.42 106 H+/H2(AQ) > -5.95 -0.34 > -5.04 -0.32 > -6.02 -0.39 > -4.42 -0.29 > -5.63 -0.38 > -6.76 -0.52
Table 3.1: Chemistry of water from Weiach borehole. (Page 2 of 2)

NAGRA NTB 86-19 - 50 -
4.0 RINIKEN
The chemistry of groundwaters from five intervals can be reliably determined from samples taken during the drilling and testing of the Riniken borehole. Samples from three intervals, 501.0 to 530.5 m, Schilfsandstein through Gansinger Dolomite, 617.3 to 696.0 m, Upper Muschelkalk, and 793.0 to 820.2 m, Buntsandstein, are Block 1 samples. The results of the analyses of these samples for all but ephemeral constituents such as the carbonate species should accurately reflect the chemistry of the groundwaters from these intervals. Two samples from Permian sediments, from 958.4 to 972.5 m, and from 977.0 to 1010.0 m, contained varying amounts of drilling fluid. The analytical data on these samples required correction as described by WITTWER (1986, Section 5.3.4 and 5.3.5) to be representative of the chemistry of the groundwaters. Samples from a third zone in Permian sediments, from 1354.0 to 1369.0 m, also contained drilling fluid and were corrected by WITTWER (1986, Section 5.3.7). The chemistry of the samples from this last zone was also influenced by cement emplaced with the borehole casing. Because it is not possible to correct for the cement effect, the chemistry of formation water at this interval cannot be determined.
4.1 Schilfsandstein through Gansinger Dolomite 515.7 m (501.0 - 530.5 m) 25-Jul-83 Sample 303/1 Block 1 Reference: WITTWER (1986) Sect. 5.3.1
This zone was drilled with fresh-water mud on 19-Jul-83 with no loss of drilling fluid to the interval. It was tested for two days immediately after drilling, followed by a period of swabbing and a pump test. The sample taken (303/1) is the pump discharge collected at the well head. Its tracer concentration corresponds to less than one.-half per cent drilling fluid, in agreement with its tritium content of < 1.2 TU. This sample is therefore assigned to Block 1.
The chemistry of this water is given in Table 4.1. The concentrations of all dissolved solids, OZ(aq)' COZ(aq) and total H2S are Fresenius analyses. The other dissolved gases are as given by PSI. As Table 4.2 shows, the PSI and AERE analyses of uranium differ by more than a factor of six. The AERE result was used in Table 4.1.
The modeled values of the carbonate system use the measured alkalinityand a pH calculated for saturation with respect to calcite. The calculation also indicates saturation with respect to dolomite, gypsum, celestite and quartz, and undersaturation with fluorite. The strongly positive barite saturation index suggests an erroneously high analyzed barium concentration rather than actual barite oversaturation in the water in the formation.
The pE values calculated from the nitrogen, sulphur and carbon couples, and from the measured platinum electrode potential agree within one unit. According to STUMM AND MORGAN (1981, p. 493), no

NAGRA NTB 86-19 - 51 -
Table 4.2: Uranium concentrations and pE values at uraninite saturation for waters from the Riniken borehole.
Uranium Concentration in micrograms per litre pE Calcu-
lated at Sanple Saq:>le PSI AERE At Calcu- Uraninite Depth NUiber Analysis Analysis lated pE Saturation
----------------
515.7 m 303/1 0.13 0.02 ± 0.004 0.02 -1.53
656.7 m 303/2 0.32 0.23 ± 0.01 0.23 -0.60
806.6 m 303/3 0.20 0.13 ± 0.01 0.13 -0.96 303/4 0.20
965.5 m 303/5b 0.31 ± 0.01 0.31 -0.97
993.5 m 303/6 0.50 0.20 ± 0.01 0.20 -1.06 303/7 0.30 303/8,9 0.60
reversible electrode potentials are established for nitrogen, sulphur or carbon couples.
Only a total arsenic concentration was reported so no pE can be calculated from the arsenic couple. The pE corresponding to uraninite saturation at the uranium concentration chosen is greater than 1.5 units more positive than the other values. Had the other higher uranium concentration been chosen, the difference still would have been greater.
4.2 Upper Muschelkalk 656.7 m (617.3 - 696.0 m) 17-Aug-83 Sample 303/2 Block 1 Reference: WITTWER (1986) Sect. 5.3.2
As in the other boreholes, the Muschelkalk was drilled with saltwater mud after casing had been set at the top of the water-bearing zone. During casing emplacement and drilling to a depth of 659 m, about ten m3 of drilling fluid were lost. A pump test was carried out from 15- to l8-Aug-83 and produced about 620 m3 of fluid. Sample 303/2 was collected at the end of this test from pump discharge at the well head. The tracer concentration of the discharge fell rapidly at the beginning of the test, and at the time the sample was taken corresponded to less than one-half per cent drilling fluid. The sample also contains little tritium « 1.1 TU). It is assigned to Block 1.
The chemistry of the water in the Riniken Muschelkalk is given in Table 4.1. The concentrations of dissolved solids, 02(aq)' CO2 (aq)
and total H2S are Fresenius analyses. The remaining gas concentrations are those analyzed by PSI. The uranium results are shown in Table 4.2. They agree within less than 40 per cent, and the lower AERE value was chosen.

NAGRA NTB 86-19 - 52 -
4.3
4.3.1
The water was modeled using the measured alkalinity and a pH corresponding to calcite saturation. The calculated SIdolomite is -0.19. As discussed in the Introduction, this is probably equivalent to dolomite saturation in water from the Muschelkalk. The sample is saturated with respect to gypsum and chalcedony, but has negative saturation indices for celestite, barite and fluorite.
The pattern of calculated pE values in this sample is like that in the 515.7 m sample discussed in the previous section. The pE values calculated from the nitrogen, sulphur and carbon couples, and from the platinum electrode potential agree within one pE unit, but the value calculated assuming uraninite saturation is more than two units more positive.
Buntsandstein/Perm
Buntsandstein 806.6 m (793.0 - 820.2 m) 16, l7-Sept-83 Samples 303/3/4 Block 1 Reference: WITTWER (1986) Sect. 5.3.3
The Buntsandstein was drilled with de-ionized water through a temporary casing. The zone sampled was of high hydraulic conductivity, but made sand when pumped at a high rate. The de-ionized water was traced with uranin only, and the uranin content of both samples showed negligible (ca. 0.1 per cent) contamination by deionized water. The samples also contained some m-TFMBA which was present as a tracer in the salt mud used to drill the section above the Buntsandstein and remained behind the temporary casing. If the m-TFMBA in the samples represented salt mud contamination, the amount present would have contributed less than 150 mg/l of NaGl or two per cent of the 7000 mg/l salt content of the sample. The low tritium content (0.7 ± 0.7 TU) supports the relatively low possible contamination of this sample and its assignment to Block 1.
The chemistry of water from this zone is given in Table 4.1. The concentrations of the dissolved solid constituents are based on the Fresenius analyses of the pumped (303/3) and GTG pressure vessel (303/4) samples as described in the Introduction. The 02(aq)' G02(aq) and total H2S values are from the field analyses of the pumped sample. The other dissolved gas concentrations are PSI analyses of the pumped (303/3) sample. The uranium results are shown in Table 4.2. The PSI values of the two samples are identical, but the AERE value is 35 per cent lower. The AERE value was used.
This water was modeled using an alkalinity equal value and a pH corresponding calcite saturation. high total dissolved carbonate content and a high also appears to be saturated with respect chalcedony.
to the measured This leads to a Pea. The water
2 b' d to ar~te an
Like the two previous samples from this borehole, the pE values calculated from the nitrogen, sulphur and carbon couples, and the platinum electrode potential agree within about one unit. The pE

NAGRA NTB 86-19 - 53 -
4.3.2
corresponding to uraninite saturation is about two units more positive.
Perm 965.5 m (958.4 - 972.5 m) 4. 5-0ct-83 Samples 303/5b/5c Block 2 Reference: WITTWER (1986) Sect. 5.3.4; Bei1age 5.4
This zone was drilled with traced salt mud, and was developed by swabbing for five days before being sampled by bailer. At the time of sampling, the conductivity had been steady for over two days, and the tracer concentration of the sample indicated a residual drilling fluid contamination of 0.85 per cent. The tritium content reported was < 1.1 TU but it cannot be used to estimate contamination of the chemical sample because the tritium sample was collected from the tubing, not at the surface.
Contamination by only 0.85 per cent would be negligible except that the contaminating drilling fluid was a brine. The major ion concentration of the drilling fluid was analyzed and is given by WITTWER (1986, Table 5.8). As this table also shows, when the analysis of sample 303/5b is corrected for its drilling fluid component, its sodium and chloride concentrations decrease by 13 per cent, its sulphate concentration by four per cent, and its other constituents by less then two per cent.
The chemistry of groundwater from this zone is shown in Table 4.1. The concentrations of dissolved solid constituents are those of the Fresenius analyses of sample 303/5b corrected for drilling fluid contamination by WITTWER (1986, Table 5.9). Because the sample was collected using the Nagra bailer, no gas analyses were made, except those for 02(aq)' CO2 (aq) and total H2S made in the field. The uranium concentration is an AERE result (Table 4.2).
Corrected values of sample density and of residue on evaporation (ROE) are not given by WITTWER (1986). The values in Table 4.1 were calculated as follows:
ROE corr (ROE - 0.85 per cent ROE
b. )/(1-0.85 per cent)
meas r1ne
Density = corr
1 + (Density - 1) • ~TDS /LTDS meas corr meas
The sample was modeled using the measured alkalinity and a pH adjusted for calcite saturation. The resulting total carbonate concentration (10.70 rnrno1) is similar to the values measured by Fresenius (11.83 rnrnol) and by PSI (11.20 rnrnol) , the mean of which was used to reconcile the sample from 993.5 m. This agreement is consistent with the close similarity of other chemical properties of the waters from these two intervals.

NAGRA NTB 86-19 - 54 -
4.3.3
Water from-this zone appears to be saturated with respect to celestite and chalcedony and has a positive barite saturation index. This probably indicates an erroneously high barium concentration rather than actual barite oversaturation.
Only pE values calculated for the sulphur couple and uraninite saturation are available. They are similar to the values calculated for the sample from 993.5 m.
Perm 993.5 m (977.0 - 1010.0 m) 23-Nov-83 Samples 303/6.7.8.9 Block 2 Reference: WITTWER (1986) Sect. 5.3.5
Some 170 m3 of brine mud were lost into this zone while it was being drilled. Before the fluid samples were taken, the zone was developed by pumping and swabbing for a period beginning 19-0ct-83 during which some 800 m3 of formation fluid were removed. When these samples were taken, however, their m-TFMBA content corresponded to contamination of about five per cent, concordant with a tritium content of 2.6 TU. Because of this level of contamination, the samples are assigned to Block 2.
A series of samples were taken during the development period before the final sampling. According to WITTWER (1986, Section 5.3.5), extrapolation from this series leads to sodium and chloride concentrations of the formation fluid between six and eight g sodium/l and between 9.9 and 12. 1 g chloride/I, but suggests little difference in the concentrations of most of the other constituents.
The chemistry of water from this zone is given in Table 4.1. The concentrations of dissolved solid constituents are based on the Fresenius analyses of the.pumped (303/6) and GTG pressure vessel (303/9) samples. If the lowest chloride (9.9 gil) extrapolated from the series of samples taken during development is used, a sodium concentration of 6.6 gil is required for ion charge balance. The composition of the formation water in this zone is thus similar to that from the adjacent zone at 965.5 m described in the previous section.
The density was calculated from the total dissolved solid contents computed from the analysis of 303/6 and from the corrected groundwater composition using the equation given in the previous section.
The uranium concentrations are given in Table 4.2. The AERE value for the pumped sample was used.
This sample was modeled by assuming a total dissolved carbonate content equal to the mean of the Fresenius and PSI analyses and adjusting the pH for calcite saturation. This total carbonate content is close to that calculated for the 965.5 m sample. The two samples are closely similar in other respects as well.

NAGRA NTB 86-19 - 55 -
4.3.4
This water appears to be saturated with respect to celestite but has positive saturation indices for barite and for both chalcedony and quartz. Oversaturation with barite and chalcedony is unlikely, so the positive saturation indices are probably a result of erroneously high barium and silica concentrations.
The pE values calculated from the nitrogen, sulphur and carbon couples agree within about one unit. The value calculated from the platinum electrode potential is about two units more negative, while that calculated from uraninite saturation is over two units more positive. Except for the unusually negative platinum electrode potential, this pattern of pE values is similar to those in the other samples from this borehole.
Perm 1361.5 m (1354.0 - 1369.0 m) 24-Jun. 17-Jul-85 Samples 303/16.17.18.19.20 Block 2 Reference: WITTWER (1986) Sect. 5.3.6: Beilage 5.5
These samples were taken during the observation phase nearly two years after completion of the borehole. The casing and cement grout were perforated and straddle packers set across the intervals given. The zone yielded 0.05 l/min or less even when swabbed from depths of greater than 900 m. After more than three weeks of swabbing, the tracers suggested that the drilling fluid contents of the samples were still 20 to 30 per cent. WITTWER (1986, Section 5.3.5) correlated analyses of samples taken periodically during the swabbing with their tracer contents to extrapolate to the composition of undiluted fluid. These analyses have been assigned to Block 2.
As shown in Table 5.10 of WITTWER (1986), correlation with uranin gives calculated formation concentrations lower than those calculated using m-TFMBA concentrations. Because of the possibility of uranin sorption on the mud present in the fluid used to drill the zone, values from the m-TFMBA calculations were chosen as representative of groundwater from this interval.
Table 4.3 gives the concentrations of solutes in the two least contaminated samples, numbers 303/19 and 20, and of the fluid after correction for contamination. The data are from Beilage 3.20 and Table 5.11, respectively, of WITTWER (1986). Note that the sulphate value in WITTWER's Table 5. 11 is in error. The correct value is given in Table 4.3.
The pH values of samples 19 and 20 are about 11. Such high values usually result from the presence of a hydroxide solid phase such as Ca(OH)2' the mineral portlandite, a cornmon constituent of cement. Because the samples were taken through perforations in the cement grout of the borehole, an effect of portlandite is to be expected.
The influence of cement on water chemistry is so profound that it is not possible to correct for it and reconstruct the chemistry of formation water from this interval. Thus, the analysis corrected for drilling fluid contamination (sample 303/20 Corrected in Table

NAGRA NTB 86-19 - 56 -
Table 4.3: Chemistry of samples and corrected chemistry of water from 1362 m interval of the Riniken borehole.
Analysis No. Date pH Temp. (C) Dens i ty (g/ml)
Lithium (Li+) Sodium (Na+) Potassium (K+) Ammonium (NH4+) Magnesium (Mg+2) Calcium (Ca+2) Strontium (Sr+2) Barium (Ba+2)
Fluoride (F-) Ch loride (Cl-) Bromide (Br-) Sulphate (S04-2) Phosphate (P) Total Arsenic (As) Alkalinity (as HC03-)
Tot. Sulphide (H2S) Sil ica (H2Si03) Borate (B(OH)3)
Dissolved Solids: Sum Residue (110C) Residue (180C)
AS ANALYZED: Bicarbonate Carbonate Hydroxide
Total Alkalinity (meq)
Charge Balance:
MODELED: Bicarbonate Carbonate Hydroxide
Total Alkalinity (meq) Charge Balance:
log P(C02)
Saturation Indices Calcite DoLomi te Gypsum Anhydrite Celest ite Barite Fluor; te Chalcedony Quartz Portlandite
303/19 11- Jut-85
11.00 70
1.0187 mg/l molality
33.9 4.942E-03 10375 4.566E-01 1019 2.637E-02 1.8 1.010E-04
0.049 2.039E-06 529 1.335E-02
38.1 4.400E-04 0.34 2.505E-06
0.37 1.971E-05 16000 4.566E-01 58.2 7.369E-04 1287 1.356E-02
0.007 2.287E-07 0.032 4.322E-07
2015.3 3.342E-02
O.OOOE+OO 11.8 1.529E-04 23.7 3.878E-04
30367 29500 29300
-2.9% -3.5%
n.n. O.OOOE+OO 73.2 1. 233E -03 25.2 1.498E-03
239.3 3.964E-03 5.42%
0.0 1.230E-07 2.6 4.340E-OS
549.5 3.269E-02 2015.3 3.342E-02
-0.44%
-10.0
0.00 -4.39 -0.81 -0.66 -0.22 0.31
-2.45 -2.75 -2.44 -0.33
303/20 15- Jut-85
11.02 70
1.0217 mg/l molality
41.9 6.112E-03 11700 5.153E-01 1036 2.683E-02 1.5 8.420E-05
0.024 9.996E-07 694 1. 753E-02
45.5 5.258E-04 0.48 3.539E-06
0.34 1.812E-05 18040 5.152E-01 68.1 8.629E-04
1395 1.470E-02 0.007 2.288E-07 0.025 3.379E-07
2144.4 3.558E-02
1.05 3.120E-05 14.7 1.906E-04 23.1 3.783E-04
34112 33180 32960
-2.7"10 -3.4%
n.n. O.OOOE+OO 63.0 1.062E-03 54.0 3.212E-03
321.9 5.336E-03 5.93%
0.0 9.530E-08 2.3 3.919E-05
589.8 3.511E-02 2144.4 3.558E-02
0.58%
-, 0.1
0.00 -4.82 -0.72 -0.56 -0.16 0.44
-2.45 -2.68 -2.37 -0.19
303/20 Corrected
11.08 70
1.0282 mg/l molality
54.5 7.980E-03 15210 6.724E-01 1347 3.501E-02
2 1. 127E-04 0.03 1.254E-06 902 2.287E-02
59.2 6.867E-04 0.62 4.588E-06
0.34 1.819E-05 23452 6.723E-01 88.5 1. 126E-03
1814.0 1.919E-02 0.007 2.297E-07 0.026 3.527E-07
2578.5 4.295E-02
1.4 4.175E-05 19 2.472E-04 30 4.931E-04
44243 43100 42800
-2.6% -3.3%
63.0 1.066E-03
128. 1 2 . 131 E -03 6.60%
0.0 7.247E-08 2.4 4.134E-05
702.1 4.195E-02 2578.5 4.295E-02
1.04%
-10.3
0.00 -4.87 -0.60 -0.44 -0.05 0.55
-2.41 -2.64 -2.32 0.00

NAGRA NTB 86-19 - 57 -
4.3) does not represent formation water, but only the grouteffected water in the vicinity of the borehole.
The analyses of samples 303/19 and 20 and the corrected analysis have two major internal inconsistencies.
First, the ionic charges of all three analyses are significantly unbalanced toward cations. Hydroxide (OH-) data are not given by WITTWER (1986), but even when analyzed hydroxide concentrations are considered, the analyses still do not balance satisfactorily. Table 4.3 includes analyzed hydroxide concentrations from the original data sheets and still shows analyzed charge balances of 5.4 and 5.9 per cent.
The second internal inconsistency is that these samples appear to be grossly oversaturated with respect to calcite when they are modeled with their reported carbonate contents.
These inconsistencies can be reconciled as shown in Table 4.3. The reported total carbonate contents were lowered to achieve calcite saturation. As shown by the group of calculated values in the table, this leads to hydroxide concentrations and alkalinities much larger than those measured, and to analyses much more closely balanced in charge. The pH value of the corrected analysis was adjusted for portlandite (Ca(OH)2) saturation. This pH, 11.08, is entirely consistent with the pH values measured on samples 19 and 20.
The resulting waters have Pea values of less than 10-10 bars. It is possible that dissolutiod of CO2 from the air, in which the Pea is about 10-3 . 5 bars, led to the analytical inconsistencies nofed. Samples 19 and 20 are less saturated with respect to portlandite than is the corrected water, consistent with the presence of drilling fluid in these samples.

1 Sample Depth 515.7 m 656.7 m 806.6 m 965.5 m 993.5 m 2 Formation km mo s r r ~ 3 Analysis No. 303/1 303/2 303/3,4 303/Sb,Sc CORRECTED 303/6,9 Gl 4 Date 25-Jul-83 17-Aug-83 16,17-Sep-83 4,S-Oct-83 2,3-Nov-83 S; S Measured pH 8.40 6.78 6.S9 6.90 6.64 6 Pt Elect. Pot. (v) -0.19 -0.20 0.00 -0.34 Z 7 Sample Temp. (IC) 22.9 41.S 31.8 29.4 3S.8 t-3 8 Formation Temp. (IC) 38 4S SO 56 57 t;1j
9 Density (g/ml) 1.0115 1.0097 1.0061 1.010 1.0155 co 10 mg/l molality mg/l molality mg/l molality mg/l molality mg/l molality 0'\
11 Lithiun (Li+) 1.75 2.531E-04 0.81 1. 172E-04 11.3 1.634E-03 19.2 2.782E-03 18.0 2.604E-03 I
I-' 12 Sodiun (Na+) 4263 1.862E-01 3998 1.747E-01 2949 1.288E-01 S191 2.271E-01 6600 2.882E-01 \0
13 Potassiun (K+) 53.8 1.381E -03 45.5 1.169E-03 102 2.619E-03 139.6 3.590E-03 154.8 3.975E-03 14 Rubidiun (Rb+) 0.045 5.286E-07 0.15 1.763E-06 0.79 9.280E-06 0.68 8.001E-06 1.28 1.504E-05 15 Cesiun (Cs+) n.n. 0.08 6.047E-07 0.61 4.608E-06 0.S6 4.237E-06 1 7.554E-06 16 Ammoniun (NH4+) 9.1 5.065E-04 0.66 3.676E-05 0.92 S.120E-05 0.34 1.895E-05 0.82 4.564E-05 17 Magnesiun (Mg+2) 203.4 8.399E-03 209.9 8.674E-03 61.4 2.535E-03 80.6 3.334E-03 80.9 3.341E-03 18 Calciun (Ca+2) 585.1 1.466E-02 873.9 2.191E-02 495.9 1.242E-02 405.9 1.018E-02 467.4 1.171E-02 19 Strontiun (Sr+2) 10.9 1.249E-04 13.50 1.548E-04 15.8 1.810E-04 32.2 3.696E-04 34.0 3.B96E-04 20 Barium (Ba+2) 0.12 B.772E-07 0.02 1.463E-07 0.03 2.193E-07 0.09 6.590E-07 0.12 B.772E-07 21 Radiun (Ra+2) 2.7E-OB 1. 199E-13 2.2E-08 9.779E-14 3.9E-09 1.732E-14 1.5E-OB 6.663E-14 22 Manganese (Mn+2) 0.38 6.944E-06 0.16 2.926E-06 1.50 2.741E-05 0.93 1.702E-05 0.60 1.097E-05 23 Iron (Fe+2) < 13 2.337E-04 < B.S 1.529E-04 < 49.2 B.844E-04 < 15.5 2.791E-04 < 0.93 1.672E-05 24 Nickel (Ni+2) n.n. < 0.002 3.422E-08 < 0.005 B.550E-OB < O.OOS 8.564E-08 < 0.004 6.840E-08 25 Copper (Cu+2) n.n. < 0.002 3.162E-OB < 0.007 1.106E-07 < 0.012 1.899E-07 < 0.011 1.73BE-07 26 Zinc (Zn+2) < 3.4 5.222E-05 < 0.110 1.691E-06 < 0.S2 7.986E-06 < 0.2B 1.846E-07 < 0.15 2.304E-06 27 Lead (Pb+2) n.n. < 0.003 1.455E-08 < 0.002 9.691E-09 < 0.006 2.912E-OB n.n. 28 Aluninum (Al+3) < 0.085 3.163E-06 n.n. n.n. < 0.53 1.975E-05 < 0.022 8.186E-07 29 Uranium 2.0E-OS 8.435E-11 2.3E-04 9.708E-10 1.3E-04 5.483E-10 3.1E-04 1.310E-09 2.0E-04 8.436E-10 30 31 Fluoride (F-) 1.00 5.284E-05 3.1 1.639E-04 1.18 6.236E-05 1.23 6.511E-05 1.04 5.496E-05 32 Chloride (Cl-) 2775 7.858E-02 6008 1.703E-01 4030 1.141E-01 7888 2.237E-01 9900 2.804E-01 V1
33 Bromide (Br-) 6.6 8.292E-05 0.7 8.801E-06 10.2 1.281E-04 29.2 3.675E-04 26.4 3.317E-04 co
34 Iodide (I -) 2.9 2.294E-05 0.03 2.375E-07 0.S3 4.193E-06 0.66 S.230E-06 0.19 1.503E-06 35 Sulfate (S04-2) 7314 7.644E-02 3011 3.149E-02 1850 1.933E-02 1477 1.546E-02 1630 1.704E-02 36 Phosphate (as P) 0.005 1.621E-07 0.08 2.59SE-06 0.04 1.296E-06 0.082 2.662E-06 0.07 2.269E-06 37 Tot. Arsenic (As+5) 0.002 2.680E-OB 0.07 9.387E-07 0.10 0.082 1.101E-06 0.068 9.112E-07 38 Arsenate (As+5) 39 Arsenite (As+3) 40 Alkalinity as HC03- 210.1 3.457E-03 283.4 4.666E-03 765.0 1.259E-02 442.0 7.285E-03 676.5 1.113E-02 41 Bicarbonate (HC03-) 204 3.356E-03 283.4 4.666E-03 765.0 1.259E-02 442.0 7.285E-03 676.5 1. 113E-02 42 Carbonate (C03-2) 3 5.019E-05 n.n. n.n. n.n. n.n. 43 44 Tot. Sulfide (H2S) 0.99 2.916E-05 0.35 1.032E-05 0.01 2.946E-07 O.OOB 2.361E-07 22 6.481E-04 45 Silica (H2Si03) 12.9 1.658E-04 29.6 3.808E-04 35.7 4.589E-04 38.0 4.893E-04 68.3 8.780E-04 46 Borate (8(OH)3) 50.76 8.241E-04 6.77 1.100E-04 35.96 5.839E-04 45.12 7.338E-04 47.9 7.77BE-04 47 Total I ron < 16.2 2.912E-04 < 8.72 1.569E-04 < 53.3 9.582E-04 < 26.4 4.754E-04 < 1.0 1.798E-05 48 Diss. Organic C < 1.4 1.170E-04 < 1.0 8.364E-05 < 0.68 5.684E-OS < 9.2 7.703E-04 < 132 1.103E-02 49 mg/kg molality mg/kg molality mg/kg molality mg/kg molality mg/kg molality 50 Oxygen (02) n.n. n.n. n.n. n.n. n.n. 51 Nitrogen (N2) 43.8 1.588E-03 16.1 5.830E-04 98.B 3.562E-03 106.6 3.880E-03 52 Methane (CH4) 0.01 6.330E·07 0.02 1.265E·06 0.19 1.196E·05 0.46 2.923E-05 53 Hydrogen (H2) < 0.11 5.541E-05 < 0.003 1.510E-06 < 0.18 9.018E-05 < 0.4 2.023E-04 54 Argon (Ar) 0.42 1.068E-05 0.59 1.498E-05 0.94 2.377E-05 0.75 1.914E-05 55 Carbon Dioxide (CO2) n.n. 81 1.867E-03 292 6.702E-03 60 1.385E-03 30 6.950E-04
Table 4.1: Chemistry of water from Riniken borehole. (Page 1 of 2)

1 Sample Depth 515.7 m 656.7 m 806.6 m 965.5 m 993.5 m 2 Formation km mo s r r ~ 3 Analysis No. 303/1 303/2 303/3,4 303/5b,5c CORRECTED 303/6,9 GJ 4 Date 25- Jul-83 17-Aug-83 16,17-Sep-83 4,5-0ct-83 2,3-Nov-83
~ 57 58 Dissolved Solids: mg/kg difference mg/kg difference mg/kg difference mg/kg difference mg/kg difference Z 59 Sum 15409 14344 10021 15584 19483 t-3 60 Residue (11OIC) 15704 1.9% 14970 4.4% 9950 -0.7% 15839 1.6% to 61 Residue (180 C) 15565 1.0% 14710 2.5% 9926 -1.0% 15736 1.0% 00 62 0'\ 63 Charge Balance: 0.08% -0.11% -0.22% -0.19% -0.04% I
64 t--> 1.0
65 Total Dissolved CO2 mg/l molality mg/l molal ity mg/l molality mg/l molality mg/l molal ity 66 Analysed 67 Fresenius 3.407E-03 6.533E-03 1.929E-02 8.669E-03 1.183E-02 68 EIR 5.200E-03 1.120E-02 69 Calculated 70 With Meas. pH 2.747E-03 5.503E-03 1.660E-02 8.197E-03 1.308E-02 71 At Calcite Satn 3.872E-03 6.646E-03 2.518E-02 1.070E-02 1.150E-02 72 73 MODELED VALUES: 74 75 Carbonate System 76 pH 6.94 6.43 6.10 6.39 6.33 77 Carbon Dioxide(C02) 21.0 4.793E-04 87.8 2.005E-03 552.7 1.261E -02 152.4 3.482E-03 173.8 3.965E-03 78 Bicarbonate (HC03-) 205.1 3.374E-03 281.1 4.628E-03 763.2 1.256E-02 436.8 7. 199E-03 456.3 7.508E-03 79 Carbonate (C03-2) 1.1 1.890E-05 0.8 1.354E-05 0.9 1.525E-05 1.5 2.486E-05 1.6 2.703E-05 80 Hydroxide (OH-) 0.2 1.356E-05 0.0 5.247E-07 0.0 8.611E-07 1.2 7.159E-05 0.1 3.355E-06 81 Total Dissolved CO2 3.872E-03 6.646E-03 2.518E-02 1.071E-02 1.150E-02 82 log peC02) -1.68 -1.00 -0.17 -0.67 -0.60 83 84 Saturation Indices: U1 85 Calcite 0.00 0.00 0.00 0.00 0.00 1.0
86 Dolomite -0.05 -0.19 -0.48 -0.27 -0.33 87 Gypsum 0.06 -0.06 -0.36 -0.63 -0.60 88 Anhydrite -0.13 -0.17 -0.42 -0.63 -0.59 89 Celestite 0.05 -0.17 -0.16 -0.05 -0.06 90 Barite 1.03 -0.15 -0.08 0.13 0.21 91 Fluorite -1.36 -0.22 -1.15 -1.39 -1.48 92 Chalcedony -0.35 -0.06 -0.04 -0.06 0.20 93 Quartz 0.05 0.32 0.32 0.29 0.54 94 95 Oxidation State at 96 Formation Temp. pE Eh(volts) pE Eh(volts) pE Eh(volts) pE Eh(volts) pE Eh(volts) 97 Pt Electrode -3.23 -0.20 -3.20 -0.20 0.00 0.00 -5.55 -0.36 98 Calculated from: 99 U02 Satn. -1.53 -0.09 -0.60 -0.04 -0.96 -0.06 -0.97 -0.06 -1.06 -0.07
100 02(aq)/H20 101 02(aq)/H20(Sato) 102 As(V)/As(I I I) 103 N2(AQ)/NH4+ -3.74 -0.23 -2.90 -0.18 -2.50 -0.16 -2.92 -0.19 104 S04-2/H2S -3.40 -0.21 -2.89 -0.18 -2.40 -0.15 -2.80 -0.18 -3.18 -0.21 105 C02/CH4 -4.12 -0.25 -3.69 -0.23 -3.47 -0.22 -3.92 -0.26 106 H+/H2(AQ) > -6.38 -0.39 > -5.09 -0.32 > -5.66 -0.36 > -6.08 -0.40
Table 4.1: Chemistry of water from Riniken borehole. (Page 2 of 2)

NAGRA NTB 86-19 - 60 -
5.0 SCHAFISHEIM
The chemistry of groundwater from five zones in the Schafisheim borehole can be determined. The lower Susswassermolasse (USM) between 553.0 and 563.0 m is represented by samples 304/1 and 2. Two samples were taken from the Muschelkalk. 304/3 was collected during drilling from 1227.8 to 1293.0 m, and 304/14 was taken after completion and casing of the borehole through perforations between 1240.8 and 1261.6 m. Sample 304/6 represents the Buntsandstein/weathered crystalline in the interval from 1476.0 to 1500.4 m. The final samples are from two zones in the crystalline 1564.5 to 1577.7 m, samples 304/8 and 9, and 1883.5 to 1892.3 m, samples 304/10 and 11.
5.1 Lower Susswassermolasse 558.0 m (553.0 - 563.0 m) 20-Dec-83 Samples 304/1,2 Block 1 Reference: WITTWER (1986) Sect. 5.4.1
This zone was drilled with traced freshwater mud on l3-Dec-83. Difficulties with logging and packer installation delayed hydraulic testing, so sampling could not be done before 20-Dec. However, the condition of the drilling fluid changed very little between the time the interval was drilled and the beginning of sampling, so the tracer concentrations can be used with confidence to establish the quality of the samples taken.
The interval was cleaned by swabbing and pumping. On 20-Dec sample 304/1 was taken from the pump discharge at the well head and sample 304/2 was collected using the GTC pressure sampler. Based on their tracer and tritium concentrations, the samples appear to contain less than one per cent drilling fluid and are therefore assigned to Block 1.
The chemistry of this water is given in Table 5.1. The concentrations of dissolved solid species 02(aq)' CO2 (aq) and total H2S are based on the Fresenius analyses of both the pumped and pressure vessel samples as described in the Introduction. The concentrations of the other gases are those given by PSI for the pressure sample because the total gas concentration of the pumped sample is so low as to suggest gas loss before collection.
The results of the uranium analysis are shown in Table 5.2. The AERE result is lower than the PSI values by about a factor of ten. The AERE value is used in Table 5.1.
The modeled values for the carbonate system are based on the mean measured alkalinity and a pH adjusted for calcite saturation. The calculated concentrations of dissolved CO2 species are virtually the same as the analyzed values. This water has a very low sulphate content (five mg/l) and so is strongly undersaturated with the sulphate minerals. The dolomite saturation index, -0.13, suggests slight undersaturation with respect to dolomite with the thermodynamic properties included in the data base. The silica content of the water is equivalent to saturation with respect to quartz.

NAGRA NTB 86-19
Table 5.2:
Saq>le Depth
558.0 m
1260.4 m
1251.1 m
1488.7 m
1571.1 m
1887.9 m
*
- 61 -
Uranium concentrations and pE values at uraninite saturation for waters from the Schafisheim borehole.
Uranium Concentration in micrograms per litre pE calcu-
lated at Saqlle PSI AERE At caLcu- Uraninite Nurber Analysis AnaLysis tated pE Saturation
304/1 0.40 0.05 -1.25 304/2 0.70 0.05 ± 0.004
304/3 0.06 0.90 ± 0.06 0.06 -1.14
304/14 0.03 ± 0.004 0.03 -1.30
304/5 0.06 304/6 trw 0.03 ± 0.004 0.03 -1.57 304/7 0.20
304/8 0.05 0.04 ± 0.004 0.04 -1.66 304/9 trw
304/10 0.20 0.01 ± 0.002 0.20 -1.83 303/8,9 <0.05 0.015 * '3.00
0.015 * -3.50
Calculated assuming uraninite saturation at pE shown.
There is little consistency among the several measures of redox potential in this water. Even though the lowest measured uranium concentration was used (Table 5.2), the potential calculated assuming uraninite saturation is the most positive of all potentials. The relatively high NH/ and CH4 contents of the water lead to negative calculated oxidation potentials. However, no dissolved H2S was detected in these samples. The platinum electrode potential is between the value calculated for uraninite saturation and those from the gas couples.
5.2 Upper Muschelkalk
The Muschelkalk at Schafisheim was sampled twice, first during the drilling phase (304/3) and, over a year later, through perforations in the casing just prior to the start of the long-term observation phase (304/14). Both samples are remarkable for their high H2S content (743 to 950 mg/l) which resulted in rapid corrosion of pumps and other sampling apparatus and made the samples difficult to collect.
Based on its tracer and tritium contents, the first sample appears to contain less than one per cent drilling fluid. Comparison of the concentrations of many dissolved solids in the first sample (304/3) with those of the second (304/14) suggests the first may be diluted by some five per cent. On the other hand, the sodium, chloride, and tritium content of the second sample show that it

NAGRA NTB 86-19 - 62 -
5.2.1
contains about one per cent of brine drilling fluid. Because of these differences, the two samples were not combined to yield a single Muschelkalk water chemistry, but are treated separately in the following sections.
Upper Musche1ka1k 1260.4 m (1227.8 - 1293.0 m) 17-Feb-84 Sample 304/3 Block 1 Reference: WITTWER (1986) Sect. 5.4.2
The interval from the foot of the casing at 1227.8 to 1293.0 m was drilled with traced fresh water on 12- and 13-Feb-84. Several periods of pumping took place, during the last of which, on l7-Feb sample 304/3 was taken. Because of difficulties associated with cold weather and the aggressive high-H2S water being produced, it was not possible to pump long enough to complete the collection of the isotope samples. Based on their tracer and tritium contents, the chemical samples appeared to contain less than one per cent drilling fluid and are therefore assigned to Block 1.
The chemistry of water from this zone is shown in Table 5.1. The dissolved solids, 02(aq) and total HzS values are from the Fresenius analyses of sample 304/3. The concentrations of the other gases are PSI results. As Table 5.2 shows, the AERE and PSI uranium results differ by a factor of 15. The lower PSI value is used in Table 5.1
Modelling the carbonate chemistry of both Muschelkalk samples is not straightforward because of the high total HzS contents of the samples. The maj or dissolved H2S species are H2S (aq) and HS- (aq) . HS- (aq) reacts with acid to form H2S(aq)' and will contribute to the alkalinity of a water sample. At room temperature and below, the temperatures at which these samples were analyzed, HZS(aq) predominates over HS- (aq) at pH values below about seven. Thus, in these samples, with measured pH values of 6.5 and 6.6, the contribution of total H2S to sample alkalinity would have been small. At the temperature of the formation itself, 57.5°C, for which the calculations were made, HS- (aq) dominates over H2S(aq) and so a significant proportion of the total HzS appears in the alkalinity.
The Fresenius measurements of COZ(aq) are made in the field by titrating a sample with an alkaline solution to a pH of about 8.2 (KUSSMAUL AND ANTONSEN, 1985). At the temperatures of the analyses this titration also includes the reaction of HS- (aq) to H2S(aq)' Therefore, it gives a value higher than the COZ(aq) concentration of the sample. The COZ(aq) values given in line 55 of Table 5.1 are for the PSI analyses which were made by mass spectroscopy and so are of COz only. Because of the possibility that the PSI method of sample preparation includes some dissociated HC03 - in the CO2 extracted for analyses, the CO2 concentrations given in WITTWER's (1986) Beilagen and in Table 5.1 are shown as maximtun values.
As line 67 of Table 5.1 shows, the total COz values which are the stuns of the analyzed C03 -2, HC03 -, and COZ(aq) values agree well between the two samples and are somewhat below the total CO2 value

NAGRA NTB 86-19 - 63 -
5.2.2
measured by PSI. For modelling, a total CO2 concentration of l2.S mmol was selected and the pH adjusted for calcite saturation.
The mineral saturation indices for Muschelkalk samples are virtually the same, except for barite. The dolomite value, -0.21, is consistent with that of other waters from the Muschelkalk and suggests saturation with respect to a dolomite about 0.2 units less stable than that included in the thermodynamic data base. Both samples appear to be saturated, or nearly so, with respect to anhydrite, celestite, and for sample 304/3, with barite as well. The Ba+2 concentration of sample 304/14 is more than three times higher than that of 304/3, giving the former sample a strongly positive barite saturation index. Both samples have about the same fluorite saturation index, -0.2, and are saturated with respect to chalcedony,
The various measures of the oxidation potential of both Muschelkalk samples fall within the usual two groups. Values calculated assuming uraninite saturation and the upper limiting values for the arsenic couple are more positive by about two pE units than those calculated from the gas couples. The values based on the platinum electrode potential are noteworthy in these samples because they are so negative, and fall within the range of values calculated from the gas couples. It may be that in these high-H2S waters the platinum electrode is responding to H2S (aq) - SO (aq) couple as suggested by NORDSTROM AND PUIGDOMENECH (1986). Because SO(aq) is not in the thermodynamic data base used for the calculations for this report, this possibility was not tested.
Upper Musche1ka1k 1251.1 m (1240.7 - 1261.6 m) 21-Jan-85 Sample 304/14 Block 2 Reference: WITTWER (1986) Sect. 5.4.7
After completion of the borehole, this interval was perforated so the Muschelkalk would be available for long- term observation. Because the sampling of this zone during the drilling phase was incomplete, the perforated section was cleaned and sampled in Jan-8S.
Following the sampling in Feb-84, described in the preceding section, drilling continued with salt mud. When the interval was cased, this fluid remained behind the casing in contact with the formation. Thus, when the perforations were made, high-conductivity fluid entered the borehole. The interval was pumped, but as with the sampling episode during drilling, there were difficulties maintaining the pumps. Finally, the zone was pumped continuously from 19- to 21-Jan during which time chemical sample 304/14 and a complete suite of isotope samples were collected.
The tracer concentration in the sample suggests the presence of some residual drilling fluid, as does the tritium content of the sample, 1.4 ± 0.7 TU. Because so many fluids were present in the borehole between the times of drilling and sample collection, neither the tracer nor the tritium concentrations can be interpreted quantitatively, although a gross estimate of contamination

NAGRA NTB 86-19 - 64 -
might be about one per cent. Because even such a small amount of brine drilling fluid would have a marked effect on at least the sodium and chloride concentrations of the sample, it is assigned to Block 2.
The chemistry of this sample is given in Table 5.1. The concentration of dissolved solids, except sodium and chloride, 02(aq), e02(aq) and total H2S are from the Fresenius analyses of sample 304/14. These results have been compared with those for sample 304/3, taken during the drilling phase and apparently containing less than one per cent drilling fluid. For lithium, potassium, magnesium, calcium, strontium, fluoride and sulphate, substances which are stable during the sampling process and amenable to precise analysis, the sample averages 1.05 ± 0.02 times the concentration of the earlier one. This could be explained if, in spite of its tracer and tritium concentrations, the earlier sample contained some five per cent fresh water drilling fluid.
The sodium and chloride concentrations given for 304/14 in Table 5.1 are 4700 and 6700 mg/l, respectively, 1.05 times their concentrations in sample 304/3. These concentrations are lower than the analyzed concentrations for sample 304/14 as given in WITTWER (1986). The higher analyzed concentrations probably result from the presence in the sample of some residual brine drilling fluid.
The results of the modelling of this sample are discussed with the other Muschelkalk sample in the preceding section.
5.3 BuntsandsteinfWeathered Crystalline 1488.2 m (1476.0 - 1500.4 m) 29-Mar. 2-Apr-84 Samples 304/4.5.6.7 Block 2 Reference: WITTWER (1986) Sect. 5.4.3: Beil. 5.6
Between 2- and l6-Mar-84 the upper Buntsandstein was drilled with brine mud to a depth of 1481.5 m and temporary casing was installed to 1476 m. Following replacement of the brine mud first with fresh, then with de-ionized water, drilling continued on 18-and 19-Mar into the crystalline to 1500.4 m. After difficulties with packer installation were overcome, hydraulic tests and sampling were carried out between 23-Mar and 2-Apr.
The static water level in this zone is some 50 m below surface so that during the three or four days between the drilling of the zone and the successful packer installation, traced de-ionized drilling fluid could have entered the water-bearing horizons. The fact that the zone is of relatively low permeability limited the quantity of drilling fluid which could enter it, but also limited the amount of water which could be withdrawn from the zone to clean it for sampling.
The interval was swabbed and the progress of development was monitored by samples taken with the Nagra bailer from a depth of 1465 m. Sample 304/4 and 6 were taken from the same depth on 29-Mar and 2-Apr, respectively, with the Preussag sampler. Samples 304/5 and 7 were taken with GTe sampler on 1- and 2-Apr from a depth of 410 m. The samples taken near the end of the sampling period have

NAGRA NTB 86-19 - 65 -
the lowest tracer concentrations, and of those, sample 304/6 from 1465 m, has considerably less tracer than 304/5 and 7 from 410 m (WITTWER, 1986, Beilage 5.6). Tracer measurements suggest that sample 304/6 contains about one per cent drilling fluid, although because of uncertainty in the initial tracer concentrations the sample is assigned to Block 2. A relatively low level of contamination for 304/6 is supported by the tritium analysis of sample 304/5 (1.8 ± 0.7 TU) which contains a much higher tracer content.
The chemistry of water from this zone based on analyses of sample 304/6 is given in Table 5.1. The concentrations of dissolved solids 02(aQ)' CO2 (aq) and total H2S are Fresenius results. The uranium concentrations are given in Table 5.2. The AERE result for sample 304/6 is used in Table 5.1.
The carbonate system was modeled using the measured alkalinity and a pH adjusted for calcite saturation. The modeled water is undersaturated with respect to dolomite and fluorite, but is saturated with anhydrite, celestite, barite and quartz.
Only an upper limiting pE value could be calculated for the arsenic couple. It is more than one pE unit more positive than the value calculated assuming uraninite saturation at the lowest measured uranium concentration (Table 5.2). The values calculated for all the gas couples are at least one unit more negative than the uraninite value.
5.4 Crystalline
5.4.1
During the drilling of the crystalline section of the Schafisheim borehole, three zones for potential sampling were identified by loss of drilling fluid to the formation. The waters from intervals 1565 to 1578 m (samples 304/8 and 304/9) and 1884 to 1892 m (samples 304/10 and 304/11) contained sufficiently little drill fluid to allow interpretation of the formation fluid chemistry. These samples are discussed below.
Crystalline 1571.1 m (1564.5 - 1577.7 m) 29-Apr. 2-May-84 Samples 304/8.9 Block 2 Reference: WITTWER (1986) Sect. 5.4.4
Brine fluid was used to drill this borehole to a depth of 1570 m. After casing installation to 1564 m, the brine drilling fluid was replaced with traced de-ionized water and the borehole was deepened to 1578 m. Before sampling, some 35 m3 of drilling fluid were lost to the formation. The cleaning phase involved swabbing and pumping the borehole. Because of the great loss of drill fluid, about 100 m3 of water were removed from the formation, which reduced the drill-fluid contamination to about two to three per cent. The tritium level of sample 304/8, 2.5 ± 0.7 TU, corresponds well with the level of contamination indicated by drill fluid tracer. Because of the higher contamination level, these samples were given to Block 2.

NAGRA NTB 86-19 - 66 -
5.4.2
The chemistry of the fluid from the crystalline at 1571 m depth is given in Table 5.1. The concentrations of dissolved solid constituents, OZ(aq)' COZ(aq) and total HzS are based on Fresenius values for the pumped sample (304/8) taken at the well head and the GTC pressure sample (304/9) taken at a depth of 430 m. The concentrations of the remaining gases are from the PSI analyses of the pumped sample. The uranium concentrations measured by PSI and AERE agree well as shown in Table 5.2. The AERE value is used in Table 5.1.
Calculations made using the measured alkalinity and the lowest measured pH value,S. 90 from the pressure sample, lead to a slightly negative calcite saturation index and an improbably high total COz of 40 mmol. Thus, this water has been modeled using a total COz content of 22 mmol and a pH adjusted to calcite saturation. The total COz chosen is consistent with the values measured by both Fresenius and PSI. The water so modeled is undersaturated with respect to dolomite, anhydrite and fluorite, and close to saturation with respect to celestite. The barite saturation index is strongly positive, probably due to an erroneously high barium concentration. The silica concentration corresponds to oversatu~ ration with respect to quartz and undersaturation with respect to chalcedony.
The pE values calculated from the measured platinum electrode potential and the assumption of uraninite saturation agree within one unit, and are lower than the upper limiting value given by the arsenic couple. As is common, the values calculated from the nitrogen, sulphur and carbon couples are somewhat lower, while the value calculated from the hydrogen couple is highly negative. This is probably due to the presence in this sample, as in all others, of excess hydrogen resulting from the corrosion of iron tools in the borehole.
Crystalline 1887.9 m (1883.5 - 1892.3 m) 11. 18-Jun-84 Samples 304/10.11 Block 1 Reference: WITTWER (1986) Sect. 5.4.5
The loss of drilling fluid to the formation within this interval required the removal of large volumes of groundwater to minimize contamination. The borehole was cleaned by removing more than 200 m3 by pumping. As the tracer concentration in the pumped fluid fell below one per cent, a corresponding increase in electrical conductivity was observed. The tritium concentration in the formation water before sampling was 1.5 ± 0.9 TU. Sample 304/10 was taken at the head of the borehole and sample 304/11 was taken using the GTC sampler at a depth of 304 m. These samples are considered Block 1.
The chemistry of the waters from the crystalline at 1888 m depth is given in Table 5.1. The concentrations of the dissolved solid constituents, 0Z(aq)' CO2 (aq) and total HzS are based on Fresenius analyses of samples 304/10 and 11. The concentration of the remaining gases is from the PSI analyses of the pumped sample. As Table 5.2 shows, there is considerable disagreement among the

NAGRA NTB 86-19 - 67 -
various concentrations reported. used in Table 5.1.
The value reported by AERE is
The values for the carbonate system were modeled using the analyzed alkalinity and a pH adjusted for calcite saturation. The resulting total carbonate value is slightly above, but consistent with, the values measured by PSI and Fresenius. The modeled water is undersaturated with respect to all minerals except barite, and its silica concentration corresponds to oversaturation with respect to quartz and saturation with respect to chalcedony.
As Table 5.2 shows, the AERE uranium concentration is below saturation with uraninite, even at pE values low enough that virtually all dissolved uranium is in the reduced U(IV) state. A minimum uranium concentration of 0.015 ~g/l is required for uraninite saturation in this water. This is probably equivalent within the uncertainty of measurement to the value reported by AERE.
The pE calculated from the platinum electrode potential measurement is more positive than even the upper limiting value from the arsenic couple, and thus is probably incorrect. The values calculated from the nitrogen and sulphur couples are similar, while the carbon value is somewhat lower, and the hydrogen value is considerably lower. As Table 5.2 shows, the low measured uranium concentration would be consistent with pE values no higher than those of the nitrogen and sulphur couples.

1 Sample Depth 558.0 m 1260.4 m 1251.1 m 1488.2 m 1571.1 m 1887.9 m 2 Formation USM mo mo s-KRI KRI KRI ~ 3 Analysis No. 304/1,2 304/3 304/14 304/6 304/8,9 304/10,11 C) 4 Date 20-Dec-B3 17-Feb-B4 21-Jan-85 2-Apr-84 2-May-84 17,18-Jun-84
~ 5 Measured pH 7.80 6.51 6.60 6.60 5.90 6.78 6 Pt Elect. Pot. (v) -0.15 -0.23 -0.17 -0.14 0.05 Z 7 Sample Temp. (IC) 16.1 23.5 10.5 17.4 30.0 30.7 t-3 8 Formation Temp. (IC) 30 57.5 57.5 68 72 85 to 9 Dens ity (g/ml) 1.0046 1.0152 1.0126 1.0106 1.0047 1.0045 ex> 10 mg/l molality mg/l molality mg/l molality mg/l molality mg/l molality mg/l molal ity 0'\
11 Lithium (Li+) 1.9 2.749E-04 6.2 B.931E-04 6.5 9.394E-04 14.4 2.085E-03 8.15 1.178E-03 14.5 2.096E-03 I
12 Sodium (Na+) 3032 1. 324E -01 4490 1.953E-01 4700 2.051E-Ol 4955 2.166E-01 2360 1.030E-01 2712 1.184E-01 !---1 1..0 13 Potassium (K+) 19.1 4.905E-04 112.5 2.B77E-03 115 2.950E-03 132.1 3.396E-03 90.4 2.319E-03 168.2 4.317E-03
14 Rubidium (Rb+) 0.01 1.175E-07 0.28 3.276E-06 0.22 2.582E-06 0.5 5.880E-06 0.54 6.338E-06 2.5 2.935E-05 15 Cesium (Cs+) 0.04 3.009E-07 0.05 3.774E-07 0.42 3.176E-06 0.36 2.717E-06 0.91 6.871E-06 16 Ammonium (NH4+) 2.6 1.447E-04 6.1 3.381E-04 5.7 3.170E-04 0.25 1.393E-05 2.20 1.223E-04 0.72 4.005E-05 17 Magnesium (Mg+2) 68.1 2.813E-03 173.8 7.148E-03 184.0 7.592E-03 66.8 2.762E-03 29.2 1.205E-03 21.0 8.668E-04 18 Calcium (Ca+2) 208.8 5.231E-03 743.1 1.854E-02 784.0 1.962E-02 531.8 1.334E-02 293.0 7.333E-03 88.0 2.203E-03 19 Strontium (Sr+2) 20.4 2.338E-04 16.9 1.929E-04 18.0 2.061E-04 17.8 2.042E-04 11.4 1.305E-04 15.7 1.798E-04 20 Barium (Ba+2) 0.47 3.436E-06 0.041 2.985E-07 0.14 1.023E-06 0.045 3.293E-07 0.25 1.826E-06 0.13 9.499E-07 21 Radium (Ra+2) 1.2E-08 5 .331E -14 1.8E-08 7.963E-14 5.3E-09 2.352E-14 1.6E-08 7.115E-14 1.3E-08 5.770E-14 3.0E-10 1.332E-15 22 Manganese (Mn+2) 0.36 6.580E-06 0.15 2.730E-06 0.29 5.295E-06 0.54 9.880E-06 1.32 2.410E-05 0.92 1.680E-05 23 Iron (Fe+2) < 2.45 4.405E-05 < 1.9 3.402E-05 < 4.2 7.544E-05 < 46.5 8.369E-04 < 58.7 1.054E-03 < 45 8.086E-04 24 Nickel (Ni+2) < 0.004 6.B41E-08 < 0.004 6.812E-08 < 0.002 3.417E-08 < 0.003 5. 136E-08 n.n. n.n. 25 Copper (Cu+2) < 0.004 6.321E-08 < 0.02 3.147E-07 < 0.041 6.473E-07 < 0.002 3.164E-08 n.n. < 0.003 4.738E-08 26 Zinc (Zn+2) < 0.11 1.690E -06 < 2.70 4.130E-05 < 4.00 6.138E-05 < 0.016 2.460E-07 < 0.58 < 0.15 2.303E-06 27 Lead (Pb+2) < 0.04 1.939E-07 < 0.01 4.826E-08 < 0.003 1.452E-08 < 0.002 9.703E-09 < 0.006 2.905E-08 n.n. 28 Aluminum (Al+3) < 0.17 6.326E-06 < 0.016 5.929E-07 < 0.09 3.346E-06 < 0.002 7.451E-08 < 0.03 1.115E-06 < 0.014 5.207E-07 29 Uranium 5.0E-05 2.109E-l0 6.0E-05 2.520E-10 3.0E·05 1.264E-l0 3.0E-05 1.267E-l0 4.0E-05 1.686E -10 1.0E-05 4.216E-11 30 31 Fluoride (F-) 1.46 7.716E-05 3.93 2.068E-04 4.20 2.218E-04 2.20 1. 164E-04 2.08 1.098E-04 7.72 4.078E-04 32 Chloride (Cl-) 5208 1.475E-Ol 6400 1.805E-Ol 6700 1.896E-Ol 6405 1.816E-Ol 2420 6.847E-02 3555 1.006E-Ol 0'\ 33 Bromide (Br-) 20.3 2.551E-04 6.6 8.258E-05 5.6 7.030E-05 11.6 1.459E-04 5.7 7.155E-05 9.9 1.243E-04 ex> 34 Iodide (I -) 7.9 6.251E-05 0.36 2.836E-06 0.48 3.794E-06 0.41 3.247E-06 0.35 2.767E-06 0.24 1.898E-06 35 Sulfate (S04-2) 5 5.226E-05 2805 2.920E-02 2850 2.976E-02 3083 3.226E-02 2022 2.111E-02 793 8.2B4E-03 36 Phosphate (as P) 0.15 4.863E-06 0.10 3.228E-06 0.03 9.716E-07 0.30 9.736E-06 0.057 1.846E-06 0.08 2.592E-06 37 Tot. Arsenic (As+5) 0.001 1.340E-08 38 Arsenate (As+5) < 0.005 6.673E-08 < 0.005 6.694E-08 < 0.005 6.708E-08 < 0.005 6.695E-08 < 0.005 6.697E-08 39 Arsenite (As+3) 0.41 5.472E-06 0.045 6.025E-07 0.004 5.367E-08 0.22 2.946E-06 0.096 1.286E-06 40 Alkalinity as HC03- 134.6 2.214E-03 429.0 7.030E-03 477.0 7.842E-03 610.0 1.005E-02 875.5 1.439E-02 890.5 1.465E-02 41 Bicarbonate (HC03-) 131.5 2.164E-03 429.0 7.030E-03 477.0 7.842E-03 610.0 1.005E-02 875.5 1.439E-02 890.5 1.465E-02 42 Carbonate (C03-2) 1.5 2.510E-05 n.n. n.n. n.n. n.n. n.n. 43 44 Tot. Sulfide (H2S) n.n. 743 2.180E-02 950 2.796E-02 0.32 9.438E-06 0.083 2.443E-06 0.072 2.120E-06 45 Silica (H2Si03) 9.9 1. 273E-04 44.8 5.735E-04 46.3 5.947E-04 32.6 4. 196E-04 46.1 5.921E-04 68.6 8.814E-04 46 Borate (B(OH)3) 13.32 2.163E-04 36.4 5.886E-04 34.3 5.564E-04 55.7 9.055E-04 48.44 7.859E-04 63.31 1.027E -03 47 Total I ron < 3.3 5.933E-05 < 4.45 7.967E-05 < 4.9 8.B01E-05 < 125 2.250E-03 < 82.7 1.485E-03 < 48.7 8.751E-04 48 Diss. Organic C < 1.9 1.588E-04 < 4.0 3.330E-04 < 9.4 7.850E-04 < 95 7.950E-03 < 3.3 2.756E-04 < 0.3 2.506E-05 49 mg/kg molality mg/kg molality mg/kg molality mg/kg molality mg/kg molality mg/kg molal ity 50 Oxygen (02) n.n. n.n. n.n. n.n. n.n. n.n. 51 Nitrogen (N2) 31.6 1.138E -03 67.2 2.435E-03 8.9 3.227E-04 153.8 5.577E-03 161.5 5.810E-03 880.5 3.168E-02 52 Methane (CH4) 448.3 2.819E-02 143.1 9.054E-03 27.5 1.741E-03 4.32 2.735E-04 1.82 1.143E-04 7.19 4.518E-04 53 Hydrogen (H2) < 0.02 1.001E-05 < 0.6 3.021E-04 < 0.03 ' 1.512E-05 < 0.02 1.008E-05 < 0.85 4.249E-04 < 1.45 7.250E-04 54 Argon (Ar) 0.47 1.187E-05 1.29 3.278E-05 0.21 5.340E-06 1.19 3.026E-05 1.49 3.759E-05 6.16 1.554E-04 55 Carbon Dioxide (CO2) 5 1.146E-04 < 246 5.674E-03 < 215 4.962E-03 186 4.293E-03 350 8.015E-03 182 4. 169E-03
Table 5.1: Chemistry of water from Schafisheim borehole. (Page 1 of 2)

1 Sample Depth 558.0 m 1260.4 m 1251.1 m 1488.2 m 1571.1 m 1887.9 m 2 Formation USM mo mo s-KRI KRI KRI ~ 3 Analysis No. 304/1,2 304/3 304/14 304/6 304/8,9 304/10,11 GJ 4 Date 20-Dec-83 17-Feb-84 21-Jan-85 2-Apr-84 2-May-84 17,18- Jun-84 ~ 57
58 Dissolved Solids: mg/kg difference mg/kg difference mg/kg difference mg/kg di fference mg/kg difference mg/kg difference Z 59 SlII1 8689 15056 15696 15745 7824 7990 r-3 60 Residue (110/C) 8985 3.4% 15914 5.7% 18480 17.7% 15993 1.6% n15 -1.4% 7854 -1. 7"10 b:l 61 Residue (180 C) 8920 2.7% 15713 4.4% 18460 17.6% 15880 0.9% 7656 -2.1% 7852 -1. 7% co 62 0'\ 63 Charge Balance: -0.14% 2.04% 2.76% -0.00% 0.65% 0.49"10 I
f-I 64 1.0 65 Total Dissolved CO2 mg/l molal ity mg/l molality mg/l molality mg/l molality mg/l molality mg/l molal ity 66 Analysed 67 Fresenius 2.304E-03 < 1.270E-02 < 1.280E-02 1.434E-02 2.241E-02 1.881E-02 68 EIR 1.390E-02 2.020E-02 2.300E-02 69 Calculated 70 With Meas. pH 2.174E-03 1.297E-02 4.002E-02 1.818E-02 71 At Calcite Satn 2.314E-03 1.250E-02 1.250E-02 2.086E-02 2.200E-02 2.601E-02 72 73 MODELED VALUES: 74 75 Carbonate System 76 pH 7.34 6~ 17 6.16 6.05 6.13 6.30 77 Carbon Dioxide(C02) 6.2 1.419E-04 238.9 5.427E-03 240.4 5.478E-03 475.0 1.085E-02 494.8 1.128E-02 501.6 1.144E-02 78 Bicarbonate (HC03-) 130.9 2.154E-03 430.6 7.055E-03 426.1 7.004E-03 606.2 9.986E-03 650.8 1.070E-02 882.7 1.452E-02 79 Carbonate (C03-2) 1.1 1.813E-05 1.0 1. 745E-05 1.0 1.739E-05 1.5 2.449E-05 1.3 2.207E-05 3.4 5.636E-05 80 Hydroxide (OH-) 0_4 2.611E-05 0.0 7.800E-07 0.0 2.031E-06 0.0 2.027E-06 0.1 5.730E-06 0.2 1.084E-05 81 Total Dissolved CO2 2.314E-03 1.250E-02 1.250E-02 2.086E-02 2.200E-02 2.601E-02 82 log P(C02) -2.31 -0.47 -0.46 -0.10 -0.75 -0.00 83 84 Saturation Indices: 0'\ 85 Calcite 0.00 0.00 0.00 0.00 0.00 0.00 1.0
86 Dolomite -0.13 -0.21 -0.21 -0.53 -0.68 -0.45 87 Gypsum -3.12 -0.16 -0.15 -0.24 -0.44 -1.25 88 Anhydrite -3.40 -0.14 -0.13 -0.11 -0.28 -0.97 89 Celestite -2.46 -0.10 -0.08 0.01 -0.11 -0.33 90 Barite -1.02 -0.01 0.51 -0.01 o.n 0.06 91 Fluorite -0.95 -0.24 -0.19 -0.88 -1.04 -0.45 92 Chalcedony -0.39 -0.00 0.02 -0.23 -0.13 -0.07 93 Quartz 0.03 0.34 0.36 0.08 0.17 0.21 94 95 Oxidation State at 96 Formation Temp. pE Eh(volts) pE Eh(volts) pE Eh(volts) pE Eh(volts) pE Eh(volts) pE Eh(volts) 97 Pt Electrode -2.61 -0.16 -3.91 -0.26 -3.02 -0.20 -2.33 -0.16 0.83 0.06 98 Calculated from: 99 U02 Satn. -1.25 -0.08 -1.14 -0.07 -1.30 . -0.08 -1.57 -0.11 -1.67 -0.11 See Text
100 02(aq)/H20 101 02(aq)/H20(Sato) 102 As(V)fAs( II I ) < -0.63 -0.04 < -0.13 -0.01 < 0.29 0.02 < -0.78 -0.05 < -1.23 -0.09 103 N2(AQ)/NH4+ -3.94 -0.24 -3.05 -0.20 -3.16 -0.21 -2.57 -0.17 -3.08 -0.21 -3.26 -0.23 104 S04-2/H2S -3.17 -0.21 -3.16 -0.21 -2.70 -0.18 -2.76 -0.19 -3.12 -0.22 105 C02/CH4 -5.03 -0.30 -4.06 -0.27 -3.96 -0.26 -3.88 -0.26 -3.97 -0.27 -4.41 -0.31 106 H+/H2(AQ) > -6.40 -0.38 > -6.00 -0.39 > -5.34 -0.35 > -5.15 -0.35 > -6.04 -0.41 > -6.34 -0.45
Table 5.1: Chemistry of water from Schafisheim borehole. (Page 2 of 2)

NAGRA NTB 86-19 - 70 -
6.0
6.1
6.1.1
KAISTEN
Buntsandstein/Perm
Buntsandstein 113.5 m (97.0-129.9 m) 22-Feb-84 Sample 305/1 Block 1 Reference: WITTWER (1986) Sect. 5.5.1
The interval was drilled with traced fresh water and developed by pumping. When the chemical sample 305/1 was taken, the tracer concentration corresponded to less than one per cent drilling fluid. This low level of contamination is confirmed by the tritium content of this sample (0.4 ± 0.2 TU), and it is assigned to Block 1.
The chemistry of water in this zone is given in Table 6.1. Because of the relatively shallow depth of the interval, no pressure vessel sample was taken. The concentrations of dissolved solid constituents, 02(aq)' CO2 (aq) and total H2S are those of the Fresenius analyses of sample 305/1. The gas concentrations are from the PSI analyses. The uranium results are shown in Table 6.2, and are in reasonable agreement. A rounded value of 14 ~g/l based on the AERE analysis is used in Table 6.1.
Table 6.2:
S~le Depth
Uranium concentrations and pE values at uraninite saturation for waters from the Kaisten borehole.
Uranitn Concentration in micrograms per litre pE Calcu-
lated at S~le PSI AERE At Calcu- Uraninite NU1ber Analysis Analysis lated pE Saturation
--------------------------~----------------------
113.5 m 305/1 15.1 13.94 ± 0.56 14 0.53
284.3 m 305/2 0.30 0.50 ± 0.02 0.50 -1.28 305/3 0.20
310.4 m 305/4 0.20 0.18 ± 0.02 0.18 -1.57 305/5 0.20
482.6 m 305/6 0.30 0.14 ± 0.01 0.14 -1.66 305/7 0.10
819.4 m 305/9 0.20 0.11 ± 0.01 0.11 -1.59 305/11 0.10
1031.0 m 305/12 0.10 0.03 ± 0.004 0.10 -1.70 305/13 0.20 0.03 -2.16
1153.3 m 305/14 0.06 ± 0.01 0.06 -2.08
1271.9 m 305/16 6.57 4.29 ± 0.26 4.3 -1.09 305/17 2.26

NAGRA NTB 86-19 - 71 -
6.1.2
The modeled values for the carbonate system are based on the measured alkalinity and a pH adjusted for calcite saturation. The calculated concentrations of CO2 (aq) and total CO2 are similar to, but somewhat larger than, the values measured by Fresenius. The saturation indices suggest this water is undersaturated with respect to dolomite, gypsum and fluorite, and about saturated with respect to celestite. The apparent barite oversaturation may well be the result of an erroneous barium analyses. The silica content of the sample corresponds to oversaturation with respect to quartz and undersaturation with respect to chalcedony.
pE values are available for the nitrogen, sulphur, carbon, and hydrogen couples, the arsenic couple, uraninite saturation, and a measured platinum electrode potential. The nitrogen, sulphur and carbon couples agree within one pE unit, while a lower limiting value based on the hydrogen couple is about two units more negative. The nitrogen, sulphur, and carbon couples react so sluggishly that they are unlikely to exert any influence on other solution redox reactions. The hydrogen value is probably an artifact of the presence of excess hydrogen in the water from the corrosion of metallic iron in the borehole.
The pE value calculated from the arsenic couple and uranini te saturation agree within 0.15 pE units. These may well represent the behaviour to be expected of other redox reactions in the water. The pE corresponding to the measured platinum electrode potential is about 1.5 units more positive and suggests difficulties with that measurement.
Perm 284.3 m (276.0 - 292.5 m) 1-Mar-84 Samples 305/2.3 Block 1 Reference: WITTWER (1986) Sect. 5.5.2
Some loss of drilling fluid into this zone occurred during drilling. However, the interval was pumped before sampling and the residual contamination of the samples, based on both their tracer and tritium contents, was less than one per cent. Thus, they are Block 1 samples.
The chemistry of water from this zone is given in Table 6.1. The concentrations of dissolved solid constituents and 02(aq)' CO2 (aq)
and total H2S are based on the Fresenius analyses of the pumped (305/2) and GTC pressure vessel (305/3) samples as described in the Introduction. The concentrations of the other gases are from the PSI analyses of the pumped sample. The uranium concentrations, shown in Table 6.2, differ by more than a factor of two. The AERE value was used in Table 6.1.
This sample is unusual among the Nagra borehole samples in that calculations using the mean alkalinity and the lowest measured pH (7.23) lead to a strongly negative calcite saturation index (-0.37). Calcite undersaturation is as improbable geochemically as calcite oversaturation in deep groundwater of this type and suggests either a gross error in the pH value reported, or that the sample included some spurious CO2 (aq)' The sample was there-

NAGRA NTB 86-19 - 72 -
fore modeled beginning with the higher measured pH, 7.96, which was then adjusted in the usual way for calcite saturation. It is of interest to note that the pH calculated for calcite saturation (7.61) is close to the range measured by the field monitoring programme (7.5 to 7.6).
This water appears to be undersaturated with respect to dolomite and all sulphate minerals except barite. It appears to be saturated with respect to both barite and fluorite and has a Si02 content corresponding to oversaturation with respect to both chalcedony and quartz.
The pE values from the arsenic couple and uraninite saturation agree wi thin 0.4 units while the values for the nitrogen and carbon couples are, as usual, considerably more negative. The pE corresponding to the platinum electrode potential is so much more positive than the arsenic and uraninite values that it suggests some difficulty with the measurement.
6.2 Crystalline
6.2.1
The crystalline at Kaisten was drilled using a wireline coring device. This technique gave rise to high drill-fluid pressures at the bit leading to significant losses of drilling fluid to the formation. Nonetheless, the tracer and tritium contents of the samples from the crystalline described in this section were low enough that all samples are assigned to Block 1.
Crystalline 310.4 m (299.3 - 321.5 m) 15. 16-Mar-84 Samples 305/4,5 Block 1 Reference: WITTWER (1986) Sect. 5.5.3
This section of the crystalline was drilled with traced de-ionized water and developed by swabbing and pumping. Prior to the start of sampling of this flowing zone, casing was cemented in place. To maintain tracer concentration in the borehole, the drilling fluid was replaced several times. Very small amounts of drilling fluid were lost to the formation. Sample 305/4 was collected at the well head when tracer concentrations corresponded to 0.8 to 0.4 per cent drilling fluid. With this small amount of contamination and tritium concentrations measuring 1.1 ± 0.7 TU, the sample was assigned to Block 1. Formation fluid was also collected using the GTC pressure sampler (sample 305/5). Tracer concentrations for this water indicated 0.5 to 0.02 per cent drilling fluid.
The chemistry of the fluid from the crystalline at 310 m depth is presented in Table 6.1. The concentrations of dissolved solids 0Z(aq)' COZ(aq) and total HzS are based on values for the pumped sample and the pressure sample as reported by Fresenius. The remaining gases are PSI results on the pumped sample. The uranium concentrations, given in Table 6.2, agree well. The AERE value was used in Table 6.1.

NAGRA NTB 86-19 - 73 -
6.2.2
The modeled values for the carbonate system are based on the measured alkalinity and a ph adjusted for calcite saturation. This sample, together with the samples from the 482.6 and 819.4 m zones of this borehole, are unusual among waters from the Nagra boreholes because the measured properties of their carbonate systems give calcite saturation indices close to zero. Thus, there is little difference between their modeled and analyzed pH and carbonate values. For this sample, for example, the pH at calcite saturation is 7.61, close to the measured value of 7.67 (Table 6.1, line 5). Likewise, the concentrations of CO2 (aq) (12 mg/l measured vs. 14.1 mg/l modeled) and total dissolved CO2 (7.177 mmol measured vs. 7.187 mmol modeled) agree well.
The saturation indices for other minerals indicate undersaturation with respect to dolomite and all sulphate minerals except barite. The positive barite value is probably due to an erroneously high barium concentration. The saturation indices of both fluorite and chalcedony are close to zero, suggesting that the water is saturated with respect to these minerals.
pE values calculated from the arsenic couple, uraninite solubility, and the measured platinum electrode potential agree within one unit and probably represent the range of conditions likely to influence other redox reactions in the system. As is common, the pE values for the nitrogen and hydrogen couples are more negative.
Crystalline 482.6 m (475.5 - 489.8 m) 3. 4-Apr-84 Samples 305/6.7 Block 1 Reference: WITTWER (1986) Section 5.5.4
During drilling of this interval, some fluid loss occurred between 360 and 380 m. Between 410 and 460 m, 0.6 to 1.6 m3/h of drilling fluid was lost. Fresh traced drilling fluid was added to the borehole prior to the cleaning phase to establish control for drill-fluid tracer concentration. Sample 305/6, taken at the well head, showed minimal contamination from drill fluid (0.9 to 0.6 per cent). Tritium levels were correspondingly low at 1.3 ± 0.7 TU. The GTC pressure sample (305/7) also contained minimal contamination (0.6 per cent). As a result of these low contamination levels, both of these samples were assigned to Block 1.
The compilation of chemical constituents in the sample waters from this zone is found in Table 6.1. The concentrations of dissolved solids 02(aq)' CO2 (aq) and total H2S are based on the Fresenius analyses of the pumped (305/6) and GTC pressure (305/7) samples. The remaining gas concentrations are PSI analyses of the pumped sample. As Table 6.2 shows, the PSI and AERE uranium analyses of the pumped sample (305/4) differ by more than a factor of two, but the PSI value for the pressure vessel sample is close to the AERE value. The AERE result is used in Table 6.1.
The modeled values for the carbonate system are based on the measured alkalinity and a pH adjusted for calcite saturation. Like the sample from the 310.4 m zone discussed in the previous section, the analyzed properties of the carbonate system are very

NAGRA NTB 86-19 - 74 -
6.2.3
close to those corresponding to calcite saturation. As Table 6.1 shows, there is little difference between measured and modeled values of pH (7.64 measured vs. 7.57 modeled), CO2 (aq) (14 mg/l measured VS. 13.1 mg/l modeled) and total dissolved CO2 (6.549 mmol analyzed VS. 6.492 mmol modeled).
The saturation indices are strongly negative for dolomite and all sulphate minerals except barite, suggesting undersaturation with respect to these minerals. The saturation indices of barite, fluorite, and chalcedony are virtually zero, indicating saturation with respect to these minerals.
The pE value calculated from uraninite saturation is within one unit of the upper limiting value calculated for the arsenic coupIe. As is common, the values calculated from the nitrogen, carbon, and hydrogen couples are more negative.
Crystalline 819.4 m (816.0 - 822.9 m) 2. 3-May-84 Samples 305/9.10.11 Block 1 Reference: WITTWER (1986) Sect. 5.5.6
Within this interval a highly fractured section of rock was encountered at 820 m. Losses of drilling fluid to the interval were minimized by a rapid change over from drilling to testing phase. Because of the high artesian flow, only pumping was required to clean the interval in preparation for sampling. Sample 305/9 was taken from the pumped discharge on 2 -May-84 and had a tracer concentration corresponding to about 2.5 per cent drilling fluid. During subsequent pumping to collect samples for isotopic analyses, the tracer concentration dropped to values corresponding to 0.6 per cent or less drilling fluid. A second pumped sample (305/10) and a GTC pressure sample (305/11) were then taken. No tri tium measurements were. made on the latter samples, but the first sample contained 0.9 ± 0.7 TU. All three samples are assigned to Block 1, but data from the latter two samples were emphasized in developing this consistent data set.
The chemistry of water from this zone is given in Table 6.1. The concentrations of the dissolved solids and 02(aq) are based on Fresenius analyses of samples 305/10 and 305/11. Analyses for some constituents were made only on the first pumped sample (305/9). These include Fresenius field measurements of CO2 (aq) and total H2S. The remaining gas concentrations were derived from PSI analyses of sample 305/9. Uranium concentrations are given in Table 6.2. The PSI and AERE values for the first pumped sample (305/9) differ by a factor of nearly two. The AERE value agrees well with the PSI value from the GTC sample, however. The AERE result is used in Table 6.1.
The modeled values for the carbonate system are based on measured alkalinity and a pH adjusted for calcite saturation. Like the samples from the 310.4 m and 482.6 m intervals discussed in the previous sections, the analyzed properties of the carbonate system in this water are very close to those corresponding to calcite saturation. As Table 6.1 shows, there is little difference
NAGRA NTB 86-19 - 75 -
6.2.4
between measured and modeled values of pH, CO2 (aq)' and total dissolved CO2 ,
The saturation indices are strongly negative for dolomite and all sulphate minerals except barite. The barite saturation index is slightly negative, but this may due to an erroneously low barium concentration rather than to undersaturation of the water with respect to that mineral. The saturation index for fluorite is close enough to zero to suggest saturation with respect to that mineral. The silica content corresponds to oversaturation with respect to both chalcedony and quartz, and, therefore, is probably high.
The pE values calculated from the arsenic couple and from uraninite saturation agree within one pE unit, and probably represent the range of conditions likely to influence other redox couples in the system. As is cornmon, the pE values calculated from the nitrogen, carbon and hydrogen couples are considerably more negative.
Crystalline 1031.0 m (1021.0 - 1040.9 m) 5. 6-Jun-84 Samples 305/12.13 Block 1 Reference: WITTWER (1986) Sect. 5.5.7
This test interval was chosen because of a sudden increase in artesian outflow from the borehole during drilling. Because of the high volume of outflow (about 40 m3 prior to sampling), drill fluid contamination was reduced quickly to 0.2 per cent. Tritium concentrations fell below 0.8 TD. The water samples from this interval were therefore assigned to Block 1.
The chemistry of water from the 1031 m sample interval is presented in Table 6.1. The concentrations of dissolved solids, 02(aq)' CO2 (aq) and total H2S are based on Fresenius analyses of the artesian discharge (305/12) and a GTC sample (305/13). The remaining gas concentrations are from the PSI analyses of the surface sample. The uranium values reported are given in Table 6.2. For reasons discussed below, the PSI value for sample 305/12 was used in Table 6.1.
The modeled values for the carbonate system are based on the measured alkalinity and a pH adjusted for calcite saturation. The calculated concentrations of CO2 (aq) and total CO2 are similar to, but somewhat larger than, the values measured by Fresenius. The saturation indices for this water are strongly negative for dolomite and all sulphate minerals except barite. The barite saturation index is virtually zero, suggesting saturation of the water with respect to this mineral. The fluorite saturation index suggests slight undersaturation with respect to this mineral, while both chalcedony and quartz saturation indices are positive, suggesting an erroneously high reported silica content.
The pE values calculated from the arsenic couple and the platinum electrode potential are virtually identical, while the uraninite pE is less than one unit more negative. The range defined by

NAGRA NTB 86-19 - 76 -
6.2.5
these three values is similar to the ranges in other samples from the more shallow crystalline in this borehole. As Table 6.2 shows, a pE value calculated using the lower AERE uranium concentration for this zone is considerably more negative.
The pE values calculated from the nitrogen, carbon, and hydrogen couples are more negative. The nitrogen and carbon couples react so slowly that they probably have no significant influence on the behaviour of other redox couples in the system. The low value for the hydrogen couple is probably due to the presence of excess hydrogen from the corrosion of iron in the borehole.
Crystalline 1153.3 m (1140.8 - 1165.8 m) 13-Aug-84 Samples 305/14,15 Block 1 Reference: WITTWER (1986) Sect. 5.5.8
This interval was drilled between 13- and l6-Jun-84 but was not sampled until August during the testing phase. The interval was cleaned by pumping and swabbing the borehole and samples were taken using both the Preussag (305/14) and GTe (305/15) pressure sampler. Tracer concentrations indicated a drill fluid content of 1 to 0.8 per cent, and the tritium content of the water was < 0.8 TU. Because of the low drilling fluid contamination levels in these samples, they were assigned to Block 1.
The GTe sample has much different, generally lower, concentrations of many dissolved solid species than the Preussag sample. WITTWER (1986, Section 5.S.8) attributes this to the fact that the GTe sampler was collected at a more shallow depth than the Preussag sample, and so could represent water not completely replaced by water from the formation being sampled. The fact that both the sodium and chloride contents of this sample are higher than those of any other sample from this borehole may also suggest contamination of the sampling vessel itself. The data in Table 6.1 are based solely on sample 305/14, the Preussag sample, but should be used with caution.
The modeled values for the carbonate system are based on the analyzed alkalinity and a pH adjusted for calcite saturation. This water has negative saturation indices for dolomite, fluorite and all sulphate minerals except barite. The saturation indices for barite and chalcedony are close enough to zero that the sample can be considered to be saturated with respect to these minerals.
pE values calculated from uranium saturation and the limiting value based on the arsenic couple agree within 0.1 pE units. As is common, the nitrogen, carbon and hydrogen couples are more negative.

NAGRA NTB 86-19 - 77 -
6.2.6 Crystalline 1271.9 m (1238.0 - 1305.8 m) 27. 28-Aug-84 Samples 305/16.17 Block 1 Reference: WITTWER (1986) Sect. 5.5.9
This interval of the crystalline was cored between 21- and 27 -Jun-84 with little loss of drilling fluid to the formation. Artesian discharge from the borehole prior to the cleaning phase helped minimize the amount of cleaning required. Surging the interval by submersible pumping increased the inflow rate to the borehole. Cleaning the borehole by pumping and swabbing reduced the drilling fluid content of the formation water to about one per cent. A tritium concentration of 1.2 ± 0.7 TU confirmed this contamination level. Water samples were taken with the GTC pressure sampler (305/17) and with the Bennett pump (305/16). Both samples were classified as Block 1.
The chemistry of the water from this zone is given in Table 6.1. Dissolved solid concentrations and 02(aq)' CO2 (aq) and total H2S are based on Fresenius analyses of samples 305/16 and 17. Other dissolved gas concentrations were taken from the PSI analysis of the pumped sample. The results of the uranium analyses are given in Table 6.2. The PSI results on the two samples differ by a factor of nearly three, while the AERE result on the pumped sample is virtually the same as the mean of the two PSI analysis. A rounded value of 4.3 ~g/l based on the AERE result is used in Table 6.1.
The modeled values for the carbonate system are based on the measured alkalinity and a pH adjusted for calcite saturation. The saturation indices are strongly negative for dolomite, fluorite and all sulphate minerals except barite, suggesting undersaturation with respect to those minerals. Barite has a strongly positive saturation index, due perhaps to an erroneously high measured barium concentration. The water appears virtually saturated with respect to quartz.
The pE values calculated from the platinum electrode potential, the assumption of uraninite saturation, and the arsenic couple agree within 0.5 pE units. These probably represent the range of potentials likely to influence the behaviour of other redox-sensitive species in the system. The values for the nitrogen, sulphur and carbon couples are more negative.

1 Sample Depth 113.5 m 284.3 m 310.4 m 482.6 m 2 Formation s r KRI KRI ~ 3 Analysis No. 305/1 305/2,3 305/4,5 305/6,7 GJ 4 Date 22-Feb-84 1-Mar-84 15,16-Mar-84 3,4-Mar-84 ~ 5 Measured pH 7.03 7.96 7.67 7.64 6 Pt Elect. Pot. (v) 0.12 0.04 -0.04 Z 7 Sample Temp. (IC) 17.0 23.5 24.1 26.0 H 8 Formation Temp. (IC) 16 24 25 30 to 9 Density (g/ml) 1.0037 0.9996 0.9996 0.9996 00
10 mg/l molal ity mg/l molal ity mg/l molality mg/l molality 0'\
11 Li th i um (Li +) 6.8 9.826E-04 1.95 2.815E-04 1.76 2.540E-04 1.98 2.858E-04 I
t--l 12 Sodium (Na+) 1780 7.766E-02 451.3 1.967E-02 431.2 1.879E-02 423.5 1.845E-02 1..0 13 Potassium (K+) 37.6 9.644E-04 12.6 3.228E-04 12.2 3.126E-04 11.2 2.869E-04 14 Rubidium (Rb+) 0.23 2.699E-06 0.13 1.524E-06 0.099 1. 160E -06 0.068 7.970E-07 15 Cesium (Cs+) 0.13 9.810E-07 0.08 6.030E-07 0.05 3.769E-07 0.04 3.015E-07 16 Ammonium (NH4+) 0.50 2.780E-05 0.20 1.111E -05 0.14 7.775E-06 0.12 6.664E-06 17 Magnesium (Mg+2) 56.3 2.323E-03 2.45 1.010E-04 1.6 6.593E-05 1.6 6.593E-05 18 Calcium (Ca+2) 443.1 1.109E-02 32.4 8.099E-04 29.8 7.448E-04 31.2 7.798E-04 19 Strontium (Sr+2) 12.6 1.442E-04 1.02 1. 166E-05 1.00 1. 143E-05 0.99 1.132E-05 20 Barillll (Ba+2) 0.010 7.303E-08 0.012 8.753E-08 0.022 1.605E-07 0.015 1.094E-07 21 Radillll (Ra+2) 1.4E-09 6.212E-15 9.0E-10 3.989E-15 6.0E-10 2.659E-15 4.0E-10 1.mE-15 22 Manganese (Mn+2) 0.21 3.834E-06 0.15 2.735E-06 0.14 2.553E-06 0.12 2.188E-06 23 Iron (Fe+2) < 2.44 4.382E-05 0.46 8.252E-06 < 0.58 1.040E-05 < 0.75 1.345E-05 24 Nickel (Ni+2) < 0.014 2.392E-07 n.n. n.n. n.n. 25 Copper (Cu+2) < 0.006 9.471E-08 n.n. n.n. < 0.005 7.883E-08 26 Zinc (Zn+2) < 3.3 5.063E-05 < 0.380 5.824E-06 < 0.25 3.831E-06 < 0.34 7.662E-08 27 Lead (Pb+2) < 0.002 9.682E-09 n.n. n.n. < 0.016 7.736E-08 28 Aluminum (Al+3) < 0.045 1.673E-06 < 0.002 7.426E-08 < 0.002 7.426E-08 < 0.003 1.114E-07 29 Uranium 1.4E-02 5.899E-08 5.0E-04 2.104E-09 1.8E-04 7.576E-10 1.4E-04 5.892E-10 30 31 Fluoride (F-) 2.4 1.267E-04 7.3 3.849E-04 7.95 4.192E-04 8.35 4.403E-04 32 Chloride (Cl-) 2025 5.729E-02 104.2 2.944E-03 79.4 2.244E-03 60.5 1.709E-03 -.....J
33 Bromide (Br-) 4.8 6.025E-05 0.55 6.895E-06 0.46 5.767E-06 0.35 4.388E-06 00
34 Iodide (I -) n.n. n.n. n.n. n.n. 35 Sulfate (504-2) 2083 2.175E-02 589 6.143E-03 572 5.965E-03 598 6.236E-03 36 Phosphate (as P) 0.015 4.857E-07 0.13 4.205E-06 0.063 2.038E-06 0.065 2.102E-06 37 Tot. Arsenic (As+5) 38 Arsenate (As+5) 0.15 2.008E-06 0.20 2.674E-06 0.15 2.006E-06 < 0.005 6.685E-08 39 Arsenite (As+3) 0.078 1.044E-06 0.069 9.227E-07 0.10 1.337E-06 0.31 4.145E-06 40 Alkalinity as HC03- 366.0 6.016E-03 402.8 6.614E-03 420.5 6.904E-03 379.5 6.230E-03 41 Bicarbonate (HC03-) 366 6.016E-03 402.8 6.614E-03 420.5 6.904E-03 379.5 6.230E-03 42 Carbonate (C03-2) n.n. n.n. n.n. n.n. 43 44 Tot. Sulfide (H2S) 0.01 2.943E-07 n.n. n.n. n.n. 45 Silica (H2Si03) 11.6 1.490E-04 29.6 3.797E-04 26.8 3.438E-04 22.0 2.822E-04 46 Borate (B(OH)3) 6.9 1. 119E-04 6.5 1.053E-04 6.46 1.047E-04 7.00 1. 134E-04 47 Total Iron < 2.9 5.208E-05 < 0.55 9.866E-06 < 0.77 1.381E-05 < 1.3 2.332E-05 48 Diss. Organic C < 0.34 2.839E-05 < 0.56 4.671E-05 < 0.33 2.752E-05 < 0.55 4.587E-05 49 mg/kg molality mg/kg molality mg/kg molal ity mg/kg molal i ty 50 Oxygen (02) n.n. n.n. n.n. n.n. 51 Nitrogen (N2) 46.3 1.664E-03 36.6 1.308E-03 36.5 1.305E-03 40.6 1.451E-03 52 Methane (CH4) 0.01 6.275E-07 0.01 6.242E-07 0.00 0.01 6.242E-07 53 Hydrogen (H2) < 0.02 9.987E-06 n.n. < 0.009 4.470E-06 < 0.006 2.980E-06 54 Argon (Ar) 0.88 2.218E-05 0.90 2.256E-05 0.90 2.256E-05 0.95 2.381E-05 55 Carbon Dioxide (CO2) 55 1.258E-03 27.5 6.258E-04 12 2.730E-04 14 3.185E-04
Table 6.1: Chenistry of water from Kaisten borehole. (Page 1 of 4)

1 Sample Depth 113.5 m 284.3 m 310.4 m 482.6 m 2 Formation s r KRI KRI ~ 3 Analysis No. 305/1 305/2,3 305/4,5 305/6,7
GJ 4 Date 22· Feb-84 1-Mar-84 15,16-Mar-84 3,4-Mar-84 ~ 57
58 Dissolved Solids: mg/kg di fference mg/kg difference mg/kg di fference mg/kg difference Z 59 Sum 6655 1433 1373 1350 t-3 60 Residue (110/C) 6764 1.6% 1409 -1 .7"" 1350 -1 .7"" 1299 -3.8% to 61 Residue (180 C) 6730 1.1% 1406 -1.9% 1345 -2.1% 1287 -4.7% 00 62 0'\
63 Charge Balance: -0.05% -0.42% -2.21% -0.40% I
64 r-' \.0
65 Total Dissolved CO2 mg/l molality mg/l molality mg/l molality mg/l molality 66 Analysed 67 Fresenius 7.274E-03 7.239E-03 7. 177E-03 6.549E-03 68 EIR 6.960E-03 6.790E-03 6.820E-03 6.350E-03 69 Calculated 70 With Meas. pH 7.108E-03 6.669E-03 7.138E-03 6.442E-03 71 At Calcite Satn 7.522E-03 6.885E-03 7.187E-03 6.492E-03 72 73 MODELED VALUES 74 75 Carbonate System 76 pH 6.86 7.61 7.61 7.57 n C02(aq) 66.7 1.520E-03 13.7 3.113E-04 14.1 3.220E-04 13.1 2.990E-04 78 Bicarbonate (HC03-) 364.6 5.992E-03 398.7 6.546E-03 416.3 6.835E-03 375.5 6.165E-03 79 Carbonate (C03-2) 0.6 1.039E-05 1.7 2.836E-05 1.8 2.967E-05 1.7 2.867E-05 80 Hydroxide (OH-) 0".0 1. 704E-06 0.0 7.921E-07 0.0 8.421E-07 0.0 1.207E-06 81 Total Dissolved CO2 7.522E-03 6.885E-03 7.187E-03 6.492E-03 82 log P(C02) -1.45 -2.05 -2.02 -2.00 83 84 Saturation Indices: -....J
85 Calcite 0.00 0.00 0.00 0.00 \.0
86 Dolomite -0.69 -0.85 -0.99 -0.97 87 Gypsum -0.21 -1.44 -1.48 -1.45 88 Anhydrite -0.66 -1.79 -1.82 -1.73 89 Celestite -0.06 -1.23 -1.24 -1.23 90 Barite 0.14 0.01 0.25 0.02 91 Fluori te -0.14 -0.05 -0.01 -0.01 92 Chalcedony -0.16 0.14 0.09 -0.06 93 Quartz 0.30 0.57 0.52 0.36 94 95 Oxidation State at 96 Formation Temp. pE Eh(volts) pE Eh(volts) pE Eh(volts) pE Eh(volts) 97 Pt Electrode 2.08 0.12 0.68 0.04 -0.68 -0.04 98 Calculated from: 99 U02 Satn. 0.53 0.03 -1.28 -0.08 -1.57 -0.09 -1.66 -0.10
100 02(aq)fH20 101 02( aq)fH20(Sato) 102 As(V)fAs( I I I) 0.66 0.04 -0.88 -0.05 -1.06 -0.06 < -2.14 -0.13 103 N2(AQ)fNH4+ -2.68 -0.15 -3.76 -0.22 -3.81 -0.23 104 S04-2/H2S -2.76 -0.16 105 C02/CH4 -3.59 -0.21 -4.57 -0.27 -4.64 -0.28 106 H+/H2(AQ) > -5.89 -0.34 > -6.47 -0.38 > -6.36 -0.38
Table 6.1: Chenistry of water from Kaisten borehole. (Page 2 of 4)

1 Sample Depth 819.4 m 1031.0 m 1153.3 m 1271.9 m 2 Formation KRI KRI KRI KRI ~ 3 Analysis No. 305/9 I 10, 11 305/12,13 305/14 305/16,17
G1 4 Date 2,3-May-84 5,6-Jun-84 13-Aug-84 27,28-Aug-84 ~ S Measured pH 7.10 7.30 8.20 7.93
6 Pt Elect. Pot. (v) -O.OS -0.05 Z 7 Sample Temp. (IC) 27.1 33.1 32.3 34.9 rl 8 Formation Temp. (IC) 42 SO 54 58 t:;l::j
9 Density (g/ml) 0.9994 0.9994 0.9994 0.9995 00 10 mg/l molality mg/l molality mg/l molality mg/l molality 0"\ 11 Lithium (Li+) 1.86 2.685E-04 2.0S 2.959E-04 1.67 2.411E-04 1.85 2.670E-04 I
12 Sodium (Na+) 361.0 1.573E-02 361.0 1.573E-02 410 1.787E-02 363.5 1.S84E-02 J-I \0
13 Potassium (K+) 19.0 4.868E-04 14.S 3.71SE-04 12.8 3.280E-04 24.2 6.200E-04 14 Rubidium (Rb+) 0.15 1.758E-06 0.14 1.641E-06 0.095 1.114E-06 0.085 9.963E-07 15 Cesium (Cs+) 0.09 6.784E-07 0.01 7.538E-08 0.06 4.523E-07 0.04 3.015E-07 16 Ammonium (NH4+) 0.30 1.666E-05 0.22 1.222E-05 0.07 3.888E-06 0.40 2.221E-05 17 Magnesium (Mg+2) 1.25 S.151E-05 1.2 4.94SE-05 2.1 8.654E-05 3.0 1. 236E-04 18 Calcium (Ca+2) 48.0 1.200E-03 48.6 1.21SE-03 36.9 9.224E-04 34.1 8.523E-04 19 Strontium (Sr+2) 1.40 1.601E-05 1.42 1.624E-05 1.24 1.418E-05 1.12 1.280E-05 20 Barium (Ba+2) 0.017 1.240E-07 0.03 2.188E-07 0.038 2.772E-07 0.12 8.753E-07 21 Radium (Ra+2) 3.0E-09 1.330E-14 2.1E-09 9.308E-15 5.2E-09 2.305E-14 7.0E-10 3.102E-15 22 Manganese (Mn+2) 0.16 2.918E-06 0.20 3.647E-06 0.15 2.736E-06 0.S8 1.0S8E-05 23 Iron (Fe+2) < 5.90 1.058E-04 < 1.14 2.045E-05 < 1.3 2.332E-05 24 Nickel (Ni+2) n.n. n.n. < 0.034 5.802E-07 < 0.004 6.825E-08 25 Copper (Cu+2) n.n. n.n. < 0.003 4.731E-08 n.n. 26 Zinc (Zn+2) < 0.22 3.372E-06 < 0.041 6.284E-07 < 0.013 1.993E-07 < 0.017 2.605E-07 27 Lead (Pb+2) < 0.005 2.418E-08 < 0.007 3.385E-08 < 0.003 1.451E-08 < 0.007 3.384E-08 28 Aluminum (Al+3) n.n. < 0.005 1.857E-07 < 0.002 7.427E-08 n.n. 29 Uranium 1.1E-04 4.630E-10 1.0E-04 4.209E-10 6.0E-05 2.526E-10 4.3E-03 1.810E-08 30 31 Fluoride (F-) 7.2 3.797E-04 6.9 3.639E-04 7.4 3.903E-04 7.5 3.955E-04 32 Chloride (Cl-) 67.0 1.893E-03 63.3 1. 789E-03 135 3.815E-03 73.1 2.066E-03 00
33 Bromide (Br-) 0.47 5.893E-06 0.38 4.764E-06 0.47 5.893E-06 0.47 5.892E-06 0
34 Iodide (I -) n.n. 0.07 S.S26E-07 n.n. n.n. 35 Sulfate (S04-2) 511 5.329E-03 508 5.298E-03 491 5.121E-03 532 5.548E-03 36 Phosphate (as P) 0.048 1.553E-06 0.075 2.426E-06 0.025 8.087E-07 0.73 2.361E-05 37 Tot. Arsenic (As+5) 38 Arsenate (As+5) 0.14 1.872E-06 0.12 1.605E-06 < 0.005 6.687E-08 0.05 6.685E-07 39 Arsenite (As+3) 0.05 6.686E-07 0.OS6 7.488E-07 0.12 1.605E-06 0.035 4.680E-07 40 Alkalinity as HC03- 372.3 6.113E-03 383.0 6.289E-03 366.0 6.010E-03 366.0 6.009E-03 41 Bicarbonate (HC03-) 372.3 6.113E-03 383.0 6.289E-03 366.0 6.010E-03 366 6.009E-03 42 Carbonate (C03-2) n.n. n.n. n.n. n.n. 43 44 Tot. Sulfide (H2S) n.n. n.n. 0.4 1. 176E-05 0.23 6.761E-06 45 Silica (H2Si03) 45.3 5.811E-04 68.9 8.838E-04 49.3 6.325E-04 26.6 3.412E-04 46 Borate (B(OH)3) 7.05 1.142E-04 7.12 1.154E-04 6.91 1.120E-04 7.48 1.212E-04 47 Total I ron < 2.7 4.844E-OS < 4.66 8.360E-05 < 16.1 2.888E-04 < 14.1 2.529E-04 48 Diss. Organic C < 0.2 1.668E-05 < 0.1 8.341E-06 < 1.8 1.501E-04 < 0.95 7.923E-05 49 mg/kg molality mg/kg molality mg/kg molality mg/kg molality 50 Oxygen (02) n.n. n.n. n.n. n.n. 51 Nitrogen (N2) 34.0 1.215E-03 35.5 1.269E-03 64.3 2.298E-03 30 1.072E-03 S2 Methane (CH4) 0.01 6.241E-07 0.02 1.248E-06 0.03 1.872E-06 0.02 1.248E-06 53 Hydrogen (H2) < 0.02 9.933E-06 < 0.003 1.490E·06 < 0.0005 2.483E-07 n.n. 54 Argon (Ar) 0.91 2.281E-05 0.95 2.381E-OS 1.44 3.609E-05 0.84 2.105E-05 55 Carbon Dioxide (CO2) 39.5 8.986E-04 24 5.460E-04 n.n. 6 1.365E-04
Table 6.1: Chenistry of water from Kaisten borehole. (Page 3 of 4)

1 Sample Depth 819.4 m 1031.0 m 1153.3 m 1271.9 m 2 Formation KRI KRI KRI KRI Z 3 Analysis No. 305/9,10,11 305/12,13 305/14 305/16,17 ~
GJ 4 Date 2,3-May-84 5,6-Jun-84 13-Aug-84 27,28-Aug-84 ~ 57
58 Dissolved Solids: mg/kg difference mg/kg di fference mg/kg difference mg/kg difference Z 59 Sum 1245 1263 1327 1255 r-3 60 Residue (11OIC) 1245 0.0% 1210 -4.2% 1303 -1.8% 1275 1.6% to 61 Residue (180 C) 1235 -0.8% 1208 -4.4% 1295 -2.4% 1240 -1.2%
00 62 0' 63 Charge Balance: -0.04% 0.74% 0.35% -4.41% I
64 I--' 1..0 65 Total Dissolved CO2 mg/l molality rng/l molality mg/l molality mg/l molality
66 Analysed 67 Fresenius 7.011E-03 6.835E-03 6.010E-03 6.145E-03 68 EIR 6.420E-03 6.420E-03 69 Calculated 70 \.lith Meas. pH 6.896E-03 6.750E-03 5.747E-03 5.914E-03 71 At Calcite Satn 6.698E-03 7.060E-03 6.575E-03 6.573E-03 72 73 MODELED VALUES 74 75 Carbonate System 76 pH 7.22 7.11 7.20 7.20 77 C02(aq) 27.0 6. 139E-04 35.2 8.021E-04 26.9 6.115E-04 27.3 6.208E-04 78 Bicarbonate (HC03-) 369.4 6.065E-03 379.9 6.238E-03 361.7 5.939E-03 361.0 5.926E-03 79 Carbonate (C03-2) 1.2 1.944E-05 1.2 1.951E-05 1.5 2.460E-05 1.5 2.563E-05 80 Hydroxide (OH-) 0.0 6.678E-07 0.0 2.781E-06 0.0 2.083E-06 0.0 2.341E-06 81 Total Dissolved CO2 6.698E-03 7.060E-03 6.575E-03 6.573E-03 82 Log P(C02) -1.57 -1.38 -1.47 -1.43 83 84 Saturation Indices: 00 85 Calcite 0.00 0.00 0.00 0.00 I--' 86 Dolomite -1.21 -1.22 -0.86 -0.69 87 Gypsum -1.30 -1.30 -1.43 -1.42 88 Anhydrite -1.45 -1.36 -1.45 -1.40 89 Celestite -1.12 -1.11 -1.17 -1.17 90 Barite -0.14 0.01 0.06 0.56 91 Fluorite -0.04 -0.15 -0.25 -0.31 92 Chalcedony 0.13 0.23 0.04 -0.26 93 Quartz 0.51 0.59 0.39 0.07 94 95 Oxidation State at 96 Formation Temp. pE Eh(volts) pE Eh(volts) pE Eh(volts) pE Eh(volts) 97 Pt Electrode -0.82 -0.05 -0.82 -0.05 98 Calculated from: 99 U02 Satn. -1.59 -0.10 -1.70 -0.11 -2.08 -0.14 -1.09 -0.07
100 02(aq)/H20 101 02(aq)/H20(Sato) 102 As(V)/As(III) -0.74 -0.05 -0.83 -0.05 < -1.99 -0.13 -1.33 -0.09 103 N2(AQ)/NH4+ -3.76 -0.24 -3.74 -0.24 -3.74 -0.24 -4.12 -0.27 104 S04-2!H2S -3.92 -0.25 -3.92 -0.26 105 C02/CH4 -4.45 -0.28 -4.50 -0.29 -4.69 -0.30 -4.73 -0.31 106 H+/H2(AQ) > -6.28 -0.39 > -5.76 -0.37 > -5.47 -0.36
Table 6.1: Chenistry of water from Kaisten borehole. (Page 4 of 4)

NAGRA NTB 86-19 - 82 -
7.0 LEUGGERN
7.1 Upper Musche1ka1k 74.9 m (53.5 - 96.4 m) 18-Jul-84 Sample 306/1 Block 1 Reference: WITTWER (1986) Sect. 5.6.1
At Leuggern the Muschelkalk lies directly beneath quaternary terrace deposits. It comprises partly eroded Plattenkalk and Trochitenkalk.
After installation of the surface casing to 53.5 m, the borehole was drilled to 96.4 m using traced fresh-water drilling fluid. At about 87.5 m, some five m3 of fluid were lost to the formation.
A pump test was carried out in the open borehole from 13- to 18-Jul-84. At the end of the test about 95 m3 had been produced from the borehole, and sample 306/1 was taken at the well head. During sampling, the tracer concentration remained steady at a level corresponding to a drilling fluid content of about two per cent. However, the total mass of tracer produced during the pump test was found to be more than four times the mass of tracer in the fluid lost during drilling. The discrepancy between this observation and the tracer content of the sample itself is not understood, but because of the large volume of water pumped before sampling, the sample is assigned to Block 1. The tritium content of this sample is 11.6 ± 1.1 TU. Because the Muschelkalk at Leuggern is in direct contact with quaternary deposits, this probably represents the tritium content of the Muschelkalk water itself, or of admixed water from the quaternary, and cannot be used as an indicator of drilling fluid contamination.
The chemistry of water from this interval is given in Table 7.1. The concentrations of dissolved solids 0Z(aq)' COZ(aq) and total HzS are as analyzed by Fresenius. Concentrations of the other dissolved gases are those of PSI. Uranium concentrations are shown in Table 7.2. PSI and AERE results are in good agreement. The AERE value is used in Table 7.1.
The modeled values for carbonate species use the measured alkalinity and a pH corresponding to calcite saturation. As the table shows, this leads to a calculated dissolved COZ(aq) concentration of 30 mg/l, close to the 21 mg/l value measured by Fresenius.
The saturation indices show that, unlike waters from the Muschelkalk in the other boreholes, this water is undersaturated with respect to the sulphate minerals gypsum, anhydrite and celestite. This may be a result of the presence in the sample of water of low res idence time as indicated by its high tritium content. The saturation index of barite, on the other hand, is positive. As with many other samples, this may due to an erroneously high analyzed barium concentration.
The saturation index of dolomite, -0.26, is similar to that of other Muschelkalk samples and probably indicates saturation of the water with respect to dolomite of the type found in this formation. Both silica minerals have positive saturation indices and

NAGRA NTB 86-19 - 83 -
Table 7.2: Uranium concentrations and pE values at uraninite saturation for waters from the Leuggern borehole.
Uranium Concentration in micrograms per litre pEC8lcu-
lated at ~le ~le PSI AERE At Calcu- Uraninite Depth Nl.iIber Analysis Analysis lated pE Saturation
-------------------------------------------------
74.9 m 306/1 1.00 0.93 ± 0.03 0.93 -0.01
217.9 m 306/2 0.50 0.37 ± 0.02 0.37 -1.68 30613 0.50
251.2 m 306/4 0.50 0.43 ± 0.01 0.43 -1.91
444.2 m 306/5 0.29 0.20 ± 0.01 0.20 -2.20 306/6 0.15
538.0 m 30617 0.11 0.11 ± 0.01 0.123 * -2.86 306/8 0.07 0.114 * -3.40
705.7 m 306/9 0.17 0.20 ± 0.01 0.20 -2.02 306110 0.07
847.0 m 306/18 0.06 0.012 ± 0.002 0.080 * -3.40 0.080 * -4.40
1203.2 m 306/20 0.14 ± 0.01 0.224 * -3.40 306/21 0.20 0.222 * -5.00
1433.4 m 306/24 0.48 ± 0.02 306/26 <0.48 <-2.04
1643.4 m 306/16 0.11 0.015 ± 0.002 0.154 * -3.40 0.153 * -5.40
1665.5 m 306/23 0.20 0.20 -2.53
* Calculated assuming'uraninite saturation at pE shown.
may indicate that the analyzed silica concentration is high. Fluorite appears to be undersaturated.
Analyzed values of both members of the arsenic redox couple are available and lead to a pE of +0.69. This is considerably lower than the platinum electrode value of 2.29, but is within one unit of the value calculated from uraninite saturation. As is common, the carbon couple leads to an extremely low pE value.
7.2 Buntsandstein 217.8 m (208.2 - 227.5 m) 8-Aug-84 Samples 306/2.3 Block 2 Reference: WITTWER (1986) Sect. 5.6.2 Beil. 5.8
The borehole was drilled with brine mud to 209.4 m and casing was installed to 208.2 m. After an exchange of drilling fluid, the interval was drilled to 227.5 m with traced de-ionized fluid. A

NAGRA NTB 86-19 - 84 -
single packer was installed in the casing and hydraulic testing and cleaning were begun on 4-Aug by swabbing and pumping. Sample 306/2 was collected at the well head on 8-Aug and had a tracer concentration corresponding to less than one per cent drilling fluid. The low tritium content of this sample « 0.8 TU) supports the conclusion from the tracer measurements.
A GTC pressure sample was also collected on 8-Aug for gas analyses (306/3). This sample had a considerably higher tracer concentration and conductivity than the pumped sample. The pressure vessel also sampled had a higher oxygen and nitrogen content than the surface sample and was not used in developing Table 7.1. Because one of the drilling fluids used was a brine which if present even at much less than one per cent could still effect the sample chemistry, and because of the unexplained high tracer content and conductivity of the pressure sample, these samples are assigned to Block 2.
The chemical data for this interval are given in Table 7.1. The values given are from analyses of the pumped sample (306/2). The concentrations of dissolved solids 02(aq)' CO2 (aq) and total H2 S are Fresenius analyses. The concentrations of the other gases are PSI analyses. As Table 7.2 shows, there is reasonable agreement among the uranium results. The AERE value is used in Table 7.1.
The carbonate system was modeled using the measured alkalinity and a pH corresponding to calcite saturation. The saturation indices show that, like waters from the Buntsandstein/Crystalline from other boreholes, this water is undersaturated with respect to dolomite and the calcium and strontium sulphate minerals. The saturation indices of barite and fluorite, however, are close to zero. The silica content of this water corresponds to undersaturation with respect to chalcedony and oversaturation with respect to quartz.
The pE value from the platinum electrode potential is within 0.3 units of the value calculated for uraninite saturation. The value calculated from the arsenic redox couple is somewhat more negative, but still within one unit. As is common, the carbon and hydrogen couples lead to extremely low pE values.
7.3 Crystalline
The crystalline at Leuggern, like that at Kaisten, was drilled using a wire-line coring device. The loss of drilling fluid to the borehole annulus in the Leuggern borehole was lessened by using casing of larger diameter than used at Kaisten. The interval of the crystalline from 251 to 706 m contained flowing zones which cleaned the borehole sufficiently to provide good water chemistry samples. At 1650 m, the borehole crossed a major fracture zone and samples of the formation fluid were taken. A smaller permeable zone was intersected at 1430 m and sampling was done to test the fractures there. Other samples containing more drilling fluid were taken within the interval from 700 m to 1600 m.

NAGRA NTB 86-19 - 85 -
The chemistry of these waters is given in Table 7.1. Geochemical calculations using the measured alkalinity and pH indicate oversaturation with respect to calcite by 0.2 to 0.8 units. Modeled values of formation conditions represent the measured alkalinity and pH values adjusted to correspond to calcite saturation.
Saturation indices show that these waters, like those from the crystalline in other boreholes, are undersaturated with respect to dolomite and the sulphate minerals gypsum, anhydrite and celestite. Barite saturation indices are highly irregular, ranging from -0.4 to +0.5 units. This probably represents scatter in the barium analytical results.
Fluorite appears to be saturated in samples from the 847.0 m zone and above. In the samples from 923.0 m and below, however, fluorite saturation indices are negative but within the narrow range of -0.23 to -0.28 units. This behaviour is not explained.
The silica concentrations used are the lowest values reported by WITTWER (1986) for the samples from all intervals except the two centred on 1203.2 m and 1433.2 m. Initial calculations showed that the lowest concentrations given for these intervals correspond to undersaturation with respect to quartz. This is unlikely, so higher reported concentrations were selected. As Table 7.1 shows, the concentration for the 1433.4 m sample corresponds to saturation with respect to quartz. The concentrations selected for the 1203.2 m sample, like the lowest reported concentration for the 444.2 m sample, corresponds to oversaturation with respect to quartz and undersaturation with respect to chalcedony. The silica concentration for the sample from 923.0 m indicates undersaturation with respect to quartz. This is unlikely, and is possibly a result of an erroneously low value having been developed by the procedure used to correct the analyzed data. The concentrations of the remaining six samples suggest that waters are saturated, or only slightly undersaturated with respect to chalcedony.
Table 7.2 compares the uranium concentrations reported by PSI and AERE for waters from the crystalline (and the Buntsandstein/weathered crystalline) horizons. There is moderate agreement between the two sets of analyses except for the samples from the 847.0 m and 1643.4 m zones where the AERE values are a factor of five or more lower than the PSI values.
Uranium concentrations reported for the 538.0 m, 847.0 m, 1203.2 m, and 1643.4 m intervals are too low to represent uranini te saturation at any pE. For these samples, Table 7.2 includes uranium concentrations calculated for saturation with respect to uraninite at the pE value given in the last column. Although these pE values differ by 0.5 to 2, the differences in the modeled uranium concentrations are very small. The modeled uranium concentrations differ from the highest PSI values for any interval by no more than 0.04 ~g/l, but are as much as ten times the concentrations reported by AERE.

NAGRA NTB 86-19 - 86 -
7.3.1
7.3.2
The following sections describe the individual zones sampled from the crystalline of the Leuggern borehole.
Crystalline 251.2 m (235.1 - 267.5 m) 14-Aug-84 Sample 306/4 Block 1 Reference: WITTWER (1986) Sect. 5.6.3
Some loss of drilling fluid (about two m3) occurred in this inter
val. Artesian flow increased as the borehole was deepened following the Buntsandstein testing. During the cleaning phase, over 40 m3 of fluid were removed from the test interval and the drilling fluid content of the water produced was reduced to between 1 and 0.2 per cent. Sample 306/4 was then taken at the well head and is assigned to Block 1. A pressure vessel sample was not obtained.
The chemistry of the water in this zone is given in Table 7.1. The concentrations reported for the dissolved solids, 02(aq)' CO2(aq) and total H2S are those of Fresenius. The concentrations of the remaining gases are as given by PSI and the dissolved uranium is an AERE value. The modeled carbonate values correspond to calcite saturation and have a lower pH and higher ratio of HC03 to C03 than were analyzed.
There is a wide variation in the pE values calculated for this sample. The value based on the platinum electrode potential is over two units more positive than that calculated for uraninite saturation. Arsenate was not detected, so only a limiting pE could be calculated for the arsenic couple. This pE is one unit more negative than that calculated for uraninite saturation. As usual, the pE values for the carbon and hydrogen couples are improbably negative. Comparison with samples from the zones above and below this one suggest.that the uraninite-based pE best represents that of this interval.
Crystalline 444.2 m (440.4 - 448.1 m) 15-Sept-84 Samples 306/5.6 Block 1 Reference: WITTWER (1986) Sect. 5.6.4: Bei1. 5.9
This interval was drilled with traced de-ionized water. It was chosen for sampling because of a doubling of the artesian flow rate noted when drilling at about 440 m. The zone was cleaned by swabbing and pumping, and sample 306/5 was taken from the pump discharge at the well head. At the time this sample was taken, the tracer content of the pumped discharge had been constant for nearly two days at a level indicating between one and two per cent drilling fluid content (WITTWER, 1986, Beilage 5.9). This may have been due to leakage around the packer in response to the high pressure differential caused by pumping. The tritium content of this sample « 1.2 TU) is concordant with a relatively low level of contamination.
A GTe pressure sample (306/6) was taken several hours after pumping stopped and had a tracer content corresponding to only about

NAGRA NTB 86-19 - 87 -
7.3.3
0.1 per cent drilling fluid. There are no systematic differences between the pump discharge and the pressure vessel samples and both are assigned to Block 1.
The chemistry of the water in this interval is given in Table 7 .1. The analyses from the pumped and pressure samples are similar and so the dissolved solids concentrations were derived from both sets as described in the Introduction. Fresenius analyses for 02(aq)' CO2(aq) and total H2S were used along with PSI analyses for the remaining gases. The AERE uranium concentration for the pumped sample was used. The modeled carbonate values correspond to calcite saturation and have a lower pH and higher ratio of HC03 to C03 than were analyzed.
pE values calculated from the arsenic couple and from uraninite saturation agree within 0.03 units and are within 0.7 units of the platinum electrode value. The values based on dissolved oxygen are much higher and support the probability that the measured oxygen was a result of sample contamination. This is suggested by the fact that oxygen was undetected in the PSI gas samples. The pE values based on the carbon and hydrogen couples are, as usual, considerably lower.
Crystalline 538.0 m (507.4 - 568.6 m) 28-Sept-84 Samples 306/7.8 Block 1 Reference: WITTWER (1986) Sect. 5.6.5
A permeable zone occurs wi thin this interval near 540 m. An increase in artesian flow from the borehole was observed and some traced de-ionized drill fluid was lost to the formation during drilling. During the cleaning phase, with almost 20 m3 of water removed, the drilling fluid concentration fell quickly to below one per cent so that surface and pressure samples could be taken. Both samples were assigned to Block 1.
The chemistry of the water in this interval is presented in Table 7.1. The concentrations of dissolved solids are based on analyses of the pumped (306/7) and pressure samples (306/8) as described in the Introduction. The Fresenius analyses for 02(aq)' CO2(aq) and total H2S were used along with PSI values for remaining gases from the pumped sample. The modeled carbonate values correspond to calcite saturation, and have a lower pH and a higher ratio of HC03 - to C0 3 -2 than the analyzed results.
The results of the various uranium analyses on samples from this interval are given in Table 7.2. The highest concentration reported, 0.11 ~g /1, is below saturation with uraninite at any reasonable pE. If the pE calculated for the arsenic couple (-2.86) is used, the uranium concentration calculated for uraninite equilibrium is 0.123 pg /1. If a pE of - 3.40 is used, the calculated uranium concentration is only slightly lower at 0.114 pg/l. The uranium concentration for this interval can thus be taken at about 0.12 ~g. /1, within the analytical uncertainty of the measured values, and corresponding to uraninite saturation at the pE calculated for the arsenic couple.

NAGRA NTB 86-19 - 88 -
7.3.4
7.3.5
The pE calculated from the measured platinum electrode potential is more than one unit more positive than that of the arsenic couple. Values calculated from the nitrogen, carbon and hydrogen couples are more negative by several units.
Crystalline 705.7 m (702.0 - 709.5 m) 17. l8-0ct-84 Samples 306/9.10 Block 1 Reference: WITTWER (1986) Sect. 5.6.6
During drilling from 703 to 707 m depth, an increase in artesian outflow from the borehole indicated an area for sampling of the formation. Some two m3 of traced de-ionized drill fluid were lost to the formation. The effects were minimized by the increased artesian discharge from the interval. After the cleaning phase, tracer concentrations indicated a drilling fluid contamination of less then 0.5 per cent. Sample 306/9 was taken at the top of the borehole and 306/10 at 400 m with the GTC sampler. Both of these samples were assigned to Block 1.
The chemistry of the water from this interval is presented in Table 7.1. The chemistries of the pumped and pressure samples are similar, so mean concentrations for the dissolved constituents were taken as described in the Introduction. The Fresenius concentrations of 02(aq)' CO2(aq) and total H2S were selected while the remaining gas analyses are from the PSI analysis of the pumped sample, 306/9. Modeled values for the carbonate system assume saturation of the water with respect to calcite. They yield a lower pH and higher ratio of HC03- to C03- than were measured.
pE values calculated from the arsenic couple and the platinum electrode potential agree within 0.4 units. The value calculated for uraninite saturation using the AERE uranium concentration, however, is considerably more positive. If a pE of -3.10 is assumed, the uranium concentration corresponding to uraninite saturation is 0.085 ~g /1. As Table 7.2 shows, this is between the concentrations measured by PSI, but less than half the AERE value. Formation conditions can thus probably best be represented by a pE value between those calculated from the platinum electrode measurement and the arsenic couple, and a uranium concentration of about 0.1 pg /1. As for all other samples, the pE values calculated from the nitrogen and carbon couples are several units more negative.
Crystalline 847.0 m (834.5 - 859.5 m) 26. 27-Mar-85 Samples 306/18.19 Block 2 Reference: WITTWER (1986) Sect. 5.6.10
This interval was sampled during the testing phase, some five months after it was drilled. During that period it remained in contact with the traced de- ionized drilling fluid. During the cleaning phase, more than 70 m3 of formation fluid were removed from the borehole prior to the start of sampling. The tracer concentrations decreased in stages which were thought to corre-

NAGRA NTB 86-19 - 89 -
7.3.6
spond to cleaning of fractures. Samples 306/17 and 306/18 were taken on 25- and 26-Mar-85 from pump discharge at the surface, and sample 306/19 on 27 -Mar with the GTC pressure sampler. Sample 306/17 had a higher tracer concentration than either 306/18 or 19, and was not considered in the interpretation. Tracer concentrations in samples 306/18 and 19 corresponded to drilling fluid contamination levels of between 2.5 and 5 per cent. The tritium concentration of sample 306/18 was 2.2 ± 0.7 TU which agrees well with the tracer analyses. The samples were assigned to Block 2.
The chemistry of the water in this zone is given in Table 7.1. The dissolved solids concentrations represent mean values of the Fresenius analyses for samples 306/18 and 306/19 as described in the Introduction. The 0Z(aq)' COZ(aq) and total HzS concentrations are Fresenius values while the concentrations of the remaining dissolved gases are PSI values for the pumped sample, 306/18. The modeled carbonate values correspond to calcite saturation and have a lower pH and a higher ratio of HC03 - to C03 - Z than the analysis.
Arsenate was not detected in this sample, so the pE given for the arsenic couple is an upper limiting value calculated assuming an arsenate concentration equal to its analytical detection limit of 0.005 mg/l. The value calculated from the platinum electrode potential is two units more positive than the limiting arsenic value, and probably does not represent a good measurement.
The analytical results of the uranium determinations are given in Table 7.2. The AERE value corresponds to undersaturation with respect to uraninite at any pE. The lowest uranium concentration possible for uraninite saturation, even at very low pE values, is about 0.08 ~g/l. This is within analytical uncertainty of the PSI uranium value for this interval. Formation conditions can probably best be represented by a uranium concentration of about 0.08 ~g/l and a pE near or slightly below the value calculated for the arsenic couple.
The pE values calculated for the nitrogen and sulphur couples agree closely, and the one calculated from the carbon couple is less than one unit more negative. Because these couples tend not to reflect equilibrium, this agreement is probably fortuitous and does not represent conditions which will be reflected in the chemistry of other dissolved redox species.
Crystalline 923.0 m (916.2 - 929.7 m) 24-Nov - 7-Dec-84 Samples 306/11b.12.13 Block 2 References: WITTWER (1986) Sect. 5.6.7: Beil. 5.10
The hydraulic conductivity of this zone is so low (10-9 m/s) that a suitable interval for packer testing could not be identified by drilling fluid loss to the formation or by changes in artesian outflow from the borehole. The test interval was selected on the basis of isolated fracture locations and anomalies in the fluid salinity and temperature logs. The fluid logs indicated a flowing zone between 840 and 920 m depth, and isolated fractures were identified at 914 and 919 m. A double packer system was used to

NAGRA NTB 86-19 - 90 -
7.3.7
isolate the interval from 916.2 to 929.7 m. Borehole cleaning began after a short period of hydraulic testing on 25-Nov-84. By swabbing and bailing, a total of 5.4 m3 of fluid was removed from the borehole. The cleaning phase continued until 7-Dec-84 with bailer samples being taken during this period for field analyses. Preussag samples were taken on 28-Nov (306/11b), 30-Nov (306/12), and on 7-Dec (306/13). Because of the low permeability within this interval, by the end of the cleaning and sampling period the tracer concentrations in the formation fluid had been reduced only to between five and ten per cent. As a result, these are considered Block 2 waters.
WITTWER (1986, Table 5.18) was able to adjust the analytical results for the residual drilling fluid and gives a corrected analysis for the groundwater itself. The corrected values are used in Table 7.1. Although PSI analyses of dissolved gases and uranium were made on these samples, the results are not consistent with the correction procedure used for the dissolved solids, so no dissolved gas or uranium values are given for the groundwater in Table 7.1.
The total salinity of the water is considerably higher than that of any other waters from the Leuggern crystalline, due primarily to its high sodium, calcium, and sulphate concentrations. Geochemical modelling at calcite saturation leads to a lower pH and total dissolved carbonate concentration than for any other Leuggern crystalline sample. This is due to the high calcium concentration of the water. However, the CO2 partial pressure calculated for this sample is similar to those of other Leuggern crystalline waters.
This water is also nearly saturated with respect to gypsum, the stable CaS04 mineral at the formation temperature, and with respect to celestite. The.calculations also indicate undersaturation with respect to both chalcedony and quartz. This is unlikely and probably results from the use of an erroneously low silica concentration.
Overall, the calculated CO2 partial pressure and near saturation with respect to gypsum and celestite suggest the validity of the corrections made to the water chemical data, and that the analyses given fairly represent the composition of groundwater in situ.
Crystalline 1192.5 m (1176.2 - 1208.8 m) 28. 29-Dec-84 Samples 306/14.15 Block 2 Reference: WITTWER (1986) Sect. 5.6.8; Be!l. 5.12
This interval was drilled from 14- to 16-Dec-84 during a period of drilling which ended on 23-Dec-84 at a depth of 1315 m. Fluid logging was carried out during pumping to find water-yielding zones which might be suitable for sampling. This zone was selected and packer tests were carried out from 24- to 26-Dec. A period of swabbing began during which a Preussag pressure sample was taken on 28-Dec-84 (306/14b) from 1150 m. On 29-Dec pressure sample 306/15 was taken also from 1150 m. During the swabbing

NAGRA NTB 86-19 - 91 -
7.3.8
period the tracer concentration declined only to a level corresponding to eight per cent drilling fluid contamination. No tritium analysis are available to corroborate this contamination amount.
Because of the relatively large potential for contamination of these samples, essentially the same interval was sampled again during the testing phase. The second set of samples were more satisfactory and are described in the following section. Because of the contamination in the samples from 1192.5 m, they were not treated further here.
Crystalline 1203.2 m (1179.3 - 1227.2 m) 22. 23-Apr-85 Samples 306/20.21 Block 2 Reference: WITTWER (1986) Sect. 5.6.11: Bei1. 5.12
In order to gain as much information as possible about the poorly permeable region of crystalline rock in this borehole, a zone essentially the same as that described in the previous section was resampled during the testi.ng phase. This interval displayed a small artesian discharge from the borehole. This discharge, combined with swabbing periods, was used to clean the sample interval of the traced de - ionized drilling fluid. A Preussag pressure sample (306/20) was taken from 1150 m, and had a tracer content equivalent to 1 to 1.2 per cent de-ionized drilling fluid. This corresponded well with its tritium concentration of 1.3 ± 0.7 TD. A GTG pressure sample (306/21), taken from a depth of 470 m, contained more than 2.5 per cent drilling fluid. These samples were therefore assigned to Block 2.
The chemistry of the water in this zone is given in Table 7.1. The concentrations of most of the dissolved solid constituents are mean values of Fresenius analyses of samples 306/20 and 306/21 as described in the Introduction. The 0Z(aq)' GOZ(aq) and total HzS values are Fresenius analyses, and the values of the remaining dissolved gases are PSI analyses of sample 306/20. Modeled carbonate values corresponding to calcite saturation have a lower pH and a higher ratio of HG03- to G03- Z than those produced by analysis.
Arsenate was sought but not detected in this sample, so the pE for the arsenic couple is an upper limiting value calculated assuming the arsenate concentration was at its detection limit of 0.005 mg/l. The uranium concentrations for these samples are given in Table 7.2. The concentration reported by AERE corresponds to undersaturation with respect to uraninite at any pE. The lowest uranium concentration possible at uraninite saturation, even at very low pE values, is about 0.22 ~g/l. This is within the uncertainty of the PSI value given for sample 306/21. The formation conditions can probably best be represented by uranium concentration of about 0.2 j.£g/l, and a pE near or slightly below that calculated as a limiting value from the arsenic couple.
The pE values calculated from the nitrogen and sulphur couples agree closely and are within one unit of the value calculated from

NAGRA NTB 86-19 - 92 -
7.3.9
the carbon couple. Because these couples tend not to reflec-t equilibrium, this agreement is probably fortuitous and does not represent conditions which will be reflected in the chemistry of other dissolved redox species.
Crystalline 1433.4 m (1427.4 - 1439.4 m) 14-May-85 Samples 306/26 Block 2 Reference: WITTWER (1986) Sect. 5.6.13; Bei1. 5.13
During the drilling phase at Leuggern no samples were collected between depths of 1200 and 1600 m. Based on the results of logging done at the beginning of the test phase, a zone around 1435 m was selected for testing. Because of the very low hydraulic conductivity of the zone, it could be cleaned only at the rate of about one swab per day.
Swabbing began on 2 -May- 85. Nagra bailer samples taken through 9-May showed regular changes in most parameters. On II-May, however the conductivity decreased instead of continuing its previous increase, even though the tracer concentrations continued to decrease (WITTWER, 1986, Beilage 5.13). This trend continued on l3-May, and so on 14- and IS-May final samples were taken using the Preussag pressure sampler and analyzed as number 306/26. For additional information about the chemical changes during swabbing, the Nagra bailer samples taken on II-May and l3-May were analyzed as 306/24 and 306/25, respectively. Based on its tracer and tritium contents, sample 306/26 appears to contain no more than one per cent drilling fluid. There are inconsistencies in the tracer results and measurements of other parameters in this and the earlier samples (306/24 and 25) which prevent an estimation of whether only drilling fluid could be a contaminant of 306/26 or whether water from some other zone in the borehole could have been involved as well. Thus, the reconciled analysis which follows, based on sample 306/26 only, must be used with caution.
The chemistry of the water taken from the 1433 m zone is given in Table 7.1. Because of the inconsistencies in chemistry of the formation fluid samples, the concentrations of dissolved constituents, including 0Z(aq) and total HzS are taken from the Fresenius analyses of sample 306/26. The high 0Z(aq) content of the sample analyzed by PSI suggests it includes atmospheric contamination. Thus, no dissolved gas concentrations for this sample are given in Table 7.1
The only uranium analysis available is an AERE determination on sample 306/24, which was collected using a Nagra bailer on II-May. This value is included in Tables 7.1 and 7.2, but is treated as an upper limiting value. The pE value calculated at uraninite saturation is thus also an upper limiting value.
Arsenate was sought but not detected in this example, so the pE for the arsenic couple is an upper limiting value calculated assuming the arsenate concentration was at its detection limit of 0.005 mg/l. The fact that the uraninite and arsenic pE values agree within better than one pE unit is irrelevant because both

NAGRA NTB 86-19 - 93 -
7.3.10
7.3.11
are limiting values. As usual, the pE calculated from the sulphur couple is much lower.
Crystalline 1643.4 m (1637.4 - 1649.3 m) l5-Feb-85 Sample 306/16 Block 1 Reference: WITTWER (1986) Sect. 5.6.9
Drilling between 1100 and 1600 m did not intersect any significant fracture zones. Between 1600 and 1640 m, open fractures in the bedrock resulted in a greater loss of de-ionized drilling fluid to the formation. A three-fold increase in artesian flow from the borehole was also observed. During the cleaning phase, more than 130 m3 of formation fluid were pumped from the interval to reduce contamination levels to around one per cent. Tritium levels were between 1.2 and 0.7 ± 0.7 TU at the time of sampling. Because of the effectiveness of the cleaning phase in reducing the drill fluid content of the sample, this analysis was assigned to Block 1. A down-hole pressure sample could not be collected.
The chemistry of this sample is given in Table 7.1. The concentrations of dissolved solids, 02(aq)' CO2(aq) and total H2S are taken from the Fresenius analyses. The remaining dissolved gases are PSI determinations, and the uranium was analyzed by AERE (Table 7.2). Modeled carbonate values correspond to calcite saturation and have a lower pH and a higher ratio of dissolved CO2 to HC03 than were analyzed.
Arsenate was not detected in this sample, so the pE for the arsenic couple is an upper limiting value" calculated assuming the arsenate was at its detection limit of 0.005 mg/l. This upper limiting value is almost three units more negative than the pE calculated from the platinum electrode potential, suggesting that the latter value is in error.
Table 7.2 shows that the minimum uranium concentration possible for uraninite saturation, even at very low pE values, is about 0.15 ~g/l. This is a factor of ten larger than the reported AERE value, but is similar to the PSI value. Formation conditions are probably best represented by a uranium concentration of about 0.15 ~g/l, and a pE near or below the value calculated from the arsenic couple.
As usual, the pE values calculated from the nitrogen, carbon and hydrogen couples are considerably more negative and probably do not represent conditions which will influence the chemistry of other dissolved redox species.
Crystalline 1665.5 m (1642.2 - 1688.9 m) 30-Apr-85 Sample 306/23 Block 2 Reference: WITTWER (1986) Sect. 5.6.12
This interval was sampled during the borehole testing phase, some two months after it was first drilled. During the cleaning phase some 150 m3 of fluid were pumped from the formation during which

NAGRA NTB 86-19 - 94 -
the drilling fluid contamination level decreased to between 1 and 1.5 per cent. Formation water samples were then collected at 1620 m with the Preussag Bailer (306/22) and at 470 m using the GTC sampler (306/23). The high dissolved oxygen content of 306/22 suggests contamination, so only the results on 306/23 are used. The sample is considered to be Block 2.
The chemistry of the waters from this depth in the crystalline is given in Table 7.1. Modeled carbonate values. correspond to calcite saturation, and have a lower pH and a higher ratio of HC03-
to C03- 2 than were analyzed.
The pE value calculated for uraninite saturation and the uranium concentration on which it is based are both higher than the corresponding values in the otherwise very similar water from the 1643.4 m interval. Formation conditions in this zone may be better represented by a somewhat lower uranium concentration and pE value than the measured values.
The pE values calculated from the nitrogen and carbon couples agree within one pE unit but are highly negative. These couples probably do not reflect conditions which will influence the chemistry of other dissolved redox species.
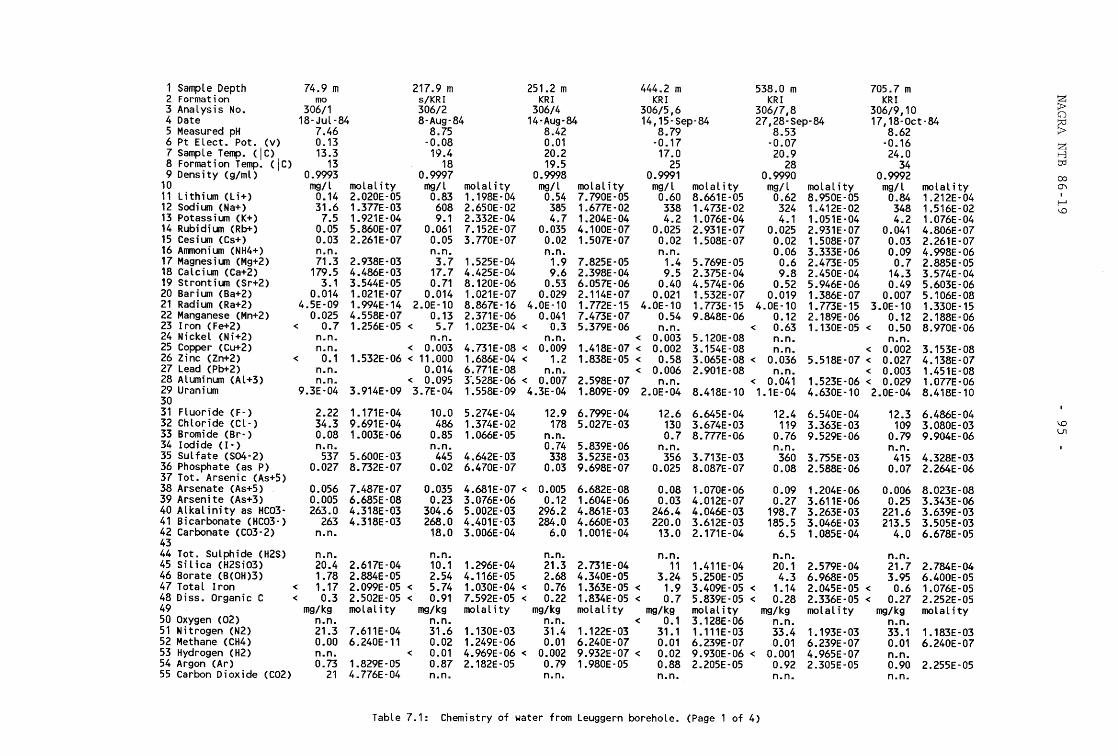
1 Sample Depth 74.9 m 217.9 m 251.2 m 444.2 m 538.0 m 705.7 m 2 Formation rna siKRI KRI KRI KRI KRI Z 3 AnaLysis No. 306/1 306/2 306/4 306/5,6 306/7,8 306/9,10 ~
G1 4 Date 18- JuL -84 8-Aug-84 14-Aug-84 14,15-Sep-84 27,28-Sep-84 17,18-0ct-84 ~ 5 Measured pH 7.46 8.75 8.42 8.79 8.53 8.62 6 Pt ELect. Pot. (v) 0.13 -0.08 0.01 -0.17 -0.07 -0.16 Z 7 SampLe Temp. (IC) 13.3 19.4 20.2 17.0 20.9 24.0 t-3 8 Formation Temp. (IC) 13 18 19.5 25 28 34 tJj
9 Density (g/mL) 0.9993 0.9997 0.9998 0.9991 0.9990 0.9992 00 10 mg/l molality mg/l molaLity mg/L molality mg/l molality mg/l molality mg/l molal ity 0'\ 11 Li th hJln (li + ) 0.14 2.020E·05 0.83 1. 198E'04 0.54 7.790E-05 0.60 8.661E-05 0.62 8.950E-05 0.84 1.212E-04 I
t--l 12 Sodium (Na+) 31.6 1.377E-03 608 2.650E-02 385 1.677E-02 338 1.473E-02 324 1.412E-02 348 1.516E-02 \.0 13 Potassium (K+) 7.5 1.921E-04 9.1 2.332E-04 4.7 1.204E-04 4.2 1.076E-04 4.1 1.051E-04 4.2 1.076E-04 14 Rubidium (Rb+) 0.05 5.860E-07 0.061 7.152E-07 0.035 4.100E-07 0.025 2.931E-07 0.025 2.931E-07 0.041 4.806E-07 15 Cesium (Cs+) 0.03 2.261E-07 0.05 3.770E-07 0.02 1.507E-07 0.02 1.508E-07 0.02 1.508E-07 0.03 2.261E-07 16 Ammonium (NH4+) n.n. n.n. n.n. n.n. 0.06 3.333E-06 0.09 4.998E-06 17 Magnesium (Mg+2) 71.3 2.938E-03 3.7 1.525E-04 1.9 7.825E-05 1.4 5.769E-05 0.6 2.473E-05 0.7 2.885E-05 18 Calcium (Ca+2) 179.5 4.486E-03 17.7 4.425E-04 9.6 2.398E-04 9.5 2.375E-04 9.8 2.450E-04 14.3 3.574E-04 19 Strontium (Sr+2) 3.1 3.544E-05 0.71 8.120E-06 0.53 6.057E-06 0.40 4.574E-06 0.52 5.946E-06 0.49 5.603E-06 20 Barium (Ba+2) 0.014 1.021E -07 0.014 1.021E-07 0.029 2.114E-07 0.021 1.532E-07 0.019 1.386E-07 0.007 5.106E-08 21 Radium (Ra+2) 4.5E-09 1. 994E -14 2.0E-10 8.867E-16 4.0E-10 1.772E-15 4.0E-l0 1.mE-15 4.0E-l0 1. 773E-15 3.0E-l0 1.330E-15 22 Manganese (Mn+2) 0.025 4.558E-07 0.13 2.371E-06 0.041 7.473E-07 0.54 9.848E-06 0.12 2.189E-06 0.12 2.188E-06 23 Iron (Fe+2) < 0.7 1.256E-05 < 5.7 1.023E-04 < 0.3 5.379E-06 n.n. < 0.63 1.130E-05 < 0.50 8.970E-06 24 Nickel (Ni+2) n.n. n.n. n.n. < 0.003 5.120E-08 n.n. n.n. 25 Copper (Cu+2) n.n. < 0.003 4.731E-08 < 0.009 1.418E -07 < 0.002 3.154E-08 n.n. < 0.002 3.153E-08 26 Zinc (Zn+2) < 0.1 1.532E-06 < 11.000 1.686E-04 < 1.2 1.838E-05 < 0.58 3.065E-08 < 0.036 5.518E-07 < 0.027 4.138E-07 27 Lead (Pb+2) n.n. 0.014 6.771E-08 n.n. < 0.006 2.901E·08 n.n. < 0.003 1.451E-08 28 Aluminum (Al+3) n.n. < 0.095 3-.528E·06 < 0.007 2.598E-07 n.n. < 0.041 1.523E-06 < 0.029 1.077E-06 29 Uranium 9.3E-04 3.914E-09 3.7E-04 1.558E-09 4.3E-04 1.809E-09 2.0E-04 8.418E-l0 1.lE-04 4.630E-l0 2.0E-04 8.418E-l0 30 31 Fluoride (F-) 2.22 1.171E-04 10.0 5.274E-04 12.9 6.799E-04 12.6 6.645E-04 12.4 6.540E-04 12.3 6.486E-04 32 Chloride (Cl-) 34.3 9.691E-04 486 1.374E-02 178 5.027E-03 130 3.674E-03 119 3.363E-03 109 3.080E-03 \.0
33 Bromide (Br-) 0.08 1.003E-06 0.85 1.066E-05 0.7 8.777E-06 0.76 9.529E-06 0.79 9.904E-06 lJl n.n. 34 Iodide (I -) n.n. n.n. 0.74 5.839E-06 n.n. n.n. n.n. 35 Sulfate (S04-2) 537 5.600E-03 445 4.642E-03 338 3.523E-03 356 3.713E-03 360 3.755E-03 415 4.328E-03 36 Phosphate (as P) 0.027 8.732E-07 0.02 6.470E-07 0.03 9.698E-07 0.025 8.087E-07 0.08 2.588E-06 0.07 2.264E-06 37 Tot. Arsenic (As+5) 38 Arsenate (As+5) 0.056 7.487E-07 0.035 4.681E-07 < 0.005 6.682E-08 0.08 1.070E-06 0.09 1.204E-06 0.006 8.023E-08 39 Arsenite (As+3) 0.005 6.685E-08 0.23 3.076E-06 0.12 1.604E-06 0.03 4.012E-07 0.27 3.611E-06 0.25 3.343E-06 40 Alkalinity as HC03- 263.0 4.318E-03 304.6 5.002E-03 296.2 4.861E-03 246.4 4.046E-03 198.7 3.263E-03 221.6 3.639E-03 41 Bicarbonate (HC03-) 263 4.318E-03 268.0 4.401E-03 284.0 4.660E-03 220.0 3.612E-03 185.5 3.046E-03 213.5 3.505E-03 42 Carbonate (C03-2) n.n. 18.0 3.006E-04 6.0 1.001E-04 13.0 2.171E-04 6.5 1.085E-04 4.0 6.678E-05 43 44 Tot. Sulphide (H2S) n.n. n.n. n.n. n.n. n.n. n.n. 45 Silica (H2Si03) 20.4 2.617E-04 10.1 1. 296E-04 21.3 2.731E-04 11 1.411E-04 20.1 2.579E-04 21.7 2.784E-04 46 Borate (B(OH)3) 1.78 2.884E-05 2.54 4.116E-05 2.68 4.340E-05 3.24 5.250E-05 4.3 6.968E-05 3.95 6.400E-05 47 Total I ron < 1.17 2.099E-05 < 5.74 1.030E-04 < 0.76 1.363E-05 < 1.9 3.409E-05 < 1.14 2.045E-05 < 0.6 1.076E-05 48 Diss. Organic C < 0.3 2.502E-05 < 0.91 7.592E-05 < 0.22 1.834E-05 < 0.7 5.839E-05 < 0.28 2.336E-05 < 0.27 2.252E-05 49 mg/kg moLaLity mg/kg molal ity mg/kg molality mg/kg molality mg/kg molality mg/kg molal ity 50 Oxygen (02) n.n. n.n. n.n. < 0.1 3.128E-06 n.n. n.n. 51 Nitrogen (N2) 21.3 7.611E-04 31.6 1.130E-03 31.4 1.122E-03 31.1 1.111E -03 33.4 1. 193E-03 33.1 1.183E-03 52 Methane (CH4) 0.00 6.240E-ll 0.02 1.249E-06 0.01 6.240E-07 0.01 6.239E-07 0.01 6.239E-07 0.01 6.240E-07 53 Hydrogen (H2) n.n. < 0.01 4.969E-06 < 0.002 9.932E-07 < 0.02 9.930E-06 < 0.001 4.965E-07 n.n. 54 Argon (Ar) 0.73 1.829E-05 0.87 2.182E-05 0.79 1.980E-05 0.88 2.205E-05 0.92 2.305E-05 0.90 2.255E-05 55 Carbon Dioxide (CO2) 21 4.776E-04 n.n. n.n. n.n. n.n. n.n.
Table 7.1: Chemistry of water from Leuggern borehole. (Page 1 of 4)

1 Sample Depth 74.9 m 217.9 m 251.2 m 444.2 m 538.0 m 705.7 m 2 Formation mo siKRI KRI KRI KRI KRI Z
;:t> 3 Analysis No. 306/1 306/2 306/4 306/5,6 306/7,8 306/9,10 GJ 4 Date 18-Jul-84 8-Aug-84 14-Aug-84 14,1S-Sep-84 27,28-Sep-84 17,18-0ct-84 ~ 57
58 Dissolved Solids: mg/l di fference mg/l di fference mg/l difference mg/l difference mg/l difference mg/l difference Z 59 Sum 1015 1760 1099 988 951 1037 H 60 Residue (11OIC) 1089 7.3% 1750 -0.6% 1077 -2.0% 1024 3 • .,.,-' 1006 5.8% 1037 0.0% td
61 Residue (180 C) 1051 3.6% 1740 -1.1% 1061 -3.4% 1014 2 . .,.,-' 998 5.0% 1035 -0.2% 00
62 0'\
63 Charge Balance: -0.43% 0.19% 0.24% ·1 .79"-' 0.62% 1.05% I
t--' 64 \.0
65 Total Dissolved CO2 mg/l molal ity mg/l molality mg/l molality mg/l molal i ty mg/l molality mg/l molali ty 66 Analysed 67 Fresenius 4.795E-03 4.702E-03 4.761E·03 3.829E-03 3.155E-03 3.572E-03 68 EIR 4.630E-03 3.250E-03 3.070E-03 69 Calculated 70 With Meas. pH 4.632E-03 4.750E-03 4.785E·03 3.826E-03 3.142E-03 3.437E-03 71 At Caldte Satn 4.980E-03 5.022E-03 4.832E-03 4.006E-03 3.200E-03 3.630E·03 72 73 MODELED VALUES: 74 75 Carbonate System 76 pH 7.16 8.06 8.27 8.28 8.32 8.05 77 Carbon Dioxide(C02) 30 6.746E-04 4 S.775E-05 2 5.266E-05 2 3.983E-05 1 2.797E-05 2 5.654E-05 78 Bicarbonate (HC03-) 262 4.295E·03 297 4.886E-03 287 4.710E-03 238 3.901E·03 189 3.110E-03 215 3.527E-03 79 Carbonate (C03-2) 1 1.059E-05 3 4.916E-05 4 6.845E-05 4 6.593E-05 4 6.206E-05 3 4.634E-05 80 Hydroxide (OH-) 0 1.789E-07 0 1.609E-05 0 3. 136E-06 0 2.266E-06 0 9.774E-06 0 7.143E-06 81 Total Dissolved CO2 4.980E-03 5.022E-03 4.832E-03 4.006E-03 3.200E-03 3.630E-03 82 log P(C02) -1.86 -2.67 -2.88 -2.93 -3.05 -2.68 83 84 Saturation Indices: \.0
85 Calcite 0.00 0.00 0.00 0.00 0.00 0.00 0'\
86 Dolomite -0.26 -0.47 -0.48 -0.56 -0.91 -0.97 87 Gypsum -0.74 -1.81 -2.10 -2.08 -2.05 -1.86 88 Anhydrite -1.22 -2.23 -2.50 -2.42 -2.36 -2.10 89 Celestite -0.78 -1.49 -1.64 -1.74 -1.61 -1.61 90 Barite 0.22 0.06 0.33 0.13 O.OS -0.44 91 Fluorite -0.22 0.04 0.04 -0.03 -0.06 0.02 92 Chalcedony 0.12 -0.26 0.05 -0.31 -0.08 -0.11 93 Quartz 0.58 0.20 0.49 0.12 0.34 0.29 94 95 Oxidation State at 96 Formation Temp. pE Eh(volts) pE Eh(volts) pE Eh(volts) pE Eh(volts) pE Eh(volts) pE Eh(volts) 97 Pt Electrode 2.29 0.13 -1.38 -0.08 0.17 0.01 -2.95 -0.17 -1.20 -0.07 -2.71 -0.17 98 Calculated from: 99 U02 Satn. -0.01 -0.00 -1.68 -0.10 -1.91 -0.11 -2.20 -0.13 See Text -2.02 -0.12
100 02(aq)/H20 < 11.83 0.70 101 02(aq)/H20(Sato) < 1.73 0.10 102 As(V)/As(III) 0.69 0.04 -2.20 -0.13 < -2.92 -0.17 -2.23 -0.13 -2.86 -0.17 -3.10 -0.19 103 N2(AQ)/NH4+ -4.67 -0.28 -4.50 -0.27 104 S04-2/H2S 10S C02/CH4 -3.38 -0.19 -S.02 -0.29 -5.2S -0.30 -5.37 -0.32 -S.49 -0.33 -S.27 -0.32 106 H+/H2(AQ) > -6.95 -0.40 > -6.81 -0.40 > -7.32 -0.43 > -6.72 -0.40
Table 7.1: Chemistry of water from leuggern borehole. (Page 2 of 4)

1 Sample Depth 847.0 m 923.0 m 1203.2 m 1433.4 m 1643.4 m 1665.5 m 2 Formation KRI KRI KRI KRI KRI KRI ~ 3 Analysis No. 306/18,19 306/11b,12,13,CORR 306/20,21 306/26 306/16 306/23 GJ 4 Date 26,27-Mar-85 28,30-Nov,7-Dec-84 22,23-Apr-85 14-May-85 15-Feb-85 30-Apr-85
~ 5 Measured pH 8.65 7.75 8.79 8.50 8.22 8.25 6 Pt Elect. Pot. (v) -0.07 -0.02 Z 7 Sample Temp. (IC) 18.0 26.9 35 34.5 H 8 Formation Temp. (IC) 40 42 51 59 66 66 Qj
9 Density (g/ml) 0.9991 1.0023 0.9989 0.9993 0.9991 0.9991 co 10 mg/l molality mg/l molality mg/l molality mg/l molality mg/l molal ity mg/l molality 0'\ 11 Uthium (U+) 0.96 1.386E-04 3.09 4.463E-04 0.78 1.126E-04 1.97 2.844E-04 1.08 1.559E-04 1.00 1.443E-04 I
r--' 12 Sodium (Na+) 332 1.447E-02 1108 4.832E-02 311 1.355E-02 468 2.040E-02 295 1.285E-02 295 1.285E-02 \.0 13 Potassium (K+) 8.0 2.050E-04 13.3 3.410E-04 6.0 1.538E-04 9.9 2.537E-04 8.8 2.255E-04 16.3 4.176E-04 14 Rubidium (Rb+) 0.052 6.096E-07 0.049 5.745E-07 0.083 9.731E-07 0.089 1.043E-06 15 Cesium (Cs+) 0.04 3.015E-07 0.02 1.508E-07 0.07 5.278E-07 0.05 3.769E-07 16 Ammonium (NH4+) 0.08 4.443E-06 0.05 2.777E-06 O.OB 4.444E-06 0.13 7.220E-06 0.14 7.775E-06 17 Magnesium (Mg+2) 0.3 1.236E-05 2.2 9.072E-05 0.2 B.243E-06 0.5 2.061E-05 0.1 4.121E-06 0.1 4.121E-06 1B Calcium (Ca+2) 15.0 3.750E-04 424 1.061E-02 6.1 1.525E-04 12.B 3.200E-04 9.4 2.350E-04 10.2 2.549E-04 19 Strontium (Sr+2) 0.52 5.946E-06 7.4 8.467E-05 0.24 2.745E-06 0.67 7.662E-06 0.47 5.374E-06 0.43 4.916E-06 20 Barium (Ba+2) 0.052 3.793E-07 0.12 8.755E-07 0.052 3.794E-07 0.19 1.386E-06 21 Radium (Ra+2) 1.0E-09 4.433E-15 7.0E-10 3.103E-15 1.1E-09 4.877E-15 5.0E-10 2.216E-15 22 Manganese (Mn+2) 0.14 2.553E-06 3.35 6.114E-05 0.06 1.094E-06 0.013 2.371E-07 0.13 2.371E-06 0.095 1.732E-06 23 Iron (Fe+2) < 0.4B 8.611E-06 < 1.3 2.332E-05 < 3.25 5.831E-05 < 0.26 4.664E-06 24 Nickel (Ni+2) n.n. < 0.002 3.413E-OB < 0.002 3.414E-08 < 0.004 6.B25E-08 < 0.009 1.536E-07 25 Copper (Cu+2) n.n. < 0.002 3.154E-OB < 0.002 3.154E-OB < 0.002 3.153E-OB < 0.002 3.153E-OB 26 Zinc (Zn+2) < 0.22 3.372E-06 < 0.01 1.533E-07 < 0.002 3.066E-08 < 0.22 3.372E-06 < 0.21 3.21BE-06 27 Lead (Pb+2) n.n. < 0.002 9.672E-09 < 0.002 9.673E-09 < 0.003 1.451E-OB < 0.004 1.934E-OB 2B Aluminum (Al+3) < 0.045 1.671E-06 < 0.006 2.229E-07 < 0.035 1.300E-06 < 0.047 1.745E-06 < 0.2 7.426E-06 < 0.046 1. 70BE-06 29 Uranium 1.2E-05 S.051E-11 1.4E-04 S.893E-10 <4.8E-04 2.021E-09 1.SE-OS 6.313E-11 2.0E-04 B.417E-10 30 31 Fl uor i de (F - ) 13_4 7.067E-04 2.9 1.530E-04 15.4 B.122E-04 12.2 6.43SE-04 14.3 7.541E-04 14.S 7.646E-04 32 Chloride (Cl-) 123 3.476E-03 203 5.741E-03 132 3.731E-03 422 1.193E-02 12S 3.S32E-03 124 3.S04E-03 \.0 33 Bromide (Br-) 0.72 9.027E-06 0.76 9.S30E-06 4.00 S.016E-OS 0.72 9.026E-06 0.79 9.904E-06 ---J 34 Iodide (I -) n.n. n.n. n.n. n.n. n.n. 35 Sulfate (S04-2) 362 3.776E-03 30S7 3.191E-02 270 2.816E-03 27B 2.900E-03 263 2.743E-03 2S2 2.62BE-03 36 Phosphate (as P) O.OS 1.617E-06 0.013 4.208E-07 0.OS2 1.682E-06 O.OOS 1.61BE-07 0.04 1.294E-06 O.OB 2.587E-06 37 Tot. Arsenic (As+S) 0.11 1.471E -06 38 Arsenate (As+5) < O.OOS 6.686E-08 < 0.005 6.687E-08 < O.OOS 6.687E-OB < O.OOS 6.686E-OB 39 Arsenite (As+3) 0.S3 7.088E-06 0.03 4.012E-07 0.013 1.739E-07 0.074 9.B9SE-07 40 Alkalinity as HC03- 236.B 3.889E-03 73.0 1.199E-03 24S.4 4.030E-03 203.1 3.336E-03 277.1 4.S49E-03 268_2 4.403E-03 41 Bicarbonate (HC03-) 216.S 3.S5SE-03 73 1.199E-03 220.0 3.613E-03 19S.0 3.202E-03 273.0 4.482E-03 2S6.0 4.203E-03 42 Carbonate (C03-2) 10.0 1.670E-04 n.n. 12.S 2.0B7E-04 4.0 6.680E-OS 2.0 3.339E-OS 6.0 1.002E-04 43 44 Tot. Sulphide (H2S) 0.04 1.176E-06 n.n. 0.32 9.408E-06 0.6 1. 764E-05 n.n. 4S Silica (H2Si03) 30.4 3.900E-04 7.4 9.499E-OS 26.S 3.400E-04 26.0 3.336E-04 S2.0 6.670E-04 47.2 6.0S4E-04 46 Borate (B(OH)3) 2.99 4.845E-OS S.6 9.0BOE-OS 3.03 4.910E-OS S.2 B.427E-OS 3.36 S.444E-OS 3.1 S.022E-OS 47 Total Iron < 0.71 1.274E-OS < 4.6 B.253E-OS n.n. < 0.76 1.363E-OS < 0.68 1.220E-05 4B Diss. Organic C < 1.2 1.001E-04 < 0.93 7.75BE-OS < 4.0 3.337E-04 < 0.34 2.836E-OS < 1.7 1.41BE-04 49 mg/kg molal ity rng/kg molality mg/kg molal ity mg/kg molality mg/kg molal ity mg/kg molality SO Oxygen (02) n.n. n.n. n.n. n.n. n.n. 51 Nitrogen (N2) 33.3 1. 190E-03 37.0 1.322E-03 30.1 1.075E-03 37.S 1.340E-03 S2 Methane (CH4) 0.02 1.24BE-06 O.OB 4.991E-06 0.02 1. 248E-06 0.03 1.B72E-06 S3 Hydrogen (H2) n.n. n.n. < 0.02 9.930E-06 n.n. 54 Argon (Ar) 0.92 2.30SE-OS 0.99 2.4BOE-OS O.BS 2.130E-05 0.90 2.255E-OS 5S Carbon Dioxide (CO2) n.n. n.n. n.n. n.n. n.n.
Table 7.1: Chemistry of water from leuggern borehole. (Page 3 of 4)

1 Sample Depth 847.0 m 923.0 m 1203.2 m 1433.4 m 1643.4 m 1665.5 m 2 Formation KRI KRI KRI KRI KRI KRI S; 3 Analysis No. 306/18,19 306/11b,12,13,CORR 306/20,21 306/26 306/16 306/23 GJ 4 Date 26,27-Mar-85 28,30-Nov,7-Dec-84 22,23-Apr-85 14-May-85 15-Feb-85 30-Apr-85 ~ 57
58 Dissolved Solids: mg/l difference mg/l di fference mg/l difference mg/l difference mg/l di fference mg/l difference Z 59 Sum 1001 4871 889 1343 899 888 t--3 60 Residue (110/C) 995 -0.6% 4988 2.4% 854 -4.0% 1306 -2 • .,.,,, 916 1.9% 882 -0.7% to 61 Residue (180 C) 995 -0.6% 4914 0.9% 852 -4.2% 1300 -3.2% 902 0.3% 880 -0.9% co 62 0"1
63 Charge Balance: 0.01% -0.16% -0.10% -3.94% 0.16% I
t--l 64 \0 65 Total Dissolved CO2 mg/l molality mg/l molal ity mg/l molal ity mg/l mg/l molality mg/l molality 66 Analysed 67 Fresenius 3.722E-03 1. 199E-03 3.821E-03 4.516E-03 4.303E-03 68 EIR 3.630E-03 4.320E-03 69 Calculated 70 With Meas. pH 3.609E-03 1. 187E-03 3.547E-03 2.941E-03 4.301E-03 4.156E-03 71 At Calcite Satn 3.906E-03 1. 269E-03 3.931E-03 3.292E-03 4.590E-03 4.469E-03 72 73 MODELED VALUES: 74 75 Carbonate System 76 pH 7.90 7.30 8.14 7.82 7.71 7.68 77 Carbon Dioxide(C02) 4 8.096E-05 4 8.543E-05 2 4.619E-05 3 7.818E-05 7 1.483E-04 7 1.542E-04 78 Bicarbonate (HC03-) 230 3.783E-03 71 1. 172E-03 231 3.800E-03 192 3.160E-03 267 4.388E-03 260 4.266E-03 79 Carbonate (C03-2) 3 4.205E-05 1 1. 126E-05 5 8.506E-05 3 5.382E-05 3 5.364E-05 3 4.947E-05 80 Hydroxide (OH-) 0 9.780E-06 0 1~846E-06 0 2.045E-05 0 2. 179E-05 1 3.937E-05 0 1.532E-05 81 Total Dissolved CO2 3.906E-03 1.269E-03 3.931E-03 3.292E-03 4.590E-03 4.469E-03 82 log P(C02) -2.46 -2.42 -2.61 -2.33 -2.00 -1.99 83 84 Saturation Indices: \0
85 Calcite 0.00 0.00 0.00 0.00 0.00 0.00 co 86 Dolomite -1.33 -1.88 -1.11 -1.05 -1.66 -1.69 87 GypSlIJl -1.88 -0.08 -2.35 -2.06 -2.14 -2.11 88 Anhydrite -2.05 -0.24 -2.41 -2.03 -2.04 -2.01 89 Celestite -1.62 -0.10 -2.02 -1.61 -1.69 -1. 75 90 Barite 0.31 0.47 -0.03 0.53 91 Fluorite 0.07 -0.26 -0.28 -0.26 -0.28 -0.23 92 Chalcedony -0.03 -0.65 -0.22 -0.29 -0.06 -0.10 93 Quartz 0.35 -0.27 0.14 0.04 0.26 0.22 94 95 Oxidation State at 96 Formation Temp. pE Eh(volts) pE Eh(volts) pE Eh(volts) pE Eh(volts) pE Eh(volts) pE Eh(volts) 97 Pt Electrode -1.21 -0.08 '0.33 -0.02 98 Calculated from: 99 U02 Satn. See Text See Text < -2.04 -0.13 See Text -2.53 -0.17
100 02(aq)fH20 101 02(aq)/H20(Sato) 102 As(V)/As(III) < -3.22 -0.20 < -3.38 -0.22 < -2.85 -0.19 < -3.18 -0.21 103 N2(AQ)/NH4+ -4.44 -0.28 -4.89 -0.31 -4.78 -0.32 -4.74 -0.32 104 S04-2/H2S -4.45 -0.28 -4.96 -0.32 -4.73 -0.31 105 C02/CH4 -5.26 -0.33 -5.78 -0.37 '5.45 -0.37 -5.44 -0.37 106 H+/H2(AQ) > -6.79 -0.46
Table 7'.1: Chemistry of water from Leuggern borehole. (Page 4 of 4)

NAGRA NTB 86-19 - 99-
8.0 SUMMARY AND CONCLUSIONS
Water samples were taken from a number of intervals in the first six Nagra test boreholes as part of a programme to characterize the subsurface environment. A variety of field collection methods and field and laboratory analytical techniques were used as described by HAUG (1985) and KUSSMAUL AND ANTONSEN (1985). The conditions surrounding the collection of each sample and the results of analyses for dissolved solids and gases are given by WITTWER (1986). This report examines the extent to which the analytical results correspond to in situ groundwater conditions.
Pristine samples of groundwater could not be collected from most intervals. It was important to collect samples during, or shortly after drilling, and from borehole intervals yielding very little water. In spite of extensive borehole cleaning efforts, many samples contained some residual drilling fluid, and all were affected by reactions with borehole tools and sampling equipment. The fact that most drilling fluid contained tracer, and that records of field activities during drilling and sampling were available made it possible to correct for drilling fluid contamination in all but a few samples. On the other hand, it was not possible to correct for the HZ(aq)' and iron and other metals which entered the samples as a result of reactions between the water and tools and sampling apparatus in the borehole.
Geochemical modelling was used to test the internal consistency of the analytical results and to gain information about the subsurface environment. Modelling of the carbonate system showed that the analytical data in virtually all samples led to positive calcite saturation indices. Calcite oversaturation is improbable geochemically, and is attributed in these samples to the loss of CO2 during sampling with resultant reporting of pH values that are too high. Groundwater conditions were therefore simulated by mathematically adding COz to the sample to reach calcite saturation. After this adjustment, waters from intervals of carbonate rock appeared to be saturated with respect to dolomite as well as with calcite.
Oxidation potentials were calculated from the platinum electrode potential and from analyzed concentrations of members of several redox couples. pE values based on the arsenic couple, and on the assumption of uraninite saturation tend to be similar. The platinum electrode potential measured in some samples is also similar. The range of pE values defined by these two or three values probably also influences the redox potential of other metallic elements. pE values calculated from the nitrogen, sulphur, carbon and hydrogen couples are more negative. The value calculated using the hydrogen couple would be influenced by excess H2 (a) produced by corrosion of iron in the borehole. The rates oqf reactions of the other three couples are so slow that they probably have little or no influence on the behaviour of other redox reactions in the groundwaters.
Saturation indices were also calculated for the minerals gypsum, anhydrite, celestite, barite, fluorite, and the silica minerals

NAGRA NTB 86-19 - 100-
quartz and chalcedony. All are present in one or more of the rock types sampled. With a few exceptions, there is consistency between the calculated saturation indices and the presence of the respective minerals. This consistency indicates that the analytical data on the components of the minerals are reliable, as are the mineral properties included in the thermochemical data base.
Saturation indices calculated for barite vary more widely than do those for the other sulphate minerals. This suggests that the barium analyses are generally less reliable than are the analyses of the other alkaline earth cations.
Several disparate values for the equilibrium constant for fluorite appear in the literature. The value chosen for inclusion in the thermodynamic data base used here is most consistent with fluorite saturation in many of these waters.
Silica analysis were made on filtered and (or) unfiltered samples. Most silica results correspond to concentrations between quartz and chalcedony saturation. Some are outside this range, however, suggesting difficulties with the silica analyses themselves or with sample preparation procedures.
The results of uranium analysis made both by PSI and AERE are included. Generally, the AERE analyses have been taken to represent the groundwater conditions because of their reported high preclslon. In several samples, particularly from the Leuggern borehole, the AERE values are too low to represent saturation with respect to uraninite at any pE. For these samples, the generally higher concentrations reported by PSI lead to pE values at uraninite saturation which are consistent with other pE indicators, such as the arsenic couple and the platinum electrode potential.

NAGRA NTB 86-19 - 101 -
9.0 LITERATURE CITED
Back, W., Hanshaw, B. B., P1ununer, L. N., Rahn, P. H., Rightimre, C. T., and Rubin, M., 1983, Process and rate of dedolomitization: Mass transfer and 14C dating in a regional carbonate aquifer: Geo1. Soc. of Am. Bulletin, v. 94, p. 1415-1429.
Baes, C. F., Jr., and Mesmer, R. E., 1976, The Hydrolysis of Cations: New York, John Wiley, 489 p.
Barnes, I., and Back, W., 1964, Geochemistry of iron-rich ground water in southern Maryland: J. Geology, v. 72, p. 435-447.
Berner, R. A., 1963, Electrode Studies of Hydrogen Sulfide in Marine Sediments: Geochim. Cosmochim. Acta, v. 27, p. 563-575.
Haug, A., 1985, Feldmethoden zur Grundwasserentnahme aus Tiefbohrungen und zur Hydrochemischen Uberwachung der Bohrspulung: Baden, Switzerland, Nagra, Technischer Bericht 85-07, 71 p.
Kussmaul, H., and Antonsen, 0., 1985, Hydrochemische Labormethoden fur das Nagra-Untersuchungsprogr,amm: Baden, Switzerland, Nagra, Technischer Bericht 85-04, 83 p.
Lindberg, R. D., and Runnels, D. D., 1984, Ground water redox reactions: An analysis of equilibrium state applied to Eh measurements and geochemical modeling: Science, v. 225, p. 925-927.
Nagra, 1982, Sondierbohrung Bottstein-Arbeitsprogramm: Baden, Switzerland, Nagra, Technischer Bericht 82-09, 92 p.
Nordstrom, D. K., and Puigdomenech, I., 1986, Redox Chemistry of Deep Ground Waters in Sweden: Stockholm, Sweden, Svensk Karnbranslehantering AB, SKB Technical Report 86-03, 30 p.
Parkhurst, D .. L., Thorstenson, D. C., and Plununer, L. N., 1980, PHREEQE--A Computer Program for Geochemical Calculations: U.S. Geol. Survey, Water-Resources Investigation 80-96, 187 p. (revised and reprinted, 1985).
Pearson, F. J., Jr., 1985, Sondierbohrung Bottstein - Results of Hydrochemical Investigations: Analysis and Interpretation: Baden, Switzerland, Nagra, Technischer Bericht 85-05, 131 p.
Pearson, F. J., Jr., and Rettman, P. L., 1976, Geochemical and isotopic analyses of waters associated with the Edwards Limestone Aquifer, Central Texas: U. S. Geol. Survey Open-File Report, 35 p.
Pearson, F. J., Jr., Fisher, D. W., and P1ununer, L. N., 1978, Correction of ground-water chemistry and carbon isotopic composition for effects of CO2 outgassing: Geochim. Cosmochim. Acta, v. 42, p. 1799-1807.
NAGRA NTB 86-19 - 102 -
Pearson, F. J., Jr., Kelly, V. A., and Pickens, J. F., 1987, Preliminary Design for a Sorbing Tracer Test in the Culebra Dolomite at the H-3 Hydropad at the Waste Isolation Pilot Plant (WIPP) Site: Albuquerque, NM, Sandia National Laboratories, Contractor Report SAND86-7l77, 189 p.
Plummer, L. N., 1977, Defining reactions and mass transfer in part of the Floridan aquifer: Water Resources Research, v. 13, p. 801-812.
Pourbaix, M., 1974, Atlas of Electrochemical Equilibria: Houston, Texas, National Association of Corrosion Engineers; Brussels, CEBELCOR, 644 p.
Sato, M., 1960, Oxidation of sulfide ore bodies, 1. Geochemical environments in terms of Eh and pH: Economic Geology, v. 55, p. 928-961.
Schmassmann, H., 1986, Nagra Besprechung tiber Analysendaten des chemischen Untersuchungsprogramrns: Sitzungsprotokoll vom 12.03.1986: unpublished report to Nagra dated 5.05.86, 8 p.
Schmassmann, H., Balderer, W., Kanz, W., and Pekdeger, A., 1984, Beschaffenheit der Tiefengrundwasser in der zentralen Nordschweiz und angrenzenden Gebieten: Baden, Switzerland, Nagra, Technischer Bericht 84-21, 335 p.
Stumm, W., and Morgan, J. J., 1981, Aquatic Chemistry, Second Edition: New York, John Wiley, 780 p.
Wagman, D. D., Evans, W. H., Parker, V. B., Schumm, R. H., Halow, I., Bailey, S. M., Churney, K. L. and Nuttall, R. L., 1982, The NBS tables of chemical thermodynamic properties: J. Phys. and Chern. Ref. Data, v. 11, 391 p.
Wittwer, C., 1986, Sondierbohrungen Bottstein, Weiach, Riniken, Schafisheim, Kaisten, Leuggern: Probenahmen und chemische Analysen von Grundwassern aus den Sondierbohrungen: Baden, Switzerland, Nagra, Technischer Bericht 85-49, 142 p.

APPENDIX
Thermodynamic Data
Used for Geochemical Modelling

NAGRA NTB 86-19 - A.2 -
1. 2. 2.1 2.2 3. 3.1 3.2 3.3 3.4 3.5 3.6 4. 4.1 4.2 4.3 5. 5.1 5.2
1
2
3
4
5
INTRODUCTION DESCRIPTION OF DATA Aqueous Species
CONTENTS
Minerals and Redox Pairs DISCUSSION Sources of Data Activity Coefficients of Solute Species Internal Consistency of Data. Entropy Values ........... . Calculation of Oxidation Potentials Temperature Dependence of Equilibrium Constants SELECTION OF DATA Aqueous Species Minerals PE Calculations REFERENCES Numbered References in Data Base References Cited
LIST OF TABLES
Values of parameters in activity coefficient equations for individual ions . . . . . . . . . . . .
Values of stability constants for aluminum hydrolysis species and gibbsite . . . . . .
Thermodynamic data for aqueous species
Thermodynamic data for minerals . . . .
Thermodynamic data for the calculation of oxidation poten-tials . . . . . . . . . . . . . . . . . . . . . . . . . . .
APPENDIX A
A.3 A.3 A.4 A.5 A.6 A.6 A.7 A.9
A.IO A.II A.II A.12 A.12 A.14 A.18 A.19 A.19 A.19
A.9
A.13
A.24
A.39
A.42

NAGRA NTB 86-19 - A.3 - APPENDIX A
1.
2.
INTRODUCTION
This appendix gives the thermodynamic data used in the geochemical modelling for NTB 86-19. The data themselves appear in Tables 3, 4 and 5. This text describes the tables and the conventions followed in assembling them, discusses the selection of the data used, and gives citations to the sources of these data.
Al thou.gh thermodynamic data are independent of any particular geochemical computer model, the fact that these data were to be used principally with PHREEQE (PARKHURST AND OTHERS, 1980) influenced the structure of the data base. For example, PHREEQE treats redox reactions using the concept of operational valence (OPV) , so the value of the OPV for each species appears in the data base. Likewise, PHREEQE uses logarithms of equilibrium constants (log K) to characterize reactions, rather than Gibbs energies of phases and aqueous species. Thus, log K values are stressed in the data base and experimentally determined log K values are taken as the preferred sources of data from which other thermodynamic properties are calculated.
These data could equally well be used with a number of other geochemical codes which employ the ion-pair model of solution behaviour. Such codes include, for example, codes in the WATEQ series (TRUESDELL AND JONES, 1974, PLUMMER AND OTHERS, 1976, BALL AND OTHERS, 1980, BALL AND OTHERS, 1987), MINEQL (SCHWEINGRUBER, 1983, WANNER, 1986), EQ3/EQ6 (WOLERY, 1983), and MINTEQ (FELMY AND OTHERS, 1984). The same results as given in the body of this report should be obtained with any of these or similar codes if used with this data set (INTERA, 1983).
The number of master species in the data base is 31, above the limit of 30 master species of the original PHREEQE (PARKHURST AND OTHERS, 1980). To use these data with an original version of PHREEQE, it would be necessary to drop one master species and to number the aqueous complex species starting with 31.
The data in this Appendix include many of the same elements as the data base given in the Appendix to PEARSON AND OTHERS (1987). Some of the data for aqueous species and minerals differ between the two data bases. Those included in this data base reflect more recent experimental work and should be used in preference to those in the earlier data base.
DESCRIPTION OF DATA
The data are given in three tables. Table 3 includes data on aqueous species, Table 4 data on minerals, and Table 5 data on oxidation-reduction reactions. This section of text describes the form and content of these data tables.
In this text and tables, units of Joules or kiloJoules are used. For use with the PHREEQE programme or comparison with data sets for such other programmes as MINEQL/EIR (WANNER, 1986), the data

NAGRA NTB 86-19 - A.4 - APPENDIX A
must be converted to units of calories or kilocalories. For conversion:
4.184 (k)Joule 1 (k)calorie
2.1 Aqueous Species
Thermodynamic data for aqueous species are given in Table 3. The first 31 species are the "master species" of PHREEQE (PARKHURST AND OTHERS, 1980) or the "basis species" of EQ3/EQ6 (WOLERY, 1983). They are the species in terms of which the association reactions of all subsequent species are written. The numbering of the subsequent aqueous species begins with 51.
In the table there are at least six lines of data for each species. These contain:
First Line:
Species number in this data base, chemical formula, and sources of data chosen. Numbered references to the sources of data for each species and mineral are given. The full reference corresponding to each number is given in Section 5.1, below. The letter and symbol codes have the following meanings:
C: Source gives coefficients for log K(T) expression.
K: Source gives value for log K(25).
Gr,Hr,Sr: Source gives Gibbs energy, enthalpy or entropy of reaction, respectively.
G,H,S: Source gives Gibbs energy, enthalpy or entropy of formation, respectively.
"=":
" ". , .
The data sources give the same values.
Data from both sources are combined to reach the value given.
Second line:
Gibbs energy (!J.Go f)' enthalpy (!J.Ho f) and entropy (!J.So f) of formation of the species in its standard state at 25°C and one bar, in kiloJoules/mol, kiloJoules/mol and Joules/mol/K, respectively. Entropies of formation are discussed in Section 3.4, below.
Gibbs energy (!J.Gor ), enthalpy (!J.H°r ) and entropy (!J.SOr ) of the association reaction for the species in its standard state at 25°C and one bar, in the same units as above.

NAGRA NTB 86-19 - A.5 - APPENDIX A
Third Line:
Thor (operational valence or OPV of PHREEQE) of each species. The operational valence is the valence of any species which can be oxidized or reduced under natural conditions. It is required for the conservation-of-electrons equations used in PHREEQE for calculations of redox reactions, and is described in detail in the documentation for that code (PARKHURST AND OTHERS, 1980, p. 6-11).
Charge of species.
Debye-Huckel a O value, discussed in Section 3.2.
Value of log K of the association reaction at 25°C.
Left Side. Fourth. Fifth. Sixth and Subsequent Lines:
These lines contain the headings and data describing the association reaction for the aqueous species. The stoichiometric coefficient, chemical formula, and number (in this data base) of each component species of the reaction forming the species appear in the sixth and subsequent lines. The Gibbs energy, enthalpy and entropy of reaction and the log K values are for this reaction.
Right side. Fourth through Eighth Lines:
These lines contain coefficients A through E for the expression:
log K(T) = A + B • T + CIT + D • T2 + E/T2 (1)
This expression is used in WATEQ and pre-1985 versions of PHREEQE. Other expressions, as used in EQ3/EQ6 or more consistent with the Maier-Kelly heat capacity equation; might be more appropriate for other geochemical models.
2.2 Minerals and Redox Pairs
Data for minerals are given in Table 4. The form of the entries in this table is the same as that for the aqueous species and described in the preceding section. Note that the mineral reactions are written as dissociation reactions, rather than as association reactions as are those for the dissolved species.
Data for the calculation of oxidation potentials from analyzed concentrations of oxidized and reduced species of several elements are given in Table 5. The method for developing the reactions for the calculation of oxidation potential is described in Section 3.5, below.

NAGRA NTB 86-19 - A.6 - APPENDIX A
3. DISCUSSION
3.1 Sources of Data
A number of compilations of thermodynamic data were drawn upon in developing this data base. These included:
CODATA (1978, 1980) values of ~Hof and SO were used whenever available for elements and aqueous species. Few CODATA values have been published for minerals included in this data base.
The data set accompanying the MINTEQ programme (FELMY AND OTHERS, 1984) is the source of the log K(25) and ~Hor values for many of the aqueous ion pairs. MINTEQ was developed on behalf of the U.S. Environmental Protection Agency, and combines the computational scheme of MINEQL with the large, well documented base of thermochemical data on aqueous species and minerals which evolved with the WATEQ series of programmes (NORDSTROM AND OTHERS, 1984, BALL AND OTHERS, 1980, PLUMMER AND OTHERS, 1976, TRUESDELL AND JONES, 1974). The documentation for the most recent member of the WATEQ series (BALL AND OTHERS, 1987) includes revisions to some of the data in earlier versions. These revisions are not included in the MINTEQ data set referred to, but were considered in selecting the data in Tables 3 and 4.
Data from what is referred to here as the Perkins/Berman data set accompany the version of PATH running at the University of Bern, Switzerland. Most of the data for aqueous species in this data set are those published by HELGESON AND OTHERS (1978, 1981). The Perkins/Berman data set includes ~Hof and Sa values from which the log K(25) and ~Hor values discussed below were calculated.
Data published by the U.S. National Bureau of Standards (WAGMAN AND OTHERS, 1982) includes ~Go f' ~Ho f and Sa data for many aqueous species and minerals. Values of log K(25) and ~Hor discussed below were calculated from the ~Go~ and ~Ho~ values
.L .L.
given.
The U.S. Geological Survey data base (ROBIE AND OTHERS, 1978) was also consulted. As with the NBS data, the log K(25) and ~Hor values discussed below were calculated from the ~Gof and ~Hof values in this data set.
Data used by the Swiss Federal Institute for Reactor Research (EIR) in MINEQL/EIR (Schweingruber, 1983, 1984; WANNER, 1986) have also been considered. All uranium data adopted are from MINEQL/EIR.
References to the sources of data are given for most species and minerals. Data for those entries for which no references are given are from the data set accompanying MINTEQ.
The data supplied with the version of PHREEQE distributed by the U.S. Geological Survey is widely used in spite of the statement
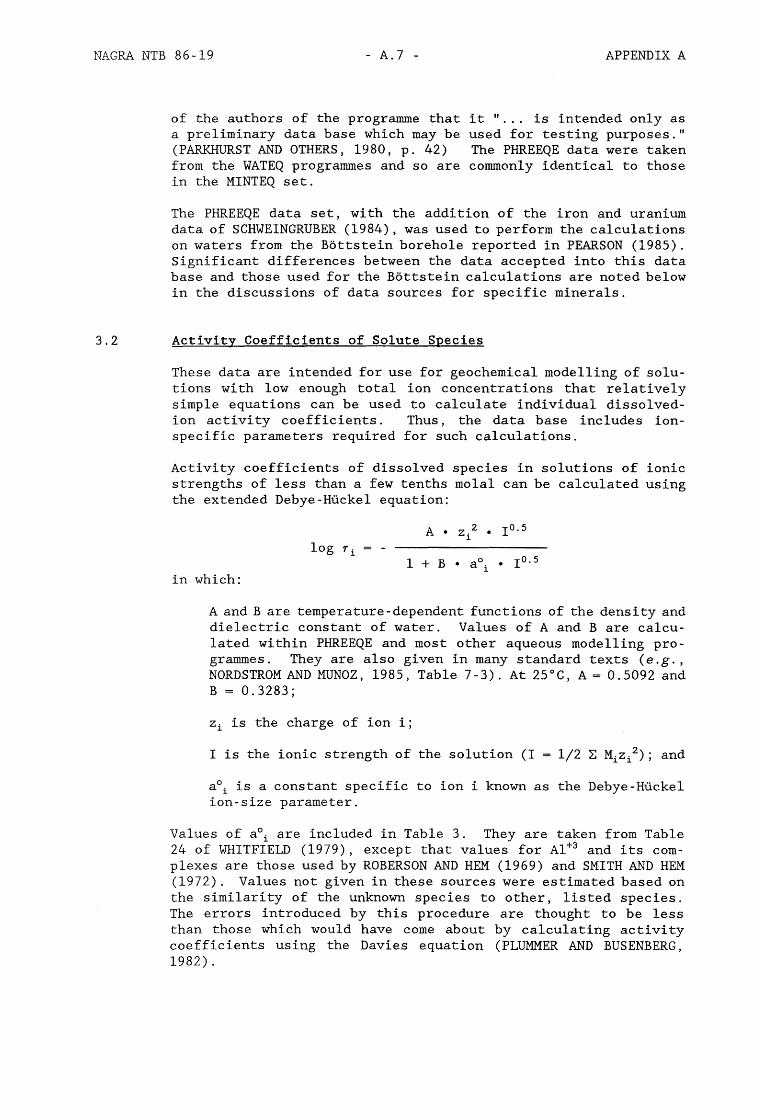
NAGRA NTB 86-19 - A.7 -
of the authors of the programme that a preliminary data base which may be (PARKHURST AND OTHERS, 1980, p. 42) from the WATEQ programmes and so are in the MINTEQ set.
APPENDIX A
it " ... is intended only as used for testing purposes." The PHREEQE data were taken commonly identical to those
The PHREEQE data set, with the addition of the iron and uranium data of SCHWEINGRUBER (1984), was used to perform the calculations on waters from the B6ttstein borehole reported in PEARSON (1985). Significant differences between the data accepted into this data base and those used for the B6ttstein calculations are noted below in the discussions of data sources for specific minerals.
3.2 Activity Coefficients of Solute Species
These data are intended for use for geochemical modelling of solutions with low enough total ion concentrations that relatively simple equations can be used to calculate individual dissolvedion activity coefficients. Thus, the data base includes ionspecific parameters required for such calculations.
Activity coefficients of dissolved species in solutions of ionic strengths of less than a few tenths molal can be calculated using the extended Debye-Huckel equation:
A • Z ,2 • 1.
1 + B • in which:
A and B are temperature-dependent functions of the density and dielectric constant of water. Values of A and B are calculated within PHREEQE and most other aqueous modelling programmes. They are also given in many standard texts (e.g., NORDSTROM AND MUNOZ, 1985, Table 7-3). At 25°C, A = 0.5092 and B = 0.3283;
Zi is the charge of ion i;
I is the ionic strength of the solution (I = 1/2 b Mizi2); and
aOi is a constant specific to ion i known as the Debye-Huckel ion-size parameter.
Values of aOi are included in Table 3. They are taken from Table 24 of WHITFIELD (1979), except that values for Al+3 and its complexes are those used by ROBERSON AND HEM (1969) and SMITH AND HEM (1972). Values not given in these sources were estimated based on the similarity of the unknown species to other, listed species. The errors introduced by this procedure are thought to be less than those which would have come about by calculating activity coefficients using the Davies equation (PLUMMER AND BUS ENBERG , 1982).

NAGRA NTB 86-19 - A.8 - APPENDIX A
In solutions of ionic strengths greater than a few tenths molal, activity coefficients calculated using the extended Debye-Huckel equation are likely to be seriously in error. For such solutions, the Davies or the WATEQ Debye-Huckel equations can be used. The Davies equation, which is said to be useful to ionic strengths of up to 0.5 molal, is written:
= -A • Z 2 • i 1 + 10. 5
in which A, zi and I are as for the previous equation and b i may be either 0.2 or 0.3 (STUMM AND MORGAN, 1981, Table 3.3).
The Davies equation, with b i equal to 0.2, is used in MINEQL/EIR (WANNER, 1986, p. 85) and is an option in PHREEQE, with b i equal to 0.3 (PARKHURST AND OTHERS, 1980, p. 27). This equation is limited because its only ion-specific parameter is the charge.
The WATEQ Debye-Huckel equation contains two ion-specific parameters and is useful to ionic strengths of several molal. It is a semi-empirical equation which was used by TRUESDELL AND JONES (1974) in their original WATEQ programme for aqueous speciation calculations. It has been included in the subsequent versions of WATEQ and is present in PHREEQE as an option for calculating activity coefficients. This equation is also discussed by NORDSTROM AND MUNOZ (1985, Section 7-6) who refer to it as the Truesdell-Jones equation.
The WATEQ Debye-Huckel equation is written:
where:
A • Z.2 • 1.
------------------- + bWi • I
aW •• 1 0 . 5 1 + B • 1.
A, B, zi and I have the same meanings as in the extended Debye-Huckel equation above, and
aWi and bW
i are the WATEQ Debye-Huckel individual ion activity coefficient parameters. These are determined by fitting the WATEQ Debye-Huckel equation to experimental mean-salt activity coefficient data as described by TRUESDELL AND JONES (1974).
Values for WATEQ Debye-Huckel coefficients are not included in Table 3, but can be added to PHREEQE data sets derived from it.
Table 1 gives several sets of values for the Debye-Huckel parameters. The columns labelled Truesdell-Jones include the aW and bW values originally given by those authors (1974, Table 2; see also, NORDSTROM AND MUNOZ, 1985, Table 7-6). Values for Ca+2 ,
Sr+2 , Ba+2 , HC03 - and C03 -2 are from PLUMMER AND BUSENBERG (1982), BUSENBERG AND OTHERS (1984), and BUSENBERG AND PLUMMER (1986).
The columns labelled WATEQ in Table 1 include newly fitted values for aW and bW
. These values were determined by a least-squares fit

NAGRA NTB 86-19 - A.9 - APPENDIX A
Table 1: Values of parameters in activity coefficient equations for individual ions.
T ruesde l L -Jones WATEQ
ION aW bW aW bW
-------------------------
Na+ 4.0 0.075 3.85 0.078 K+ 3.5 0.015 3.54 0.016 Mg+2 5.5 0.20 5.29 0.208
Ca+2 5.0 0.165 5.12 0.161 Sr+2 5.26 0.121 5.16 0.127
Ba+2 4.42 0.095 (4.42 0.095) UO +2
2 5.88 0.223
Cl 3.5 0.015 3.54 0.016 SO -2
4 5.0 -0.04 5.35 -0.068
HC03 5.4 0 5.4 0 CO -2
3 5.4 0 5.4 0
of the WATEQ Debye-Huckel equation to experimental ion activities calculated from mean-salt data given by ROBINSON AND STOKES (1970) using the conventions described and adopted by TRUESDELL AND JONES (1974). The new values were fit to data in the range of ionic strengths of zero to three molal, and agree well with the original TRUESDELL AND JONES (1974) data.
3.3 Internal Consistency of Data
The data in Tables 3, 4 and 5 are internally consistent, and obey the appropriate thermodynamic equalities such as:
D.GO r = -RT In K(25)
D.Ho r = R T2 d( In K(T» /dT
(2)
(3)
(4)
This consistency is maintained by calculating all values from the "highest" data available. The data rank from "highest" to "lowest" as follows:
Coefficients for the equation for log K(T) as a function of temperature, such as values of A through E in equation (1);
log K(25);
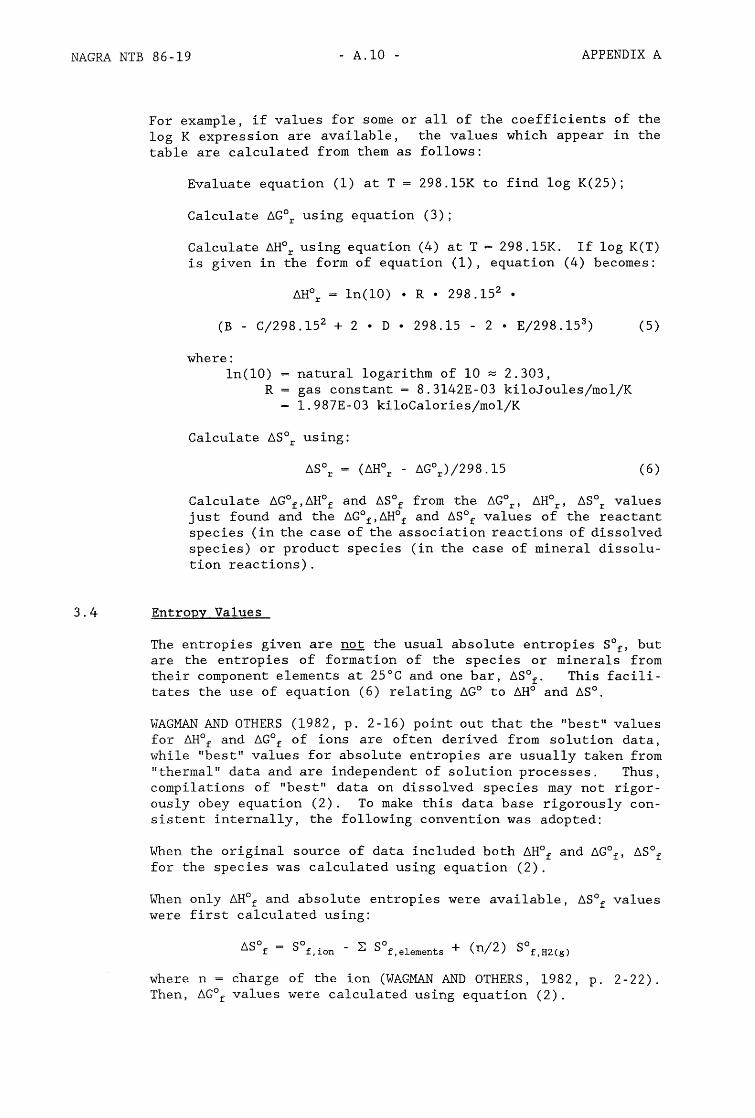
NAGRA NTB 86-19 - A.lO - APPENDIX A
For example, if values for some or all of the coefficients of the log K expression are available, the values which appear in the table are calculated from them as follows:
Evaluate equation (1) at T = 298.l5K to find log K(25);
Calculate ~Gor using equation (3);
Calculate ~Hor using equation (4) at T = 298.l5K. If log K(T) is given in the form of equation (1), equation (4) becomes:
~or = In(lO) • R • 298.152 •
(B - C/298.l52 + 2 • D • 298.15 - 2 • E/298.l53) (5)
where: In(lO)
R natural logarithm of 10 ~ 2.303, gas constant = 8.3l42E-03 kiloJoules/mol/K 1.987E-03 kiloCalories/mol/K
Calculate ~Sor using:
(6)
Calculate ~Go f' ~Ho f and ~SO f from the ~Go r' LlHo r' ~SO r values just found and the ~Gof,~Hof and ~Sof values of the reactant species (in the case of the association reactions of dissolved species) or product species (in the case of mineral dissolution reactions).
3.4 Entropy Values
The entropies given are not the usual absolute entropies SOf' but are the entropies of formation of the species or minerals from their component elements at 25°C and one bar, ~Sof' This facilitates the use of equation (6) relating ~Go to ~Ho and ~So.
WAGMAN AND OTHERS (1982, p. 2-16) point out that the "best" values for ~Ho f and ~Go f of ions are often derived from solution data, while "best" values for absolute entropies are usually taken from "thermal" data and are independent of solution processes. Thus, compilations of "best" data on dissolved species may not rigorously obey equation (2). To make this data base rigorously consistent internally, the following convention was adopted:
When the original source of data included both ~Hof and ~Gof' ~Sof
for the species was calculated using equation (2).
When only ~Hof and absolute entropies were available, ~Sof values were first calculated using:
where n = charge of the ion (WAGMAN AND OTHERS, 1982, p. 2-22). Then, ~Gof values were calculated using equation (2).

NAGRA NTB 86-19 - A.ll - APPENDIX A
3.5 Calculation of Oxidation Potentials
If concentrations of both members of an oxidation-reduction couple are available, the pE value corresponding to that couple can be calculated in a manner similar to the one used to calculate mineral saturation indices. The reaction for the oxidation of R to o can be written (GARRELS AND CHRIST, 1965, Chapter 7):
R = 0 + n • H+ + m • e-, (7)
with equilibrium constant:
log K(T) log Cta + n • log CtH+ + m • log Ct e- - log CtR (8)
By definition, pE = -log Cte -, so the log K(T) expression can be rewritten:
pE = -log K(T)/m + (log Cta + n • log CtH+ - log CtR)/m (9)
The saturation index, SI, equals log lAP - log K(T), where lAP is the value of the ion activity product in the solution of interest. This definition has the same form as the pE expression (9). Thus, if reaction (7) is written for the transfer of one-electron, e.g., so that m in (7), (8) and (9) equals one, the SI calculated for it in the usual manner will equal its pE.
Reactions such as (7) used to calculate pE values are association reactions forming "minerals" which are simply single electrons. The ~Go f' ~Ho f and ~So f values of the electron are zero, and are so entered in the data base. The ~Gor' ~Hor' ~Sor and log K values for the reactions are then determined by the properties only of the reactant species. The use of the saturation index routine of PHREEQE to calculate pE values is described in the documentation for that programme (PARKHURST AND OTHERS, 1980, p. 59).
Field data are frequently reported as Eh values rather than as pE'S. The two are related by the expression:
where: F
Eh = (In(10) R • T/F) • pE
Faraday's constant = 96487.0 Joules;Volt/mol and the other symbols are defined above.
(10)
For Eh in Volts and temperature in Celsius, equation (10) becomes:
pE = Eh • 5040.07/(273.15 + temperature) (11)
3.6 Temperature Dependence of Equilibrium Constants
Values of log K at temperatures other than 25°C can be calculated in two ways from the information in the data base. If coefficients for one or more of the temperature terms in equation (1) are given, that equation can be used. For most species and minerals, however, only ~Hor values are available and log K values must

NAGRA NTB 86-19 - A.12 - APPENDIX A
be calculated with an integrated form of equation (4), the van't Hoff equation. This equation is written:
log K(T) log K(298.l5) -LlHr ( 298 . 15 ) (- 1 1)
-1-n-(-1-0-) -. -R-- -; - 298 . 15
Both equations are available in PHREEQE and the predecessor WATEQ codes. At temperatures above 50° or 60°C, the van't Hoff equation can lead to serious errors and should be used with caution.
4. SELECTION OF DATA
4.1 Aqueous Species
The association constants for most of the aqueous species are taken from the MINTEQ data base (FELMY AND OTHERS, 1984, version released by U.S.E.P.A, December, 1986). In this case, no reference to the source of the data is given in Table 4. Users interested in tracing the sources of these data should refer to the original WATEQ programmes (NORDSTROM AND OTHERS, 1984, BALL AND OTHERS, 1980, PLUMMER AND OTHERS, 1976, TRUESDELL AND JONES, 1974).
Certain groups of data have been taken from other sources. Coefficients for equation (1) for log K(T) for the carbonate and bicarbonate ion pairs with the cations Ca+2 , Sr+2 , and Ba+2 are taken from PLUMMER AND BUSENBERG (1982), BUSENBERG AND OTHERS (1984), and BUSENBERG AND PLUMMER (1986). Values for log K(25) for all hydrolysis reactions are from BAES AND MESMER (1976).
Several sets of association constants for the aluminum hydroxide solution complexes have heen proposed. The reaction for the formation of these species can be written:
Values of log K(25) and LlHr for this reaction from a number of sources are given in Table 2.
The log K(25) values for gibbsite from HEMINGWAY AND OTHERS (1978), MAY AND OTHERS (1979) and the Perkins/Berman data set are the same within the errors quoted. The Perkins/Berman, WAGMAN AND OTHERS (1982) and HEMINGWAY AND OTHERS (1978) values of LlHor also are in good agreement.
The log K(25) values for the aluminum species given by MAY AND OTHERS (1979) are an internally consistent set based on experimental solubility data. Total dissolved aluminum concentrations calculated from them (MAY AND OTHERS, 1979, Figure 3) are virtually the same as those given by the data of BAES AND MESMER (1976, Figure 6.4c) if the Al(OH)3o species is left out. The log K(2s) data of MAY AND OTHERS (1979) were selected.

NAGRA NTB 86-19 - A.13 - APPENDIX A
Table 2: Values of stability constants for aluminum hydrolysis species and gibbsite.
SPECIES:
Al(OH)+Z
Al(OH)/
Al (OH)3 0
Al (OH)4
Al (OH)3 (cr)
SPECIES:
Al(OH)+Z
Al(OH)z+
Al (OH)3 0
Al (OH) 4
Al(OH)3(cr)
VaLues of Log K(25) of association of soLution species and of dissociation of the soLid
(1) (2) (3) (4) (5)
-4.91 -4.97±0.02 -4.74 -4.99
-9.3 -8.7±0.4 -10.1
-15.0 -16.0
-22.5 -23.0±0.3 -23.3±0.3 -23.25 -23.0
-7.23 -8.5±0.1 -8.0±0.3 -7.25 -8.77
Perkins/Berman log K (gibbsite): = -7.90
VaLues of 6Hr of association of soLution species and of dissociation of the soLid
(1) (2) (3) (4) (5)
50±2 64.12 49.8
0.0
0.0
171.42 180.20 184.35
95.155 95.16 95.67 95.4
Perkins/Berman 8Hor (gibbsite): 95.06
References
(6)
-5.0±0.3
-10.2±0.3
-22.2±0.3
-8.1±0.3
(6)
(1) WAGMAN AND OTHERS, (1982) (3) HEMINGWAY AND OTHERS, (1978) (5) MINTEQ
(2) BAES AND MESMER, (1976) (4) Perkins/Berman PATH (6) MAY AND OTHERS, (1979)
The ilHor value of WAGMAN AND OTHERS (1982) for Al(OH)4- and of BAES AND MESMER (1976) for Al(OH)+z were chosen. A value of 90 kiloJoules/mol was estimated for Al(OH)z+ by interpolation between the values for the other two species.
Constants for the uranium species were taken from the compilation of SCHWEINGRUBER (1983, Data Base A), as used in MINEQL/EIR (WANNER, 1986). These data were in turn derived from the compilation of LEMIRE AND TREMAINE (1980). Only those aqueous species which are stable enough to appear prominently in Schweingruber's Figures 6 and 7 are included in this data base.
A recent publication on redox conditions in Swedish ground-waters includes data on solution complexes and minerals which include iron or sulphur species (NORDSTROM AND PUIGDOMENECH, 1986). These

NAGRA NTB 86-19 - A.14 - APPENDIX A
data have not yet been examined for comparison with data already in this data base or for possible addition to it.
4.2 Minerals
Data for the dissociation constants of minerals are given in Table 4. Because so many sets of thermodynamic data on minerals have been prepared, the selections made for this data base are discussed in more detail than were those for the aqueous species. For many minerals, the data base includes values for the coefficients of equation (1). Most of the other data sets examined contain only values for log K(2S) and ~Hor' Thus, in the following discussion only values for these two parameters are compared.
Calcite CaC03 : The values chosen are based on the equation for log K(T) given by PLUMMER AND BUSENBERG (1982). They compare with the other data considered as follows:
log K(25)
Data chosen: -8.480 -9.61 MINTEQ: -8.475 -10.82 Perkins/Berman: -8.52 -11.78 WANNER (1986): -8.36 -13.18 WAGMAN AND OTHERS (1982): -8.304 -13.05 ROBIE AND OTHERS (1978): -8.305 -12.60
The PLUMMER AND BUSENBERG (1982) data are consistent with the data adopted for the ion pairs of calcium and the carbonate species in this data base.
Dolomite CaMg(C03 )z: The values chosen are from the MINTEQ data set. They compare with the other values considered as follows:
Data chosen: Perkins/Berman
Disordered dolomite: Ordered dolomite:
WANNER (1986): WAGMAN AND OTHERS (1982): ROBIE AND OTHERS (1978):
log K(25)
-17.00 -34.685
-16.52 -46.36 -18.06 -34.12 -17.00 -34.98 -17.41 -37.66 -17.09 -39.48
These values range from those representative of high-temperature, well-ordered dolomites to disordered sedimentary dolomites (see HELGESON AND OTHERS, 1978). Waters from a number of dolomitic aquifers J the Massenkalk and the Schilfsandstein/Gansinger Dolorni te in northern Switzerland and the Edwards aquifer in Texas (PEARSON, 1976), appear to be in equilibrium with a dolomite with log K(2S) = -17.0. However, waters from the Muschelkalk are more consistent with a log K(2S) value of -16.8. This difference may

NAGRA NTB 86-19 - A.15 - APPENDIX A
be a result of slight differences in composition or crystallinity between the dolomites of the several formations.
Strontianite SrC03 : The values chosen are as given by the equation for log K(T) of BUSENBERG AND OTHERS, (1984). They compare with the other data considered as follows:
Data chosen: MINTEQ: WANNER (1986): WAGMAN AND OTHERS (1982): ROBIE AND OTHERS (1978):
log K(25)
-9.27 -9.25 -9.03 ·9.25 -8.81
-1.67 -2.89 -0.42 -2.84 -4.26
The data chosen are consistent with those in this data base for the ion pairs of strontium and the carbonate solution species and with the calcite data.
Witherite BaC03 : The values chosen are as given by the equation for log K(T) of BUSENBERG AND PLUMMER, (1986). They compare with values derived from the other data sets examined as follows:
Data chosen: MINTEQ: WAGMAN AND OTHERS (1982): ROBIE AND OTHERS (1978):
log K(25)
-8.56 -8.585 -8.59 -7.63
2.94 1.51 1.52
-3.93
The data chosen are consistent with those in this data base for the ion pairs of barium and the carbonate solution species and with the calcite and strontianite data.
Gypsum CaS04 • 2HzO: Values derived from the equation for log K(T) of LQ~G~ruIR fu~D MELCHIOR (1985, equation 3) were chosen. They compare with values derived from the other data sets examined as follows:
Data chosen: MINTEQ: WANNER (1986): WAGMAN AND OTHERS (1982): ROBIE AND OTHERS (1978):
log K(25)
-4.58 -4.85 -4.86 -4.36 -4.34
-0.45 1.09 0.92
-1.13 -1.13
The data for the other sulphate minerals, anhydrite, celestite and barite, were also selected from LANGMUIR AND MELCHIOR (1985) and are consistent with the value chosen for gypsum.

NAGRA NTB 86-19 - A.16 - APPENDIX A
Anhydrite CaS04 : LANGMUIR AND MELCHIOR (1985) give three expressions (equations 4, 5 and 9) which give similar values for log K(T) of anhydrite. Equation 5, based on experimental data above 56°C, was chosen because gypsum is the stable CaS04 phase below this temperature except in highly concentrated solutions. These data compare with the values derived from the other data sets examined as follows:
log K(25)
Data chosen: -4_24 -19.95 Perkins/Berman: -4.14 -18.01 WANNER (1986): -4.65 -15.69 WAGMAN AND OTHERS (1982): -4.15 -17.99 ROBIE AND OTHERS (1978): -4.12 -17.99
There is relatively little change in the log K(T) of gypsum between 0° and 100°C. Anhydrite stability increases rapidly with temperature, however, and it becomes more stable than gypsum at 56°C.
Celestite SrS04 : Two equations have recently been proposed to describe the stability of celestite. The first was developed from literature data by LANGMUIR AND MELCHIOR (1985, equation 10) and is consistent with the equations chosen for the other alkalineearth sulphate minerals. The second is based on new experimental data by REARDON AND ARMSTRONG (1987). The log K(25) values calculated from both sets of equations agree well, but are significantly different from the values in the other sources examined. There are also wide differences among the ~Hor values of all the data sets:
Data chosen: REARDON AND ARMSTRONG (1987): MINTEQ: WANNER (1986): WAGMAN AND OTHERS (1982): ROBIE AND OTHERS (1978):
log K(25)
-6.633 -6.637 -6.465 -6.50 -6.46 -6.46
2.52 -3.49 -1.97 2.09
-1.97 -1.90
Equation 10 of LANGMUIR AND MELCHIOR (1985) has been included in Table 4, not because it is necessarily better than the equation of REARDON AND ARMSTRONG (1987), but because it is likely to be more consistent with those chosen for the other sulphate minerals.
Barite BaS04 : Data from LANGMUIR AND MELCHIOR (1985, equation 2) and from all the other data bases examined are virtually identical.

NAGRA NTB 86-19
Data chosen: MINTEQ: WAGMAN AND OTHERS (1982): ROBIE AND OTHERS (1978):
- A.17 -
log K(25)
-9.97 -9.976 -9.97 -9.95
26.57 26.28 26.29 26.28
APPENDIX A
Data from LANGMUIR AND MELCHIOR (1985) were chosen for consistency with the other sulphate minerals.
Fluori te CaF z: The values chosen are from the MINTEQL/EIR (WANNER, 1986) data set. They compare with values from the other data sets examined as follows:
Data chosen: Perkins/Berman: MINTEQ: WAGMAN AND OTHERS (1982): ROBIE AND OTHERS (1978):
log K(25)
-10.41 -10.93 -10.96 -9.84
-10.51
15.90 17.88 19.71 11.51 15.73
Portlandite Ca(OH)z: The values chosen are derived from the data of WAGMAN AND OTHERS (1982) for the Gibbs energy and enthalpy of formation for crystalline Ca(OH)z. These values compare with the values from the other data sets examined as follows:
Data chosen: MINTEQ: WANNER (1986): ROBIE AND OTHERS (1978):
Chalcedony SiOz : and
log K(25)
22.66 22.675 22.80 22.67
-128.40 -128.41 -129.70 -128.40
Quartz SiOz: FOURNIER (1981) gives equations for the variation with temperature of the solubility of several silica phases important as controls on the dissolved silica content of groundwaters. His values for both quartz and chalcedony have been adopted. The chalcedony values are essentially the same as those from the original PHREEQE data set. The several sets of quartz data available agree well:
log K(25) LlHor -------
Data chosen: -3.979 25.06 MINTEQ: -4.006 26.02 Perkins/Berman: -4.033 26.08

NAGRA NTB 86-19 - A. 18 - APPENDIX A
Uraninite UOz: The values chosen are from SCHWEINGRUBER (1983, Database A). They compare with values in the other data bases examined as follows:
log K(25)
Data chosen: -4.60 -78.24 MINTEQ: -4.70 -77.95 WANNER (1986): -4.60 -78.20
PCOZ: To calculate the partial pressure of CO2 in equilibrium with a solution requires a value for the Henry's Law constant for the gas. The equation chosen is that given by PLUMMER AND BUSENBERG (1982), which is consistent with the data chosen for carbonate aqueous species and minerals.
4.3 pE Calculations
Values of equilibrium constants used for calculating oxidation potentials from measured concentrations of oxidized and reduced species of an element are given in Table 5. As discussed above, the Gibbs energy, enthalpy and entropy of formation of the electron are zero. Thus, the log K(25) and other properties of the reaction depend on the properties of formation of the reactant species. All properties of formation of all species in a given reaction were taken from the same data base, so each reaction would contain internally consistent data. The data set used, that of WAGMAN AND OTHERS, (1982), does not include the properties of N2(aq)' so these were estimated as the average of the !J.G and !J.H values for the formation of 0Z(aq) and HZ(aq)'
The log K(25) values for these pE expressions could also be found from tables of standard electrode potentials for the reactions involved.
Two pE expressions are given for the 0Z(aq)/H20 couple. The first is based on the tabulated values of the thermodynamic properties of the species involved. The second, the Sato pE, uses an empirical relationship proposed by SATO (1960) between oxygen concentrations and "effective" oxidation potential. The SATO pE has been used in water equilibrium calculations since the earliest WATEQ appeared (TRUESDELL AND JONES, 1974), and has often been found to be concordant with pE values measured using a platinum electrode.

NAGRA NTB 86-19 - A.19 - APPENDIX A
5. REFERENCES
5.1 Numbered References in Data Base
In Tables 3, 4 and 5, the data sources are given by number as described above in Section 2.1. The full references corresponding to these numbers are as follows:
1) WAGMAN AND OTHERS, 1982. 2) CODATA, 1978. 3) PERKINS/BERMAN PATH data (PETERS, written commun., Ju1,1985) 4) HELGESON AND OTHERS, 1981. 5) By definition. 6) Estimated. See text. 7) BAES AND MESMER, 1976. 8) PLUMMER AND BUS ENBERG , 1982. 9) BUSENBERG AND OTHERS, 1984. 10) LANGMUIR AND MELCHIOR, 1985. 11) HELGESON AND OTHERS, 1978. 12) NORDSTROM AND OTHERS, 1984. 13) FOURNIER, 1981. 14) MAY AND OTHERS, 1979. 15) MINTEQ data (FELMY AND OTHERS, 1984) which comprises the
large, well documented base of thermochemical data on aqueous species and minerals which evolved with the WATEQ series of programmes (NORDSTROM AND OTHERS, 1984, BALL AND OTHERS, 1980, PLUMMER AND OTHERS, 1976, TRUESDELL AND JONES, 1974). Data supplied with the U. S. Geological Survey version of PHREEQE (PARKHURST AND OTHERS, 1980), are also derived from the WATEQ programmes and so are commonly identical to MINTEQ data.
16) Data in MINEQL/EIR as tabulated by WANNER, 1986. 17) SCHWEINGRUBER, 1983, Data Base A. 18) HELGESON, 1969. 19) BUSENBERG AND PLUMMER, 1986. 20) REARDON, 1983, REARDON AND ARMSTRONG, 1987. 21) BALL AND OTHERS, 1987. 22) ROBIE AND OTHERS, 1978.
5.2 References Cited
Baes, C. F., and Mesmer, R. E., 1976, The Hydrolysis of Cations: New York, John Wiley, 489 p.
Ball, J. W., Nordstrom, D. K., and Jenne, E. A., 1980, Additional and Revised Thermochemical Data and Computer Code for WATEQ2 - -A Computerized Model for Trace and Maj or Element Speciation and Mineral Equilibria of Natural Waters: U.S. Geol. Survey Water Resources Investigations 78-116, 109 p.
Ball, J. W., Nordstrom, D. K., and Zachmann, D. W., 1987, WATEQ4F - A Personal Computer Fortran Translation of the Geochemical Model WATEQ2 with Revised Data Base: U.S. Geol. Survey OpenFile Report 87-50, 108 p.

NAGRA NTB 86-19 - A.20 - APPENDIX A
Busenberg, E., Plummer, L. N., and Parker, V. B., 1984, The solubility of strontianite (SrC03 ) in CO2 -H20 solutions between 2 and 91°C, the association constants of SrHC03+(aq) and SrC030(aq) between 5 and 80°C, and an evaluation of the thermodynamic properties of Sr+2 (aq) and SrC03 (cr) at 25°C and 1 atm total pressure: Geochim. Cosmochim. Acta, v. 48, p. 2021-2035.
Busenberg, E., and Plummer, L. N., 1986, The solubility of BaC03 (cr)(witherite) in CO2 -H20 solutions between 0 and 90°C, evaluation of the association constants of BaHC03+(aq) and BaC030(aq) between 5° and 80°C, and a preliminary evaluation of the thermodynamic properties of Ba2+(aq): Geochim. Cosmochim. Acta, v. 50, p. 2225-2233.
CODATA Task Group on key values for thermodynamics, 1978, CODATA recommended key values for thermodynamics, 1977: J. Chern. Thermodynamics, v. 10, p. 903-906.
CODATA Task Group on key values for thermodynamics, 1980, Tentative set of key values for thermodynamics. Part VIII. CODATA Special Report, April, 1980.
Felmy, A. R., Girvin, D. C., and Jenne, E. A., 1984, MINTEQ - A Computer Program for Calculating Aqueous Geochemical Equilibria: U. S. Environmental Protection Agency Report EPA-600/384-032, 86 p.
Fournier, R. 0., 1981, Application of water chemistry to geothermal exploration and reservoir engineering: in Rybach, L. and Muffler, L. J. P., ed., Geothermal Systems: Principles and Case Histories: Chichester, John Wiley, p. 109-143.
Garrels, R. M., and Christ, C. L., 1965, Solutions, Minerals, and Equilibria: New York, Harper & Row, 450 p.
Helgeson, H. C., 1969, Thermodynamics of hydrothermal systems at elevated temperatures and pressures: Am. J. of Science, v. 267, p. 729-804.
Helgeson, H. C., Delany, J. M., Nesbitt, H. W., and Bird, D. K., 1978, Summary and Critique of the Thermodynamic Properties of Rock-Forming Minerals: Am. J. of Science, v. 278-A, 229 p.
Helgeson, H. C., Kirkham, D. H., and Flowers, G. C., 1981, Theoretical Prediction of the Thermodynamic Behaviour of Aqueous Electrolytes at High Pressures and Temperatblres: IV. Calculation of activity coefficients, osmotic coefficients, and apparent molal and standard and relative partial molal properties to 600°C and 5 kb: Am. J. of Science, v. 281, p. 1249-1516.
Hemingway, B. S., Robie, R. A., and Kittrick, J. A., 1978, Revised values for the Gibbs free energy of formation of [Al(OH)4- aq J, diaspore, boehmite and bayerite at 298.15 K and 1 bar, the

NAGRA NTB 86-19 - A.21 - APPENDIX A
thermodynamic properties of kaolinite to 800 K and 1 bar, and the heats of solution of several gibbsite samples: Geochim. Cosmochim. Acta, v. 42, p. 1533-1543.
Intera Environmental Consultants, Inc., 1983, Geochemical Models Suitable for Performance Assessment of Nuclear Waste Storage: Comparison of PHREEQE and EQ3/EQ6: ONWI-473, prepared for Battelle Memorial Institute, Columbus, OH, Office of Nuclear Waste Isolation, 114 p.
Langmuir, D., and Melchior, D., 1985, The geochemistry of Ca, Sr, Ba and Ra sulfates in some deep brines from the Palo Duro Basin, Texas: Geochim. Cosmochim. Acta, v. 49, p. 2423-2432.
Lemire, R. J., and Tremaine, P. R., 1980, Uranium and plutonium equilibria in aqueous solutions to 200°C: J. Chern. Eng. Data, v. 25, p.36l-370.
May, H. M., Helmke, P. A., and Jackson, M. L., 1979, Gibbsite solubility and thermodynamic properties of hydroxy-aluminum ions in aqueous solution at 25°C: Geochim. Cosmochim. Acta, v. 43, p. 861-868.
Nordstrom, D. K., Valentine, S. D., Ball, J. W., Plummer, L. N., and Jones, B. F., 1984, Partial Compilation and Revision of Basic Data in the WATEQ Programs: U.S. Geol. Survey WaterResources Investigations Report 84-4186, 19 p.
Nordstrom, D. K., and Munoz, J. L., 1985, Geochemical Thermodynamics: Menlo Park, CA, The Benjamin/Cummings, 477 p.
Nordstrom, D. K., and Puigdomench, I., 1986, Redox chemistry of deep groundwaters in Sweden: Stockholm, Sweden, Svensk Karnbranslehantering AB, .SKB Technical Report 86-03, 36 p.
Parkhurst, D. L., Thorstenson, D. C., and Plummer, L. N., 1980, PHREEQE - A computer program for geochemical calculations: U.S. Geol. Survey Water-Resources Investigations 80-96, 210 p.
Pearson, F. J. Jr., 1976, Geochemical and Isotopic Analyses of Waters Associated with the Edwards Limestone Aquifer, Central Texas: San Antonio, TX, U. S. Geol. Survey Report published by Edwards Underground Water District, 35 p.
Pearson, F. J., Jr., 1985, Sondierbohrung B6ttstein Hydrochemical Investigations: Analysis and tion: Baden, Switzerland, Nagra, Technischer 85-05, 116 p.
- Results of Interpreta
Bericht NTB
Pearson, F. J., Jr., Kelley, V. A., and Pickens, J. F., 1987, Preliminary Design for a Sorbing Tracer Test in the Culebra Dolomite at the H-3 Hydropad at the Waste Isolation Pilot Plant (WIPP) Site: Albuquerque, NM, Sandia National Laboratories, Contractor Report SAND86-7l77, 218 p.

NAGRA NTB 86-19 - A.22 - APPENDIX A
Plummer, L. N., Jones, B. F., and Truesdell, A. H., 1976, WATEQF - A computer program for calculating chemical equilibrium of natural waters: U.S. Geol. Survey Water Resources Investigations 76-13, 61 p.
Plummer, L. N., and Busenberg, E., 1982, The solubilities of calcite, aragonite and vaterite in CO2 -H20 solutions between 0 and 90 0 C, and an evaluation of the aqueous model for the sys tern CaC03 - CO2 - H20: Geochim. Cosmochim. Ac ta, v. 46, p. 1011-1040.
Reardon, E. J., 1983, Determination of SrS04° ion pair formation using conductimetric and ion exchange techniques: Geochim. Cosmochim. Acta, v. 47, p. 1971-1922.
Reardon, E. J., and Armstrong, D. K., 1987, Celestite (SrS04 (s»
solubility in water, seawater and NaC1 solution: Geochim. Cosmochim. Acta, v. 51, p. 66-72.
Roberson, C. E., and Hem, J. D., 1969, Solubility of aluminum in the presence of hydroxide, fluoride, and sulphate: U.S. Geol. Survey Water-Supply Paper 1827-C, p. C1-C37.
Robie, R. A., Hemingway, B. S., and Fisher, J. R., 1978, Thermodynamic Properties of Minerals and Related Substances at 198.15 K and 1 Bar (105 Pascals) Pressure and at Higher Temperatures: U.S. Geol. Survey Bulletin 1452, 456 p., (reprinted with corrections, 1979).
Robinson, R. A., and Stokes, R. H., 1970, Electrolyte Solutions, Second Edition (Revised): London, Butterworths, 571 p.
Sato, M., 1960, Oxidation of sulfide ore bodies, 1. Geochemical environments in terms of Eh and pH: Economic Geology, v. 55, p. 928-961.
Schweingruber, M., 1983, Actinide solubility in deep groundwaters - Estimates for upper limits based on chemical equilibrium calculations: Baden, Switzerland, Nagra, Technischer Bericht 83-24, 63 p.
Schweingruber, M., 1984, On probable in-situ pH, PC02 and redox conditions for waters sampled at 400,600, and 1300 m depth in borehole KRISTAL I, Bottstein: Wurenlingen, Switzerland, Eidgenossisches Institut fur Reactorforschung, TM-45-84-20, 21 p.
Smith, R. W., and Hem, J. D., 1972, Effect of aging on aluminum hydroxide complexes in dilute aqueous solutions: U.S. Geol. Survey Water-Supply Paper l827-D, p. Dl-D5l.
Stumm, W., and Morgan, J. J., 1981, Aquatic Chemistry, Second Edition: New York, John Wiley, 780 p.

NAGRA NTB 86-19 - A.23 - APPENDIX A
Truesdell, A. H., and Jones, B. F., 1974, WATEQ, A computer program for calculating chemical equilibria of natural waters: J. Research U.S. Geol. Survey, v. 2, p. 233-248.
Wagman, D. D., Evans, W. H., Parker, V. B., Schumm, R. H., Halow, I., Bailey, S. M., Churney, K. L., and Nuttall, R. L., 1982, The NBS tables of chemical thermodynamic properties: J . Phys. Chern. Ref. Data, v. 11, 392 p.
Wanner, H., 1986, Modelling Interaction of Deep Groundwaters with Bentonite and Radionuclide Speciation: Wurenlingen, Switzerland, Eidg. Institut fur Reactorforschung, EIR-Bericht 589, 103 p.
Whitfield, M., 1979, Activity coefficients in natural waters: in Pytkowicz, R. M., ed., Activity Coefficients in Electrolyte Solutions: Boca Raton, FL, CRC, v. II, p. 154-299.
Wolery, T. J., 1983, EQ3NR A Computer Program for Geochemical Aqueous Speciation-Solubility Calculations: User's Guide and Documentation: Livermore, CA, Lawrence Livermore Laboratory, UCRL-534l4, 191 p.

NAGRA NTB 86-19
Gibbs Energy kJ/mol
Enthalpy kJ/mol
1: H+ Form: .000 .000
Thor: .0 Charge: Reactant Spec; es
Coef. Name 1.00 H+
2: e-Form: .000 .000
Thor: -1.0 Charge: Reactant Species
Coef. Name 1.00 e-
3: H20 Form: -237.129 -285.830
Thor: .0 Charge: Reactant Species
Coef. Name 1.00 H20
4: LI+ Form: -292.630 -278.455
Thor: .0 Charge: Reactant Species
Coef. Name 1.00 LI+
5: NA+ Form: -261.930 -240.300
Thor: .0 Charge: Reactant Species
Coef. Name 1.00 NA+
6: K+ Form: -282.740 -252.170
Thor: .0 Charge: Reactant Spec; es
Coef. Name 1.00 K+
7: MG+2 Form: -454.800 -466.800
Thor: .0 Charge: Reactant Spec; es
Coef. Name 1.00 MG+2
8: CA+2 Form: -552.940 -543.100
Thor: .0 Charge: Reactant Species
Coef. Name 1.00 CA+2
9: SR+2 Form: -559.460 -545.820
Thor: .0 Charge: Reactant Sped es
Coef. Name 1.00 SR+2
- A.24 -
Entropy J/mol/K
Gibbs Energy kJ/mol
Enthalpy kJ/mol
Data Sources: G:5 H:5 S:5 .000 Rean: .000 .000
1.0 D-H aD: 9.0 logK(25): .0000 logK(T)= .000000
No. + .000000 *T 1
Data Sources: Definition .000 Rean: .000 .000
-1.0 D-H aD: .0 logK(25): .0000 logK(T)= .000000
No. + .000000 *T 2
Data Sources: G:1=3 H:1=2=3 -163.344 Rean: .000 .000
.0 D-H aD: .0 logK(25): .0000 logK(T)= .000000
No. + .000000 *T 3
Data Sources: G:2=3=4 H:2=3=4 47.543 Rean: .000 .000 1.0 D-H aD: 6.0 logK(25): .0000
logK(T)= .000000 No. + .000000 *T
4
Data Sources: G:1=2=3=4 H:2=3=4 72.547 Rean: .000 .000 1.0 D-H aD: 4.0 logK(25): .0000
logK(T)= .000000 No. + .000000 *T
5
Data Sources: G:4 H:2=4 102.532 Rean: .000 .000 1.0 D-H aD: 3.0 logK(25): .0000
logK(T)= .000000 No. + .000000 *T
6
Data Sources: G:1=3=4 H:1=3=4 -40.248 Rean: .000 .000 2.0 D-H aD: 8.0 logK(25): .0000
logK(T)= .000000 No. + .000000 *T
7
Data Sources:'G:4 H:2=4 33.004 Rean: .000 .000 2.0 D-H aD: 6.0 logK(25): .0000
logK(T)= .000000 No. + .000000 *T
8
Data Sources: G:1=3=4 H:1=3=4 45.749 Rean: .000 .000 2.0 D-H aD: 5.0 logK(25): .0000
logK(T)= .000000 No. + .000000 *T
9
Table 3: Thermodynamic data for aqueous species. (Page 1 of 15)
APPENDIX A
Entropy J/mol/K
.000
.000
.000
.000
.000
.000
.000
.000
.000

NAGRA NTB 86-19
Gibbs Energy kJ/mol
10: BA+2
Enthalpy kJ/mol
Form: -560.760 -537.640 Thor: .0 Charge:
Reactant Species Coef. Name
1.00 BA+2
11: Mn+2 Form: -228.100 -220.750
Thor: 2.0 Charge: Reactant Species
Coef. Name 1.00 Mn+2
12: Fe+2 Form: -85.350 -87.400
Thor: 2.0 Charge: Reactant Speci es
Coef. Name 1.00 Fe+2
13: H3B03 Form: -968.750 -1072.320
Thor: .0 Charge: Reactant Species
Coef. Name 1.00 H3B03
14: Al+3 Form: -489.400 -531.380
Thor: .0 Charge: Reactant Speci es
Coef. Name 1.00 AL+3
15: C03-2 Form: -527.810 -677.140
Thor: 4.0 Charge: Reactant Species
Coef. Name 1.00 C03-2
- A.2S -
Entropy J/moL/K
Gibbs Energy kJ/mol
EnthaLpy kJ/moL
Data Sources: G:1=3=4 H:1=3=4 77.545 Rean: .000 .000 2.0 D-H aD: 5.0 LogK(25): .0000
LogK(T)= .000000 No. + .000000 *T
10
Data Sources: G:1=4 H:1=4 24.652 Rean: .000 .000 2.0 D-H aD: 6.0 LogK(25): .0000
LogK(T)= .000000 No. + .000000 *T
11
Data Sources: G: H:12 -6.876 Rean: .000 .000 2.0 D-H aD: 6.0 LogK(25): .0000
LogK(T)= .000000 No. + .000000 *T
12
Data Sources: G:1 H:1 -347.375 Rean: .000 .000
.0 D-H aD: .0 LogK(25): .0000 LogK(T)= .000000
No. + .000000 *T 13
Data Sources: G:4=14 H:3=4 -140.802 Rean: .000 .000
3.0 D-H aD: 9.0 LogK(25): .0000 LogK(T)= .000000
No. + .000000 *T 14
Data Sources: G:1=3 H:1=3 -500.855 Rean: .000 .000 -2.0 D-H aD: 5.4 LogK(25): .0000
LogK(T)= .000000 No. + .000000 *T
15
16: H4SI04 Data Sources: G:3 H:3 Form: -1307.600 -1456.280 -498.675 Rean: .000 .000
Inor: .0 Charge: .0 D-H aO: .0 logK(25j: .0000 Reactant Speci es LogKeT)= .000000
Coef. Name No. + .000000 *T 1.00 H4SI04 16
17: NH4+ Data Sources: G:1 H:1 Form: -79.310 -132.510 -178.434 Rean: .000 .000
Thor: -3.0 Charge: 1.0 D-H aD: 2.5 LogK(25): .0000 Reactant Speci es LogK(T)= .000000
Coef. Name No. + .000000 *T 1.00 NH4+ 17
18: P04-3 Data Sources: G:1 H:1 Form: -1018.700 -1277.400 -867.684 Rean: .000 .000
Thor: .0 Charge: -3.0 D-H aD: 4.0 LogK(25): .0000 Reactant Species LogKeT)= .000000
Coef. Name No. + .000000 *T 1.00 P04-3 18
Table 3: Thermodynamic data for aqueous species. (Page 2 of 15)
APPENDIX A
Entropy J/moL/K
.000
.000
.000
.000
.000
.000
.000
.000
.000

NAGRA NTB 86-19
Gibbs Energy EnthaLpy kJ/moL kJ/moL
19: H3As03 Form: -639.800 -742.200
Thor: 3.0 Charge: Reactant Species
Coef. Name 1.00 H3As03
20: S04-2 Form: -744.530 -909.270
Thor: 6.0 Charge: Reactant Speci es
Coef. Name 1.00 S04-2
21: F-Form: -281.710 -335.350
Thor: .0 Charge: Reactant Species
Coef. Name 1.00 F-
22: CL-Form: -131.291 -167.080
Thor: .0 Charge: Reactant Speci es
Coef. Name 1.00 CL-
23: BR-Form: -104.040 -121.500
Thor: .0 Charge: Reactant Species
Coef. Name 1.00 BR-
24: U4+ Form: -531.000 -591.200
Thor: 4.0 Charge: Reactant Species
Coef. Name 1.00 U4+
25: 02 AQ Form: 16.400 -11. 700
Thor: 4.0 Charge: Reactant Species
Coef. Name 1.00 02 AQ
26: H2 AQ Form: 17.600 -4.200
Thor: -2.0 Charge: Reactant Species
Coef. Name 1.00 H2 AQ
27: CH4 AQ Form: -34.330 -89.040
Thor: -4.0 Charge: Reactant Speci es
Coef. Name 1.00 CH4 AQ
- A.26 -
Entropy J/mol/K
Gibbs Energy EnthaLpy kJ/mol kJ/moL
Data Sources: G:1 H:1 -343.451 Rean: .000 .000
.0 D-H aD: .0 LogK(25): .0000 LogK(T)= .000000
No. + .000000 *T 19
Data Sources: G:1 H:1 -552.541 Rean: .000 .000 -2.0 D-H aO: 4.0 LogK(25): .0000
LogKeT)= .000000 No. + .000000 *T 20
Data Sources: G:2=4 H:2=4 -179.910 Rean: .000 .000 -1.0 D-H aD: 3.5 logK(25): .0000
LogK(T)= .000000 No. + .000000 *T
21
Data Sources: G:2=3=4 H:2=3=4 -120.037 Rean: .000 .000 -1.0 D-H aD: 3.0 logK(25): .0000
LogK(T)= .000000 No. + .000000 *T
22
Data Sources: G:2=3=4 H:2=3=4 -58.561 Rean: .000 .000 -1.0 D-H aO: 3.0 LogK(25): .0000
LogK(T)= .000000 No. + .000000 *T
23
Data Sources: G:1 H:1 -201.912 Rean: .000 .000
4.0 D-H aO: 11.0 LogK(25): LogK(T)= .000000
No. + .000000 24
Data Sources: G:1 H:1 -94.248 Rean: .000 .000
No. 25
.0 D-H aO: .0 togK(25): LogK(T)= .000000
+ .000000
Data Sources: G:1 H:1 -73.118 Rean: .000 .000
.0 D-H aD: .0 LogK(25): LogK(T)= .000000
No. + .000000 26
Data Sources: G:1 H:1 -183.498 Rean: .000 .000
.0 D-H aD: .0 logK(25): LogK(T)= .000000
No. + .000000 27
.0000
*T
.0000
*T
.0000
*T
.0000
*T
Table 3: Thermodynamic data for aqueous species. (Page 3 of 15)
APPENDIX A
Entropy J/moL/K
.000
.000
.000
.000
.000
.000
.000
.000
.000

NAGRA NTB 86-19
28: Form:
Gibbs Energy kJ/mol
N2 AQ 17.000
Thor: .0
Enthalpy kJ/mol
-8.000 Charge:
Reactant Speci es Coef. Name
1.00 N2 AQ
29: AS04-3 Form: -648.410 -888.140
Thor: 5.0 Charge: Reactant Species
Coef. Name 1.00 AS04-3
30: H2S AQ Form: -27.830 -39.700
Thor: -2.0 Charge: Reactant Speci es
Coef. Name 1.00 H2S AQ
31: N03-Form: -108.740 -205.000
Thor: 5.0 Charge: Reactant Speci es
Coef. Name 1.00 N03-
51: OH-Form: -157.230 -229.994
Thor: .0 Charge: Reactant Speci es
Coef. Name 1.00 H2O
-1.00 H+
52: NAC03-Form: -796.978 -880.156
Thor: 4.0 Ch~rge: Reactant Species
Coef. Name 1.00 NA+ 1.00 C03-2
53: NAHC03 Form: -847.276 -932.519
Thor: 4.0 Charge: Reactant Speci es
Coef. Name 1.00 NA+ 1.00 H+ 1.00 C03-2
- A.27 - APPENDIX A
Entropy J/mol/K
Gibbs Energy kJ/mol
EnthaLpy kJ/moL
Entropy J/moL/K
Data Sources: G: H: EST -83.850 Rean: .000 .000 .000
.0 D-H aD: .0 LogK(25): .0000 logK(T)= .000000
No. + .000000 *T 28
Data Sources: G:1 H:1 -804.058 Rean: .000 .000 .000 -3.0 D-H aD: 4.0 LogK(25): .0000
logK(T)= .000000 No. + .000000 *T 29
Data Sources: G: 1 H: 1 -39.812 Rean: .000 .000 .000
.0 D-H aD: .0 LogK(25): .0000 logK(T)= .000000
No. + .000000 *T 30
Data Sources: G:1 H:1 -322.858 Rean: .000 .000 .000 -1.0 D-H aD: 3.0 logK(25): .0000
LogK(T)= .000000 No. + .000000 *T
31
Data Sources: -244.053 Rean: 79.899 55.836 -80.709 -1.0 D-H aD: 3.5 LogK(25): -13.9980
LogK(T)= .000000 No. + .000000 *T
3 + .000000 IT 1 + .000000 *T"2
+ .000000 IT "2
Data Sources: -278.982 Rean:-7.238 37.284 149.326 -1.0 D-H aD: 4.0 LogK(2~): 1.2680
LogK(T)= .000000 No. + .000000 *T
5 + .000000 IT 15 + .000000 *T"2
+ .000000 IT"2
Data Sources: -285.907 Rean: -57.536 -15.079 142.400
.0 D-H aO: .0 LogK(25): 10.0800 LogK(T)= .000000
No. + .000000 *T 5 + .000000 IT 1 + .000000 *T"'2
15 + .000000 IT"'2
Table 3: Thermodynamic data for aqueous species. (Page 4 of 15)
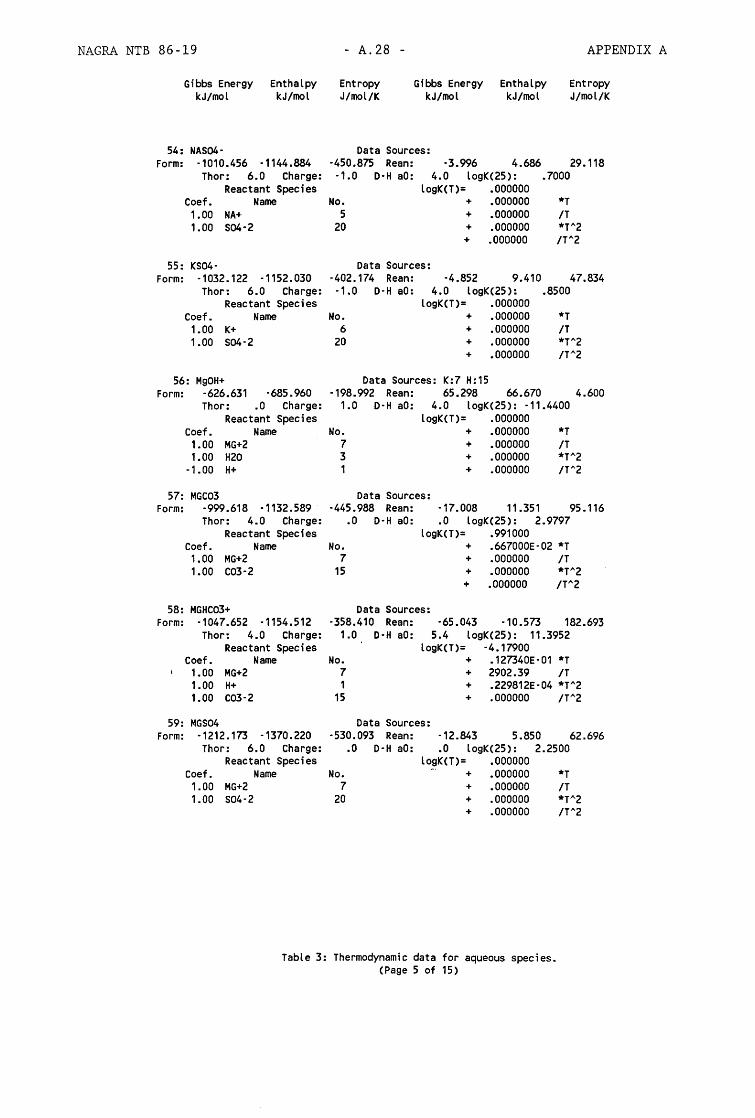
NAGRA NTB 86-19
Gibbs Energy Enthalpy kJ/mol kJ/mol
54: NAS04-Form: -1010.456 -1144.884
Thor: 6.0 Charge: Reactant Species
Coef. Name 1.00 NA+ 1.00 S04-2
55: KS04-Form: -1032.122 -1152.030
Thor: 6.0 Charge: Reactant Species
Coef. Name 1.00 K+ 1.00 S04-2
56: MgOH+ Form: -626.631 -685.960
Thor: .0 Charge: Reactant Species
Coef. Name 1.00 MG+2 1.00 H20
-1.00 H+
57: MGC03 Form: -999.618 -1132.589
Thor: 4.0 Charge: Reactant Species
Coef. Name 1.00 MG+2 1.00 C03-2
58: MGHC03+ Form: -1047.652 -1154.512
Thor: 4.0 Charge: Reactant Species
Coef. Name 1.00 MG+2 1.00 H+ 1.00 C03-2
59: MGS04 Form: -1212.173 -1370.220
Thor: 6.0 Charge: Reactant Speci es
Coef. Name 1.00 MG+2 1.00 S04-2
- A.28 - APPENDIX A
Entropy J/mol/K
Gibbs Energy EnthaLpy kJ/mol kJ/mol
Entropy J/mol/K
Data Sources: -450.875 Rean: '3.996 4.686 29.118 -1.0 D-H aO: 4.0 LogK(25): .7000
LogK(T)= .000000 No. + .000000 *T
5 + .000000 /T 20 + .000000 *TA2
+ .000000 /TA2
Data Sources: -402.174 Rean: -4.852 9.410 47.834 -1.0 D-H aD: 4.0 logK(25): .8500
logK(T)= .000000 No. + .000000 *T
6 + .000000 IT 20 + .000000 *TA2
+ .000000 /TA2
Data Sources: K:7 H:15 '198.992 Rean: 65.298 66.670 4.600
1.0 D-H aD: 4.0 logK(25): -11.4400 logK(T)= .000000
No. + .000000 *T 7 + .000000 IT 3 + .000000 *TA2 1 + .000000 /TA2
Data Sources: -445.988 Rean: -17.008 11.351 95.116
.0 D-H aD: .0 logK(25): 2.9797 logK(T)= .991000
No. + .667000E-02 *T 7 + .000000 IT
15 + .000000 *TA2 + .000000 /TA2
Data Sources: -358.410 Rean: -65.043 -10.573 182.693
1.0 D-H aO: 5.4 logK(25): 11.3952 LogK(T)= -4.17900
No. 7 1
15
Data Sources: -530.093 Rean:
.0 D-H aO:
+ • 127340E -01 *T + 2902.39 IT + .229812E-04 *TA2 + .000000 /TA2
-12.843 5.850 62.696 .0 logK(25): 2.2500
logK(T)= .000000 No.
7 20
+ .000000 + .000000 + .000000 + .000000
*T /T *TA2 ITA2
Table 3: Thermodynamic data for aqueous species. (Page 5 of 15)
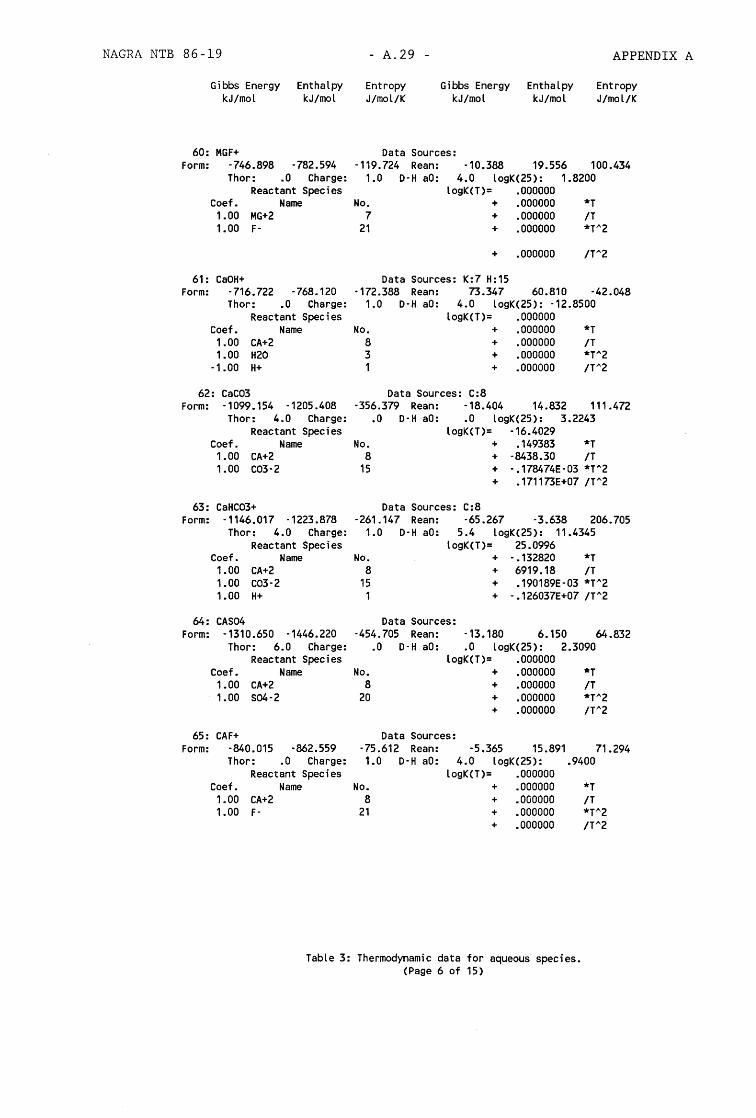
NAGRA NTB 86-19
Gibbs Energy kJ/mol
Enthalpy kJ/mol
60: MGF+ Form: -746.898 -782.594
Thor: .0 Charge: Reactant Species
Coef. Name 1.00 MG+2 1.00 F-
61: CaOH+ Form: -716.722 -768.120
Thor: .0 Charge: Reactant Species
Coef. Name 1.00 CA+2 1.00 H20
-1.00 H+
62: CaC03 Form: -1099.154 -1205.408
Thor: 4.0 Charge: Reactant Species
Coef. Name 1.00 CA+2 1.00 C03-2
63: CaHC03+ Form: -1146.017 -1223.878
Thor: 4.0 Charge: Reactant Species
Coef. Name 1.00 CA+2 1.00 C03-2 1.00 H+
64: CAS04 Form: -1310.650 -1446.220
Thor: 6.0 Charge: Reactant Species
Coef. Name 1.00 CA+2 1.00 S04-2
65: CAF+ Form: -840.015 -862.559
Thor: .0 Charge: Reactant Species
Coef. Name 1.00 CA+2 1.00 F-
- A.29 - APPENDIX A
Entropy J/mol/K
Gibbs Energy kJ/mol
Enthalpy kJ/mol
Entropy J/mol/K
Data Sources: -119.724 Rean: -10.388 19.556 100.434
1.0 D-H aO: 4.0 logK(25): 1.8200 logK(T)= .000000
No. + .000000 *T 7 + .000000 /T
21 + .000000 *T~2
+ .000000 /T~2
Data Sources: K:7 H:15 -172.388 Rean: 73.347 60.810 -42.048
1.0 D-H aD: 4.0 logK(25): -12.8500
No. 8 3 1
logK(T)= .000000
Data Sources: C:8
+ .000000 + .000000 + .000000 + .000000
*T IT
-356.379 Rean: -18.404 14.832 111.472 .0 D-H aO: .0 logK(25): 3.2243
logK(T)= -16.4029 No. + .149383 *T
8 + -8438.30 /T 15 + -.178474E-03 *T~2
+ .171173E+07 /T~2
Data Sources: C:8 -261.147 Rean: -65.267 -3.638 206.705
1.0 D-H aO: 5.4 logK(25): 11.4345 logK(T)= 25.0996
No. 8
15 1
Data Sources: -454.705 Rean:
.0 D-H aO:
+ -.132820 *T + 6919.18 IT + .190189E-03 *T~2 + -.126037E+07 /T~2
-13.180 6.150 64.832 .0 logK(25): 2.3090
logK(T)= .000000 No.
8 20
Data Sources: -75.612 Rean: 1.0 D-H aO:
+ .000000 + .000000 + .000000 + .000000
-5.365 15.891 4.0 logK(25):
logK(T)= .000000 No. + .000000
8 + .000000 21 + .000000
+ .000000
*T IT
.9400
*T IT
71.294
*T~2
IT~2
Table 3: Thermodynamic data for aqueous species. (Page 6 of 15)

NAGRA NTB 86-19
Gibbs Energy Enthalpy kJ/mol kJ/mol
66: SrOH+ Form: -720.731 -771.000
Thor: .0 Charge: Reactant Species
Coef. Name 1.00 SR+2 1.00 H2O
-1.00 H+
67: SrC03 Form: -1103.281 -1201.133
Thor: 4.0 Charge: Reactant Species
Coef. Name 1.00 SR+2 1.00 C03-2
68: SrHC03+ Form: -1152.988 -1212.560
Thor: 4.0 Charge:
69: Form:
Reactant Species Coef. Name
1.00 SR+2 1.00 C03-2 1.00 H+
SRS04 -1317.061 -1463.790 Thor: 6.0 Charge:
Reactant Species Coef. Name
1.00 SR+2 1.00 S04-2
70: BaOH+ Form: -721.004 -760.310
Thor: .0 Charge: Reactant Species
Coef. Name 1.00 BA+2 1.00 H20
-1.00 H+
71: BAC03 Form: -1104.057 -1199.938
Thor: 4.0 Charge: Reactant Species
Coef. Name 1.00 BA+2 1.00 C03-2
72: BAHC03+ Form: -1153.130 -1206.419
Thor: 4.0 Charge: Reactant Species
Coef. Name 1.00 BA+2 1.00 C03-2 1.00 H+
- A.30 - APPENDIX A
Entropy J/mol/K
Gibbs Energy Enthalpy kJ/mol kJ/mol
Entropy J/mol/K
Data Sources: K:7 H:15 -168.603 Rean: 75.858 60.650 -51.008
1.0 D-H aD: 4.0 logK(25): -13.2900 logK(T)= .000000
No. + .000000 *T 9 + .000000 /T 3 + .000000 *T"2 1 + .000000 /T/',2
Data Sources: C:9 -328.195 Rean: -16.011 21.827 126.911
No. 9
15
.0 D-H aD: .0 logK(25): 2.8051 logK(T)= -1.01900
+ .128260E-01 *T + .000000 /T + .000000 + .000000
Data Sources: C:8,9 -199.805 Rean: -65.718 10.400 255.301
1.0 D-H aD: 5.4 logK(25): 11.5135 logK(T)= 7.50265
No. + .114338E-01 *T 9 + -1630.26 /T
15 + .143000E-04 *T/',2 1 + 426564. /T/',2
Data Sources: K: H:20 -492.131 Rean: -13.071 -8.700 14.661
.0 D-H aD: .0 logK(25): 2.2900 logK(T)= .000000
No. + .000000 *T 9 + .000000 /T
20 + .000000 *T/',2 + .000000 /T/',2
Data Sources: K:7 H:15 -131.835 Rean: 76.885 63.160 -46.035
1_0 D-H aD: 4.0 logK(25): -13.4700
No. 10 3 1
logK(T)= .000000
Data Sources: C:19
+ .000000 + .000000 + .000000 + .000000
*T /T *T/',2 /T/',2
-321.590 Rean: -15.486 14.842 101.721 .0 D-H aD: .0 logK(25): 2.7132
logK(T)= .113000 No. + .872100E-02 *T
10 + .000000 /T 15 + .000000 *T/',2
+ .000000 /T/',2
Data Sources: C: 19 -178.732 Rean: -64.560 8.361 244.578
1.0 D-H aO: 5.4 logK(25) : 11.3106 logK(T)= 7.65690
No. + .102358E-01 *T 10 + -1630.26 /T 15 + .143000E-04 *T"2 1 + 426564. /T/',2
Table 3: Thermodynamic data for aqueous species. (Page 7 of 15)

NAGRA NTB 86-19
Gibbs Energy Enthalpy kJ/mol kJ/mol
73: BAS04 Form: -1318.304 -1440.760
Thor: 6.0 Charge: Reactant Species
Coef. Name 1.00 BA+2 1.00 S04-2
74: MnOH+ Form: -404.782 -446.330
Thor: 2.0 Charge: Reactant Species
Coef. Name 1.00 Mn+2 1.00 H2O
-1.00 H+
75: Mn(OH)3-Form: -740.852 -1078.240
Thor: 2.0 Charge: Reactant Species
Coef. Name 1.00 Mn+2 3.00 H2O
-3.00 H+
76: Mn2(OH)3+ Form: -1031.168 -1298.990
Thor: 4.0 Charge: Reactant Species
Coef. Name 2.00 Mn+2 3.00 H2O
-3.00 H+
77: MnS040 Form: -985.530 -1120.940
Thor: 8.0 Charge: Reactant Species
Coef. Name 1.00 Mn+2 1.00 S04-2
78: MnCl+ Form: -362.856 -387.830
Thor: 2.0 Charge: Reactant Species
Coef. Name 1.00 Mn+2 1.00 CL-
79: MnCl20 Form: -490.916 -554.910
Thor: 2.0 Charge: Reactant Species
Coef. Name 1.00 Mn+2 2.00 CL-
- A.31 -
Entropy J/mol/K
Gibbs Energy kJ/mol
Enthalpy kJ/mol
APPENDIX A
Entropy J/mol/K
Data Sources: -410.719 Rean: -13.014 6.150 64.276
.0 D-H aD: .0 logK(25): 2.2800 logK(T)= .000000
No. + .000000 *T 10 + .000000 /T 20 + .000000 *T"'2
+ .000000 /T"2
Data Sources: K:7=15 H:15 -139.352 Rean: 60.447 60.250 - .660
1.0 D-H aD: 4.0 logK(25): -10.5900 logK(T)= .000000
No. + .000000 *T 11 + .000000 IT 3 + .000000 *T"2 1 + .000000 /T"2
Data Sources: K:7=15=18 H=O.O -1131.605 Rean: 198.635 .000 -666.225
-1.0 D-H aD: 4.0 logK(25): -34.8000 logK(T)= .000000
No. + .000000 *T 11 + .000000 IT 3 + .000000 *T"2 1 + .000000 IT"2
Data Sources: K:7 H=O.O -898.279 Rean: 136.419 .000 -457.551
1.0 D-H aD: 4.0 logK(25): -23.9000 logK(T)= .000000
No. + .000000 *T 11 + .000000 /T 3 + .000000 *T"2 1 + .000000 /T"2
Data Sources: K: H: 15 -454.168 Rean: -12.900 9.080 73.721
.0 D-H aD: .0 logK(25): 2.2600 logK(T)= .000000
No. + .000000 *T 11 + .000000 /T 20 + .000000 *T"2
+ .000000 /T"2
Data Sources: K:15 H=O.O -83.764 Rean: -3.465 .000 11.621 1.0 D-H aD: 4.0 logK(25): .6070
logK(T)= .000000 No. + .000000 *T
11 + .000000 /T 22 + .000000 *T"2
+ .000000 /T"2
Data Sources: K:15 H=O.O -214.637 Rean: - .234 .000 .785
.0 D-H aD: .0 logK(25): .0410 logK{T)= .000000
No. + .000000 *T 11 + .000000 IT 22 + .000000 *T"2
+ .000000 IT"2
Table 3: Thermodynamic data for aqueous species. (Page 8 of 15)

NAGRA NTB 86-19
Gibbs Energy kJ/mol
Enthalpy kJ/mol
80: MnCl3-Form: -620.232 -721.990
Thor: 2.0 Charge: Reactant Species
Coef. Name 1.00 Mn+2 3.00 CL-
81: MnHC03+ Form: -822.122 -912.990 .
Thor: 6.0 Charge: Reactant Species
Coef. Name 1.00 Mn+2 1.00 C03-2 1.00 H+
82: FeOH+ Form: -268.254 -318.010
Thor: 2.0 Charge: Reactant Species
Coef. Name 1.00 Fe+2 1.00 H2O
-1.00 H+
83: Fe(OH)20 Form: -442.025 -539.560
Thor: 2.0 Charge: Reactant Species
Coef. Name 1.00 Fe+2 2.00 H2O
-2.00 H+
84: Fe(OH)3-Form: -619.792 -818.090
Thor: 2.0 Charge: Reactant Species
Coef. Name 1.00 Fe+2 3.00 H2O
-3.00 H+
85: FeS040 Form: -842.723 -989.970
Thor: 8.0 Charge: Reactant Species
Coef. Name 1.00 Fe+2 1.00 S04-2
86: Fe+3 Form: -10.976 -45.560
Thor: 3.0 Charge: Reactant Species
Coef. Name 1.00 Fe+2
-1.00 e-
- A.32 - APPENDIX A
Entropy J/mol/K
Gibbs Energy kJ/mol
Enthalpy kJ/mol
Entropy J/mol/K
Data Sources: K:15 H=O.O -341.297 Rean: 1.741 .000 -5.839 -1.0 D-H aO: 4.0 logK(25): - .3050
logK(T)= .000000 No. + .000000 *T
11 + .000000 /T 22 + .000000 *T"2
+ .000000 IT"2
Data Sources: K: H: 15 -304.774 Rean: -66.212 -15.100 171.430
1.0 D-H aO: 5.4 logK(25): 11.6000 logK(T)= .000000
No. + .000000 *T 11 + .000000 IT 15 + .000000 *T"2 1 + .000000 IT"2
Data Sources: K:7=15 H:15 -166.883 Rean: 54.225 55.220 3.337
1.0 D-H aO: 4.0 logK(25): -9.5000 logK(T)= .000000
No. + .000000 *T 12 + .000000 IT 3 + .000000 *T"2 1 + .000000 IT"2
Data Sources: K:7=15 H:15 -327.134 Rean: 117.583 119.500 6.430
.0 D-H aO: .0 logK(25): -20.6000 logK(T)= .000000
No. + .000000 *T 12 + .000000 IT 3 + .000000 *T"2 1 + .000000 /T"2
Data Sources: K: H:7=19 -665.096 Rean: 176.945 126.800 -168.188 -1.0 D-H aO: 4.0 logK(25): -31.0000
logK(T)= .000000 No. + .000000 *T
12 + .000000 IT 3 + .000000 *T"2 1 + .000000 IT"2
Data Sources: K: H:15 -493.870 Rean: -12.843 6.700 65.547
.0 D-H aO: .0 logK(25): 2.2500 logK(T)= .000000
No. + .000000 *T 12 + .000000 IT 20 + .000000 *T"2
+ .000000 IT"2
Data Sources: K: H:15 -115.996 Rean: 74.374 41.840 -109.120
3.0 D-H aO: 9.0 logK(25): -13.0300
No. 12 2
logK(T)= .000000 + .000000 + .000000 + .000000 + .000000
*T /T *T"2 /T"2
Table 3: Thermodynamic data for aqueous species. (Page 9 of 15)

NAGRA NTB 86-19
Gibbs Energy Enthalpy kJ/mol kJ/mol
87: FeOH+2 Form: -235.605 -287.890
Thor: 3.0 Charge: Reactant Species
Coef. Name 1.00 Fe+2 1.00 H2O
-1.00 e--1.00 H+
88: Fe(OH)2+ Form: -452.870 -617.220
Thor: 3.0 Charge: Reactant Sped es
Coef. Name 1.00 Fe+2 2.00 H2O
-1.00 e--2.00 H+
89: Fe(OH)30 Form: -644.679 -903.050
Thor: 3.0 Charge: Reactant Speci es
Coef. Name 1.00 Fe+2 3.00 H2O
-1.00 e--3.00 H+
90: Fe(OH)4-Form: -836.202 -1188.880
Thor: 3.0 Charge: Reactant Species
Name Coef. 1.00 4.00
-1.00 e-
Fe+2 H20
-4.00 H+
91: FeS04+ Form: -777.881 -938.470
Thor: 9.0 Charge: Reactant Speci es
Coef. Name 1.00 Fe+2 1.00 S04-2
-1.00 e-
92: Fe(S04)2-Form: -1530.973 -1844.850
Thor: 15.0 Charge: Reactant Species
Coef. Name 1.00 Fe+2 2.00 S04-2
-1.00 e-
- A.33 -
Entropy J/moL/K
Gibbs Energy EnthaLpy kJ/moL kJ/moL
Data Sources: K: H:7=15 -175.366 Rean: 86.874 85.340
APPENDIX A
Entropy J/moL/K
-5.146 2.0 D-H aO: 4.0 LogK(25): -15.2200
LogK(T)= .000000 No. + .000000 *T
12 + .000000 IT 3 + .000000 *T"2 2 + .000000 IT"2 1
Data Sources: K:7=15 H=O.O -551.233 Rean: 106.738 41.840 -217.669
1.0 D-H aO: 4.0 LogK(25): -18.7000 LogK(T)= .000000
No. + .000000 *T 12 + .000000 IT 3 + .000000 *T"2 2 + .000000 IT "2 1
Data Sources: K:7=15 H=O.O -866.583 Rean: 152.059 41.840 -369.675
.0 D-H aO: .0 LogK(25): -26.6400 LogK(T)= .000000
No. + .000000 *T 12 + .000000 IT 3 + .000000 *T"2 2 + .000000 IT"2 1
Data Sources: K:5=15 H=O.O -1182.891 Rean: 197.665 41.840 -522.639
-1.0 D-H aO: 4.0 LogK(25): -34.6300
No. 12 3 2 1
LogK(T)= .000000 + .000000 + .000000 + .000000 + .000000
Data Sources: K: H:15
*T IT *T"2 IT"2
-538.619 Rean: 51.999 58.200 20.798 1.0 D-H aO: 4.0 LogK(25): -9.1100
LogK(T)= .000000 No. + .000000 *T
12 + .000000 IT 20 + .000000 *T"2 2 + .000000 IT"2
Data Sources: K: H:15 -1052.749 Rean: 43.437 61.090 59.208
-1.0 D-H aO: 4.0 LogK(25): -7.6100 LogK(T)= .000000
No. + .000000 *T 12 + .000000 IT 20 + .000000 *T"2 2 + .000000 IT "2
TabLe 3: Thermodynamic data for aqueous species. (Page 10 of 15)

NAGRA NTB 86-19
Gibbs Energy Enthalpy kJ/mol kJ/moL
93: FeCl+2 Form: -150.715 -179.540
Thor: 3.0 Charge: Reactant Species
Coef. Name 1.00 Fe+2 1.00 CL-
-1.00 e-
94: FeCl2+ Form: -285.716 -346.370
Thor: 3.0 Charge: Reactant Species
Coef. Name 1.00 Fe+2 2.00 CL-
-1.00 e-
95: FeCl30 Form: -411.299 -503.750
Thor: 3.0 Charge: Reactant Species
Coef. Name 1.00 Fe+2 3.00 CL-
-1.00 e-
96: FeCl4-Form: -531.688 -655.890
Thor: 3.0 Charge: Reactant Species
Coef. Name 1.00 Fe+2 4.00 CL-
-1.00 e-
97: H2B03-Form: -916.009 -1058.831
98: Form:
99: Form:
Thor: .0 Charge: Reactant Speci es
Coef. Name 1.00 H3B03
-1.00 H+
H2As03--587.130 -714.790 Thor: 3.0 Charge:
Reactant Species Coef. Name
1.00 H3As03 -1.00 H+
At(OH)+2 -697.990 -767.210 Thor: .0 Charge:
Reactant Species Coef. Name 1.00 Al+3 1.00 H2O
-1.00 H+
- A.34 -
Entropy J/mol/K
Gibbs Energy Enthalpy kJ/mol kJ/mol
Data Sources: K: H:18 -96.681 Rean: 65.926 74.940
APPENDIX A
Entropy J/mol/K
30.232 2.0 D-H aD: 4.0 logK(25): -11.5500
logK(T)= .000000 No. + .000000 *T
12 + .000000 IT 22 + .000000 *T"2 2 + .000000 IT"2
Data Sources: K: 15=18 H: 18 -203.436 Rean: 62.216 75.190 43.514
1.0 D-H aD: 4.0 logK(25): -10.9000 logK(T)= .000000
No. + .000000 *T 12 + .000000 IT 22 + .000000 *T"2 2 + .000000 IT"2
Data Sources: K: 15=18 H: 18 -310.083 Rean: 67.924 84.890 56.904
.0 D-H aD: .0 logK(25): -11.9000 logK(T)= .000000
No. + .000000 *T 12 + .000000 IT 22 + .000000 *T"2 2 + .000000 IT "2
Data Sources: K: H:18 -416.577 Rean: 78.826 99.830 70.447 -1.0 D-H aD: 4.0 logK(25): -13.8100
logK(T)= .000000 No. + .000000 *T
12 + .000000 IT 22 + .000000 *T"2 2 + .000000 IT"2
Data Sources: -479.027 Rean: 52.741 13.489 -131.652 -1.0 D-H aD: 4.0 logK(25): -9.2400
No. 13 1
logK(T)= .000000 + .000000 + .000000 + .000000 + .000000
*T IT *T"2 IT"2
Data Sources: G:1 H:1 -428.174 Rean: 52.670 27.410 -84.723 -1.0 D-H aD: 4.0 logK(25): -9.2276
logK(T)= .000000 No. + .000000 *T
19 + .000000 IT 1 + .000000 *T"2
+ .000000 IT"2
Data Sources: K:14 H:7 -232.167 Rean: 28.539 50.000 71.979
2.0 D-H aO: 5.0 logK(25): -5.0000 logK(T)= .000000
No. + .000000 *T 14 + .000000 IT 3 + .000000 *T"2 1 + .000000 IT"2
Table 3: Thermodynamic data for aqueous species. (Page 11 of 15)

NAGRA NTB 86-19
Gibbs Energy Enthalpy kJ/mol kJ/moL
100: AL(OH)2+ Form: -905.438 -1013.040
Thor: .0 Charge: Reactant Species
Coef. Name 1.00 AL+3 2.00 H2O
-2.00 H+
101: Al(OH)4-Form: -1311.201 -1503.280
Thor: .0 Charge: Reactant Species
Coef. Name 1.00 AL+3 4.00 H2O
-4.00 H+
102: ALF+2 Form: -811.122 -866.730
Thor: .0 Charge: Reactant Species
Coef. Name 1.00 AL+3 1.00 F-
103: ALF2+ Form: -1125.596 -1118.380
Thor: .0 Charge: Reactant Species
Coef. Name 1.00 Al+3 2.00 F-
104: ALF3 Form: -1431.679 -1526.970
Thor: .0 Charge: Reactant Species
Coef. Name 1.00 At+3 3.00 F-
105: ALF4-Form: -1728.800 -1872.780
Thor: .0 Charge: Reactant Species
Coef. Name 1.00 AL+3 4.00 F-
106: HF(AQ) Form: -299.798 -320.870
Thor: .0 Charge: Reactant Species
Coef. Name 1.00 H+ 1.00 F-
- A.35 - APPENDIX A
Entropy J/mol/K
Gibbs Energy kJ/moL
Enthalpy kJ/mol
Entropy J/mol/K
Data Sources: K:14 H:6 -360.901 Rean: 58.221 90.000 106.589
1.0 D-H aO: 4.0 logK(25): -10.2000 logK(T)= .000000
No. + .000000 *T 14 + .000000 IT 3 + .000000 *T"'2 1 + .000000 IT"'2
Data Sources: K:14 H:1 -644.237 Rean: 126.715 171.420 149.941 -1.0 D-H aD: 4.0 LogK(25): -22.2000
LogKO )= .000000 No. + .000000 *T
14 + .000000 JT 3 + .000000 *T"'2 1 + .000000 IT"'2
Data Sources: -186.508 Rean: -40.012 .000 134.203
2.0 D-H aD: 5.0 LogK(25): 7.0100 LogK(T)= .000000
No. + .000000 *T 14 + .000000 IT 21 + .000000 *T"'2
+ .000000 IT"'2
Data Sources: 24.202 Rean: -72.776 83.700 524.822 1.0 D-H aD: 4.0 LogK(25): 12.7500
LogK(T)= .000000 No.
14 21
Data Sources: -319.609 Rean:
.0 D-H aO:
+ .000000 + .000000 + .000000 + .000000
*T IT *T"'2 IT"'2
-97.149 10.460 360.921 .0 LogK(25): 17.0200
LogK(T)= .000000 No.
14 21
Data Sources:
+ .000000 + .000000 + .000000 + .000000
*T IT *T"'2 JT"'2
-482.912 Rean: -112.560 .000 377.528 -1.0 D-H aO: 4.0 LogK(25): 19.7200
LogK(T)= .000000 No. + .000000 *T
14 + .000000 IT 21 + .000000 *T"'2
Data Sources: -70.675 Rean:
.0 D-H aO:
+ .000000 IT"'2
-18.088 14.480 109.235 .0 LogK(25): 3.1690
LogK(T)= .000000 No.
1 21
+ .000000 + .000000 + .000000 + .000000
*T IT
TabLe 3: Thermodynamic data for aqueous species. (Page 12 of 15)

NAGRA NTB 86-19
Gibbs Energy kJ/moL
Enthalpy kJ/moL
107: HC03-Form: -586.766 -692.041
Thor: 4.0 Charge: Reactant Species
Coef. Name 1.00 C03-2 1.00 H+
108: H2C03 Form: -623.022 -701.149
Thor: 4.0 Charge: Reactant Species
Coef. Name 1.00 C03-2 2.00 H+
109: H3SI04-Form: -1250.926 -1418.894
110: Form:
111 : Form:
112: Form:
Thor: .0 Charge: Reactant Species
Coef. Name 1.00 H4SI04
-1.00 H+
NH3 AQ -26.500 -80.315
Thor: -3.0 Charge: Reactant Speci es
Coef. Name 1.00 NH4+
-1.00 H+
HP04-2 -1089.170 -1292.170 Thor: .0 Charge:
Reactant Species Coef. Name 1.00 P04-3 1.00 H+
H2P04--1130.307 -1296.310 Thor: .0 Charge:
Reactant Species Coef. Name 1.00 P04-3 2.00 H+
113: HAs04-2 Form: -714.600 -906.340
Thor: 5.0 Charge: Reactant Species
Coef. Name 1.00 AS04-3 1.00 H+
- A.36 - APPENDIX A
Entropy J/moL/K
Gibbs Energy kJ/moL
Enthalpy kJ/mol
Entropy J/mol/K
Data Sources: C:8 -353.091 Rean: -58.957 -14.901 147.764 -1.0 D-H aO: 5.5 LogK(25): 10.3289
LogK(T)= 10.7507 No. + -.343322E-02 *T
15 + -1630.26 /T 1 + .143000E-04 *TA2
+ 426564. /TA2
Data Sources: C:8 -262.042 Rean: -95.212 -24.010 238.814
.0 D-H aO: .0 LogK(25): 16.6807 LogK(T)= 50.5538
No. + -.596899E-01 *T 15 + -11990.2 /T 1 + .608946E-04 *TA2
+ .166459E+07/TA2
Data Sources: -563.367 Rean: 56.674 37.386 -64.691 -1.0 D-H aO: 4.0 logK(25): -9.9290
No. 16 1
LogK(T)= 6.36800 + -.163460E-01 *T + -3405.90 /T + .000000 *TA2 + .000000 ITA2
Data Sources: -180.495 Rean: 52.810 52.195 -2.061
.0 D-H aO: .0 LogK(25): -9.2520 LogK(r)= .000000
No. + .000000 *T 17 + .000000 /T 1 + .000000 *TA2
+ .000000 ITA2
Data Sources: -680.865 Rean: -70.470 -14.770 186.819 -2.0 D-H aO: 4.0 LogK(25): 12.3461
LogK(r)= .000000 No. + .000000 *T
18 + .000000 IT 1 + .000000 *TA2
+ .000000 ITA2
Data Sources: -556.778 Rean: -111.607 -18.910 310.906 -1.0 D-H aO: 4.5 LogK(25): 19.5530
LogK(T)= .000000 No. + .000000 *T
18 + .000000 IT 1 + .000000 *TA2
+ .000000 ITA2
Data Sources: G:1 H:1 -643.099 Rean: -66.190 -18.200 160.959 -2.0 D-H aO: 4.0 LogK(25): 11.5962
No. 29
1
LogKeT)= .000000 + .000000 + .000000 + .000000 + .000000
*T IT *TA2 ITA2
TabLe 3: Thermodynamic data for aqueous species. (Page 13 of 15)

NAGRA NTB 86-19
Gibbs Energy EnthaLpy kJ/moL kJ/moL
114: H2As04-Form: -753.170 -909.560
Thor: 5.0 Charge: Reactant Species
Coef. Name 1.00 AS04-3 2.00 H+
115: U(OH)4 Form: -1430.999 -1630.760
Thor: 4.0 Charge: Reactant Species
Coef. Name 1.00 U4+ 4.00 H2O
-4.00 H+
116: U(OH)5-Form: -1641.587 -1904.870
Thor: 4.0 Charge: Reactant Speci es
Coef. Name 1.00 U4+ 5.00 H2O
-5.00 H+
117: U02+ Form: -968.545 -1032.610
Thor: 5.0 Charge: Reactant Species
Coef. Name 1.00 U4+ 2.00 H2o
-4.00 H+
-1.00 e-
118: UL=U02+2 Form: -952.746 -1018.511
Thor: 6.0 Charge: Reactant Species
Coef. Name 1.00 U4+ 2.00 H2O
-4.00 H+ -2.00 e-
119: ULC03 Form: -1537.920 -1707.371
Thor: 10.0 Charge: Reactant Species
Coef. Name 1.00 U4+ 2.00 H2O 1.00 C03-2
-4.00 H+ -2.00 e-
- A.37 - APPENDIX A
Entropy J/moL/K
Gibbs Energy EnthaLpy kJ/moL kJ/moL
Entropy J/mol/K
Data Sources: G:1 H:1 -524.535 Rean: -104.760 -21.420 279.523 -1.0 D-H aO: 4.5 LogK(25): 18.3535
LogK(T)= .000000 No. + .000000 *T 29 + .000000 IT 1 + .000000 *T~2
+ .000000 IT~2
Data Sources: K:17 H:17 -670.003 Rean: 48.517 103.760 185.285
.0 D-H aO: .0 LogK(25) : -8.5000 LogK(r)= .000000
No. + .000000 *T 24 + .000000 IT 3 + .000000 *T~2
1 + .000000 IT~2
Data Sources: K:17 H:17 -883.059 Rean: 75.059 115.480 135.573 -1.0 D-H aO: 4.0 LogK(25) : -13.1500
LogK(r)= .000000 No. + .000000 *T
24 + .000000 IT 3 + .000000 *T~2
1 + .000000 IT~2
Data Sources: K:17 H:17 -214.876 Rean: 36.713 130.250 313.724
1.0 D-H aO: 4.0 LogK(25): -6.4320 LogK(r)= .000000
No. + .000000 *T 24 + .000000 IT 3 + .000000 *T~2
1 + .000000 IT~2
2
Data Sources: K:17 H:17 -220.577 Rean: 52.513 144.350 308.024
2.0 D-H aD: 5.0 logK(25): -9.2000 LogK(r)= .000000
No. + .000000 *T 24 + .000000 IT 3 + .000000 *T~2
1 + .000000 IT~2
2
Data Sources: K:17 H:17 -568.339 Rean: -4.852 132.630 461.116
.0 D-H aO: .0 LogK(25): .8500 LogK(r)= .000000
No. + .000000 *T 24 + .000000 IT 3 + .000000 *T"2
15 + .000000 IT~2
1 2
TabLe 3: Thermodynamic data for aqueous species. (Page 14 of 15)

NAGRA NTB 86-19
Gibbs Energy Enthalpy kJ/mol kJ/moL
120: ULC032-2 Form: -2105.400 -2357.731
Thor: 14.0 Charge: Reactant Species
Coef. Name 1.00 U4+ 2.00 H2O 2.00 C03-2
-4.00 H+ -2.00 e-
121 : ULC033-4 Form: -2658.325 -3090.521
Thor: 18.0 Charge: Reactant Species
Coef. Name 1.00 U4+ 2.00 H2O 3.00 C03-2
-4.00 H+ -2.00 e-
122: ULOH+ Form: -1156.769 -1258.321
Thor: 6.0 Charge: Reactant Species
Coef. Name 1.00 U4+ 3.00 H2O
-5.00 H+ -2.00 e-
123: Ul(OH)2 Form: -1358.509 -1517.371
Thor: 6.0 Charge: Reactant Speci es
Coef. Name 1.00 U4+ 4.00 H2O
-6.00 H+ -2.00 e-
124: S-2 Form: 85.809 116.780
Thor: -2.0 Charge: Reactant Species
Coef. Name 1.00 H2S AQ
-2.00 H+
125: HS-Form: 12.080 66.160
Thor: -2.0 Charge: Reactant Species
Coef. Name 1.00 H2S AQ
-1.00 H+
- A.38 - APPENDIX A
Entropy J/mol/K
Gibbs Energy EnthaLpy kJ/moL kJ/moL
Entropy J/moL/K
Data Sources: K:17 H:17 -846.321 Rean: -44.522 159.410 683.990 -2.0 D-H aO: 4.0 LogK(25): 7.8000
LogK(T)= .000000 No. + .000000 *T
24 + .000000 IT 3 + .000000 *T"'2
15 + .000000 IT "'2 1 2
Data Sources: K:17 H:17 -1449.592 Rean: -69.636 103.760 581.575
-4.0 D-H aO: 6.0 LogK(25): 12.2000 LogK(T)= .000000
No. + .000000 *T 24 + .000000 IT 3 + .000000 *T"'2
15 + .000000 IT"'2 1 2
Data Sources: K:17 H:17 -340.606 Rean: 85.619 190.370 351.338
1.0 D-H aO: 4.5 logK(25): -15.0000 LogK(T)= .000000
No. + .000000 *T 24 + .000000 IT 3 + .000000 *T"'2 1 + .000000 IT"'2 2
Data Sources: K:17 H:17 -532.825 Rean: 121.008 217.150 322.463
.0 D-H aD: .0 LogK(25): -21.2000 LogK(T)= .000000
No. + .000000 *T 24 + .000000 IT 3 + .000000 *T"'2 1 + .000000 IT "'2 2
Data Sources: 103.878 Rean: 113.639 156.480 143.690 -2.0 D-H aD: 5.0 logK(25): -19.9090
No. 30
1
LogK(T)= .000000
Data Sources:
+ .000000 + .000000 + .000000 + .000000
*T IT *T"'2 IT"'2
181.386 Rean: 39.910 105.860 221.199 -1.0 D-H aD: 3.5 logK(25): -6.9920
logK(T)= .000000 No. + .000000 *T 30 + .000000 IT
1 + .000000 *T"'2 + .000000 IT"'2
Table 3: Thermodynamic data for aqueous species. (Page 15 of 15)

NAGRA NTB 86-19 - A.39 - APPENDIX A
Gibbs Energy Enthalpy kJ/mol kJ/mol
Entropy J/mol/K
Gibbs Energy Enthalpy kJ/mol kJ/mol
Entropy J/mol/K
1: Calcite Data Sources: C:8 Thor: 4.0 logK(25): -8.480
Form: -1129.152 -1210.631 -273.282 Rean: Reactant Species
Coef. Name 1.00 C03-2 1.00 CA+2
No. 15 8
48.402 -9.609 -194.570 logK(T)= 6.75444
+ -.118494E-01 *T + -3637.75 IT + -.263017E-04 *T"2 + 252258. IT"2
2: Dolomite Data Sources: K: H:15 Thor: 8.0 logK(25): -17.000
Form: -2160.394 -2329.495 -567.166 Rean:
Coef. Reactant Species
Name 1.00 CA+2 1.00 MG+2 2.00 C03-2
No. 8 7
15
97.034 logK(T)=
+ + + +
-34.685 .000000 .000000 .000000 .000000 .000000
-441. 789
*T IT *T"2 IT"2
3: Strontianite Data Sources: C:9 Thor: 4.0 logK(25): -9.271
Form: -1140.185 -1221.285 -272.010 Rean:
Coef. Reactant Sped es
Name 1.00 SR+2 1.00 C03-2
No. 9
15
52.915 -1.675 -183.096 logK(T)= 13.8232
+ -.522789E-01 *T + -2120.44 IT + .207889E-04 *T"2 + -199367. IT"2
4: Witherite Data Sources: C:19 Thor: 4.0 togK(25): -8_562
Form: -1137.439 -1217.720 -269.263 Rean:
Coef. Reactant Species
Name 1.00 BA+2 1.00 C03-2
No. 10 15
48.869 2.940 -154.047 logK(T)= 17.4830
+ -.973880E-01 *T + 1384.14 IT + .868793E-04 *T"2 + -833276. ITA2
7: Gypsum Data Sources: C:10 (eqn 3) Thor: 6.0 logK(25): -4.581
Form: -1797.875 -2023.576 -757.002 Rean: 26.147 - .454 -89.222
Coef. Reactant Sped es
Name 1.00 CA+2 1.00 S04-2 2.00 H20
No. 8
20 3
logK(T)= 5.69760 + -.231542E-01 *T + -954.120 IT + .920711E-05 *TA2 + -88306.9 IT"2
8: Anhydrite Data Sources: C:l0 (eqn 5) -4.239
Form: Thoi:
-1321.668 "" n v.v togK(25):
-1432.417 -371.453 Reactant Species
Coef. Name No. 1.00 CA+2 8
Rean: 24.198 -19.954 -148.085 LogK(T)= 5.83989
+ - .303452E-Ol *T + -239.299 IT
1.00 s04-2 20 + .120667E-04 *T"2 + -115728.
TabLe 4: Thermodynamic data for mineraLs. (Page 1 of 3)
/T A 2

NAGRA NTB 86-19 - A.40 - APPENDIX A
Gibbs Energy kJ/mol
Enthalpy kJ/mol
Entropy J/mol/K
Gibbs Energy Enthalpy kJ/mol kJ/mol
Entropy J/mol/K
9: Celestite Data Sources: C:10 (eqn 10) Thor: 6.0 logK(25): -6.633
Form: -1341.853 -1457.612 -388.259 Rean:
Coef. Reactant Species
Name 1.00 SR+2 1.00 S04-2
No. 9
20
37.863 2.522 -118.532 logK(T)= 14.2330
+ -.456563E-01 *T + -2059.93 IT + .181551E-04 *T~2 + -174121. IT~2
10: Barite Data Sources: C:10 (eqn 2) . Thor: 6.0 logK(25): -9.970
Form: -1362.200 -1473.484 -373.250 Rean: 56.910 26.574 -101.746 logK(T)= 14.7689
Coef. Reactant Species
Name 1.00 BA+2 1.00 S04-2
No. 10 20
+ -.448943E-01 *T + -3284.06 IT + .178518E-04 *T~2 + -171224. IT~2
11: Fluorite Data Sources: K: H:16 Thor: .0 logK(25): -10.410
Form: -1175.779 -1229.699 -180.848 Rean: 59.419 logK(T)=
15.899 .000000 .000000 .000000 .000000 .000000
Coef. Reactant Species
Name 1.00 CA+2 2.00 F-
No. 8
21
+ + + +
12: Portlandite Data Sources: G:1 H:1 Thor: .0 logK(25): 22.661
Form: -897.850 -986.360 -296.864 Rean: -129.348 -128.400 .000000 .000000 .000000 .000000 .000000
Reactant Speci es Coef. Name
1.00 CA+2 2.00 H2O
-2.00 H+
No. 8 3 1
logK(T)= + + + +
13: Chalcedony Data Sources: C:13 Thor: .0 logK(25): -3.550
Form: -1090.736 -1190.207 -333.628 Rean: 20.265 19.757
14:
Form:
Reactant Species Coef. Name 1.00 H4SI04
-1.00 H20
Quartz
No. 16 3
logK(T)= -.890000E-01 + .000000 + -1032.00 + .000000 + .000000
Data Sources: C: 13 Thor: .0 loaK(25): -3.979 -856.056 -909.680 -179.856 Rean: 22.714 25.060
Coef. 1.00
-2.00
Reactant Species logK(T)= .411000 Name
H4SI04 H2O
No. + .000000 16 + -1309.00 3 + .000000
+ .000000
Table 4: Thermodynamic data for minerals. (Page 2 of 3)
-145.967
*T IT *T~2
IT~2
3.180
*T IT *T~2
/T~2
-1.704
*T IT *T~2
IT~2
7.868
*T IT *T~2
IT~2

NAGRA NTB 86-19
Gibbs Energy kJ/mol
Enthalpy kJ/mol
- A.41 -
Entropy J/mol/K
Gibbs Energy kJ/mol
15: Uraninite Data Sources: K:17 H:17 Thor: 4.0 logK(25): -4.600
Form: -1031.515 -1084.620 -178.117 Rean: 26.256 Reactant Species
Coef. Name 1.00 U4+ 2.00 H2O
-4.00 H+
22: P C02
No. 24 3 1
logK(T)=
Data Sources: C:8 -1.468
+ + + +
Enthalpy kJ/mol
-78.240 .000000 _000000 .000000 .000000 .000000
Form: Thor: 4.0 logK(25): -394.272 -395.336 -3.568 Rean: 8.379 -19.984
Reactant Species logK(T)= 7.44216
APPENDIX A
Entropy J/mol/K
-350.483
*T IT *T"2 /T"2
-95.129
Coef. Name 1.00 H2C03
-1.00 H20
No. 108
3
+ -.175207E-01 *T + -3259.96 /T + .148606E-04 *T"2 + 526838. /T"2
Table 4: Thermodynamic data for minerals. (Page 3 of 3)

NAGRA NTB 86-19 - A.42 -
23:
Form:
25:
Form:
26:
Form:
27:
Form:
Gibbs Energy Enthalpy
kJ/moL kJ/mol
Entropy
J/mol/K
Gibbs Energy Enthalpy
kJ/mol kJ/mol
PE:02/H20 Data Sources: G: H: 0.0 Thor: 1. a LogK(25): -21.490
.000 .000 .000 Rean: 122.665 139.990 Reactant Species logK(r)= .000000
Coef. Name No. + .000000 .25 02 AQ 25 + .000000
1.00 H+ 1 + .000000 - .50 H2O 3 + .000000
PE:02(SATO)/H20 Data Sources: K: 16 H: 0.0 Thor: 1.0 logK(25): -11.385
57.680 .000 -193.460 Rean: 64.984 139.990 Reactant Species logK(r)= .000000
Coef. Name No. + .000000 .25 02 AQ 25 + .000000
1.00 H+ 1 + .000000 -.50 H2O 3 + .000000
PE:As(V)/As(III) Data Sources: G: H: 0.0 Thor: 1.0 LogK(25) : -20.018
.000 .000 .000 Rean: 114.260 69.945 Reactant Species logK(r)= .000000
Coef. Name No. + .000000 .50 AS04-3 29 + .000000
2.50 H+ 1 + .000000 -.50 H3As03 19 + .000000 -.50 H2O 3
PE:N2(AQ)/NH4+ Data Sources: G: H: 0.0 Thor: 1.0 logK(25): -5.128
.000 .000 .000 Rean: 29.270 42.836 Reactant Species logK(r)= .000000
Coef. Name No. + .000000 .17 N2 AQ 28 + .000000
1.33 H+ 1 + .000000 - .33 NH4+ 17 + .000000
28: PE:S04-2/H2S Data Sources: G: H: 0.0 Thor: 1.0 logK(25): -5.077
Form: .000 .000 .000 Rean: 28.977 34.219 Reactant Species LogK(r)= .000000
Coef. Name No. + .000000 .13 S04-2 20 + .000000
1.25 H+ 1 + .000000 -.13 H2S AQ 30 + .000000 - .50 H2O 3
29: PE:C03-2/CH4(AQ) Data Sources: G: H: 0.0 Thor: 1.0 logK(25): -4.772
Form: .000 .000 .000 Rean: 27.239 33.674 Reactant Species LogK(r)= .000000
Coef. Name No. + .000000 .13 C03-2 15 + .000000
1.25 H+ 1 + .000000 -.13 CH4 AQ 27 + .000000 - .38 H2O 3
APPENDIX A
Entropy
J/mol/K
58.110
*T /T *T"2 /T ..... 2
251.570
*T IT *T ..... 2 IT"'" 2
-148.632
*T IT *T"2 /T ..... 2
45.502
*T IT *T ..... 2 /T"2
17.581
*T IT *T"2 IT"2
21.584
*T IT *T ..... 2 IT ..... 2
Table 5: Thermodynamic data for the calculation of oxidation potentials.
(Page 1 of 2)

NAGRA NTB 86-19 - A.43 -
Gibbs Energy Enthalpy
kJ/mol kJ/mol
Entropy
J/mol/K
Gibbs Energy Enthalpy
kJ/mol kJ/mol
30: PE:H+/H2(AQ) Thor: 1.0 logK(25):
Form: .000 .000 Reactant Species
Coef. Name No. 1.00 H+ 1 -.50 H2 AQ 26
Data Sources: G: H: 0.0 1.542
.000 Rean: -8.800 logK(T)=
+ + + +
2.100 .000000 .000000 .000000 .000000 .000000
APPENDIX A
Entropy
J/mol/K
36.559
*T IT *T"2 /T"2
Table 5: Thermodynamic data for the calculation of oxidation potentials.
(Page 2 of 2)