Technical Report 3rd Proficiency Test (2017) on … Diffusion Capacity of Cigarette Papers May 2017...
19
Physical Test Methods Sub-Group Technical Report 3 rd Proficiency Test (2017) on Diffusion Capacity of Cigarette Papers May 2017 Sub-Group Co-ordinator: Bernhard Eitzinger, delfort AG, Austria Study Co-ordination: B. Eitzinger, P. Le Men, J. Vincent, P. Müller
-
Upload
truongkhanh -
Category
Documents
-
view
217 -
download
2
Transcript of Technical Report 3rd Proficiency Test (2017) on … Diffusion Capacity of Cigarette Papers May 2017...
Physical Test Methods Sub-Group
Technical Report
3rd Proficiency Test (2017)
on Diffusion Capacity
of Cigarette Papers
May 2017
Sub-Group Co-ordinator:
Bernhard Eitzinger, delfort AG, Austria
Study Co-ordination:
B. Eitzinger, P. Le Men, J. Vincent, P. Müller

Table of Contents
1. INTRODUCTION ............................................................................................................ 3
Purpose and Scope ................................................................................................... 3 1.1
Study Protocol ......................................................................................................... 3 1.2
Products and Measurements .................................................................................... 3 1.3
Study Participants .................................................................................................... 4 1.4
2. STATISTICAL EVALUATION ...................................................................................... 5
2.1 Raw Data Treatement .............................................................................................. 5
2.2 Outlier Analysis and Removal ................................................................................ 5
2.3 Robust Mean Values and Standard Deviations ....................................................... 6
2.4 Evaluation of Laboratory Performance (z-Scores) .................................................. 7
3. DATA INTERPRETATION ............................................................................................ 8
3.1 Conclusions from Outlier Testing ........................................................................... 8
3.2 Conclusions from the Z-Scores ............................................................................... 8
3.3 Comparison with Historical Data ............................................................................ 9
4. REFERENCES ............................................................................................................... 10
5. APPENDICES ................................................................................................................ 11

PTM-123-CTR 3rd
Proficiency Test (2017) on Diffusion Capacity – May 2017 3/19 3 of 19
1. INTRODUCTION
Purpose and Scope 1.1
In 2014 the Physical Test Methods (PTM) Sub-Group of CORESTA published CRM No. 77 -
Determination of Diffusion Capacity by Measurement of CO2 Transfer Rate Through
Materials Used as Cigarette Papers and Cigarette Papers having an Oriented Zone of Reduced
Diffusion Capacity.
During and shortly after the development of this CRM a first and second proficiency test were
carried out. Improving laboratory proficiency for the measurement of diffusion capacity has
turned out to be difficult, as no standard reference material for diffusion capacity is available
despite an intensive search and numerous experiments and studies in the PTM Sub-Group.
Thus currently only the components of the measurement instruments can be calibrated but not
the measurement process as a whole. Consequently, it was decided to carry out this
proficiency test to ensure that the laboratories using CRM No. 77 do not drift apart over time.
This proficiency test contributes to objective #3 of the PTM Sub-Group, which requires the
group to organise, conduct and report on routine inter-laboratory studies in order to assess
inter-laboratory consistency and to enable continual improvement of participating
laboratories.
The results from this study serve as a check that laboratory procedures and their development
over time did not lead to a substantial increase in between-laboratory variability and it further
offers each laboratory the possibility of assessing its performance in comparison to other
laboratories and to derive actions for improvement.
All results are presented in anonymised form.
Study Protocol 1.2
The test protocol used for this proficiency test is given in Appendix A and is briefly
summarised below.
The protocol contained information about the samples to be tested, the preparation of samples
and the number of determinations to be made, but otherwise asked laboratories to follow their
internal routine procedures. Apart from the results, the laboratories were asked to provide
information related to the configuration and the calibration of the measurement instrument
and ambient conditions during measurement, particularly including the ambient air pressure,
which is a known and uncontrolled factor that may influence the measurement result.
The measurement data were reported in an Excel sheet and sent to the study coordinator.
There they were checked for plausibility and any inconsistency was corrected in cooperation
with the respective laboratory. In fact, only a single value, whose decimal separator was
missing, needed to be corrected in the entire study. Then the data set was anonymised and
compiled into a single data sheet for evaluation and statistical analysis.
The distribution of samples started in early January 2017 and the measured data were to be
reported by February 28, 2017.
Products and Measurements 1.3
For the proficiency test, two lower ignition propensity (LIP) cigarette papers were used. Both
papers featured bands of low diffusion capacity to achieve self-extinguishment according to

PTM-123-CTR 3rd
Proficiency Test (2017) on Diffusion Capacity – May 2017 4/19 4 of 19
ISO 12863:2010. The laboratories were asked to make two determinations, on separate days,
of the diffusion capacity of the LIP bands on the cigarette paper and between the LIP bands,
i.e. on the base paper. The main characteristics of the two LIP cigarette papers are given in
Table 1. The values in Table 1 do not represent actual measured values but just serve as an
indication of the characteristics of the LIP cigarette paper.
As the upper and lower part of the measurement head exert a mechanical pressure on the
paper, the paper may get damaged in the clamped areas. Thus a new sample strip was to be
used for each measurement.
Table 1 – Characteristics of the LIP cigarette papers.
Diffusion Capacity
Sample Basis Weight Air Permeability Band Paper
g/m² CU cm/s cm/s
A 27,5 60 0,035 1,800
B 24,0 45 0,130 1,750
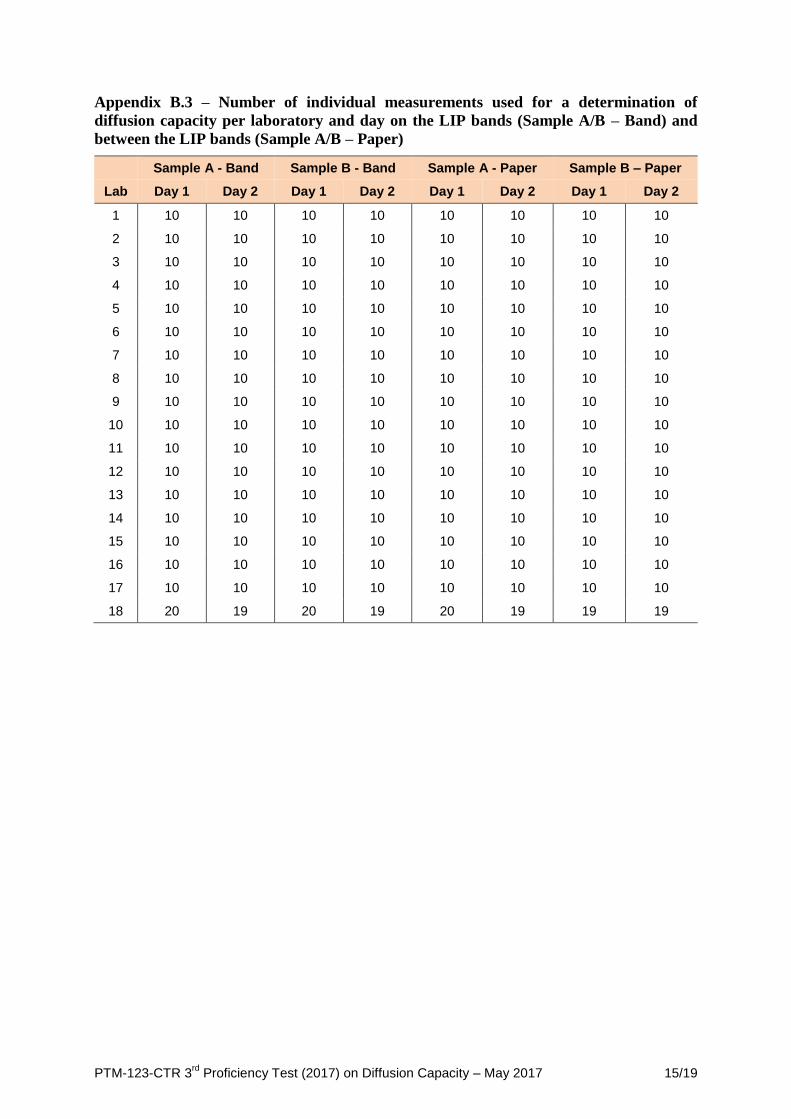
For the measurements the laboratories generally followed CRM No. 77 and with one
exception used 10 individual measurements to make one determination of diffusion capacity,
while one laboratory used 20 or 19 individual measurements.
Study Participants 1.4
In total 10 laboratories participated in the study with the entire list of participants in
alphabetical order given in Table 2. A code was assigned to each laboratory by the Study
Coordinator, thus the order of laboratories in Table 2 does not agree with the order of the
laboratories in other tables. Several laboratories participated with more than one instrument so
that the number of instruments is also given in Table 2. In total 18 instruments from three
different instrument manufacturers (Borgwaldt KC, Cerulean, Sodim) were used in the study.
The instruments used by the laboratories were distributed over the three instrument
manufacturers by 10, 7 and 1 instrument(s), which needs to be taken into account in the
analysis, as past studies have shown differences between the results obtained on instruments
of different manufacturers, but less so between instruments of the same manufacturer.
Table 2 – List of Participants
Participants Country No. of
Instruments
Cerulean United Kingdom 1
LipTec GmbH Germany 2
Japan Tobacco Inc. Japan 1
Japan Tobacco International Germany 1
Papeteries du Léman France 1
Papierfabrik Wattens GmbH & Co KG Austria 6
Philip Morris Int. Switzerland 1
SODIM France 1
SWM International France 3
Zhengzhou Tobacco Research Institute of CNTC China 1

PTM-123-CTR 3rd
Proficiency Test (2017) on Diffusion Capacity – May 2017 5/19 5 of 19
2. STATISTICAL EVALUATION
2.1 Raw Data Treatment
Data sets from all 10 laboratories were received covering in total 18 instruments. After a brief
screening for inconsistencies and any corrections, if needed, the data were prepared for
statistical analysis.
Mean values (MV) over all instruments and determinations and the average standard
deviation (SD) of a single determination (i.e. the average of typically 10 individual
measurements) over all laboratories and days are provided in Table 3.
Table 3 – Mean value (MV) and average within-laboratory standard deviation (SD) for
diffusion capacity over all instruments, outliers included.
On LIP Bands Between LIP Bands
ID MV SD N MV SD N
cm/s cm/s cm/s cm/s
A 0,039 0,002 18 1,802 0,061 18
B 0,149 0,006 18 1,738 0,025 18
The complete data set for all laboratories is given in Appendix B.
2.2 Outlier Analysis and Removal
In order to evaluate laboratory proficiency in the form of z-scores, as described in ISO
13528:2015, a ‘true’ value and standard deviation need to be assigned to each measurement
parameter, which form the basis for the calculation of z-scores. In contrast to other studies,
where the ‘true’ value is known or can be easily assigned, such values are not available in this
study. Consequently, the ‘true’ mean value and standard deviation were determined as a
robust global average over all laboratories. To ensure that this global average represents the
unknown ‘true’ value as closely as possible, outlier testing was performed to eliminate any
laboratories, that provided unusual values. Outlier testing was only used to obtain a robust
mean value and standard deviation, the z-scores were then calculated for all laboratories,
which reported data, irrespective of whether their results were excluded in the calculation of
the robust mean value.
The procedure follows ISO 13528:2015 by using Cochran’s test to eliminate any laboratories
with exceptionally high standard deviation and then using Grubb’s test to detect whether the
highest or lowest value qualifies as outlier. This procedure was repeated as often as was
needed to eliminate all outliers.
First mean value and standard deviation of the two determinations per laboratory and sample
were calculated and used for the outlier tests. The mean value and standard deviations are
given in Appendix C.
In fact it turned out that only laboratories 8 and 17, sample A, measured between the bands,
had unusually high standard deviations of 0.185 cm/s and 0.122 cm/s, respectively. All other
laboratories obtained standard deviations of less than 0.080 cm/s for this measurement.
Laboratories 8 and 17 were thus eliminated by Cochran’s test as outliers with 5 % probability
of error.

PTM-123-CTR 3rd
Proficiency Test (2017) on Diffusion Capacity – May 2017 6/19 6 of 19
Grubb’s test did not reveal any outliers in the data set. However, the value of laboratory 12 on
the base paper of sample A with 2.378 cm/s almost qualified as a straggler with 5 %
probability of error. Tentative elimination of this value from the calculation of the robust
global mean value showed that it had a large impact on the z-scores. Thus it was decided to
exclude this value for the calculation of the robust global mean and standard deviation. The
effect on the z-scores by excluding this value is discussed further below.
The remaining data sets were then used to calculate a robust mean and standard deviation.
2.3 Robust Mean Values and Standard Deviations
After the removal of outliers as explained above robust mean values and between-laboratory
standard deviations were calculated using algorithm A of ISO 13528:2015. The results are
given in Table 4. The number of laboratories is denoted by N.
Table 4 – Robust mean values (MV) and between-laboratory standard deviations (SD-
BL) for the diffusion capacity in and between the LIP bands for samples A
and B before and after exclusion of outliers.
LIP Bands Base Paper
ID MV SD-BL N MV SD-BL N
cm/s cm/s cm/s cm/s
Outliers included
A 0,039 0,004 18 1,802 0,243 18
B 0,149 0,014 18 1,738 0,206 18
Outliers excluded
A 0,039 0,004 18 1,762 0,162 15
B 0,149 0,014 18 1,738 0,206 18
These values were used for the calculation of z-scores.
For the further analysis it is of interest to investigate the differences between the instruments
of various instrument manufacturers. For each of the three instrument manufacturers, robust
global mean values and standard deviations were calculated separately and are given in Table
5. For manufacturer c which was represented by only one instrument the standard deviation of
the two determinations is given instead of the between-laboratory standard deviation.

PTM-123-CTR 3rd
Proficiency Test (2017) on Diffusion Capacity – May 2017 7/19 7 of 19
Table 5 – Robust mean values (MV) and between-laboratory standard deviations (SD-
BL) for the diffusion capacity in and between the LIP bands for samples A
and B. The data are provided separately for each of the three instrument
manufacturers (Mfct). For instrument manufacturer c, represented only by a
single instrument, the standard deviation of the two determinations is given.
LIP Bands Base Paper
ID Mfct MV SD-BL N MV SD-BL N
cm/s cm/s cm/s cm/s
a 0,037 0,004 10 1,814 0,209 7
A b 0,041 0,004 7 1,724 0,103 7
c 0,044 (0,001) 1 1,650 (0,028) 1
a 0,140 0,008 10 1,819 0,236 10
B b 0,159 0,014 7 1,637 0,109 7
c 0,169 (0,004) 1 1,635 (0,007) 1
2.4 Evaluation of Laboratory Performance (z-Scores)
Based on the robust mean value and the between-laboratory standard deviation the z-scores
were calculated as described in ISO 13528:2015. The results are given for samples A and B
on and between the LIP bands in Table 6. In the table fields marked in orange are z-scores
with 2<|z|<3 and red fields are those with 3|z|.
Table 6 – Z-Scores for all laboratories on the measurement of diffusion capacity on and
between the LIP bands for samples A and B.
A B A B
Lab Band Band Paper Paper
1 -0,960 -0,341 -1,585 -0,584
2 -1,635 -1,199 -0,563 -0,567
3 -0,173 0,036 -0,696 -1,002
4 1,178 1,339 -0,597 -0,501
5 -1,185 -1,061 0,551 0,228
6 -0,623 0,105 2,070 1,396
7 2,078 2,094 0,693 0,296
8 -1,185 -0,719 -2,009 -1,094
9 -0,848 -0,650 1,554 1,102
10 0,615 0,928 0,613 0,216
11 0,885 1,020 -0,526 -0,765
12 -0,060 -0,616 3,810 2,096
13 1,335 0,262 0,803 0,378
14 0,615 -1,610 -0,573 -0,790
15 -0,173 -0,650 -0,953 -0,924
16 -0,285 0,036 -0,390 -0,691
17 -0,128 -0,293 2,652 1,772
18 0,548 1,319 -0,399 -0,567
PTM-123-CTR 3rd
Proficiency Test (2017) on Diffusion Capacity – May 2017 8/19 8 of 19
3. DATA INTERPRETATION
3.1 Conclusions from Outlier Testing
As has been observed in previous proficiency tests, the repeatability standard deviation of the
measurement method, i.e. testing the same sample repeatedly on the same instrument by the
same operator, is rather low. Even when day-to-day variability and product variability is
included, as in this test, it remains low. In contrast the between-laboratory variability is
substantially higher, mainly due to the inability to calibrate the measurement instruments by
use of a reference material.
Due to this large between-laboratory variability it does not come as a surprise that the Grubb’s
test did not detect any outliers. Also the fact that while the measurement method itself is fairly
sophisticated the actual operation of the instrument by the user is comparably simple. Thus,
given proper conditioning of the samples and positioning of the LIP bands under the opening
in the measurement head, there are few options where the operator can influence the
measurement result.
In past studies a number of outlying measurements on LIP bands were found, as operators had
difficulty positioning the LIP band under the opening in the measurement head. This leads to
exceptionally high values as parts of the much higher permeable base paper contribute to the
diffusion process. In the present study no such outliers were observed, which is an indication
that laboratories have achieved a certain routine in dealing with the hardly visible LIP bands
on the cigarette paper.
3.2 Conclusions from the Z-Scores
As described in ISO 13528:2015, in normal circumstances about 95 % of all z-scores will be
in the range between -2 and 2. Occasionally, absolute z-scores equal to or greater than 2 may
be expected at a rate of about 5 %, while absolute z-scores equal to or greater than 3 will
occur only at a rate of about 0,3 %.
Thus for absolute z-scores between 2 and 3 it is up to the laboratory to decide if these
exceptional values are of importance and require any corrective action or review of the
laboratory procedures. For absolute z-scores of 3 or higher it is strongly recommended that
the laboratory investigates the reasons for the deviation and derives appropriate actions from
these investigations.
In the present study, 6 of 72 determinations (8,3 %) resulted in absolute z-scores between 2
and 3, and is slightly above the expected rate. One determination (1,4 %) resulted in a z-score
above 3. The LIP band measurements from laboratory 7 and the base paper measurements
from laboratory 12 were notably higher than those from other laboratories. On the other hand
five z-scores were between (absolute) 2,0 and 2,1, so they were just above the limit of being
non-satisfactory.
If data from laboratory 12, sample A, base paper, is included, which as mentioned above, was
just below the limit of being an outlier under Grubb’s test, then the absolute z-scores of
laboratories 6, 8 and 17 for the measurement on sample A, base paper, fall below the limit of
2,0 and the z-score of laboratory 12 for the same measurement drops from 3,810 to 2,633.
Inclusion of laboratory 12 thus leads to only 4 of 72 z-scores being non-satisfactory with no z-
score being above 3,0.

PTM-123-CTR 3rd
Proficiency Test (2017) on Diffusion Capacity – May 2017 9/19 9 of 19
In contrast to past studies, no statistically significant differences were observed between the
instruments of different manufacturers. A likely reason for this result is that laboratories using
several instruments try to match the instruments to each other by measuring internal standard
samples. Often instruments will allow adjustment factors to be set, such as gain and offset, to
make the instruments match each other. Therefore, it may be expected that laboratories taking
part with a higher number of instruments may obtain internally homogeneous results from
instruments of different manufacturers. It has to be noted that two laboratories using 3 and 6
instruments, respectively, make up half of all instruments in the study.
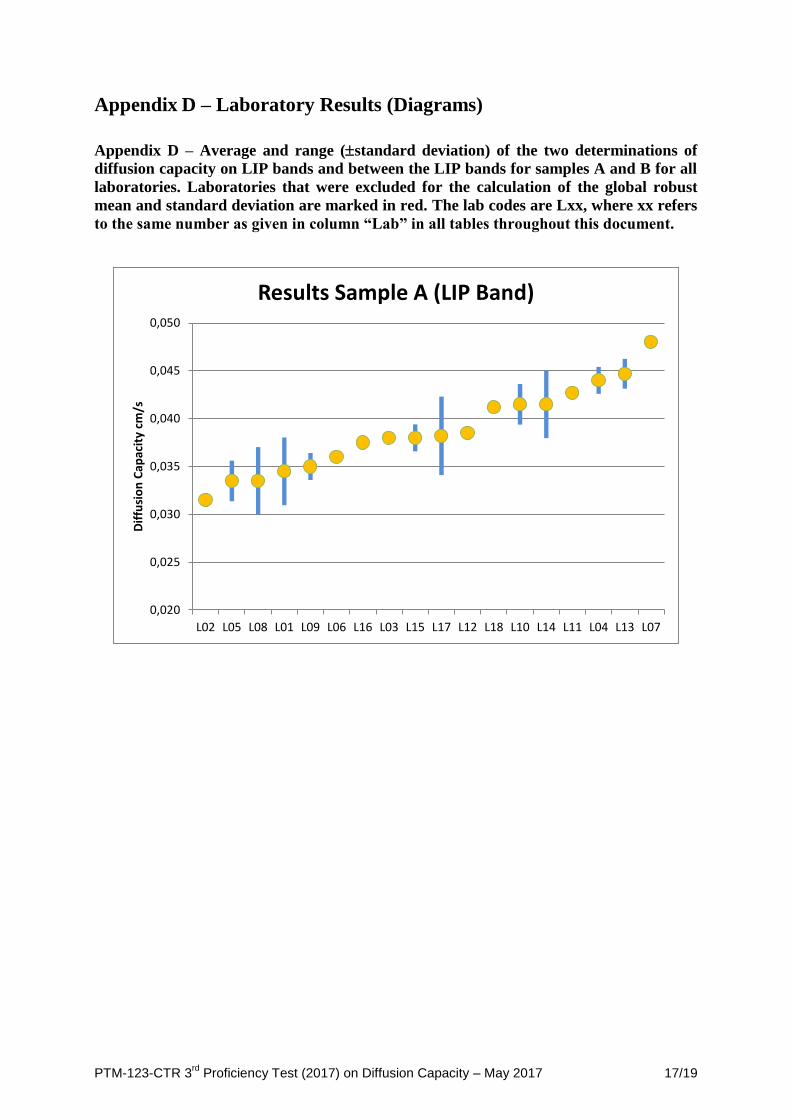
As can be seen in Table 7, the between-laboratory standard deviation is still a factor of 2-3
(LIP bands) or 6-8 (base paper) higher than the average within-laboratory standard deviation.
Despite a large number of instruments likely to be matched to each other the differences
between the laboratories and instruments remain a substantial factor in the overall variability.
This is also immediately apparent from the diagrams in Appendix D.
Table 7 – Average within-laboratory standard deviation (SD-WL), between-laboratory
standard deviation (SD-BL) and coefficient of variation (CoV) for the diffusion
capacity in and between the LIP bands for samples A and B.
LIP Bands Base Paper
ID SD-WL SD-BL CoV N SD-WL SD-BL CoV N
cm/s cm/s % cm/s cm/s %
A 0,002 0,004 11,5 18 0,028 0,163 9,2 15
B 0,006 0,015 9,8 18 0,025 0,207 11,8 18
With a coefficient of variation of about 10 %, the measurement of diffusion capacity still
remains a less precise method than other similar, but admittedly less complex, methods such
as the measurement of air permeability.
3.3 Comparison with Historical Data
One of the purposes of a proficiency test is to assess laboratory performance so that over time
a steady improvement can be achieved. The following historical assessment by comparing
data from the 1st Proficiency Test on Diffusion Capacity (2014) and the 2
nd Proficiency Test
on Diffusion Capacity (2015) with the current test results are an attempt to investigate if such
an improvement can be observed.
The results of this analysis have to be interpreted very cautiously as different laboratories
have taken part in the three proficiency tests and as the test products differed in all tests.
However, in all three proficiency tests measurements on LIP bands and between LIP bands
were done. The LIP bands in all studies had a diffusion capacity between 0,02 cm/ and 0,15
cm/s and the base papers had a diffusion capacity between 1,0 cm/s and 2,5 cm/s, and so at
least the measurement ranges were similar in all three proficiency tests.
To assess overall performance an average robust coefficient of variation is calculated over all
samples by the ratio of the robust standard deviation and the robust global mean value and
expressed as a percentage. As the robust standard deviation is calculated from the between-
laboratory standard deviations it may be expected that the robust coefficient of variation
decreases over time as the laboratories improve and the differences between the laboratories
become smaller.

PTM-123-CTR 3rd
Proficiency Test (2017) on Diffusion Capacity – May 2017 10/19 10 of 19
The results of this analysis are provided in Table 8 and are to be understood for information
only and are not based on any specific statistical test or analysis.
Table 8 – Historical development of a robust coefficient of variation for diffusion
capacity
Robust Coefficient of Variation
Parameter %
2014 2015 2017
On LIP Bands 11,7 11,4 10,5
Between LIP Bands 5,3 5,6 12,0
The coefficient of variation for measurements on LIP bands did obviously not change
substantially over the three proficiency tests. However, it is surprising that the coefficient of
variation for measurements on the base paper increased from about 5 % to more than 10 %.
This increase is unlikely to be due to product variability, as for both base papers A and B the
coefficient of variation was above 10 % in the current study, while in the past two proficiency
tests the value was about 5 % for all base papers. As the measurement of LIP bands is more
relevant because it relates to the performance in the measurement of ignition strength in
accordance with ISO 12863, it could be that laboratories have put more focus on the
measurement of LIP bands than of the base paper. Two factors that have led to an increase in
the coefficient of variation compared to past proficiency tests may be, firstly, the differences
between the instruments of different manufacturers and, secondly, the high between
laboratory standard deviation observed for instruments of manufacturer a, see Table 5. As the
instruments allow the adjustment of measured values by setting, for example, gain and offset
values, the users are likely to match their instruments by adjustment of these parameters for
the low diffusion capacities of LIP bands. As a consequence the differences at higher
diffusion capacities may become greater, but are not perceived as a problem, because
measurement of diffusion capacity is mainly used for LIP bands. Nevertheless, this increase
may deserve further investigation and any findings should be considered in a revision of CRM
No. 77.
4. REFERENCES
CORESTA CRM No. 77:2014, Determination of Diffusion Capacity by Measurement
of CO2 Transfer Rate Through Materials Used as Cigarette Papers and Cigarette Papers
having an Oriented Zone of Reduced Diffusion Capacity
CORESTA Technical Report (2015), 2015 Proficiency Test Report - The Measurement
of Diffusion Capacity of Cigarette Papers
CORESTA Technical Report (2015), Collaborative Study to Evaluate a Paperboard
Substitute for a Diffusion Capacity Standard
CORESTA Technical Report (2015), 2014 Proficiency Test Report - The Measurement
of Diffusion Capacity of Cigarette Papers
ISO 12863:2010, Standard test method for assessing the ignition propensity of
cigarettes

PTM-123-CTR 3rd
Proficiency Test (2017) on Diffusion Capacity – May 2017 11/19 11 of 19
5. APPENDICES
Appendix A – Protocol
Appendix B – Raw Data
Appendix C – Measurement Results
Appendix D – Laboratory Results (Diagrams)

PTM-123-CTR 3rd
Proficiency Test (2017) on Diffusion Capacity – May 2017 12/19 12 of 19
Appendix A – Protocol
The protocol is reproduced in its original form. Minor typographical errors were corrected and
e-mail addresses were removed.
3rd
Proficiency Test on Diffusion Capacity
NOTE: The purpose of a proficiency test is to allow laboratories to evaluate themselves in
comparison to other laboratories. Therefore, it is important that you follow the procedure
which is routinely used in your laboratory.
1. Measurement Plan
Measurements on each sample (and each instrument, if applicable) should take place on 2
consecutive days (e.g. Monday / Tuesday).
On each day determine the diffusion capacity of each of the samples A and B by performing
the number of measurements (e.g. 10) you would normally use in routine determinations of
diffusion capacity in your laboratory. On each day a new set of sample strips shall be used.
DAY 1 - Determination of Diffusion Capacity on Samples A1 and B1 (on bands and between bands)
DAY 2 - Determination of Diffusion Capacity on Samples A2 and B2 (on bands and between bands)
Please report mean value, standard deviation and number of measurements in the appropriate
cells. Please use a new sample strip for each measurement series, i.e. do not measure on and
between the bands on the same sample strip.
2. Measurement Method and Instrument Set-Up
According to CRM No. 77, calibration and instrument settings as used in your laboratory.
Condition samples for at least 48 hours prior to the first series of measurements.
3. Recording of Results
It is not permitted to make any changes to the data recording sheets. Results, which are not
reported correctly, may be disregarded in the proficiency test. For any additional information
or remarks please use the comments column. You can also add an additional spreadsheet.
e-mail completed spreadsheets (as Excel file) to:
Bernhard Eitzinger
Philippe Le Men
Results must be submitted by February 28th
, 2017.
4. Sample Codes
A Banded lower ignition propensity paper
A1 for measurements on the band and the base paper on day 1
A2 for measurements on the band and the base paper on day 2
B Banded lower ignition propensity paper
B1 for measurements on the band and the base paper on day 1
B2 for measurements on the band and the base paper on day 2

PTM-123-CTR 3rd
Proficiency Test (2017) on Diffusion Capacity – May 2017 13/19 13 of 19
Appendix B – Raw Data
Appendix B.1 – Determinations of diffusion capacity per laboratory and day on the LIP
bands (Sample A/B – Band) and between the LIP bands (Sample A/B – Paper)
Sample A - Band Sample B - Band Sample A - Paper Sample B – Paper
Lab Day 1 Day 2 Day 1 Day 2 Day 1 Day 2 Day 1 Day 2
cm/s cm/s cm/s cm/s cm/s cm/s cm/s cm/s
1 0,037 0,032 0,140 0,148 1,495 1,517 1,612 1,624
2 0,032 0,031 0,125 0,138 1,637 1,705 1,593 1,650
3 0,038 0,038 0,145 0,154 1,634 1,665 1,548 1,516
4 0,045 0,043 0,166 0,171 1,685 1,646 1,640 1,630
5 0,032 0,035 0,133 0,134 1,836 1,866 1,782 1,788
6 0,036 0,036 0,153 0,148 2,115 2,078 2,029 2,022
7 0,048 0,048 0,178 0,181 1,873 1,875 1,830 1,768
8 0,031 0,036 0,136 0,141 1,307 1,568 1,511 1,515
9 0,036 0,034 0,139 0,140 2,003 2,023 1,962 1,968
10 0,040 0,043 0,163 0,162 1,842 1,880 1,759 1,806
11 0,043 0,043 0,161 0,166 1,673 1,681 1,589 1,572
12 0,038 0,039 0,143 0,137 2,434 2,321 2,215 2,124
13 0,046 0,044 0,159 0,147 1,875 1,909 1,824 1,808
14 0,039 0,044 0,131 0,120 1,714 1,625 1,582 1,569
15 0,039 0,037 0,150 0,129 1,611 1,605 1,564 1,532
16 0,037 0,038 0,153 0,146 1,676 1,722 1,590 1,602
17 0,035 0,041 0,142 0,148 2,104 2,277 2,090 2,116
18 0,042 0,041 0,163 0,173 1,702 1,693 1,633 1,610

PTM-123-CTR 3rd
Proficiency Test (2017) on Diffusion Capacity – May 2017 14/19 14 of 19
Appendix B.2 – Standard deviation of an individual measurements (i.e. not of a
determination) of diffusion capacity per laboratory and day on the LIP bands (Sample
A/B – Band) and between the LIP bands (Sample A/B – Paper)
Sample A - Band Sample B - Band Sample A - Paper Sample B – Paper
Lab Day 1 Day 2 Day 1 Day 2 Day 1 Day 2 Day 1 Day 2
cm/s cm/s cm/s cm/s cm/s cm/s cm/s cm/s
1 0,003 0,003 0,024 0,017 0,067 0,053 0,072 0,087
2 0,004 0,003 0,025 0,025 0,072 0,057 0,060 0,084
3 0,002 0,004 0,012 0,010 0,041 0,064 0,042 0,053
4 0,007 0,005 0,029 0,029 0,046 0,034 0,034 0,045
5 0,002 0,005 0,022 0,017 0,032 0,066 0,047 0,075
6 0,004 0,003 0,027 0,024 0,053 0,063 0,111 0,092
7 0,004 0,006 0,025 0,015 0,054 0,054 0,034 0,029
8 0,003 0,002 0,016 0,020 0,072 0,062 0,046 0,057
9 0,003 0,002 0,015 0,015 0,051 0,099 0,097 0,105
10 0,003 0,002 0,016 0,028 0,084 0,065 0,052 0,081
11 0,004 0,003 0,022 0,015 0,036 0,056 0,037 0,042
12 0,004 0,003 0,022 0,023 0,097 0,051 0,085 0,093
13 0,003 0,002 0,022 0,018 0,084 0,069 0,090 0,069
14 0,002 0,004 0,011 0,013 0,062 0,051 0,042 0,034
15 0,005 0,003 0,010 0,014 0,049 0,025 0,045 0,050
16 0,004 0,004 0,021 0,010 0,040 0,039 0,052 0,048
17 0,003 0,004 0,017 0,018 0,051 0,099 0,050 0,076
18 0,003 0,004 0,022 0,023 0,057 0,047 0,043 0,046
PTM-123-CTR 3rd
Proficiency Test (2017) on Diffusion Capacity – May 2017 15/19 15 of 19
Appendix B.3 – Number of individual measurements used for a determination of
diffusion capacity per laboratory and day on the LIP bands (Sample A/B – Band) and
between the LIP bands (Sample A/B – Paper)
Sample A - Band Sample B - Band Sample A - Paper Sample B – Paper
Lab Day 1 Day 2 Day 1 Day 2 Day 1 Day 2 Day 1 Day 2
1 10 10 10 10 10 10 10 10
2 10 10 10 10 10 10 10 10
3 10 10 10 10 10 10 10 10
4 10 10 10 10 10 10 10 10
5 10 10 10 10 10 10 10 10
6 10 10 10 10 10 10 10 10
7 10 10 10 10 10 10 10 10
8 10 10 10 10 10 10 10 10
9 10 10 10 10 10 10 10 10
10 10 10 10 10 10 10 10 10
11 10 10 10 10 10 10 10 10
12 10 10 10 10 10 10 10 10
13 10 10 10 10 10 10 10 10
14 10 10 10 10 10 10 10 10
15 10 10 10 10 10 10 10 10
16 10 10 10 10 10 10 10 10
17 10 10 10 10 10 10 10 10
18 20 19 20 19 20 19 19 19

PTM-123-CTR 3rd
Proficiency Test (2017) on Diffusion Capacity – May 2017 16/19 16 of 19
Appendix C – Measurement Results
Appendix C – Mean value (MV) and standard deviation (SD) of the two determinations
of diffusion capacity per laboratory on the LIP bands (Sample A/B – Band) and between
the LIP bands (Sample A/B – Paper). The two laboratories detected as outliers by
Cochran’s test are marked in orange. One value marked in red, although not a
statistical outlier by Grubb’s test, was eliminated because of its large impact on the z-
scores.
Sample A - Band Sample B - Band Sample A - Paper Sample B – Paper
Lab MV SD MV SD MV SD MV SD
cm/s cm/s cm/s cm/s cm/s cm/s cm/s cm/s
1 0,035 0,004 0,144 0,006 1,506 0,016 1,618 0,008
2 0,032 0,001 0,132 0,009 1,671 0,048 1,622 0,040
3 0,038 0,000 0,150 0,006 1,650 0,022 1,532 0,023
4 0,044 0,001 0,169 0,004 1,666 0,028 1,635 0,007
5 0,034 0,002 0,134 0,001 1,851 0,021 1,785 0,004
6 0,036 0,000 0,151 0,004 2,097 0,026 2,026 0,005
7 0,048 0,000 0,180 0,002 1,874 0,001 1,799 0,044
8 0,034 0,004 0,139 0,004 1,438 0,185 1,513 0,003
9 0,035 0,001 0,140 0,001 2,013 0,014 1,965 0,004
10 0,042 0,002 0,163 0,001 1,861 0,027 1,783 0,033
11 0,043 0,000 0,164 0,003 1,677 0,006 1,581 0,012
12 0,039 0,001 0,140 0,004 2,378 0,080 2,170 0,064
13 0,045 0,002 0,153 0,009 1,892 0,024 1,816 0,011
14 0,042 0,004 0,126 0,008 1,670 0,063 1,576 0,009
15 0,038 0,001 0,140 0,015 1,608 0,004 1,548 0,023
16 0,038 0,001 0,150 0,005 1,699 0,033 1,596 0,008
17 0,038 0,004 0,145 0,005 2,191 0,122 2,103 0,019
18 0,041 0,000 0,168 0,007 1,698 0,006 1,621 0,017
PTM-123-CTR 3rd
Proficiency Test (2017) on Diffusion Capacity – May 2017 17/19 17 of 19
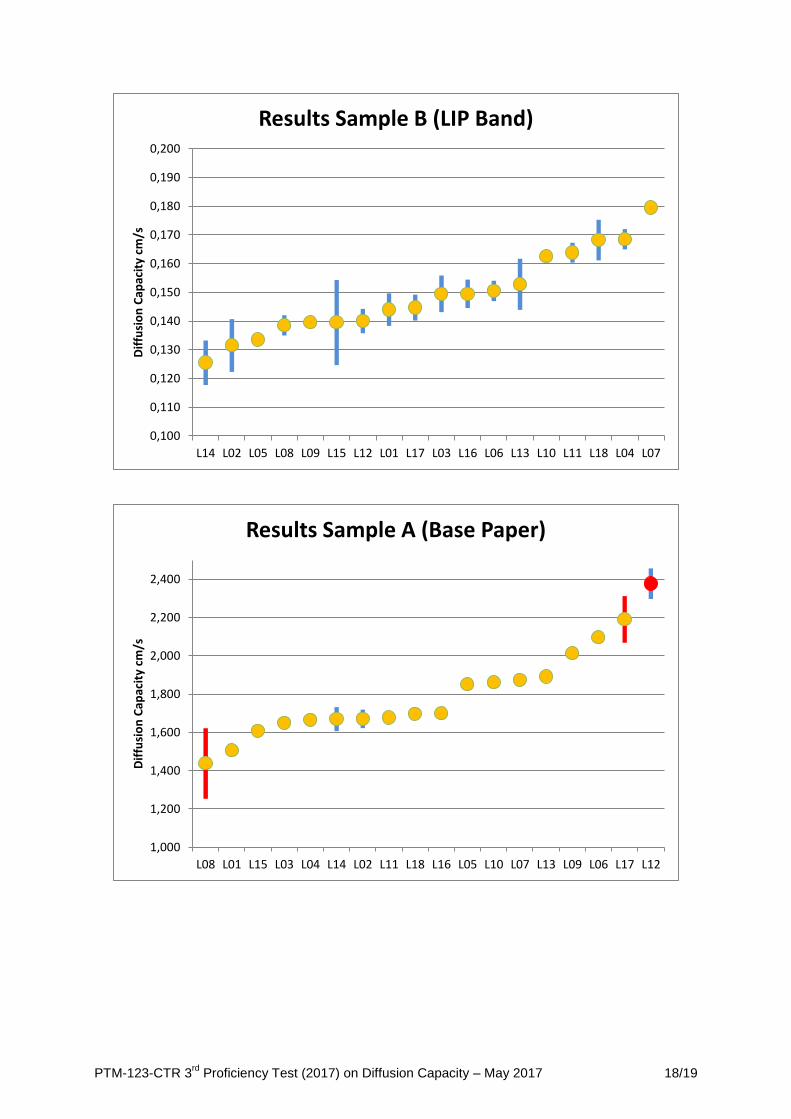
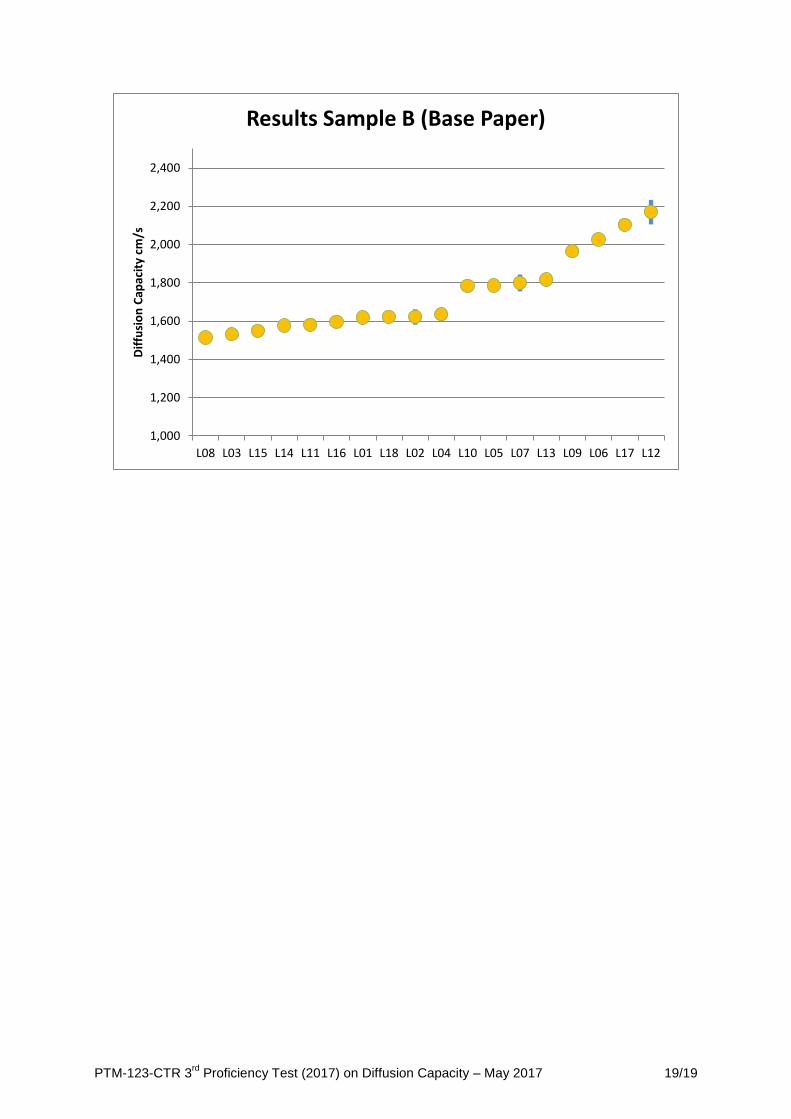
Appendix D – Laboratory Results (Diagrams)
Appendix D – Average and range (standard deviation) of the two determinations of
diffusion capacity on LIP bands and between the LIP bands for samples A and B for all
laboratories. Laboratories that were excluded for the calculation of the global robust
mean and standard deviation are marked in red. The lab codes are Lxx, where xx refers
to the same number as given in column “Lab” in all tables throughout this document.
0,020
0,025
0,030
0,035
0,040
0,045
0,050
L02 L05 L08 L01 L09 L06 L16 L03 L15 L17 L12 L18 L10 L14 L11 L04 L13 L07
Dif
fusi
on
Cap
acit
y cm
/s
Results Sample A (LIP Band)
PTM-123-CTR 3rd
Proficiency Test (2017) on Diffusion Capacity – May 2017 18/19 18 of 19
0,100
0,110
0,120
0,130
0,140
0,150
0,160
0,170
0,180
0,190
0,200
L14 L02 L05 L08 L09 L15 L12 L01 L17 L03 L16 L06 L13 L10 L11 L18 L04 L07
Dif
fusi
on
Cap
acit
y cm
/sResults Sample B (LIP Band)
1,000
1,200
1,400
1,600
1,800
2,000
2,200
2,400
L08 L01 L15 L03 L04 L14 L02 L11 L18 L16 L05 L10 L07 L13 L09 L06 L17 L12
Dif
fusi
on
Cap
acit
y cm
/s
Results Sample A (Base Paper)
PTM-123-CTR 3rd
Proficiency Test (2017) on Diffusion Capacity – May 2017 19/19 19 of 19
1,000
1,200
1,400
1,600
1,800
2,000
2,200
2,400
L08 L03 L15 L14 L11 L16 L01 L18 L02 L04 L10 L05 L07 L13 L09 L06 L17 L12
Dif
fusi
on
Cap
acit
y cm
/sResults Sample B (Base Paper)